
Aqueous Metabolite Trends for the Progression of Nonalcoholic Fatty Liver Disease in Female Bariatric Surgery Patients by Targeted 1H-NMR Metabolomics


Abstract
:1. Introduction
2. Results
2.1. Patient Characteristics and NMR-Derived Metabolite Levels
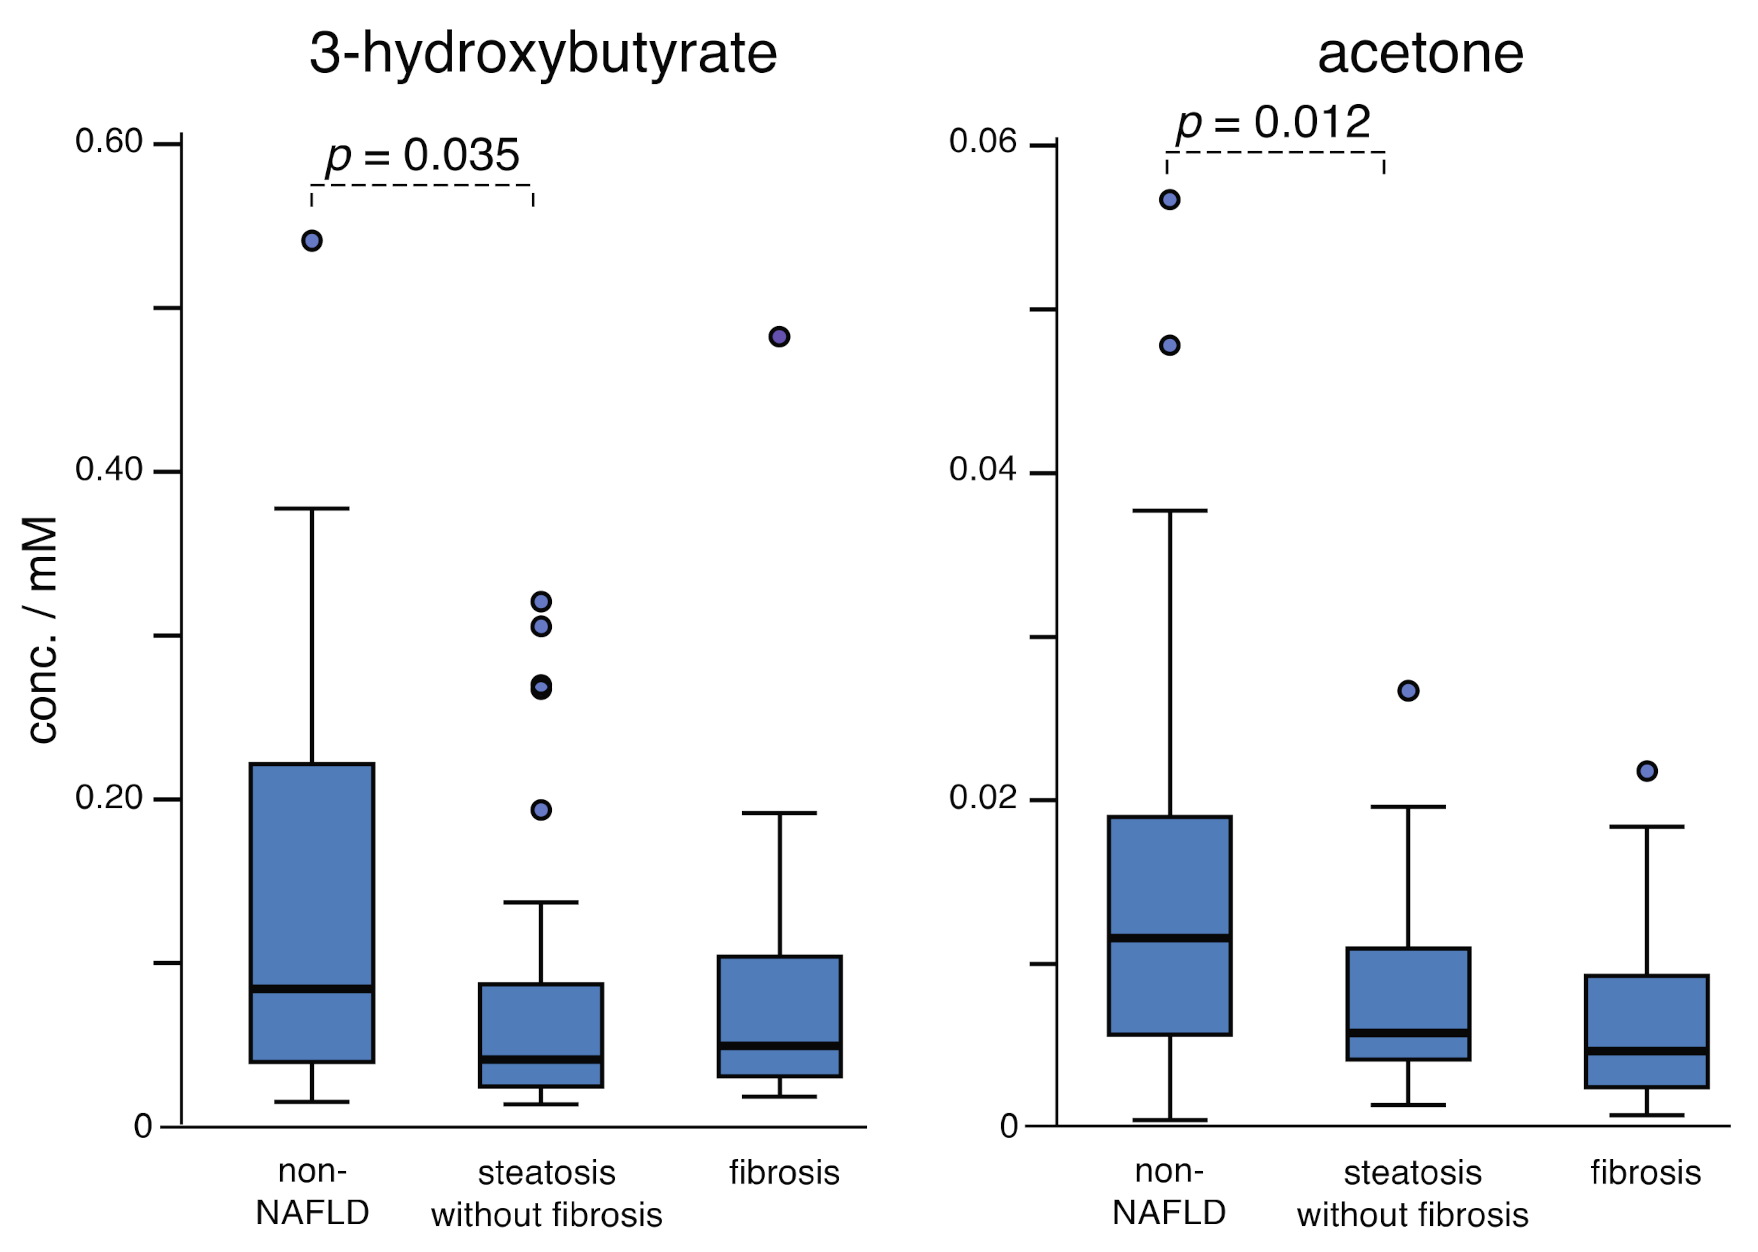
2.2. Fatty Acid Oxidation: Steatosis vs. Fibrosis
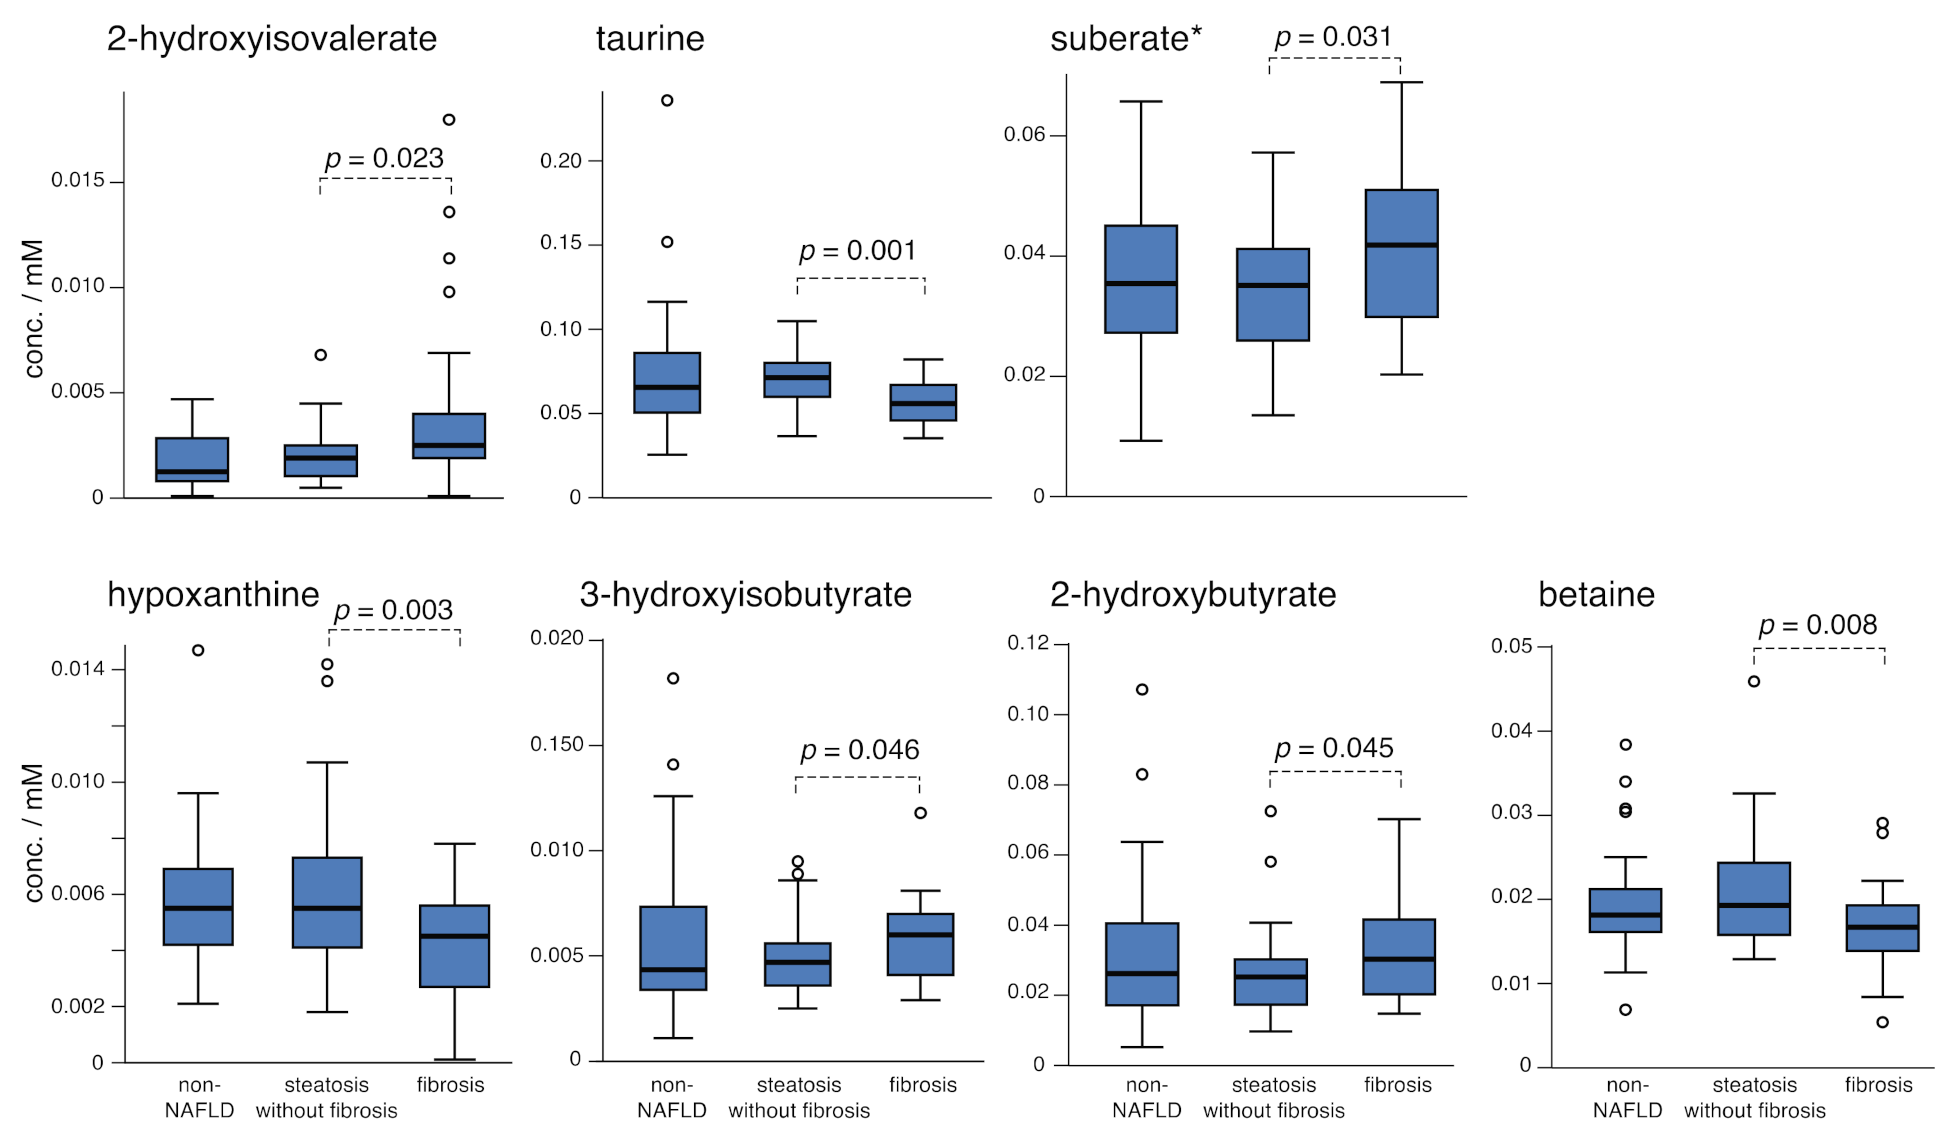
2.3. Comparing Steatosis and Fibrosis Groups
2.4. Branched Chain Amino Acids (BCAA) and Aromatic Amino Acids (AAA)
2.5. Decreasing BCAA as a Function of Fibrosis Stage
2.6. TCA Cycle and Urea Cycle Metabolites: Steatosis
3. Discussion
3.1. Biobanked Sera of Bariatric Surgery Patients
3.2. Overview of Markers for NAFLD
4. Materials and Methods
4.1. Organic Extraction of Aqueous Metabolites
4.2. Serum Collection and Group Design
4.3. Targeted Profiling
4.4. Statistical Methodology and Data Analysis
4.5. NMR Data Acquisition
5. Conclusions
Supplementary Materials
Author Contributions
Funding
Institutional Review Board Statement
Informed Consent Statement
Data Availability Statement
Acknowledgments
Conflicts of Interest
References
- Lazarus, J.V.; Colombo, M.; Cortez-Pinto, H.; Huang, T.T.K.; Miller, V.; Ninburg, M.; Schattenberg, J.M.; Seim, L.; Wong, V.W.S.; Zelber-Sagi, S. NAFLD—Sounding the alarm on a silent epidemic. Nat. Rev. Gastroenterol. Hepatol. 2020, 17, 377–379. [Google Scholar] [CrossRef] [PubMed]
- Hassan, K.; Bhalla, V.; El Regal, M.E.; A-Kader, H.H. Nonalcoholic fatty liver disease: A comprehensive review of a growing epidemic. World J. Gastroenterol. 2014, 20, 12082–12101. [Google Scholar] [CrossRef] [PubMed]
- Pais, R.; Barritt, A.S.; Calmus, Y.; Scatton, O.; Runge, T.; Lebray, P.; Poynard, T.; Ratziu, V.; Conti, F. NAFLD and liver transplantation: Current burden and expected challenges. J. Hepatol. 2016, 65, 1245–1257. [Google Scholar] [CrossRef] [PubMed] [Green Version]
- Burra, P.; Becchetti, C.; Germani, G. NAFLD and liver transplantation: Disease burden, current management and future challenges. JHEP Reports 2020, 2. [Google Scholar] [CrossRef]
- Paik, J.M.; Henry, L.; De Avila, L.; Younossi, E.; Racila, A.; Younossi, Z.M. Mortality Related to Nonalcoholic Fatty Liver Disease Is Increasing in the United States. Hepatol. Commun. 2019, 3, 1459–1471. [Google Scholar] [CrossRef] [PubMed] [Green Version]
- Robinson, M.D.; Mishra, I.; Deodhar, S.; Patel, V.; Gordon, K.V.; Vintimilla, R.; Brown, K.; Johnson, L.; O’Bryant, S.; Cistola, D.P. Water T2 as an early, global and practical biomarker for metabolic syndrome: An observational cross-sectional study. J. Transl. Med. 2017, 15, 258. [Google Scholar] [CrossRef]
- Mishra, I.; Jones, C.; Patel, V.; Deodhar, S.; Cistola, D.P. Early detection of metabolic dysregulation using water T(2) analysis of biobanked samples. Diabetes Metab. Syndr. Obes. 2018, 11, 807–818. [Google Scholar] [CrossRef] [PubMed] [Green Version]
- Bloomgarden, Z. Diabetes and branched-chain amino acids: What is the link? J. Diabetes 2018, 10, 350–352. [Google Scholar] [CrossRef] [Green Version]
- de Mello, V.D.; Sehgal, R.; Männistö, V.; Klåvus, A.; Nilsson, E.; Perfilyev, A.; Kaminska, D.; Miao, Z.; Pajukanta, P.; Ling, C.; et al. Serum aromatic and branched-chain amino acids associated with NASH demonstrate divergent associations with serum lipids. Liver Int. 2021, 41, 754–763. [Google Scholar] [CrossRef] [PubMed]
- Ioannou, G.N.; Nagana Gowda, G.A.; Djukovic, D.; Raftery, D. Distinguishing NASH Histological Severity Using a Multiplatform Metabolomics Approach. Metabolites 2020, 10, 168. [Google Scholar] [CrossRef] [PubMed]
- Sookoian, S.; Puri, P.; Castaño, G.O.; Scian, R.; Mirshahi, F.; Sanyal, A.J.; Pirola, C.J. Nonalcoholic steatohepatitis is associated with a state of betaine-insufficiency. Liver Int. 2017, 37, 611–619. [Google Scholar] [CrossRef] [PubMed]
- Gaggini, M.; Carli, F.; Rosso, C.; Buzzigoli, E.; Marietti, M.; Della Latta, V.; Ciociaro, D.; Abate, M.L.; Gambino, R.; Cassader, M.; et al. Altered amino acid concentrations in NAFLD: Impact of obesity and insulin resistance. Hepatology 2018, 67, 145–158. [Google Scholar] [CrossRef] [PubMed] [Green Version]
- Mannisto, V.T.; Simonen, M.; Hyysalo, J.; Soininen, P.; Kangas, A.J.; Kaminska, D.; Matte, A.K.; Venesmaa, S.; Kakela, P.; Karja, V.; et al. Ketone body production is differentially altered in steatosis and non-alcoholic steatohepatitis in obese humans. Liver Int. 2015, 35, 1853–1861. [Google Scholar] [CrossRef] [PubMed]
- Kalhan, S.C.; Guo, L.; Edmison, J.; Dasarathy, S.; McCullough, A.J.; Hanson, R.W.; Milburn, M. Plasma metabolomic profile in nonalcoholic fatty liver disease. Metab.-Clin. Exp. 2011, 60, 404–413. [Google Scholar] [CrossRef] [Green Version]
- Pirola, C.J.; Sookoian, S. Multiomics biomarkers for the prediction of nonalcoholic fatty liver disease severity. World J. Gastroenterol. 2018, 24, 1601–1615. [Google Scholar] [CrossRef] [PubMed]
- Gitto, S.; Schepis, F.; Andreone, P.; Villa, E. Study of the Serum Metabolomic Profile in Nonalcoholic Fatty Liver Disease: Research and Clinical Perspectives. Metabolites 2018, 8, 17. [Google Scholar] [CrossRef] [PubMed] [Green Version]
- Hoozemans, J.; de Brauw, M.; Nieuwdorp, M.; Gerdes, V. Gut Microbiome and Metabolites in Patients with NAFLD and after Bariatric Surgery: A Comprehensive Review. Metabolites 2021, 11, 353. [Google Scholar] [CrossRef]
- Schofield, Z.; Reed, M.A.; Newsome, P.N.; Adams, D.H.; Günther, U.L.; Lalor, P.F. Changes in human hepatic metabolism in steatosis and cirrhosis. World J. Gastroenterol. 2017, 23, 2685–2695. [Google Scholar] [CrossRef]
- Li, H.; Wang, L.; Yan, X.; Liu, Q.; Yu, C.; Wei, H.; Li, Y.; Zhang, X.; He, F.; Jiang, Y. A Proton Nuclear Magnetic Resonance Metabonomics Approach for Biomarker Discovery in Nonalcoholic Fatty Liver Disease. J. Proteome Res. 2011, 10, 2797–2806. [Google Scholar] [CrossRef]
- Chashmniam, S.; Ghafourpour, M.; Farimani, A.R.; Gholami, A.; Ghoochani, B.F.N.M. Metabolomic Biomarkers in the Diagnosis of Non-Alcoholic Fatty Liver Disease. Hepat. Mon. 2019, 19, e92244. [Google Scholar] [CrossRef] [Green Version]
- Ballestri, S.; Nascimbeni, F.; Baldelli, E.; Marrazzo, A.; Romagnoli, D.; Lonardo, A. NAFLD as a Sexual Dimorphic Disease: Role of Gender and Reproductive Status in the Development and Progression of Nonalcoholic Fatty Liver Disease and Inherent Cardiovascular Risk. Adv. Ther. 2017, 34, 1291–1326. [Google Scholar] [CrossRef]
- Tramunt, B.; Smati, S.; Grandgeorge, N.; Lenfant, F.; Arnal, J.; Montagner, A.; Gourdy, P. Sex differences in metabolic regulation and diabetes susceptibility. Diabetologia 2020, 63, 453–461. [Google Scholar] [CrossRef] [Green Version]
- Rangel-Huerta, O.; Pastor-Villaescusa, B.; Gil, A. Are we close to defining a metabolomic signature of human obesity? A systematic review of metabolomics studies. Metabolites 2019, 15, 93. [Google Scholar] [CrossRef] [PubMed] [Green Version]
- Taddeo, M.C.; Robinson, E.J.; Hassid, N.Y.; Chu, X.; Shi, W.; Wood, C.; Still, C.; Rovnyak, D. A Robust Protocol for Extracting Aqueous Metabolites of High Lipid Sera. Curr. Metab. Syst. Biol. 2020, 7, 67–72. [Google Scholar] [CrossRef]
- Flanagin, A.; Frey, T.; Christiansen, S.L. AMA Manual of Style Committee Updated Guidance on the Reporting of Race and Ethnicity in Medical and Science Journals. JAMA 2021, 326, 621–627. [Google Scholar] [CrossRef]
- Poynard, T.; Ratziu, V.; Charlotte, F.; Messous, D.; Munteanu, M.; Imbert-Bismut, F.; Massard, J.; Bonyhay, L.; Tahiri, M.; Thabut, D.; et al. Diagnostic value of biochemical markers (NashTest) for the prediction of non alcoholo steato hepatitis in patients with non-alcoholic fatty liver disease. BMC Gastroenterol. 2006, 6, 34. [Google Scholar] [CrossRef] [PubMed] [Green Version]
- Tincopa, M.A. Diagnostic and interventional circulating biomarkers in nonalcoholic steatohepatitis. Endocrinol. Diab. Metab. 2020, 3, e00177. [Google Scholar] [CrossRef] [PubMed]
- Rocha, R.; Cotrim, H.P.; Carvalho, F.M.; Siqueira, A.C.; Braga, H.; Freitas, L.A. Body mass index and waist circumference in non-alcoholic fatty liver disease. J. Hum. Nutr. Diet. 2005, 18, 365–370. [Google Scholar] [CrossRef] [PubMed]
- Safai, N.; Suvitaival, T.; Ali, A.; Spégel, P.; Al-Majdoub, M.; Carstensen, B.; Vestergaard, H.; Ridderstråle, M.; the CIMT, T.G. Effect of metformin on plasma metabolite profile in the Copenhagen Insulin and Metformin Therapy (CIMT) trial. Diabet. Med. 2018, 35, 944–953. [Google Scholar] [CrossRef] [PubMed]
- Boeckmans, J.; Natale, A.; Buyl, K.; Rogiers, V.; De Kock, J.; Vanhaecke, T.; Rodrigues, R.M. Human-based systems: Mechanistic NASH modelling just around the corner? Pharmacol. Res. 2018, 134, 257–267. [Google Scholar] [CrossRef] [PubMed]
- Koo, S. Nonalcoholic fatty liver disease: Molecular mechanisms for the hepatic steatosis. Clin. Mol. Hepatol. 2013, 19, 210–215. [Google Scholar] [CrossRef] [PubMed]
- Nagana Gowda, G.A.; Gowda, Y.N.; Raftery, D. Expanding the limits of human blood metabolite quantitation using NMR spectroscopy. Anal. Chem. 2015, 87, 706–715. [Google Scholar] [CrossRef] [PubMed] [Green Version]
- Chen, Y.; Liu, Y.; Zhou, R.; Chen, X.; Wang, C.; Tan, X.; Wang, L.; Zheng, R.; Zhang, H.; Ling, W.; et al. Associations of gut-flora-dependent metabolite trimethylamine-N-oxide, betaine and choline with non-alcoholic fatty liver disease in adults. Sci. Rep. 2016, 6, 19076. [Google Scholar] [CrossRef] [PubMed]
- Sarfaraz, M.O.; Myers, R.P.; Coffin, C.S.; Gao, Z.; Shaheen, A.A.M.; Crotty, P.M.; Zhang, P.; Vogel, H.J.; Weljie, A.M. A quantitative metabolomics profiling approach for the noninvasive assessment of liver histology in patients with chronic hepatitis C. Clin. Transl. Med. 2016, 5, 33. [Google Scholar] [CrossRef] [PubMed] [Green Version]
- Tajiri, K.; Shimizu, Y. Branched-chain amino acids in liver diseases. World J. Gastroenterol. 2013, 19, 7620–7629. [Google Scholar] [CrossRef]
- Campollo, O.; Sprengers, D.; McIntyre, N. The BCAA/AAA ratio of plasma amino acids in three different groups of cirrhotics. Rev. Investig. Clin. 1992, 44, 513–518. [Google Scholar]
- Ishikawa, T. Branched-chain amino acids to tyrosine ratio value as a potential prognostic factor for hepatocellular carcinoma. World J. Gastroenterol. 2012, 18, 2005–2008. [Google Scholar] [CrossRef] [PubMed]
- Casadei-Gardini, A.; Del Coco, L.; Marisi, G.; Conti, F.; Rovesti, G.; Ulivi, P.; Canale, M.; Frassineti, G.L.; Foschi, F.G.; Longo, S.; et al. 1H-NMR Based Serum Metabolomics Highlights Different Specific Biomarkers between Early and Advanced Hepatocellular Carcinoma Stages. Cancers 2020, 12, 241. [Google Scholar] [CrossRef] [PubMed] [Green Version]
- Ito, T.; Ishigami, M.; Ishizu, Y.; Kuzuya, T.; Honda, T.; Ishikawa, T.; Toyoda, H.; Kumada, T.; Fujishiro, M. Serum Nutritional Markers as Prognostic Factors for Hepatic and Extrahepatic Carcinogenesis in Japanese Patients with Nonalcoholic Fatty Liver Disease. Nutr. Cancer. 2020, 72, 884–891. [Google Scholar] [CrossRef]
- Cano, N.J.M.; Fouque, D.; Leverve, X.M. Application of Branched-Chain Amino Acids in Human Pathological States: Renal Failure. J. Nutr. 2006, 136, 299S–307S. [Google Scholar] [CrossRef] [Green Version]
- MacAulay, J.; Thompson, K.; Kiberd, B.A.; Barnes, D.C.; Peltekian, K.M. Serum Creatinine in Patients with Advanced Liver Disease Is of Limited Value for Identification of Moderate Renal Dysfunction: Are the Equations for Estimating Renal Function Better? Can. J. Gastroenterol. 2006, 20, 858053. [Google Scholar] [CrossRef] [PubMed]
- De Chiara, F.; Heebøll, S.; Marrone, G.; Montoliu, C.; Hamilton-Dutoit, S.; Ferrandez, A.; Andreola, F.; Rombouts, K.; Grønbæk, H.; Felipo, V.; et al. Urea cycle dysregulation in non-alcoholic fatty liver disease. J. Hepatol. 2018, 69, 905–915. [Google Scholar] [CrossRef] [PubMed] [Green Version]
- Eriksen, P.L.; Vilstrup, H.; Rigbolt, K.; Suppli, M.P.; Sørensen, M.; Heebøll, S.; Veidal, S.S.; Knop, F.K.; Thomsen, K.L. Non-alcoholic fatty liver disease alters expression of genes governing hepatic nitrogen conversion. Liver Int. 2019, 39, 2094–2101. [Google Scholar] [CrossRef] [PubMed]
- Wong, W.; Chan, W. Nonalcoholic Fatty Liver Disease: A Global Perspective. Clin. Ther. 2021, 43, 473–499. [Google Scholar] [CrossRef] [PubMed]
- Eslam, M.; Newsome, P.N.; Sarin, S.K.; Anstee, Q.M.; Targher, G.; Romero-Gomez, M.; Zelber-Sagi, S.; Wong, V.W.S.; Dufour, J.; Schattenberg, J.M.; et al. A new definition for metabolic dysfunction-associated fatty liver disease: An international expert consensus statement. J. Hepatol. 2020, 73, 202–209. [Google Scholar] [CrossRef]
- Chong, J.; Soufan, O.; Li, C.; Caraus, I.; Li, S.; Bourque, G.; Wishart, D.S.; Xia, J. MetaboAnalyst 4.0: Towards more transparent and integrative metabolomics analysis. Nucleic Acids Res. 2018, 46, W486–W494. [Google Scholar] [CrossRef] [PubMed] [Green Version]
- Toye, A.A.; Dumas, M.E.; Blancher, C.; Rothwell, A.R.; Fearnside, J.F.; Wilder, S.P.; Bihoreau, M.T.; Cloarec, O.; Azzouzi, I.; Young, S.; et al. Subtle metabolic and liver gene transcriptional changes underlie diet-induced fatty liver susceptibility in insulin-resistant mice. Diabetology 2007, 50, 1867–1879. [Google Scholar] [CrossRef] [Green Version]
- Lee, J.; Cho, Y.K.; Kang, Y.M.; Kim, H.S.; Jung, C.H.; Kim, H.; Park, J.; Lee, W.J. The Impact of NAFLD and Waist Circumference Changes on Diabetes Development in Prediabetes Subjects. Sci. Rep. 2019, 9, 17258. [Google Scholar] [CrossRef] [PubMed] [Green Version]
- Gonzalez-Franquesa, A.; Burkart, A.M.; Isganaitis, E.; Patti, M.E. What Have Metabolomics Approaches Taught Us About Type 2 Diabetes? Curr. Diabetes Rep. 2016, 16, 74. [Google Scholar] [CrossRef]
- Wang, T.J.; Larson, M.G.; Vasan, R.S.; Cheng, S.; Rhee, E.P.; McCabe, E.; Lewis, G.D.; Fox, C.S.; Jacques, P.F.; Fernandez, C.; et al. Metabolite profiles and the risk of developing diabetes. Nat. Med. 2011, 17, 448–453. [Google Scholar] [CrossRef] [PubMed]
- Klein, M.S.; Shearer, J. Metabolomics and Type 2 Diabetes: Translating Basic Research into Clinical Application. J. Diabetes Res. 2016, 2016, 3898502. [Google Scholar] [CrossRef] [PubMed] [Green Version]
- Lake, A.D.; Novak, P.; Shipkova, P.; Aranibar, N.; Robertson, D.G.; Reily, M.D.; Lehman-McKeeman, L.; Vaillancourt, R.R.; Cherrington, N.J. Branched chain amino acid metabolism profiles in progressive human nonalcoholic fatty liver disease. Amino Acids 2015, 47, 603–615. [Google Scholar] [CrossRef] [PubMed]
- Mayo, R.; Crespo, J.; Martínez-Arranz, I.; Banales, J.M.; Arias, M.; Mincholé, I.; Aller de la Fuente, R.; Jimenez-Agüero, R.; Alonso, C.; de Luis, D.A.; et al. Metabolomic-based noninvasive serum test to diagnose nonalcoholic steatohepatitis: Results from discovery and validation cohorts. Hepatol. Commun. 2018, 2, 807–820. [Google Scholar] [CrossRef] [PubMed]
- Wood, G.C.; Chu, X.; Argyropoulos, G.; Benotti, P.; Rolston, D.; Mirshahi, T.; Petrick, A.; Gabrielson, J.; Carey, D.J.; DiStefano, J.K.; et al. A multi-component classifier for nonalcoholic fatty liver disease (NAFLD) based on genomic, proteomic, and phenomic data domains. Sci. Rep. 2017, 7, 43238. [Google Scholar] [CrossRef] [Green Version]
- Dong, S.; Zhan, Z.Y.; Cao, Y.; Wu, C.; Bian, Y.Q.; Li, J.Y.; Cheng, G.H.; Liu, P.; Sun, M.Y. Urinary metabolomics analysis identifies key biomarkers of different stages of nonalcoholic fatty liver disease. World J. Gastroenterol. 2017, 23, 2771–2784. [Google Scholar] [CrossRef]
- Goffredo, M.; Santoro, N.; Tricò, D.; Giannini, C.; D’Adamo, E.; Zhao, H.; Peng, G.; Yu, X.; Lam, T.T.; Pierpont, B.; et al. A Branched-Chain Amino Acid-Related Metabolic Signature Characterizes Obese Adolescents with Non-Alcoholic Fatty Liver Disease. Nutrients 2017, 9, 642. [Google Scholar] [CrossRef] [Green Version]
- Martineau, E.; Tea, I.; Loaec, G.; Giraudeau, P.; Akoka, S. Strategy for choosing extraction procedures for NMR-based metabolomic analysis of mammalian cells. Anal. Bioanal. Chem. 2011, 401, 2133–2142. [Google Scholar] [CrossRef]
- Beltran, A.; Suarez, M.; Rodriguez, M.A.; Vinaixa, M.; Samino, S.; Arola, L.; Correig, X.; Yanes, O. Assessment of compatibility between extraction methods for NMR- and LC/MS-based metabolomics. Anal. Chem. 2012, 84, 5838–5844. [Google Scholar] [CrossRef] [PubMed]
- Nagana Gowda, G.A.; Raftery, D. Quantitating metabolites in protein precipitated serum using NMR spectroscopy. Anal. Chem. 2014, 86, 5433–5440. [Google Scholar] [CrossRef] [PubMed]
- Miele, M.M.; Irving, B.A.; Wenrich, B.R.; Martin, P.L. Reproducibility and Stability of Aqueous Metabolite Levels in Extracted Serum by NMR Spectroscopy. Curr. Metab. 2017, 5, 45–54. [Google Scholar] [CrossRef]
- Wood, G.C.; Chu, X.; Manney, C.; Strodel, W.; Petrick, A.; Gabrielsen, J.; Seiler, J.; Carey, D.; Argyropoulos, G.; Benotti, P.; et al. An electronic health record-enabled obesity database. BMC Med. Inform. Decis. Mak. 2012, 12, 45. [Google Scholar] [CrossRef] [Green Version]
- Kleiner, D.E.; Brunt, E.M.; Van Natta, M.; Behling, C.; Contos, M.J.; Cummings, O.W.; Ferrell, L.D.; Liu, Y.; Torbenson, M.S.; Unalp-Arida, A.; et al. Nonalcoholic Steatohepatitis Clinical, Research Network Design and validation of a histological scoring system for nonalcoholic fatty liver disease. Hepatology 2005, 41, 1313–1321. [Google Scholar] [CrossRef] [PubMed]
- Brunt, E.M. Pathology of fatty liver disease. Mod. Pathol. 2007, 20, S40–S48. [Google Scholar] [CrossRef] [PubMed]
- Mckay, R.T. How the 1D-NOESY suppresses solvent signal in metabonomics NMR spectroscopy: An examination of the pulse sequence components and evolution. Concepts Magn. Reson. 2011, 38A, 197–220. [Google Scholar] [CrossRef]


| Parameter | Non-NAFLD | Steatosis | Fibrosis | p (ANOVA) |
|---|---|---|---|---|
| Total, n | 32 | 39 | 29 | |
| Sex | F (32) | F (39) | F (29) | |
| Age (years) | 45 ± 11 | 45 ± 11 | 43.9 ± 8.9 | 0.832 |
| Race and Ethnicity d | Caucasian (31) Native American (1) | Caucasian (38) African American (1) | Caucasian (29) | |
| BMI (kg/m2) | 48.7 ± 6.9 | 50.1 ± 7.4 | 51.9 ± 8.0 | 0.268 |
| Waist Circumference (inches) | 50.5 ± 4.4 | 52.8 ± 5.5 | 54.0 ± 5.1 | 0.021 |
| (Waist/cm) | (128 ± 11) | (134 ± 14) | 137 ± 13 | |
| Hypertension | 0.41 (n = 13) | 0.41 (n = 16) | 0.45 (n = 13) | 0.935 a |
| Type 2 Diabetes | 0.41 (n = 13) | 0.38 (n = 15) | 0.48 (n = 14) | 0.713 a |
| Hyperlipidemia | 0.41 (n = 13) | 0.31 (n = 12) | 0.41 (n = 12) | 0.632 a |
| Blood sugar (mg/dL) | 98 ± 40 | 107 ± 55 | 122 ± 64 | 0.472 c |
| Insulin (µU/mL) | 16 ± 11 | 26 ± 17 | 29 ± 16 | 0.003 b |
| HbA1c (%) | 5.85 ± 0.65 | 6.3 ± 1.2 | 7.0 ± 1.8 | 0.005 b |
| Triglycerides (mg/dL) | 150 ± 70 | 175 ± 92 | 280 ± 370 | 0.074 c |
| Cholesterol (mg/dL) | 192 ± 37 | 192 ± 44 | 201 ± 60 | 0.686 |
| High-Density Lipoproteins (mg/dL) | 53 ± 15 | 50 ± 11 | 48.0 ± 9.7 | 0.276 |
| Low-Density Lipoproteins (mg/dL) | 110 ± 37 | 107 ± 43 | 108 ± 42 | 0.961 |
| Alanine Aminotransferase (U/L) | 22.3 ± 9.1 | 28 ± 12 | 50 ± 35 | <0.001 b |
| Aspartate Aminotransferase (U/L) | 23.8 ± 8.3 | 23.9 ± 6.8 | 42 ± 30 | 0.001b |
| Lobular Inflammation (0/1/2/3) | 32/0/0/0 | 30/8/1/0 | 2/17/10/0 | |
| Ballooning (0/1/2) | 32/0/0 | 30/5/4 | 4/13/12 | |
| Steatosis Grading | ||||
| 0 (<5%) | 32 (100%) | 0 (0%) | 0 (0%) | |
| 1 (5–33%) | 0 (0%) | 26 (67%) | 0 (0%) | |
| 2 (34–66%) | 0 (0%) | 12 (31%) | 15 (52%) | |
| 3 (>66%) | 0 (0%) | 1 (3%) | 14 (48%) | |
| Fibrosis Staging | ||||
| 0 (none) | 32 (100%) | 39 (100%) | 0 (0%) | |
| 1a (mild perisinusoidal) | 0 (0%) | 0 (0%) | 11 (38%) | |
| 1b (moderate perisinusoidal) | 0 (0%) | 0 (0%) | 2 (7%) | |
| 1c (portal/periportal) | 0 (0%) | 0 (0%) | 3 (10%) | |
| 2 (perisinusoidal and portal/periportal) | 0 (0%) | 0 (0%) | 8 (28%) | |
| 3 (bridging) | 0 (0%) | 0 (0%) | 5 (17%) | |
| 4 (cirrhosis) | 0 (0%) | 0 (0%) | 0 (0%) |
| Metabolite | Non-NAFLD (n = 32) | Steatosis (n = 39) | Fibrosis (n = 29) | p (ANOVA) |
|---|---|---|---|---|
| 2-Aminobutyrate | 0.0136 (66) | 0.0114 (42) | 0.0113 (40) | 0.208 a |
| 2-Hydroxybutyrate | 0.033 (22) | 0.026 (13) | 0.033 (14) | 0.158 b |
| 2-Hydroxyisovalerate | 0.0018 (13) | 0.0021 (13) | 0.0040 (42) | 0.005 b |
| 2-Oxoisocaproate | 0.0173 (64) | 0.0177 (46) | 0.0191 (64) | 0.462 b |
| 3-Hydroxybutyrate | 0.14 (13) | 0.076 (83) | 0.082 (93) | 0.066 c |
| 3-Hydroxyisobutyrate | 0.0057 (39) | 0.0048 (18) | 0.0057 (20) | 0.273 b |
| 2-Methyl-3-oxovalerate | 0.0109 (45) | 0.0117 (32) | 0.0132 (47) | 0.114 b |
| Acetate | 0.033 (17) | 0.039 (65) | 0.0303 (61) | 0.569 c |
| Acetoacetate # | 0.0087 (65) | 0.0071 (52) | 0.0071 (50) | 0.428 |
| Acetone | 0.014 (13) | 0.0078 (53) | 0.0070 (60) | 0.003 b |
| Alanine | 0.175 (43) | 0.209 (55) | 0.219 (61) | 0.003 |
| Asparagine | 0.0195 (57) | 0.0201 (59) | 0.0181 (54) | 0.356 |
| Aspartate | 0.0134 (61) | 0.0136 (61) | 0.0133 (52) | 0.964 |
| Azelate * | 0.035 (24) | 0.032 (16) | 0.048 (42) | 0.086 b |
| Betaine | 0.0198 (64) | 0.0208 (67) | 0.0167 (52) | 0.024 |
| Carnitine | 0.0168 (41) | 0.0187 (45) | 0.0188 (65) | 0.154 a |
| Choline | 0.0079 (24) | 0.0083 (22) | 0.0075 (22) | 0.328 b |
| Citrate | 0.0186 (55) | 0.0179 (55) | 0.0199 (54) | 0.308 |
| Creatine | 0.026 (37) | 0.0161 (67) | 0.0186 (97) | 0.445 c |
| Creatinine | 0.027 (12) | 0.025 (12) | 0.023 (13) | 0.575 |
| Dimethylsulfone | 0.05 (27) | 0.0036 (58) | 0.005 (13) | 0.937 c |
| Formate | 0.0231 (39) | 0.0236 (34) | 0.0222 (30) | 0.258 |
| Glucose | 1.88 (55) | 2.14 (75) | 2.4 (1.3) | 0.069 b |
| Glutamate | 0.045 (17) | 0.050 (16) | 0.054 (21) | 0.180 |
| Glutamine | 0.209 (41) | 0.207 (39) | 0.195 (50) | 0.410 |
| Glycerol | 0.049 (23) | 0.050 (18) | 0.058 (25) | 0.163 |
| Glycine | 0.131 (39) | 0.126 (27) | 0.126 (43) | 0.813 a |
| Histidine | 0.0344 (56) | 0.0355 (59) | 0.0344 (71) | 0.696 b |
| Hypoxanthine ** | 0.0059 (25) | 0.0060 (27) | 0.0042 (18) | 0.006 b |
| Isobutyrate | 0.0056 (15) | 0.0053 (14) | 0.0057 (13) | 0.530 |
| Isoleucine | 0.037 (18) | 0.0365 (70) | 0.0378 (86) | 0.900 b |
| Lactate | 1.11 (43) | 1.25 (38) | 1.30 (40) | 0.171 b |
| Leucine | 0.072 (30) | 0.067 (13) | 0.069 (15) | 0.641 b |
| Lysine | 0.053 (14) | 0.057 (11) | 0.058 (13) | 0.259 |
| Mannose | 0.0312 (61) | 0.033 (12) | 0.034 (12) | 0.565 b |
| Methionine | 0.0135 (38) | 0.0137 (28) | 0.0132 (26) | 0.821 |
| Ornithine | 0.026 (11) | 0.0260 (68) | 0.0244 (71) | 0.730 b |
| Phenylalanine | 0.047 (14) | 0.047 (12) | 0.047 (10) | 0.985 |
| Proline | 0.089 (36) | 0.098 (33) | 0.096 (40) | 0.534 b |
| Propylene glycol | 0.088 (35) | 0.092 (29) | 0.117 (70) | 0.050 b |
| Pyroglutamate | 0.0099 (45) | 0.0108 (39) | 0.0123 (54) | 0.115 |
| Pyruvate | 0.0221 (93) | 0.031 (14) | 0.031 (17) | 0.015 b |
| Serine | 0.045 (12) | 0.046 (11) | 0.045 (13) | 0.924 |
| Suberate * | 0.035 (11) | 0.035 (10) | 0.042 (15) | 0.087a |
| Taurine | 0.074 (40) | 0.070 (17) | 0.056 (13) | 0.031 b |
| Threonine | 0.049 (16) | 0.053 (12) | 0.048 (14) | 0.232 |
| Tryptophan | 0.0254 (72) | 0.0270 (63) | 0.0281 (50) | 0.242 b |
| Tyrosine | 0.040 (13) | 0.0428 (91) | 0.044 (12) | 0.555 b |
| Valine | 0.117 (38) | 0.118 (21) | 0.123 (26) | 0.689 b |
| Non-NAFLD vs. Steatosis | Steatosis vs. Fibrosis | Non-NAFLD vs. Fibrosis | |||
|---|---|---|---|---|---|
| Metabolite (NMR) | p | Metabolite (NMR) | p | Metabolite (NMR) | p |
| 3-hydroxybutyrate * | 0.035 | 2-Hydroxybutyrate | 0.045 | 2-Hydroxyisovalerate | 0.010 |
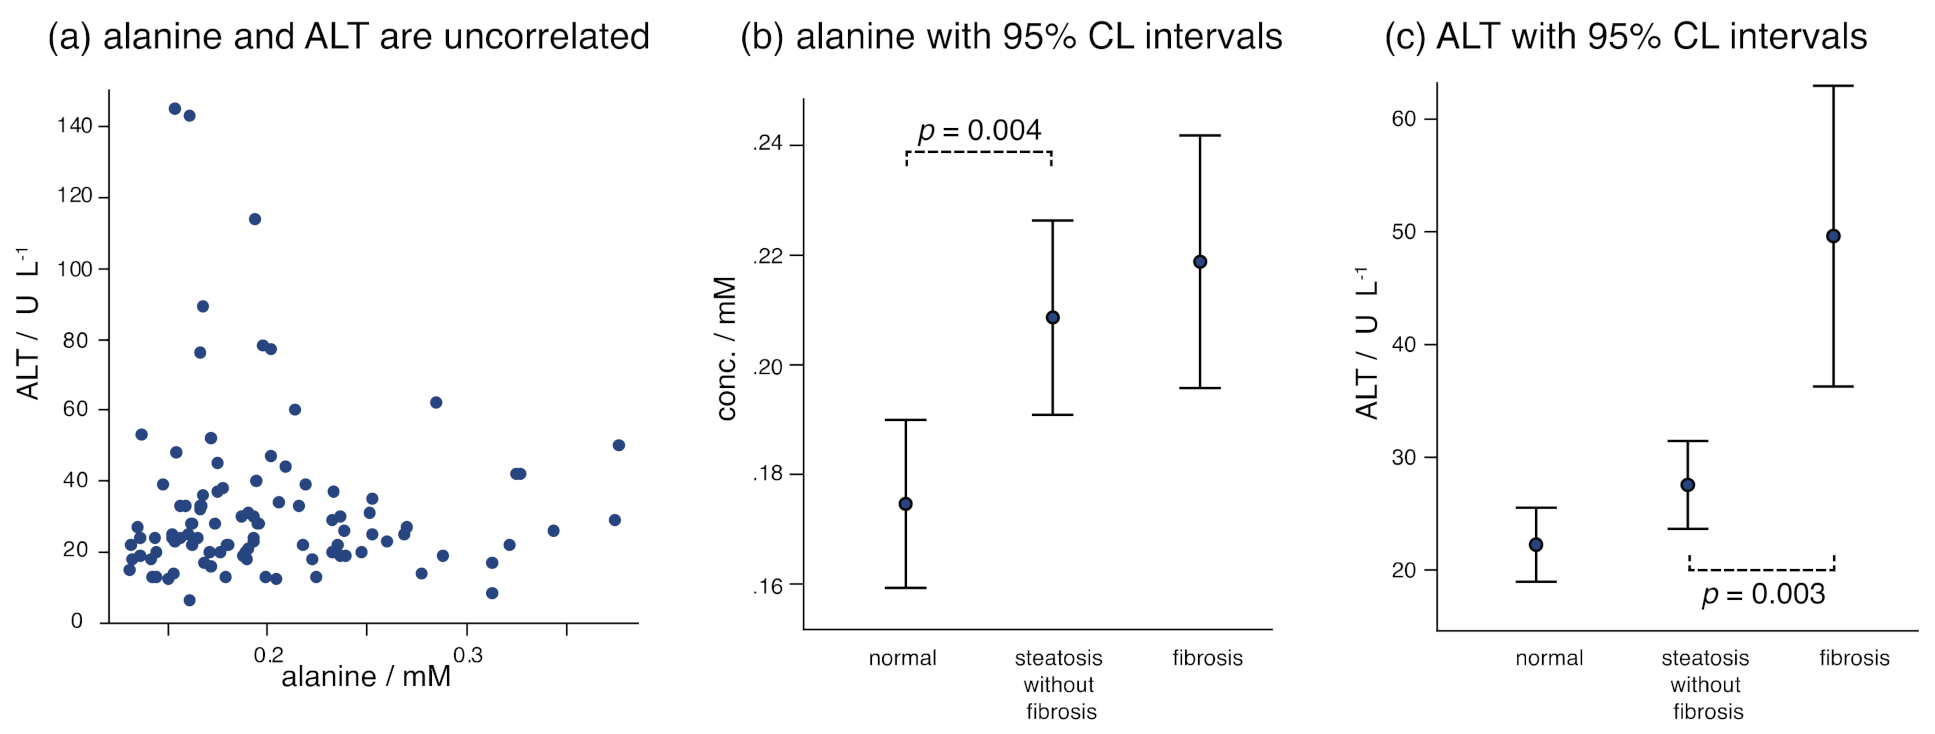
| Alanine | 0.004 | 2-Hydroxyisovalerate | 0.023 | Acetone | 0.007 |
| Acetone | 0.012 | 3-Hydroxyisobutyrate | 0.046 | Alanine | 0.002 |
| Pyruvate | 0.003 | Betaine | 0.008 | Betaine | 0.041 |
| Hypoxanthine | 0.003 | Hypoxanthine # | 0.006 | ||
| Suberate | 0.031 | Taurine | 0.025 | ||
| Taurine | 0.001 | ||||
| 2-Hydroxybutyrate | 0.045 | ||||
| Clinical | p | Clinical | p | Clinical | p |
| Waist | 0.049 | ALT | 0.003 | Waist | 0.005 |
| Insulin | 0.006 | AST | 0.003 | Insulin | 0.001 |
| HbA1c | 0.046 | HbA1c | 0.002 | ||
| ALT | 0.042 | Triglycerides * | 0.029 | ||
| ALT | <0.001 | ||||
| AST | 0.004 | ||||
| Fibrosis Stage 1 (n = 16) | Fibrosis Stages 2 and 3 (n = 13) | p Value | |
|---|---|---|---|
| Metabolite (NMR) | |||
| 2-Aminobutyrate | 0.0128 (41) | 0.0094 (32) | 0.021 |
| Acetoacetate | 0.0087 (57) | 0.0053 (33) | 0.036 # |
| Creatinine | 0.0295 (98) | 0.016 (13) | 0.001 # |
| Hypoxanthine | 0.0051 (16) | 0.0032 (15) | 0.003 |
| Isoleucine | 0.0422 (72) | 0.0324 (71) | 0.001 # |
| Leucine | 0.076 (12) | 0.059 (14) | 0.001 |
| Lysine | 0.063 (12) | 0.052 (11) | 0.020 |
| Methionine | 0.0141 (26) | 0.0122 (21) | 0.040 |
| Tyrosine * | 0.048 (13) | 0.0385 (85) | 0.050 # |
| Valine | 0.135 (21) | 0.109 (24) | 0.004 |
| Clinical | |||
| Type 2 diabetes | 0.50 (8/16) | 0.46 (6/13) | 1.000 § |
| Insulin | 31 (15) | 28 (17) | 0.475 # |
| HbA1c | 6.5 (1.2) | 7.6 (2.3) | 0.232 # |
| GFR + | 86 (20) | 90 (23) | 0.612 |
| Variables | Non-NAFLD and Fibrosis (% Classification Success) | |||
|---|---|---|---|---|
| Overall | Non-NAFLD | Fibrosis | Nagelkirke R2 | |
| Metabolite(NMR) only: | ||||
| alanine, acetone, betaine, 2hiv | 85.2 | 90.6 | 79.3 | 0.478 |
| betaine, hypoxanthine, tryptophan, taurine | 80.0 | 83.9 | 75.9 | 0.590 |
| Metabolite(NMR) + clinical: | ||||
| ALT, alanine, acetone, 2hiv | 86.9 | 87.5 | 86.2 | 0.732 |
| ALT, insulin, propylene glycol, 2hiv | 86.2 | 89.7 | 82.8 | 0.726 |
| Steatosis and Fibrosis (% Classification Success) | ||||
| Overall | Steatosis | Fibrosis | Nagelkirke R2 | |
| Metabolite(NMR) only: | ||||
| pyroglutamate, betaine, taurine, 2hb | 85.3 | 89.7 | 79.3 | 0.507 |
| azelate, hypoxanthine, taurine, 2hiv | 82.4 | 87.2 | 75.9 | 0.471 |
| Metabolite(NMR) + clinical: | ||||
| AST, taurine, azelate, 2hiv | 85.3 | 89.7 | 79.3 | 0.587 |
| AST, taurine, glucose, 2hiv | 86.8 | 94.9 | 75.9 | 0.527 |
| Non-NAFLD and Steatosis (% Classification Success) | ||||
| Overall | Non-NAFLD | Steatosis | Nagelkirke R2 | |
| Metabolite(NMR) only: | ||||
| acetone, alanine, pyruvate, creatine | 73.2 | 65.6 | 79.5 | 0.314 |
| acetone, alanine, pyruvate | 70.4 | 65.6 | 74.4 | 0.272 |
| Metabolite(NMR) + clinical: | ||||
| ALT, alanine, acetone, pyruvate | 76.1 | 68.8 | 82.1 | 0.358 |
| AST, ALT, alanine | 78.6 | 77.4 | 79.5 | 0.305 |
Publisher’s Note: MDPI stays neutral with regard to jurisdictional claims in published maps and institutional affiliations. |
© 2021 by the authors. Licensee MDPI, Basel, Switzerland. This article is an open access article distributed under the terms and conditions of the Creative Commons Attribution (CC BY) license (https://creativecommons.org/licenses/by/4.0/).
Share and Cite
Robinson, E.J.; Taddeo, M.C.; Chu, X.; Shi, W.; Wood, C.; Still, C.; Rovnyak, V.G.; Rovnyak, D. Aqueous Metabolite Trends for the Progression of Nonalcoholic Fatty Liver Disease in Female Bariatric Surgery Patients by Targeted 1H-NMR Metabolomics. Metabolites 2021, 11, 737. https://doi.org/10.3390/metabo11110737
Robinson EJ, Taddeo MC, Chu X, Shi W, Wood C, Still C, Rovnyak VG, Rovnyak D. Aqueous Metabolite Trends for the Progression of Nonalcoholic Fatty Liver Disease in Female Bariatric Surgery Patients by Targeted 1H-NMR Metabolomics. Metabolites. 2021; 11(11):737. https://doi.org/10.3390/metabo11110737
Chicago/Turabian StyleRobinson, Emma J., Matthew C. Taddeo, Xin Chu, Weixing Shi, Craig Wood, Christopher Still, Virginia G. Rovnyak, and David Rovnyak. 2021. "Aqueous Metabolite Trends for the Progression of Nonalcoholic Fatty Liver Disease in Female Bariatric Surgery Patients by Targeted 1H-NMR Metabolomics" Metabolites 11, no. 11: 737. https://doi.org/10.3390/metabo11110737