
Optimal Design for Compliant Mechanism Flexure Hinges: Bridge-Type
by
 ,
,
Chia-Nan Wang
1 ,
,
Fu-Chiang Yang
1,*, 
Van Thanh Tien Nguyen
1,2,*,
Quoc Manh Nguyen
3,*,
Ngoc Thai Huynh
2,* and
Thanh Thuong Huynh
4 1
Department of Industrial Engineering and Management, National Kaohsiung University of Science and Technology, Kaohsiung 80778, Taiwan
2
Industrial University of Ho Chi Minh City, Nguyen Van Bao Street, Ward 4, Go Vap District, Ho Chi Minh City 70000, Vietnam
3
Faculty of Mechanical Engineering, Hung Yen University of Technology and Education, Hung Yen 16000, Vietnam
4
Department of Mechanical Engineering, Campus II, Can Tho University, Can Tho 94000, Vietnam
*
Authors to whom correspondence should be addressed.
Micromachines 2021, 12(11), 1304; https://doi.org/10.3390/mi12111304
Submission received: 5 September 2021
/
Revised: 18 October 2021
/
Accepted: 19 October 2021
/
Published: 23 October 2021
(This article belongs to the Special Issue The 12th International Conference on “Instrumental Methods of Analysis” (IMA-2021))
Abstract
:Compliant mechanisms’ design aims to create a larger workspace and simple structural shapes because these mechanical systems usually have small dimensions, reduced friction, and less bending. From that request, we designed optimal bridge-type compliant mechanism flexure hinges with a high magnification ratio, low stress by using a flexure joint, and especially no friction and no bending. This joint was designed with optimal dimensions for the studied mechanism by using the method of grey relational analysis (GRA), which is based on the Taguchi method (TM), and finite element analysis (FEA). Grey relational grade (GRG) has been estimated by an artificial neural network (ANN). The optimal values were in good agreement with the predicted value of the Taguchi method and regression analysis. The finite element analysis, signal-to-noise analysis, surface plot, and analysis of variance demonstrated that the design dimensions significantly affected the equivalent stress and displacement. The optimal values of displacement were also verified by the experiment. The outcomes were in good agreement with a deviation lower than 6%. Specifically, the displacement amplification ratio was obtained as 65.36 times compared with initial design.
1. Introduction
For over a decade, numerous scientists and researchers have investigated several kinds of flexure hinges to use as the traditional joints. Yong and Lu investigated the kinetostatic model with a 3-RRR compliant mechanism [1]. These joints could be used as rotational joints for a 3-DOF (degrees of freedom) parallel mechanism with smooth and high-precision motion in micro/nanomanipulation work, which Tian et al. [2] presented in their recent studies. Qi et al. showed a displacement-amplification bridge-type mechanism, referring to the elastic beam theory (EBT) [3] and kinematics. The equivalent formula and FEM (finite element method) to analyze failures in Triple-LET and LET flexure hinges were employed by Qiu, Yin, and Xie [4]. Tian et al. used the finite element method to simulate filleted V-shaped flexure hinges and compared them with closed-form compliance equations [5]. Yang et al. used super-elastic materials to produce a bending hinge, and their calculations and numerical experiments were able to accurately predict displacement and reduce computational costs more efficiently than ANSYS FEA [6]. Xu et al. developed DAR employing the Euler-Bernoulli of EBT and confirmed its findings using finite element analysis and conducting experiments [7]. Liu and Yang introduced a new approach applying EBT to investigate the effect of the displacement amplification ratio (DAR) external loads, and the results were validated using the FEM [8]. The law of conservation of energy and EBT improved the methodology of the mechanisms corresponding to the spheres and rhombuses, and the results were compared to those obtained by the FEM and the conducted experiments, as employed by Ling et al. [9]. Choi et al. studied and demonstrated a compatible mechanism with the type of bridge, fully respecting the concentrated and distributed force [10]. Their results have been confirmed by previous experiments and studies. Ma et al. note that DAR increases with the decreasing thickness of the flexible joint, and this problem has been investigated using the FEM and mathematical modeling [11]. A prefabricated modular static modeling tool was introduced by Ling et al. for analyzing and designing the wide range of flexible joints, which is used in the precision-positioning phase. The results of this approach were compared with those of the FEM and its earlier studies [12].
In 2018, Ling et al. presented their findings regarding a semi-analytical finite element approach for complex compliant mechanisms by using Lagrange’s equation [13]. Sabri et al. performed experiments to measure the displacement of silicon XY-micro-stages [14]. A new pseudo-rigid-body model of a flexure hinge was proposed by Šalinic et al. [15]. The concept of virtual operation created a matrix relationship that is used to determine the quasi-static responses of a compatible mechanism due to external loads. Lai et al. used two L-shaped levers and a spherical mechanism to eliminate bending moments and shear forces [16]. The stiffness matrix was used for identifying DAR. It was confirmed by FEA and the conducted experiments. For highly accurate tracking and positioning, Wang and Zhang developed a compact flat nano-localization platform with three free capabilities, in which three two-level switchable amplifiers are symmetrically positioned to obtain high magnification [17,18,19,20,21], and this was determined by the experiments.
The consistency mechanism for all types of bridges described above is the consistency mechanism for types of bridges that use flexible hinges. The presence of stiffness in the four arms of this rectangular mechanism is a serious weakness in the mechanism frequency [19,22,23,24,25,26]. In comparison with the other bridge-type mechanisms, the distributing one is suitable for flexible multi-beam parts for increasing the resonant frequency of the mechanism, instead of notched hinges and rigid bodies. The compliant mechanisms could meet the demand for longer lifetime and better performance, in comparison with dynamic mechanical amplifiers used in the past. In contrast, the adaptation mechanism’s mechanical property of the bridging distribution has never been investigated. At the design step, a sufficiently easy analytical model makes it possible to define the structural factors regarding the performance demands expected from behaviors of the mechanism [27,28,29,30]. In the present study, the mechanical properties of the deformation (displacement) of the bridge-type mechanism have been found and analyzed in detail. The authors use the stiffness matrix method; therefore, the input stiffness used to predict the magnification of the theoretical displacement is confirmed by the FEA. Comparison of the analytical model with the results of the FEA shows that the analytical model has higher precision. According to the analyzed modeling, the influences of shape and material factors on the performance of the bridge-type mechanism, such as displacement ratio and stiffness, have been analyzed.
The motivations of this work are a project that optimizes the design parameters in the bending hinge DAR of the bridge-matching mechanism using gray relational analysis based on the Taguchi method [31,32,33,34,35], FEM in ANSYS, and artificial neural networks [36,37,38,39,40,41]. A gap is often present in many kinds of classical joints, leading to friction and vibration, causing the wear of the joints. Flexure hinges were developed to eliminate the gap, and their effects have been applied in many popular mechanisms. In this study, the optimal design for bridge-type compliant mechanism flexure hinges has been conducted and investigated.
The contribution of this study is to analyze the gateway types of distributed compliance mechanisms. The compliant distributed bridge mechanism has distributed stress and low quality and has a longer life and superior performance compared to the traditional mechanical swing arm pivot-based amplifier. We use the stiffness matrix method to generate an analysis model and predict the input stiffness by comparing the displacement gain of the bridge-type mechanism. For verifying the analysis modeling mechanism, the FEA method of the bridge mechanism has also been performed via the ANSYS Workbench.
2. Developed Modeling and Applied Finite Element Method (FEM)
2.1. Studied Compliant Mechanism—A Developed Model
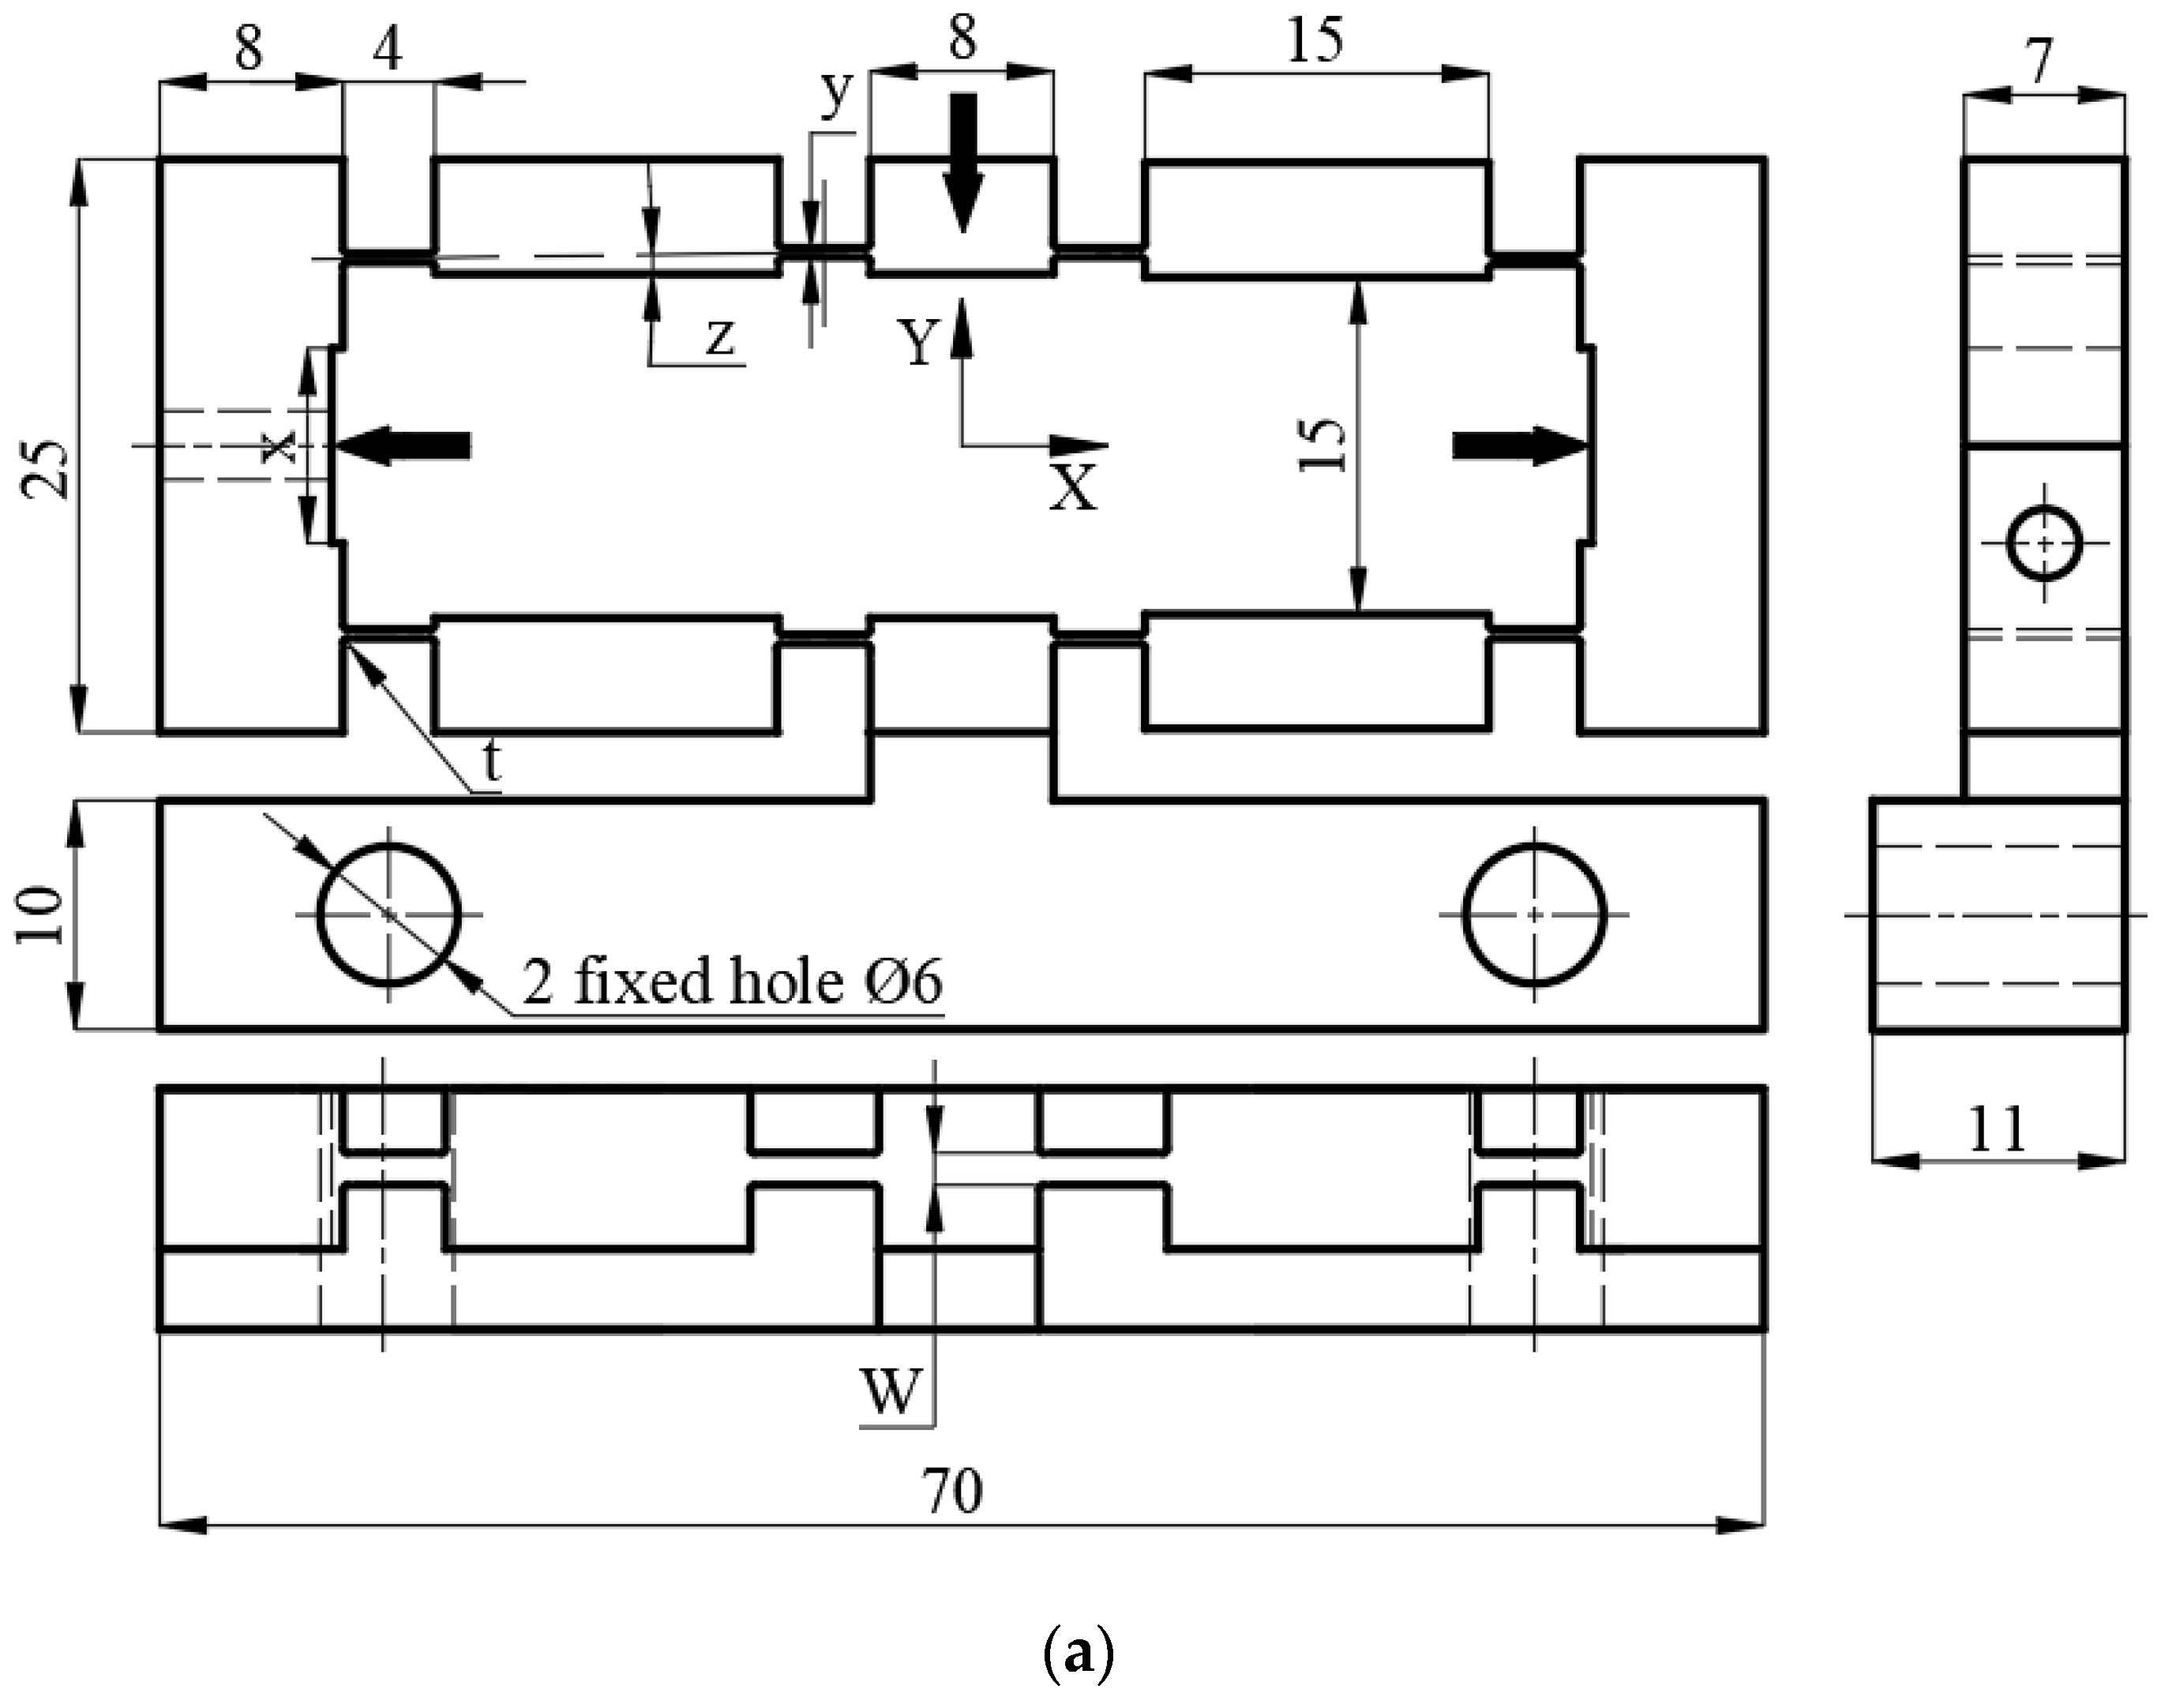
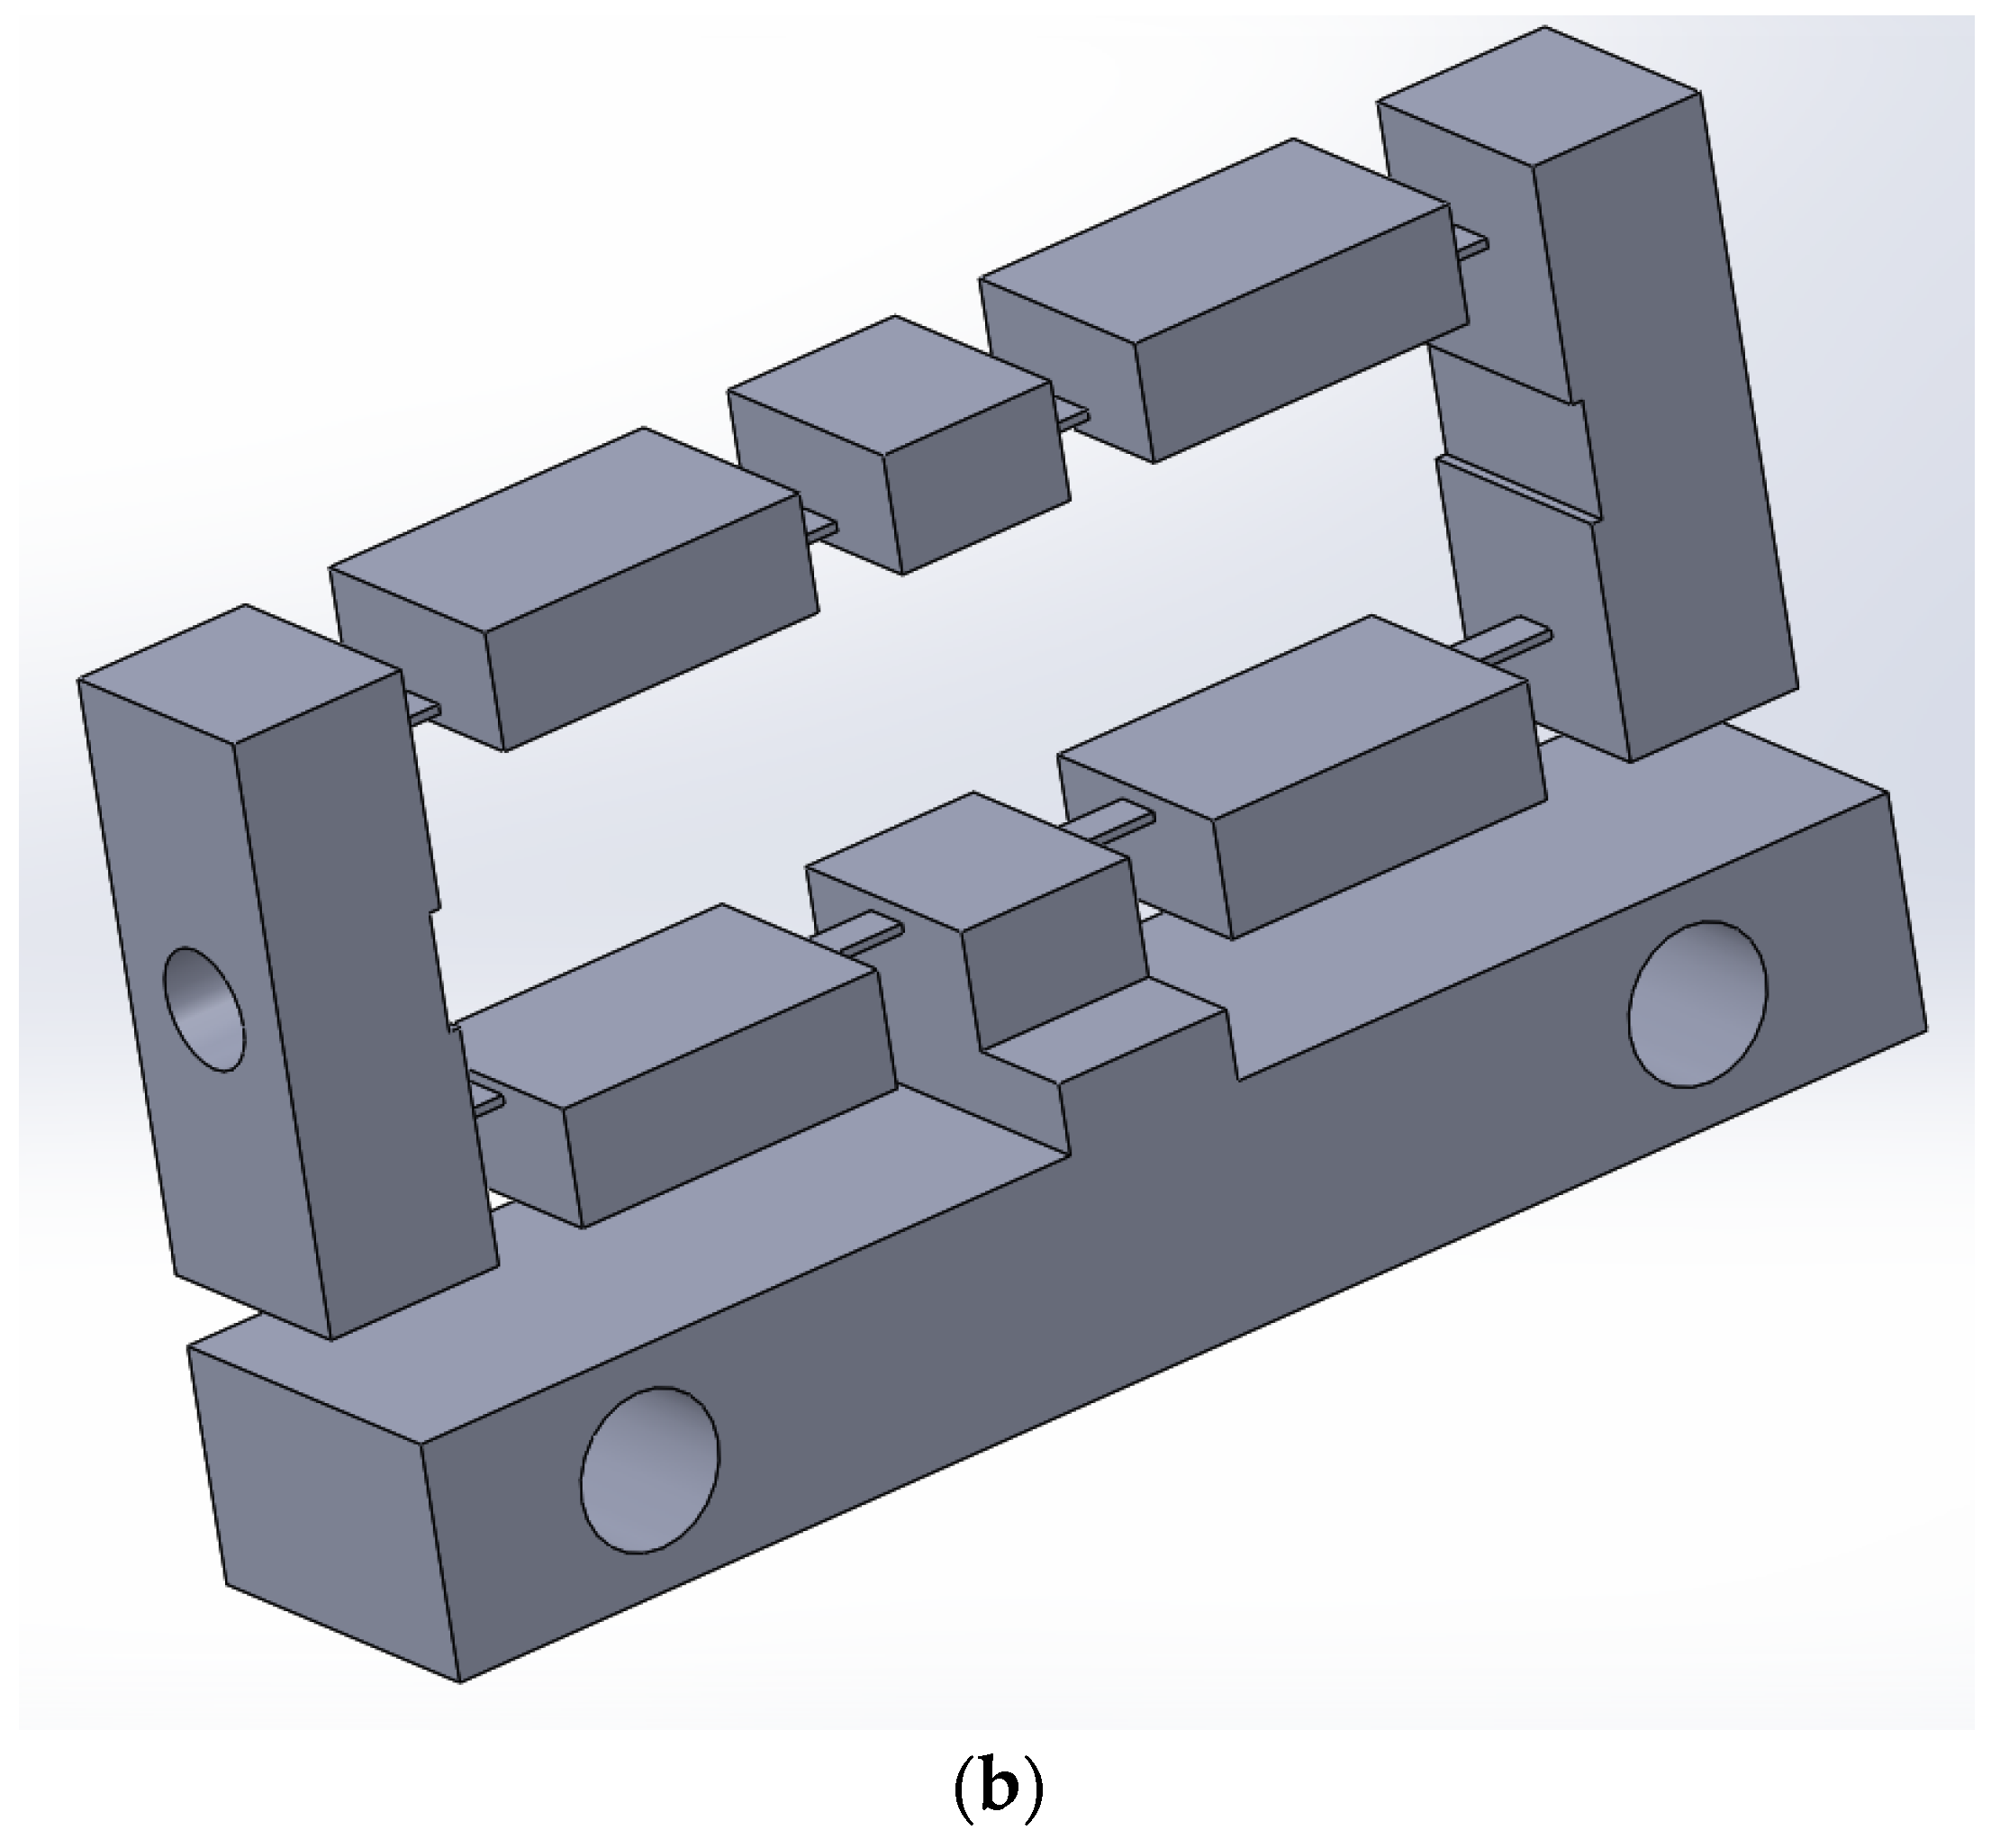
Figure 1 presents our developed compliant mechanism. Its primary dimensions are 70, 25, and 10 mm. Figure 1a shows the 2D drawings, and Figure 1b shows the 3D model. The mechanism has eight bendable joints of 4 mm long and with variable thickness, four middle cases, two inlet cases with variable inlet length, one fixed case, and one outlet case of 8 mm long and 10 mm wide. Absolute force, distribution force, or displacements are employed as inlet parameters to the compliant mechanisms, and the outlet frame moves from top to bottom on the Y-axis.
2.2. Analyzing the Finite Element Method (FEM)
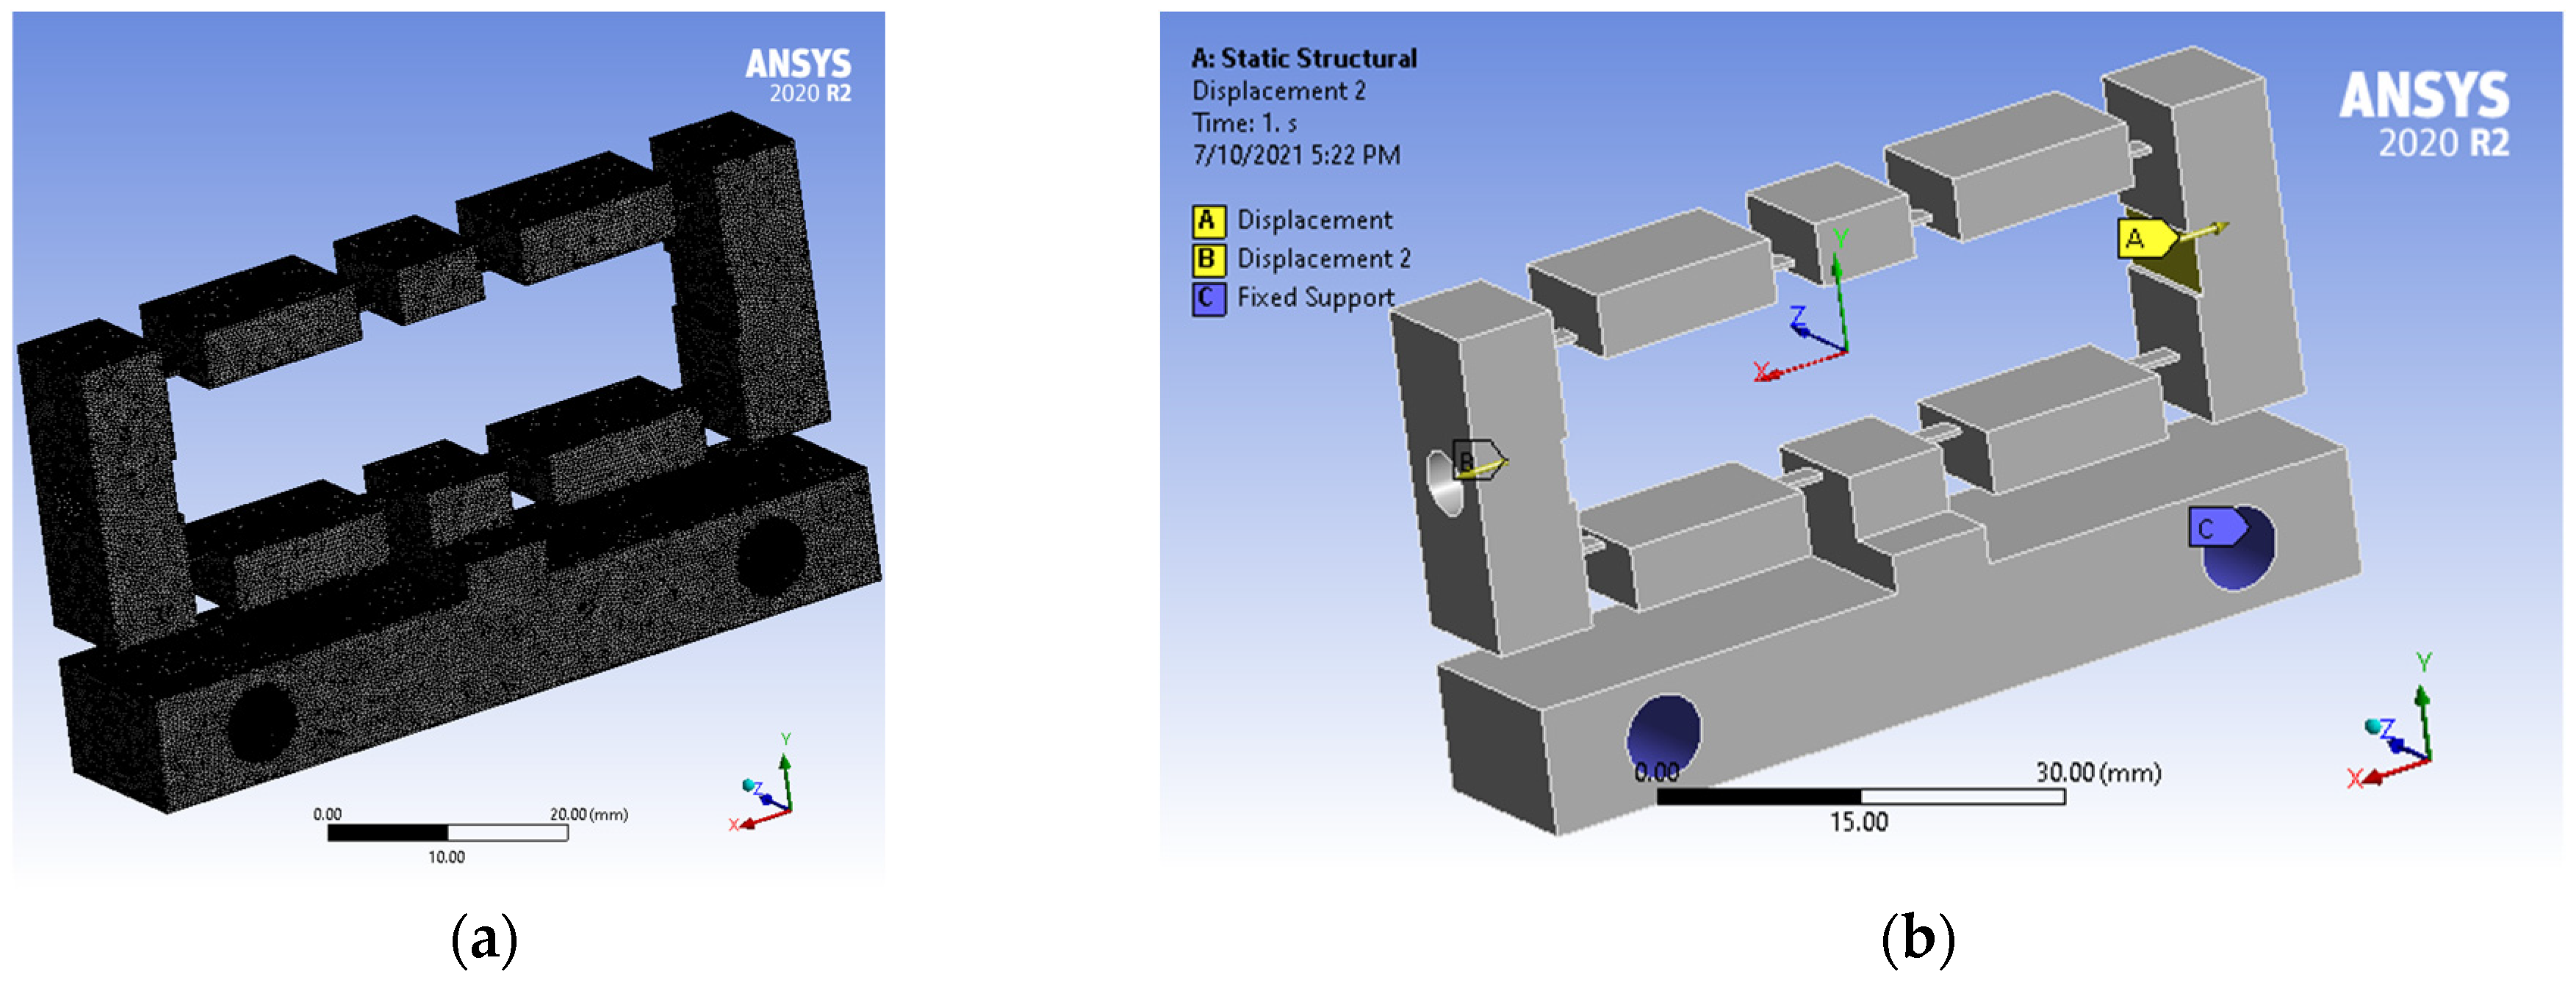
The material used for the developed compliant mechanism is aluminum. First, the developed mechanism model was built employing the SOLIDWORK software and then imported into the statically structural environment (ANSYS tools). It is clear to see that the mechanical material of this developed model is AL-7075 (aluminum). The mechanism meshes are presented in Figure 2a. Fixed support is utilized for fixing surface A. The double-input bodies with 0.01 mm of each (displacement) were placed on the B-surface and C-surface, see Figure 2b.
3. Investigative Methodology
3.1. Grey Relational Analysis Based on Taguchi Method
The Taguchi method (TM) in Minitab 18 software was applied to create an orthogonal array: the optimal output characteristics obtained from the theory model must be pointed out first, and then the optimal methods are applied. However, the deviations compared with the theoretical modeling were huge, and therefore, the optimal methods could not be approved. Thus, in this investigation, we applied TM based on grey relational analysis [18,19,20,21,22,23,24,25,26,27] to optimize these output characteristics.
Step 1: Choosing optimization combination parameters for the output characteristics.
Step 2: Defining the primary control factors with their specific levels.
Step 3: Laying out (L27) the orthogonal array.
Step 4: Carrying out numerical computation and collected numerical results.
Step 5: Employing the grey relational analysis (GRA), which is known as the method for comparing the alternative values of a system undertaking analysis to calculate the significance of the design variable. The GRA method is employed to discretize the frequency. GRA was carried out as below.
Normalizing: Rewrite every single sequence from 0 to 1.
- -
- GRC stands for grey relational coefficient (γ). This employs a quantitative methodology. GRC is required initially. After that, we determined the grey relational grade (GRG).
- -
- Estimation of the normalized coefficient.
- -
- Determination of the entropy.
- -
- Computation of the sum of entropy values.
- -
- Determination of the weight.
Step 7: Analyzing the regression equation.
Step 8: Analysis of variance.
Step 9: Analysis of mean and predicted outcomes.
Step 10: Predicted GRG by using an artificial neural network.
Step 11: Verify results.
values can be found in reference [35].
3.2. Stage of Artificial Neural Network (ANN)
In this study, we used 3 layers: the input layer with 5 enter parameters, the hidden layer with 11 neurons, and 1 output layer with 1 output neuron. The community becomes educated on the usage of the Levenberg–Marquardt hybrid (trainlm) [36,37,38,39,40,41,42,43,44]. The shape of the ANN was offered in [27] and other design method suggestions of structures were mentioned in [47,48,49,50]. The inlet body length, angle of incline, thickness, the radius of the fillet, and the width of the (flexure) hinges were used as the inlet factors. In the contract, displacement and pressure were used as the outlet factors. The numerical values were applied for training. The numerical values then were applied for testing.
3.3. Statistical Analysis
- ◾
- The model accuracy was evaluated utilizing 4 error standards, which are listed in [51].
- ◾
- RMSE stands for the root mean squared error, which differs from forecast values to the numerical ones or observed actual ones.
- ◾
- MSE stands for the mean square error, which is the square value of the root mean square.
- ◾
- MAPE stands for the mean absolute error percentage.
- ◾
- R2 stands for the determination coefficient, which has to be at least 0.8 for forecast models to be accepted:where m stands for the range of experimental simulations, and represent the numerical and forecast values respectively, and represents the mean of the numerical value.
4. Primary Results and Detailed Discussion
4.1. Simulation Plan
The parameters and their levels are listed in Table 1 in detail. Thereby, variable x is the length of the input frame, which changes between 5 and 10 mm (and 15 mm). The variable y is the flexure hinge thickness, changing between 0.4 and 0.6 mm (and 0.8 mm). The variable z is known as the angle of the incline in the two-flexure hinges, changing between 0.7 and 1 degree (and 1.3 degrees). The variable t is known as the flexure hinge fillet radius, and changes between 0 and 0.2 mm (and 0.4 mm). The variable w is the width of the flexure hinge, alternating between 4 and 6 mm (and 8 mm).
By using Minitab 18.0, the numerical results of the generated output displacement values and equivalent stress values are presented in Table 2. Besides, the orthogonal arrays were created. The finite element analysis in ANSYS revealed that the design variable significantly affected displacements and stresses.
are objective functions, and the values are presented in Table 3. For the bridge-type compliant mechanism to work optimally, large displacement is better, and small stress is better. The values Δoi(1) and Δoi(2) are considered as the displacement and stress deviation values respectively, which are presented in Table 3. The GRC values γi(1) and γi(2) represent displacement and stress respectively, and GRG (ψi) is calculated and ranked, as shown in Table 4. The sixth column in Table 4 illustrates the results of the signal-to-noise (S/N) analysis, the seventh column outlines the predicted values of GRG by using ANN, and the eighth column is the error between the predicted values of ANN and the simulation values. The predicted values of GRG by using ANN and the simulated values by using ANSYS are in good agreement. The error is low, as shown in Table 5.
4.2. S/N Ratio Analysis
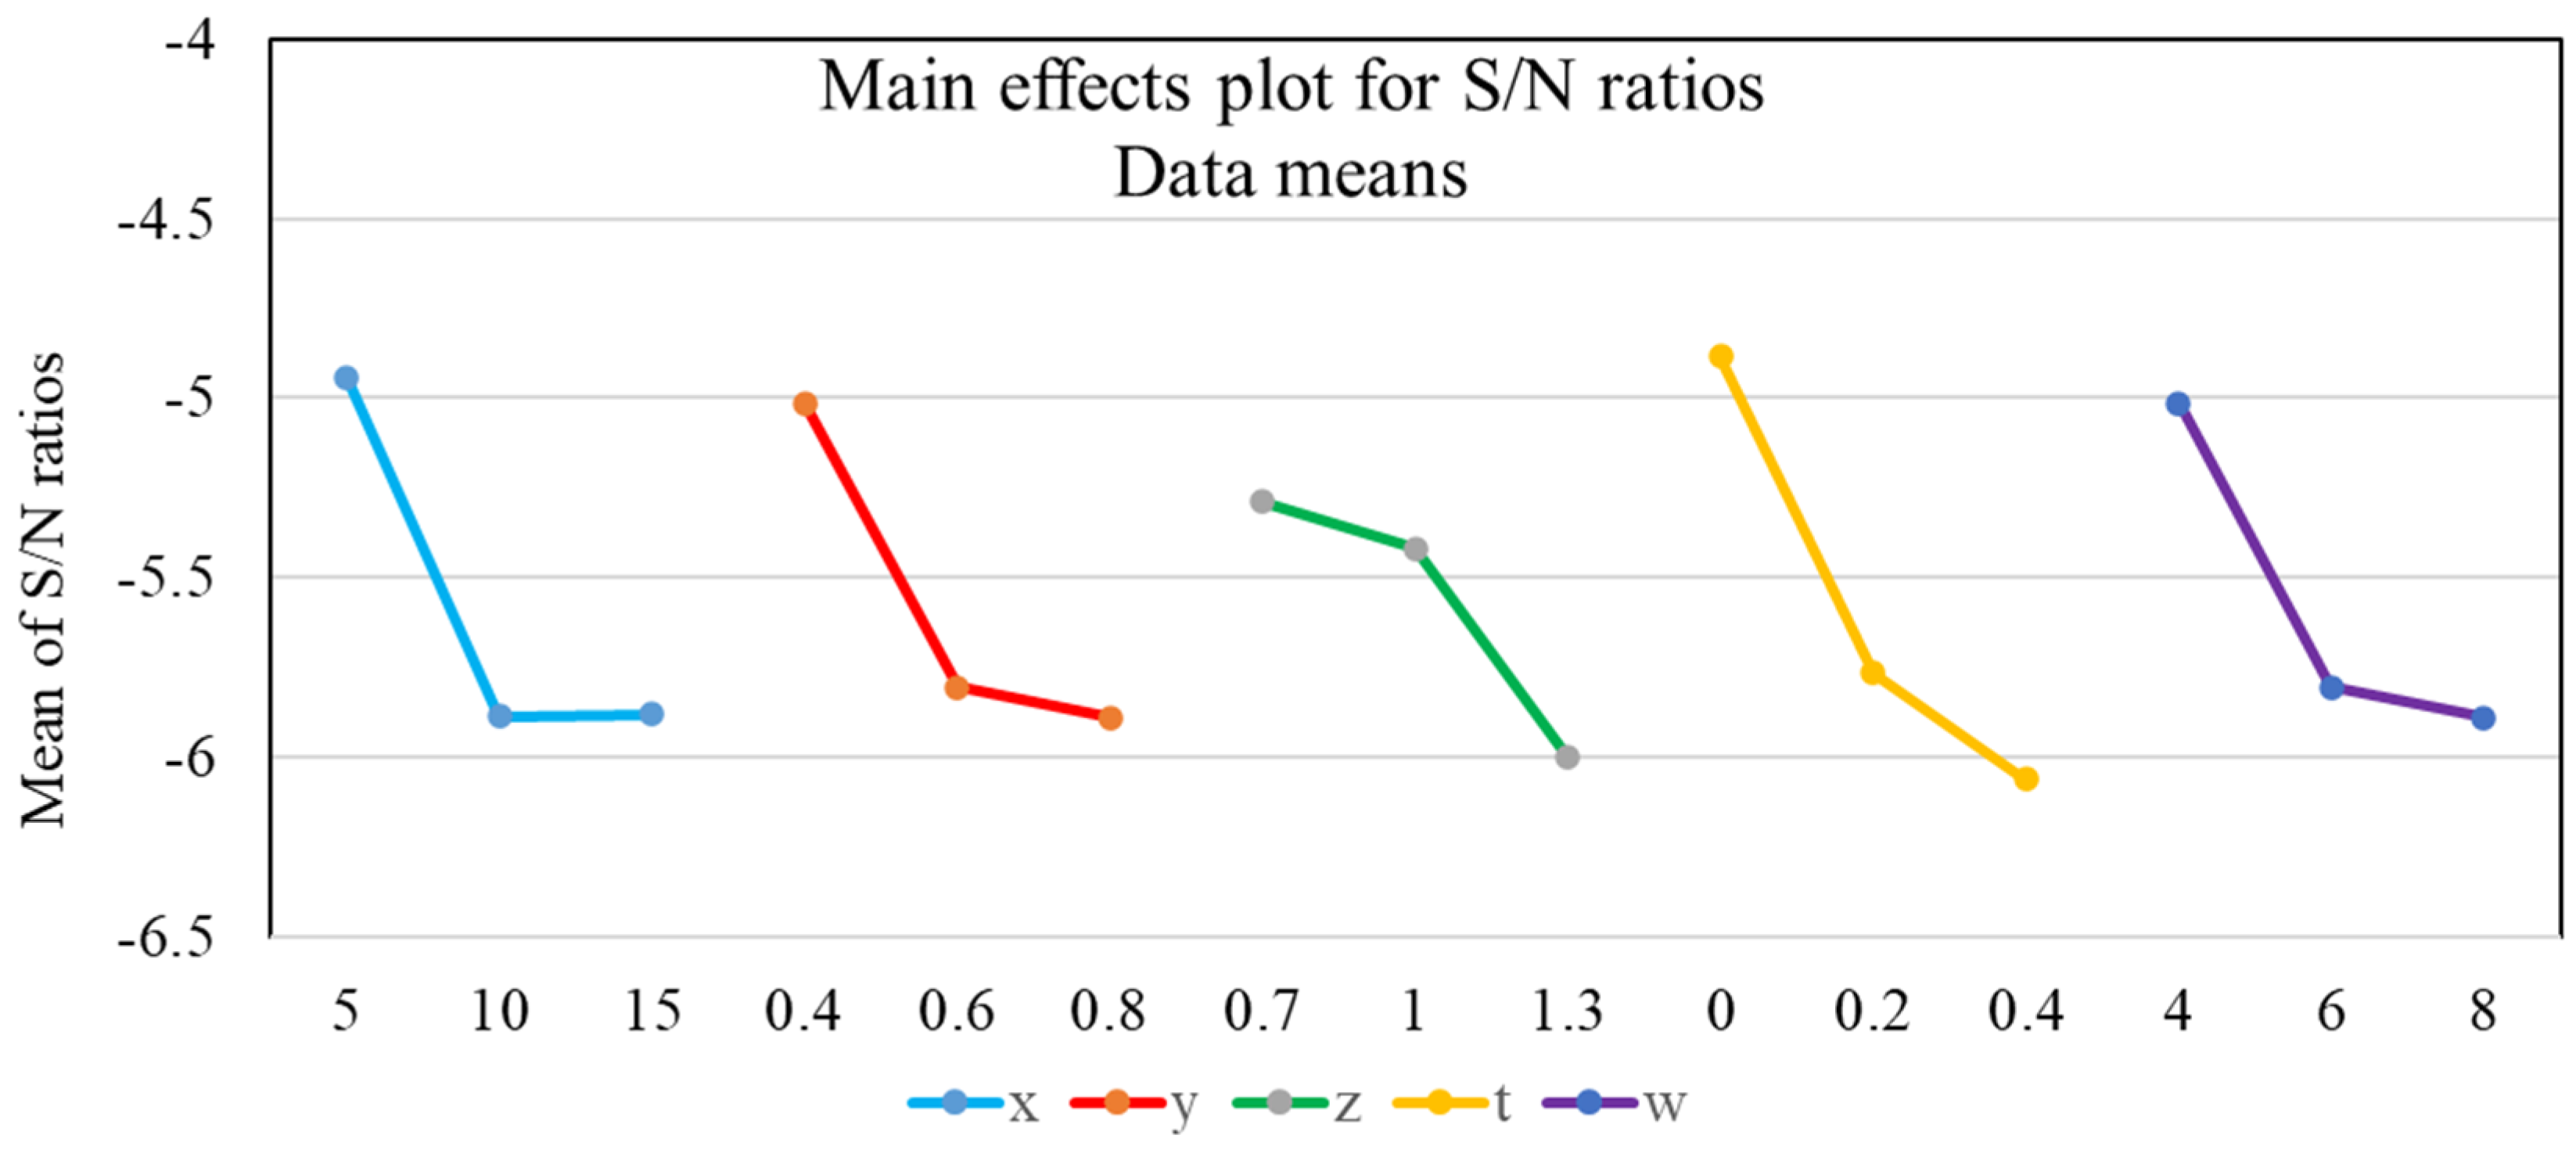
The outcomes of the analysis of the signal-to-noise ratio are listed in Table 5 and used to draw the plot of the S/N analysis as shown in Figure 3. The maximum value of the mean of S/N indicates which optimal level of the design variable (t) needs to be investigated and evaluated. Thereby, the optimal levels of design variables x, y, z, t, and w were selected (5 mm, 0.4 mm, 0.7 degrees, 0 mm, and 4 mm, respectively), corresponding with x1y1z1t1w1. The slope of the graph identifies that the larger the slope of the variable is, the more strongly the variable affects GRG. Therefore, according to Figure 3, variable y is the strongest. The variables of t, x, w, and z eventually decrease. The problem was ranked as shown in Table 4.
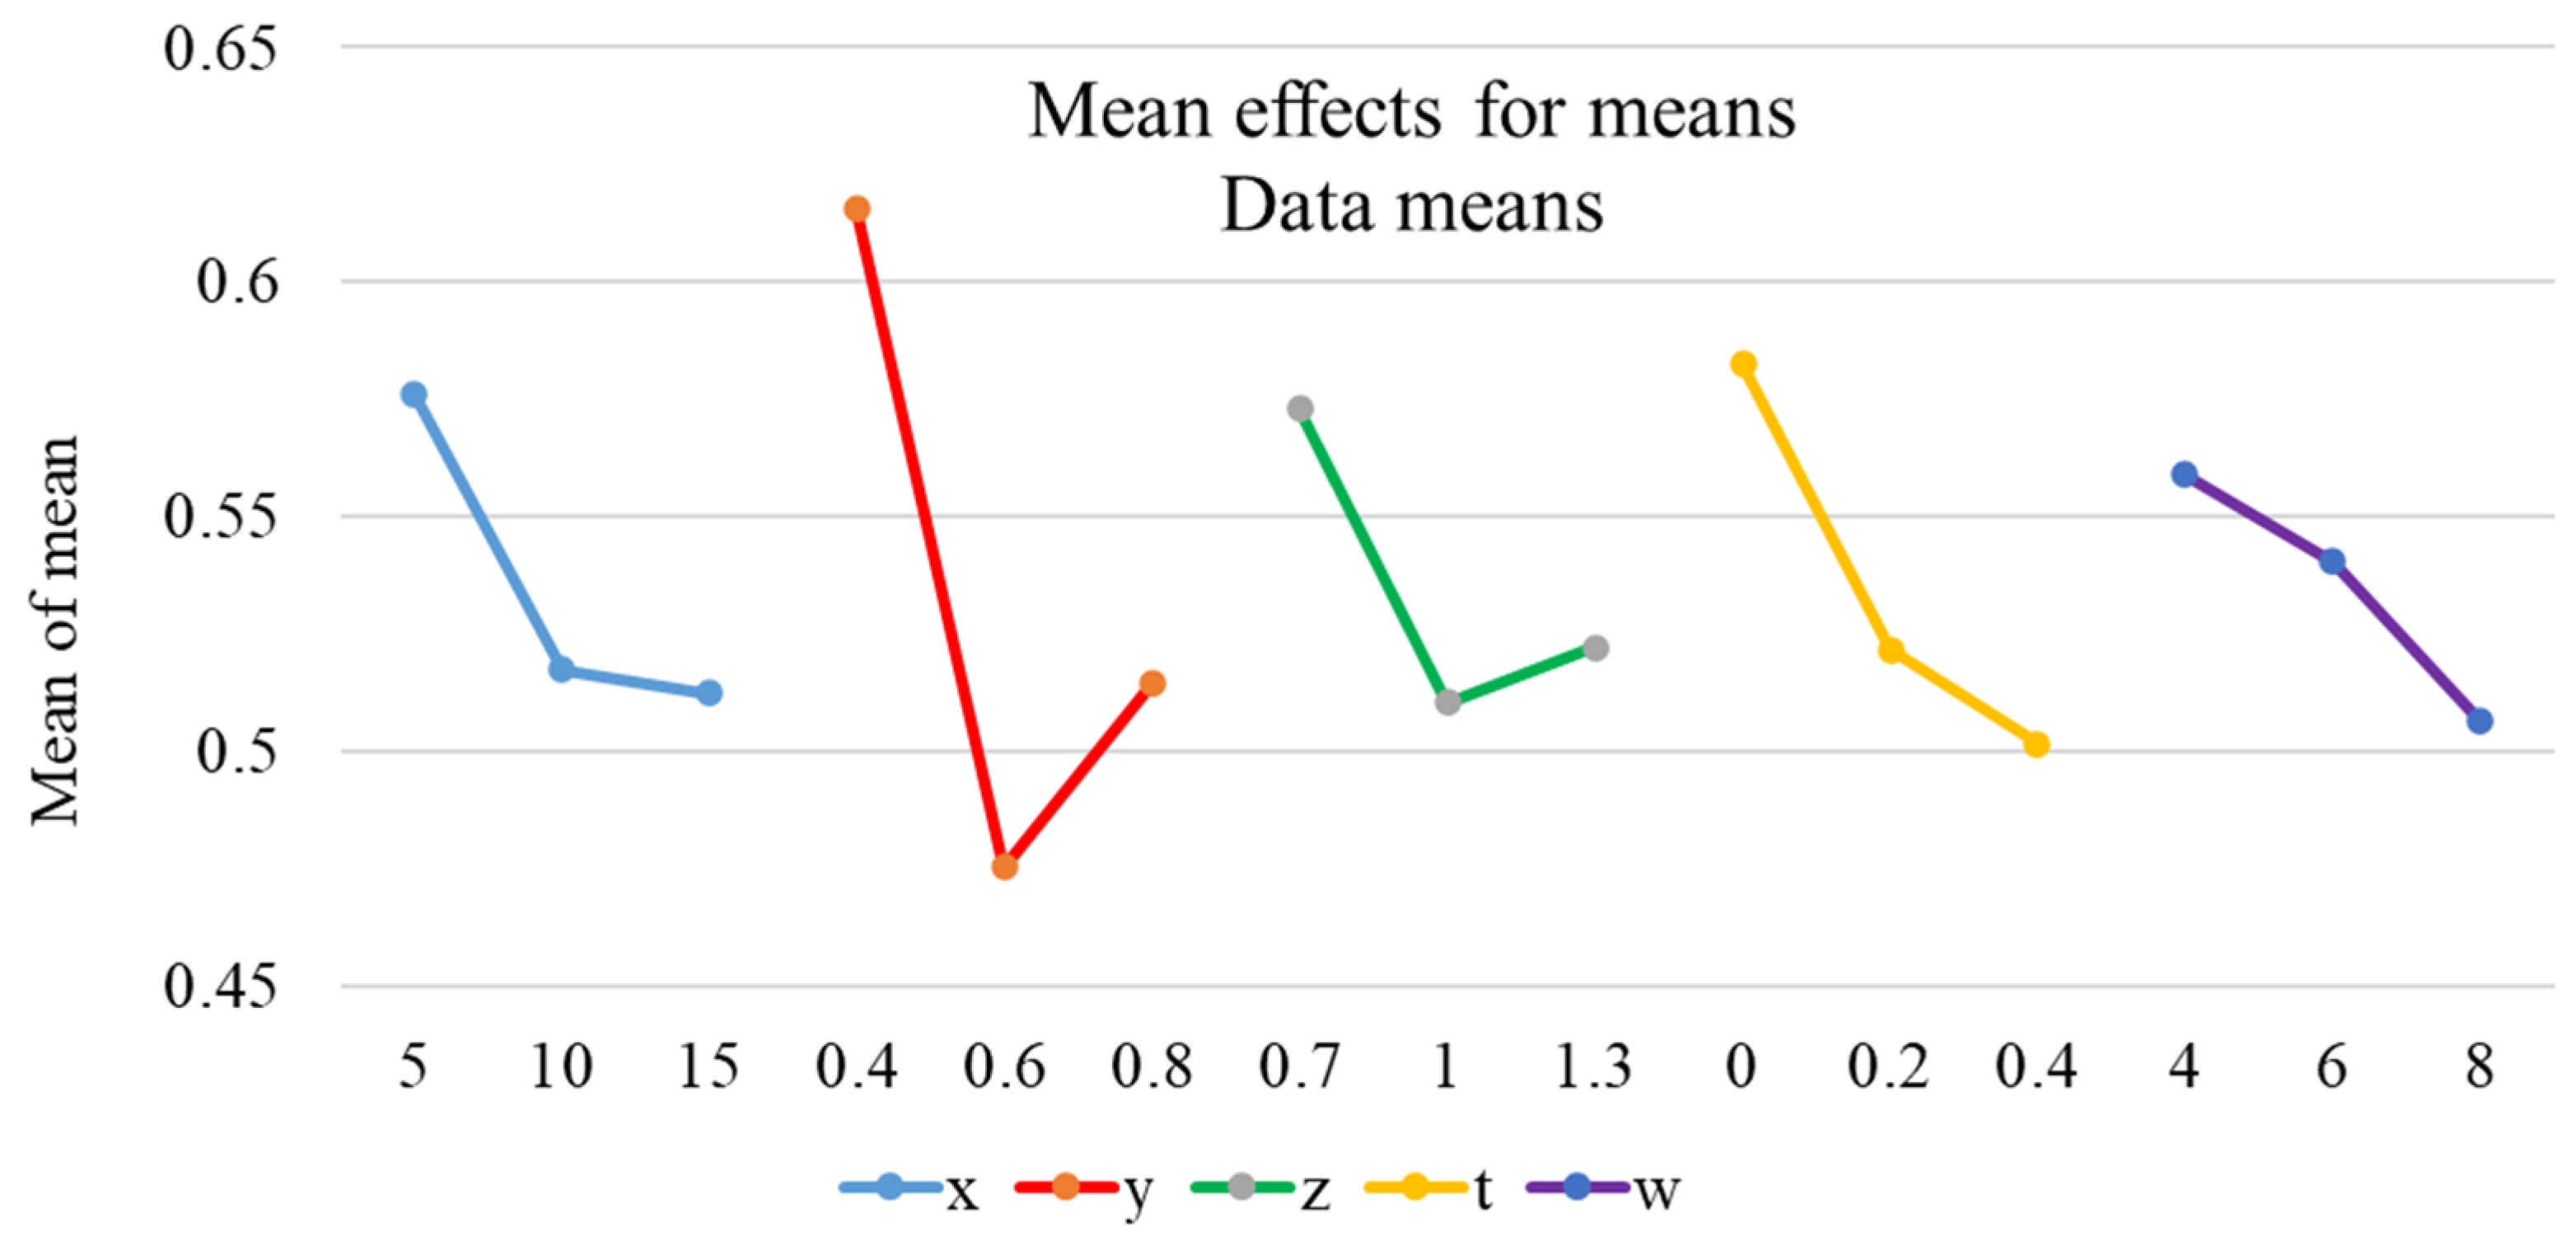
The outcomes of the analysis of the mean values are listed in Table 6 and used to draw the plot of the analysis of the mean values as shown in Figure 4. The maximum mean value of GRG indicates that it is the optimal level for the design variable. Thereby, the optimal levels of the design variables (x, y, z, t, and w) are 5 mm, 0.4 mm, 0.7 degrees, 0 mm, and 4 mm respectively, corresponding with x1y1z1t1w1. The slope of the graph identifies that the larger the slope of the variable is, the more strongly the variable affects GRG. Therefore, according to Figure 4, variable y is the strongest.
4.3. ANOVA for Output Response
The ANOVA outcomes are presented in Table 7. The first column is the design variable, regression equation (RE), error, and total. The second column is the degree of freedom of the RE, design variable, and error. The fourth column presents the contribution of the design variable. The results demonstrate that the design variables significantly affected displacement and stress and are in good agreement with the S/N analysis, the mean analysis, and the finite element analysis in ANSYS. Since the p-values are less than 0.005 and the F-values are higher than 2, it is clear to see that the R-square is 96.61%, R-square (adj) = 94.76%, and R-square (pred) = 92.92%, respectively.
4.4. Regression Analysis
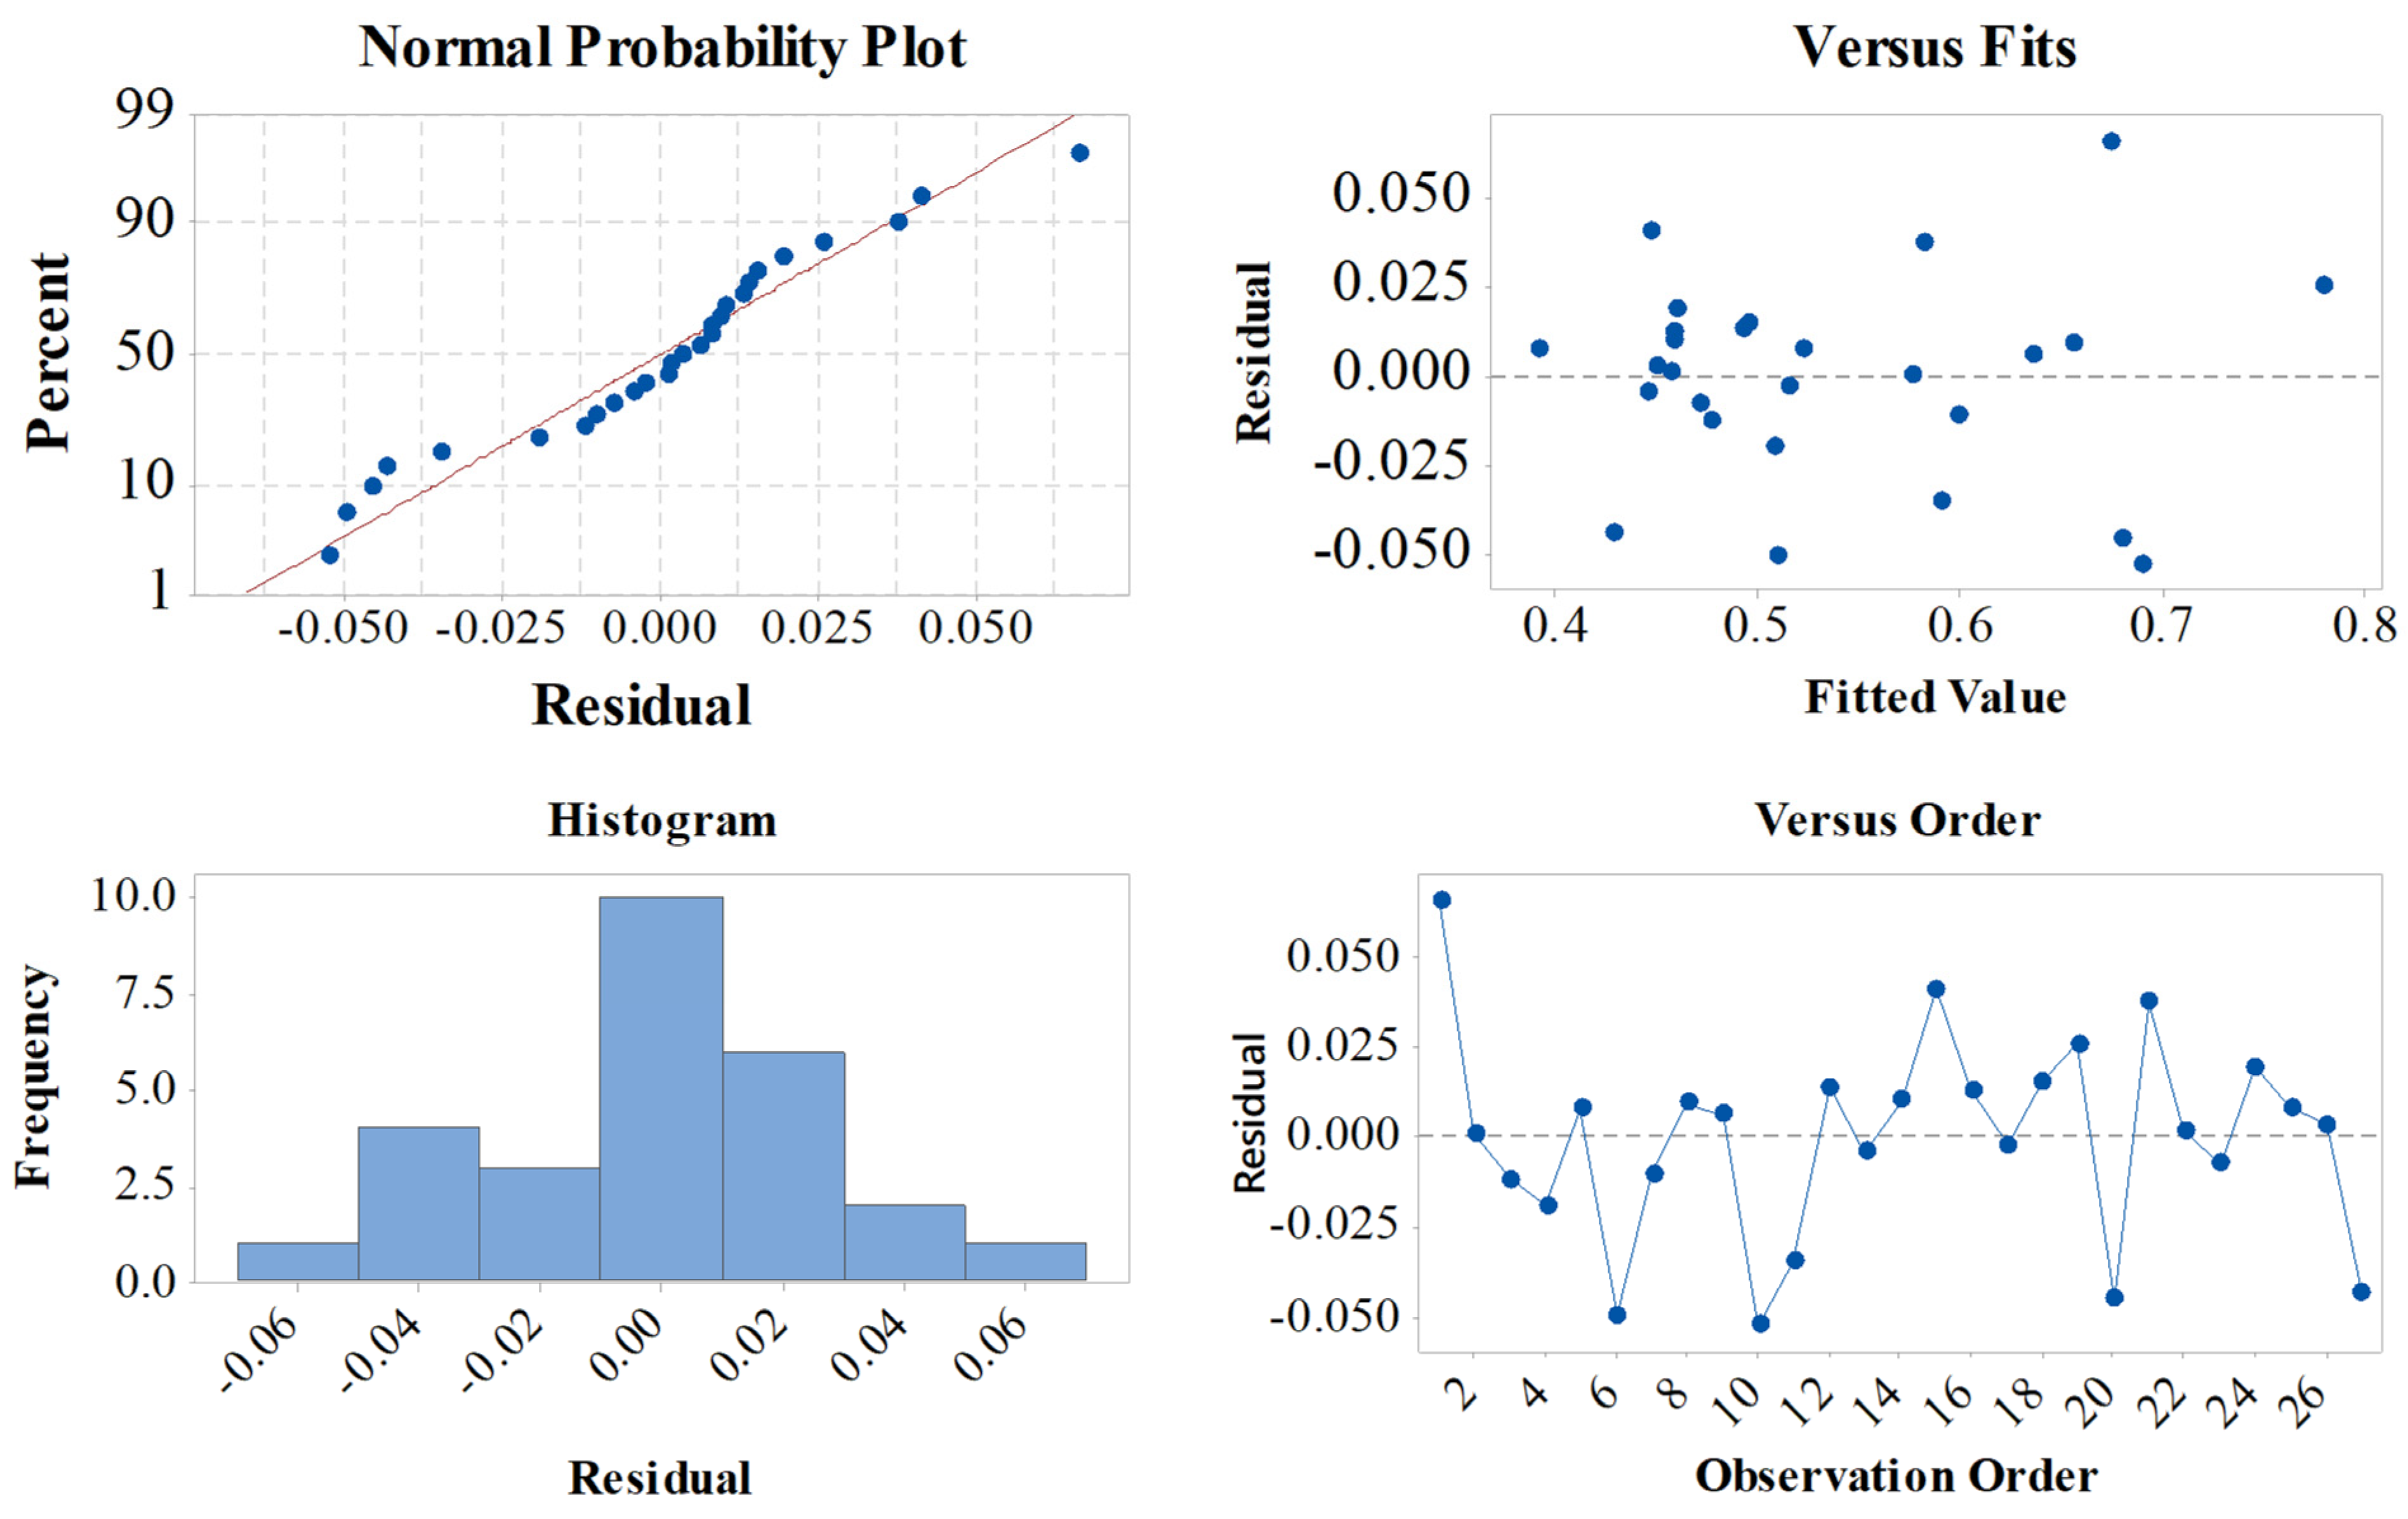
The predicted results were achieved the regression analysis of GRG and presented as the residual graph for GRG in Figure 5. In this study, the normal probability plots demonstrate that the simulation data and predicted data by RE are approximated to each other, and the interval error is between −0.045 and 0.045. The interval was also verified by Equation (2):
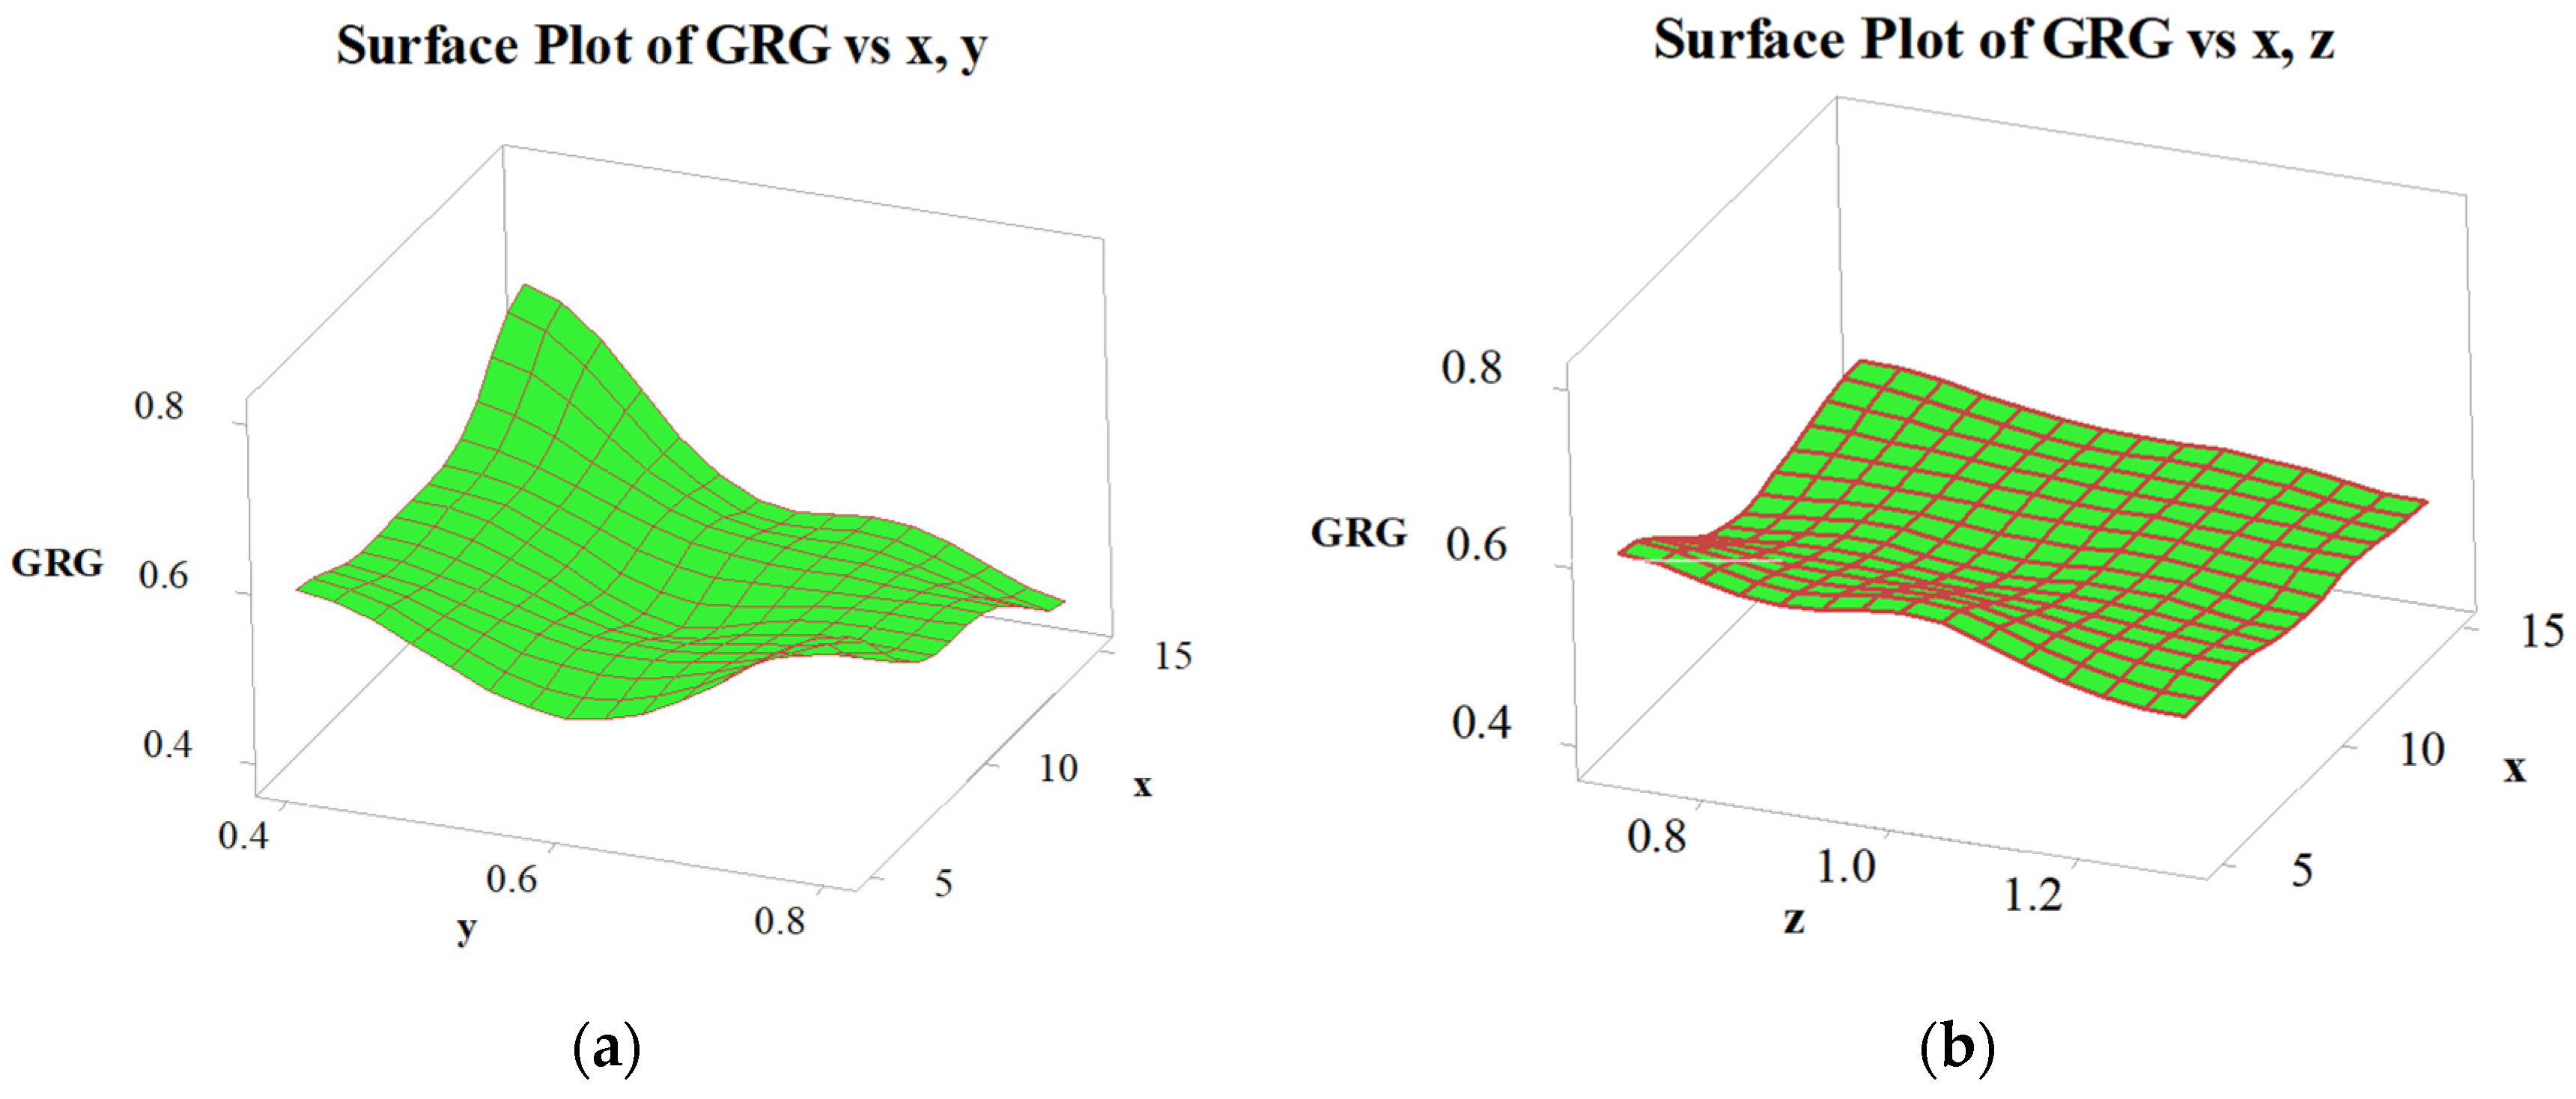
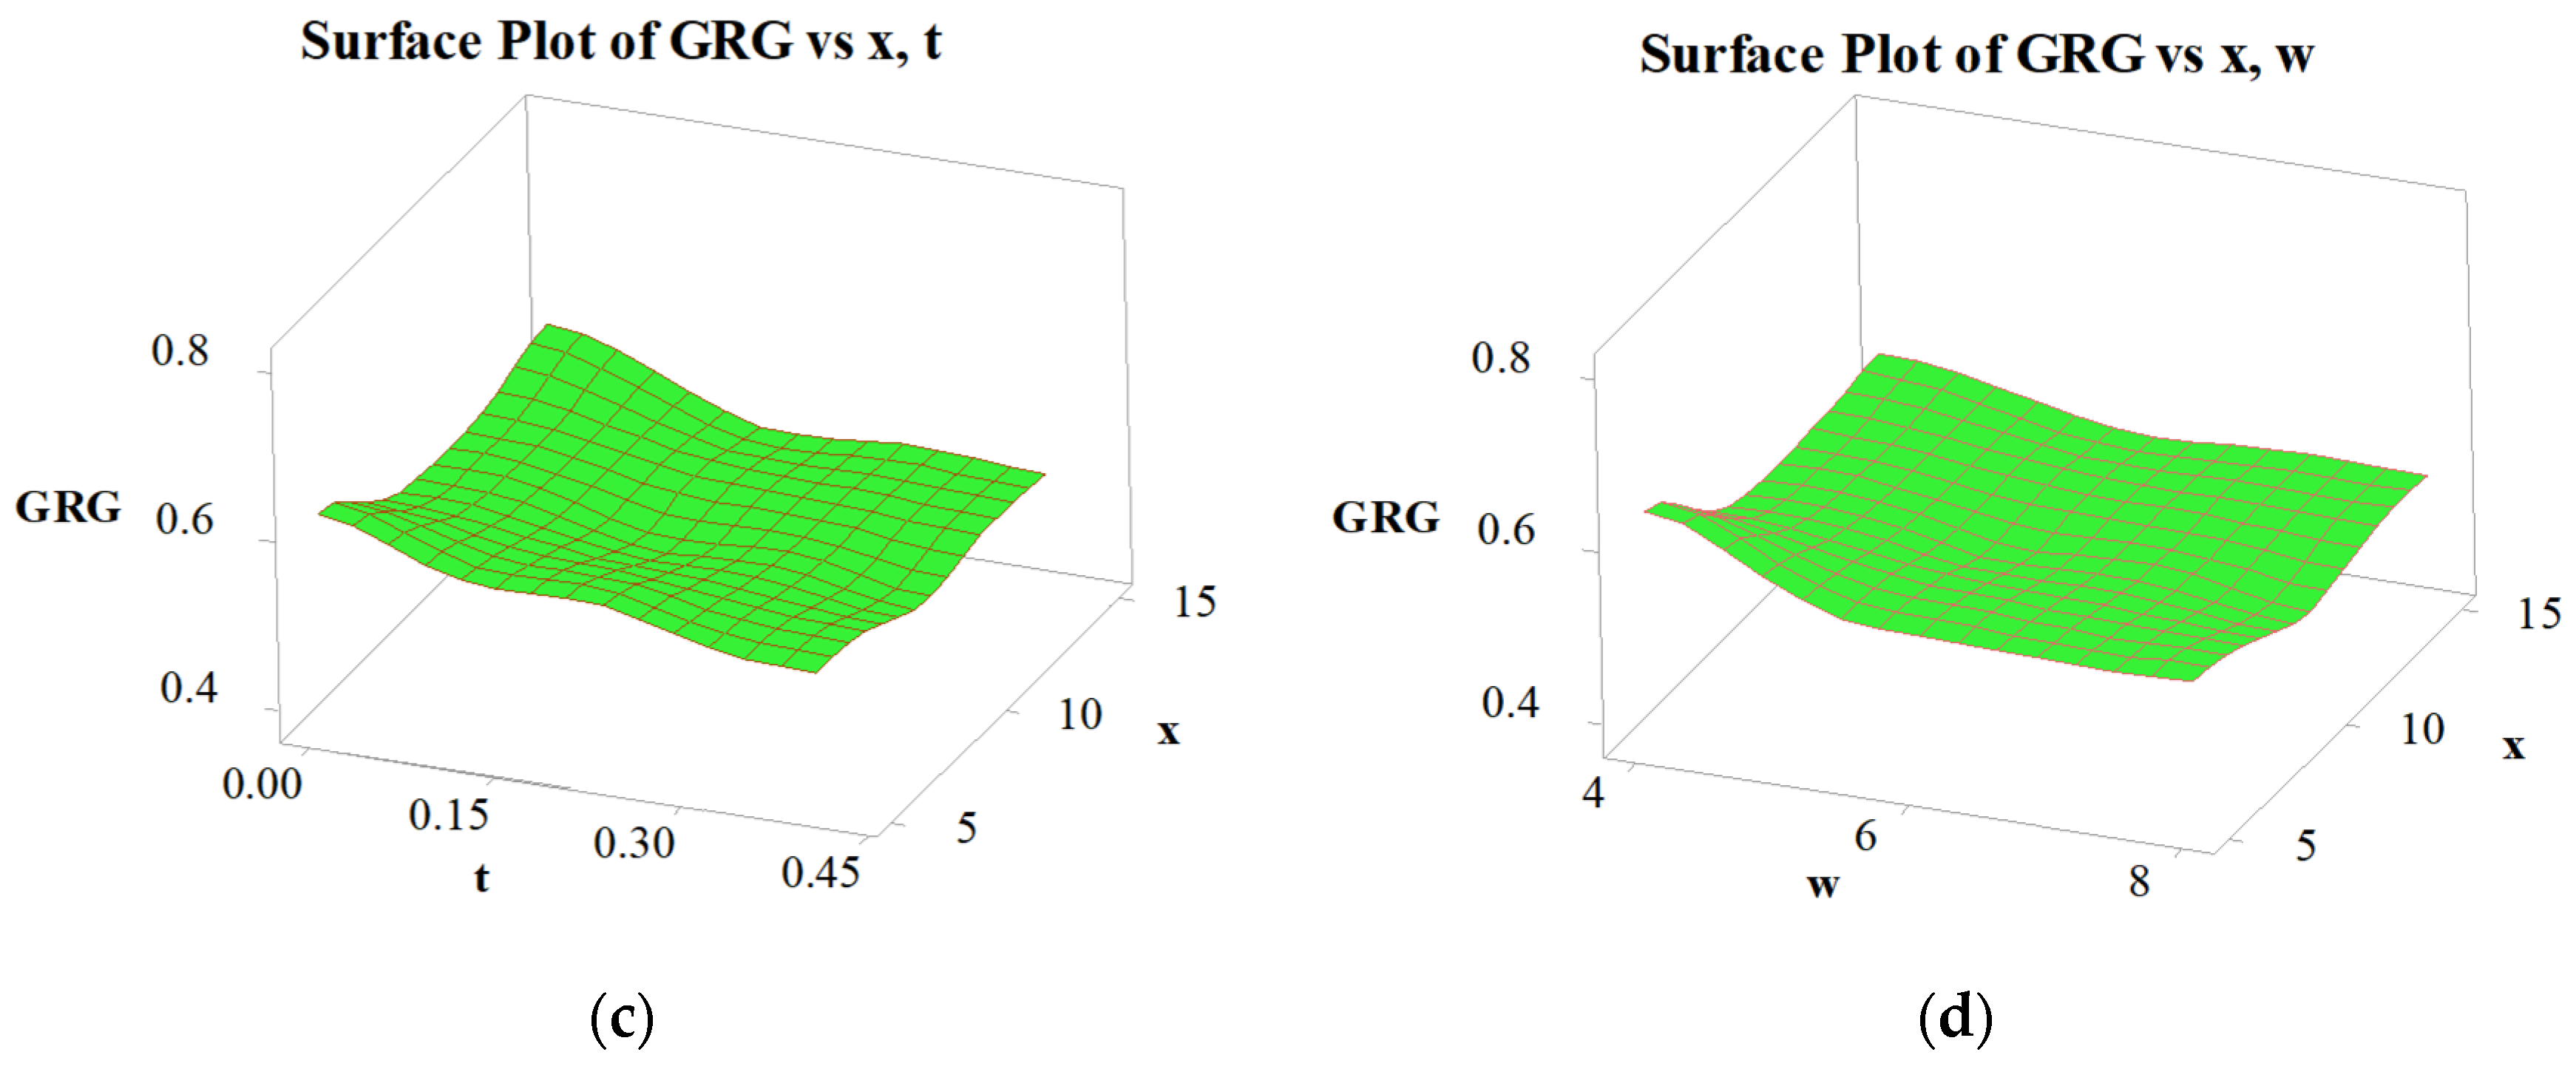
In Figure 6, the surface plot for GRG identifies that the design variables have significantly changed the GRG values. The analytical outcomes are in good agreement with the results of the S/N analysis, the FEM results, the ANOVA results, and the predicted results of the regression analysis.
4.5. Artificial Neural Network
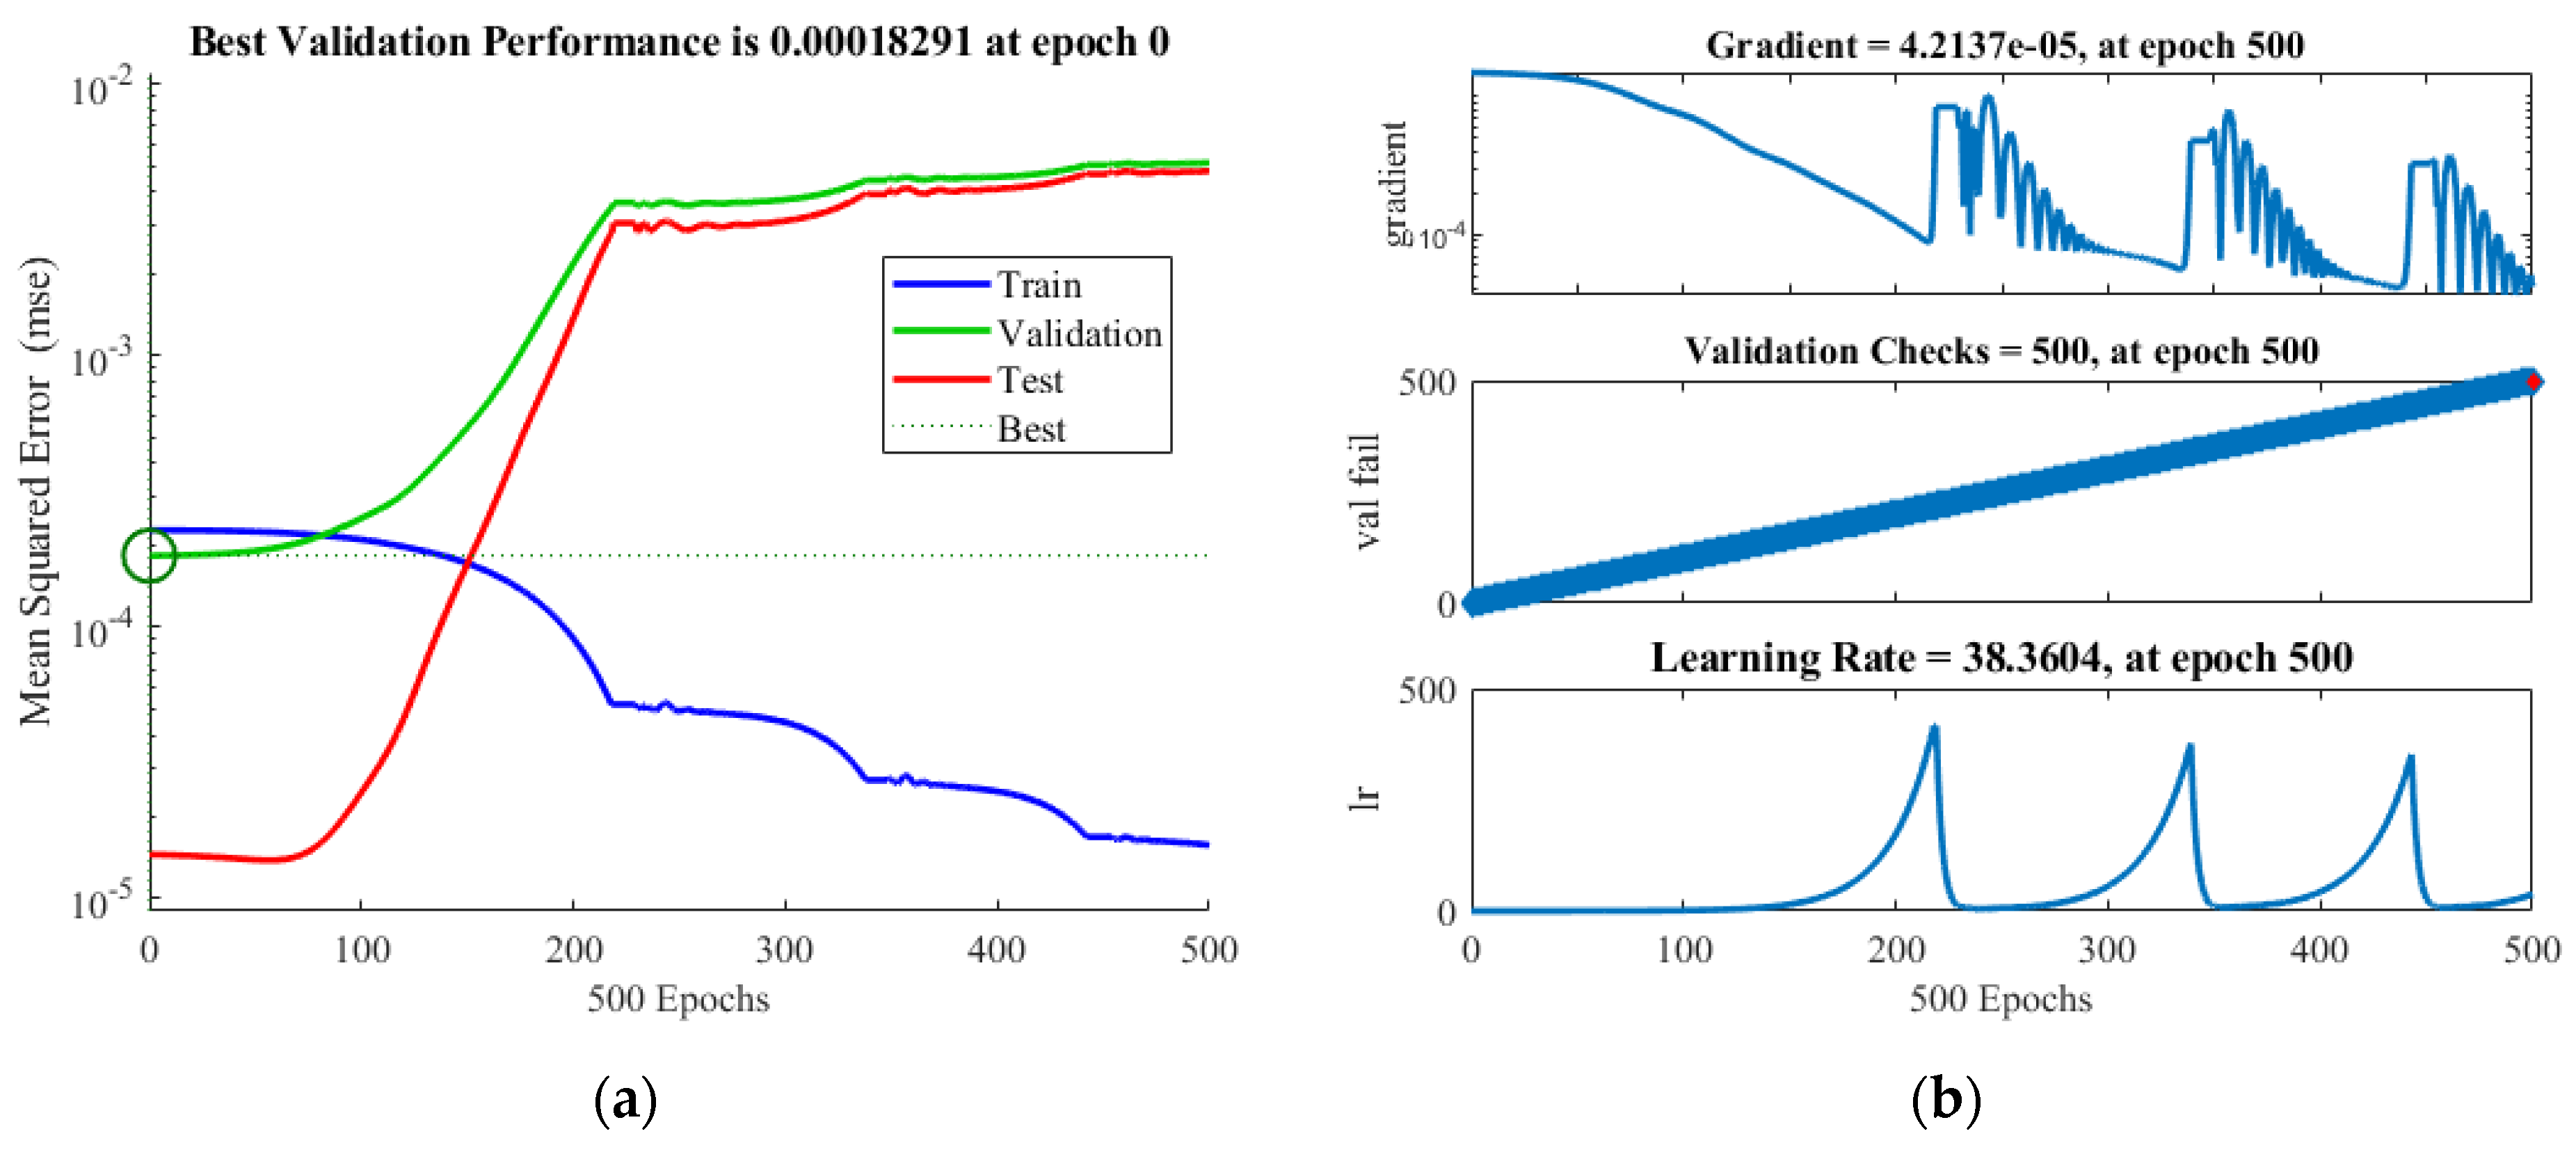
The simulation results were utilized for comparison with those of the ANN model values. The performance plots are shown in Figure 7 for GRG. The best validation performance was 0.00018291 at epoch 0.
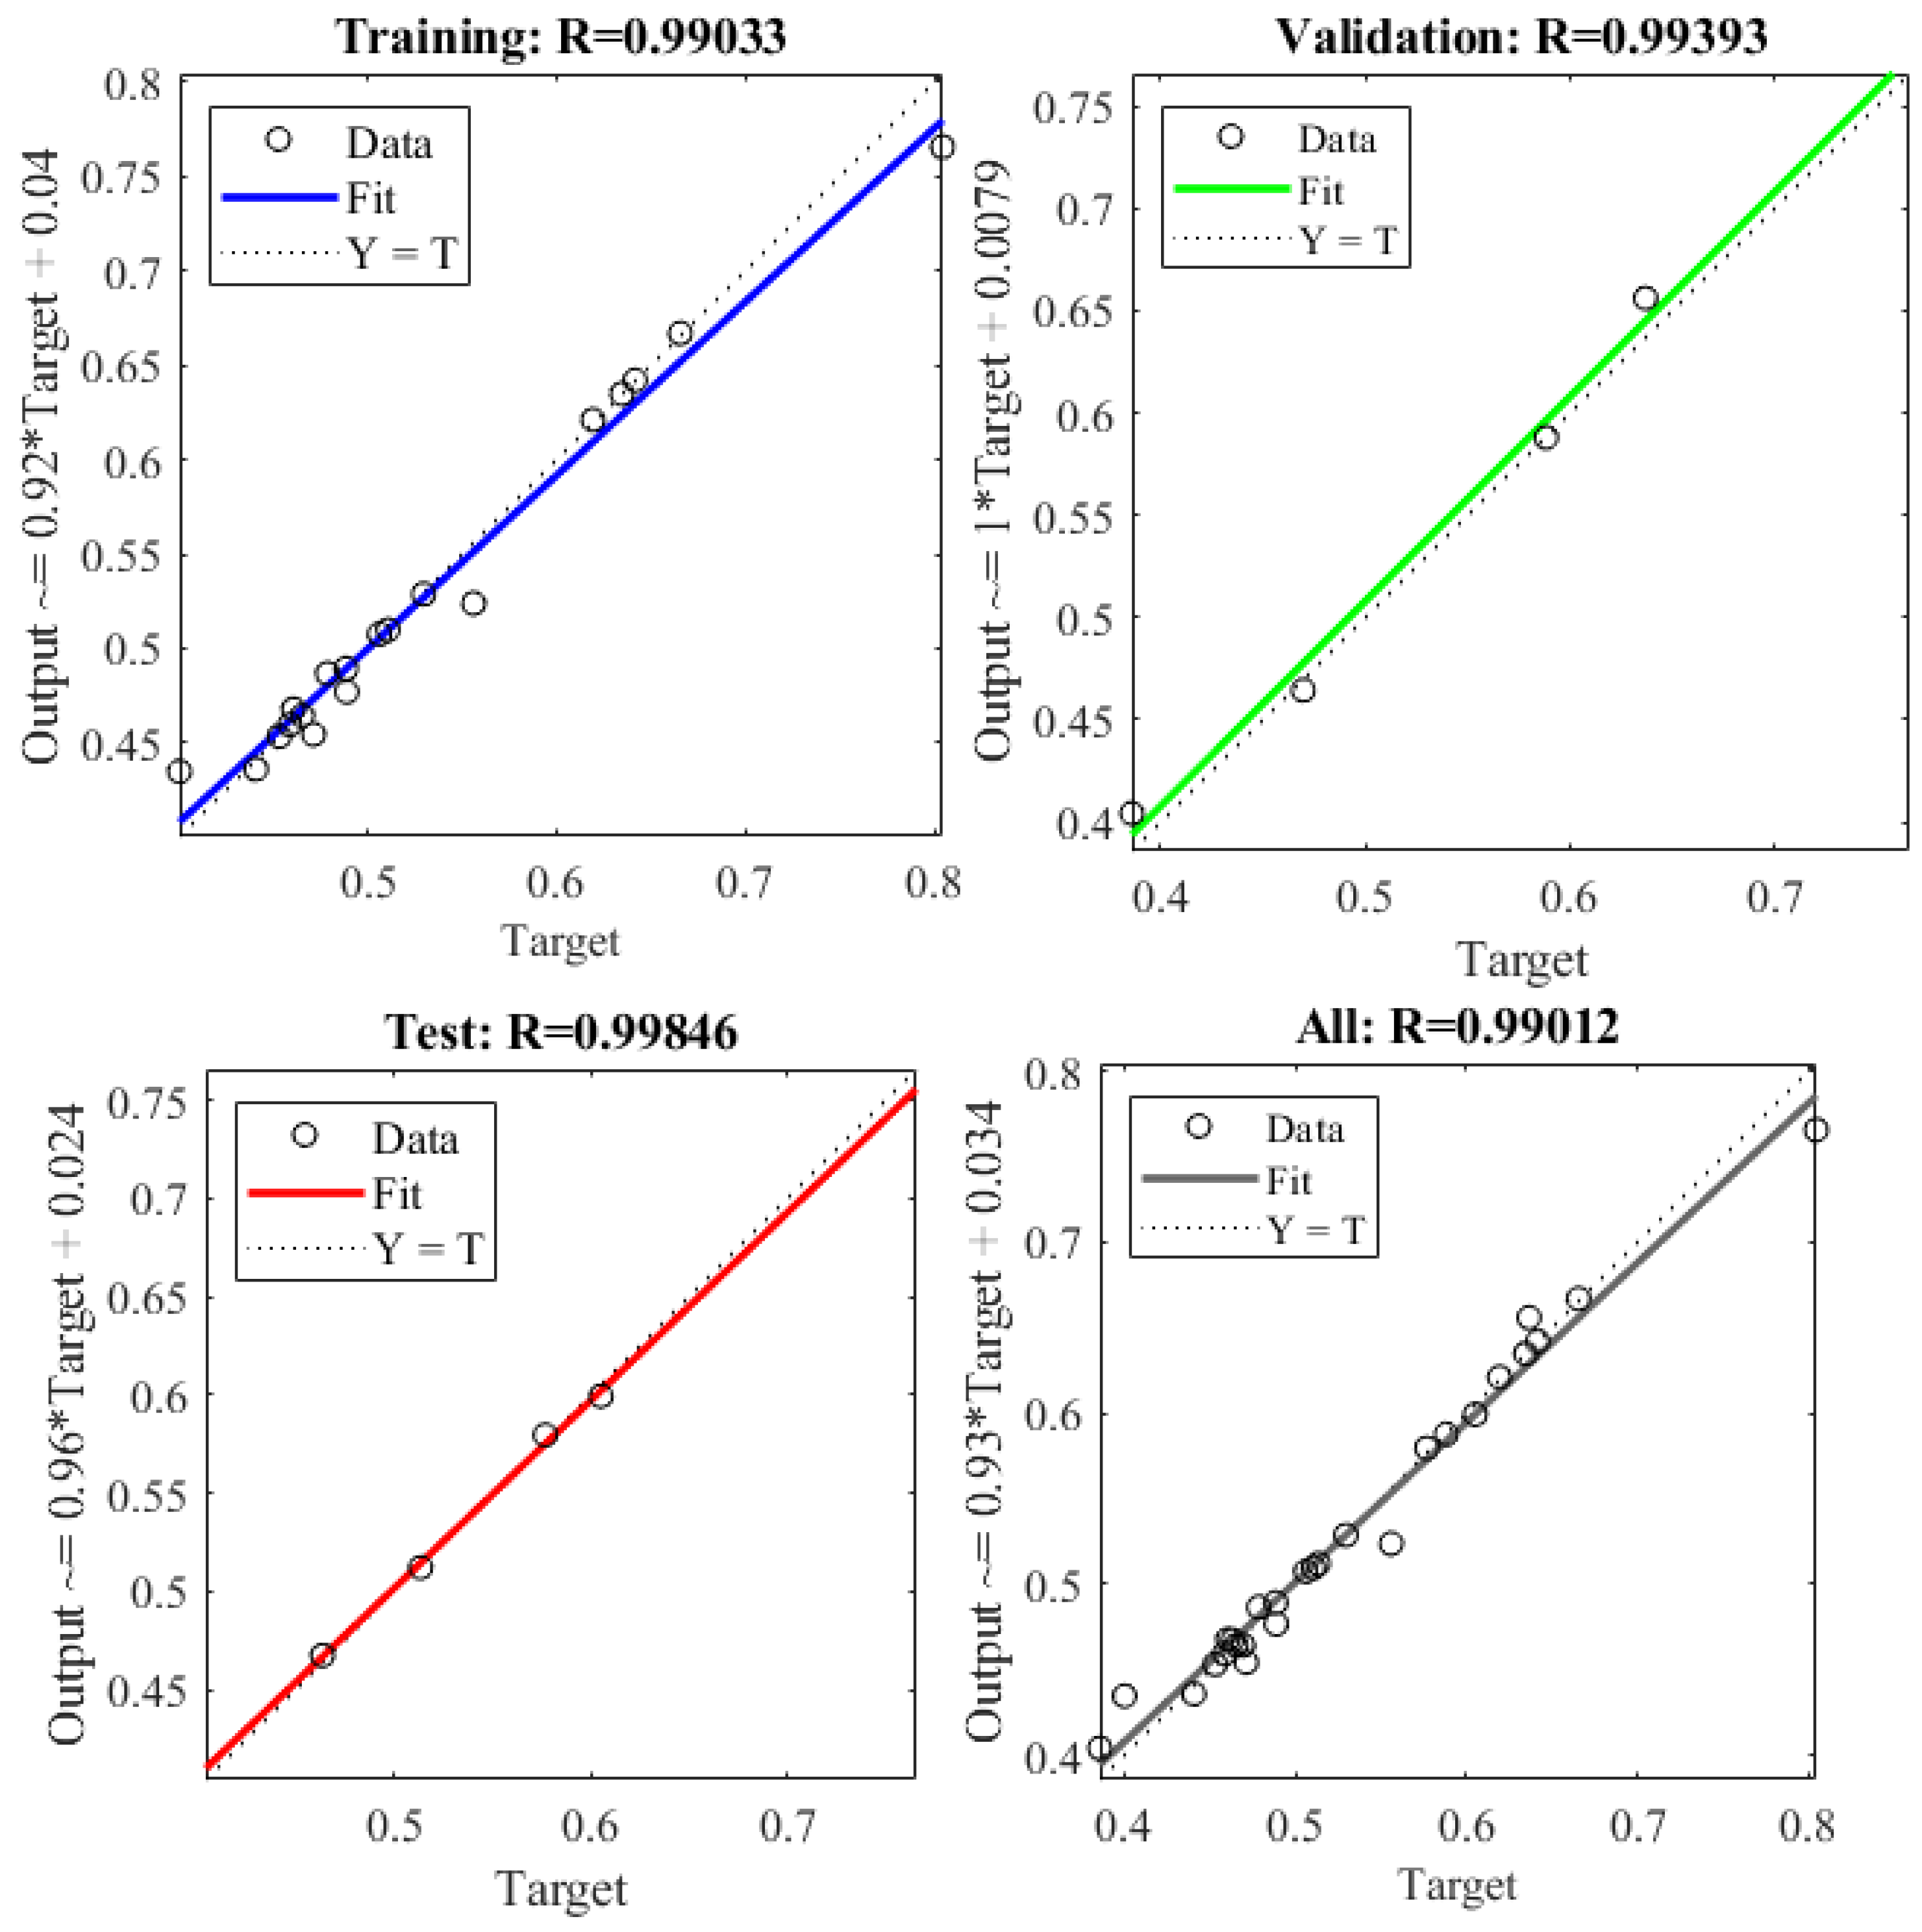
The results of statistical analysis of GRG are presented in Table 8, and the results showed that RMSE, MSE, MAPE, and R-square (see Figure 8) were 0.01718171, 0.000295199, 2.109164529, and 0.998937275, respectively. The values are very low. This problem proves that the predicted values of GRG of the ANN method are in good agreement with the values of GRG achieved from the GRA based on the FEM.
The predicted value of GRG by the Taguchi method was obtained as follows:
It can be seen that the values x1, y1, z1, t1, and w1, as listed in Table 6, were 0.5759, 0.6157, 0.5371, 0.5826, and 0.5589, respectively. The GRG mean value (Gm) was 0.5353.
Table 9 presents a comparison of the results among the predicted values and optimal values of the Taguchi method, ANN, and RE. These results prove that the predicted and optimal values of the three methods are in good agreement, with errors of less than 4%.
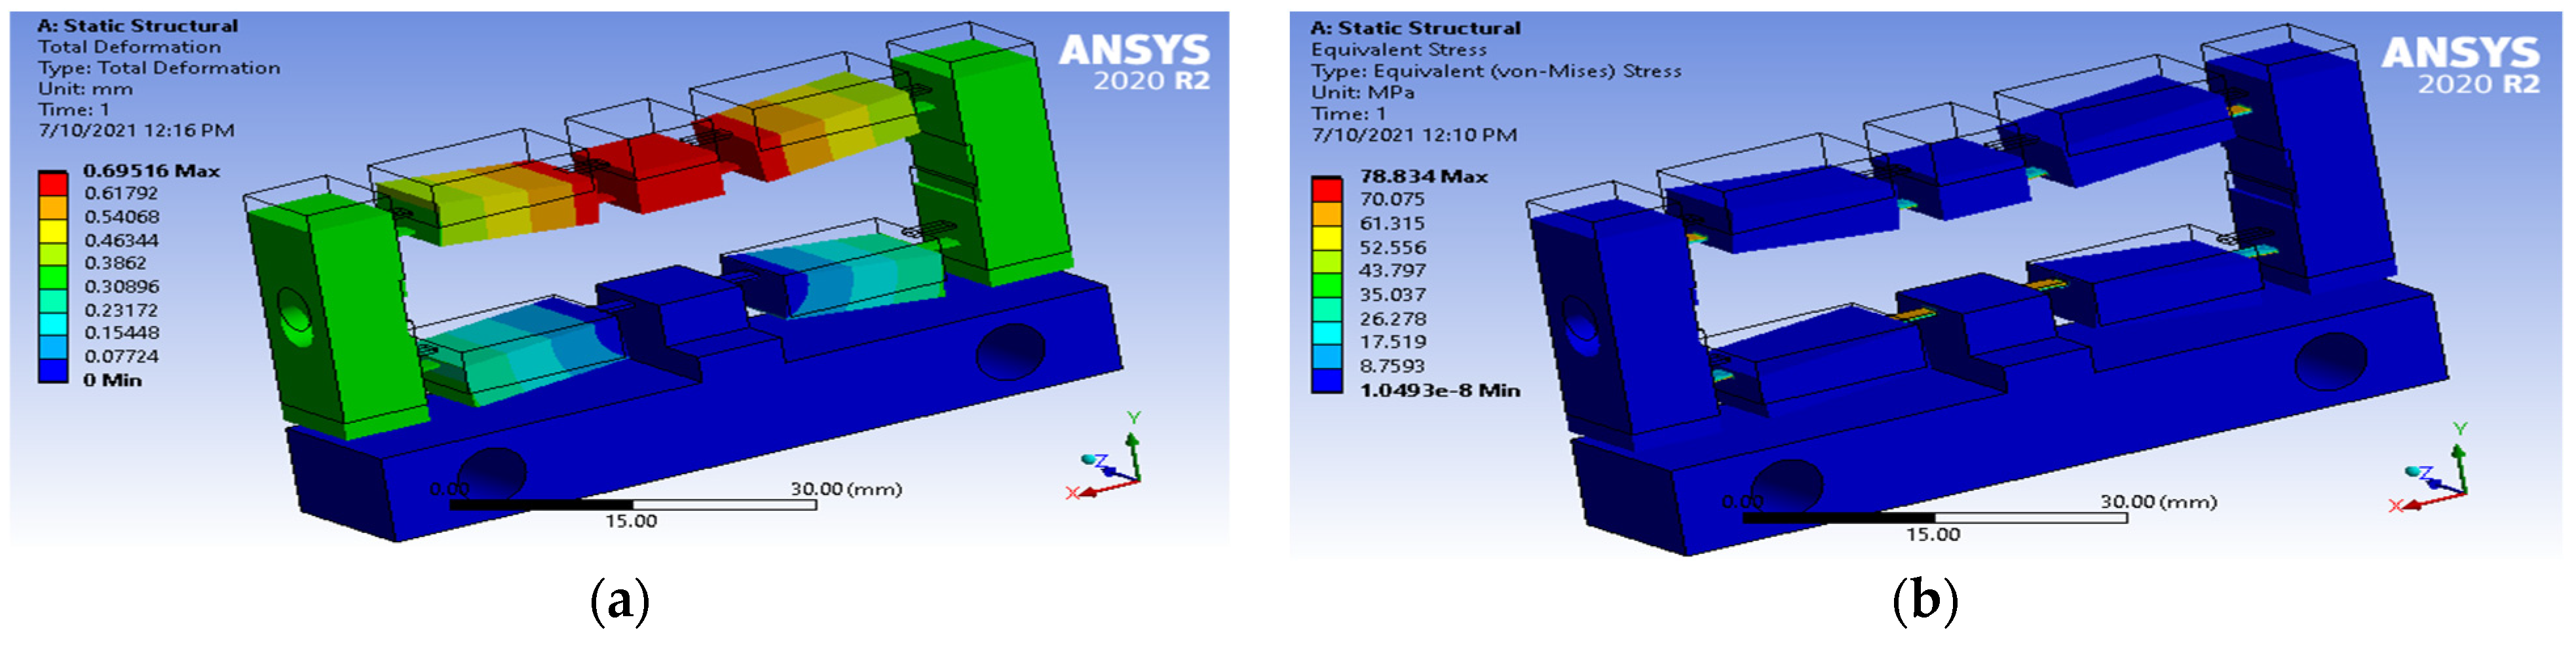
The optimal values of displacement and equivalent stress were obtained as 0.69516 mm and 78.834 MPa respectively, as depicted in Figure 9.
4.6. Verified Experiment
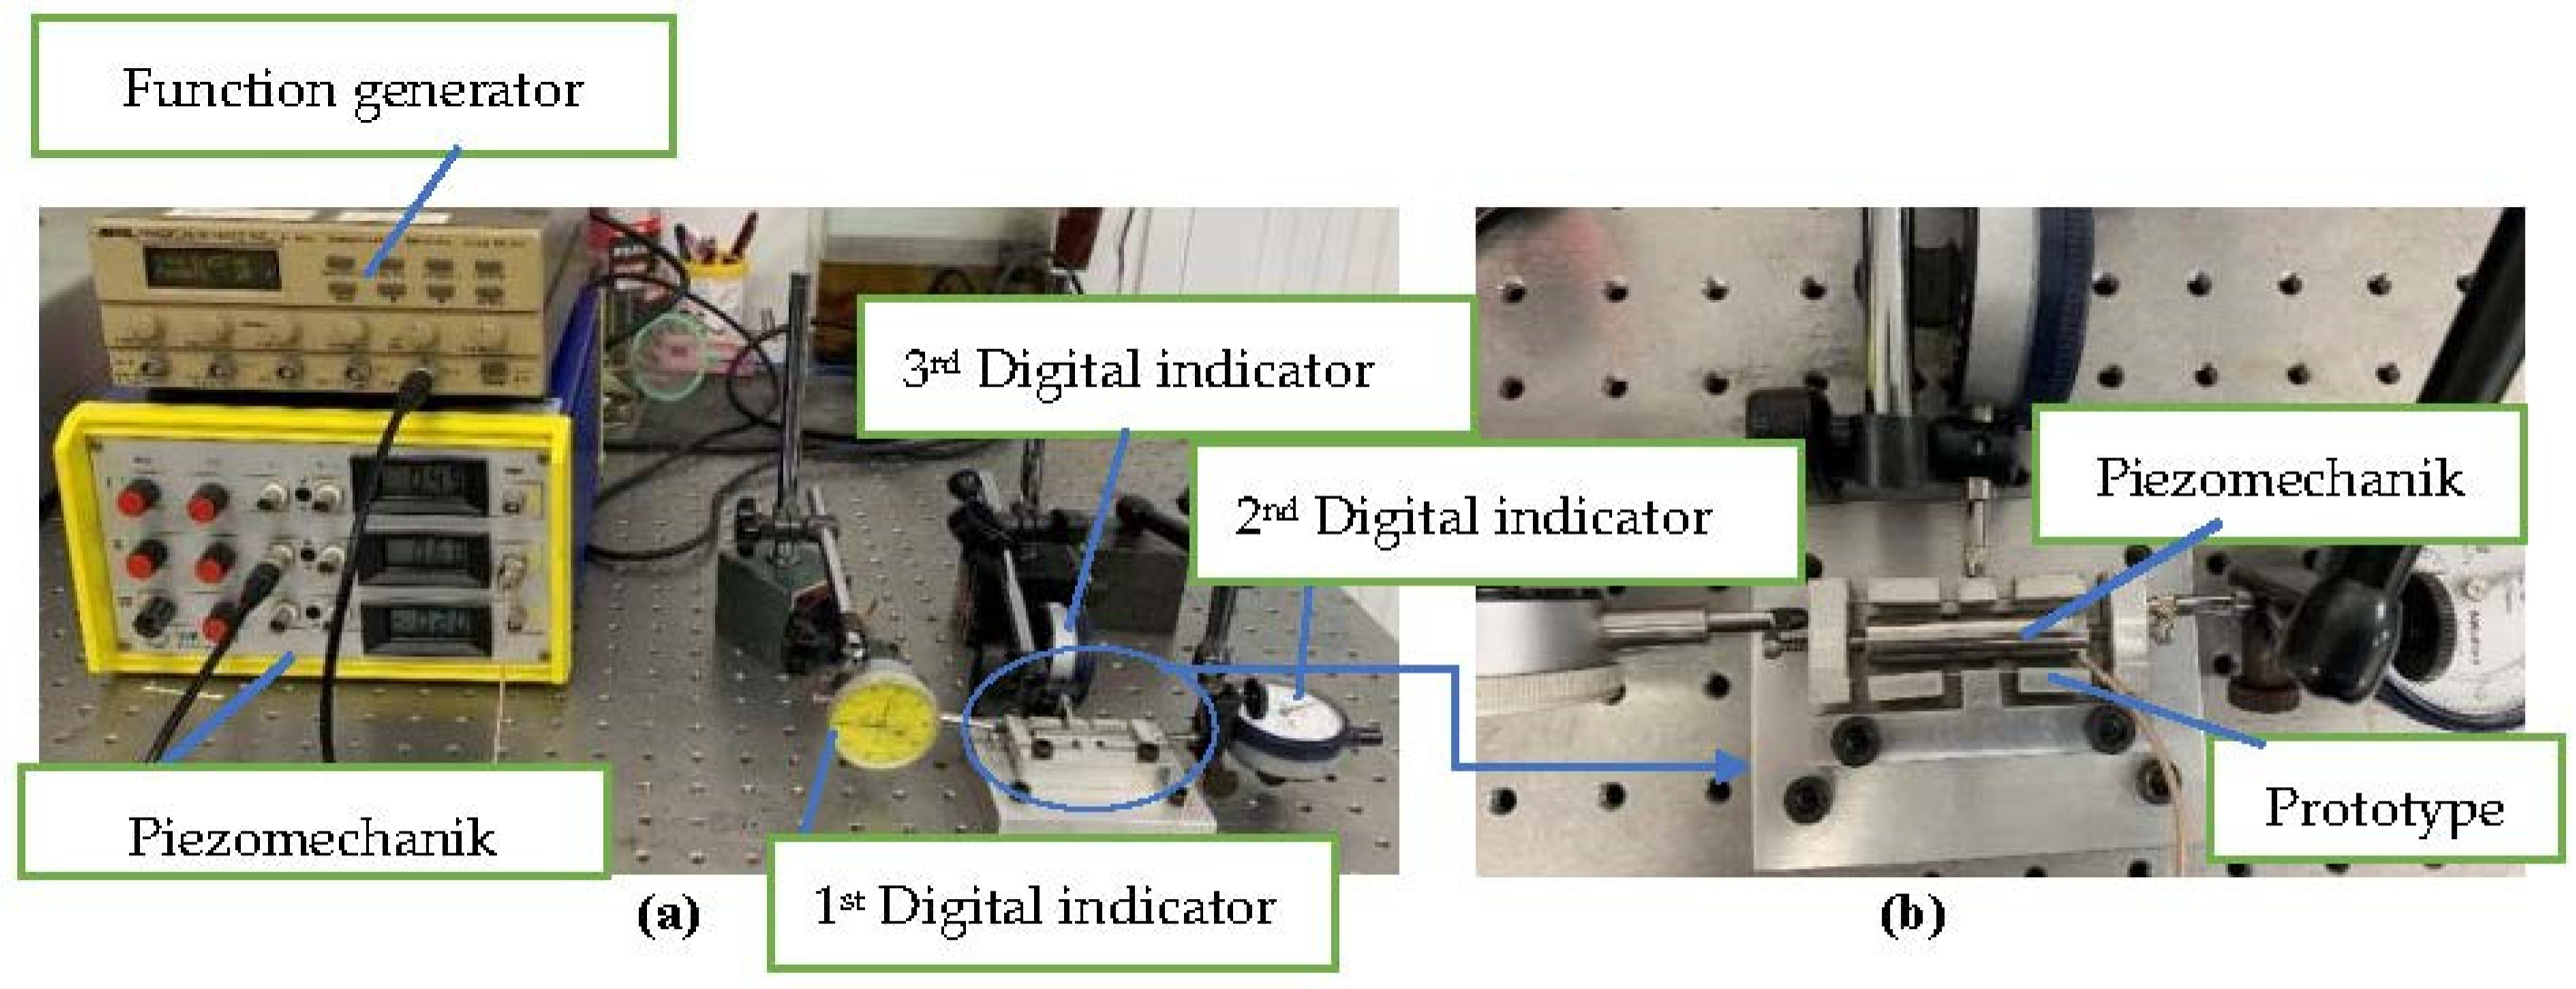
The optimal parameters x1y1z1t1w1 were utilized to manufacture a prototype bridge-type compliant mechanism. The mechanism was fabricated by the use of an electrical wire machine. The experiment was set up as shown in Figure 10a, and a larger view of the mechanism is shown in Figure 10b. The displacement of 0.01 mm was input by piezomechanik, and was measured by the first and then the second digital indicator. The function generator created a frequency function which was transmitted to the piezomechanik GmbH, and then the piezomechanik. The output displacement was measured using the third digital indicator.
The experimental results measured an output displacement of 0.6536 mm, and a displacement amplification ratio of 65.36. The optimal result and the experiment result were in good agreement, with a deviation of 5.97%, as depicted in Table 10. These values are better than those obtained in previous studies [3,7,8,9,10].
5. Conclusions
In this study, we have analyzed the results of design dimensions of the flexure joint and linked size on the displacement and stress of the bridge-type compliant mechanism, primarily based on the FEA in ANSYS. The FEA effects have proven that the design variables strongly impacted displacement and pressure. The design problems changed with the aid of using S/N evaluation, ANOVA, RE, and surface plot. All the results seem to be in great agreement. The expected values of GRG of the ANN approach have additionally confirmed the problem. The evidence has shown that the errors of the expected values of GRG with the ANN approach compared with those of the GRA approach were much less than 4%. It was found that the optimum values for displacement and pressure were 0.6951 mm and 78.834 MPa, respectively. The optimal values after investigated in this study were additionally confirmed by the experiments. All the effects were in good agreement, with an error of much less than 6%. The optimal magnification ratio was acquired as 65.36 times with the design variables (x = 5 mm, y = 0.4 mm, z = 0.7 degrees, t = 0 mm, and w = 4 mm, respectively).
Author Contributions
Conceptualization, V.T.T.N., C.-N.W., F.-C.Y. and N.T.H.; Methodology, Q.M.N., N.T.H. and T.T.H.; Resources, T.T.H.; Software, N.T.H.; Visualization and Validation, Q.M.N.; Writing—original draft, T.T.H.; Writing—review and editing, V.T.T.N., C.-N.W. and F.-C.Y.; Supervision, C.-N.W. and F.-C.Y. All authors have read and agreed to the published version of the manuscript.
Funding
This research received no external funding.
Acknowledgments
The authors appreciate the support from the National Kaohsiung University of Science and Technology and the Ministry of Sciences and Technology in Taiwan.
Conflicts of Interest
The authors declare no conflict of interest.
References
- Yong, Y.K.; Lu, T.-F. Kinetostatic modeling of 3-RRR compliant micro-motion stages with flexure hinges. Mech. Mach. Theory 2009, 44, 1156–1175. [Google Scholar] [CrossRef]
- Tian, Y.; Shirinzadeh, B.; Zhang, D. Design and dynamics of a 3-DOF flexure-based parallel mechanism for micro/nanomanipulation. Microelectron. Eng. 2010, 87, 230–241. [Google Scholar] [CrossRef]
- Qi, K.-Q.; Xiang, Y.; Fang, C.; Zhang, Y.; Yu, C.-S. Analysis of the displacement amplification ratio of bridge-type mechanism. Mech. Mach. Theory 2015, 87, 45–56. [Google Scholar] [CrossRef]
- Qiu, L.; Yin, S.; Xie, Z. Failure analysis and performance comparison of Triple-LET and LET flexure hinges. Eng. Fail. Anal. 2016, 66, 35–43. [Google Scholar] [CrossRef]
- Tian, Y.; Shirinzadeh, B.; Zhang, D. Closed-Form compliance equations of filleted V-shaped flexure hinges for compliant mechanism design. Precis. Eng. 2009, 34, 408–418. [Google Scholar] [CrossRef]
- Yang, M.; Du, Z.; Dong, W. Modeling and analysis of planar symmetric superelastic flexure hinges. Precis. Eng. 2016, 46, 177–183. [Google Scholar] [CrossRef]
- Xu, Q.; Li, Y. Analytical modeling, optimization and testing of a compound bridge-type compliant displacement amplifier. Mech. Mach. Theory 2011, 46, 183–200. [Google Scholar] [CrossRef]
- Liu, P.; Yan, P. A new model analysis approach for bridge-type amplifiers supporting nano-stage design. Mech. Mach. Theory 2016, 99, 176–188. [Google Scholar] [CrossRef]
- Ling, M.; Cao, J.; Zeng, M.; Lin, J.; Inman, D.J. Enhanced mathematical modeling of the displacement amplification ratio for piezoelectric compliant mechanisms. Smart Mater. Struct. 2016, 25, 075022. [Google Scholar] [CrossRef]
- Choi, K.-B.; Lee, J.J.; Kim, G.H.; Lim, H.J.; Kwon, S.G. Amplification ratio analysis of a bridge-type mechanical amplification mechanism based on a fully compliant model. Mech. Mach. Theory 2018, 121, 355–372. [Google Scholar] [CrossRef]
- Ma, H.-W.; Yao, S.-M.; Wang, L.-Q.; Zhong, Z. Analysis of the displacement amplification ratio of bridge-type flexure hinge. Sens. Actuators A Phys. 2006, 132, 730–736. [Google Scholar] [CrossRef]
- Ling, M.; Cao, J.; Jiang, Z.; Lin, J. Modular kinematics and statics modeling for precision positioning stage. Mech. Mach. Theory 2017, 107, 274–282. [Google Scholar] [CrossRef]
- Ling, M.; Cao, J.; Jiang, Z.; Lin, J. A semi-analytical modeling method for the static and dynamic analysis of complex compliant mechanism. Precis. Eng. 2018, 52, 64–72. [Google Scholar] [CrossRef]
- Sabri, M.F.M.; Ono, T.; Esashi, M. Modeling and experimental validation of the performance of a silicon XY-micro stage driven by PZT actuators. J. Micromech. Microeng. 2009, 19, 095004. [Google Scholar] [CrossRef]
- Šalinić, S.; Nikolić, A. A new pseudo-rigid-body model approach for modeling the quasi-static response of planar flexure-hinge mechanisms. Mech. Mach. Theory 2018, 124, 150–161. [Google Scholar] [CrossRef]
- Lai, L.-J.; Zhu, Z.-N. Design, modeling and testing of a novel flexure-based displacement amplification mechanism. Sens. Actuators A Phys. 2017, 266, 122–129. [Google Scholar] [CrossRef]
- Wang, R.; Zhang, X. A planar 3-DOF nanopositioning platform with large magnification. Precis. Eng. 2016, 46, 221–231. [Google Scholar] [CrossRef] [Green Version]
- Chen, X.; Deng, Z.; Hu, S.; Gao, J.; Gao, X. Design of a Compliant Mechanism Based Four-Stage Amplification Piezoelectric-Driven Asymmetric Microgripper. Micromachines 2019, 11, 25. [Google Scholar] [CrossRef] [PubMed] [Green Version]
- Chen, Z.; Nguyen, V.T.; Tran, N.T. Optimum design of the volute tongue shape of a low specific speed centrifugal pump. J. Electr. Electron. Syst. 2017, 6, 1–5. [Google Scholar] [CrossRef]
- Wang, G.; Zhu, D.; Liu, N.; Zhao, W. Multi-Objective Topology Optimization of a Compliant Parallel Planar Mechanism under Combined Load Cases and Constraints. Micromachines 2017, 8, 279. [Google Scholar] [CrossRef] [PubMed]
- Moritoki, Y.; Furukawa, T.; Sun, J.; Yokoyama, M.; Shimono, T.; Yamada, T.; Nishiwaki, S.; Kageyama, T.; Fukuda, J.; Mukai, M.; et al. 3D-Printed Micro-Tweezers with a Compliant Mechanism Designed Using Topology Optimization. Micromachines 2021, 12, 579. [Google Scholar] [CrossRef] [PubMed]
- Wang, C.N.; Truong, K.P.; Huynh, N.T.; Nguyen, H. Optimization on effects of design parameter on displacement amplification ratio of 2 DOF working platform employing Bridge-type compliant mechanism flexure hinge using Taguchi method. J. Phys. Conf. Ser. 2019, 1303, 012053. [Google Scholar] [CrossRef]
- Wang, C.N.; Truong, K.P.; Huynh, N.T.; Hoang, L.Q.N. Optimization effects of design parameter on the first frequency modal of a Bridge-type compliant mechanism flexure hinge by using the Taguchi method. J. Phys. Conf. Ser. 2019, 1303, 012063. [Google Scholar] [CrossRef]
- Sabotin, I.; Tristo, G.; Valentinčič, J. Technical Model of Micro Electrical Discharge Machining (EDM) Milling Suitable for Bottom Grooved Micromixer Design Optimization. Micromachines 2020, 11, 594. [Google Scholar] [CrossRef]
- Huynh, N.T.; Huang, S.C.; Dao, T.P. Optimal displacement amplification ratio of bridge-type compliant mechanism flexure hinge using the Taguchi method with grey relational analysis. Microsyst. Technol. 2021, 27, 1251–1265. [Google Scholar] [CrossRef]
- Jung, J.H.; Kwon, W.T. Optimization of EDM process for multiple performance characteristics using Taguchi method and Grey relational analysis. J. Mech. Sci. Technol. 2010, 24, 1083–1090. [Google Scholar] [CrossRef]
- Huynh, N.T.; Nguyen, Q.M. Application of Grey Relational Approach and Artificial Neural Network to Optimise Design Parameters of Bridge-Type Compliant Mechanism Flexure Hinge. Int. J. Automot. Mech. Eng. 2021, 18, 8505–8522. [Google Scholar]
- Nalbant, M.; Gökkaya, H.; Sur, G. Application of Taguchi method in the optimization of cutting parameters for surface roughness in turning. Mater. Des. 2007, 28, 1379–1385. [Google Scholar] [CrossRef]
- Asiltürk, S.; Neşeli, M.; İnce, A. Optimisation of parameters affecting surface roughness of Co28Cr6Mo medical material during CNC lathe machining by using the Taguchi and RSM methods. Measurement 2016, 78, 120–128. [Google Scholar] [CrossRef]
- Aber, S.; Salari, D.; Parsa, M.R. Employing the Taguchi method to obtain the optimum conditions of coagulation–flocculation process in tannery wastewater treatment. Chem. Eng. J. 2010, 162, 127–134. [Google Scholar] [CrossRef]
- Chen, W.-C.; Hsu, Y.-Y.; Hsieh, L.-F.; Tai, P.-H. A systematic optimization approach for assembly sequence planning using Taguchi method, DOE, and BPNN. Expert Syst. Appl. 2010, 37, 716–726. [Google Scholar] [CrossRef]
- Liu, Y.-T.; Chang, W.-C.; Yamagata, Y. A study on optimal compensation cutting for an aspheric surface using the Taguchi method. CIRP J. Manuf. Sci. Technol. 2010, 3, 40–48. [Google Scholar] [CrossRef]
- Sarıkaya, M.; Güllü, A. Multi-Response optimization of minimum quantity lubrication parameters using Taguchi-based grey relational analysis in turning of difficult-to-cut alloy Haynes 25. J. Clean. Prod. 2015, 91, 347–357. [Google Scholar] [CrossRef]
- Deepanraj, B.; Sivasubramanian, V.; Jayaraj, S. Multi-Response optimization of process parameters in biogas production from food waste using Taguchi—Grey relational analysis. Energy Convers. Manag. 2017, 141, 429–438. [Google Scholar] [CrossRef]
- Roy, R.K. A Primer on the Taguchi Method, 2nd ed.; Society of Manufacturing Engineers: Southfield, MI, USA, 2010; p. 329. [Google Scholar]
- Kumar, S.; Batish, A.; Singh, R.; Singh, T.P. A hybrid Taguchi-artificial neural network approach to predict surface roughness during electric discharge machining of titanium alloys. J. Mech. Sci. Technol. 2014, 28, 2831–2844. [Google Scholar] [CrossRef]
- Kant, G.; Sangwan, K.S. Predictive Modelling and Optimization of Machining Parameters to Minimize Surface Roughness using Artificial Neural Network Coupled with Genetic Algorithm. Procedia CIRP 2015, 31, 453–458. [Google Scholar] [CrossRef] [Green Version]
- Sukumar, M.; Ramaiah, P.V.; Nagarjuna, A. Optimization and Prediction of Parameters in Face Milling of Al-6061 Using Taguchi and ANN Approach. Procedia Eng. 2014, 97, 365–371. [Google Scholar] [CrossRef] [Green Version]
- Alharthi, N.H.; Bingol, S.; Abbas, A.T.; Ragab, A.E.; El-Danaf, E.A.; Alharbi, H.F. Optimizing Cutting Conditions and Prediction of Surface Roughness in Face Milling of AZ61 Using Regression Analysis and Artificial Neural Network. Adv. Mater. Sci. Eng. 2017, 2017, 1–8. [Google Scholar] [CrossRef] [Green Version]
- Kilickap, E.; Yardimeden, A.; Çelik, Y.H. Mathematical Modelling and Optimization of Cutting Force, Tool Wear and Surface Roughness by Using Artificial Neural Network and Response Surface Methodology in Milling of Ti-6242S. Appl. Sci. 2017, 7, 1064. [Google Scholar] [CrossRef] [Green Version]
- Mia, M.; Razi, M.H.; Ahmad, I.; Mostafa, R.; Rahman, S.M.S.; Ahmed, D.H.; Dey, P.R.; Dhar, N.R. Effect of time-controlled MQL pulsing on surface roughness in hard turning by statistical analysis and artificial neural network. Int. J. Adv. Manuf. Technol. 2017, 91, 3211–3223. [Google Scholar] [CrossRef]
- Paturi, U.M.R.; Devarasetti, H.; Narala, S.K.R. Application Of Regression And Artificial Neural Network Analysis In Modelling Of Surface Roughness In Hard Turning Of AISI 52100 Steel. Mater. Today Proc. 2018, 5, 4766–4777. [Google Scholar] [CrossRef]
- Arafat, M.; Sjafrizal, T.; Anugraha, R.A. An artificial neural network approach to predict energy consumption and surface roughness of a natural material. SN Appl. Sci. 2020, 2, 1–11. [Google Scholar] [CrossRef]
- Sanjeevi, R.; Nagaraja, R.; Krishnan, B.R. Vision-Based surface roughness accuracy prediction in the CNC milling process (Al6061) using ANN. Mater. Today Proc. 2020, 37, 245–247. [Google Scholar] [CrossRef]
- Singh, M.; Maharana, S.; Yadav, A.; Singh, R.; Maharana, P.; Nguyen, T.V.T.; Yadav, S.; Loganathan, M.K. An Experimental Investigation on the Material Removal Rate and Surface Roughness of a Hybrid Aluminum Metal Matrix Composite (Al6061/SiC/Gr). Metals 2021, 11, 1449. [Google Scholar] [CrossRef]
- Huynh, T.T.; Nguyen, T.V.T.; Nguyen, Q.M.; Nguyen, T.K. Minimizing Warpage for Macro-Size Fused Deposition Modeling Parts. Comput. Mater. Contin. 2021, 68, 2913–2923. [Google Scholar] [CrossRef]
- Huynh, N.-T.; Nguyen, T.V.T.; Tam, N.T.; Nguyen, Q.-M. Optimizing Magnification Ratio for the Flexible Hinge Displacement Amplifier Mechanism Design. In Proceedings of the 2nd Annual International Conference on Material, Machines and Methods for Sustainable Development (MMMS2020), Nha Trang, Vietnam, 12–15 November 2020; Long, B.T., Kim, Y.H., Ishizaki, K., Toan, N.D., Parinov, I.A., Vu, N.P., Eds.; Lecture Notes in Mechanical Engineering. Springer: Cham, Switzerland, 2021. [Google Scholar] [CrossRef]
- Nguyen, V.T.T.; Dang, V.A.; Tran, N.T.; Hoang, N.C.; Vo, D.H.; Nguyen, D.K.; Nguyen, N.L.; Nguyen, Q.L.; Tieu, T.L.; Bui, T.N.; et al. An investigation on design innovation, fabrication and experiment of a soybean peeling machine-scale. Int. J. Eng. Technol. (UAE) 2018, 7, 2704–2709. [Google Scholar] [CrossRef]
- Phan, V.N.; Nguyen, T.V.T. Experimental Investigation and Manufacture of a Multifunction Electric Wheelbarrow. In Proceedings of the 2nd Annual International Conference on Material, Machines and Methods for Sustainable Development (MMMS2020), Nha Trang, Vietnam, 12–15 November 2020; Long, B.T., Kim, Y.H., Ishizaki, K., Toan, N.D., Parinov, I.A., Vu, N.P., Eds.; Lecture Notes in Mechanical Engineering. Springer: Berlin/Heidelberg, Germany, 2021. [Google Scholar] [CrossRef]
- Nguyen, V.T.T.; Tran, T.B.; Nguyen, T.G.; Huynh, H.H.; To, V.H.; Doan, D.M.; Nguyen, T.Q.; Van Thanh, D. An investigation of designing and manufacturing the hard-shell peanut peeling machine with a small scale-size. Int. J. Sci. Technol. Res. 2019, 8, 9. [Google Scholar]
- Zhu, D.; Zhan, W.; Wu, F.; Simeone, A. Topology Optimization of Spatially Compliant Mechanisms with an Isomorphic Matrix of a 3-UPC Type Parallel Prototype Manipulator. Micromachines 2018, 9, 184. [Google Scholar] [CrossRef] [PubMed] [Green Version]
Figure 1.
Developed compliant mechanism model of bridge-type: (a) 2D drawings, and (b) 3D drawing.


Figure 2.
(a) Modeling meshes, and (b) locations of input displacements and fixed supports.

Figure 3.
The results of the S/N analysis.

Figure 4.
The result of mean analysis.

Figure 5.
Residual plot for GRG.

Figure 6.
Surface plot for GRG. (a) Surface plot of GRG with x, y; (b) Surface plot of GRG with x, z; (c) Surface plot of GRG with x, t; (d) Surface plot of GRG with x, w.
Figure 6.
Surface plot for GRG. (a) Surface plot of GRG with x, y; (b) Surface plot of GRG with x, z; (c) Surface plot of GRG with x, t; (d) Surface plot of GRG with x, w.


Figure 7.
Relationship between simulation values and ANN model values for displacement. (a) the best validation performance at epoch 0; (b) Gradient at epoch 500.
Figure 7.
Relationship between simulation values and ANN model values for displacement. (a) the best validation performance at epoch 0; (b) Gradient at epoch 500.

Figure 8.
Statistical analysis of GRG.

Figure 9.
The optimal results. (a) The optimal result of displacement; (b) The optimal result of stress.
Figure 9.
The optimal results. (a) The optimal result of displacement; (b) The optimal result of stress.

Figure 10.
(a) The experimental set-up. (b) Larger view of the bridge-type compliant mechanism.


Table 1.
Selected factors with their levels.
| Parameters | Unit | Their Levels | |||
|---|---|---|---|---|---|
| First | Second | Third | |||
| Inlet frame length | x | mm | 5 | 10 | 15 |
| Flexure hinge thickness | y | mm | 0.4 | 0.6 | 0.8 |
| Two-flexure hinge distance | z | degrees | 0.7 | 1.0 | 1.3 |
| Fillet radius | t | mm | 0.0 | 0.2 | 0.4 |
| Flexure hinge width | w | mm | 4 | 6 | 8 |
Table 2.
Output response (including orthogonal arrays and numerical results with S/N).
| Test No. (Trial) | x | y | z | t | w | Deformation (mm) | Stress (MPa) |
|---|---|---|---|---|---|---|---|
| 1 | 5 | 0.4 | 0.7 | 0 | 4 | 0.6951 | 78.834 |
| 2 | 5 | 0.4 | 1 | 0.2 | 6 | 0.6378 | 92.646 |
| 3 | 5 | 0.4 | 1.3 | 0.4 | 8 | 0.5693 | 105.044 |
| 4 | 5 | 0.6 | 0.7 | 0.2 | 8 | 0.5384 | 92.330 |
| 5 | 5 | 0.6 | 1 | 0.4 | 4 | 0.5546 | 86.350 |
| 6 | 5 | 0.6 | 1.3 | 0 | 6 | 0.4725 | 90.349 |
| 7 | 5 | 0.8 | 0.7 | 0.4 | 6 | 0.3875 | 69.767 |
| 8 | 5 | 0.8 | 1 | 0 | 8 | 0.3541 | 64.184 |
| 9 | 5 | 0.8 | 1.3 | 0.2 | 4 | 0.3668 | 65.720 |
| 10 | 10 | 0.4 | 0.7 | 0 | 4 | 0.7153 | 116.280 |
| 11 | 10 | 0.4 | 1 | 0.2 | 6 | 0.6436 | 99.901 |
| 12 | 10 | 0.4 | 1.3 | 0.4 | 8 | 0.5855 | 96.782 |
| 13 | 10 | 0.6 | 0.7 | 0.2 | 8 | 0.4823 | 96.080 |
| 14 | 10 | 0.6 | 1 | 0.4 | 4 | 0.4977 | 91.180 |
| 15 | 10 | 0.6 | 1.3 | 0 | 6 | 0.4702 | 84.826 |
| 16 | 10 | 0.8 | 0.7 | 0.4 | 6 | 0.3935 | 82.673 |
| 17 | 10 | 0.8 | 1 | 0 | 8 | 0.3654 | 75.989 |
| 18 | 10 | 0.8 | 1.3 | 0.2 | 4 | 0.3755 | 76.678 |
| 19 | 15 | 0.4 | 0.7 | 0 | 4 | 0.7275 | 80.981 |
| 20 | 15 | 0.4 | 1 | 0.2 | 6 | 0.6502 | 84.490 |
| 21 | 15 | 0.4 | 1.3 | 0.4 | 8 | 0.6028 | 78.877 |
| 22 | 15 | 0.6 | 0.7 | 0.2 | 8 | 0.4923 | 92.956 |
| 23 | 15 | 0.6 | 1 | 0.4 | 4 | 0.5112 | 94.270 |
| 24 | 15 | 0.6 | 1.3 | 0 | 6 | 0.4676 | 86.395 |
| 25 | 15 | 0.8 | 0.7 | 0.4 | 6 | 0.4018 | 97.780 |
| 26 | 15 | 0.8 | 1 | 0 | 8 | 0.3714 | 84.367 |
| 27 | 15 | 0.8 | 1.3 | 0.2 | 4 | 0.3811 | 99.880 |
Table 3.
For displacement and stress, the larger displacement is better and the smaller stress is better, and Δoi(1) and Δoi(2) show value deviation.
Table 3.
For displacement and stress, the larger displacement is better and the smaller stress is better, and Δoi(1) and Δoi(2) show value deviation.
| Trial Test No. | (1) | (2) | Δoi(1) | Δoi(2) |
|---|---|---|---|---|
| 1 | 0.9055 | 0.1422 | 0.0945 | 0.8578 |
| 2 | 0.7598 | 0.4537 | 0.2402 | 0.5463 |
| 3 | 0.5763 | 0.2157 | 0.4237 | 0.7843 |
| 4 | 0.4936 | 0.4597 | 0.5064 | 0.5403 |
| 5 | 0.5370 | 0.5745 | 0.463 | 0.4255 |
| 6 | 0.3171 | 0.4978 | 0.6829 | 0.5022 |
| 7 | 0.0894 | 0.8928 | 0.9106 | 0.1072 |
| 8 | 0.0000 | 1.0000 | 1.0000 | 0.0000 |
| 9 | 0.0340 | 0.9705 | 0.966 | 0.0295 |
| 10 | 0.9673 | 0.0000 | 0.0327 | 1.0000 |
| 11 | 0.7753 | 0.3144 | 0.2247 | 0.6856 |
| 12 | 0.6197 | 0.3743 | 0.3803 | 0.6257 |
| 13 | 0.3433 | 0.3877 | 0.6567 | 0.6123 |
| 14 | 0.3846 | 0.4818 | 0.6154 | 0.5182 |
| 15 | 0.3109 | 0.6038 | 0.6891 | 0.3962 |
| 16 | 0.1055 | 0.6451 | 0.8945 | 0.3549 |
| 17 | 0.0303 | 0.7734 | 0.9697 | 0.2266 |
| 18 | 0.0573 | 0.7602 | 0.9427 | 0.2398 |
| 19 | 1.0000 | 0.6776 | 0.0000 | 0.3224 |
| 20 | 0.7930 | 0.6102 | 0.2070 | 0.3898 |
| 21 | 0.6660 | 0.7180 | 0.3340 | 0.2820 |
| 22 | 0.3701 | 0.4477 | 0.6299 | 0.5523 |
| 23 | 0.4207 | 0.4225 | 0.5793 | 0.5775 |
| 24 | 0.3040 | 0.5737 | 0.6960 | 0.4263 |
| 25 | 0.1277 | 0.3551 | 0.8723 | 0.6449 |
| 26 | 0.0463 | 0.6126 | 0.9537 | 0.3874 |
| 27 | 0.0723 | 0.3148 | 0.9277 | 0.6852 |
Table 4.
The rank of GRG and the predicted GRG of ANN.
| Trial No. | GRC (γi(1)) | GRC (γi(2)) | GRG (ψi) | Rank | S/N of GRG | Predicted GRG of ANN | Error |
|---|---|---|---|---|---|---|---|
| 1 | 0.841 | 0.3682 | 0.7406 | 2 | −2.73712 | 0.729699 | 0.010901463 |
| 2 | 0.6755 | 0.4779 | 0.5770 | 9 | −4.6673 | 0.584299 | −0.007298969 |
| 3 | 0.5413 | 0.3893 | 0.4655 | 20 | −6.79307 | 0.457453 | 0.008046562 |
| 4 | 0.4968 | 0.4806 | 0.4887 | 16 | −6.20221 | 0.489654 | −0.000953627 |
| 5 | 0.5192 | 0.5402 | 0.5297 | 11 | −5.44135 | 0.534481 | −0.004781168 |
| 6 | 0.4227 | 0.4989 | 0.4607 | 22 | −6.71628 | 0.461515 | −0.000814538 |
| 7 | 0.3545 | 0.8235 | 0.5883 | 8 | −4.6074 | 0.588342 | −4.24 × 10⁻⁵ |
| 8 | 0.3333 | 1.0000 | 0.6656 | 3 | −3.54029 | 0.665251 | 0.000448659 |
| 9 | 0.3411 | 0.9443 | 0.6418 | 4 | −4.11459 | 0.622688 | 0.019111683 |
| 10 | 0.9386 | 0.3333 | 0.6369 | 5 | −3.23449 | 0.689089 | −0.052289264 |
| 11 | 0.6899 | 0.4217 | 0.5562 | 10 | −5.46608 | 0.532962 | 0.023237886 |
| 12 | 0.568 | 0.4442 | 0.5063 | 14 | −5.85577 | 0.509579 | −0.003279069 |
| 13 | 0.4323 | 0.4495 | 0.4409 | 25 | −7.19254 | 0.436891 | 0.004008545 |
| 14 | 0.4483 | 0.4911 | 0.4696 | 19 | −6.97332 | 0.448058 | 0.021542182 |
| 15 | 0.4205 | 0.5579 | 0.4890 | 15 | −6.62479 | 0.466402 | 0.022597861 |
| 16 | 0.3586 | 0.5849 | 0.4714 | 18 | −6.66318 | 0.464345 | 0.007055262 |
| 17 | 0.3402 | 0.6881 | 0.5136 | 12 | −5.83493 | 0.510803 | 0.002797351 |
| 18 | 0.3466 | 0.6759 | 0.5107 | 13 | −5.91761 | 0.505964 | 0.004836211 |
| 19 | 1.0000 | 0.6080 | 0.8046 | 1 | −2.1881 | 0.777311 | 0.027288788 |
| 20 | 0.7072 | 0.5619 | 0.6348 | 6 | −3.79827 | 0.645783 | −0.010982537 |
| 21 | 0.5995 | 0.6394 | 0.6194 | 7 | −4.15325 | 0.619923 | −0.000523041 |
| 22 | 0.4425 | 0.4751 | 0.4587 | 23 | −6.66189 | 0.464414 | −0.005613602 |
| 23 | 0.4633 | 0.464 | 0.4636 | 21 | −6.60591 | 0.467417 | −0.003816678 |
| 24 | 0.4181 | 0.5398 | 0.4788 | 17 | −6.34858 | 0.481472 | −0.002671981 |
| 25 | 0.3644 | 0.4367 | 0.4004 | 26 | −7.90211 | 0.402619 | −0.002219156 |
| 26 | 0.3439 | 0.5634 | 0.4533 | 24 | −6.68759 | 0.463042 | −0.009741989 |
| 27 | 0.3502 | 0.4219 | 0.3859 | 27 | −7.32292 | 0.430382 | −0.04448199 |
Table 5.
Responses for S/N ratio (GRG).
| Levels | x | y | z | t | w |
|---|---|---|---|---|---|
| First | −4.944 | −4.328 | −5.290 | −4.884 | −5.015 |
| Second | −5.886 | −6.467 | −5.420 | −5.765 | −5.806 |
| Third | −5.881 | −5.916 | −6.002 | −6.063 | −5.890 |
| Delta | 0.942 | 2.140 | 0.712 | 1.179 | 0.875 |
| Rank | 3 | 1 | 5 | 2 | 4 |
Table 6.
Outcomes of analyzing mean values.
| Levels | x | y | z | t | w |
|---|---|---|---|---|---|
| First | 0.5759 | 0.6157 | 0.5731 | 0.5826 | 0.5589 |
| Second | 0.5174 | 0.4755 | 0.5105 | 0.5216 | 0.5404 |
| Third | 0.5124 | 0.5145 | 0.5222 | 0.5016 | 0.5064 |
| Delta | 0.0635 | 0.1402 | 0.0509 | 0.0810 | 0.0525 |
| Rank | 3 | 1 | 5 | 2 | 4 |
Table 7.
Details of ANOVA results (GRG).
| Sources | DF | Seq + SS | Contributions | AdjSS | SeqMS | F-Values | p-Values |
|---|---|---|---|---|---|---|---|
| Reg | 9 | 0.098263 | 96.61% | 0.098263 | 0.010918 | 33.16 | 0.000 |
| x | 1 | 0.003510 | 4.38% | 0.002514 | 0.003510 | 10.66 | 0.005 |
| y | 1 | 0.015414 | 14.84% | 0.006638 | 0.015414 | 46.82 | 0.000 |
| z | 1 | 0.002495 | 2.40% | 0.004054 | 0.002495 | 7.58 | 0.014 |
| t | 1 | 0.008349 | 8.04% | 0.000824 | 0.008349 | 25.36 | 0.000 |
| w | 1 | 0.004259 | 4.10% | 0.005381 | 0.004259 | 12.94 | 0.002 |
| x × x | 1 | 0.001945 | 1.87% | 0.001945 | 0.001945 | 5.91 | 0.026 |
| y × y | 1 | 0.017658 | 17.00% | 0.017658 | 0.017658 | 53.64 | 0.000 |
| x × y | 1 | 0.042918 | 41.32% | 0.042918 | 0.042918 | 130.37 | 0.000 |
| y × t | 1 | 0.001715 | 1.65% | 0.001715 | 0.001715 | 5.21 | 0.036 |
| Error | 17 | 0.005597 | 3.39% | 0.005597 | 0.000329 | ||
| Total | 26 | 0.103860 | 100.00% |
R-sq = 96.61%, R-sq (adj) = 94.76%, R-sq (pred) = 92.92%.
Table 8.
The results of the statistical analysis of GRG.
| RMSE | MSE | MAPE | R-Square |
|---|---|---|---|
| 0.017181371 | 0.000295199 | 2.109164529 | 0.998937275 |
Table 9.
Comparison of the predicted and optimal values between methods.
| Method | TM | ANN | RE |
|---|---|---|---|
| Predicted value of GRG | 0.7650 | 0.7671 | 0.768 |
| Optimal value of GRG | 0.7406 | 0.7406 | 0.7406 |
| % Error | 3.2 | 3.46 | 3.57 |
Table 10.
Comparison of the optimal value with the experimental results.
| Output | Combination Parameters | Di (mm) | Magnification Ratio | Stress (MPa) |
|---|---|---|---|---|
| Optimal value | x1y1z1t1w1 | 0.6951 | 69.22 | 78.834 |
| Experiment value | 0.6536 | 65.36 | - | |
| % Error | 5.97 | 5.97 |
Publisher’s Note: MDPI stays neutral with regard to jurisdictional claims in published maps and institutional affiliations. |
© 2021 by the authors. Licensee MDPI, Basel, Switzerland. This article is an open access article distributed under the terms and conditions of the Creative Commons Attribution (CC BY) license (https://creativecommons.org/licenses/by/4.0/).
Share and Cite
MDPI and ACS Style
Wang, C.-N.; Yang, F.-C.; Nguyen, V.T.T.; Nguyen, Q.M.; Huynh, N.T.; Huynh, T.T. Optimal Design for Compliant Mechanism Flexure Hinges: Bridge-Type. Micromachines 2021, 12, 1304. https://doi.org/10.3390/mi12111304
AMA Style
Wang C-N, Yang F-C, Nguyen VTT, Nguyen QM, Huynh NT, Huynh TT. Optimal Design for Compliant Mechanism Flexure Hinges: Bridge-Type. Micromachines. 2021; 12(11):1304. https://doi.org/10.3390/mi12111304
Chicago/Turabian StyleWang, Chia-Nan, Fu-Chiang Yang, Van Thanh Tien Nguyen, Quoc Manh Nguyen, Ngoc Thai Huynh, and Thanh Thuong Huynh. 2021. "Optimal Design for Compliant Mechanism Flexure Hinges: Bridge-Type" Micromachines 12, no. 11: 1304. https://doi.org/10.3390/mi12111304
Note that from the first issue of 2016, this journal uses article numbers instead of page numbers. See further details here.