Trace Element Distributions in the Zn-Pb (Mississippi Valley-Type) and Cu-Ag (Kupferschiefer) Sediment-Hosted Deposits in Poland

 , ,
, ,
Abstract
:1. Introduction
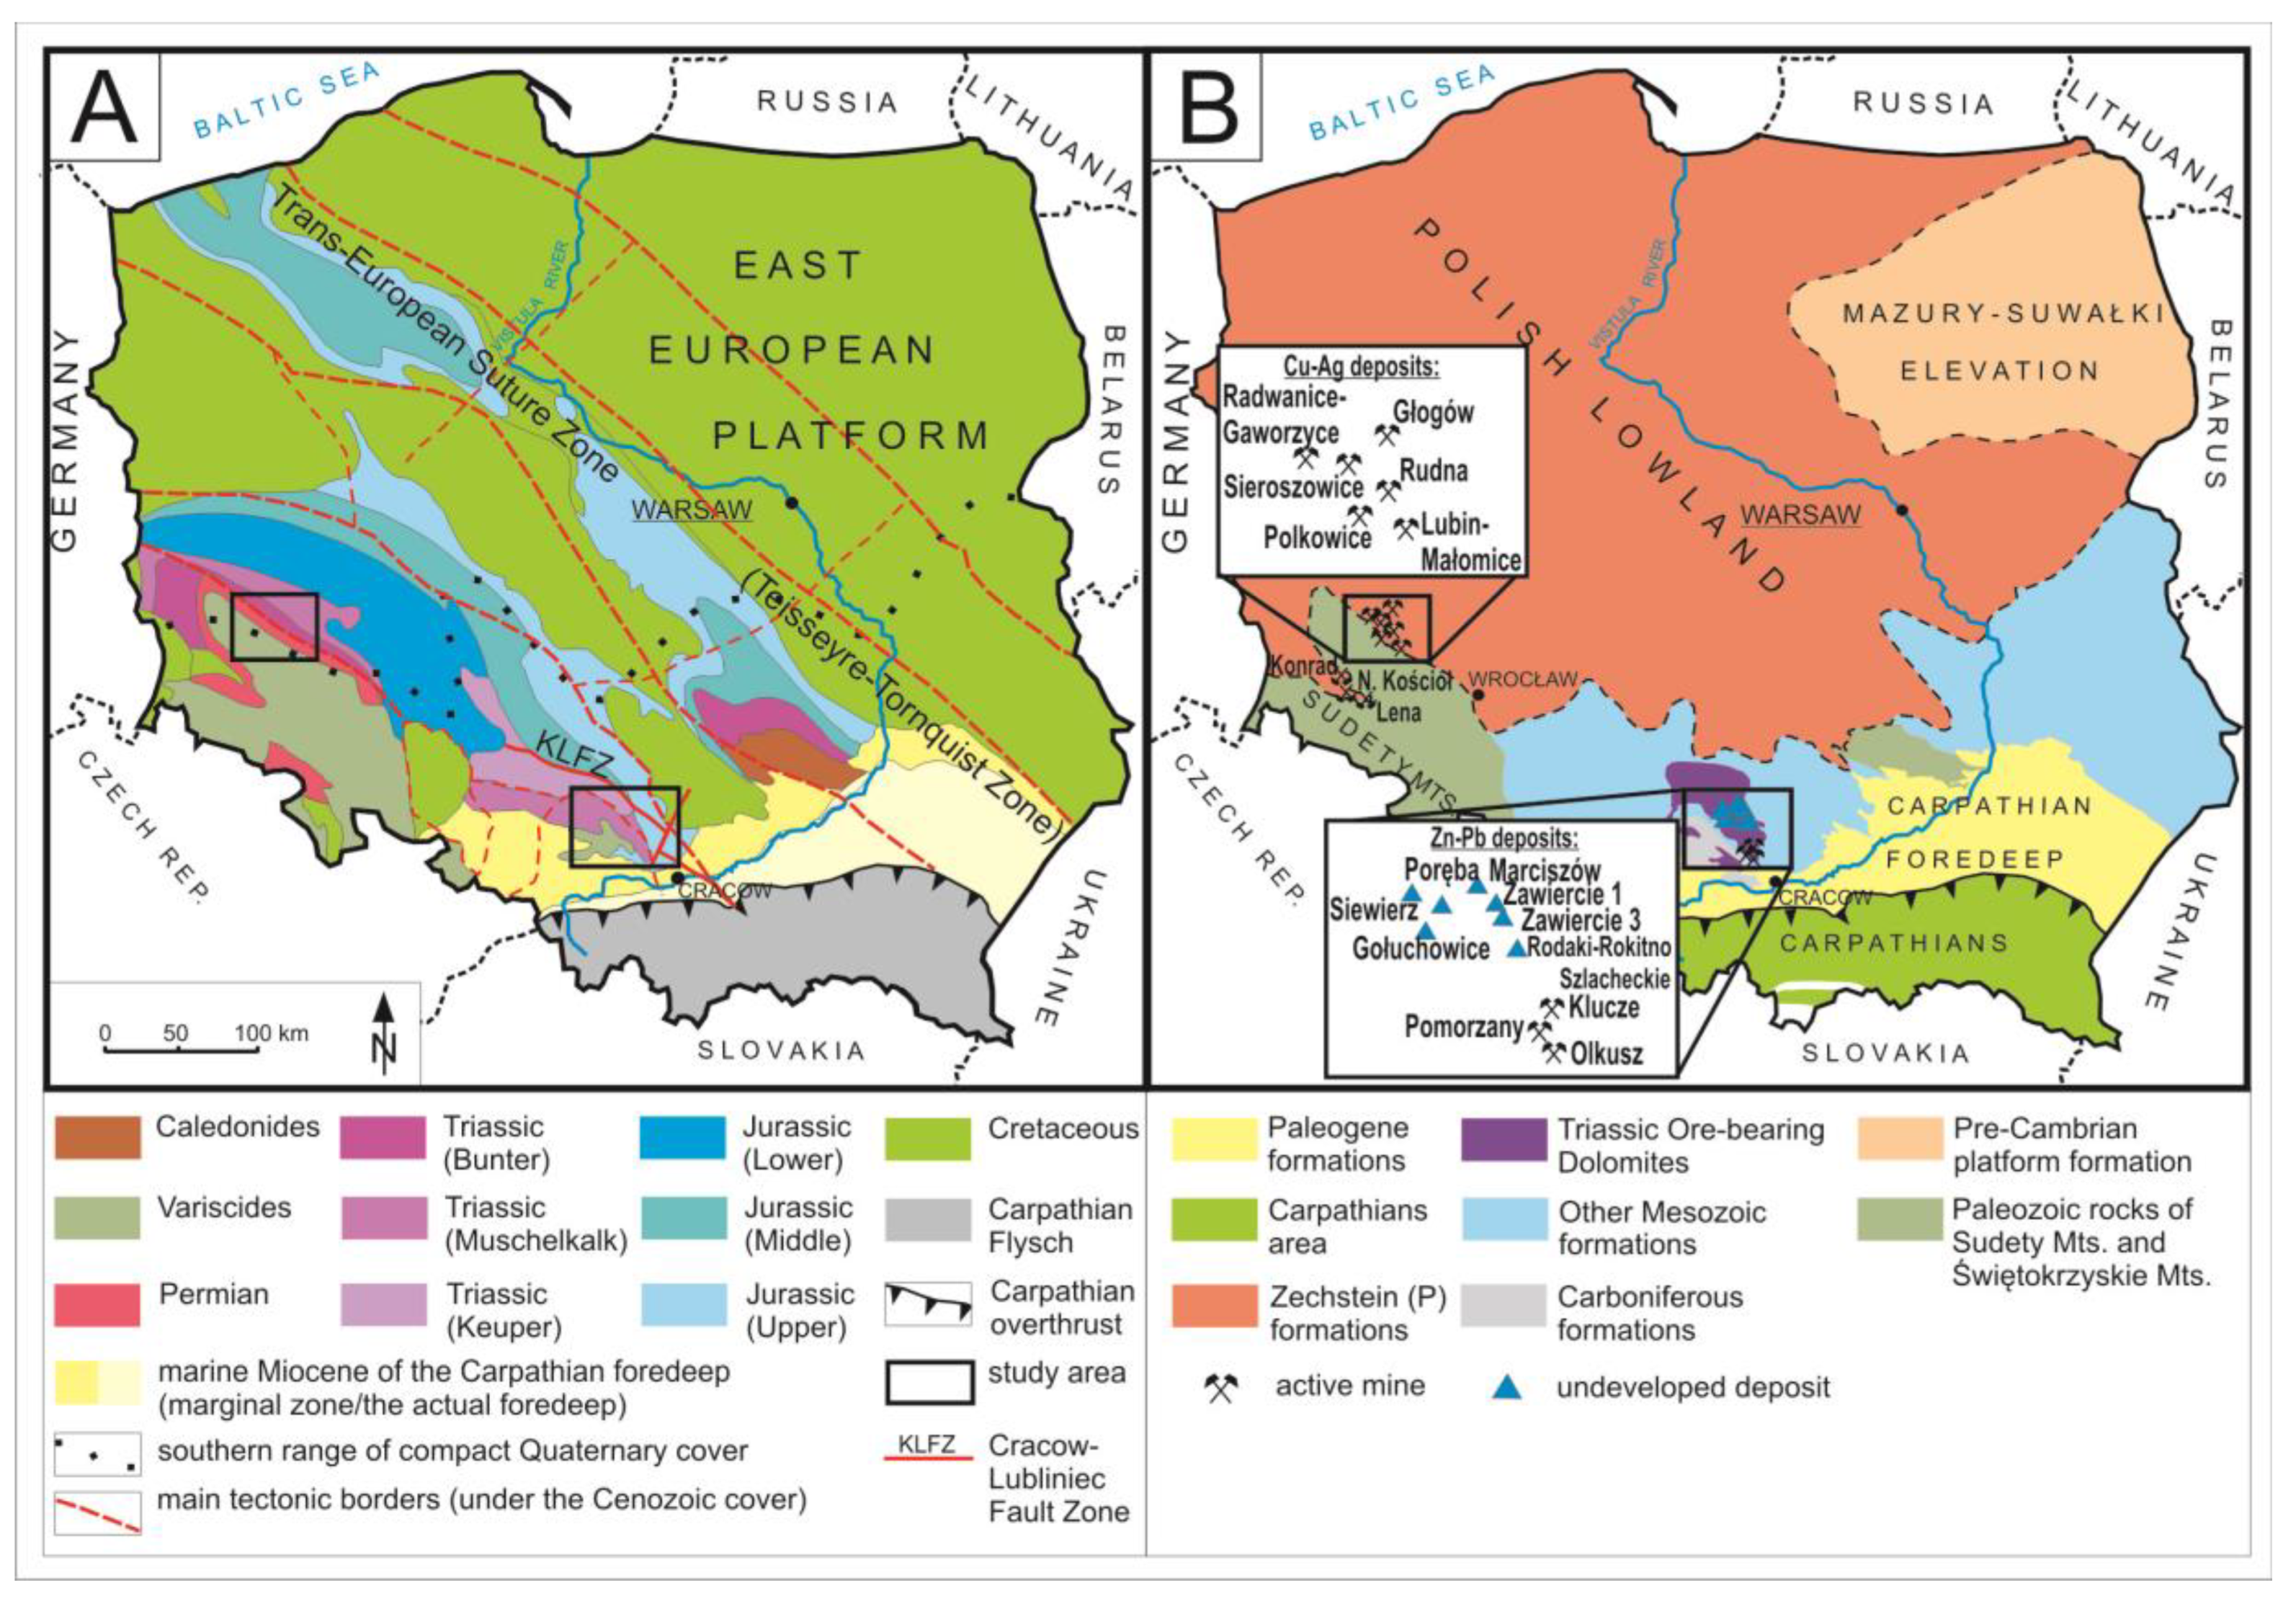
2. Geological Setting of Zn-Pb and Cu-Ag Sediment-Hosted Deposits in Poland
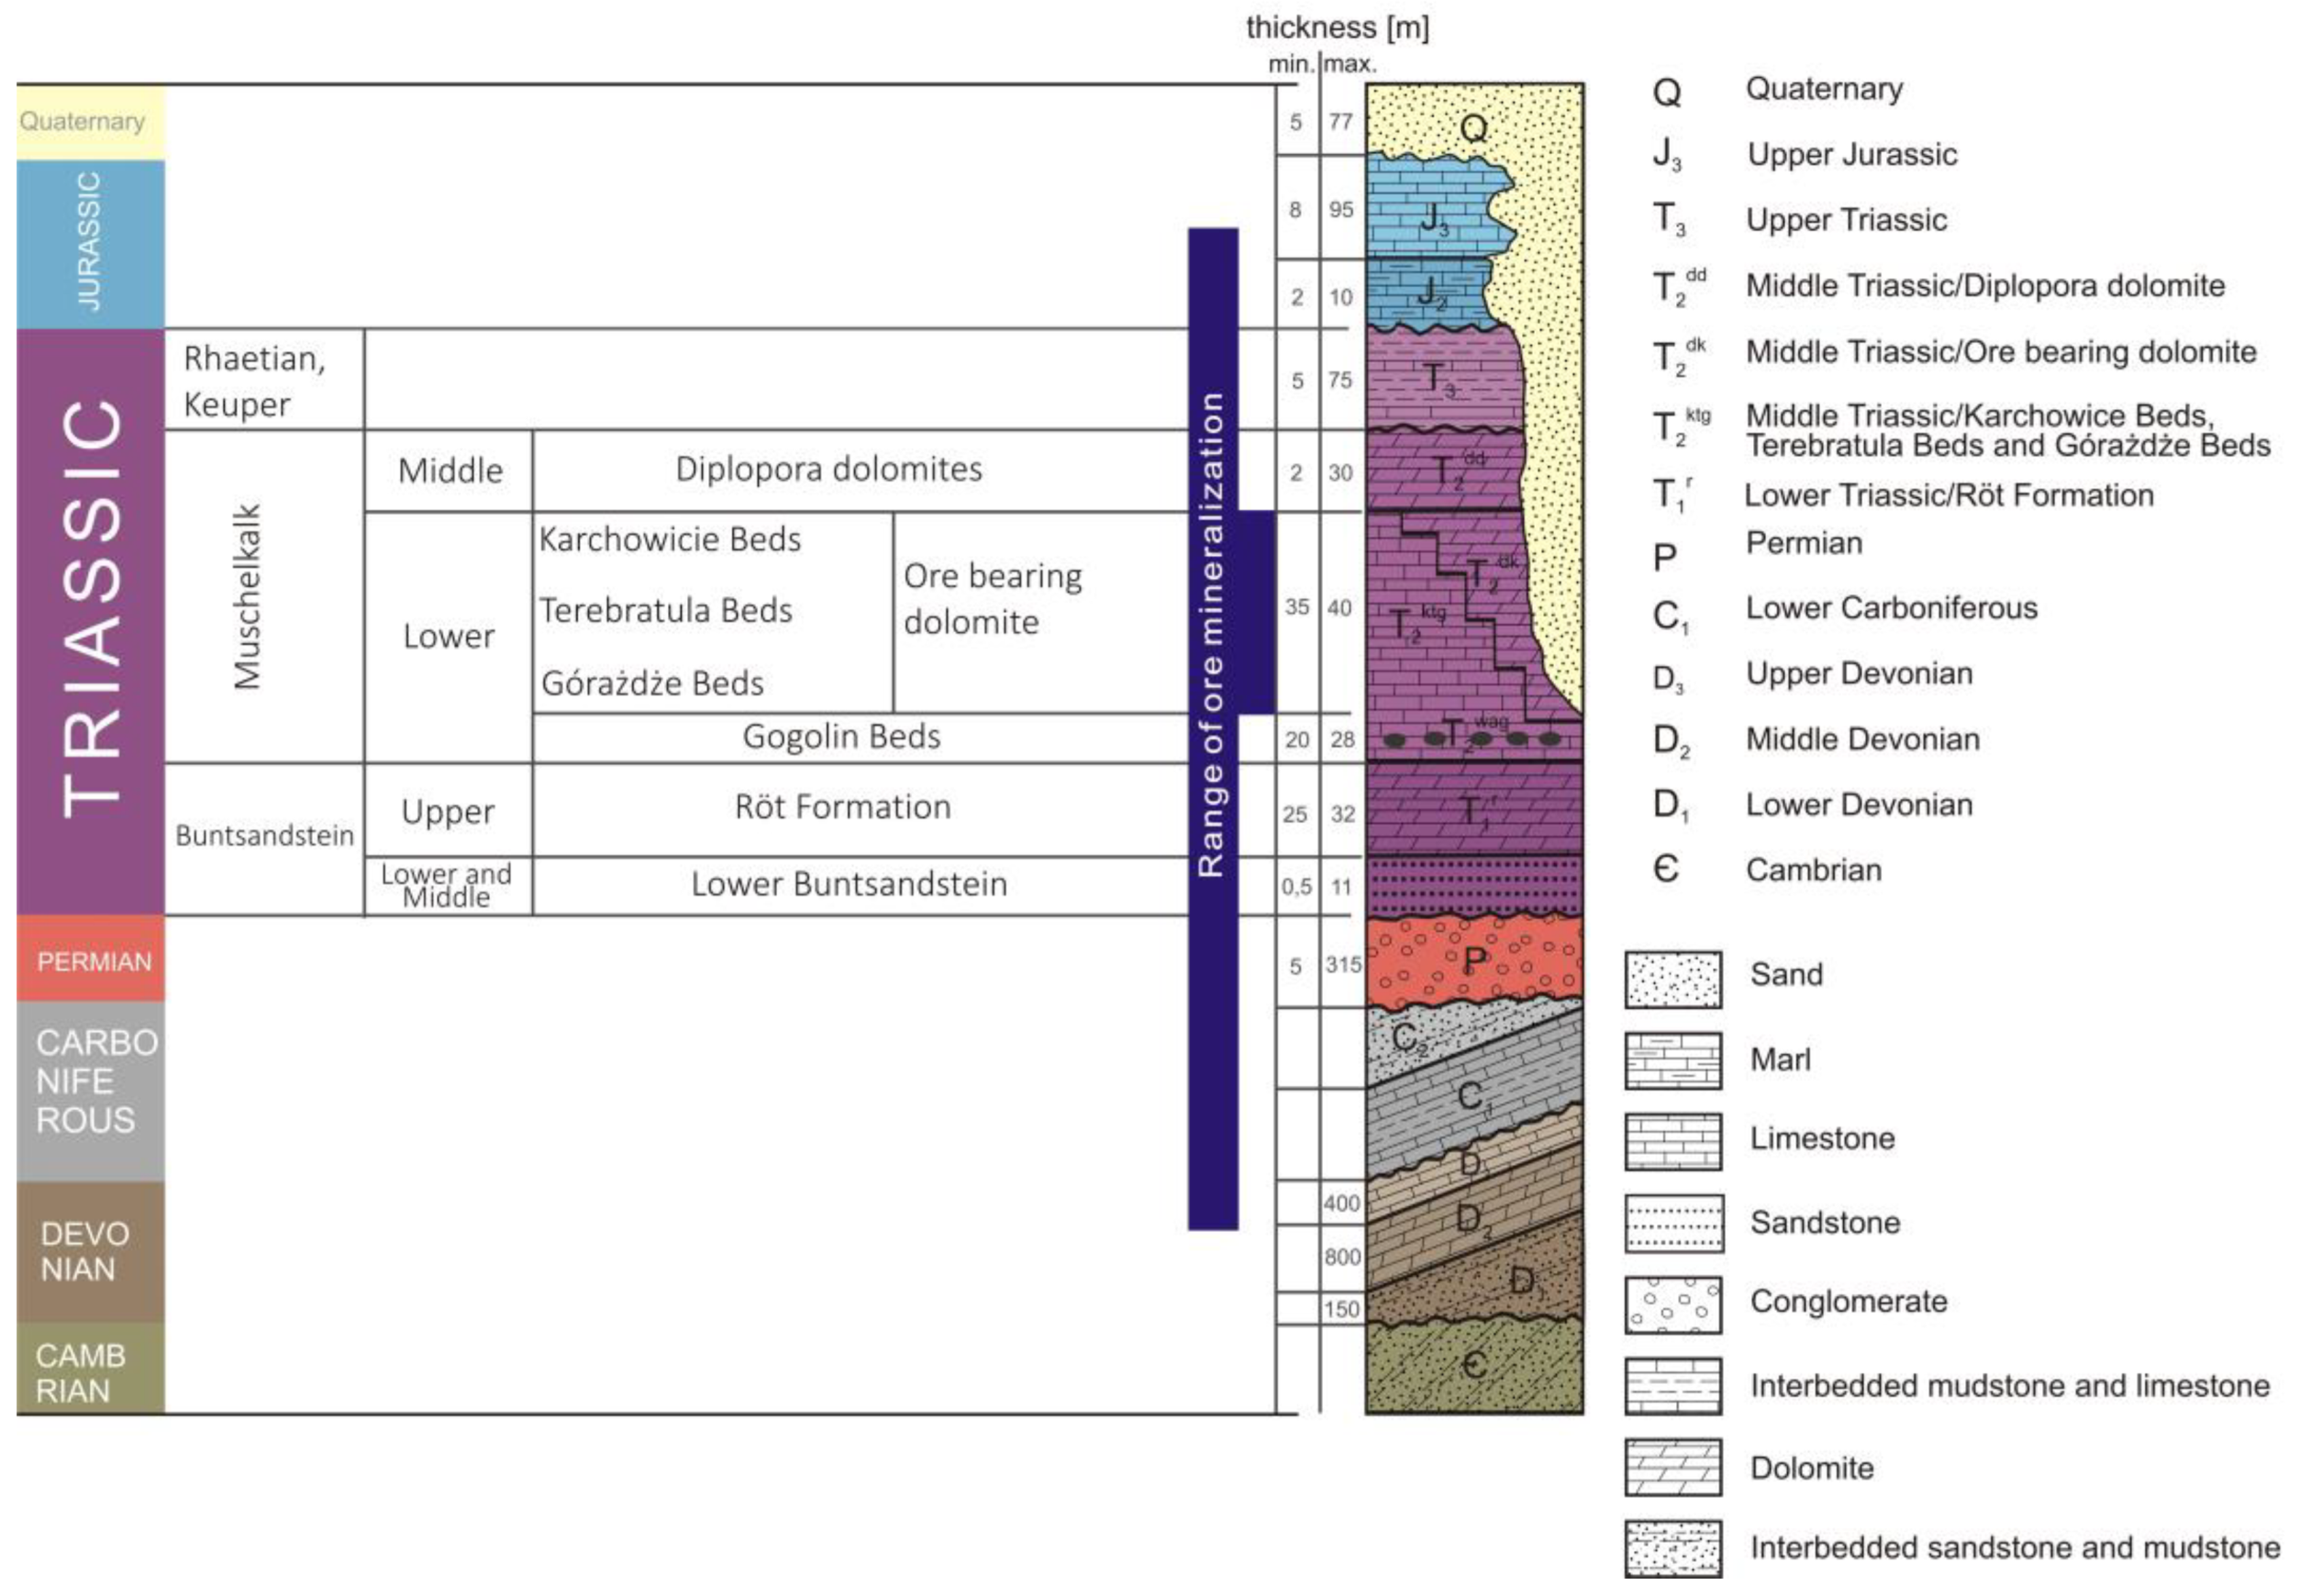
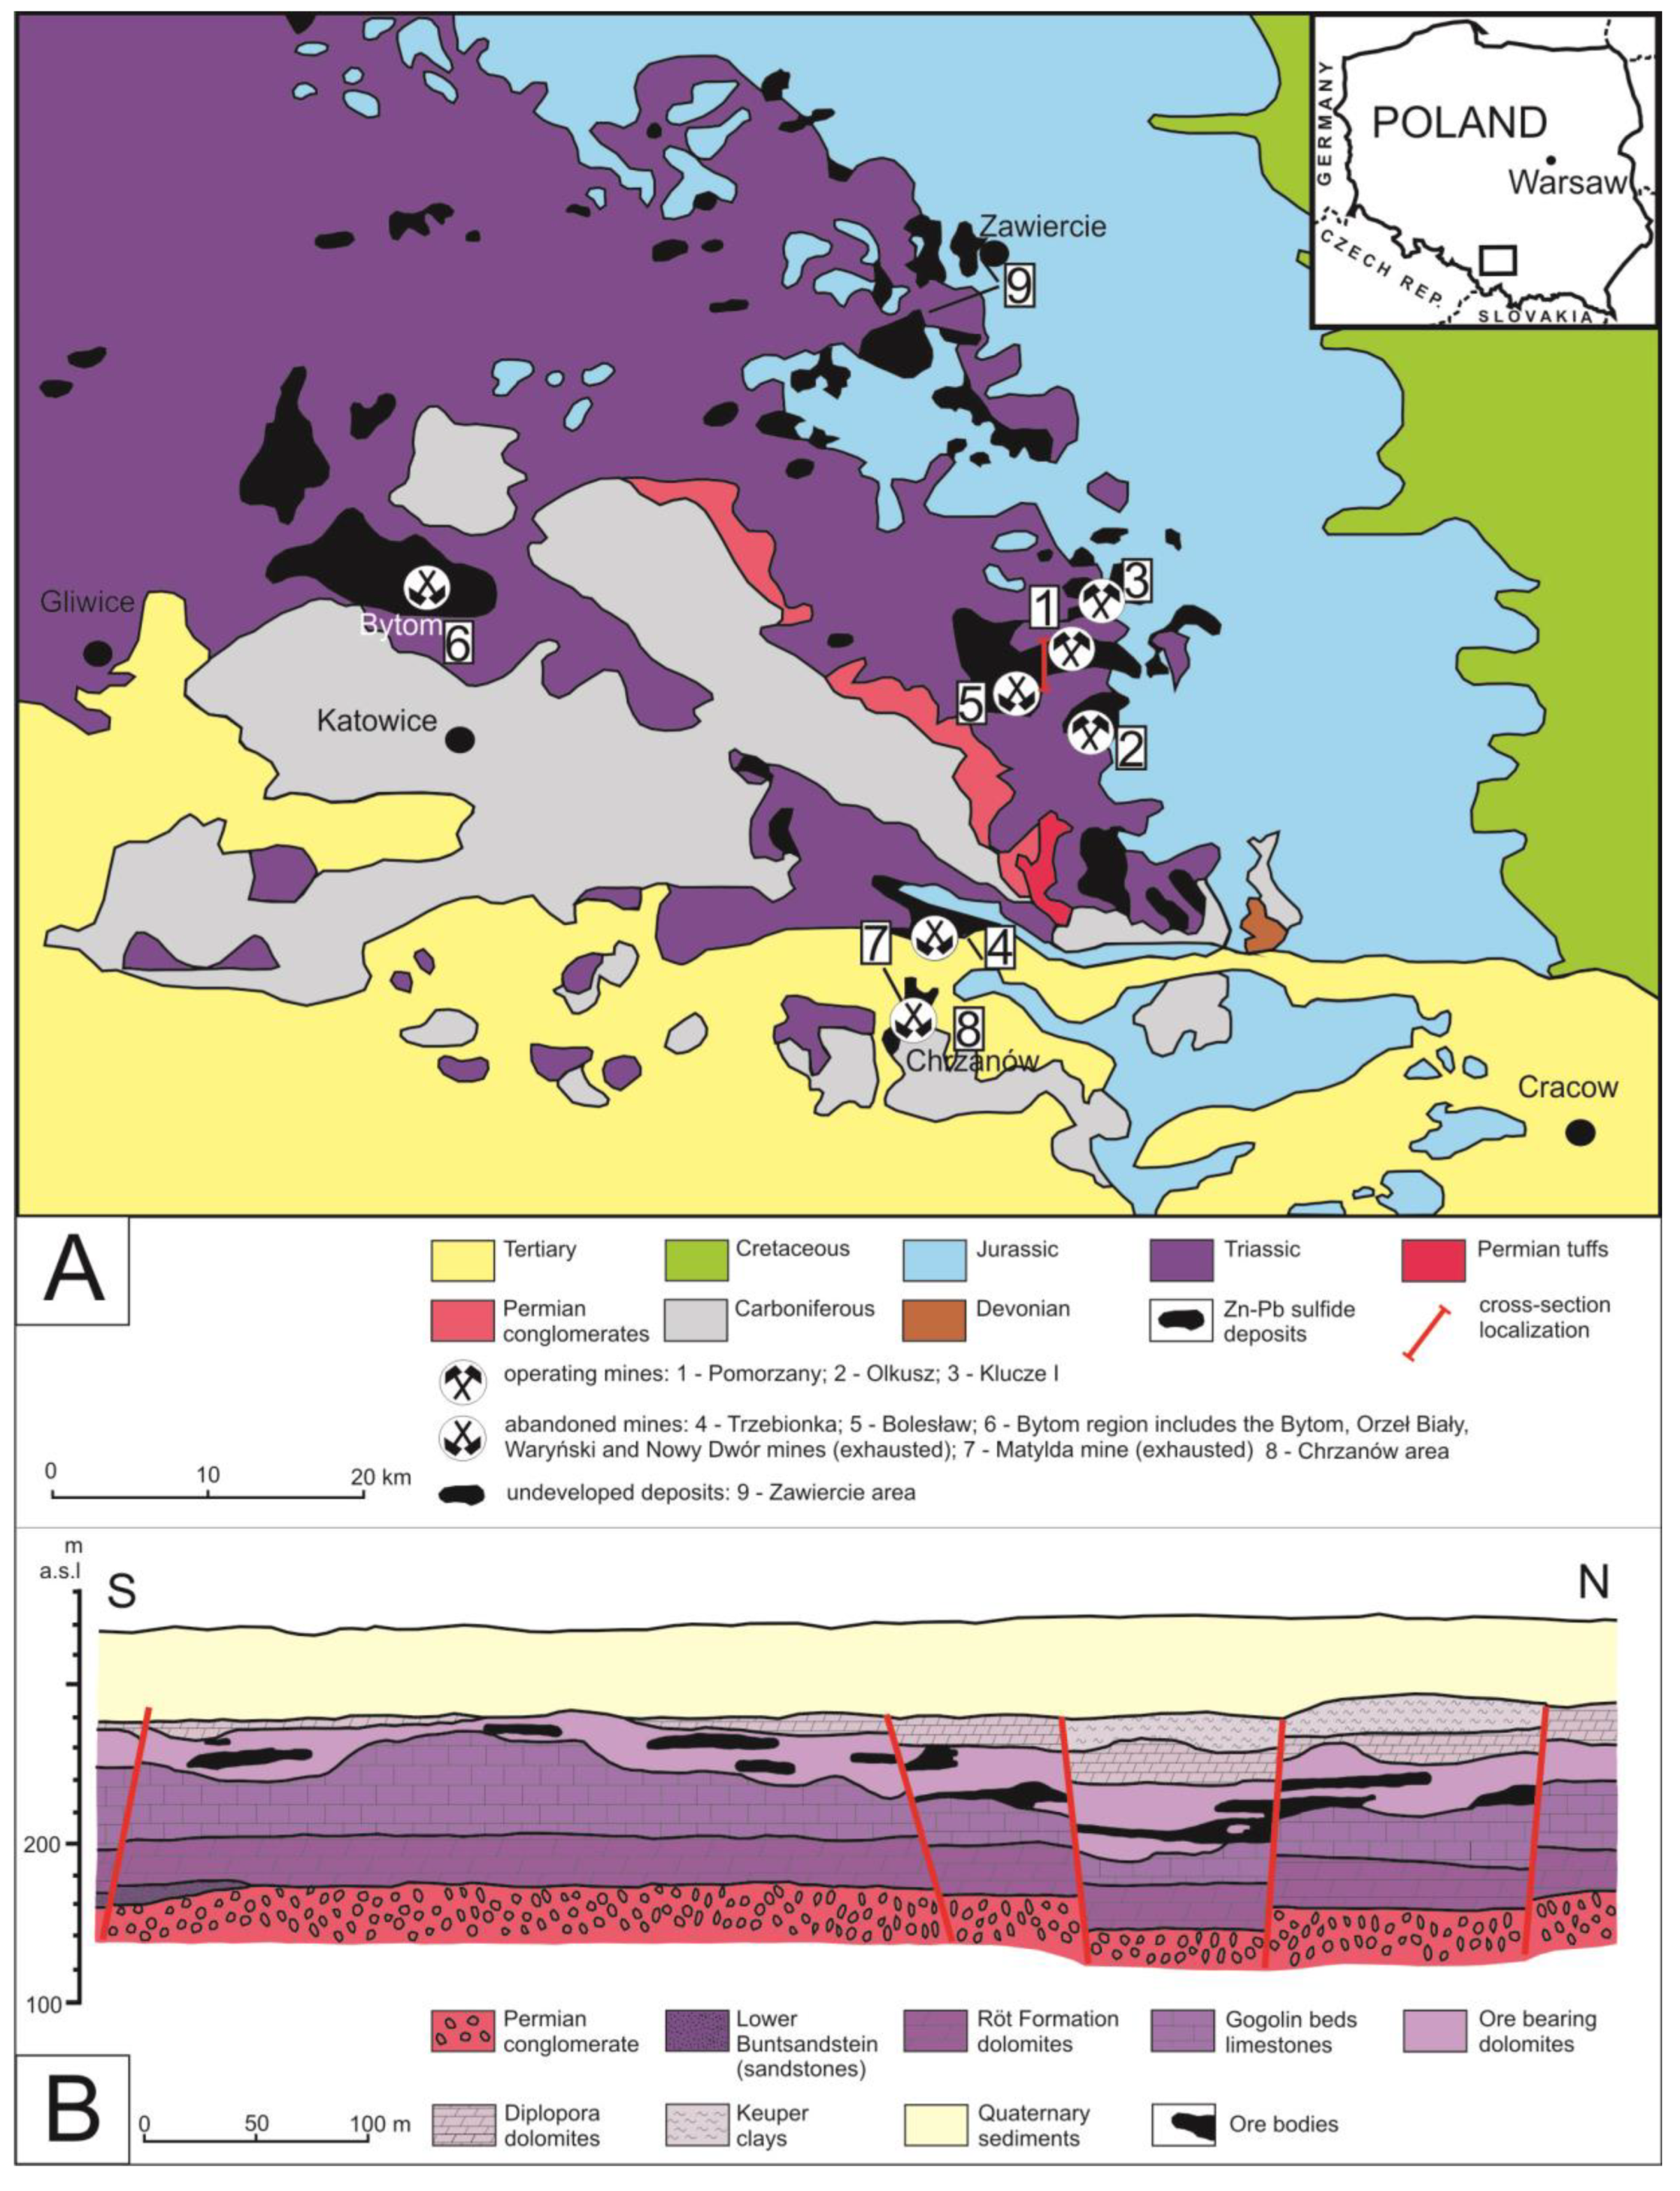
2.1. Zn-Pb Mississippi Valley-Type Deposits
Ore Mineralization
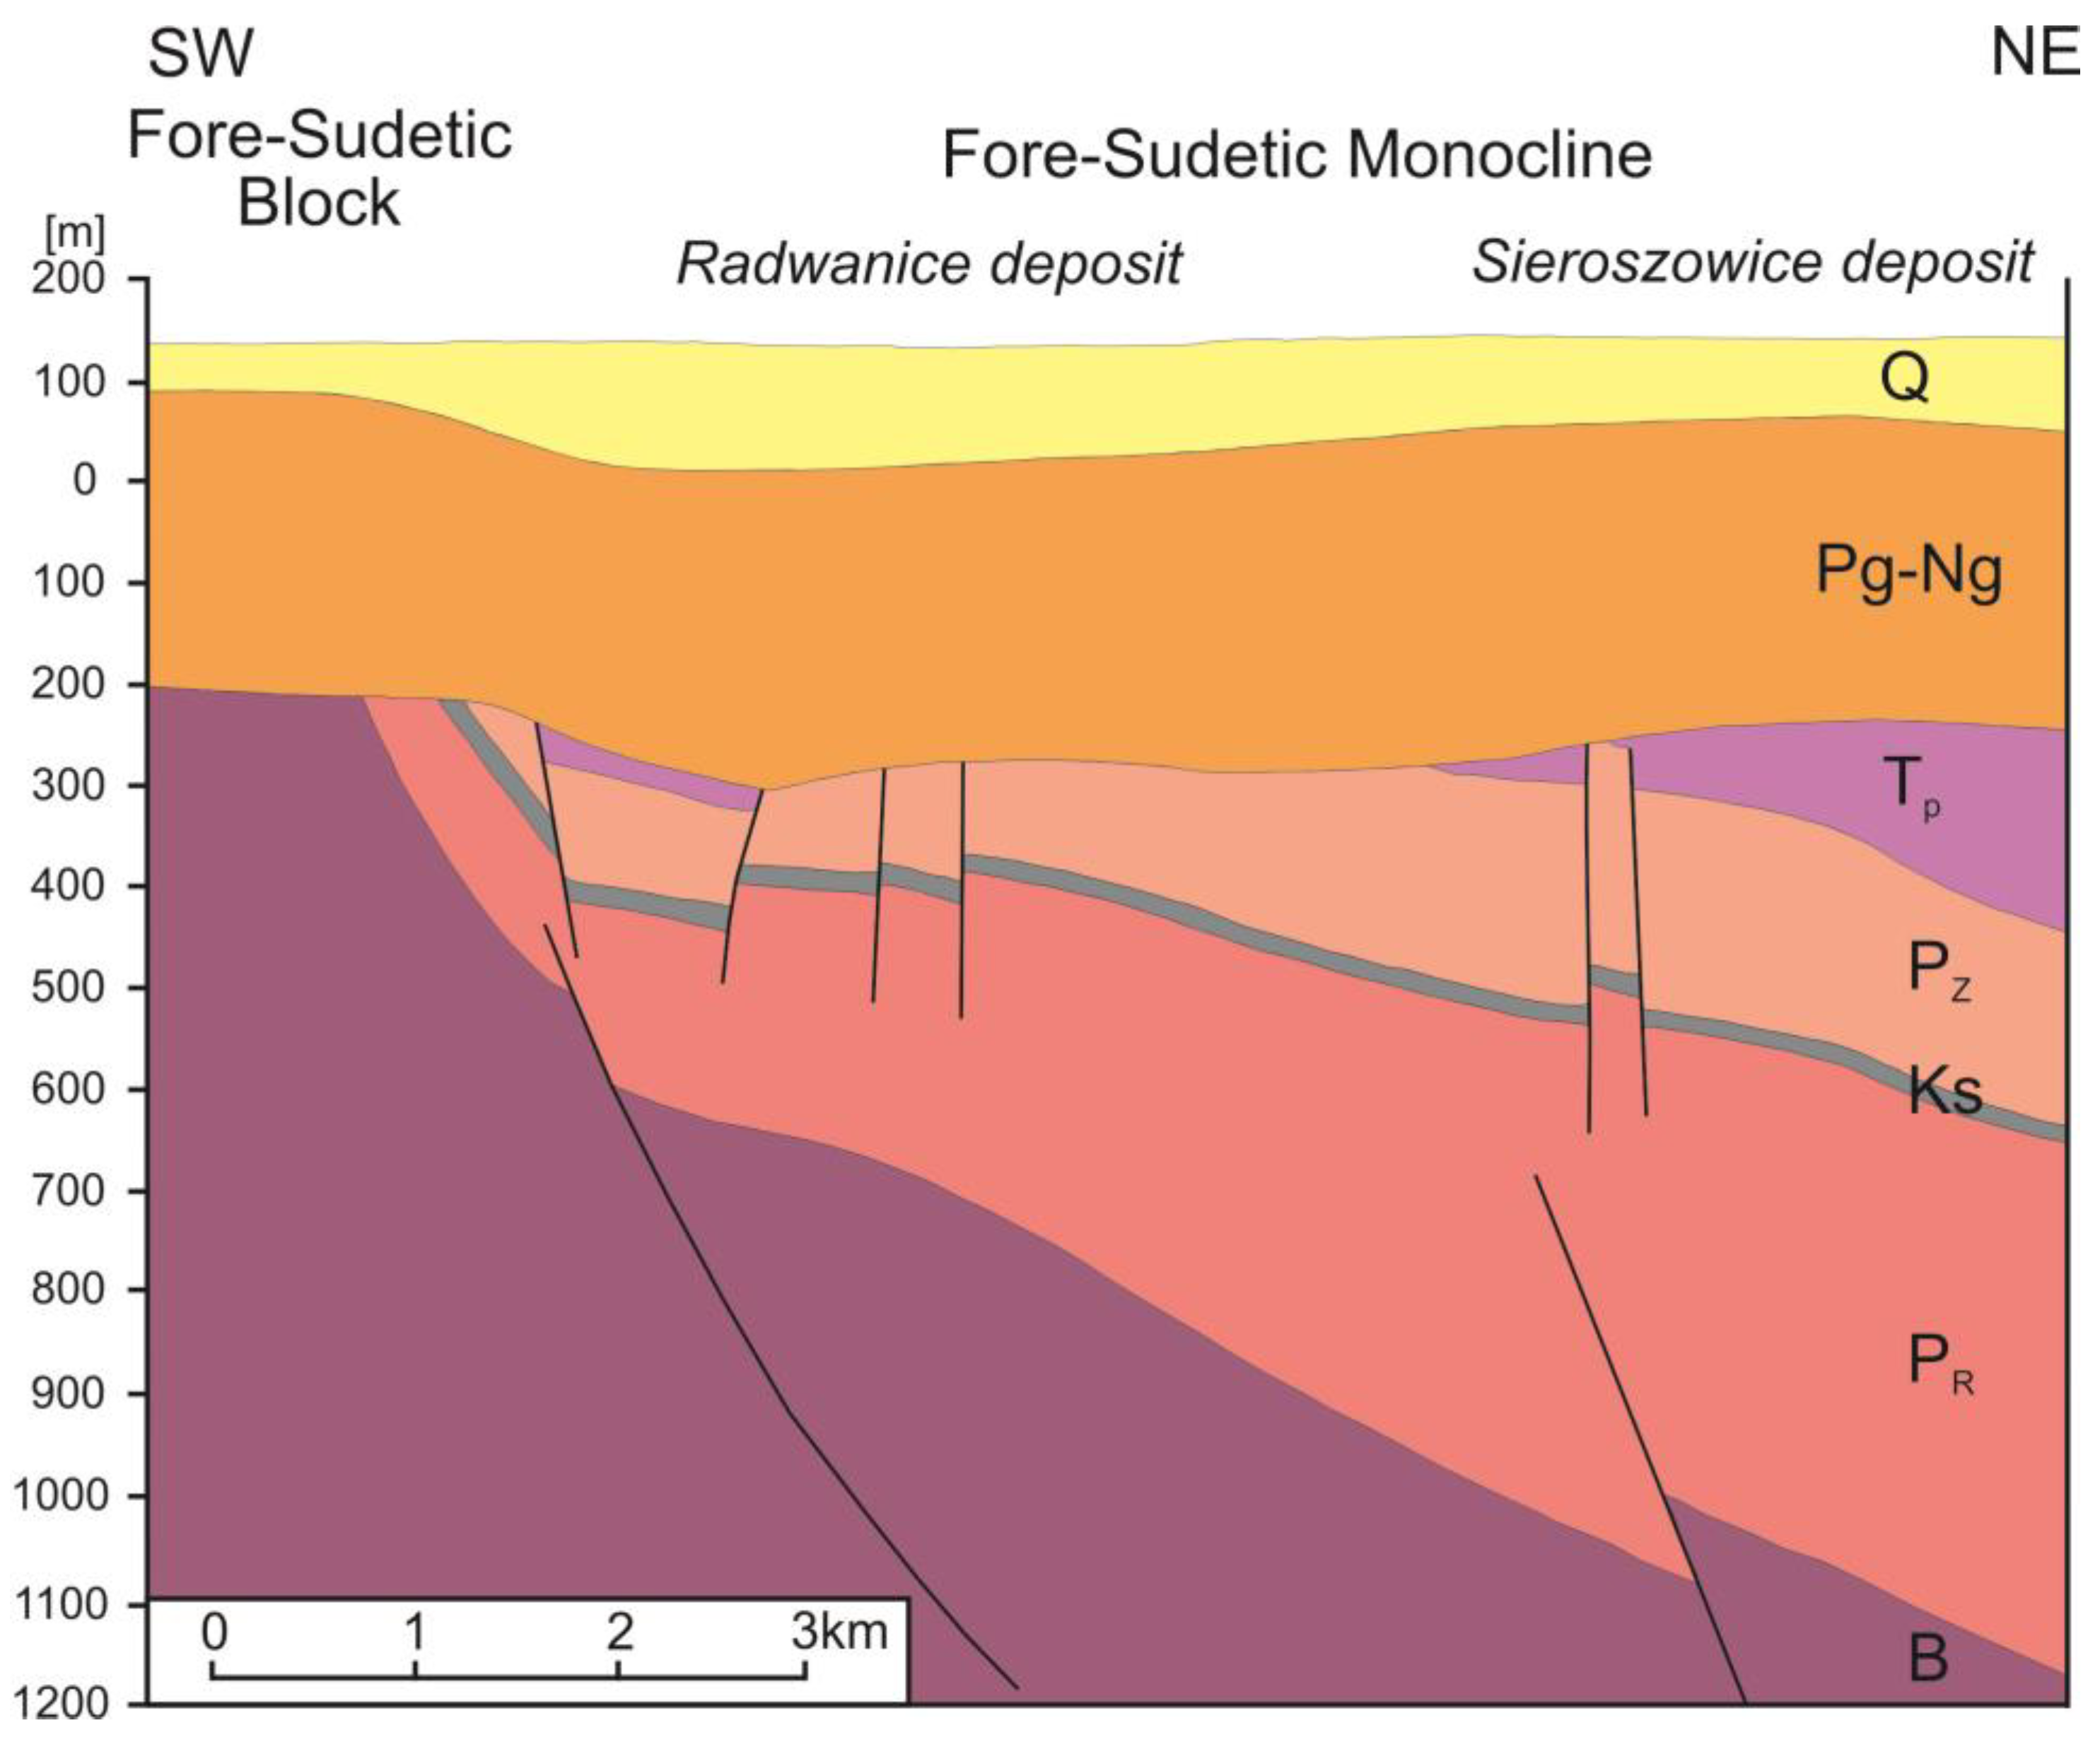
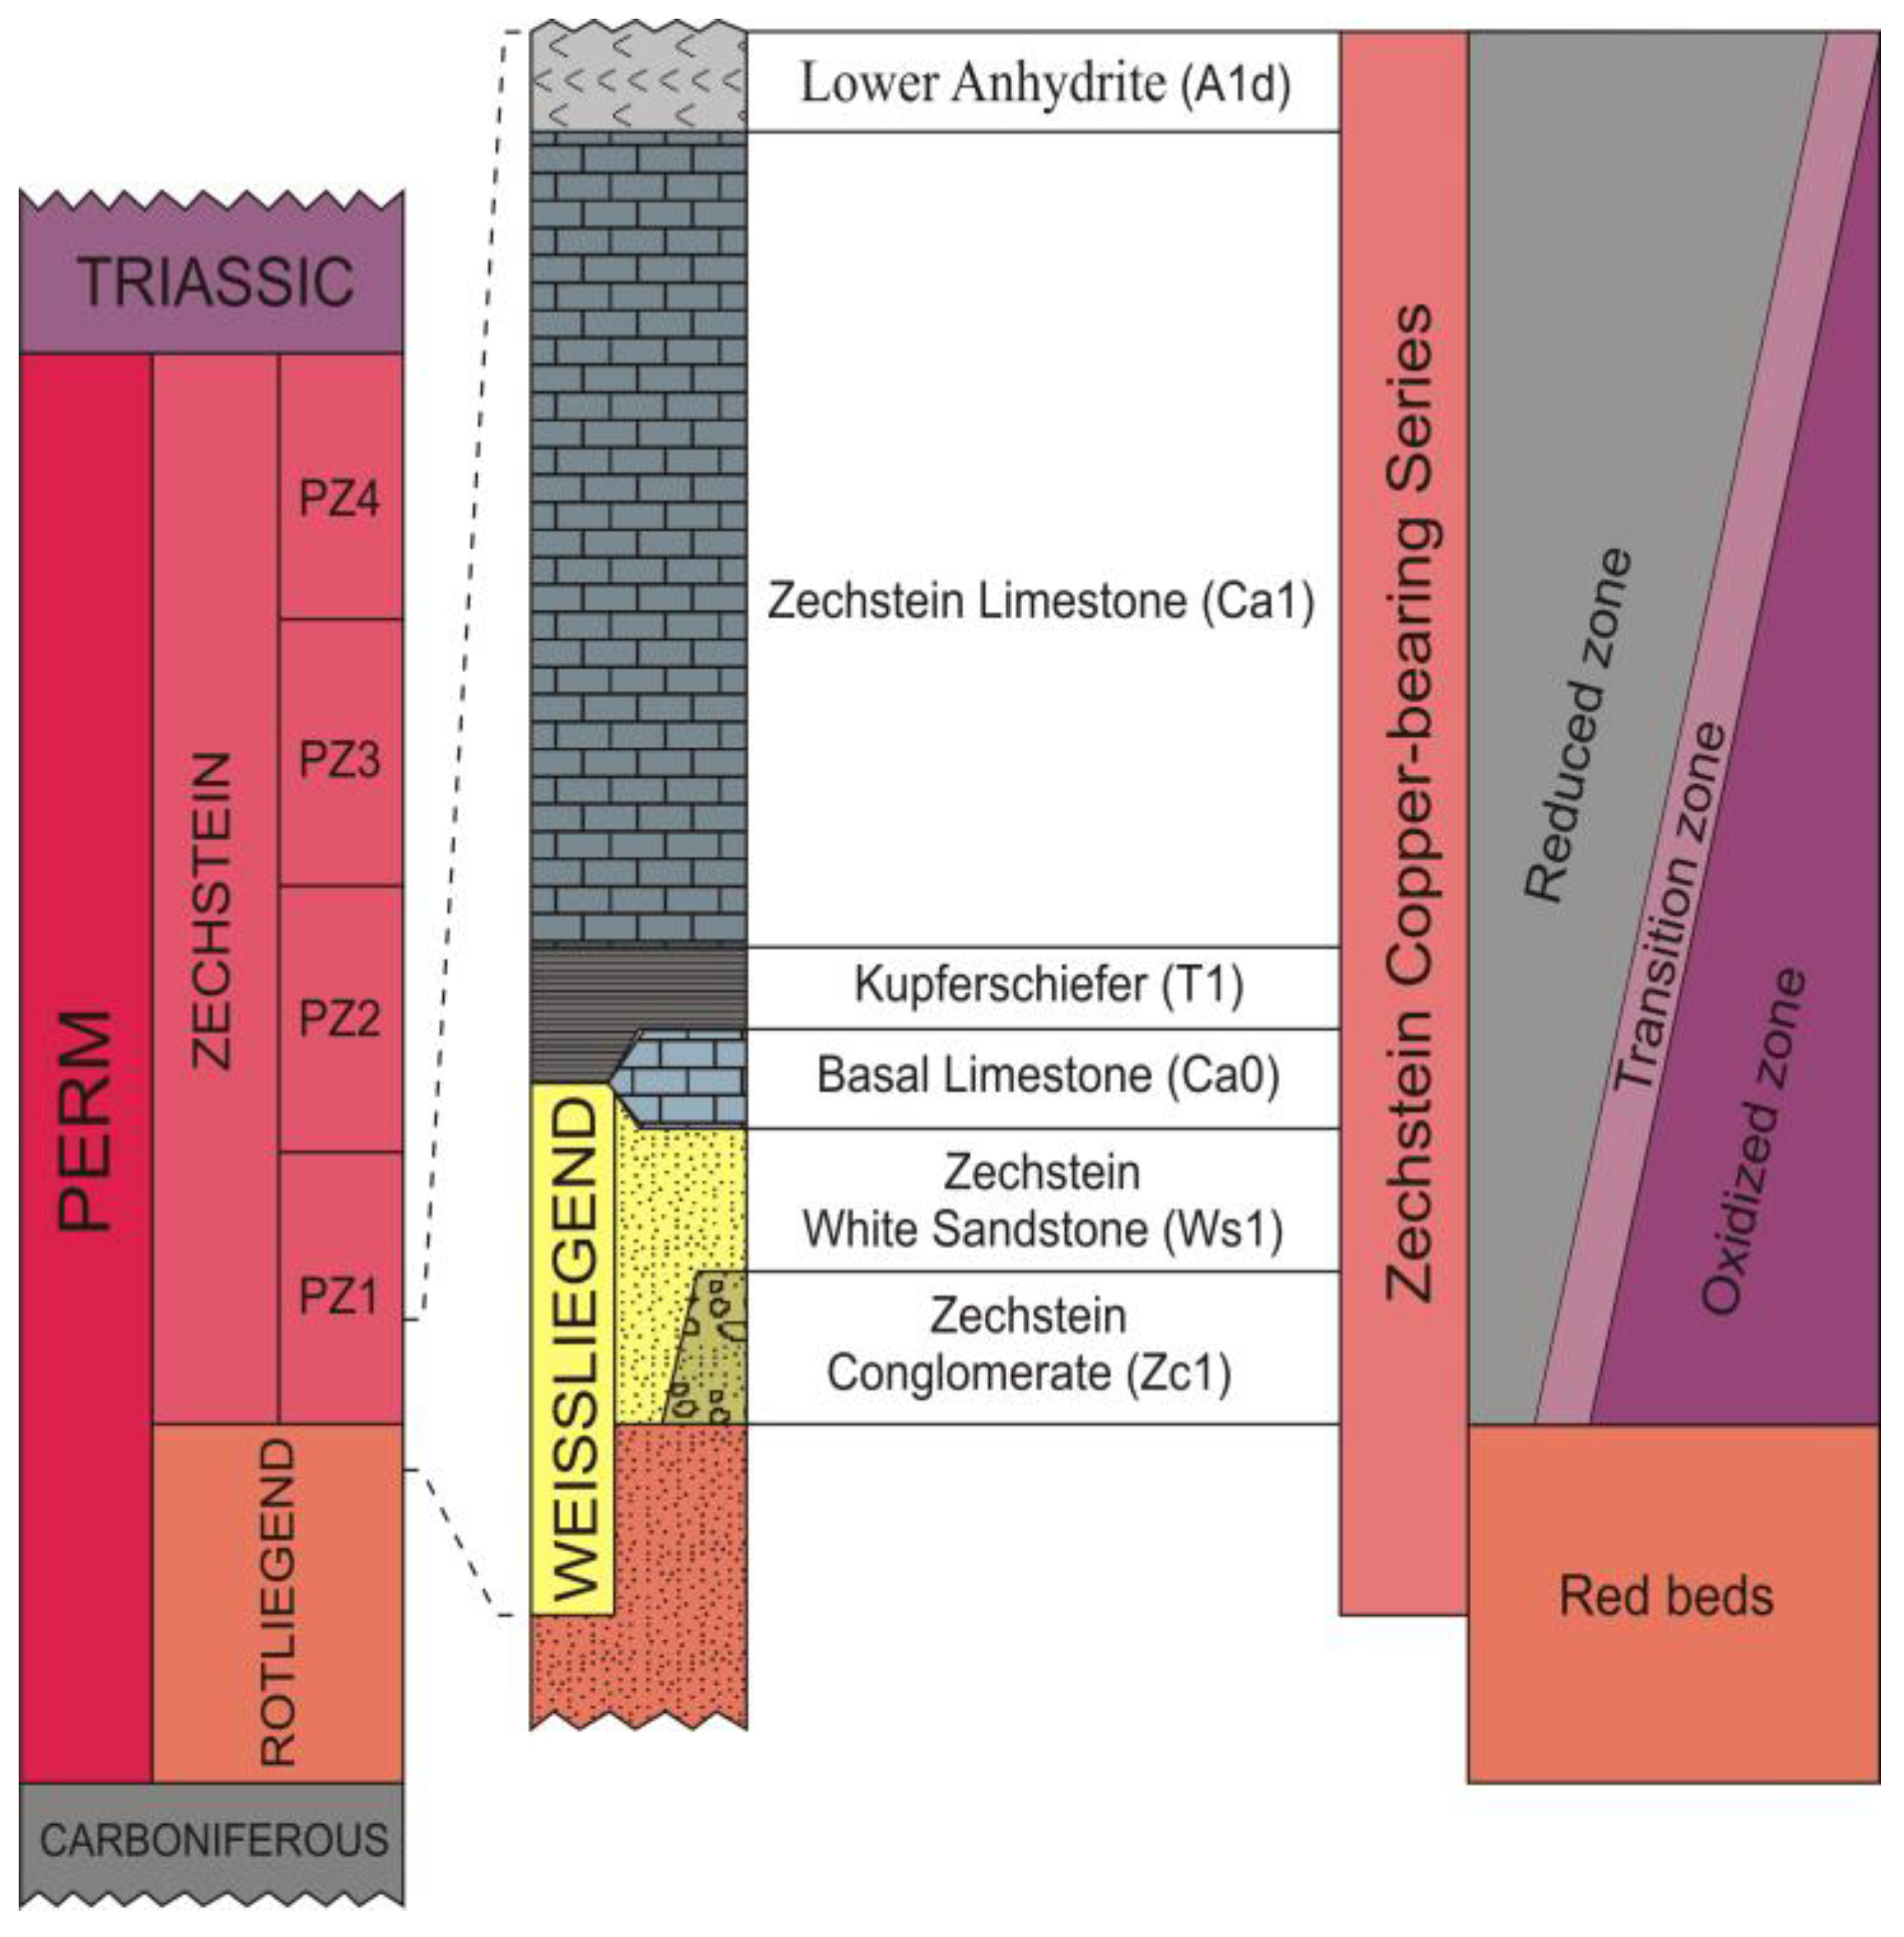
2.2. Cu-Ag Sediment-Hosted Stratiform Deposit on the Fore-Sudetic Monocline
Ore Mineralization
3. Samples and Analytical Methods
4. Results
4.1. Zn-Pb Mississippi Valley-Type Deposits
4.1.1. Results of Bulk-Rock Geochemical Investigation
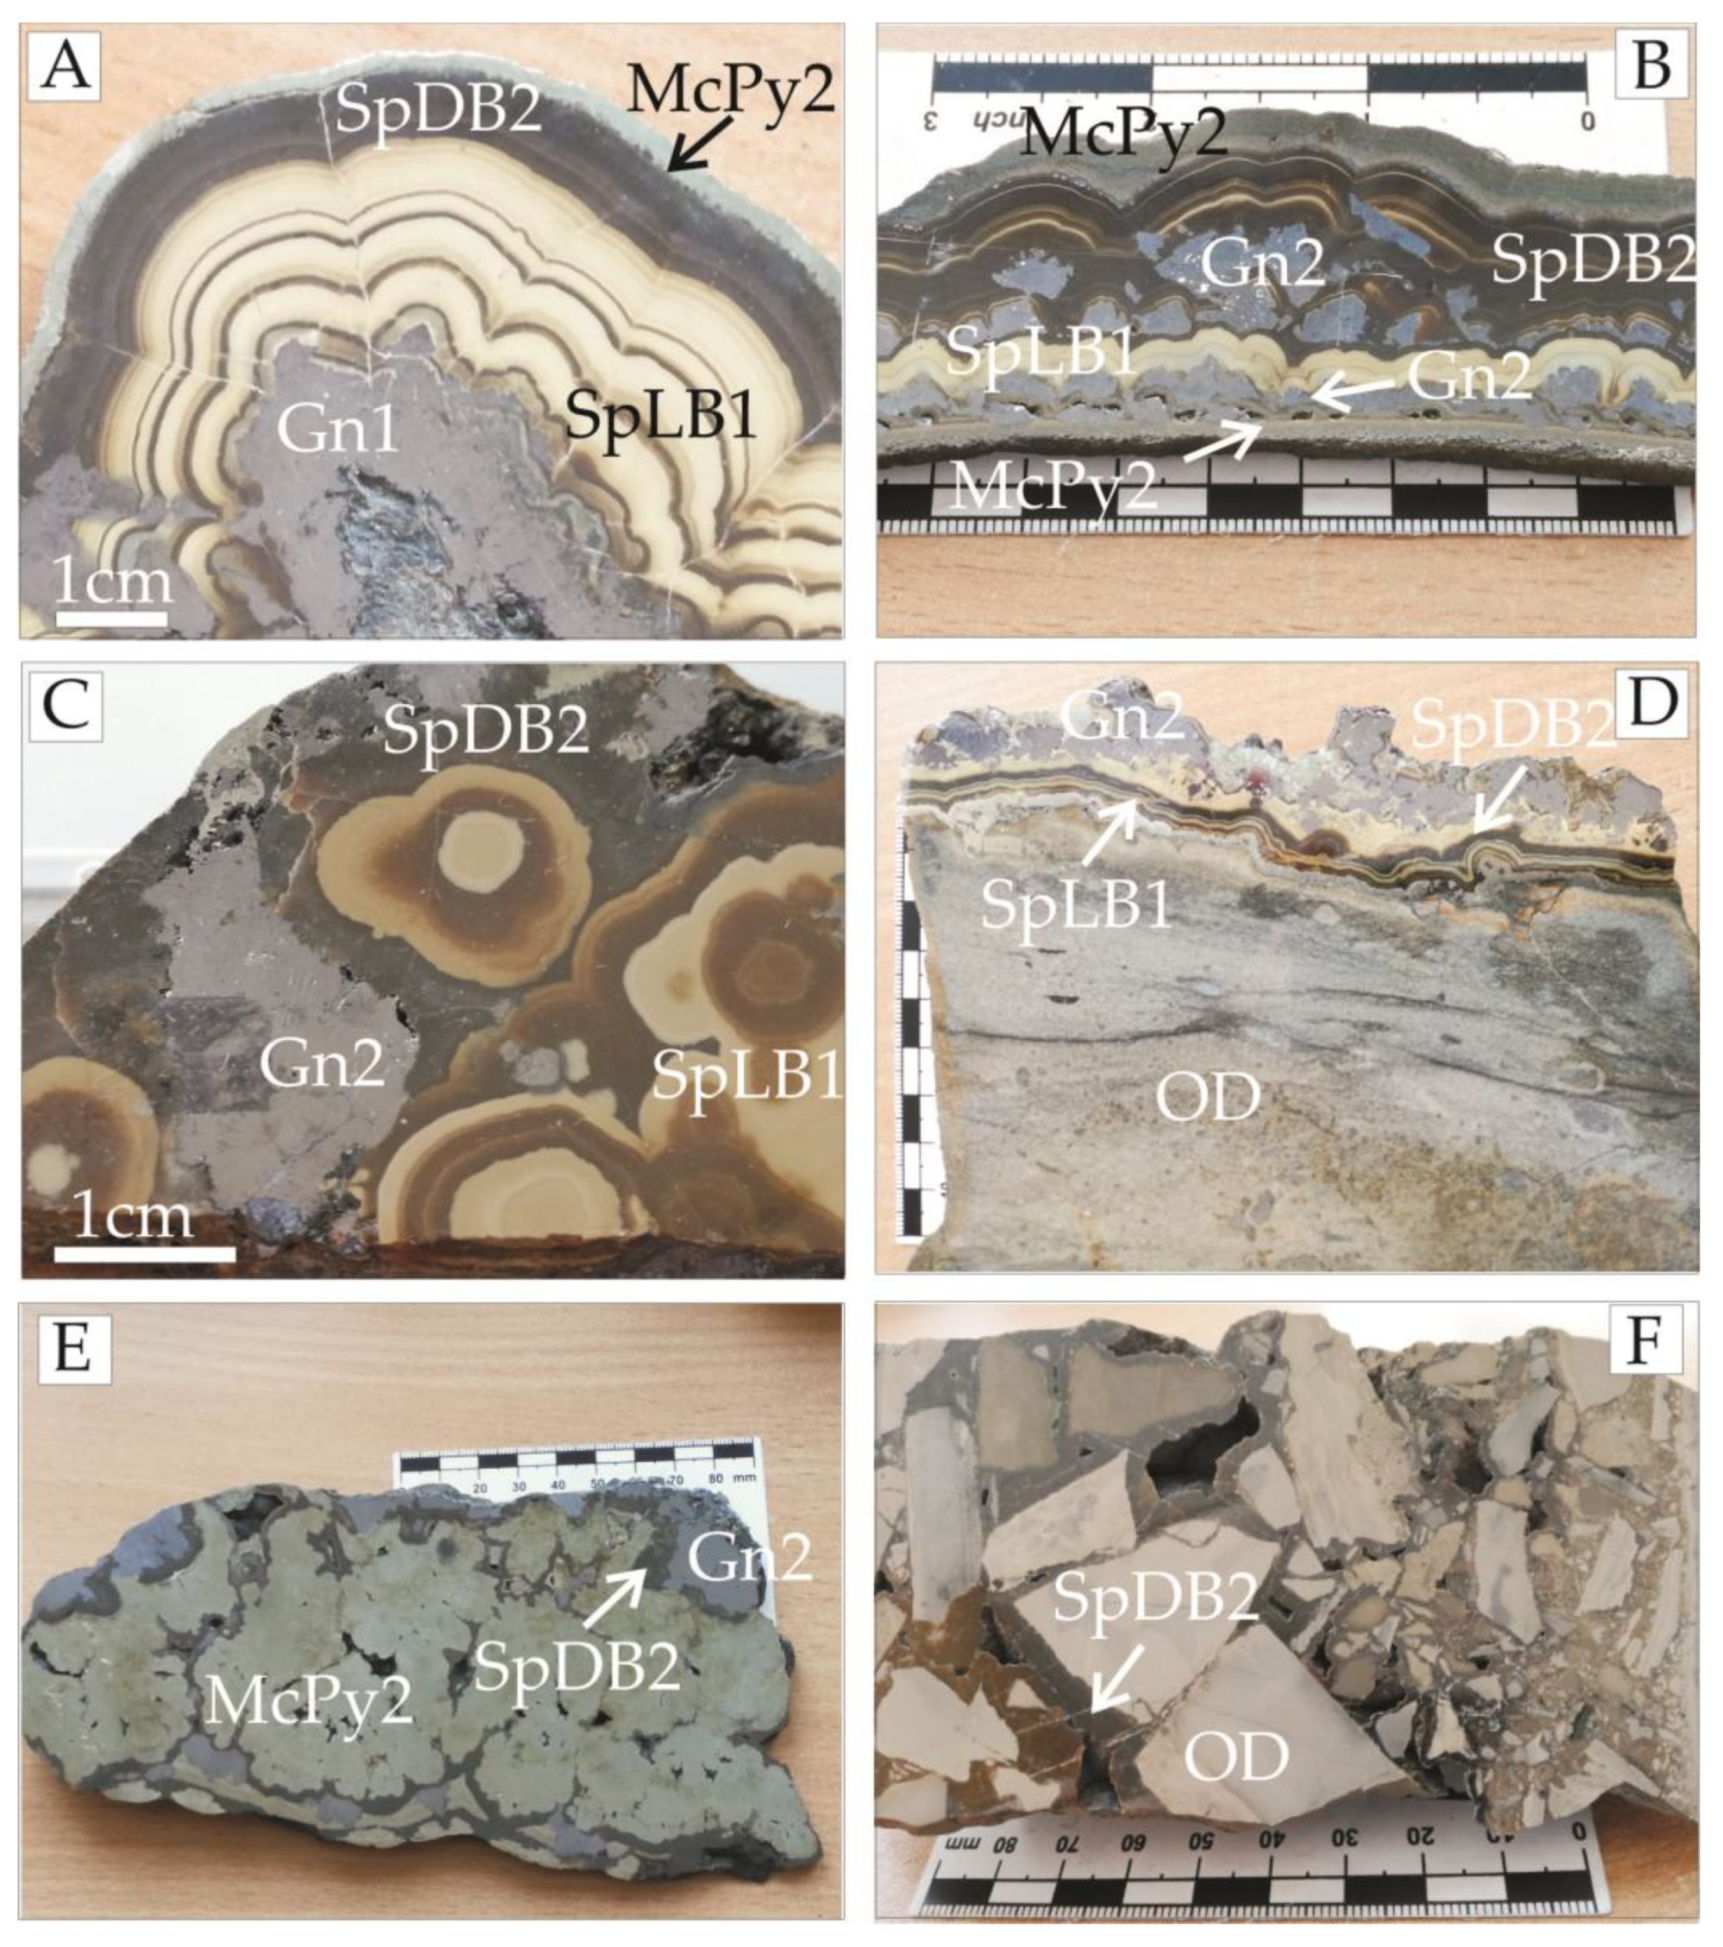
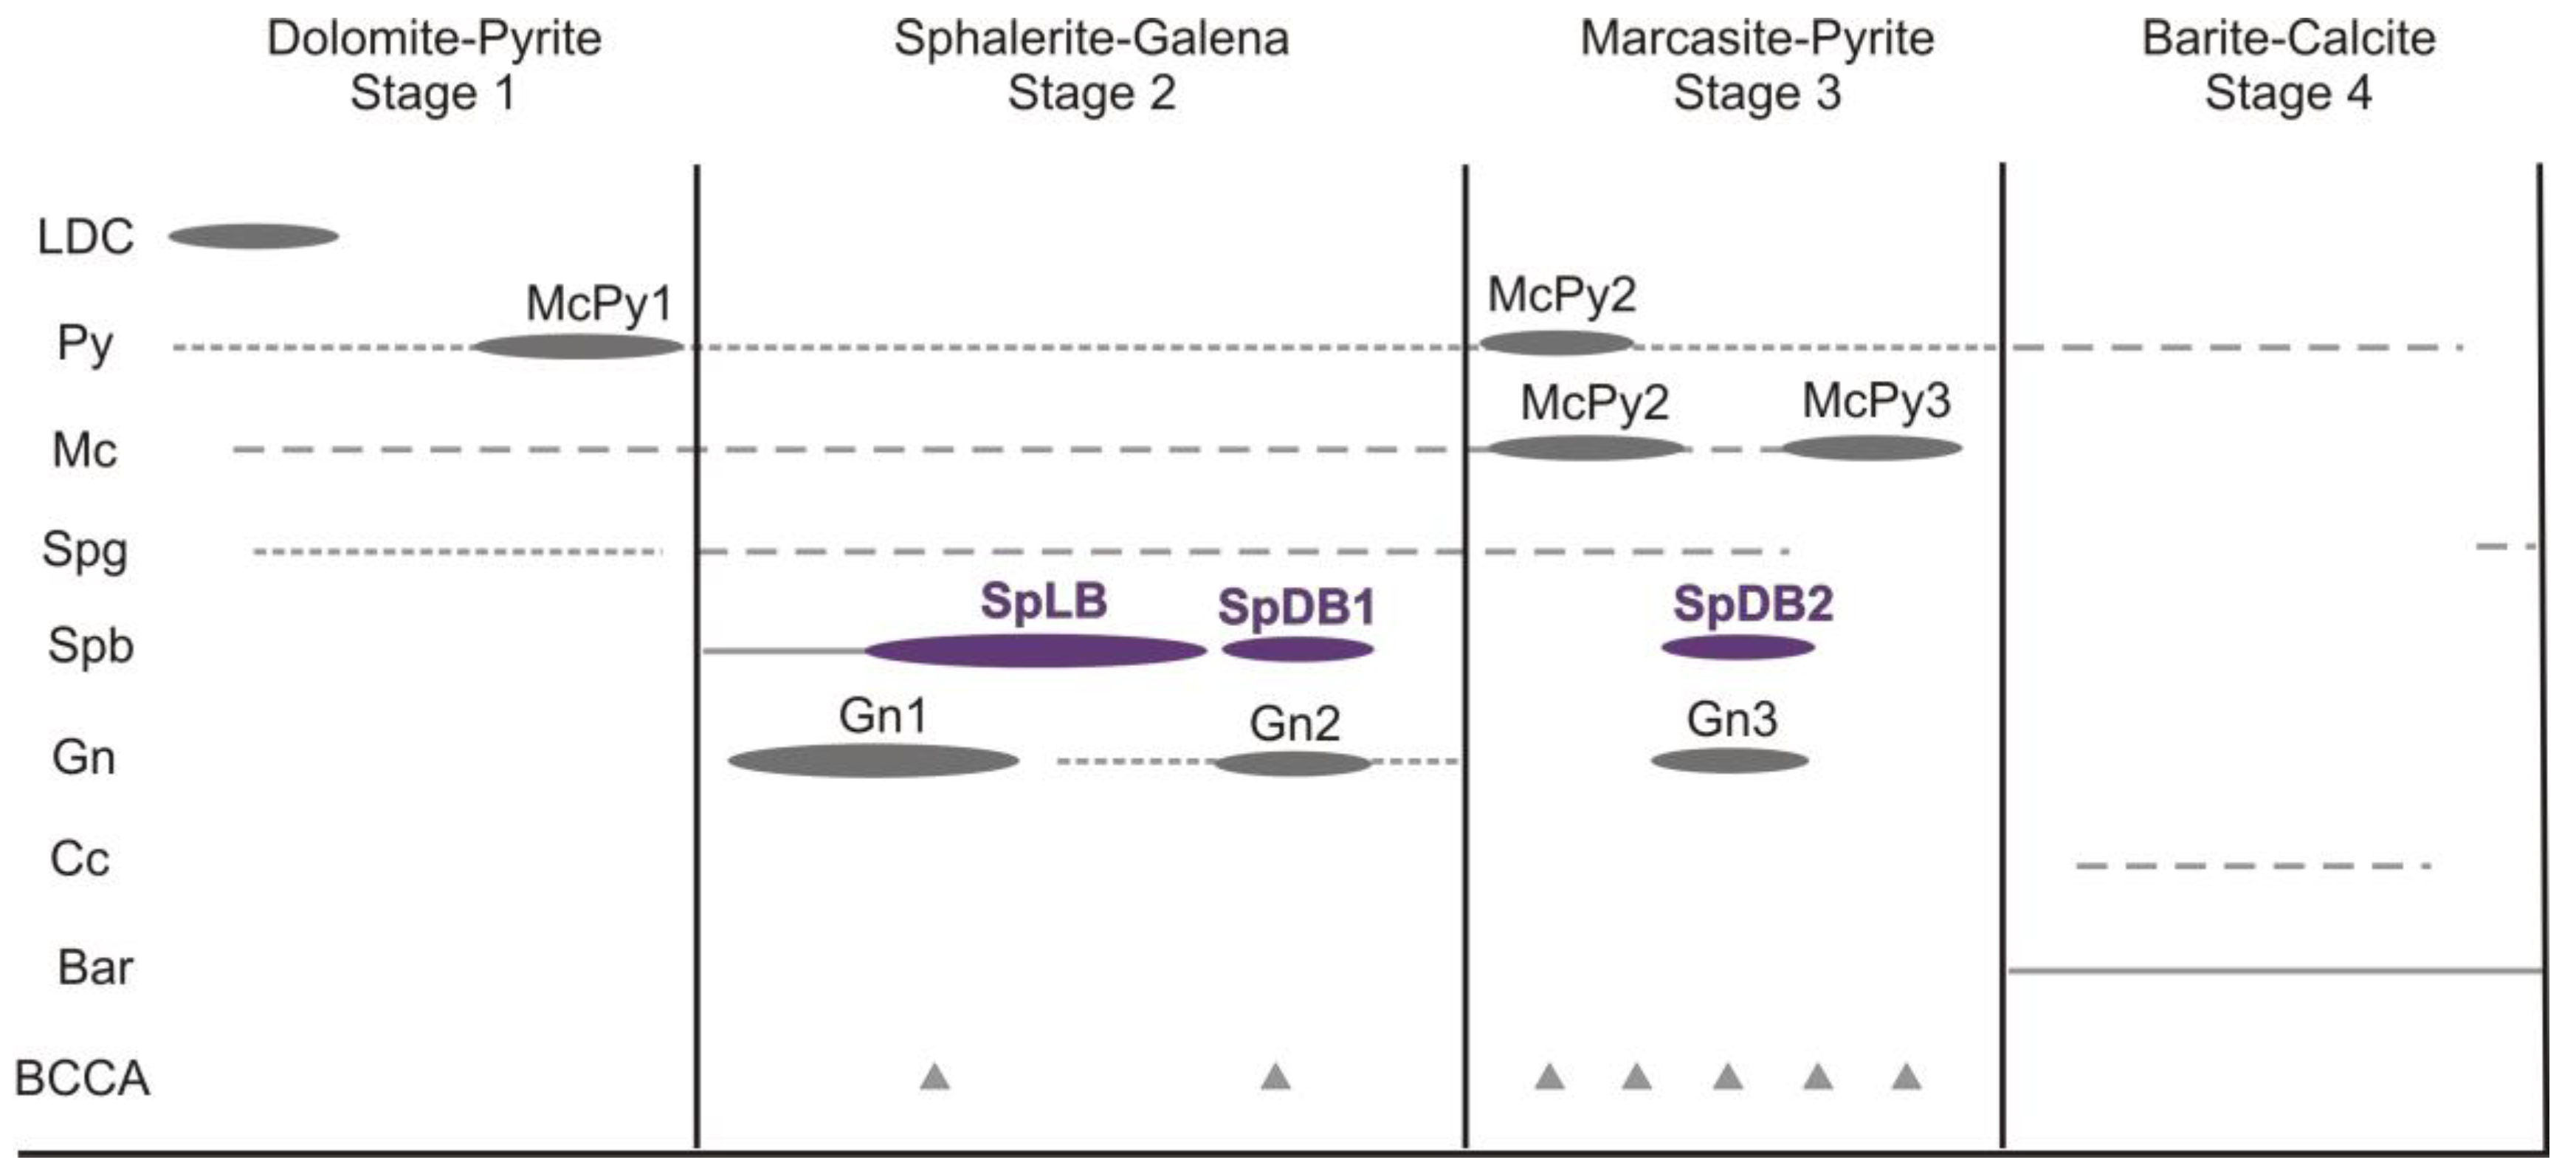
4.1.2. Results of Mineralogical Investigation
4.2. Cu-Ag Stratiform Deposit on the Fore-Sudetic Monocline
4.2.1. Results of Bulk-Rock Geochemical Investigation
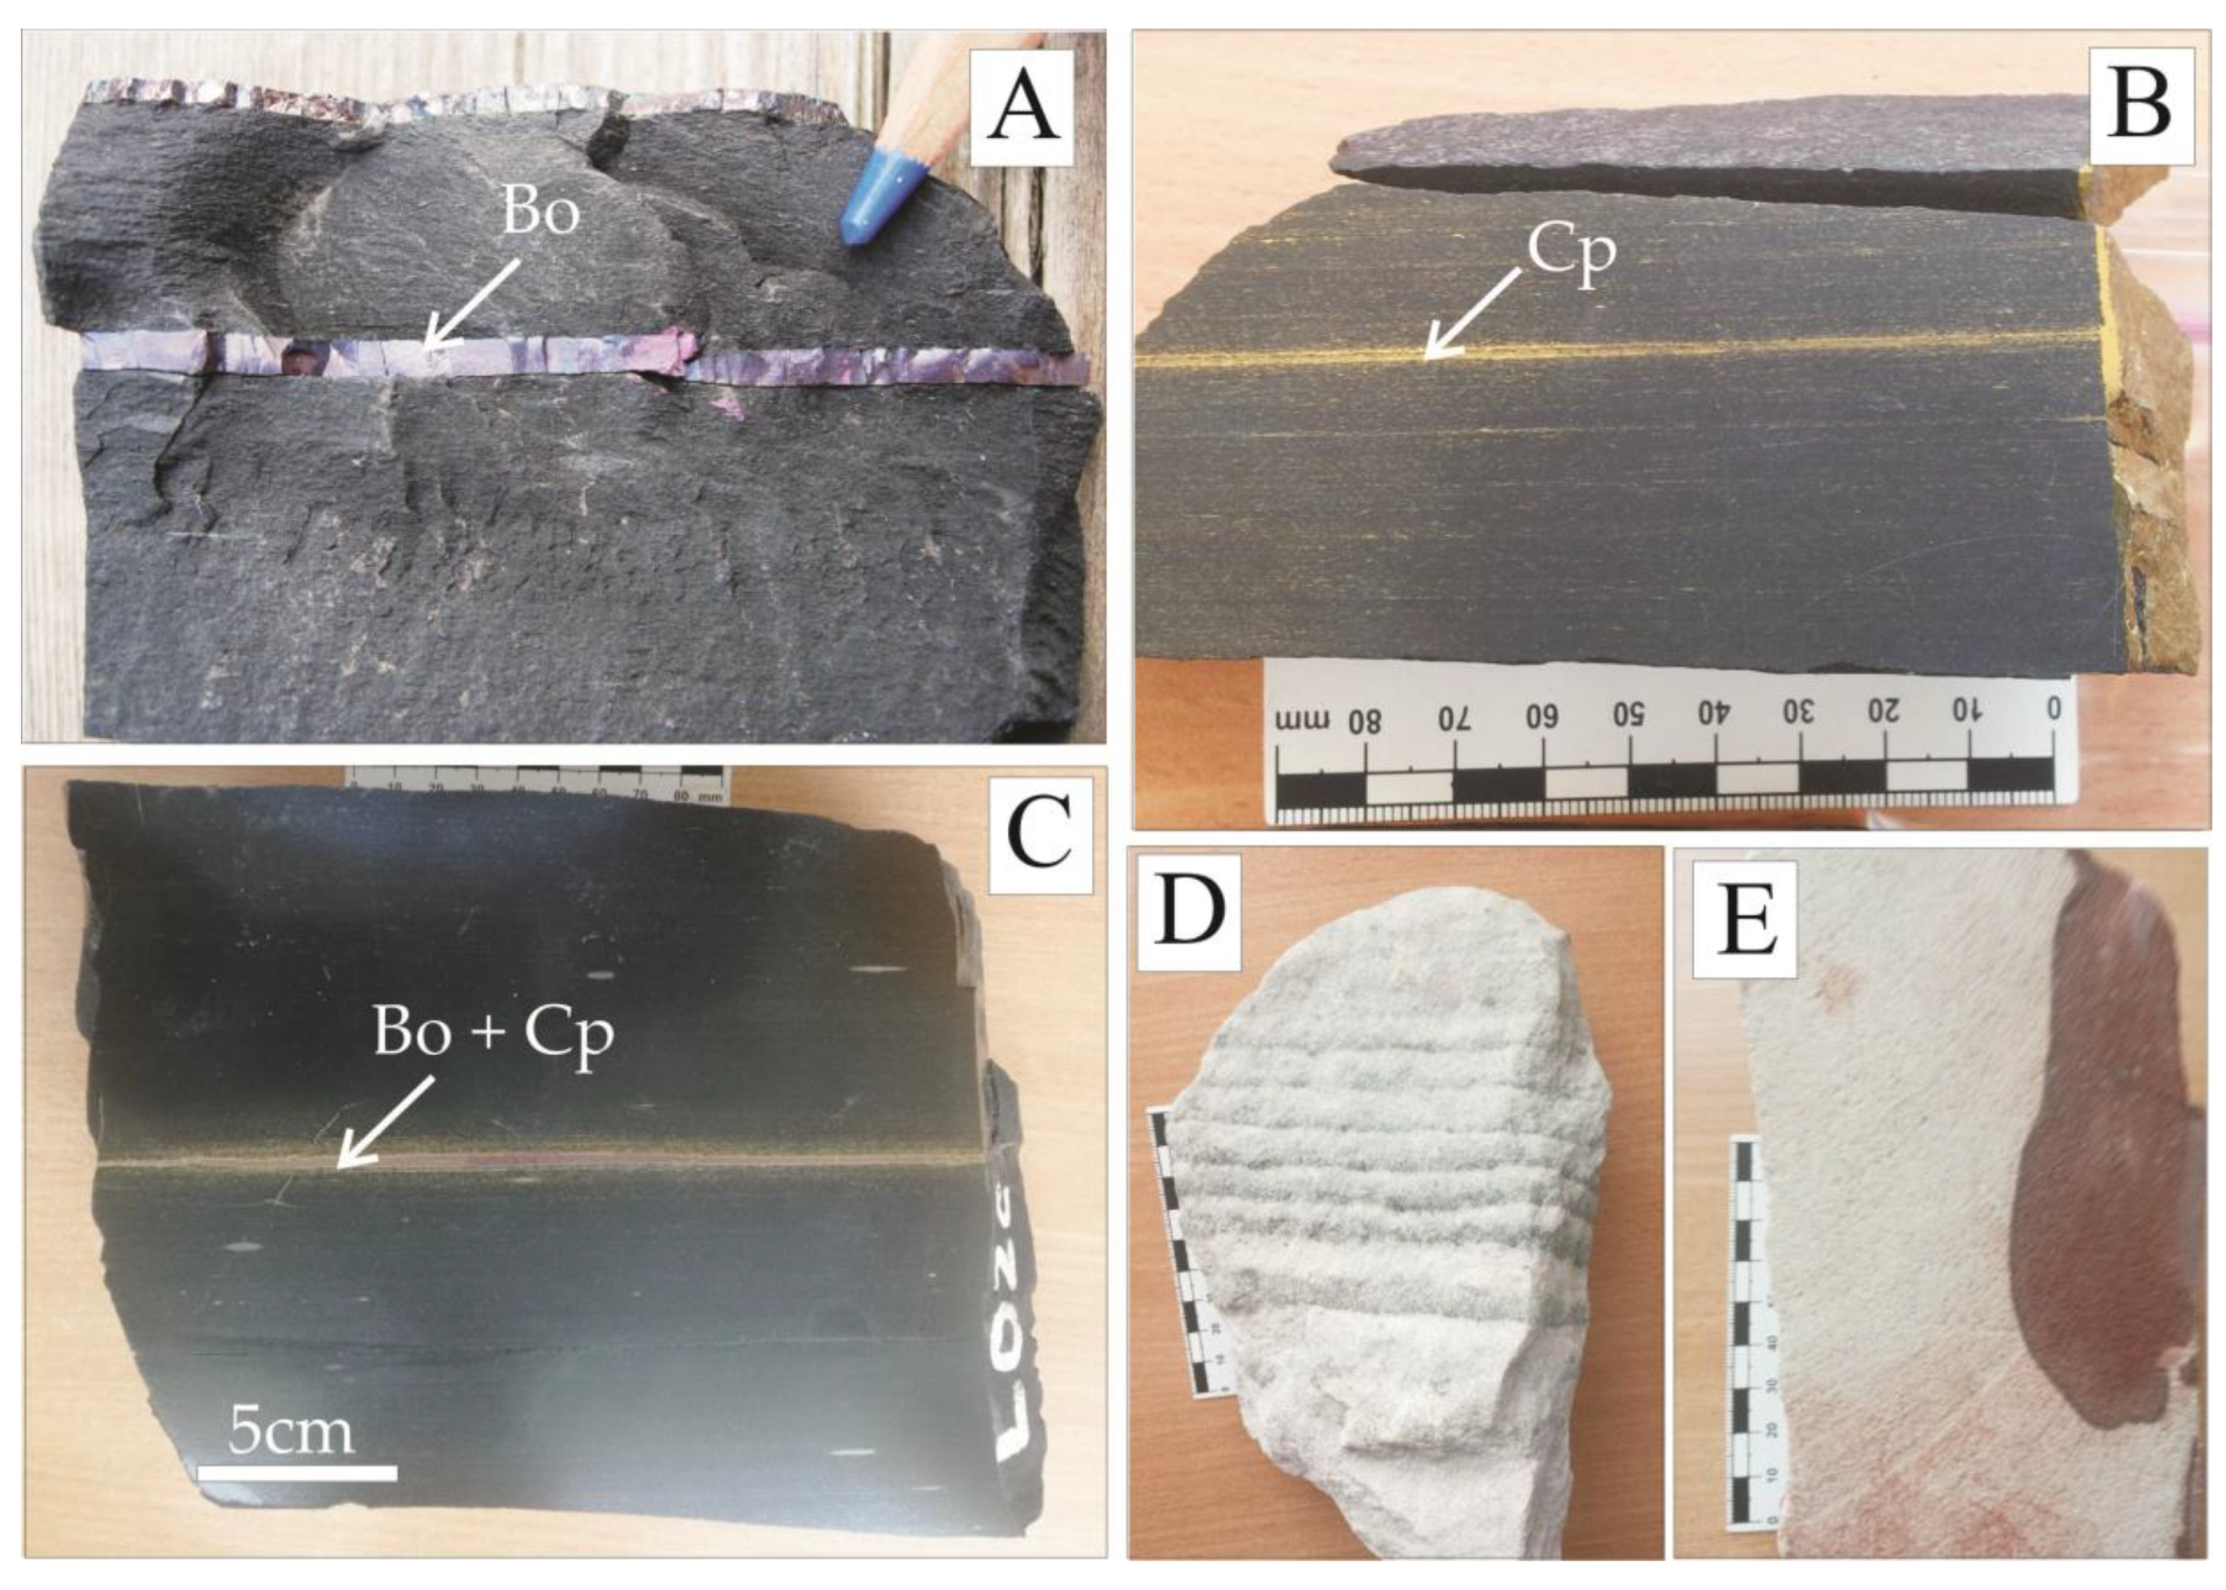
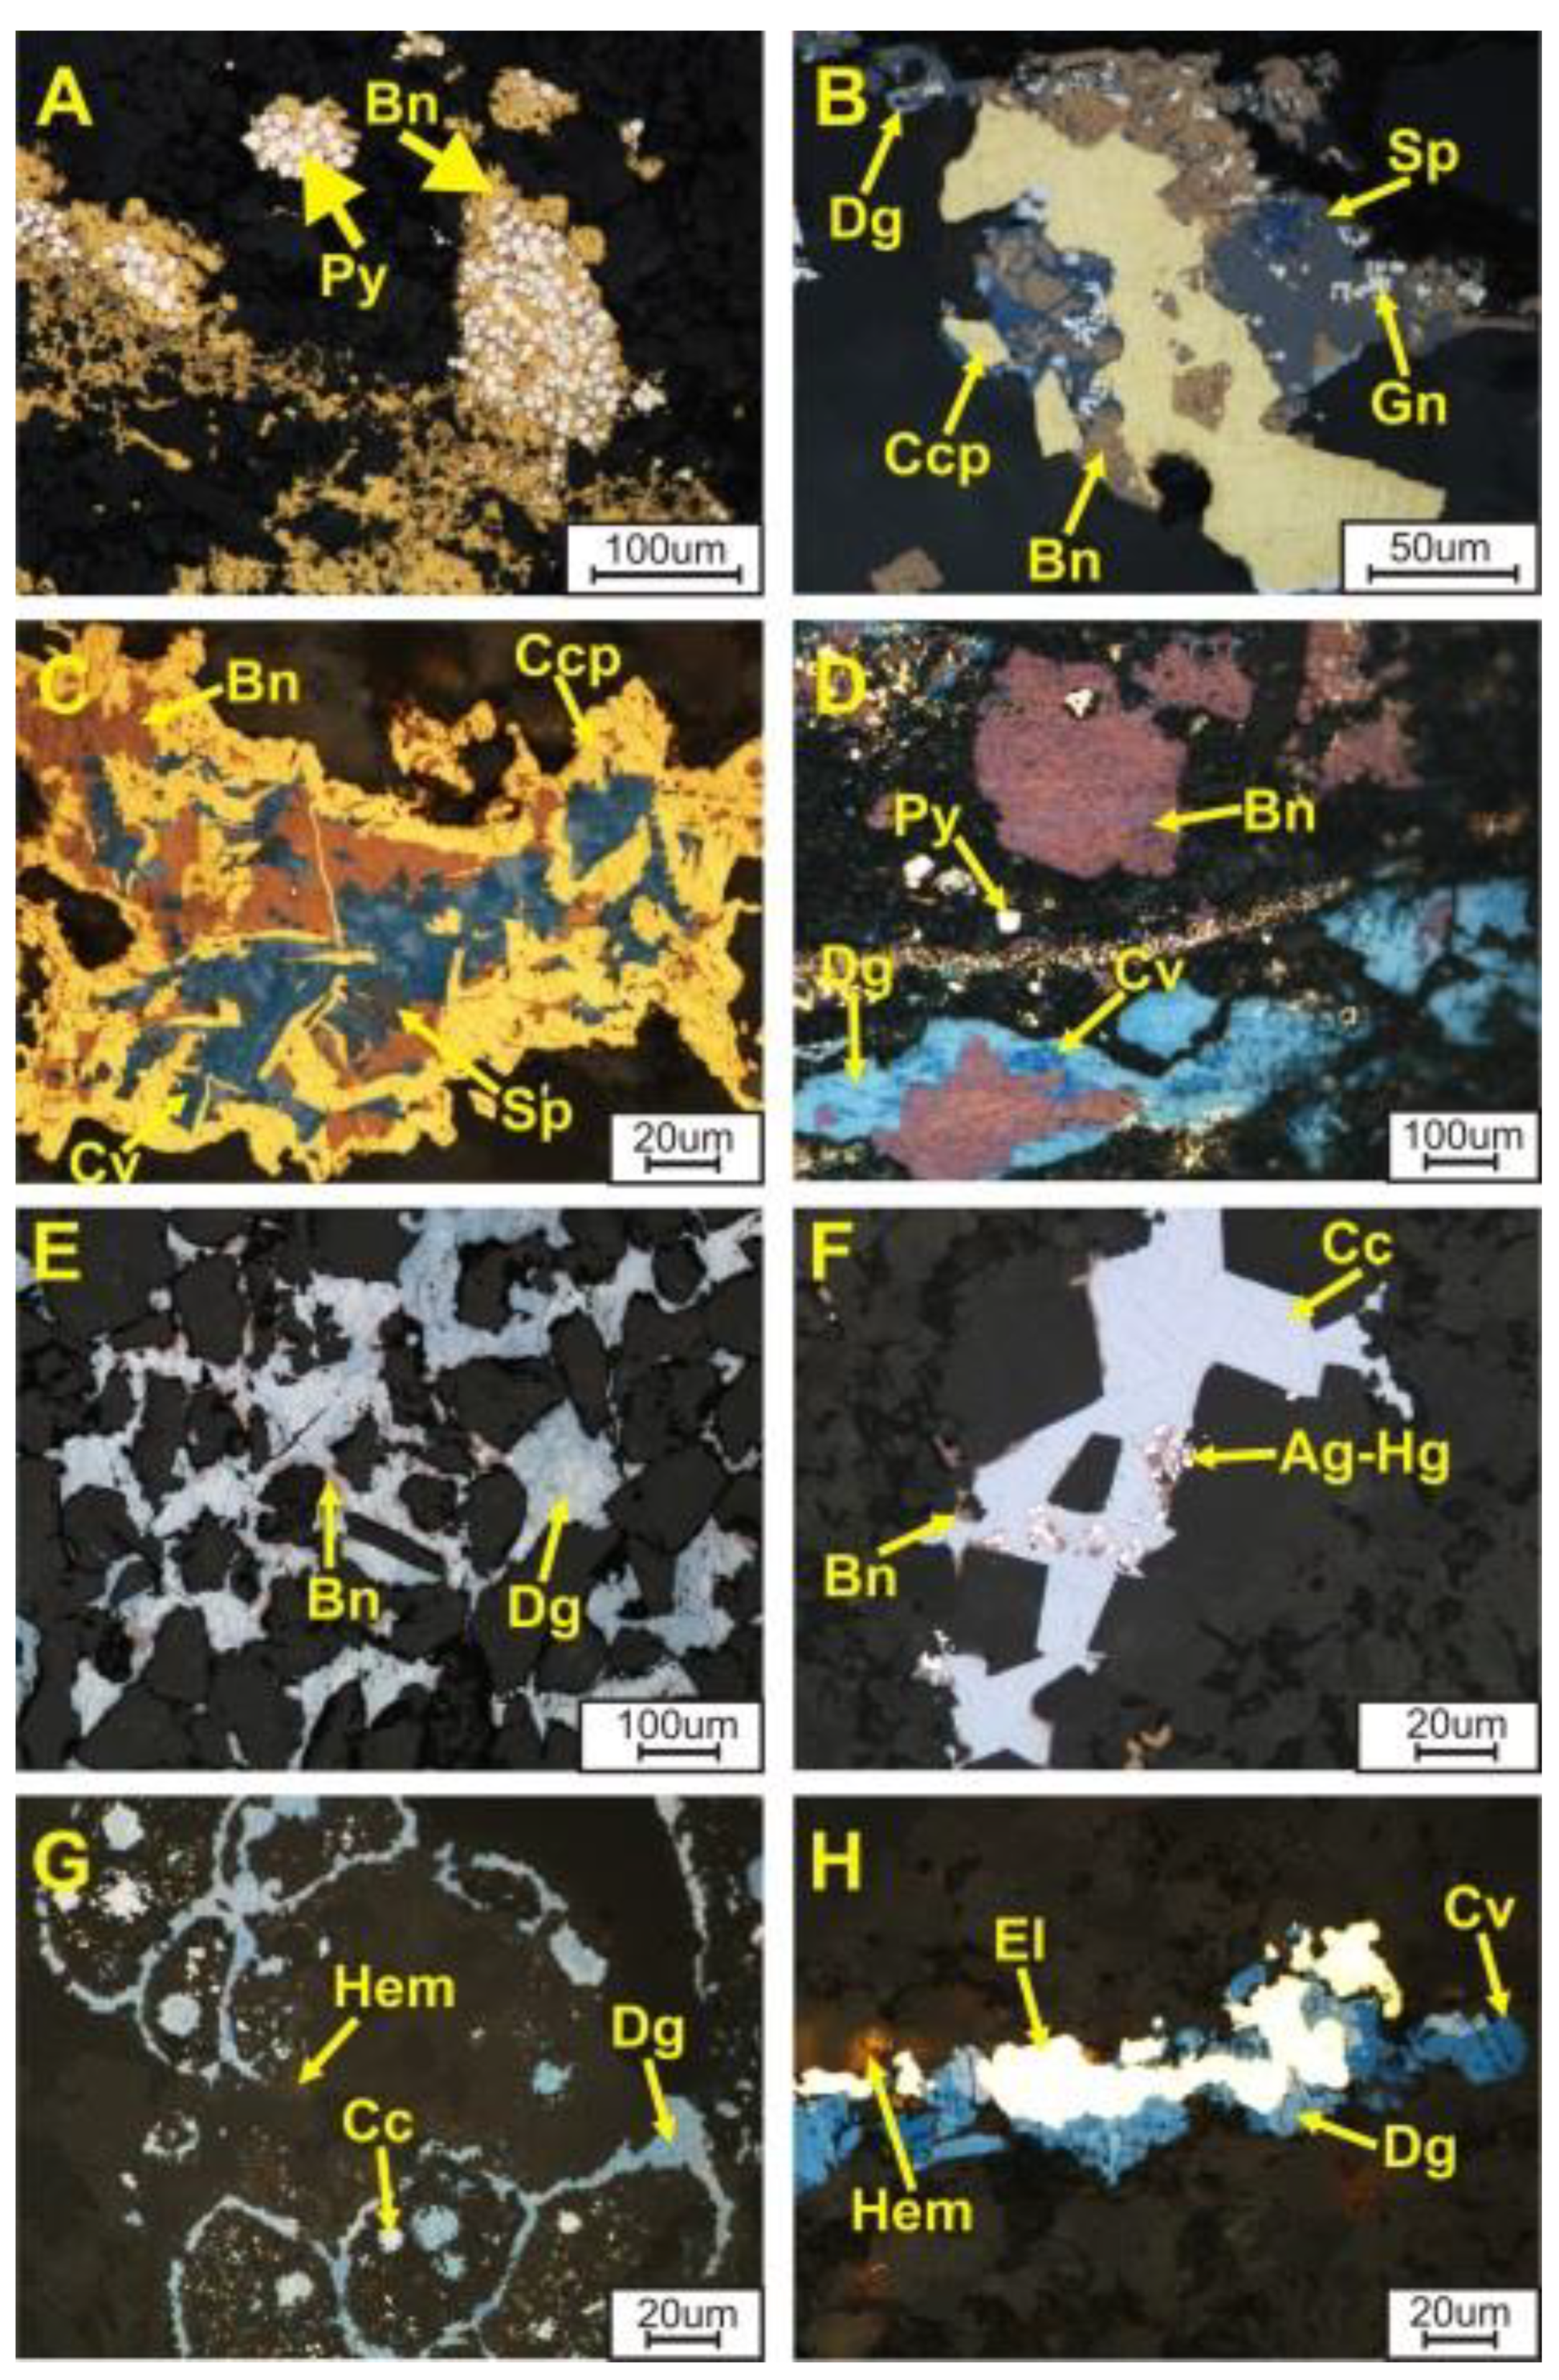
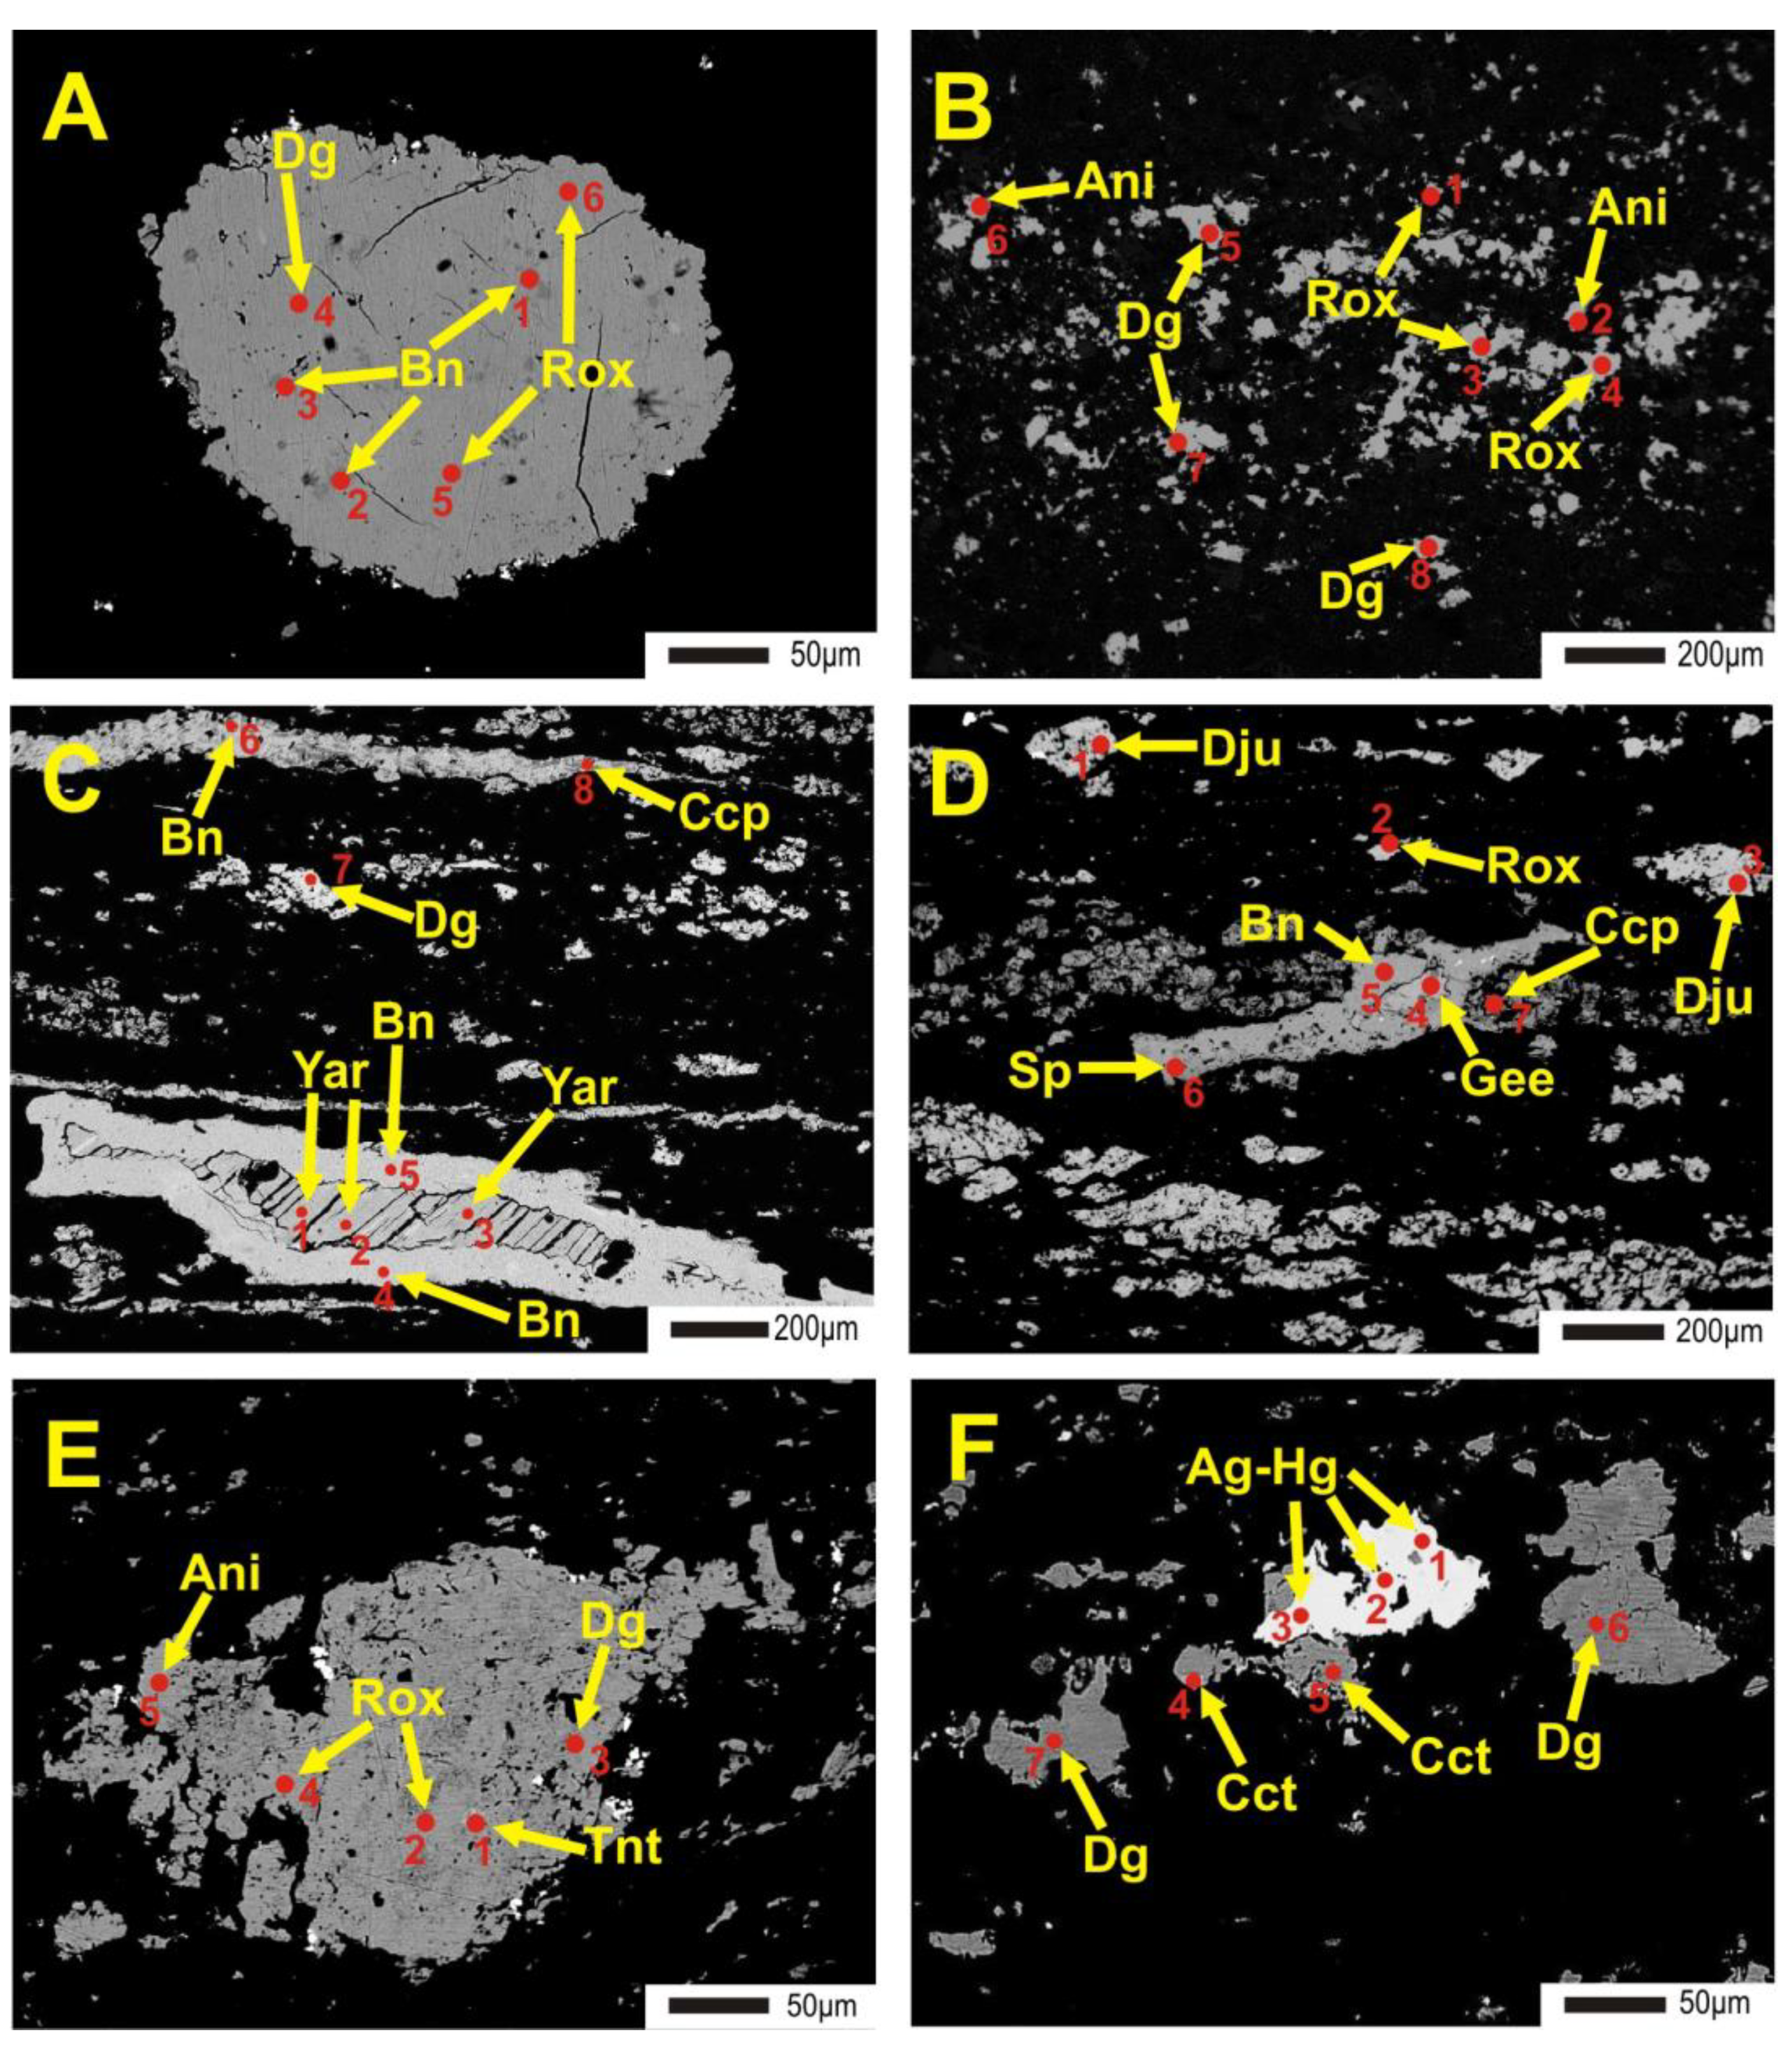
4.2.2. Results of Mineralogical Investigation
5. Discussion
5.1. Importance of Trace Element Distributions in Polish Sediment-Hosted Deposits as Resource for Critical Elements of the European Union
5.2. Genetic Implications for Trace Element Enrichment
6. Conclusions
Author Contributions
Funding
Acknowledgments
Conflicts of Interest
Appendix A

| Borehole | Zechstein Limestone (Ca1) | Kupferschiefer (T1) | Weissliegend (Ws) | |||
|---|---|---|---|---|---|---|
| Principal Ore Mineral | Associated Minerals | Principal Ore Mineral | Associated Minerals | Principal Ore Mineral | Associated Minerals | |
| S-389 | digenite | covellite, chalcocite, pyrite, hematite | covellite | digenite, hematite | - | - |
| S-391 | digenite | covellite, chalcocite, hematite, electrum, native gold | chalcocite | digenite, covellite, bornite, hematite | chalcocite | hematite, goethite |
| S-428 | digenite | covellite, bornite, electrum, native gold, hematite | chalcocite | hematite | chalcocite | hematite |
| S-115 | sphalerite | galena, pyrite, chalcopyrite | galena | chalcopyrite, sphalerite, pyrite | chalcopyrite | sphalerite, galena, pyrite, bornite |
| S-117 | chalcopyrite | bornite, sphalerite, covellite, galena | bornite | chalcopyrite, covellite, galena | bornite | covellite, sphalerite, galena, pyrite, chalcopyrite |
| S-303 | pyrite | galena, sphalerite, chalcopyrite | - | - | bornite | chalcopyrite, covellite, digenite, galena, pyrite |
| S-262 | digenite | chalcocite, bornite, pyrite | chalcocite | digenite, bornite, covellite, chalcopyrite, galena, sphalerite, pyrite | chalcocite | digenite, covellite, bornite, chalcopyrite, pyrite, Ag alloys |
| S-269 | bornite | chalcopyrite, covellite, digenite, galena, chalcocite | - | - | chalcopyrite | hematite, goethite |
| S-95 | chalcocite | digenite, chalcopyrite | digenite | chalcocite, Ag alloys | chalcocite | digenite, hematite |
| S-99 | digenite | chalcocite, covellite, bornite | chalcocite | digenite, bornite, covellite | - | - |
| S-192 | covellite | bornite, chalcopyrite, digenite | - | - | covellite | bornite, digenite, chalcocite, native Au, hematite |
| S-64 | digenite | chalcocite, covellite, bornite, electrum, native gold, hematite | digenite | covellite, chalcopyrite, electrum, hematite | chalcocite | covellite, hematite |
| S-65 | digenite | covellite | chalcocite | bornite, digenite | digenite | chalcocite, covellite, bornite, tennantite, electrum, Ag alloys |
| S-232 | chalcopyrite | galena, sphalerite, bornite, pyrite | - | - | galena | chalcopyrite, sphalerite, bornite |
| S-171 | chalcocite | digenite, covellite, bornite | - | - | chalcocite | digenite, covellite, Ag alloys |
| S-196 | digenite | chalcocite, covellite, bornite, chalcopyrite, galena | - | - | digenite | bornite, covellite, Ag alloys |
| S-209 | chalcopyrite | bornite, covellite, galena, sphalerite, pyrite | - | - | bornite | chalcopyrite, galena, covellite, sphalerite |
| S-39 | chalcopyrite | sphalerite, bornite | chalcocite | digenite, bornite, | hematite | goethite, chalcopyrite |
| S-137 | chalcocite | digenite, bornite | chalcocite | digenite, covellite, electrum, tiemannite, hematite | chalcocite | covellite, hematite |
| S-186 | digenite | bornite, covellite, chalcocite, chalcopyrite | digenite | bornite, covellite, chalcocite, chalcopyrite | chalcocite | digenite, covellite, galena, chalcopyrite, sphalerite |
References
- Malon, A.; Tymiński, M.; Mikulski, S.Z.; Oszczepalski, S. Metal resources. In The Balance of Mineral Resources in Poland as of 31.12.2018; Szuflicki, M., Malon, A., Tymiński, M., Eds.; Państwowy Instytut Geologiczny: Warszawa, Poland, 2019; pp. 51–68. (In Polish) [Google Scholar]
- Szuwarzyński, M. Ore bodies in the Silesia-Cracow Zn-Pb ore district, Poland. Pr. Państw. Inst. Geol. 1996, 154, 9–24. [Google Scholar]
- Górecka, E. Geological setting of the Silesian-Kraków Zn-Pb deposits. Geol. Q. 1993, 37, 127–146. [Google Scholar]
- Mikulski, S.Z.; Oszczepalski, S.; Sadłowska, K.; Chmielewski, A.; Małek, R. The occurrence of associated and critical elements in selected documented Zn-Pb, Cu-Ag, Fe-Ti-V, Mo-Cu-W, Sn, Au-As and Ni deposits in Poland. Biul. Państw. Inst. Geol. 2018, 472, 21–52. (In Polish) [Google Scholar] [CrossRef]
- Leach, D.L.; Sangster, D.F.; Kelley, K.D.; Large, R.R.; Garven, G.; Allen, C.R. Sediment-hosted Pb-Zn Deposits: A global perspective. Econ. Geol. 2005, 100, 561–608. [Google Scholar]
- Gruszczyk, H.; Wielgomas, L. Zinc and lead ores in the Silesia-Kraków Triassic. In Geology of Poland: Mineral Deposits; Osika, R., Ed.; Wydawnictwa Geologiczne: Warsaw, Poland, 1990; Volume 6, pp. 172–177. [Google Scholar]
- Communication from the Commission to the European Parliament, The Council. The European Economic and Social Committee and the Committee of the Regions on the 2017 List of Critical Raw Materials for the EU; European Commission: Brussels, Belgium, 2017; pp. 1–8. [Google Scholar]
- Moss, R.L.; Tzimas, E.; Kara, H.; Willis, P.; Kooroshy, J. Critical metals in strategic energy technologies. Assessing rare metals as Supply-chain bottlenecks in low-carbon energy technologies. In European Commission Joint Research Centre Institute for Energy and Transport; Publication Office of the European Union: Luxembourg, 2011; pp. 1–159. [Google Scholar]
- Weng, Z.; Jowitt, S.M.; Mudd, G.M.; Haque, N.A. Detailed Assessment of Global Rare Earth Resources: Opportunities and Challenges. Econ. Geol. 2015, 110, 1925–1952. [Google Scholar] [CrossRef]
- Werner, T.T.; Ciacci, L.; Mudd, G.M.; Reck, B.K.; Northey, S.A. Looking Down Under for a Circular Economy of Indium. Env. Sci. Technol. 2018, 52, 2055–2062. [Google Scholar] [CrossRef]
- Yellishetty, M.; Huston, D.; Graedel, T.; Werner, T.T.; Reck, B.K.; Mudd, G.M. Quantifying the Potential for Recoverable Resources of Gallium, Germanium and Antimony as Companion Metals in Australia. Ore Geol. Rev. 2017, 82, 148–159. [Google Scholar] [CrossRef]
- Mudd, G.M.; Werner, T.T.; Weng, Z.H.; Yellishetty, M.; Yuan, Y.; McAlpine, S.R.B.; Skirrow, R.; Czarnota, K. Critical Minerals in Australia: A review of opportunities and research needs. Geosci. Aust. Rec. 2018, 51, 1–29. [Google Scholar]
- Marsh, E.E.; Hitzman, M.W.; Leach, D.L. Critical Elements in Sediment-Hosted Deposits (Clastic-Dominated Zn-Pb-Ag, Mississippi Valley-Type Zn-Pb, Sedimentary Rock-Hosted Stratiform Cu, and Carbonate-Hosted Polymetallic Deposits): A Review. Rev. Econ. Geol. 2016, 18, 307–321. [Google Scholar]
- Paulo, A.; Strzelska-Smakowska, B. Non-Ferrous and Precious Metal Ores; Wyd. AGH: Kraków, Poland, 2000. (In Polish) [Google Scholar]
- Paulo, A.; Krzak, M. Rare Metals; Wyd. AGH: Kraków, Poland, 2015. (In Polish) [Google Scholar]
- Żaba, J. The structural evolution of Lower Palaeozoic succession in the Upper Silesia and Małopolska block border zone (Southern Poland). Pr. Państw. Inst. Geol. 1999, 166, 1–162. [Google Scholar]
- Żelaźniewicz, A.; Obec-Dziedzic, T.; Fanning, C.M.; Protas, A.; Muszyński, A. Late Carboniferous-Early Permian events in the Trans-European Suture Zone: Tectonic and acid magmatic evidence from Poland. Tectonophysics 2016, 675, 227–243. [Google Scholar] [CrossRef]
- Szamałek, K.; Szuflicki, M.; Malon, A.; Tymiński, M. (Eds.) Mineral Resources of Poland; Polish Geological Institute-National Research Institute: Warszawa, Poland, 2017. [Google Scholar]
- Szulc, J. Anisian—Carnian evolution of the Germanic basin and its eustatic, tectonic and climate controls. Zbl. Geol. Palaeontol. T.I.H 1999, 7–8, 813–852. [Google Scholar]
- Górecka, E.; Leach, D.L.; Kozłowski, A. (Eds.) Carbonate-Hosted Zinc-Lead Deposits in the Silesian-Cracow Area, Poland; Prace/Panstwowy Instytut Geologiczny: Warszawa, Poland, 1996. [Google Scholar]
- Leach, D.L.; Viets, J.G.; Kozłowski, A.; Kibitlewski, S. Geology, geochemistry, and Genesis of the Silesia-Kraków zinc-lead district, southern Poland. Soc. Econ. Geol. Spec. Publ. 1996, 4, 171–181. [Google Scholar]
- Sass-Gustkiewicz, M.; Dżułyński, S.; Ridge, J.D. The emplacement of zinc-lead sulfide ores in the Upper Silesian district—A contribution to the understanding of Mississippi Valley-type deposits. Econ. Geol. 1982, 77, 392–412. [Google Scholar] [CrossRef]
- Przeniosło, S. An outline of the metallogeny of zinc and lead ores in the Silesian-Cracovian region. In The Current Metallogenic Problems of Central Europe; Fedak, J., Ed.; Wydawnictwa Geologiczne: Warszawa, Poland, 1976; pp. 367–384. [Google Scholar]
- Mikulski, S.Z.; Strzelska-Smakowska, B.; Retman, W. The prospective and prognostic areas of zinc and lead ores in the Upper Silesia Zn-Pb Ore District. Gospod. Surowcami Miner. Resour. Manag. 2013, 29, 173–191. [Google Scholar]
- Mikulski, S.Z.; Nowacki, Ł.; Sadłowska, K.; Ostrowski, S.; Bąk, T.; Pacanowski, G.; Lasocki, M. Modern prospecting for zinc and lead ores of the MVT near Siewierz in the Upper Silesia Zn-Pb Ore District in the southern Poland. In Proceedings of the 14th SGA Biennial Meeting, Quebec City, PQ, Canada, 20–23 August 2017; Volume 2, pp. 681–684. [Google Scholar]
- Leach, D.L.; Viets, J.G.; Powell, J.W. Textures of ores from the Silesian-Kraków zinc-lead deposits, Poland: Clues to the ore-forming environment. Pr. Inst. Geol. 1996, 154, 37–50. [Google Scholar]
- Sass-Gustkiewicz, M. Revised and completed paragenetic order of minerals on the Pomorzany lead-zinc deposit, Upper Silesian region, Poland. Miner. Pol. 1997, 28, 46–80. [Google Scholar]
- Viets, J.G.; Leach, D.I.; Lichte, F.E.; Hopkins, R.T.; Gent, C.A.; Powell, J.W. Paragenetic and minor- and trace-element studies of Mississippi Valley-type ore deposits of the Silesia-Cracow district, Poland. Pr. Państw. Inst. Geol. 1996, 154, 51–70. [Google Scholar]
- Harańczyk, C. Geochemistry of the ore minerals from Silesia-Cracow zinc and lead deposits. Pr. Geol. 1965, 30, 1–111. [Google Scholar]
- Kozłowski, A.; Górecka, E. Sphalerite origin in the Olkusz mining district: A fluid inclusion model. Geol. Q. 1993, 37, 291–306. [Google Scholar]
- Heijlen, W.; Muchez, P.; Banks, D.A.; Schneider, J.; Kucha, H.; Keppens, E. Carbonate-hosted Zn-Pb deposits in Upper Silesia, Poland: Origin and evolution mineralizing fluids and constrains on genetic models. Econ. Geol. 2003, 98, 911–932. [Google Scholar] [CrossRef]
- Sass-Gustkiewicz, M.; Kwiecińska, B. Organic master in the Upper Silesian (Mississippi Valley-type) Zn-Pb deposits, Poland. Econ. Geol. 1999, 94, 981–992. [Google Scholar] [CrossRef]
- Wodzicki, A. Origin of the Cracovian-Silesian Zn-Pb deposits. Ann. Soc. Geol. Pol. 1987, 57, 3–36. [Google Scholar]
- Sass-Gustkiewicz, M. Internal sediments as a key to understanding the hydrothermal karst origin of the Upper Silesian Zn-Pb ore deposits. Soc. Econ. Geol. Spec. Publ. 1996, 4, 171–181. [Google Scholar]
- Kozłowski, A.; Leach, D.L.; Viets, J.G. Genetic characteristics of fluid inclusions in sphalerite from the Silesian-Kraków ores, Poland. Pr. Państw. Inst. Geol. 1996, 154, 73–83. [Google Scholar]
- Church, S.E.; Vaughn, R.B.; Gent, C.A.; Hopkins, R.T. Lead-isotopic, sulphur-isotopic and trace-elements studies of galena from the Silesian-Cracow Zn-Pb ores, polymetallic veins from the Góry Świętokrzyskie Mts. and the Myszków porphyry copper deposit, Poland. Pr. Państw. Inst. Geol. 1996, 154, 139–156. [Google Scholar]
- Coppola, V.; Boni, M.; Gilg, A.; Strzelska-Smakowska, B. Non-sulfide zinc deposits in the Silesia-Cracow district, Southern Poland. Miner. Depos. 2009, 44, 559–580. [Google Scholar] [CrossRef]
- Sass-Gustkiewicz, M. Ore-forming processes in the Upper Silesian Zn-Pb ore deposits. In Proceedings of the Fore-Sudetic Cu-Ag ore deposits & Upper Silesia Zn-Pb Ore Deposits, Post Conference Field Trip 7 Guide—Poland, Kraków, Poland, 20–23 August 2007; pp. 77–97. [Google Scholar]
- Symmons, D.T.A.; Sangster, D.F.; Leach, D.A. Teritary age from paleomagnetism for the Mississippi Valley-type zinc-lead mineralization in Upper Silesia. Econ. Geol. 1995, 90, 782–794. [Google Scholar] [CrossRef]
- Doornenbal, J.C.; Stevenson, A.G. Petroleum Geological Atlas of the Southern Permian Basin Area; EAGE Publications: Houten, The Netherlands, 2010. [Google Scholar]
- Oszczepalski, S. Kupferschiefer in southwestern Poland: Sedimentary environments, metal zoning, and ore controls. In Sediment-Hosted Stratiform Copper Deposits; Boyle, R.W., Brown, A.C., Jowett, E.C., Kirkham, R.V., Eds.; Geological Association of Canada Special Paper 36; Geological Association of Canada: Ottawa, ON, Canada, 1989; pp. 571–600. [Google Scholar]
- Peryt, T.; Durakiewicz, T.; Kotarba, M.J.; Oszczepalski, S.; Peryt, D. Carbon isotope stratigraphy of the basal Zechstein (Lopingian) strata in Northern Poland and its global correlation. Geol. Q. 2012, 56, 285–298. [Google Scholar] [CrossRef] [Green Version]
- Jowett, E.C.; Pearce, G.W.; Rydzewski, A. A Mid-Triassic paleomagnetic age of the Kupferschiefer mineralization in Poland based on a revised apparent polar wander path for Europe and Russia. J. Geophys. Res. 1987, 92, 581–598. [Google Scholar] [CrossRef]
- Nawrocki, J. Clay mineralogy, crystallinity, and K-Ar ages of illites within the Polish Zechstein Basin: Implications for the age of Kupferschiefer mineralization—A discussion. Econ. Geol. 2000, 95, 241–242. [Google Scholar] [CrossRef]
- Mikulski, S.Z.; Stein, H.J. Re-Os age of a chalcopyrite sample from the Lubin Cu-Ag mine, Kupferschiefer, SW Poland. Geochim. Cosmochim. Acta 2010, 74, A708. [Google Scholar]
- Mikulski, S.Z.; Stein, H.J. Re-Os ages for Ag-bearing Cu sulfide ores from the Kupferschiefer in Poland. In Mineral Resources in a Sustainable World, Proceedings of the 13th Biennial SGA Meeting, Nancy, France, 24–27 August 2015; Andre-Mayer, A.S., Cathelineau, M., Muchez, P., Pirard, E., Sindern, S., Eds.; Université de Lorraine: Nancy, France, 2015; Volume 2, pp. 607–610. [Google Scholar]
- Bechtel, A.; Elliott, W.C.; Wampler, J.M.; Oszczepalski, S. Clay mineralogy, crystallinity, and K-Ar ages of illites within the Polish Zechstein basin: Implications for the age of Kupferschiefer mineralization. Econ. Geol. 1999, 94, 261–272. [Google Scholar] [CrossRef]
- Michalik, M. Diagenesis of the Weissliegend sandstones in the south-western margin of the Polish Rotliegend basin. Pr. Miner. 2001, 91, 3–171. [Google Scholar]
- Michalik, M.; Sawłowicz, Z. Multi-stage and long term origin of the Kupferschiefer copper deposits in Poland. In Mineral Deposits at the Beginning of the 21st Century; Piestrzyński, A., Speczik, S., Pasava, J., Gize, A., Sass-Gustkiewicz, M., Leach, D., Muchez, P., Oszczepalski, S., Brown, A., Blundell, D.J., et al., Eds.; Balkema: Rotterdam, The Netherlands, 2001; pp. 235–238. [Google Scholar]
- Pašava, J.; Oszczepalski, S.; Du, A.D. Re–Os age of non-mineralized black shale from the Kupferschiefer, Poland, and implications for metal enrichment. Miner. Depos. 2010, 45, 189–199. [Google Scholar] [CrossRef]
- Alderton, D.; Selby, D.; Kucha, H.; Blundell, D. A multistage origin for Kupferschiefer mineralization. Ore Geol. Rev. 2016, 79, 535–543. [Google Scholar] [CrossRef] [Green Version]
- Rydzewski, A. Petrographic and Mineralogical Characteristics of Lower Zechstein Deposits in the Area of the Lubin-Sieroszowice Copper Deposit; Wyd. Geol.: Warszawa, Poland, 1964; pp. 59–84. (In Polish) [Google Scholar]
- Oszczepalski, S. Origin of the Kupferschiefer polymetallic mineralization in Poland. Miner. Depos. 1999, 34, 599–613. [Google Scholar] [CrossRef]
- Kucha, H. Geology, mineralogy and geochemistry of the Kupferschiefer, Poland. In Europe’s Major Base Metal Deposits; Kelly, J.G., Andrew, C.J., Ashton, J.H., Boland, M.B., Earls, G., Fusciardi, L., Stanley, T.G., Eds.; Irish Association for Economic Geology: Dublin, Ireland, 2014; pp. 215–238. [Google Scholar]
- Harańczyk, C. Ore mineralization of the Lower Zechstein reducing sediments of the Fore-Sudetic Monocline. Arch. Mine. 1972, 30, 13–171. (In Polish) [Google Scholar]
- Mayer, W.; Piestrzyński, A. Ore minerals from Lower Zechstein sediments at Rudna mine, Fore-Sudetic monocline, SW Poland. Prace Miner. 1985, 75, 1–72. [Google Scholar]
- Sawłowicz, Z. Primary copper sulfides from the Kupferschiefer, Poland. Miner. Depos. 1990, 25, 262–271. [Google Scholar] [CrossRef]
- Piestrzyński, A. Ore mineralization. In Monography of KGHM Polska Miedź SA, 2nd ed.; Piestrzyński, A., Banaszak, A.M., Zaleska-Kuczmierczyk, M., Eds.; Allexim sp.z o.o.: Wrocław, Poland, 2007; pp. 167–197. (In Polish) [Google Scholar]
- Pieczonka, J. Factors Controlling Distribution of Ore Minerals within Copper Deposit, Fore-Sudetic Monocline, SW Poland; Wyd. AGH: Kraków, Poland, 2011; pp. 1–195. (In Polish) [Google Scholar]
- Piestrzyński, A.; Salamon, W. Perspectives of silver bearing capacity of the eastern part of copper deposits in the Fore-Sudetic Monocline. Gosp. Sur. Min. 1986, 2, 469–481. [Google Scholar]
- Piestrzyński, A.; Tylka, W. Silver amalgams from the Sieroszowice copper mine, Lubin-Sieroszowice district, SW Poland. Min. Pol. 1992, 23, 17–25. [Google Scholar]
- Kucha, H.; Sawłowicz, Z. Geochemical and mineralogical characteristic of elements associating copper in the western part of Lubin mine. Zesz. Nauk. AGH Geol. 1980, 3, 53–70. (In Polish) [Google Scholar]
- Kijewski, P.; Jarosz, J. Metallic mineralization and forms of occurrence of accompanying elements in the copper ore deposit. In The Associated Metals in the Copper Ore Deposit—State of Research and Prospects for Their Further Use; Kijewski, P., Ed.; Cuprum: Wrocław, Poland, 1987; pp. 21–47. (In Polish) [Google Scholar]
- Kucha, H. Geochemistry of the Kupferschiefer, Poland. Geol. Rundsch. 1990, 79, 387–399. [Google Scholar] [CrossRef]
- Banaś, M.; Kijewski, P.; Salamon, W.; Pieczonka, J.; Piestrzyński, A. Associated elements in the copper ore deposit. In Monography of KGHM Polska Miedź SA, 2nd ed.; Piestrzyński, A., Banaszak, A., Zaleska-Kuczmierczyk, M., Eds.; Allexim sp.zo.o.: Wrocław, Poland, 2007; pp. 214–228. (In Polish) [Google Scholar]
- Idzikowski, A.; Wojciechowska, J. Balance of accompanying elements during ore processing. Pr. Nauk. ICHNiMPR 1971, 8, 3–64. (In Polish) [Google Scholar]
- Salamon, W. Ag and Mo in the Zechstein rocks of the Fore-Sudetic Monocline. Pr. Min. PAN 1979, 65. (In Polish) [Google Scholar]
- Rahfeld, A.; Wiehl, N.; Dressler, S.; Möckel, R.; Gutzmer, J. Major and trace element geochemistry of the European Kupferschiefer—An evaluation of analytical techniques. Geochemistry 2018, 18, 132–141. [Google Scholar] [CrossRef]
- Wood, M.D.; Beresford, N.A.; Copplestone, D. Limit of detection values in data analysis: Do they matter? Radioprotection 2011, 46, S85–S90. [Google Scholar] [CrossRef] [Green Version]
- McDonough, W.F.; Sun, S.S. The composition of the Earth. Chem. Geol. 1995, 120, 223–253. [Google Scholar] [CrossRef]
- Frenzel, M.; Hirsch, T.; Gutzmer, J. Gallium, germanium, indium, and other trace and minor elements in sphalerite as a function of deposit type—A meta-analysis. Ore Geol. Rev. 2016, 76, 52–78. [Google Scholar] [CrossRef]
- Belissont, R.; Boiron, M.C.; Luais, B.; Cathelineau, M. LA-ICP-MS analyses of minor and trace elements and bulk Ge isotopes in zoned Ge-rich sphalerites from the Noailhac–Saint-Salvy deposit (France): Insights into incorporation mechanisms and ore deposition processes. Geochim. Cosmochim. Acta 2014, 126, 518–540. [Google Scholar] [CrossRef]
- Johan, Z. Indium and germanium in the structure of sphalerite: An example of coupled substitution with copper. Mineral. Petrol. 1988, 39, 211–229. [Google Scholar] [CrossRef]
- Sahlstöm, F.; Arribas, A.; Dirks, P.; Corral, I.; Chang, Z. Mineralogical distribution of germanium, gallium and indium at the Mt Carlton high-sulfidation epithermal deposit, NE Australia, and Comparison with similar deposits worldwide. Minerals 2017, 7, 213. [Google Scholar] [CrossRef] [Green Version]
- Cook, N.J.; Ciobanu, C.L.; Pring, A.; Skinner, W.; Shimizu, M.; Danyushevsky, L.; Saint-Eidukat, B.; Melcher, F. Trace and minor elements in sphalerite: A LA-ICPMS study. Geochim. Cosmochim. Acta 2009, 73, 4761–4791. [Google Scholar] [CrossRef]
- Schwarz-Schampera, U.; Herzig, P.M. Indium: Geology, Mineralogy, and Economics; Springer: Heidelberg, Germany, 2002. [Google Scholar]
- Sawłowicz, Z. REE and their relevance to the development of the Kupferschiefer copper deposit in Poland. Ore Geol. Rev. 2013, 55, 176–186. [Google Scholar] [CrossRef]
- Oszczepalski, S.; Chmielewski, A.; Mikulski, S.Z. Controls on the distribution of rare earth elements in the Kupferschiefer series of SW Poland. Geol. Q. 2016, 60, 811–826. [Google Scholar] [CrossRef] [Green Version]
- McLennan, S.M. Rare earth elements in sedimentary rocks: Influence of provenance and sedimentary processes. Rev. Miner. 1989, 21, 169–200. [Google Scholar]
- Pieczonka, J.; Piestrzyński, A.; Mucha, J.; Głuszek, A.; Kotarba, M.; Więcław, D. The red-bed-type precious metal deposit in the Sieroszowice-Polkowice copper mining district, SW Poland. Ann. Soc. Geol. Pol. 2008, 78, 151–280. [Google Scholar]
- Piestrzyński, A.; Pieczonka, J.; Speczik, S.; Oszczepalski, S.; Banaszak, A. Noble metals from the Kupferschiefer-type deposits, Lubin-Sieroszowice, SW Poland. In Mineral Deposits: Resources and Exploration—Where do They Meet; Papunen, H., Ed.; Balkema: Rotterdam, The Netherlands, 1997; pp. 563–566. [Google Scholar]
- Oszczepalski, S.; Rydzewski, A. Gold, platinum and palladium in the Lubin-Sieroszowice deposit based on data from boreholes. PTMiner. Pr. Spec. 1998, 10, 51–70. (In Polish) [Google Scholar]
- Pieczonka, J.; Piestrzyński, A.; Głuszek, A.; Michalik, A. Occurrence of gold, platinum and palladium in the Polkowice-Sieroszowice deposit area. PTMiner. Pr. Spec. 2011, 10, 71–86. (In Polish) [Google Scholar]
- Rapacz, A. Recovery of accompanying metals from KGHM concentrates. PTMiner. Pr. Spec. 1998, 10, 221–240. (In Polish) [Google Scholar]
- Blaschke, W.; Witkowska-Kita, B.; Biel, K. Analysis of the possibility of obtaining critical minerals. Annu. Set Environ. Prot. 2015, 17, 792–813. (In Polish) [Google Scholar]
- Skirrow, R.G.; Huston, D.L.; Mernagh, T.P.; Thorne, J.P.; Dulfer, H.; Senior, A.B. Critical Commodities for a High-Tech World: Australia’s Potential to Supply Global Demand; Geoscience Australia: Canberra, Australia, 2013; pp. 1–126.
- Huston, D.L. New age metals: The geology and genesis of ores required for a changing economy and a carbon-constrained world—preface to a thematic issue on critical commodities. Miner. Depos. 2014, 49, 885–887. [Google Scholar] [CrossRef]
- Sykes, J.P.; Wright, J.P.; Trench, A.; Miller, P. An assessment of the potential for transformational market growth amongst the critical metals. Appl. Earth Sci. 2016, 125, 21–56. [Google Scholar] [CrossRef]
- Jowitt, S.M.; Mudd, G.M.; Werner, T.T.; Weng, Z.; Barkoff, D.W.; McCaffrey, D. The critical metals: An overview and opportunities and concerns for the future. SEG Spec. Publ. 2018, 21, 25–38. [Google Scholar]
- Nassar, N.T.; Graedel, T.E.; Harper, E.M. By-product metals are technologically essential but have problematic supply. Sci. Adv. 2015, 1, 1–10. [Google Scholar] [CrossRef] [Green Version]
- Mudd, G.M.; Jowitt, S.M.; Werner, T.T. The world’s by-product and critical metal resources. Pt. I: Uncertainties, current reporting practices, implications and grounds for optimism. Ore Geol. Rev. 2017, 86, 924–938. [Google Scholar] [CrossRef]
- Werner, T.T.; Mudd, G.M.; Jowitt, S.M. The world’s by-product and critical metal resources. Pt. II. A method for quantifying the resources of rarely reported metals. Ore Geol. Rev. 2017, 80, 658–675. [Google Scholar] [CrossRef]
- Barbalance, K. Periodic Table of Elements. Available online: https://environmentalchemistry.com/yogi/periodic (accessed on 19 July 2019).
- Kijewski, P.; Wirth, H. Rhenium—Occurrence in copper ore deposit, the production and its perspectives. Zesz. Nauk. IGSMiE PAN 2011, 81, 103–115. (In Polish) [Google Scholar]
- Serkies, J. The epitome of geochemistry of the Fore-Sudetic copper deposit. Pr. Nauk. ICHNiMPR 1972, 12. (In Polish) [Google Scholar]
- Salamon, W. The relationship between cobalt and nickel in copper deposits on the Fore-Sudetic Monocline. PTMiner. Pr. Spec. 1993, 3, 89–96. (In Polish) [Google Scholar]
- Piestrzyński, A.; Mucha, J.; Bachowski, C.; Głuszek, C.; Michalik, A.; Szarowski, W.; Serafin, W.; Tomanik, R.; Zimocha, R. Cobalt in the copper ore deposit on the Fore-Sudetic Monocline, SW Poland. PTMiner. Pr. Spec. 1998, 10, 119–139. (In Polish) [Google Scholar]
- Pazik, P.M.; Chmielewski, T.; Glass, H.J.; Kowalczuk, P.B. World production and possible recovery of cobalt from the Kupferschiefer stratiform copper ore. EDP Sci. 2016, 8, 01063. [Google Scholar] [CrossRef] [Green Version]
- Kucha, H.; Mayer, W.; Piestrzyński, A. Vanadium in the copper ore deposits on the Fore-Sudetic Monocline (Poland). Min. Pol. 1983, 14, 35–43. [Google Scholar]
- Kucha, H.; Przybyłowicz, W. Noble metals in organic matter and clay-organic matrices, Kupferschiefer, Poland. Econ. Geol. 1999, 94, 1137–1162. [Google Scholar] [CrossRef]
- Speczik, S. Kupferschiefer mineralization in the light of organic geochemistry and coal petrology studies. Geol. Q. 1994, 38, 639–650. [Google Scholar]
- Wodzicki, A.; Piestrzyński, A. An ore genetic model for the Lubin-Sieroszowice mining district, Poland. Miner. Depos. 1994, 29, 30–43. [Google Scholar] [CrossRef]


| WD-XRF [ppm] | ||||||||||||
| As | Ba | Bi | Br | Cd | Ce | Co | Cr | Cu | Ga | Hf | La | Mo |
| 3 | 10 | 3 | 1 | 3 | 5 | 3 | 5 | 5 | 3 | 3 | 5 | 2 |
| Nb | Ni | Pb | Rb | Sn | Sr | Th | U | V | Y | Zn | Zr | |
| 2 | 3 | 3 | 3 | 2 | 2 | 3 | 2 | 5 | 3 | 2 | 3 | |
| ICP-MS [ppm] | GF AAS [ppm] | AMA254 [ppm] | ||||||||||
| Sc | Y | La | Ce | Pr | Nd | Eu | Sm | Au | Pd | Pt | Hg | |
| 0.5 | 0.5 | 0.5 | 0.5 | 0.5 | 0.5 | 0.05 | 0.05 | 0.001 | 0.005 | 0.01 | 0.001 | |
| Gd | Tb | Dy | Ho | Er | Tm | Yb | Lu | |||||
| 0.05 | 0.05 | 0.05 | 0.05 | 0.05 | 0.05 | 0.05 | 0.05 | |||||
| ICP-MS [ppm] | ||||||||||||
| Ag | Cd | In | Mn | Re | Sb | Se | Sn | Ta | V | Te | Tl | W |
| 0.1 | 0.5 | 0.05 | 1 | 0.05 | 0.5 | 2 | 1 | 0.05 | 0.5 | 0.05 | 0.1 | |
| As | Bi | Co | Cu | Hf | Ni | Nb | Mo | Th | 5 | |||
| 2 | 0.05 | 0.5 | 0.5 | 0.05 | 0.5 | 0.5 | 0.5 | 0.05 | ||||
| WD-XRF [%] | ||||||||||||
| SiO2 | TiO2 | Al2O3 | Fe2O3 | MnO | MgO | CaO | Na2O | K2O | P2O5 | SO3 | Cl | F |
| 0.1 | 0.01 | 0.05 | 0.01 | 0.001 | 0.01 | 0.01 | 0.01 | 0.01 | 0.001 | 0.01 | 0.001 | 0.01 |
| Element | Number of Sample | Arithmetic Mean | Geometric Mean | Median | Minimum Content | Maximum Content | Standard Deviation |
| As | 64 | 205.7 | 13.9 | 5 | <3 | 2609 | 453.9 |
| Ba | 64 | 11,271.2 | 133.2 | 43 | 5 | 117,347 | 25,975.2 |
| Cd | 66 | 440.2 | 246.5 | 298 | 14 | 2100 | 445.3 |
| Co | 63 | 5.5 | 3.8 | 4 | <3 | 25 | 5.4 |
| Cu | 66 | 56.3 | 29 | 37.5 | 5 | 257 | 61.9 |
| Ga | 63 | 44 | 22.3 | 31 | <3 | 177 | 43.9 |
| Mn | 65 | 1562.1 | 1428.1 | 1308.9 | 627.3 | 3299.4 | 679.9 |
| Nb | 63 | 7.3 | 6.5 | 6 | 3 | 24 | 4.3 |
| Ni | 63 | 71.4 | 16.8 | 17 | <3 | 512 | 124.6 |
| Pb | 66 | 36,815.1 | 3240.9 | 3968 | 20 | 800,737 | 109,493.7 |
| Rb | 65 | 38.9 | 21.2 | 15 | 6 | 450 | 64.9 |
| Sr | 64 | 221.3 | 104.4 | 61 | 34 | 1635 | 356.9 |
| U | 63 | 6.6 | 5.9 | 6 | 3 | 22 | 3.7 |
| V | 63 | 32.7 | 9.5 | 7 | <5 | 284 | 61.9 |
| Y | 63 | 22.5 | 13.6 | 15 | <3 | 90 | 21.4 |
| Zn | 66 | 73,820.4 | 34,577.1 | 47,912 | 973 | 303,530 | 74,596.5 |
| Zr | 66 | 70.8 | 32.9 | 33 | 4 | 821 | 117.9 |
| Ag | 66 | 13.4 | 7.9 | 9.9 | 0.9 | 102.7 | 16.4 |
| Mo | 66 | 2.9 | 1 | 0.9 | <1 | 45.1 | 8 |
| Hf | 66 | 0.07 | 0.05 | 0.06 | <0.05 | 0.5 | 0.1 |
| Sb | 66 | 23.4 | 6.5 | 9.8 | <0.5 | 225.1 | 38.1 |
| Se | 66 | 3.5 | 2.5 | 3 | <2 | 18 | 3.1 |
| W | 66 | 18.9 | 1.2 | 0.4 | <0.1 | 347.1 | 50.1 |
| Tl | 66 | 7.6 | 2.7 | 2.7 | 0.14 | 109.6 | 18.6 |
| Th | 66 | 0.34 | 0.24 | 0.27 | <0.05 | 1.9 | 0.3 |
| Sc | 66 | 2.30 | 1.48 | 2.30 | <0.05 | 6.4 | 1.2 |
| La | 66 | 1.8 | 1.3 | 1.4 | <0.05 | 11.6 | 1.6 |
| Ce | 66 | 3.2 | 2.4 | 2.4 | <0.05 | 18.7 | 2.7 |
| Nd | 66 | 1.6 | 1 | 1.2 | <0.05 | 10.1 | 1.4 |
| Sm | 66 | 0.4 | 0.3 | 0.3 | <0.05 | 10.7 | 0.4 |
| Eu | 66 | 0.08 | 0.06 | 0.07 | <0.05 | 0.5 | 0.1 |
| Gd | 66 | 0.33 | 0.26 | 0.25 | <0.05 | 2.0 | 0.3 |
| Dy | 66 | 0.28 | 0.22 | 0.22 | <0.05 | 1.6 | 0.2 |
| Er | 66 | 0.14 | 0.11 | 0.11 | <0.05 | 0.8 | 0.1 |
| Yb | 66 | 0.11 | 0.08 | 0.09 | <0.05 | 0.7 | 0.1 |
| Element | Number of Sample | Arithmetic Mean | Geometric Mean | Median | Minimum Content | Maximum Content | Standard Deviation |
| below/above | |||||||
| detection limit | |||||||
| Pr | 48/18 | - | - | - | <0.05/0.5 | <0.05/2.6 | - |
| Tb | 47/19 | - | - | - | <0.05/0.1 | <0.05/0.3 | - |
| Ho | 40/26 | - | - | - | <0.05/0.1 | <0.05/0.3 | - |
| Tm | 62/4 | - | - | - | <0.05/0.1 | <0.05/0.1 | - |
| Lu | 63/3 | - | - | - | <0.05/0.1 | <0.05/0.1 | - |
| Bi | 43/23 | - | - | - | <0.05/0.1 | <0.05/0.7 | - |
| Br | 39/24 | - | - | - | <0.5/1 | <0.5/13 | - |
| Sn | 28/38 | - | - | - | <0.5/1 | <0.5/5 | - |
| Ta | 55/11 | - | - | - | <0.05/0.1 | <0.05/0.7 | - |
| Au | 38/15 | - | - | - | <0.001/0.001 | <0.001/0.002 | - |
| Pd | 47/6 | - | - | - | <0.005/0.0012 | <0.005/0.01 | - |
| Pt | 50/3 | - | - | - | <0.01/0.001 | <0.01/0.001 |
| Ag | As | Ba | Cd | Ce | Co | Cu | Ga | Hf | La | Mo | Nb | Ni | Pb | Sb | Sc | Se | Sr | Th | Tl | U | W | |
|---|---|---|---|---|---|---|---|---|---|---|---|---|---|---|---|---|---|---|---|---|---|---|
| As | 0.24 | |||||||||||||||||||||
| Ba | 0.03 | −0.10 | ||||||||||||||||||||
| Cd | 0.64 | 0.16 | 0.00 | |||||||||||||||||||
| Ce | −0.13 | −0.14 | −0.11 | 0.00 | ||||||||||||||||||
| Co | 0.22 | 0.00 | 0.27 | 0.09 | 0.32 | |||||||||||||||||
| Cu | 0.45 | 0.18 | 0.11 | 0.57 | 0.32 | 0.59 | ||||||||||||||||
| Ga | 0.33 | −0.11 | 0.38 | 0.50 | −0.10 | 0.30 | 0.40 | |||||||||||||||
| Hf | −0.03 | 0.00 | −0.04 | −0.05 | 0.71 | 0.33 | 0.26 | −0.12 | ||||||||||||||
| La | −0.17 | −0.16 | −0.11 | −0.03 | 0.99 | 0.34 | 0.32 | −0.13 | 0.70 | |||||||||||||
| Mo | −0.01 | 0.76 | −0.10 | 0.00 | −0.08 | −0.10 | −0.06 | −0.18 | −0.05 | −0.08 | ||||||||||||
| Nb | 0.11 | −0.11 | 0.68 | −0.05 | −0.10 | 0.40 | 0.13 | 0.72 | −0.03 | −0.11 | −0.08 | |||||||||||
| Ni | 0.31 | 0.29 | 0.01 | 0.25 | 0.05 | 0.32 | 0.33 | 0.13 | 0.31 | 0.00 | −0.08 | 0.01 | ||||||||||
| Pb | 0.00 | −0.22 | 0.48 | −0.27 | −0.19 | 0.28 | −0.06 | 0.61 | −0.14 | −0.18 | −0.14 | 0.92 | −0.12 | |||||||||
| Sb | 0.16 | 0.03 | 0.38 | −0.06 | −0.01 | 0.35 | 0.17 | 0.37 | 0.12 | −0.02 | −0.01 | 0.52 | 0.45 | 0.46 | ||||||||
| Sc | 0.15 | 0.11 | −0.34 | 0.22 | 0.58 | 0.09 | 0.19 | −0.33 | 0.61 | 0.57 | 0.02 | −0.50 | 0.34 | −0.62 | −0.14 | |||||||
| Se | 0.47 | 0.16 | −0.02 | 0.88 | 0.04 | 0.09 | 0.59 | 0.52 | −0.06 | 0.00 | −0.06 | −0.07 | 0.29 | −0.28 | −0.08 | 0.19 | ||||||
| Sr | 0.04 | −0.11 | 0.99 | 0.02 | −0.09 | 0.28 | 0.12 | 0.35 | 0.00 | −0.09 | −0.11 | 0.66 | 0.04 | 0.44 | 0.36 | −0.29 | −0.01 | |||||
| Th | −0.06 | 0.01 | −0.15 | −0.12 | 0.79 | 0.30 | 0.25 | −0.16 | 0.93 | 0.76 | −0.04 | −0.08 | 0.26 | −0.15 | 0.12 | 0.62 | −0.10 | −0.12 | ||||
| Tl | −0.02 | 0.58 | −0.05 | 0.07 | −0.10 | −0.09 | −0.03 | −0.08 | −0.09 | −0.11 | 0.83 | −0.05 | 0.04 | −0.14 | 0.00 | 0.04 | 0.03 | −0.06 | −0.10 | |||
| U | 0.12 | −0.10 | 0.12 | −0.06 | −0.15 | 0.23 | 0.06 | 0.69 | −0.11 | −0.17 | −0.08 | 0.76 | −0.01 | 0.86 | 0.40 | −0.49 | −0.07 | 0.08 | −0.08 | −0.05 | ||
| W | 0.13 | −0.05 | 0.32 | −0.01 | 0.25 | 0.77 | 0.47 | 0.27 | 0.16 | 0.29 | −0.05 | 0.40 | −0.04 | 0.35 | 0.15 | −0.15 | 0.01 | 0.30 | 0.14 | −0.08 | 0.24 | |
| Zn | 0.51 | 0.19 | 0.02 | 0.90 | 0.02 | 0.11 | 0.60 | 0.56 | −0.01 | −0.03 | −0.07 | −0.03 | 0.36 | −0.26 | 0.01 | 0.25 | 0.93 | 0.03 | −0.07 | 0.09 | −0.04 | −0.03 |
| Sphalerite ** (n = 500) | Zn | S | Fe | Pb | Cd | Ag | As | Cu | Co | Sb | Ni | Au | Se | Te | Bi | Hg | Cl | Ca | Mg | Si | Total |
| wt% | wt% | wt% | wt% | ppm | ppm | ppm | ppm | ppm | ppm | ppm | ppm | ppm | ppm | ppm | ppm | ppm | ppm | ppm | ppm | wt.% | |
| Mean | 65.95 | 32.58 | 0.26 | 0.05 | 3063 | 219 | 165 | 400 | 205 | 1513 | 248 | 366 | 201 | 99.56 | |||||||
| S.D. | 0.66 | 0.42 | 0.43 | 0.103 | 3633 | 334 | 478 | 658 | 193 | 1534 | 524 | 545 | 452 | 0.62 | |||||||
| Min. | 62.96 | 30.27 | * b.d.l. | b.d.l. | b.d.l. | b.d.l. | b.d.l. | b.d.l. | b.d.l. | b.d.l. | b.d.l. | b.d.l. | b.d.l. | b.d.l. | b.d.l. | b.d.l. | b.d.l. | b.d.l. | b.d.l. | b.d.l. | 98.14 |
| Max. | 67.69 | 33.80 | 2.48 | 1.24 | 26,390 | 3310 | 5250 | 10,470 | 810 | 10,040 | 910 | 1620 | 410 | 580 | 1250 | 8430 | 4590 | 5800 | 9850 | 101.44 | |
| Galena ** (n = 197) | Pb | S | Zn | Fe | Cd | Ag | As | Cu | Co | Sb | Ni | Au | Se | Te | Bi | Hg | Cl | Ca | Mg | Si | Total |
| wt% | wt% | wt% | wt% | ppm | ppm | ppm | ppm | ppm | ppm | ppm | ppm | ppm | ppm | ppm | ppm | ppm | ppm | ppm | ppm | wt.% | |
| Mean | 85.56 | 13.38 | 0.09 | 0.05 | 217 | 514 | 363 | 1132 | 274 | 797 | 99.53 | ||||||||||
| S.D. | 0.53 | 0.14 | 0.09 | 0.11 | 540 | 388 | 276 | 2693 | 487 | 519 | 0.47 | ||||||||||
| Min. | 82.90 | 12.86 | b.d.l. | b.d.l. | b.d.l. | b.d.l. | b.d.l. | b.d.l. | b.d.l. | b.d.l. | b.d.l. | b.d.l. | b.d.l. | b.d.l. | b.d.l. | b.d.l. | 270 | b.d.l. | b.d.l. | b.d.l. | 98.06 |
| Max. | 86.81 | 14.04 | 0.84 | 1.24 | 820 | 730 | 4.370 | 1710 | 1090 | 18170 | 1280 | 1760 | 680 | 790 | 2110 | 6560 | 3880 | 610 | 970 | 100.80 | |
| Pyrite/marcasite ** (n = 98) | Fe | S | Zn | Pb | As | Co | Ni | Cu | Sb | Cd | Ag | Au | Se | Te | Bi | Hg | Cl | Ca | Mg | Si | Total |
| wt% | wt% | wt% | wt% | ppm | ppm | ppm | ppm | ppm | ppm | ppm | ppm | ppm | ppm | ppm | ppm | ppm | ppm | ppm | ppm | wt.% | |
| Mean | 45.77 | 53.12 | 0.1 | 0.08 | 2237 | 759 | 599 | 316 | 418 | 283 | 190 | 99.68 | |||||||||
| S.D. | 0.68 | 0.65 | 0.17 | 0.24 | 4721 | 317 | 1909 | 309 | 796 | 389 | 174 | 0.43 | |||||||||
| Min. | 43.58 | 50.73 | b.d.l. | b.d.l. | b.d.l. | b.d.l. | b.d.l. | b.d.l. | b.d.l. | b.d.l. | b.d.l. | b.d.l. | b.d.l. | b.d.l. | b.d.l. | b.d.l. | b.d.l. | b.d.l. | b.d.l. | b.d.l. | 98.50 |
| Max. | 47.32 | 54.64 | 1.38 | 1.68 | 26950 | 1700 | 15230 | 1340 | 1850 | 740 | 1450 | 1380 | 830 | 340 | 600 | 2110 | 4680 | 1800 | 1280 | 100.71 |
| Sphalerite | Zn | S | Fe | Pb | Cd | Ag | Sb | Cl | Bi | Se | As | Cu | Ni | Co | Mn | Hg | Au | Mg | Ca | Si | Total |
| Collomorphic ** (n = 84) | wt% | wt% | ppm | ppm | ppm | ppm | ppm | ppm | ppm | ppm | ppm | ppm | ppm | ppm | ppm | ppm | ppm | ppm | ppm | ppm | wt% |
| Mean | 65.76 | 32.54 | 4322 | 1482 | 1033 | 3213 | 99.52 | ||||||||||||||
| S.D. | 0.58 | 0.46 | 4110 | 1289 | 1317 | 1530 | 0.49 | ||||||||||||||
| Min. | 63.49 | 31.06 | * b.d.l. | b.d.l. | b.d.l. | b.d.l. | b.d.l. | 560 | b.d.l. | b.d.l. | b.d.l. | b.d.l. | b.d.l. | b.d.l. | b.d.l. | b.d.l. | b.d.l. | b.d.l. | b.d.l. | b.d.l. | 98.27 |
| Max. | 67.00 | 33.39 | 22,050 | 6780 | 5830 | 720 | 6520 | 1620 | 3070 | 1310 | 910 | 710 | 1020 | 720 | 690 | 100.38 | |||||
| Sphalerite | Zn | S | Pb | Fe | Cd | Ag | Sb | Cl | Bi | Se | As | Cu | Ni | Co | Mn | Hg | Au | Mg | Ca | Si | Total |
| Breccia (n = 9) | wt% | wt% | ppm | ppm | ppm | ppm | ppm | ppm | ppm | ppm | ppm | ppm | ppm | ppm | ppm | ppm | ppm | ppm | ppm | ppm | wt% |
| Mean | 65.62 | 32.28 | 3790 | 5741 | 2306 | 228 | 220 | 182 | 307 | 98.97 | |||||||||||
| S.D. | 0.43 | 0.56 | 550 | 1880 | 1475 | 199 | 156 | 169 | 152 | 0.78 | |||||||||||
| Min. | 65.06 | 31.35 | b.d.l. | b.d.l. | 2750 | b.d.l. | b.d.l. | 240 | b.d.l. | b.d.l. | b.d.l. | b.d.l. | b.d.l. | b.d.l. | b.d.l. | b.d.l. | b.d.l. | b.d.l. | b.d.l. | b.d.l. | 97.95 |
| Max. | 66.24 | 32.94 | 1300 | 530 | 8620 | 1510 | 4330 | 570 | 530 | 470 | 550 | 350 | 160 | 290 | 100.29 | ||||||
| Sphalerite | Zn | S | Pb | Fe | Cd | Ag | Sb | Cl | Bi | Se | As | Cu | Ni | Co | Mn | Hg | Au | Mg | Ca | Si | Total |
| Granular (n = 253) | wt% | wt% | ppm | ppm | ppm | ppm | ppm | ppm | ppm | ppm | ppm | ppm | ppm | ppm | ppm | ppm | ppm | ppm | ppm | ppm | wt% |
| Mean | 65.96 | 32.54 | 444 | 2708 | 4242 | 1089 | 477 | 204 | 199 | 222 | 300 | 423 | 181 | 99.63 | |||||||
| S.D. | 0.72 | 0.43 | 1049 | 5123 | 4530 | 1396 | 830 | 189 | 195 | 207 | 540 | 689 | 149 | 0.66 | |||||||
| Min. | 62.96 | 30.27 | b.d.l. | b.d.l. | b.d.l. | b.d.l. | b.d.l. | b.d.l. | b.d.l. | b.d.l. | b.d.l. | b.d.l. | b.d.l. | b.d.l. | b.d.l. | b.d.l. | b.d.l. | b.d.l. | b.d.l. | b.d.l. | 94.14 |
| Max. | 67.69 | 33.60 | 12,410 | 24,830 | 26,390 | 3310 | 10,040 | 8430 | 580 | 800 | 5250 | 10,470 | 850 | 810 | 700 | 1250 | 1330 | 5800 | 4590 | 1380 | 100.99 |
| Element | Number of Samples | Arithmetic Mean | Geometric Mean | Median | Minimum Content | Maximum Content | Standard Deviation |
| Ag | 71 | 67.9 | 33.1 | 43.9 | 1.1 | 377 | 79.3 |
| As | 71 | 381.3 | 38.1 | 30 | <2 | 6250 | 1022.3 |
| Au | 71 | 0.247 | 0.003 | 0.002 | <0.001 | 0.778 | 1.156 |
| Bi | 71 | 5 | 0.8 | 0.5 | <0.05 | 78.7 | 13.6 |
| Cd | 71 | 5.0 | 0.8 | 0.6 | <0.1 | 71.3 | 11.7 |
| Co | 71 | 243.3 | 53.7 | 61.7 | <3 | 5630 | 729.1 |
| Cu | 71 | 47,974.5 | 19,385.2 | 28,500 | 113 | 182,464 | 47,904.4 |
| Hf | 71 | 1.7 | 1.5 | 1.8 | 0.37 | 4 | 0.8 |
| Hg | 62 | 9 | 1.7 | 1.3 | 0.1 | 183 | 27.9 |
| In | 71 | 0.06 | 0.045 | 0.05 | <0.05 | 0.29 | 0.047 |
| Mn | 71 | 1830.2 | 1456.3 | 1660 | 152 | 6784.6 | 1166.4 |
| Mo | 71 | 120.3 | 39.1 | 44.5 | 1.6 | 784.9 | 167.6 |
| Nb | 71 | 92.8 | 1.6 | 1.2 | <0.5 | 3,210 | 529.4 |
| Ni | 71 | 194.1 | 92.2 | 117 | <3 | 1,190 | 233 |
| Re | 71 | 5.8 | 0.9 | 0.9 | <0.05 | 68.7 | 12.3 |
| Sb | 71 | 91.7 | 1.3 | 1.1 | <0.05 | 3,210 | 529.6 |
| Sc | 71 | 9.5 | 8.1 | 10.8 | 0.7 | 20.1 | 4.3 |
| Se | 71 | 28.8 | 13.4 | 21 | <2 | 109 | 27.7 |
| Sn | 71 | 3.8 | 3.5 | 4 | 1 | 8 | 1.4 |
| Ta | 71 | 0.5 | 0.3 | 0.4 | <0.05 | 1.5 | 0.4 |
| Th | 71 | 6.5 | 5.5 | 7.4 | <3 | 14.5 | 3.2 |
| Tl | 71 | 2.2 | 1.7 | 1.8 | 0.26 | 7.3 | 1.7 |
| V | 71 | 740.2 | 328.7 | 497 | 15 | 2393 | 716.9 |
| W | 71 | 1.2 | 1 | 1.3 | 0.2 | 4.9 | 0.8 |
| Y | 71 | 18 | 15.8 | 16.2 | 4 | 50.3 | 9.5 |
| La | 71 | 21.4 | 19.3 | 23.2 | 5.7 | 44.3 | 8.76 |
| Ce | 71 | 42.7 | 38.5 | 43.6 | 10.4 | 95.7 | 17.7 |
| Pr | 71 | 5.8 | 5.1 | 5.3 | 1.4 | 15.5 | 2.8 |
| Nd | 71 | 23.9 | 20.9 | 21.6 | 5.2 | 70.9 | 12.6 |
| Eu | 71 | 1.2 | 1 | 0.9 | 0.28 | 3.8 | 0.7 |
| Sm | 71 | 5.4 | 4.7 | 4.5 | 1.16 | 17.9 | 3.2 |
| Gd | 71 | 4.6 | 3.9 | 4 | 0.92 | 14.6 | 2.7 |
| Tb | 71 | 0.6 | 0.5 | 0.5 | 0.13 | 2 | 0.4 |
| Dy | 71 | 3.5 | 3.1 | 2.9 | 0.72 | 10.3 | 1.9 |
| Ho | 71 | 0.6 | 0.6 | 0.6 | 0.16 | 1.8 | 0.3 |
| Er | 71 | 1.7 | 1.6 | 1.6 | 0.41 | 4.6 | 0.8 |
| Tm | 71 | 0.2 | 0.2 | 0.2 | 0.06 | 0.6 | 0.1 |
| Yb | 71 | 1.5 | 1.3 | 1.4 | 0.44 | 3.3 | 0.6 |
| Lu | 71 | 0.2 | 0.2 | 0.2 | 0.06 | 0.5 | 0.1 |
| Element | Number of Sample below/above Detection Limit | Arithmetic Mean | Geometric Mean | Median | Minimum Content | Maximum Content | Standard Deviation |
| In | 35/36 | /0.09 | /0.08 | /0.07 | <0.05/0.05 | <0.05/0.3 | /0.1 |
| Pd | 61/10 | <0.005/0.005 | <0.005/0.153 | ||||
| Pt | 59/12 | <0.01/0.01 | <0.01/0.184 |
| Eleme-nt | Ag | As | Au | Bi | Co | Cu | Hf | Hg | In | Mn | Mo | Nb | Ni | Re | Sb | Sc | Se | Sn | Ta | Th | Tl | V | W | Y |
|---|---|---|---|---|---|---|---|---|---|---|---|---|---|---|---|---|---|---|---|---|---|---|---|---|
| As | −0.01 | |||||||||||||||||||||||
| Au | −0.16 | −0.06 | ||||||||||||||||||||||
| Bi | 0.08 | 0.13 | −0.02 | |||||||||||||||||||||
| Co | 0.05 | 0.84 | −0.06 | 0.12 | ||||||||||||||||||||
| Cu | 0.62 | −0.08 | −0.21 | 0.41 | 0.03 | |||||||||||||||||||
| Hf | 0.05 | −0.07 | −0.21 | 0.14 | 0.07 | 0.29 | ||||||||||||||||||
| Hg | −0.07 | −0.04 | 0.25 | −0.01 | −0.05 | 0.27 | 0.10 | |||||||||||||||||
| In | −0.21 | 0.18 | −0.08 | −0.05 | −0.08 | −0.12 | −0.33 | −0.06 | ||||||||||||||||
| Mn | 0.10 | 0.08 | 0.11 | −0.08 | −0.05 | −0.12 | −0.37 | 0.05 | 0.11 | |||||||||||||||
| Mo | 0.36 | 0.06 | −0.12 | 0.46 | 0.14 | 0.68 | 0.29 | −0.05 | 0.18 | −0.21 | ||||||||||||||
| Nb | −0.11 | 0.42 | −0.04 | 0.09 | −0.04 | −0.12 | −0.14 | 0.04 | 0.45 | 0.22 | −0.05 | |||||||||||||
| Ni | 0.40 | 0.49 | −0.11 | 0.26 | 0.64 | 0.55 | 0.37 | 0.06 | −0.03 | −0.23 | 0.69 | −0.06 | ||||||||||||
| Re | 0.23 | 0.06 | −0.09 | 0.74 | 0.11 | 0.55 | 0.22 | 0.06 | −0.15 | −0.17 | 0.36 | −0.05 | 0.29 | |||||||||||
| Sb | −0.12 | 0.42 | −0.04 | 0.09 | −0.04 | −0.12 | −0.14 | 0.04 | 0.45 | 0.22 | −0.05 | 0.99 | −0.06 | −0.05 | ||||||||||
| Sc | −0.04 | −0.07 | −0.21 | 0.19 | 0.04 | 0.23 | 0.89 | 0.03 | −0.25 | −0.18 | 0.33 | −0.09 | 0.32 | 0.23 | −0.09 | |||||||||
| Se | 0.11 | −0.12 | −0.08 | 0.27 | −0.02 | 0.48 | 0.67 | 0.30 | −0.13 | −0.14 | 0.45 | −0.10 | 0.43 | 0.38 | −0.10 | 0.68 | ||||||||
| Sn | 0.01 | −0.13 | −0.27 | 0.12 | −0.01 | 0.22 | 0.71 | −0.03 | −0.22 | −0.28 | 0.30 | −0.10 | 0.29 | 0.17 | −0.10 | 0.77 | 0.51 | |||||||
| Ta | 0.13 | 0.01 | −0.20 | 0.28 | 0.18 | 0.40 | 0.86 | 0.12 | −0.30 | −0.30 | 0.45 | −0.16 | 0.50 | 0.35 | −0.16 | 0.88 | 0.76 | 0.72 | ||||||
| Th | 0.03 | −0.07 | −0.25 | 0.14 | 0.04 | 0.23 | 0.96 | 0.03 | −0.30 | −0.26 | 0.28 | −0.06 | 0.33 | 0.20 | −0.06 | 0.93 | 0.60 | 0.75 | 0.85 | |||||
| Tl | 0.14 | 0.04 | −0.21 | 0.14 | 0.18 | 0.49 | 0.29 | 0.19 | 0.47 | −0.12 | 0.57 | −0.18 | 0.42 | 0.16 | −0.18 | 0.28 | 0.37 | 0.27 | 0.35 | 0.25 | ||||
| V | 0.25 | −0.09 | −0.15 | 0.37 | 0.00 | 0.63 | 0.71 | 0.20 | −0.06 | −0.26 | 0.60 | −0.07 | 0.55 | 0.47 | −0.07 | 0.70 | 0.90 | 0.57 | 0.81 | 0.64 | 0.42 | |||
| W | 0.08 | 0.27 | −0.20 | 0.06 | 0.48 | 0.22 | 0.62 | 0.15 | −0.20 | −0.24 | 0.29 | −0.12 | 0.57 | 0.16 | −0.12 | 0.63 | 0.37 | 0.59 | 0.69 | 0.66 | 0.31 | 0.42 | ||
| Y | −0.19 | −0.08 | 0.39 | 0.10 | 0.01 | −0.09 | 0.50 | 0.12 | −0.32 | 0.11 | −0.02 | −0.14 | 0.06 | 0.10 | −0.14 | 0.51 | 0.56 | 0.39 | 0.47 | 0.45 | −0.05 | 0.37 | 0.24 | |
| La | −0.02 | −0.05 | −0.21 | 0.13 | 0.00 | 0.24 | 0.87 | 0.15 | −0.33 | −0.03 | 0.22 | 0.04 | 0.29 | 0.18 | 0.04 | 0.91 | 0.74 | 0.68 | 0.81 | 0.89 | 0.20 | 0.67 | 0.58 | 0.59 |
| Borehole | Principal Ore Mineral | Associated Minerals | Accesoric Minerals |
|---|---|---|---|
| S-65 | digenite | roxbyite, chalcocite, djurleite, anilite, bornite, tennantite | Ag alloys |
| S-87 | spionkopite | digenite, bornite, djurleite, geerite, roxbyite, yarrowite, covellite, chalcopyrite, galena, sphalerite | - |
| S-99 | digenite | roxbyite, spionkopite, djurleite, anilite, bornite | - |
| Cu-S Type Sulfide | Value | Cu | S | Ag | Fe | Bi | Cd | Cl | Co | Mo | Ni | Pb | Sb | Se | Te | Zn | Al | Ca | Mg | Si | Total |
|---|---|---|---|---|---|---|---|---|---|---|---|---|---|---|---|---|---|---|---|---|---|
| wt% | wt% | ppm | ppm | ppm | ppm | ppm | ppm | ppm | ppm | ppm | ppm | ppm | ppm | ppm | ppm | ppm | ppm | ppm | wt% | ||
| Chalcocite Cu2S (n = 6) | mean | 75.58 | 19.76 | 45,900 | 680 | 4040 | 99.63 | ||||||||||||||
| s.d. | 2.55 | 1.67 | 16,700 | 445 | 4690 | 0.72 | |||||||||||||||
| min | 73.87 | 18.42 | 25,400 | b.d.l. | b.d.l. | b.d.l. | b.d.l. | b.d.l. | b.d.l. | b.d.l. | b.d.l. | b.d.l. | b.d.l. | b.d.l. | b.d.l. | b.d.l. | 590 | b.d.l. | b.d.l. | 99.40 | |
| max | 79.33 | 19.87 | 62,800 | 450 | 700 | 320 | 1070 | 290 | 13,350 | 100.81 | |||||||||||
| Djurleite Cu31S16 (n = 7) | mean | 78.23 | 20.86 | 3331 | 880 | 99.65 | |||||||||||||||
| s.d. | 0.29 | 0.13 | 3159 | 350 | 0.08 | ||||||||||||||||
| min | 77.91 | 20.68 | b.d.l. | 440 | b.d.l. | b.d.l. | b.d.l. | b.d.l. | b.d.l. | b.d.l. | b.d.l. | b.d.l. | b.d.l. | b.d.l. | b.d.l. | b.d.l. | b.d.l. | b.d.l. | b.d.l. | 99.59 | |
| max | 78.79 | 21.03 | 9080 | 1460 | 720 | 1030 | 1930 | 720 | 440 | 1320 | 99.70 | ||||||||||
| Digenite Cu9S5 (n = 24) | mean | 77.48 | 21.43 | 443 | 847 | 234 | 580 | 99.53 | |||||||||||||
| s.d. | 0.81 | 0.38 | 721 | 425 | 123 | 870 | 0.78 | ||||||||||||||
| min | 73.76 | 19.98 | b.d.l. | b.d.l. | b.d.l. | b.d.l. | b.d.l. | b.d.l. | b.d.l. | b.d.l. | b.d.l. | b.d.l. | b.d.l. | b.d.l. | b.d.l. | b.d.l. | 120 | b.d.l. | b.d.l. | 98.7 | |
| max | 78.80 | 21.84 | 3545 | 2350 | 740 | 845 | 900 | 901 | 640 | 1580 | 5800 | 5970 | 1670 | 8970 | 100.22 | ||||||
| Roxbyite Cu39S28 (n = 24) | mean | 77.16 | 21.89 | 792 | 650 | 99.52 | |||||||||||||||
| s.d. | 0.33 | 0.09 | 720 | 1.030 | 0.10 | ||||||||||||||||
| min | 76.39 | 21.73 | b.d.l. | b.d.l. | b.d.l. | b.d.l. | b.d.l. | b.d.l. | b.d.l. | b.d.l. | b.d.l. | b.d.l. | b.d.l. | b.d.l. | b.d.l. | b.d.l. | b.d.l. | b.d.l. | b.d.l. | 99.41 | |
| max | 77.78 | 22.06 | 890 | 3140 | 760 | 1590 | 620 | 2390 | 2.270 | 640 | 760 | 610 | 1510 | 1440 | 4990 | 2150 | 99.59 | ||||
| Anilite Cu7S4 (n = 3) | mean | 76.91 | 22.38 | 545 | 745 | ||||||||||||||||
| s.d. | 0.11 | 0.28 | 211 | 380 | |||||||||||||||||
| min | 76.79 | 22.07 | b.d.l. | 343 | b.d.l. | b.d.l. | b.d.l. | b.d.l. | b.d.l. | b.d.l. | b.d.l. | b.d.l. | b.d.l. | b.d.l. | b.d.l. | b.d.l. | b.d.l. | b.d.l. | b.d.l. | ||
| max | 76.94 | 22.61 | 728 | 500 | 1600 | 1190 | 1010 | ||||||||||||||
| Geerite Cu8S5, (n = 5) | mean | 73.80 | 24.22 | 64,900 | 3400 | 99.46 | |||||||||||||||
| s.d. | 3.24 | 0.816 | 36,700 | 1700 | 0.48 | ||||||||||||||||
| min | 65.10 | 22.90 | 3400 | 1500 | b.d.l. | b.d.l. | b.d.l. | b.d.l. | b.d.l. | b.d.l. | b.d.l. | b.d.l. | b.d.l. | b.d.l. | b.d.l. | b.d.l. | b.d.l. | b.d.l. | b.d.l. | 99.13 | |
| max | 73.80 | 24.86 | 101.000 | 5900 | 1400 | 100.4 | |||||||||||||||
| Spionkopite Cu39S28 (n = 8) | mean | 72.03 | 26.96 | 756 | 510 | 690 | 1143 | 980 | 99.73 | ||||||||||||
| s.d. | 0.60 | 0.98 | 181 | 649 | 750 | 381 | 1080 | 0.18 | |||||||||||||
| min | 71.38 | 26.35 | b.d.l. | 550 | b.d.l. | b.d.l. | b.d.l. | b.d.l. | b.d.l. | b.d.l. | b.d.l. | b.d.l. | b.d.l. | b.d.l. | b.d.l. | 710 | b.d.l. | 220 | 99.60 | ||
| max | 72.57 | 28.09 | 890 | 1260 | 720 | 1480 | 1240 | 1430 | 2220 | 99.98 | |||||||||||
| Yarrowite Cu9S8 (n = 4) | mean | 67.43 | 30.01 | 3515 | 135 | 1047 | 740 | 99.76 | |||||||||||||
| s.d. | 2.34 | 1.03 | 2154 | 239 | 1775 | 401 | 0.34 | ||||||||||||||
| min | 63.94 | 28.58 | 1800 | 14000 | b.d.l. | b.d.l. | b.d.l. | b.d.l. | b.d.l. | b.d.l. | b.d.l. | b.d.l. | b.d.l. | b.d.l. | 220 | b.d.l. | b.d.l. | b.d.l. | b.d.l. | 99.34 | |
| max | 68.8 | 30.81 | 6614 | 49300 | 3710 | 8940 | 790 | 1190 | 580 | 100.01 |
| Cu-Fe-S-type Sulfide | Value | Cu | Fe | S | Ag | Hg | As | Au | Cd | Co | Mo | Ni | Sb | Se | Te | Zn | Al | Ca | Si | Cl | Total |
|---|---|---|---|---|---|---|---|---|---|---|---|---|---|---|---|---|---|---|---|---|---|
| wt% | wt% | wt% | ppm | ppm | ppm | ppm | ppm | ppm | ppm | ppm | ppm | ppm | ppm | ppm | ppm | ppm | ppm | ppm | wt% | ||
| Chalcopyrite CuFeS2 (n = 12) | mean | 35.71 | 28.70 | 33.61 | 1105 | 1.050 | 98.47 | ||||||||||||||
| s.d. | 1.71 | 0.71 | 0.72 | 510 | 1.096 | 0.61 | |||||||||||||||
| min | 34.50 | 28.20 | 33.10 | b.d.l. | b.d.l. | b.d.l. | b.d.l. | b.d.l. | b.d.l. | b.d.l. | b.d.l. | b.d.l. | b.d.l. | b.d.l. | 750 | b.d.l. | b.d.l. | 970 | b.d.l. | 98.26 | |
| max | 36.92 | 29.24 | 34.12 | 830 | 670 | 890 | 550 | 1170 | 970 | 1440 | 1.780 | 99.21 | |||||||||
| Bornite Cu5FeS4 (n = 24) | mean | 63.17 | 9.74 | 25.49 | 4024 | 740 | 99.25 | ||||||||||||||
| s.d. | 3.11 | 3.07 | 0.57 | 8479 | 2699 | 1.01 | |||||||||||||||
| min | 59.238 | 0.23 | 23.65 | b.d.l. | b.d.l. | b.d.l. | b.d.l. | b.d.l. | b.d.l. | b.d.l. | b.d.l. | b.d.l. | b.d.l. | b.d.l. | b.d.l. | b.d.l. | b.d.l. | b.d.l. | b.d.l. | 94.78 | |
| max | 73.52 | 11.40 | 26.25 | 32980 | 910 | 720 | 1040 | 780 | 470 | 570 | 1460 | 9130 | 3200 | 13400 | 330 | 97.71 | |||||
| Cu | Fe | S | Ag | Hg | As | Au | Cd | Co | Mo | Ni | Sb | Se | Te | Zn | Al | Ca | Si | Cl | Total | ||
| wt% | ppm | ppm | wt% | wt% | ppm | ppm | ppm | ppm | ppm | ppm | ppm | ppm | ppm | ppm | ppm | ppm | ppm | ppm | wt% | ||
| Ag alloys (n = 24) | mean | 1.58 | 5.460 | 64.22 | 22.74 | 961 | 756 | 1972 | 683 | 813 | 96.41 | ||||||||||
| s.d. | 1.37 | 4.160 | 11.71 | 10.65 | 349 | 432 | 2279 | 753 | 147 | 6.37 | |||||||||||
| min | 0.66 | b.d.l. | 690 | 39.68 | 19.56 | b.d.l. | b.d.l. | b.d.l. | b.d.l. | b.d.l. | b.d.l. | b.d.l. | b.d.l. | 700 | b.d.l. | 530 | b.d.l. | 560 | 89.05 | ||
| max | 3.15 | 950 | 13.570 | 76.71 | 34.46 | 590 | 560 | 790 | 1120 | 1600 | 1450 | 7240 | 1880 | 1060 | 101.23 |
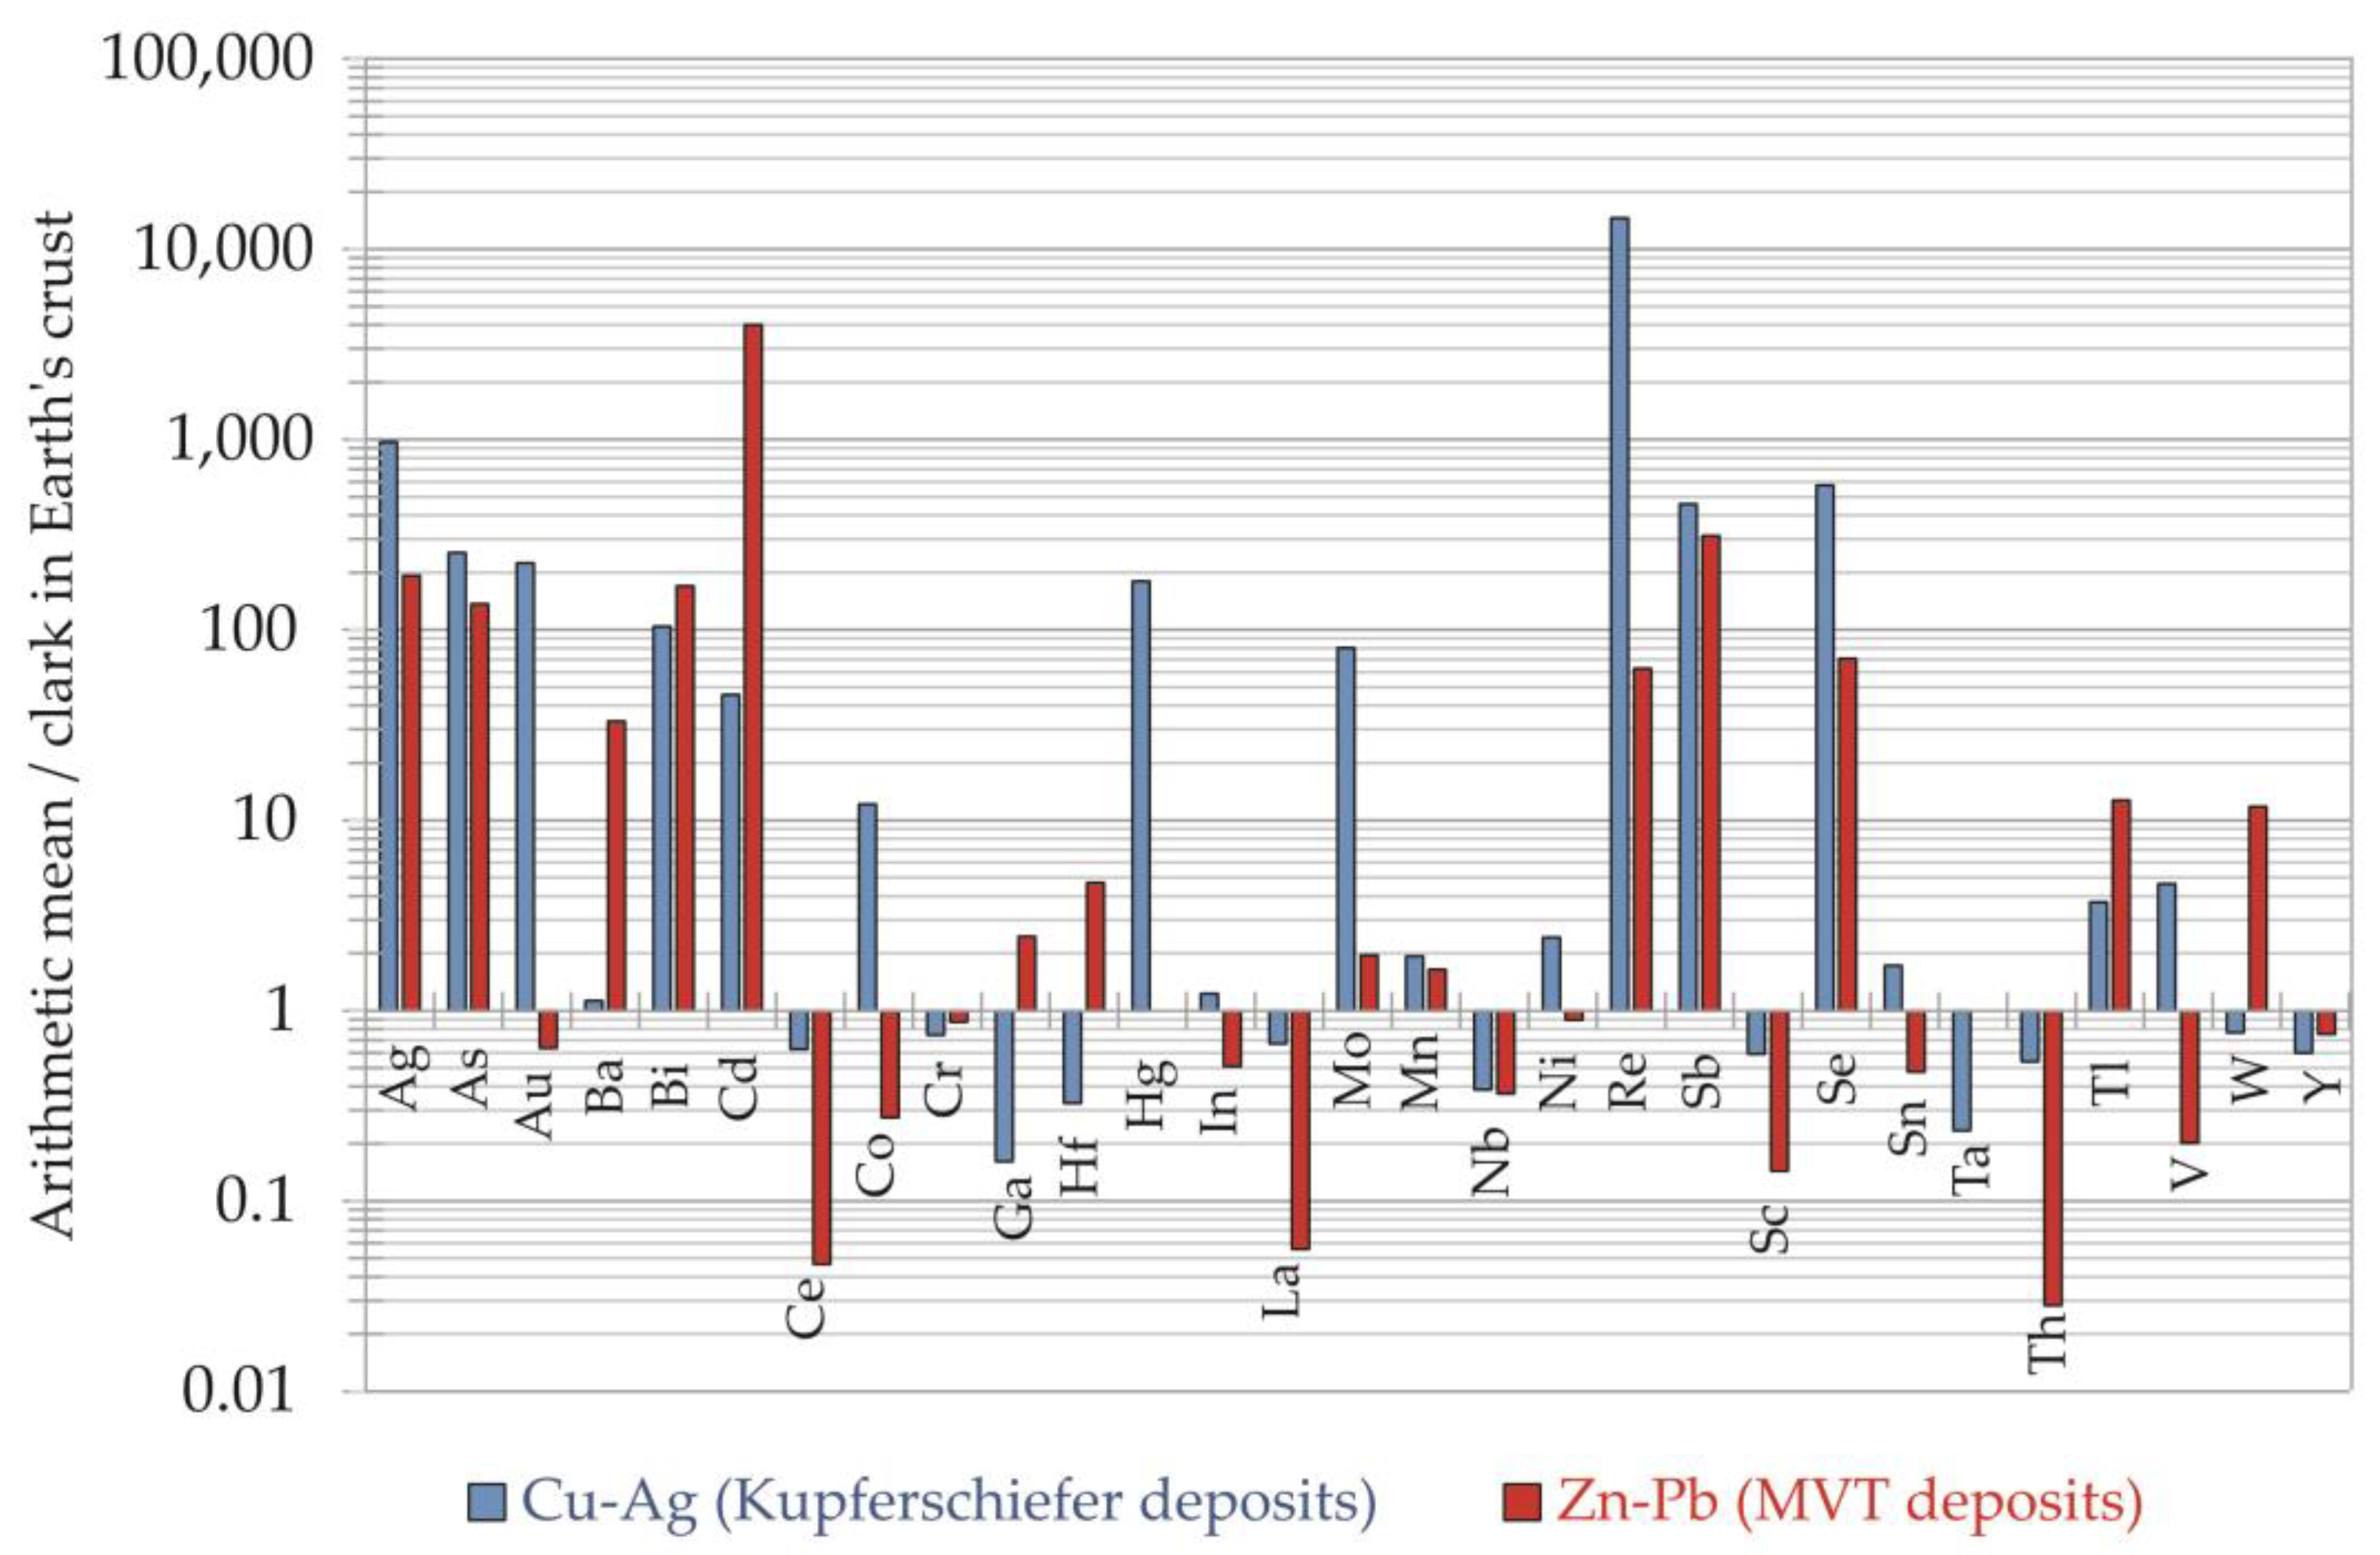
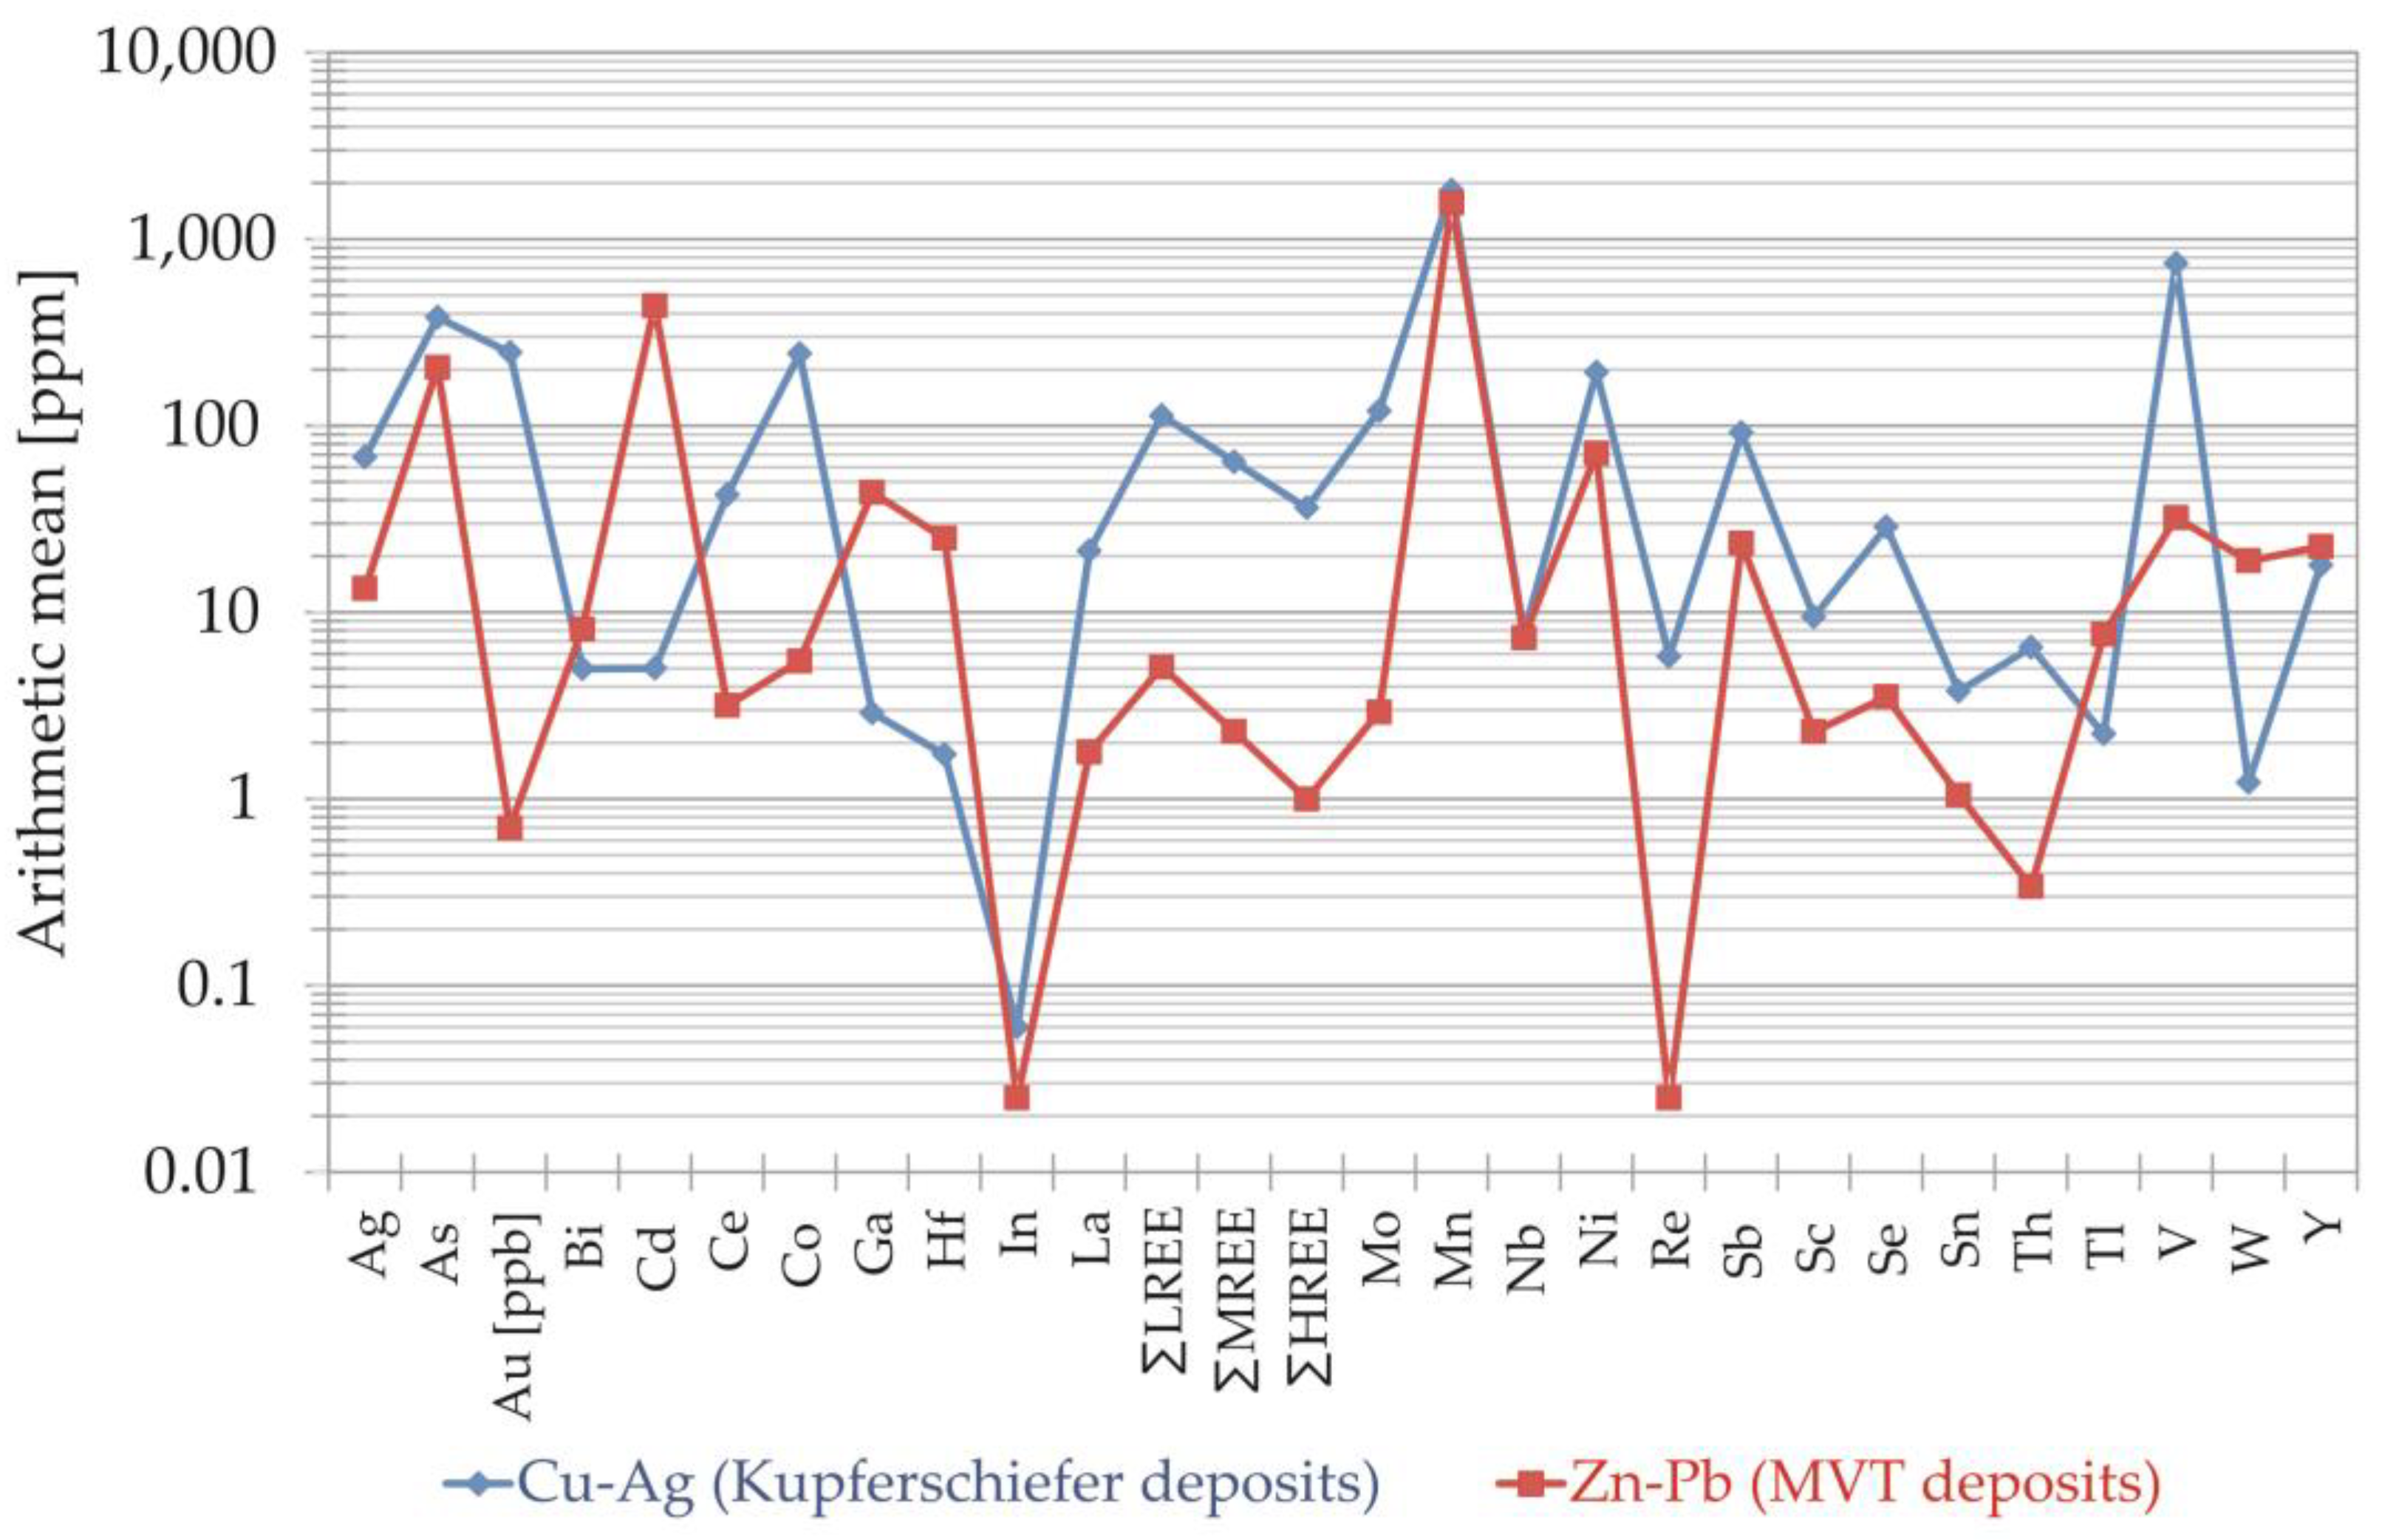
| Deposit Type | Associated Elements | Arithmetic Mean (ppm) | Median (ppm) | N | Clark in the Earth’s Crust [93] (ppm) | Enrichment Factor Arithmetic Mean/Clark in Earth’s Crust | |
|---|---|---|---|---|---|---|---|
| Zn-Pb | Critical elements | Ga | 44.0 | 31.0 | 63 | 18 | ×2.4 |
| Hf | 24.9 | 1.5 | 63 | 5.3 | ×4.7 | ||
| Nb | 7.3 | 6.0 | 63 | 20 | ×0.4 | ||
| Ba | 11,271.2 | 43.0 | 64 | 340 | ×33.2 | ||
| Sc | 2.3 | 2.3 | 66 | 16 | ×0.1 | ||
| Non-critical elements | Ag | 13.4 | 9.9 | 66 | 0.07 | ×191.4 | |
| Cd | 440.2 | 298.0 | 66 | 0.11 | ×4001 | ||
| Tl | 7.6 | 2.7 | 66 | 0.6 | ×12.7 | ||
| Cu-Ag | Critical elements | Co | 243.3 | 61.7 | 71 | 20 | ×12.2 |
| V | 740.2 | 497.0 | 71 | 160 | ×4.6 | ||
| Non-critical elements | Re | 5.8 | 0.89 | 71 | 0.0004 | ×14,567 | |
| Se | 28.8 | 21.0 | 71 | 0.05 | ×575.2 | ||
| Ni | 194.1 | 117.0 | 71 | 80 | ×2.4 | ||
| * Ag | 67.9 | 43.9 | 71 | 0.07 | ×970 | ||
| Bi | 5.0 | 0.5 | 71 | 0.048 | ×104.1 | ||
| Associate Element | Zn-Pb (MVT) | Cu-Ag (Kupferschiefer) | |||||
|---|---|---|---|---|---|---|---|
| Enrichment Factor | Resources Estimated [4] (ton) | Resources Identified [1] (ton) | Enrichment Factor | Resources [4] (ton) | Resources Identified [1] (ton) | By-Product of the SSC Deposits in 2018 [1] (ton) | |
| Trace (critical) Elements | |||||||
| Bi | high | >9000 | |||||
| Ga | low | >1000 | 130 | ||||
| Ge | - | - | 30 | ||||
| Hf | low | - | |||||
| Co | high | >100,000 | 137,440 | ||||
| Nb | low | - | |||||
| Sc | low | >1000 | low | >10,000 | |||
| V | low | >100,000 | 171,410 | ||||
| Ba | high | >500,000 | |||||
| Trace (non-critical) elements | |||||||
| Cr | very low | >1000 | |||||
| Cd | high | >20,000 | 21,770 | ||||
| Mo | high | >100,000 | 73,040 | ||||
| * Ni (as Ni-sulfate) | low | >100,000 | 82,270 | 1730 | |||
| * Re | high | high | >10,000 | 9.09 | |||
| * Se | high | >10,000 | 66.36 | ||||
| *,** Ag | high | 700–1000 | 930 | high | >100,000 | 97,938 | 1189 |
| Tl | low | 400 | 150 | >1000 | |||
| * Au | 0.523 | ||||||
| * Pt-Pd | |||||||
© 2020 by the authors. Licensee MDPI, Basel, Switzerland. This article is an open access article distributed under the terms and conditions of the Creative Commons Attribution (CC BY) license (http://creativecommons.org/licenses/by/4.0/).
Share and Cite
Mikulski, S.Z.; Oszczepalski, S.; Sadłowska, K.; Chmielewski, A.; Małek, R. Trace Element Distributions in the Zn-Pb (Mississippi Valley-Type) and Cu-Ag (Kupferschiefer) Sediment-Hosted Deposits in Poland. Minerals 2020, 10, 75. https://doi.org/10.3390/min10010075
Mikulski SZ, Oszczepalski S, Sadłowska K, Chmielewski A, Małek R. Trace Element Distributions in the Zn-Pb (Mississippi Valley-Type) and Cu-Ag (Kupferschiefer) Sediment-Hosted Deposits in Poland. Minerals. 2020; 10(1):75. https://doi.org/10.3390/min10010075
Chicago/Turabian StyleMikulski, Stanisław Z., Sławomir Oszczepalski, Katarzyna Sadłowska, Andrzej Chmielewski, and Rafał Małek. 2020. "Trace Element Distributions in the Zn-Pb (Mississippi Valley-Type) and Cu-Ag (Kupferschiefer) Sediment-Hosted Deposits in Poland" Minerals 10, no. 1: 75. https://doi.org/10.3390/min10010075