
Analytical Approach for the Study of Teotihuacan Mural Paintings from the Techinantitla Complex

 , ,
, ,  and
and
Abstract
:1. Introduction
2. Materials and Methods
2.1. Geophysical Prospection
2.1.1. Magnetic Gradient
2.1.2. Electrical Resistivity
2.1.3. Ground Penetrating Radar (GPR)
2.2. Mural Painting Analysis
2.2.1. Fragment Selection
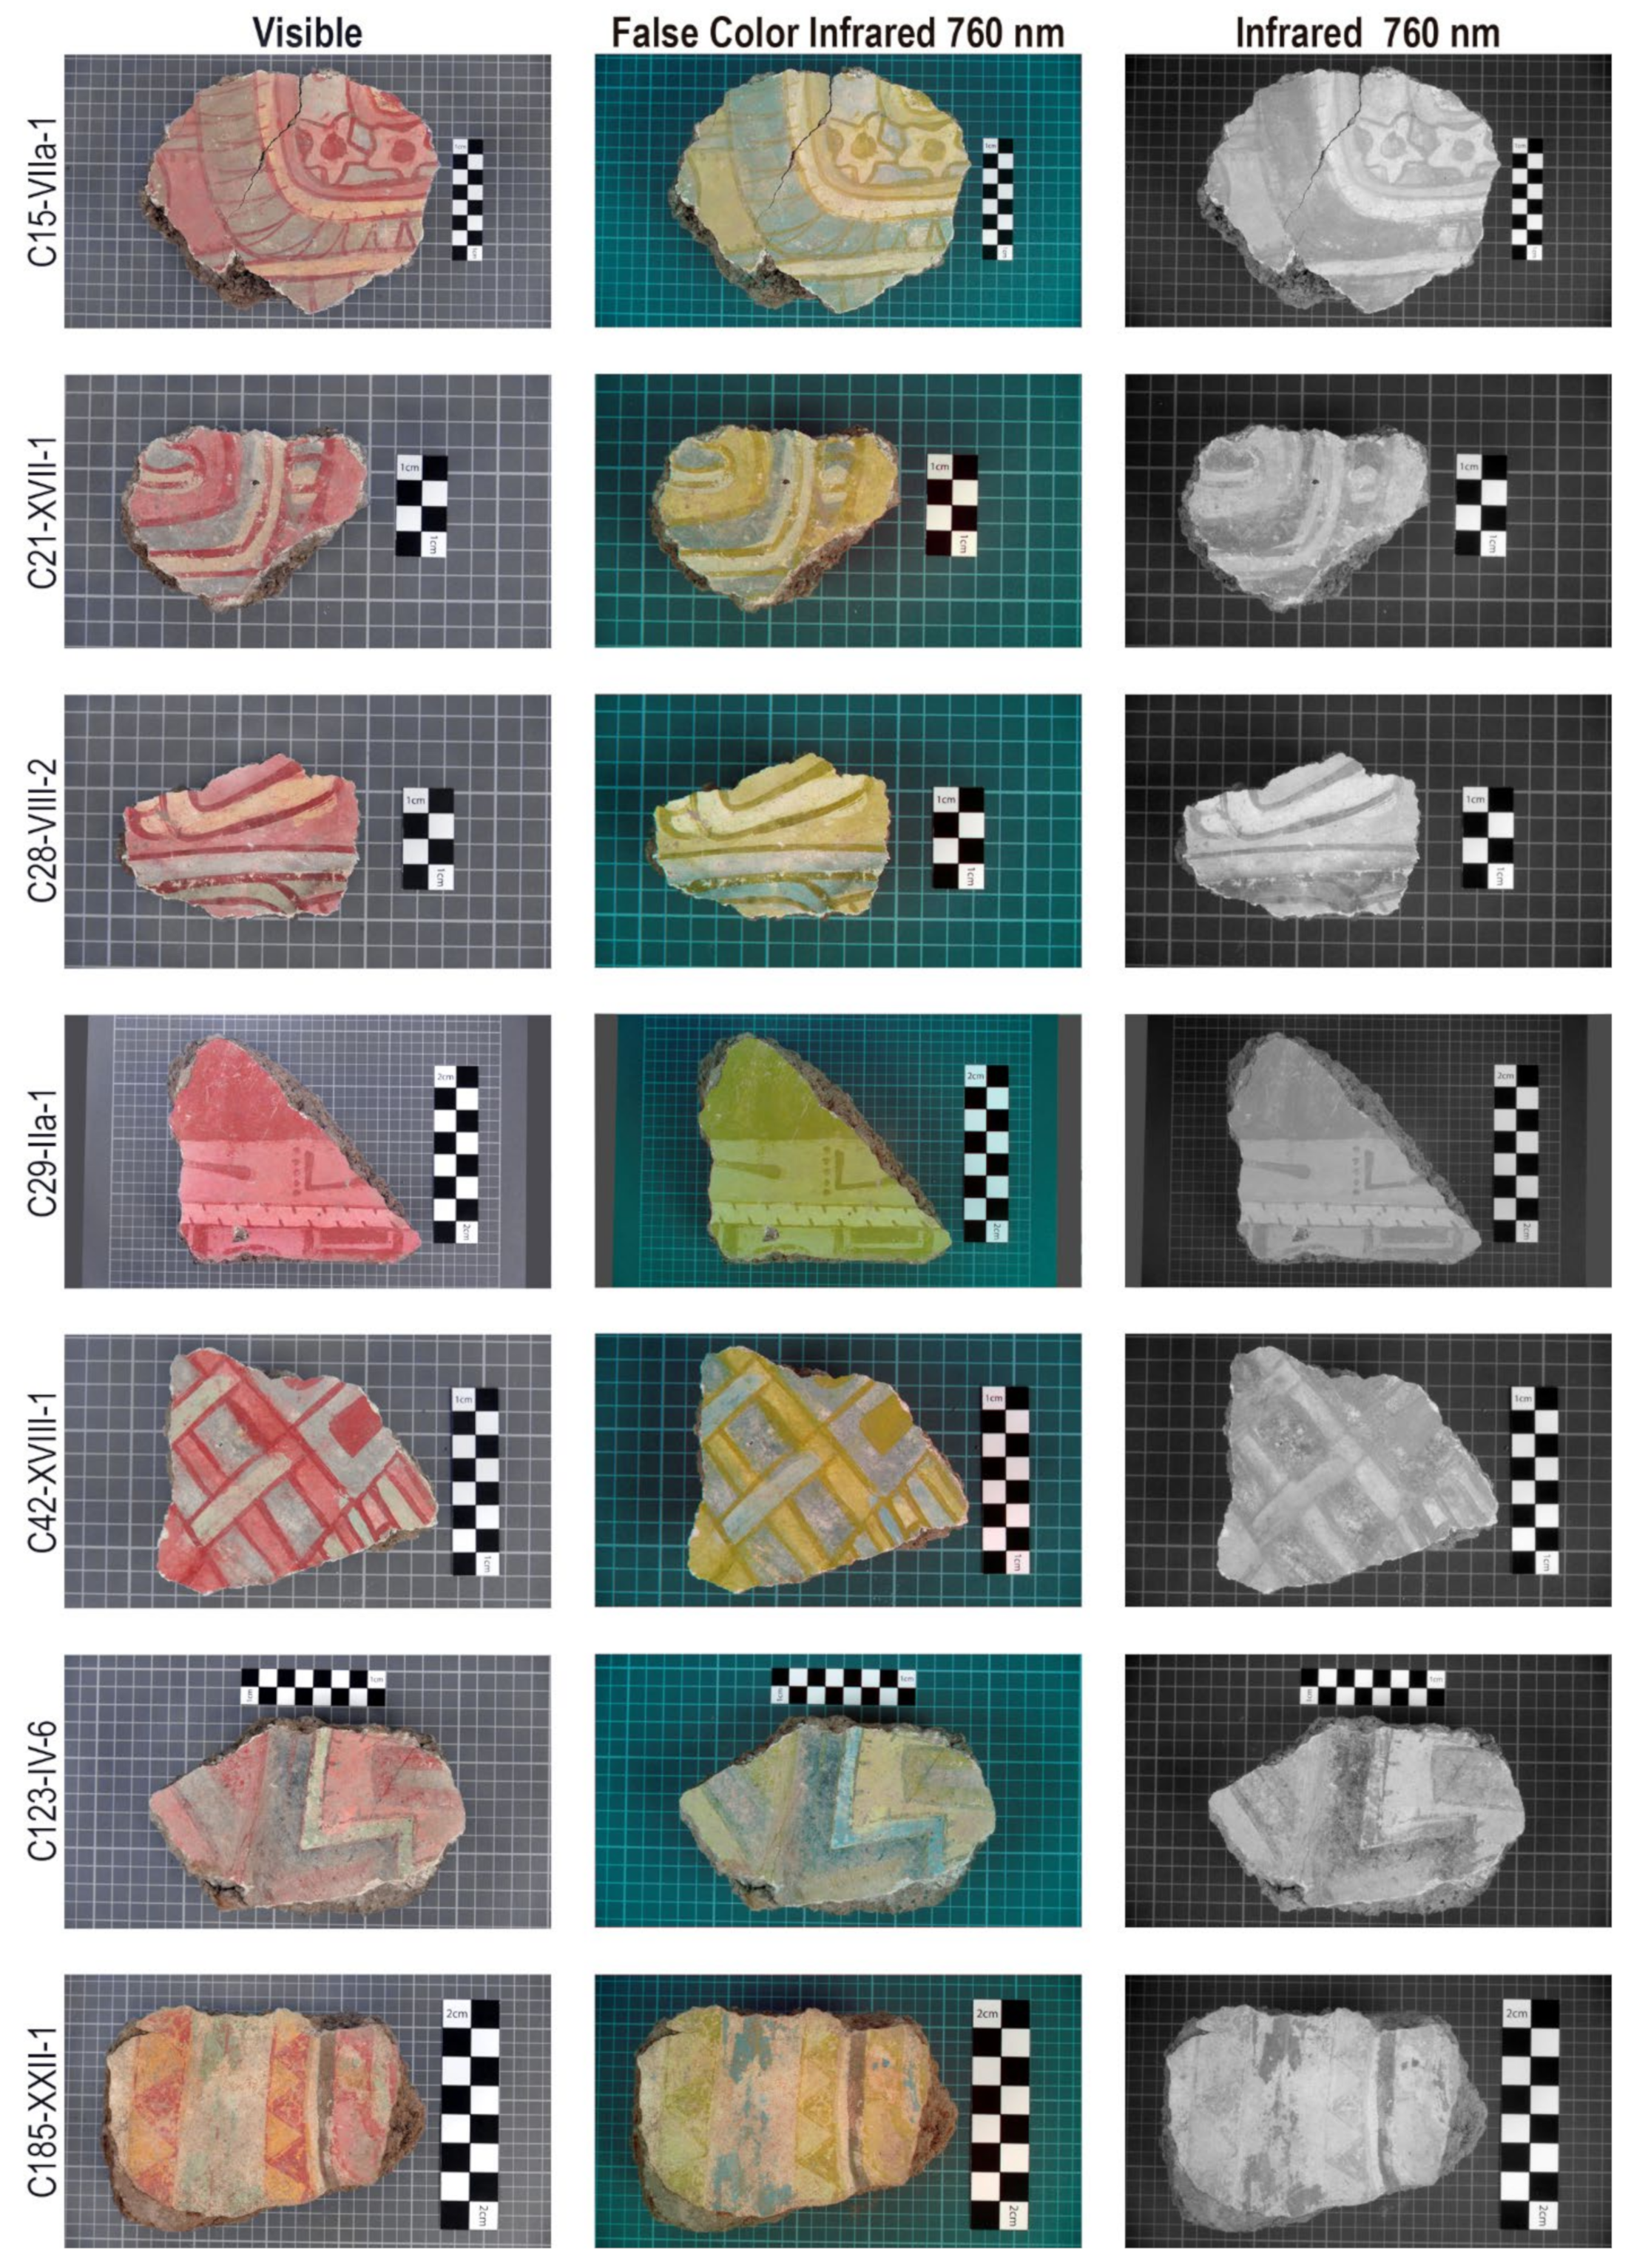
2.2.2. False Color Infrared Imaging (FCIR)
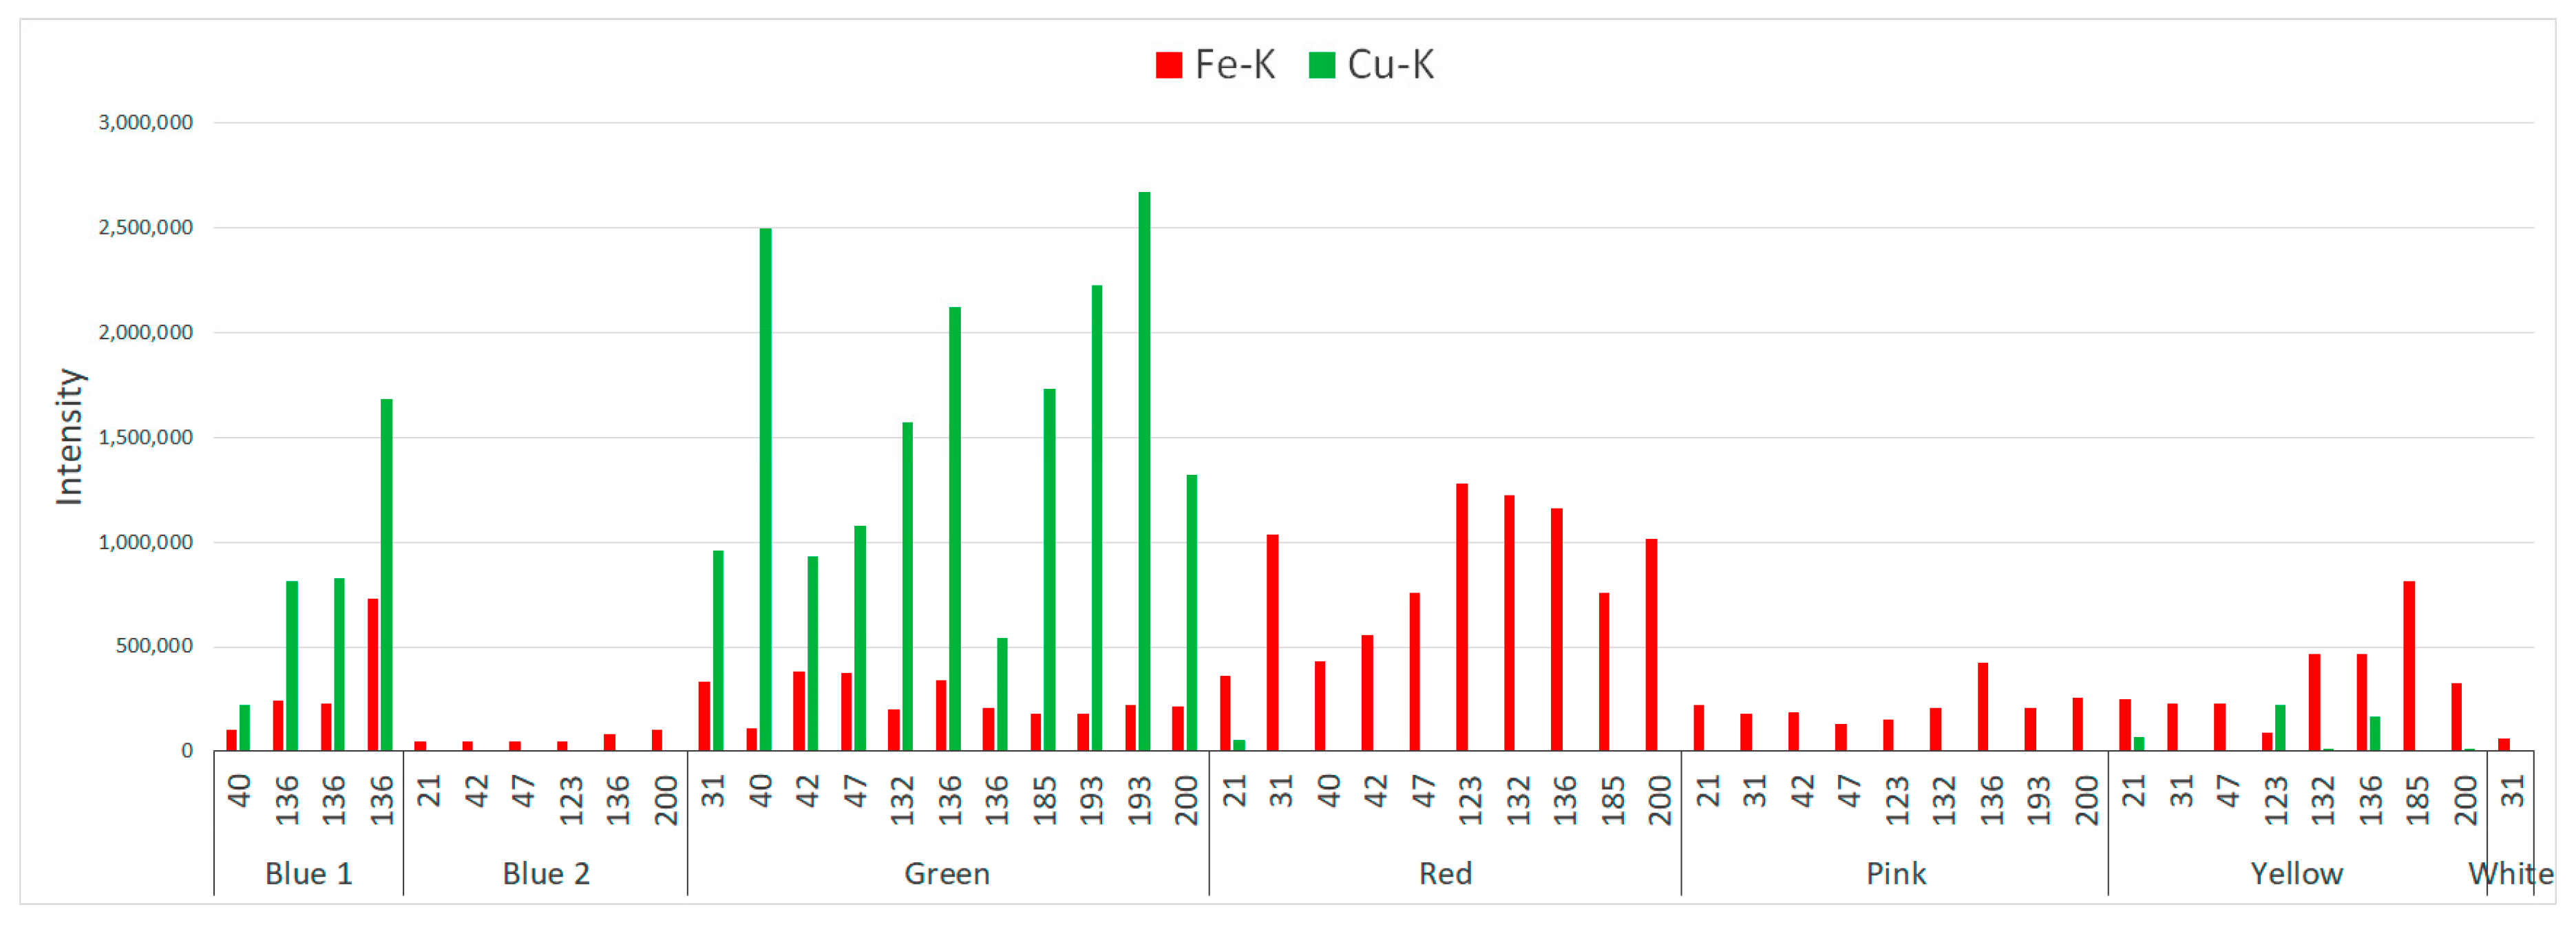
2.2.3. X-Ray Fluorescence (XRF)
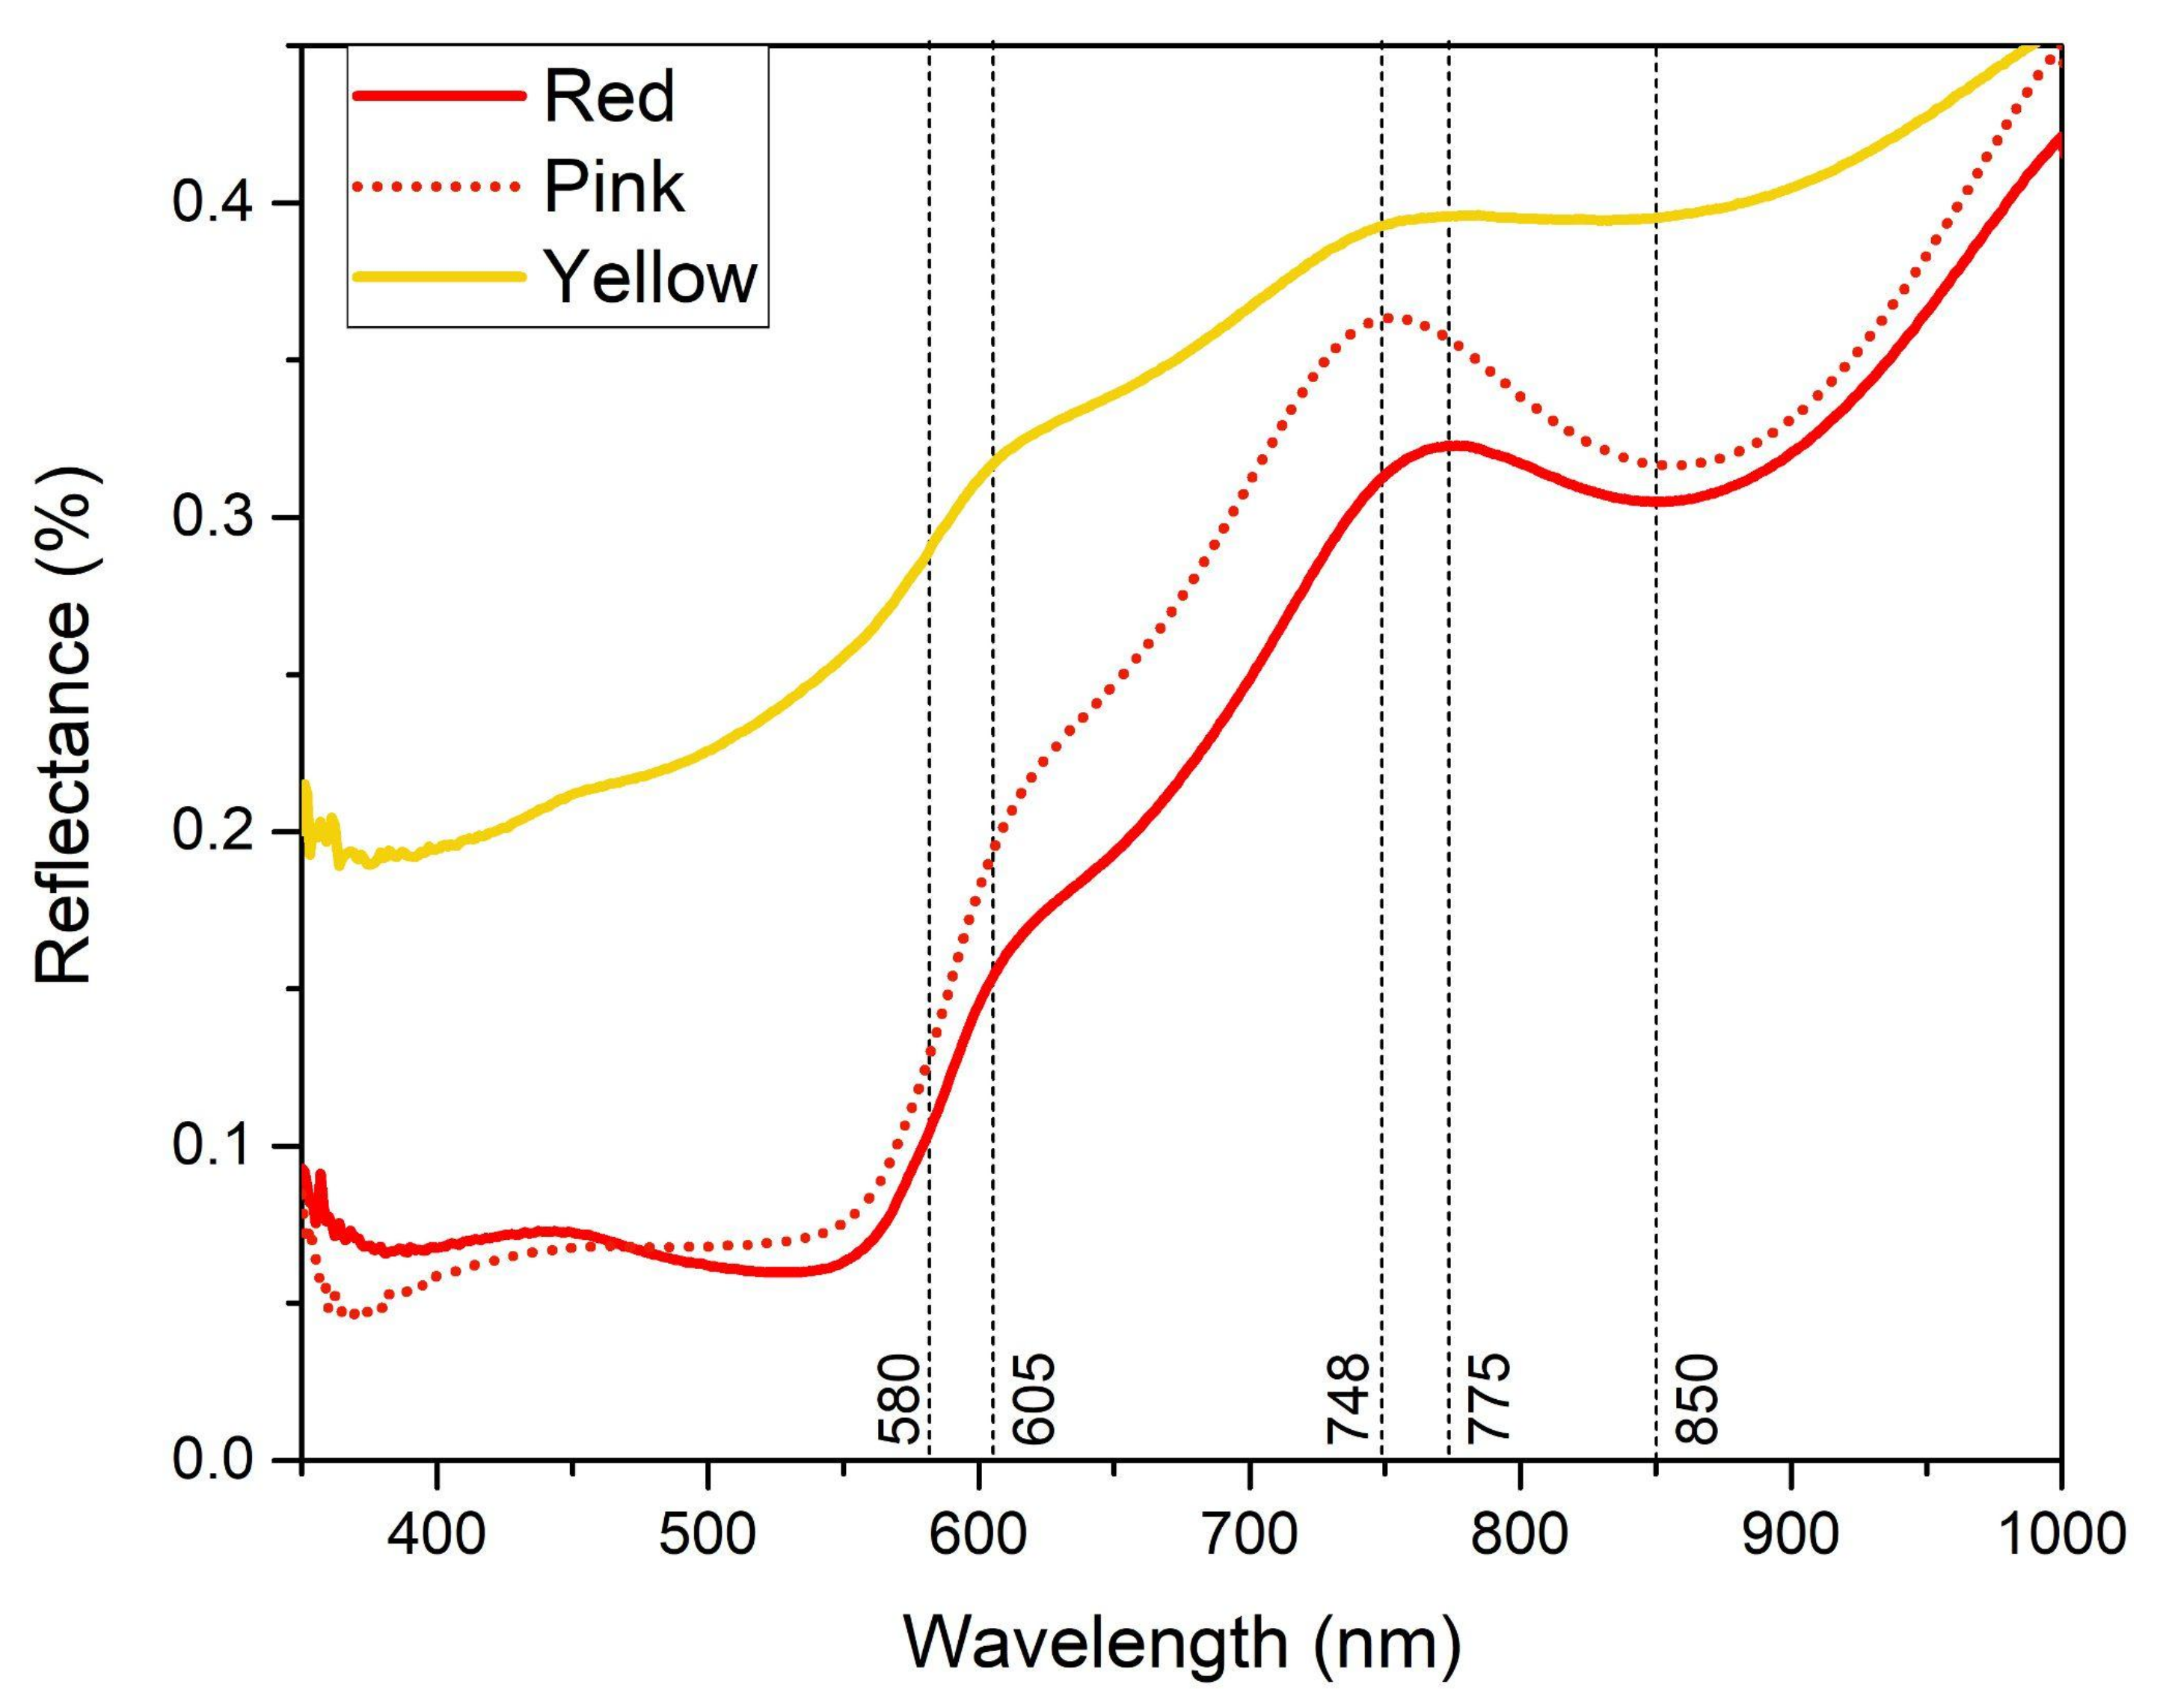
2.2.4. Fiber-Optics Reflectance Spectroscopy (FORS)
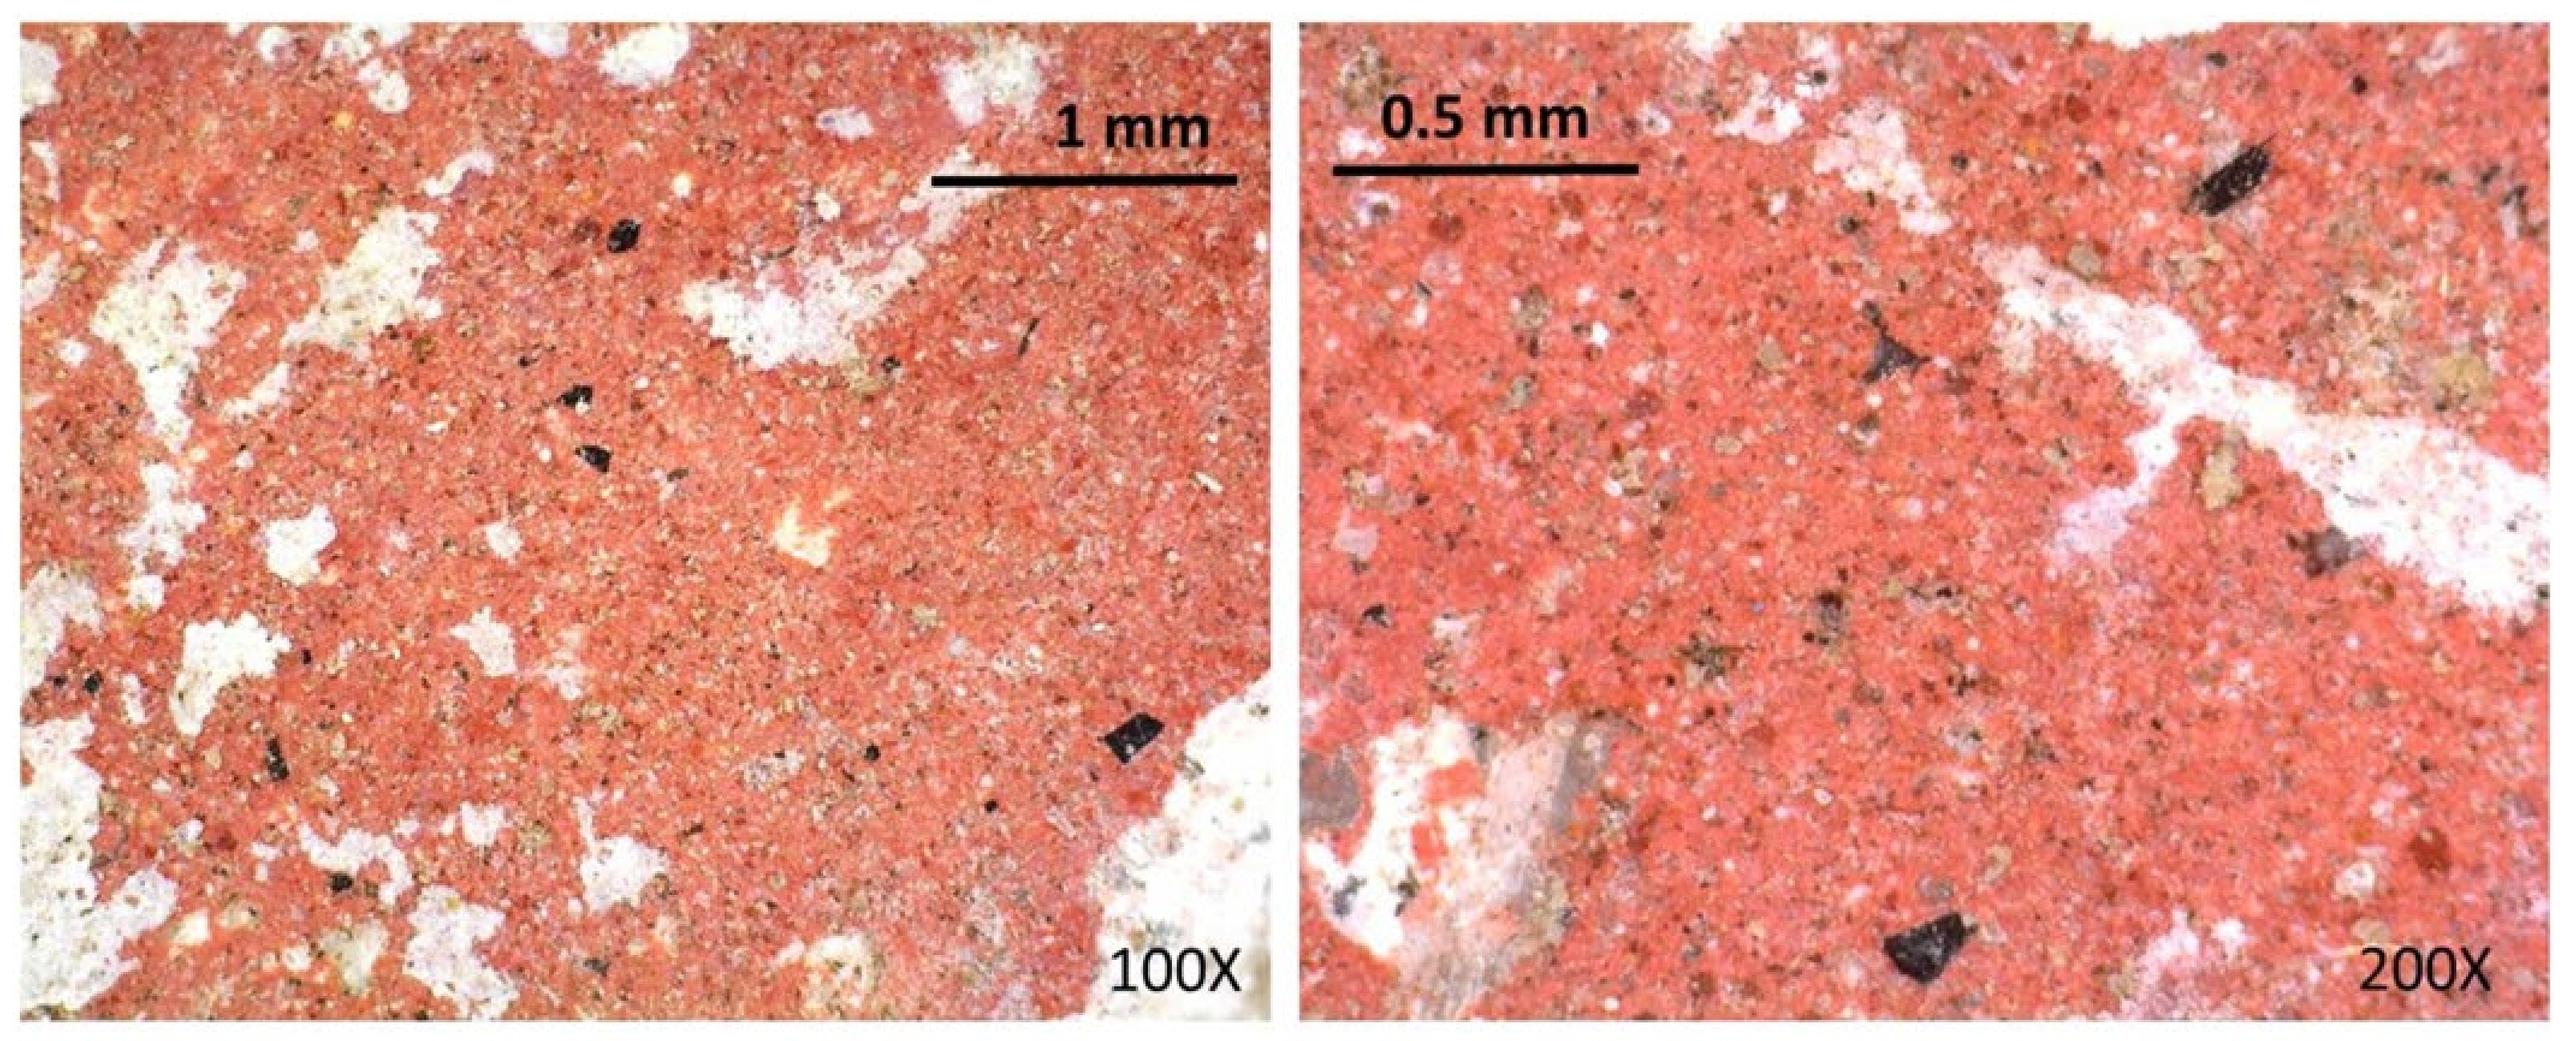
2.2.5. Microscopic Examination
3. Results and Discussion
3.1. Geophysical Prospection
3.2. Mural Fragments Analysis
3.2.1. Red
3.2.2. Yellow
3.2.3. Green
3.2.4. Blue
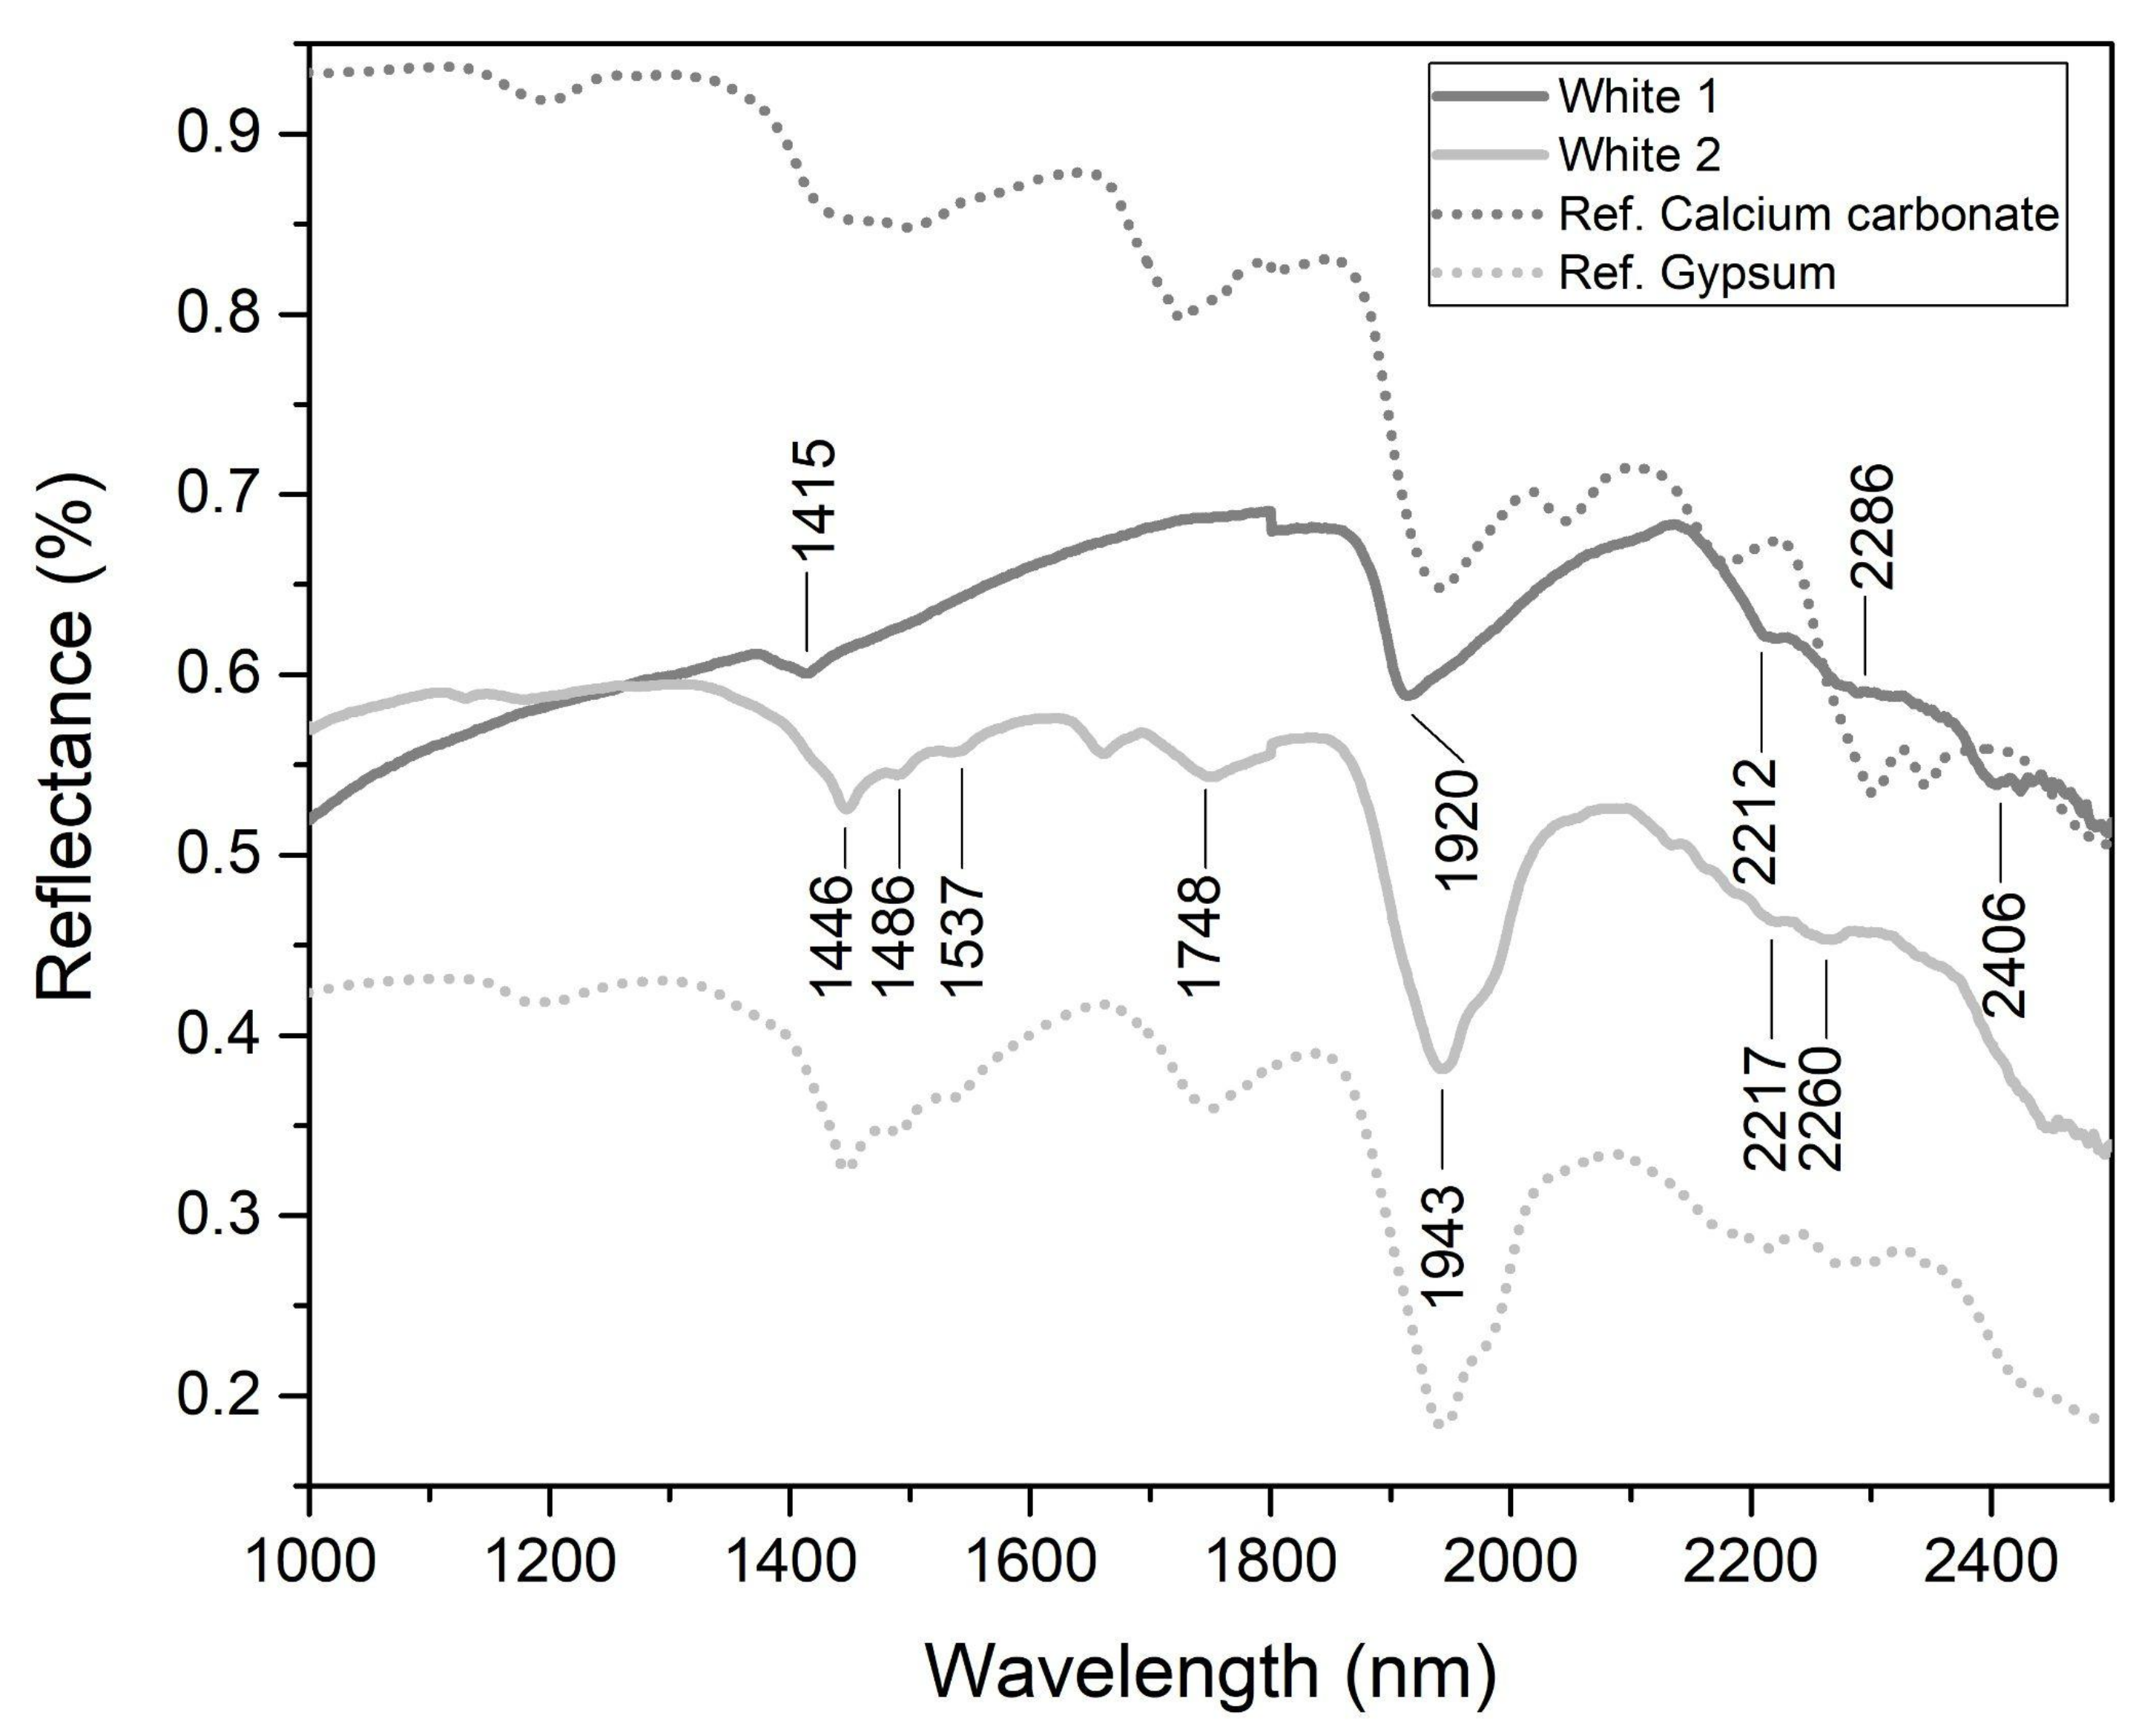
3.2.5. White
3.3. Comparison with Previous Analysis on Mural Paintings from Techinantitla
4. Conclusions
Author Contributions
Funding
Acknowledgments
Conflicts of Interest
References
- Cowgill, G.L. State and society at Teotihuacan, Mexico. Annu. Rev. Anthropol. 1997, 29, 129–161. [Google Scholar] [CrossRef] [Green Version]
- Hirth, K.G.; Arroyo, D.M. (Eds.) Teotihuacan: The World Beyond the City; Dumbarton Oaks Research Library & Collection: Washington, DC, USA, 2020. [Google Scholar]
- de la Fuente, B. La Pintura Mural Prehispánica en México, Teotihuacan; Universidad Nacional Autónoma de México, Instituto de Investigaciones Estéticas: Ciudad de México, Mexico, 1995; Volume I. [Google Scholar]
- Robb, M.H. (Ed.) Teotihuacan: City of Water, City of Fire; Fine Arts Museums of San Francisco-de Young and University of California Press: San Francisco, CA, USA, 2017. [Google Scholar]
- Berrin, K.; Millon, C.; Millon, R.; Pasztory, E.; Seligman, T.K. (Eds.) Feathered Serpents and Flowering Trees: Reconstructing the Murals at Teotihuacan; Fine Arts Museums of San Francisco: San Francisco, CA, USA, 1988. [Google Scholar]
- Magaloni Kerpel, D. El espacio pictórico teotihuacano, tradición y técnica. In La Pintura Mural Prehispánica en México, Teotihuacan; de la Fuente, B., Ed.; Universidad Nacional Autónoma de México, Instituto de Investigaciones Estéticas: Ciudad de México, Mexico, 1996; Volume II, pp. 187–225. [Google Scholar]
- Magaloni Kerpel, D. Teotihuacan: El lenguaje del color. In El Color En El Arte Mexicano Universidad Nacional Autónoma De México; Roque, G., Ed.; Instituto de Investigaciones Estéticas: Ciudad de México, Mexico, 2003; pp. 163–204. [Google Scholar]
- Magaloni Kerpel, D. The Colors of Time: Teotihuacan Mural Painting Tradition. In Teotihuacan. City of Water, City of Fire; Robb, M.H., Ed.; Fine Arts Museums of San Francisco-de Young and University of California Press: San Francisco, CA, USA, 2017; pp. 174–180. [Google Scholar]
- Martínez García, C.; Ruvalcaba Sil, J.L.; Manzanilla, L.R.; Riquelme, F. Teopancazco y su pintura. Aplicación de técnicas analíticas PIXE, MEB-EDX DRX, FTIR y Raman. In Estudios Arqueométricos Del Centro De Barrio De Teopancazco En Teotihuacan; Manzanilla, L.R., Ed.; Universidad Nacional Autónoma de México: Ciudad de México, Mexico, 2012; pp. 165–210. [Google Scholar]
- Miller, A. The Mural Painting of Teotihuacan; Harvard University: Washington, DC, USA, 1973. [Google Scholar]
- Millon, C. The History of Mural art at Teotihuacan In Teotihuacan. XI Mesa Redonda; Ruz Lhuillier, A., Ed.; Sociedad Mexicana de Antropología: México City, Mexico, 1972; pp. 1–17. [Google Scholar]
- Sánchez Morton, L.S. Los Pigmentos Del Sitio 46c: n4e2. Su Manufactura Como Evidencia De Especialización Artesanal; Escuela Nacional de Antropología e Historia: Ciudad de México, Mexico, 2013. [Google Scholar]
- López-Puértolas, C.; Manzanilla-Naim, L.R.; Vázquez-de-Ágredos-Pascual, M.L. Characterization of color production in Xalla’s palace complex. Teotihuacan. Sci. Technol. Archaeol. Res. 2019, 5, 221–233. [Google Scholar] [CrossRef] [Green Version]
- Margolis, S.V. Geochemical and Mineralogical Analysis of Teotihuacan Murals, De Young Museum of San Francisco; Department of Geology, University of California: Davis, CA, USA, 1985. [Google Scholar]
- Millon, R. Where do they all come from? The provenance of the Wagner Murals from Teotihuacan. In Feathered Serpents and Flowering Trees: Reconstructing the Murals at Teotihuacan; Berrin, K., Millon, C., Millon, R., Pasztory, E., Seligman, T.K., Eds.; Fine Arts Museums of San Francisco: San Francisco, CA, USA, 1988; pp. 78–113. [Google Scholar]
- Muñoz-Fuentes, M. La Integración De La Pintura Mural De Techinantitla Y Tlacuilapaxco, Barrio De Amanalco, A La Plástica Teotihuacana. Ph.D. Thesis, Universidad Nacional Autónoma de México, Ciudad de México, Mexico, 2019. [Google Scholar]
- Aguilar-Téllez, D.M.; Ruvalcaba-Sil, J.L.; Claes, P.; González-González, D. False color and infrared imaging for the identification of pigments in paintings. Mater. Res. Soc. Symp. Proc. 2014, 1618, 3–15. [Google Scholar] [CrossRef]
- Moon, T.; Schilling, M.R.; Thirkettle, S. A Note on the Use of False-Color Infrared Photography in Conservation. Stud. Conserv. 1992, 37, 42. [Google Scholar] [CrossRef]
- Cosentino, A. Identification of pigments by multispectral imaging; A flowchart method. Herit. Sci. 2014, 2, 8. [Google Scholar] [CrossRef] [Green Version]
- Solé, V.A.; Papillon, E.; Cotte, M.; Walter, P.; Susini, J. A multiplatform code for the analysis of energy-dispersive X-ray fluorescence spectra. Spectrochim. Acta Part B At. Spectrosc. 2007, 62, 63–68. [Google Scholar] [CrossRef]
- Kubelka, P.; Munk, F. Ein Beitrag zur Optik der Farbanstriche. Z. Für Tech. Phys. 1931, 12, 593–601. [Google Scholar]
- Vargas, W.E.; Niklasson, G.A. Applicability conditions of the Kubelka–Munk theory. Appl. Opt. 1997, 36, 5580. [Google Scholar] [CrossRef]
- Elias, M.; Chartier, C.; Prévot, G.; Garay, H.; Vignaud, C. The colour of ochres explained by their composition. Mater. Sci. Eng. B Solid State Mater. Adv. Technol. 2006, 127, 70–80. [Google Scholar] [CrossRef]
- Aceto, M.; Agostino, A.; Fenoglio, G.; Idone, A.; Gulmini, M.; Picollo, M.; Ricciardi, P.; Delaney, J.K. Characterisation of colourants on illuminated manuscripts by portable fibre optic UV-visible-NIR reflectance spectrophotometry. Anal. Methods 2014, 6, 1488–1500. [Google Scholar] [CrossRef]
- Qiu, J.T.; Qi, H.; Duan, J.L. Reflectance spectroscopy characteristics of turquoise. Minerals 2017, 7, 3. [Google Scholar] [CrossRef] [Green Version]
- Cavaleri, T.; Buscaglia, P.; Migliorini, S.; Nervo, M.; Piccablotto, G.; Piccirillo, A.; Pisani, M.; Puglisi, D.; Vaudan, D.; Zucco, M. Pictorial materials database: 1200 combinations of pigments, dyes, binders and varnishes designed as a tool for heritage science and conservation. Appl. Phys. A Mater. Sci. Process. 2017, 123, 419. [Google Scholar] [CrossRef]
- Istituto Nazionale di Ricerca Metrologica. Pictorial Materials Database. 2017. Available online: https://webimgc.inrim.it/Hyperspectral_imaging/Database.aspx (accessed on 28 April 2021).
- Kokaly, R.F.; Clark, R.N.; Swayze, G.A.; Livo, K.E.; Hoefen, T.M.; Pearson, N.C.; Wise, R.A.; Benzel, W.M.; Lowers, H.A.; Driscoll, R.L.; et al. USGS Spectral Library Version 7. US Geol. Surv. Data Ser. 2017, 1035, 61. [Google Scholar] [CrossRef]
- Fang, Q.; Hong, H.; Zhao, L.; Kukolich, S.; Yin, K.; Wang, C. Visible and Near-Infrared Reflectance Spectroscopy for Investigating Soil Mineralogy: A Review. J. Spectrosc. 2018, 2018, 3168974. [Google Scholar] [CrossRef]
- Gazzola, J. Uso de cinabrio en la pintura mural de Teotihuacán. Arqueología 2009, 40, 57–70. [Google Scholar]
- Argote, D.L.; Torres, G.; Hernández-Padrón, G.; Ortega, V.; López-García, P.A.; Castaño, V.M. Cinnabar, hematite and gypsum presence in mural paintings in Teotihuacan, Mexico. J. Archaeol. Sci. Rep. 2020, 32, 102375. [Google Scholar] [CrossRef]
- Vandenabeele, P.; Bodé, S.; Alonso, A.; Moens, L. Raman spectroscopic analysis of the Maya wall paintings in Ek’Balam, Mexico. Spectrochim. Acta Part A Mol. Biomol. Spectrosc. 2005, 61, 2349–2356. [Google Scholar] [CrossRef] [PubMed]
- Alonso, A.; Pérez, N.A.; Ruvalcaba Sil, J.L.; Casanova, E.; Claes, P.; Aguilar Melo, V.; Cañetas, J. Comparative spectroscopic analysis of Maya wall paintings from Ek’Balam, Mexico. Mater. Res. Soc. Symp. Proc. 2014, 1618, 63–72. [Google Scholar] [CrossRef]
- Corona-Esquivel, R.; Enriquez, F. Modelo Magmático Del Yacimiento De Hierro De Peña Colorada, Colima Y Su Relación Con La Exploración De Otros Yacimientos De Hierro En México; Boletín 113; Instituto de Geología, Universidad Nacional Autónoma de México: Ciudad de México, Mexico, 2004. [Google Scholar]
- Panczner, W.D. Minerals of Mexico; Springer US: New York, NY, USA, 1987. [Google Scholar] [CrossRef]
- Russell, B.W.; Dahlin, B.H. Traditional burnt-lime production at Mayapán, Mexico. J. Field Archaeol. 2008, 32, 407–423. [Google Scholar] [CrossRef]
- Seligson, K.E.; Ortiz Ruiz, S.; Barba Pingarrón, L. Prehispanic Maya Burnt Lime Industries: Previous Studies and Future Directions. Anc. Mesoam. 2019, 30, 199–219. [Google Scholar] [CrossRef]
- Miranda, J.; Gallardo, M.L.; Grimaldi, D.M.; Román-Berrelleza, J.A.; Ruvalcaba-Sil, J.L.; Ontalba Salamanca, M.A.; Morales, J.G. Pollution effects on stone benches of the Eagle Warriors Precinct at the Major Temple, Mexico City. Nucl. Instrum. Methods Phys. Res. Sect. B Beam Interact. Mater. At. 1999, 150, 611–615. [Google Scholar] [CrossRef]
- Domenici, D.; Brunetti, B.G.; Miliani, C.; Sgamellotti, A. Non-invasive investigations on Mesoamerican codices: The MOLAB approach. Rend. Lincei 2020, 31, 773–778. [Google Scholar] [CrossRef]
- Domenici, D.; Buti, D.; Miliani, C.; Sgamellotti, A. Changing Colours in a Changing World. The Technology of Codex Painting in Post-Classic and Early Colonial Mesoamerica. In Materia Americana; The Body of Spanish American Images, (16th to Mid-19th Centuries); Siracusano, G., Romero, A.R., Eds.; Universidad Nacional de Tres de Febrero & The Getty Foundation: Buenos Aires, Argentina, 2020; pp. 45–57. [Google Scholar]
- Casanova-González, E.; Maynez-Rojas, M.Á.; Mitrani, A.; Rangel-Chávez, I.; García-Bucio, M.A.; Ruvalcaba-Sil, J.L.; Muñoz-Alcócer, K. An imaging and spectroscopic methodology for in situ analysis of ceiling and wall decorations in Colonial missions in Northern Mexico from XVII to XVIII centuries. Herit. Sci. 2020, 8, 91. [Google Scholar] [CrossRef]
- Ricciardi, P.; Pallipurath, A.; Rose, K. “It’s not easy being green”: A spectroscopic study of green pigments used in illuminated manuscripts. Anal. Methods 2013, 5, 3819–3824. [Google Scholar] [CrossRef] [Green Version]
- Dooley, K.A.; Lomax, S.; Zeibel, J.G.; Miliani, C.; Ricciardi, P.; Hoenigswald, A.; Loew, M.; Delaney, J.K. Mapping of egg yolk and animal skin glue paint binders in Early Renaissance paintings using near infrared reflectance imaging spectroscopy. Analyst 2013, 138, 4838–4848. [Google Scholar] [CrossRef]
- Gabrieli, F.; Dooley, K.A.; Facini, M.; Delaney, J.K. Near-UV to mid-IR reflectance imaging spectroscopy of paintings on the macroscale. Sci. Adv. 2019, 5. [Google Scholar] [CrossRef] [PubMed] [Green Version]
- Hosler, D.; Macfarlane, A. Copper sources, metal production, and metals trade in Late Postclassic Mesoamerica. Science 1996, 273, 1819–1824. [Google Scholar] [CrossRef]
- Lyu, S.; Liu, Y.; Hou, M.; Yin, Q.; Wu, W.; Yang, X. Quantitative analysis of mixed pigments for Chinese paintings using the improved method of ratio spectra derivative spectrophotometry based on mode. Herit. Sci. 2020, 8, 31. [Google Scholar] [CrossRef] [Green Version]
- Hunt, G.; Salisbury, J. Visible and near infrared spectra of minerals and rocks. II. Carbonates. Mod. Geol. 1971, 2, 23–30. [Google Scholar]
- Gaffey, S.J. Spectral reflectance of carbonate minerals in the visible and near infrared (0.35–2.55 microns): Calcite, aragonite, and dolomite. Am. Mineral. 1986, 71, 151–162. [Google Scholar]
- Clark, R.N.; King, T.V.V.; Klejwa, M.; Swayze, G.A.; Vergo, N. High spectral resolution reflectance spectroscopy of minerals. J. Geophys. Res. 1990, 95, 12653–12680. [Google Scholar] [CrossRef] [Green Version]
- Gomez, C.; Lagacherie, P.; Coulouma, G. Continuum removal versus PLSR method for clay and calcium carbonate content estimation from laboratory and airborne hyperspectral measurements. Geoderma 2008, 148, 141–148. [Google Scholar] [CrossRef]
- Liu, Y. Mid-IR, and NIR spectroscopic study of calcium sulfates and mapping gypsum abundances in Columbus crater, Mars. Planet. Space Sci. 2018, 163, 35–41. [Google Scholar] [CrossRef]
- Buti, D.; Domenici, D.; Miliani, C.; García Sáiz, C.; Gómez Espinoza, T.; Jímenez Villalba, F.; Verde Casanova, A.; Sabía de la Mata, A.; Romani, A.; Presciutti, F.; et al. Non-invasive investigation of a pre-Hispanic Maya screenfold book: The Madrid Codex. J. Archaeol. Sci. 2014, 42, 166–178. [Google Scholar] [CrossRef]
- Maynez-Rojas, M.A.; Casanova-González, E.; Ruvalcaba-Sil, J.L. Identification of natural red and purple dyes on textiles by Fiber-optics Reflectance Spectroscopy. Spectrochim. Acta A 2017, 178, 239–250. [Google Scholar] [CrossRef]
- Grazia, C.; Buti, D.; Amat, A.; Rosi, F.; Romani, A.; Domenici, D.; Sgamellotti, A.; Miliani, C. Shades of blue: Non-invasive spectroscopic investigations of Maya blue pigments. From laboratory mock-ups to Mesoamerican codice. Herit. Sci. 2020, 8, 1. [Google Scholar] [CrossRef] [Green Version]
- Manrique-Ortega, M.D.; Mitrani, A.; Casanova-González, E.; Pérez-Ireta, G.; García-Bucio, M.A.; Rangel-Chávez, I.; Sugiyama, S. Material study of green stone artifacts from a Teotihuacan complex. Mater. Manuf. Process. 2020, 35, 1431–1445. [Google Scholar] [CrossRef]
- Barba, L.; Blancas, J.; Manzanilla, L.R.; Ortiz, A.; Barca, D.; Crisci, G.M.; Pecci, A. Provenance of the limestone used in Teotihuacan (Mexico): A methodological approach. Archaeometry 2009, 51, 525–545. [Google Scholar] [CrossRef]
- Rattray, E.C. New findings on the origins of thin orange ceramics. Anc. Mesoam. 1990, 1, 181–195. [Google Scholar] [CrossRef]


| Box | Chromia | Description | Relationship | |||||
|---|---|---|---|---|---|---|---|---|
| Mono | Bi | Poly | Total | De Young Museum Collection | In Situ Murals | Other Work [16] | ||
| 15 | 1 | 1 | Tlaloc god corner | 1 | ||||
| 17 | 1 | 2 | 3 | Fragments | 1 | |||
| 20 | 1 | 1 | Dot and bar | 1 | ||||
| 21 | 4 | 4 | Footprints | 1 | ||||
| 23 | 1 | 1 | Red and pink color | 1 | ||||
| 28 | 2 | 2 | Eye drop/footprints | 1 | ||||
| 29 | 2 | 2 | Human figure with glyph | 1 | ||||
| 30 | 1 | Red Drops | 1 | |||||
| 31 | 3 | 3 | Tlaloc god/godess | 1 | ||||
| 40 | 1 | 1 | Box with beads | 1 | ||||
| 42 | 2 | 2 | Tlaloc god | 1 | ||||
| 47 | 1 | 1 | Tlaloc god | 1 | ||||
| 43 | 1 | Hands with claws | 1 | |||||
| 62 | 1 | 2 | 3 | Slope corner | 1 | |||
| 65 | 1 | 1 | Green circles on pink | 1 | ||||
| 74 | 5 | 1 | 6 | Shades of red | 1 | |||
| 84 | 1 | 1 | Peaks in pink | 1 | ||||
| 108 | 2 | 5 | 7 | Feathers | 1 | |||
| 113 | 1 | 1 | Slope with Tlaloc god | 1 | ||||
| 116 | 1 | 1 | Slope with Green circle | 1 | ||||
| 123 | 2 | 2 | 4 | Blue Peak with pink | 1 | |||
| 132 | 1 | Hands with claws | 1 | |||||
| 136 | 5 | 5 | Various, face shape | 1 | ||||
| 140 | 4 | 4 | Slope with green circles, yellow flower | 1 | ||||
| 141 | 1 | 1 | 15 | 17 | Bird fragments | 1 | ||
| 142 | 2 | 2 | Red with claws | 1 | ||||
| 184 | 1 | 1 | Footprints & human figure with glyph | 1 | ||||
| 185 | 1 | 1 | Spike bars | 1 | ||||
| 193 | 1 | 1 | Green feathers on pink | 1 | ||||
| 200 | 1 | Feathers | 1 | |||||
| 201 | 1 | Feathers with circles | 1 | |||||
| Total | 9 | 10 | 64 | 83 | 3 | 18 | 9 | |
| Box | Red | Yellow | Green | Blue | White |
|---|---|---|---|---|---|
| 15 | Hematite * | - | Malachite * | - | - |
| 17 | Hematite * | - | Malachite * | - | - |
| 20 | Hematite * | - | Malachite * | - | - |
| 21 | Hematite *† Fe, Cu ‡ | Yellow earths † Fe, Cu ‡ | - | Earths † ∅ | - |
| 23 | Hematite *† | - | - | - | - |
| 28 | Hematite *† | - | Malachite *† + earths † | - | - |
| 29 | Hematite * | - | - | - | - |
| 30 | Hematite *† | Yellow earths † | - | - | Earths, CaCO3 † |
| 31 | Hematite *† Fe ‡ | Yellow earth Fe ‡ | Malachite *† + earths † | - | Earths, CaCO3 † Ca ‡ |
| 40 | Hematite *† Fe ‡ | - | Malachite *† + earths † Cu, Fe ‡ | Earths † Cu, Fe-Azurite ‡ | Earths, CaCO3 † Cu, Fe ‡ |
| 42 | Hematite *† Fe ‡ | Malachite *† + earths † Cu, Fe ‡ | Earths † ∅ | - | |
| 43 | Hematite * | - | Malachite * | - | - |
| 47 | Hematite *† Fe ‡ | Yellow earths Fe ‡ | Malachite * | Earths † Cu, Fe ‡ | Earths, CaCO3 † |
| 62 | Hematite * | - | Malachite * | - | - |
| 65 | Hematite *† | - | Malachite *† | - | - |
| 74 | Hematite *† | Yellow earths † | - | - | - |
| 84 | Hematite *† | - | - | - | - |
| 108 | Hematite † | Yellow earths † | Azurite + malachite + earths † | - | Gypsum † |
| 113 | Hematite * | - | Malachite * | - | - |
| 116 | Hematite * | - | Malachite * | - | - |
| 123 | Hematite *† Fe ‡ | Yellow earths Cu, Fe ‡ | Malachite * | Earths † ∅ | - |
| 132 | Hematite † Fe ‡ | Yellow earth Fe ‡ | Malachite + earths † Cu, Fe ‡ | Earths † Cu, Fe ‡ | - |
| 136 | Hematite *† Fe ‡ | Yellow earths † Fe, Cu ‡ | Malachite *† + earths † /Earths † Cu, Fe ‡ | Earths † Cu, Fe-Azurite ‡ | Earths, CaCO3 † Cu, Fe ‡ |
| 140 | Hematite * | - | Malachite * | - | - |
| 141 | Hematite | Yellow earths † | Malachite *† + earths † | Azurite/Earths † | Probable gypsum † |
| 142 | Hematite * | - | - | - | - |
| 184 | Hematite *† | - | - | - | - |
| 185 | Hematite *† Fe ‡ | Yellow earths † Fe ‡ | Malachite * | Earths † Cu, Fe ‡ | Earths, CaCO3 † Cu, Fe ‡ |
| 193 | Hematite *† Fe ‡ | - | Malachite *† Cu, Fe ‡ | - | - |
| 200 | Hematite † Fe ‡ | Yellow earths † Fe ‡ | Malachite + earths † | Earths † | - |
| 201 | Hematite † | Yellow earths † | Malachite † | Earths † | Earths, gypsum † |
Publisher’s Note: MDPI stays neutral with regard to jurisdictional claims in published maps and institutional affiliations. |
© 2021 by the authors. Licensee MDPI, Basel, Switzerland. This article is an open access article distributed under the terms and conditions of the Creative Commons Attribution (CC BY) license (https://creativecommons.org/licenses/by/4.0/).
Share and Cite
Ruvalcaba-Sil, J.L.; Barba, L.; Casanova-González, E.; Mitrani, A.; Muñoz, M.; Rangel-Chavez, I.; Maynez-Rojas, M.Á.; Cañetas, J. Analytical Approach for the Study of Teotihuacan Mural Paintings from the Techinantitla Complex. Minerals 2021, 11, 508. https://doi.org/10.3390/min11050508
Ruvalcaba-Sil JL, Barba L, Casanova-González E, Mitrani A, Muñoz M, Rangel-Chavez I, Maynez-Rojas MÁ, Cañetas J. Analytical Approach for the Study of Teotihuacan Mural Paintings from the Techinantitla Complex. Minerals. 2021; 11(5):508. https://doi.org/10.3390/min11050508
Chicago/Turabian StyleRuvalcaba-Sil, José Luis, Luis Barba, Edgar Casanova-González, Alejandro Mitrani, Margarita Muñoz, Isaac Rangel-Chavez, Miguel Ángel Maynez-Rojas, and Jaqueline Cañetas. 2021. "Analytical Approach for the Study of Teotihuacan Mural Paintings from the Techinantitla Complex" Minerals 11, no. 5: 508. https://doi.org/10.3390/min11050508