Article

Experimental Determination of the Effect of CaO and Al2O3 in Slag Systems Related to the Conversion Process of High Copper Matte Grade

1
Metallurgy Engineering department, Universidad Técnica Federico Santa María, Valparaiso 2340000, Chile
2
Independent Consultant, Santiago 8320000, Chile
*
Author to whom correspondence should be addressed.
Minerals 2019, 9(11), 716; https://doi.org/10.3390/min9110716
Submission received: 6 September 2019 / Revised: 23 October 2019 / Accepted: 31 October 2019 / Published: 19 November 2019
(This article belongs to the Section Mineral Processing and Extractive Metallurgy)

Abstract

:
The slags generated in the conventional copper conversion process are mainly composed of Cu2O–Fe2O3–SiO2 with CaO, Al2O3, and MgO compounds—in concentrations up to 10 wt %. The present work contributes to the knowledge of the conversion process, generating experimental data for the phase diagrams of the Cu2O–Fe2O3–SiO2–Al2O3 and Cu2O–Fe2O3–SiO2–CaO systems. The experiments were carried out in a tubular furnace at temperatures of 1150 °C and 1200 °C, under a condition of saturation with tridymite and spinel. Once the equilibrium was reached, the samples were immediately quenched in water. The phases in the samples were observed through a scanning electron microscope (SEM) and the elemental composition of the phases were analyzed by means of energy-dispersive X-ray spectroscopy (EDS) detectors. The addition of Al2O3 and CaO into the Cu2O–Fe2O3–SiO2 system resulted in an appreciable displacement of the liquidus lines, corresponding to an expansion of the liquid in the tridymite primary phase field. The addition of CaO and Al2O3 combined was evaluated on industrial slags and from samples obtained in a Peirce–Smith furnace, with increasing amounts of CaO in the flux.

1. Introduction

In most Chilean smelters, conversion Peirce–Smith Furnaces are loaded with high copper matte (70–75 wt % Cu) [1]. Due to the low concentration of iron in these mattes (up to 5 wt %), it is considered that separating the conversion process into two stages is neither operational nor environmentally convenient. Therefore, the process is carried out in a single stage and the generated slag is reported to contain a large proportion of solid phases and relatively high concentrations of copper (wt % Cu > 40) [2]. A high proportion of solid phases increases the apparent viscosity and creates a number of difficulties during the smelting operation.
The basic thermodynamic system to represent these slags is Cu2O–Fe2O3–SiO2. The phase diagram of this system, at the temperatures of interest (between 1150 °C and 1400 °C), was recently reported in the literature [3]. The reported phase diagram indicates an appreciable reduction of the liquid area at temperatures below 1250 °C and Cu2O concentrations between 15 and 20 wt %. This fact explains the observed formation of solid phases during the conversion process and consequently, the reported ejection of materials from the furnace, the generation of slags with high viscosity that are difficult to remove from the furnace, and the buildup of accretions in the furnace [1].
The addition of CaO and Al2O3 has the potential to expand the liquid area of FeOx–SiO2 slag systems, as demonstrated in a number of publications [4,5,6,7,8,9]. Technical works related to industrial operations with added CaO and Al2O3 are also available in the literature [10,11,12,13]. While there are indications of improvements in slag viscosity properties [14,15,16], systematic thermodynamic information related to the effect of CaO and Al2O3 in the Cu2O–FeOx–SiO2 system is at the moment not reported in the literature.
In the present work, the effect of Al2O3 and CaO on the Cu2O–Fe2O3–SiO2 system has been systematically studied via laboratory smelting conversion conditions. The experimental results were the base for industrial tests in a Peirce–Smith converter.
The analysis of the obtained laboratory experiments and industrial tests is the topic of the present publication.

2. Materials and Methods

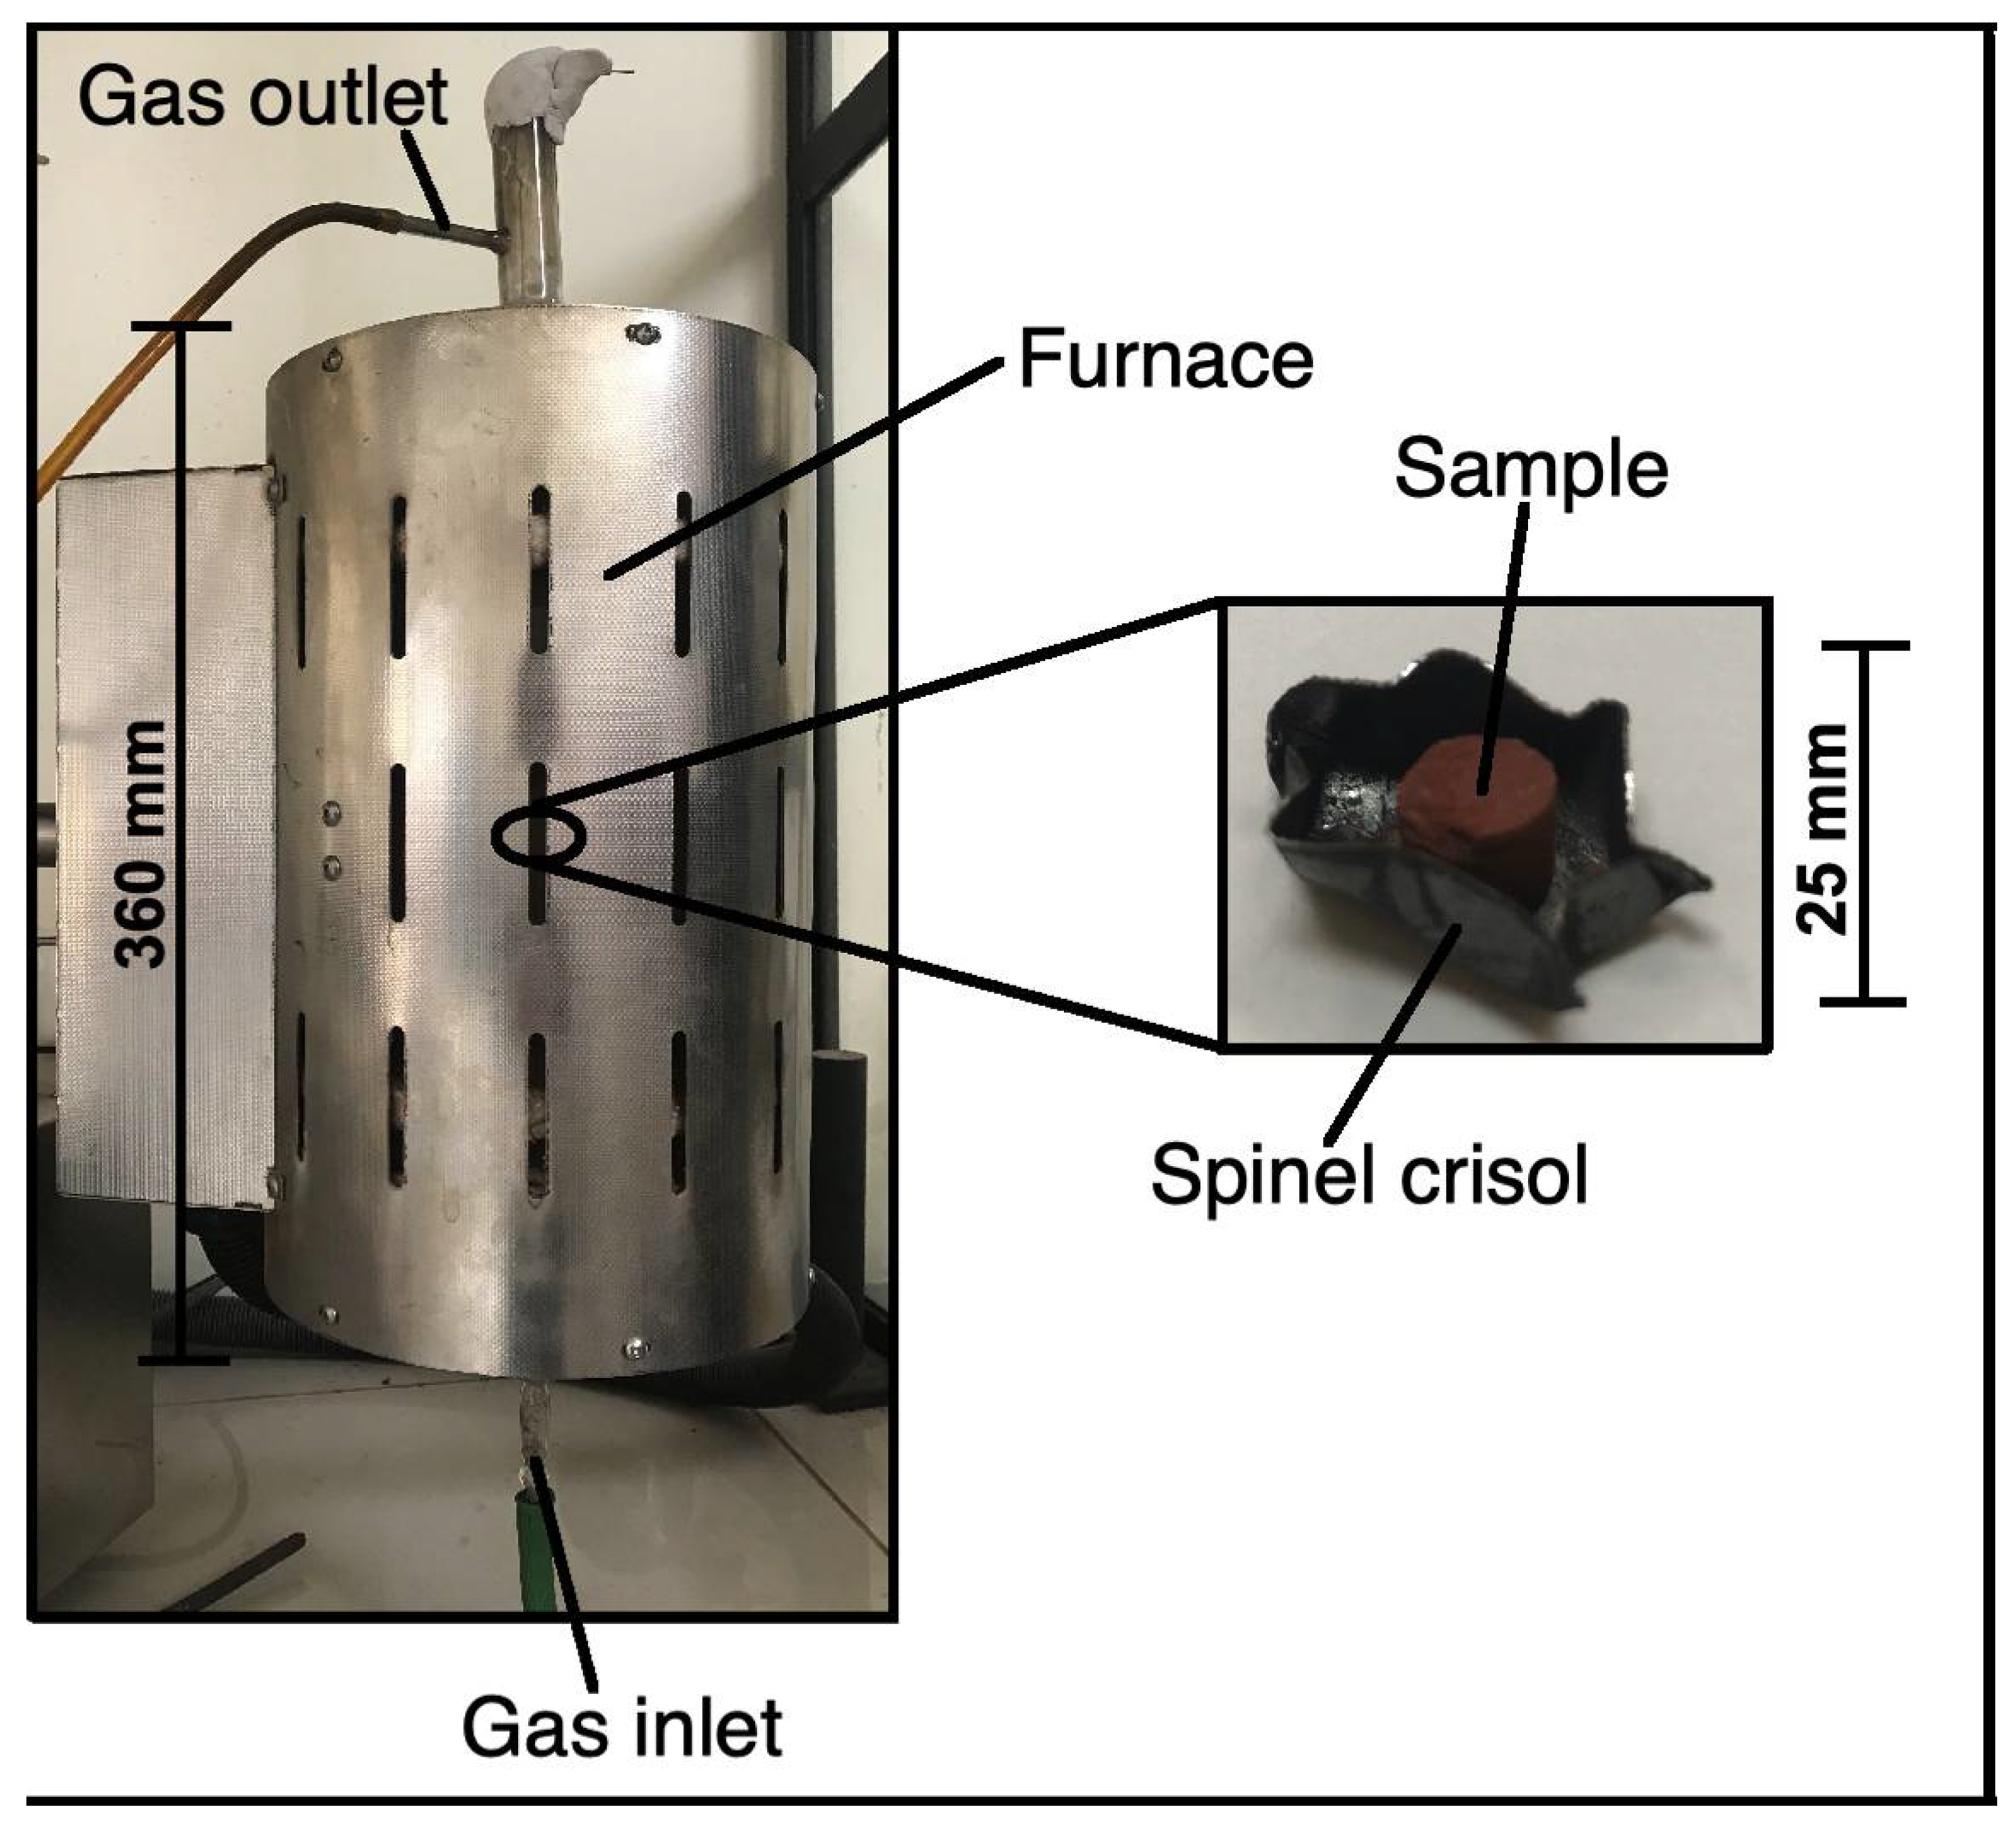
2.1. Experimental Method

The experimental work was carried out at three different levels:
  • Equilibrium of synthetic slag/copper with CaO or Al2O3 addition
  • Equilibrium of industrial slag/blister copper with addition of CaO
  • Industrial smelting tests with addition of CaO and Al2O3
The experiments of level 1 were carried out according to the experimental procedures described in previous work [3,17]. The starting mixtures for the experiments with synthetic slags were made from Al2O3, CaO, and SiO2 powders with 99.9 wt % purity and Cu2O, Fe2O3, and Cu powders with 99.0 wt % purity. Approximately 1.0 g of sample was weighted, mixed in an agate mortar and pestle, pelletized, and finally placed in a silica or iron oxide substrate, depending on whether the experiments were to be performed in the tridymite or spinel primary phase field, respectively. The experiments were conducted in a vertical reaction alumina tube (30 mm i.d.) with electrically heated furnaces and the sample was placed at the target temperature for six hours, as shown in Figure 1. The furnace temperature was controlled by a type-K thermocouple placed immediately adjacent to the sample. This thermocouple was periodically calibrated against the melting point of metallic copper. The overall absolute temperature accuracy is estimated to be within 3 K. The inert atmosphere for the experiments was maintained by using high purity argon gas.
The experiments of level 2 were carried out by introducing an industrial slag, blister copper, and incremental additions of CaO in a silica ampoule, similar to the method described in the previous paragraph. The ampoule was fluxed with high purity argon gas and then vacuumed and sealed. The objective of this procedure was to conserve the partial pressure of oxygen and sulfur in the experiment, to replicate the gas phase of a smelting operation.
Once the time of the experiment had elapsed, in experiments of level 1 and 2, the sample was quenched in water, mounted in an epoxy resin, and a conventional metallographic polishing technique was used for further microanalysis. With the adopted quenching technique, the observed slag did not conform to a glassy material, and an area analysis of 100 μm × 100 μm was performed. The available instrument, EPMA/WDS (JEOL JXA 8200L), does not allow a large area analysis of 100 μm × 100 μm. That analysis was made possible by the EDS (Carl Zeiss, Oberkochen, Germany, EVO MA 10/EDS Oxford Instruments X-Act) technique. It is important to remark that the WDS analysis only has meaning when the probe or volume to be analyzed is completely homogeneous. High purity internal standards of tridymite, Fe2O3, Cu2O·Fe2O3, and Cu were used for the microanalysis.
An analysis of the degrees of freedom was made and the temperature and total pressure were fixed. The number of elements in the system was 5 (Fe, Cu, Si, O, and addition of Al or Ca) and the number of phases was 3 (liquid slag, liquid copper, and tridymite or spinel). The number of degrees of freedom was obtained by using Equation (1). From the initial composition, the amount of Cu2O and CaO or Al2O3 was fixed, thus there are no degrees of freedom.
F = C − P + 2
The experiments of level 3 were carried out by adding CaO and Al2O3 in an industrial Pierce–Smith furnace. The temperature of the furnace was controlled between 1230 °C and 1250 °C. CaO and Al2O3 were added as cold charges. Once the blowing time was reached, samples of slags were taken and analyzed by SEM/EDS (Carl Zeiss, Oberkochen, Germany, EVO MA 10/EDS Oxford Instruments X-Act). The experiments were also monitored to observe the fluidity of the slags during tapping and the formation or dissolution of accretions in the mouth of the furnace.

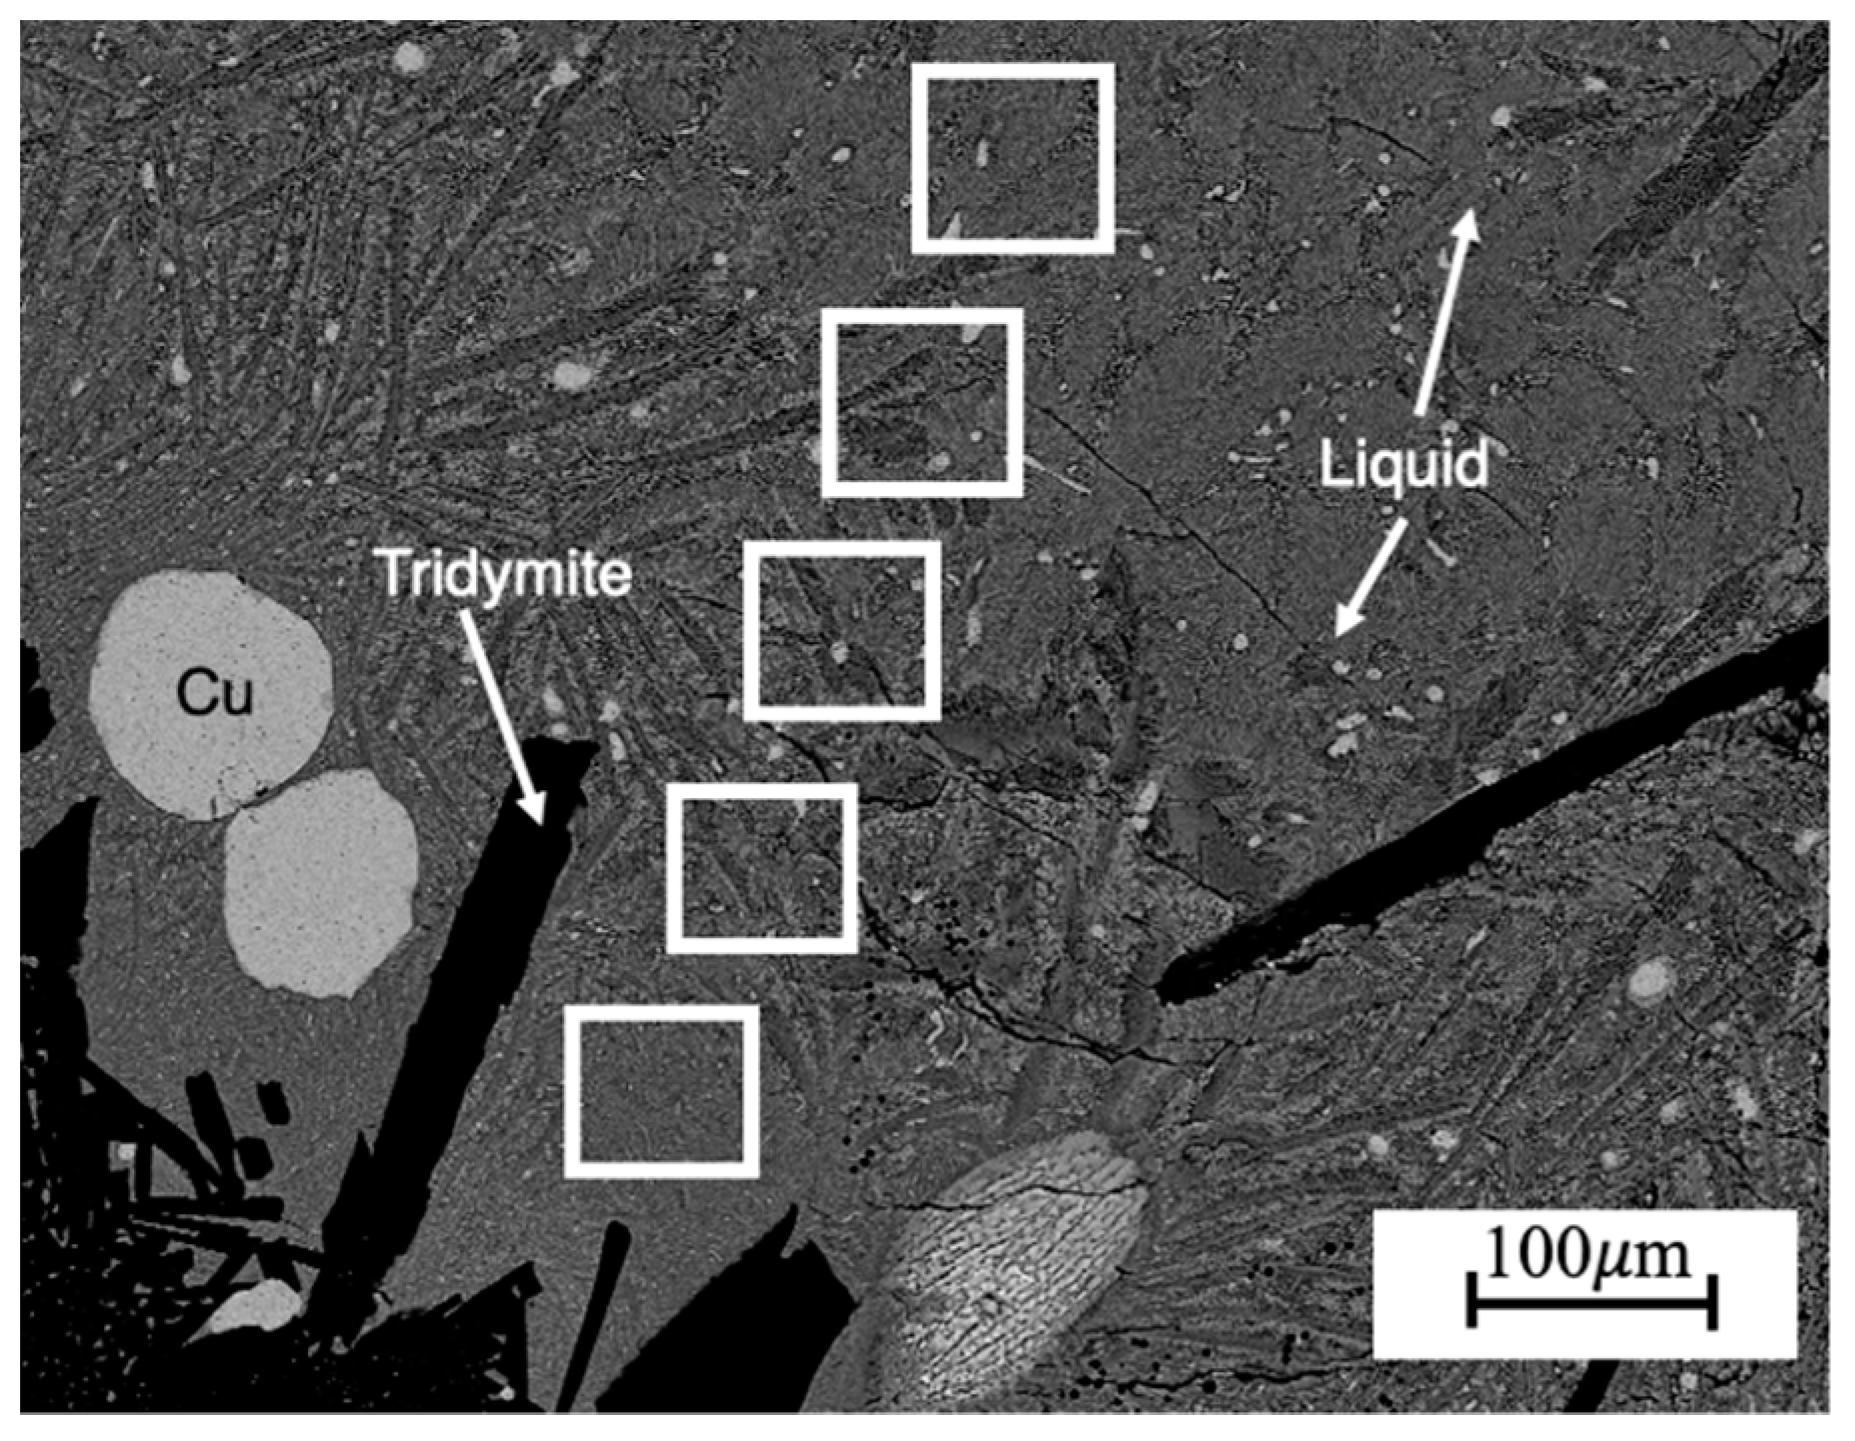
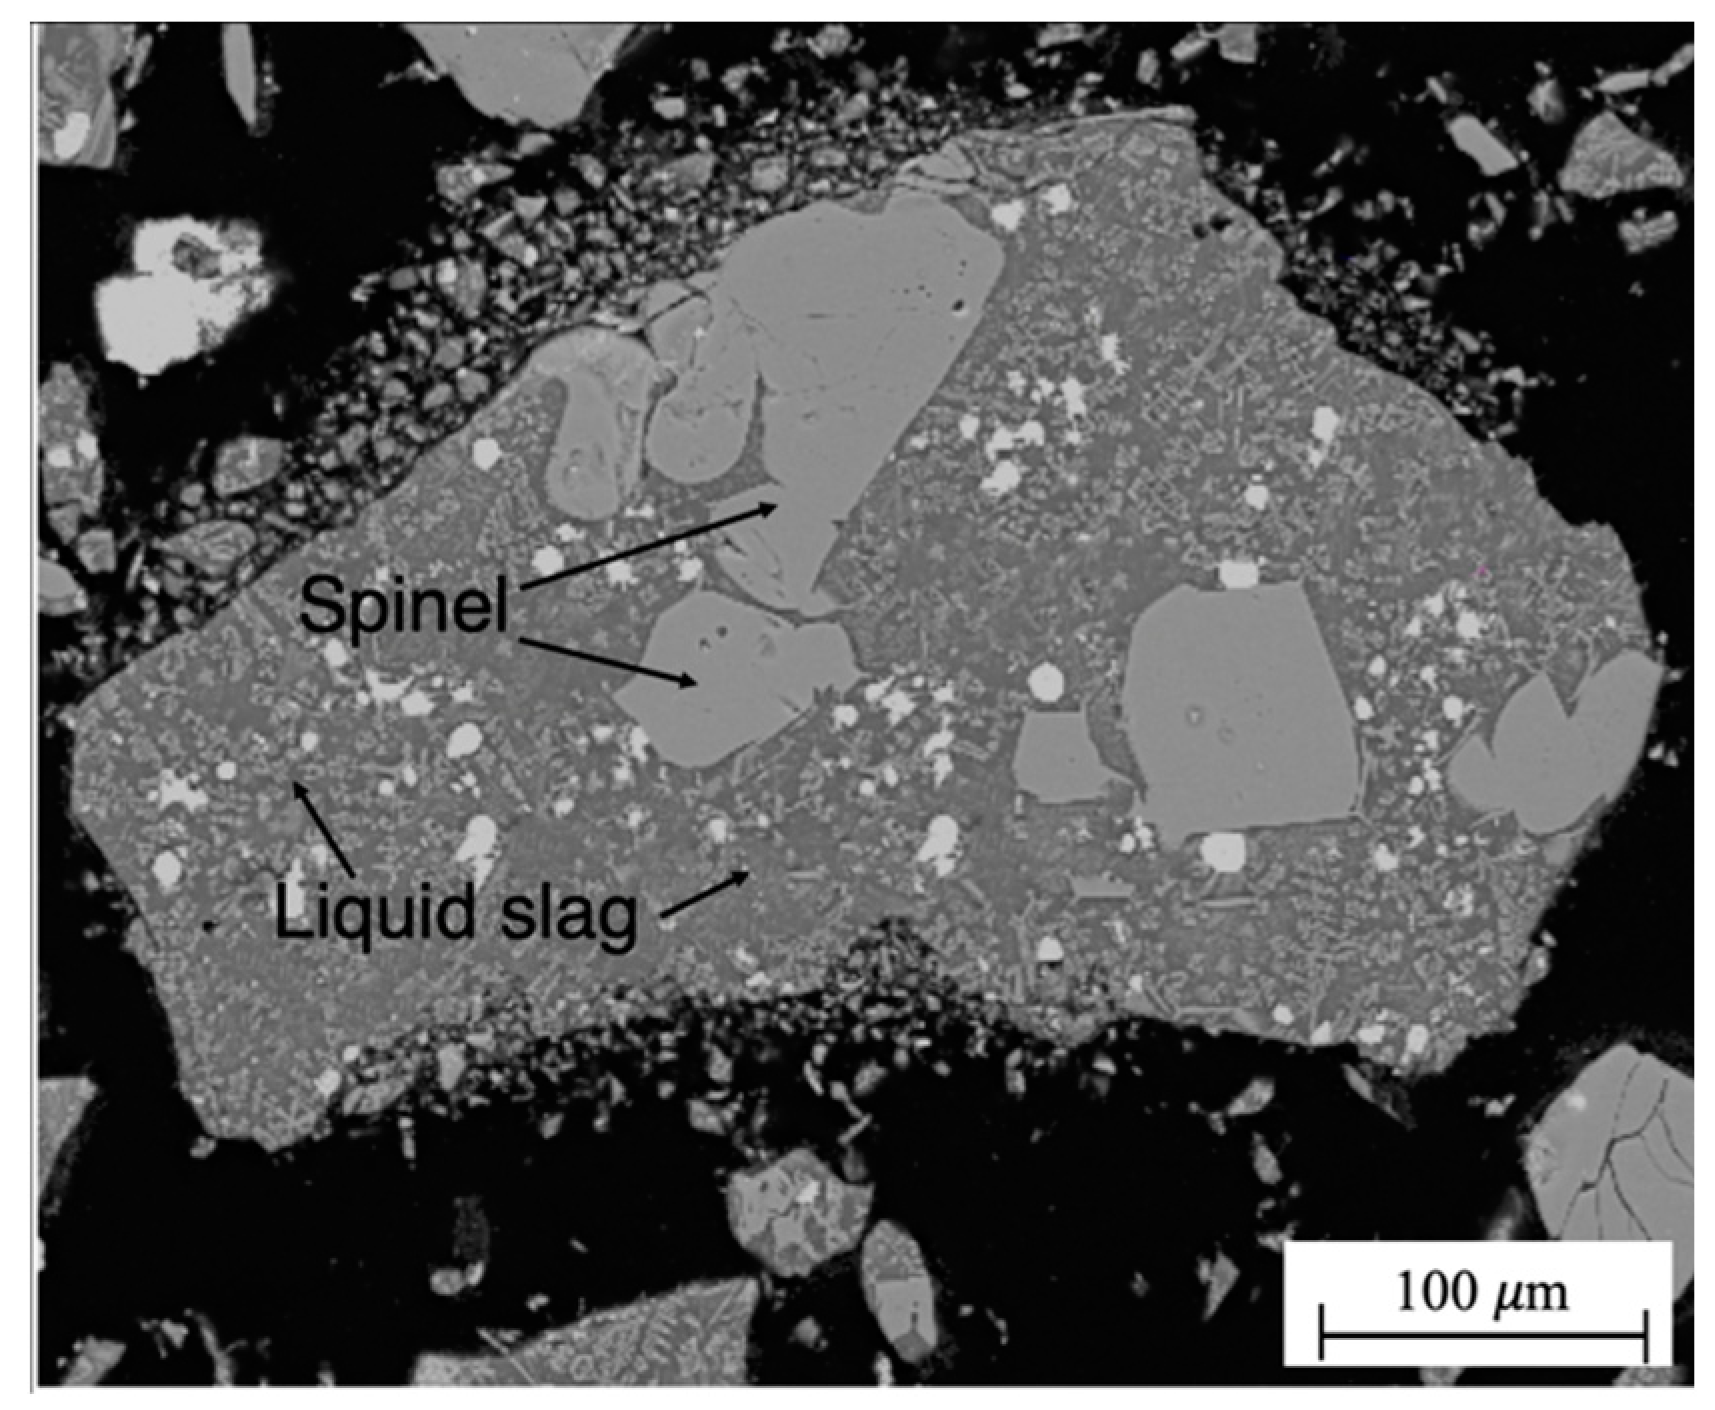
2.2. Confirmation of Achievement of Equilibrium
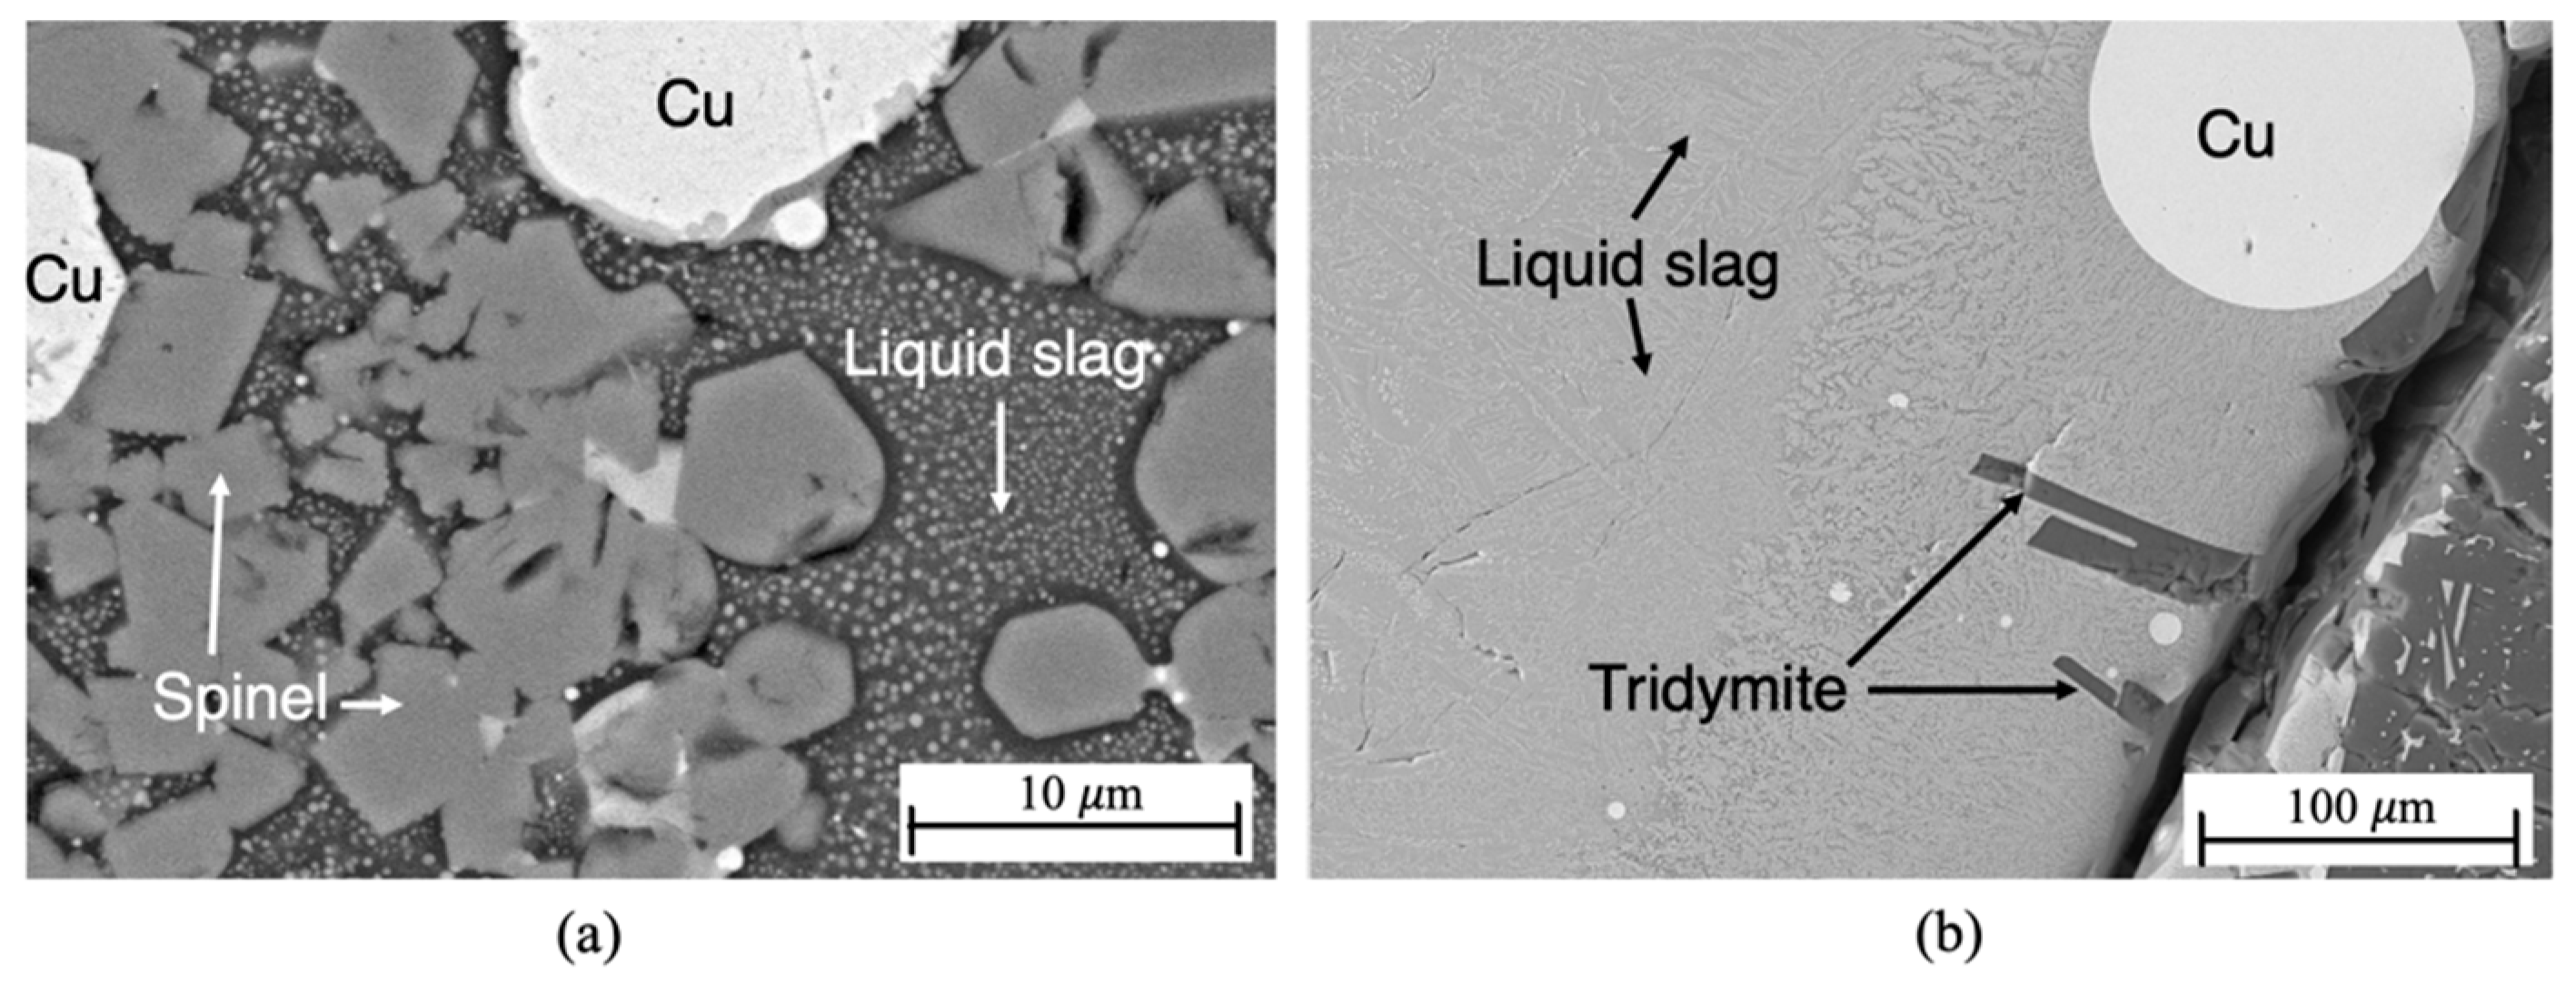
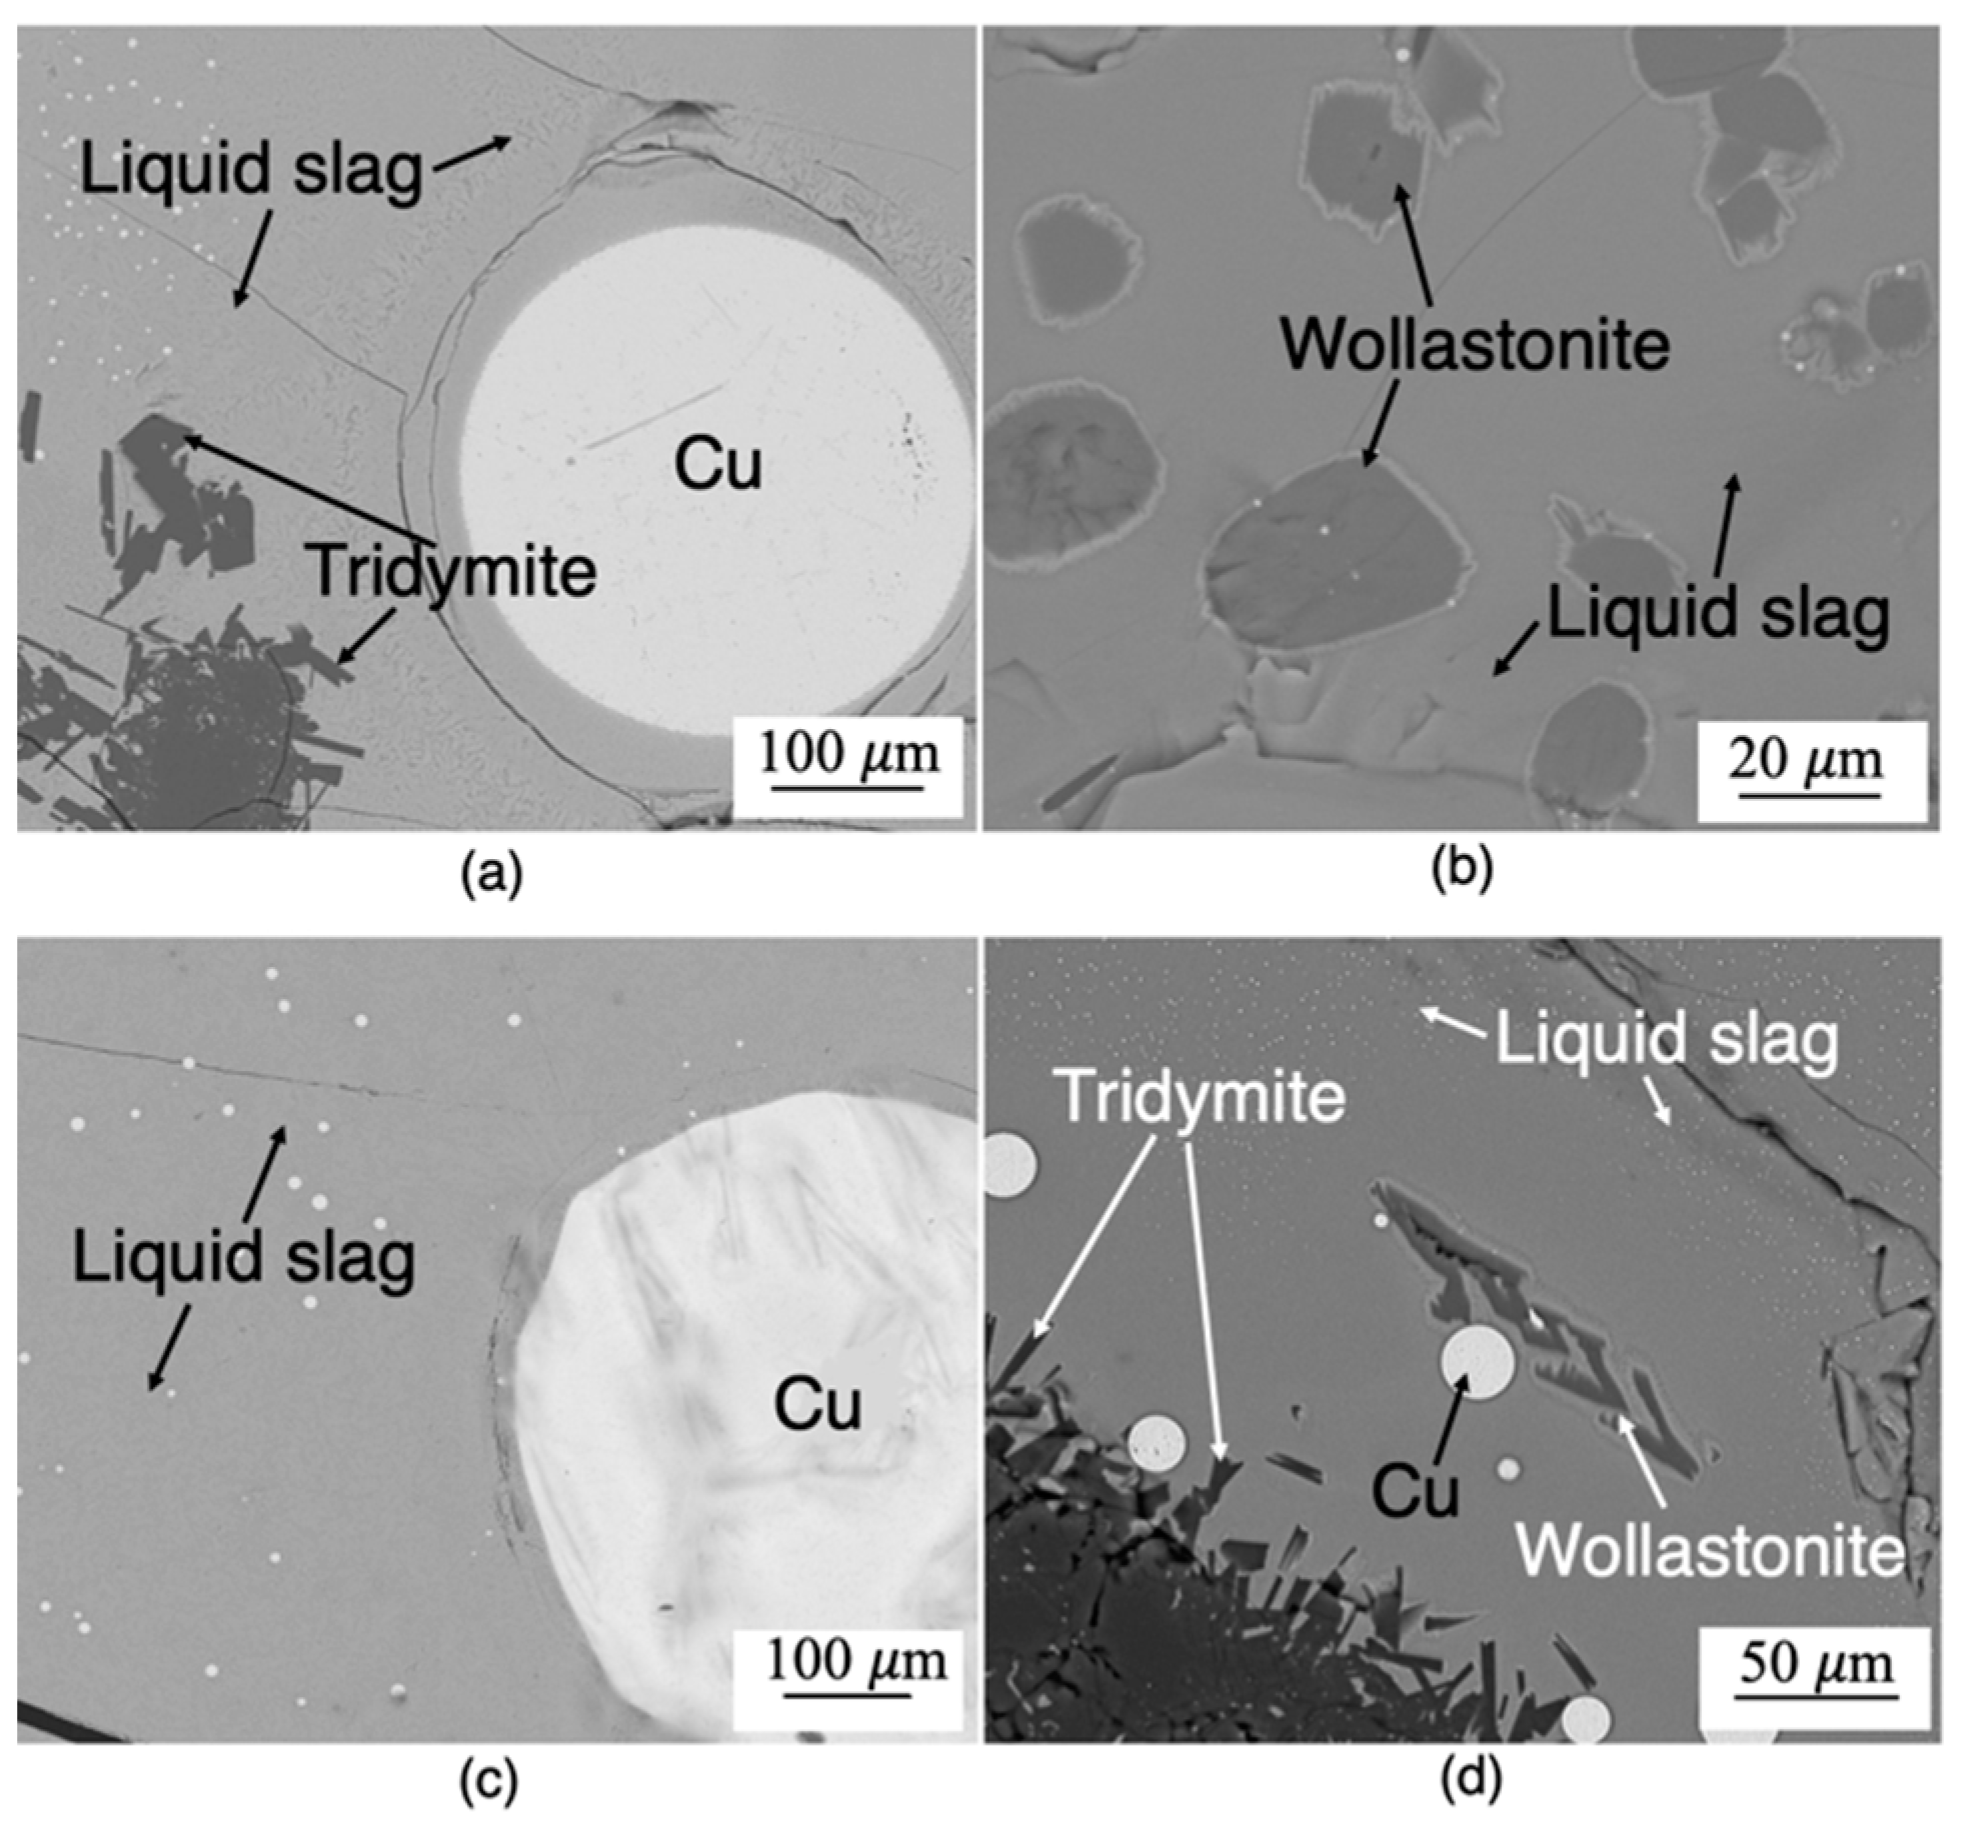
To guarantee the achievement of equilibrium, two types of measurements were used. The first being a comparison between the compositions of the phases for two different experimental times: 3 h and 6 h. The second one is the measurement of the compositions in different places of the same phase to ensure their homogeneity. An area analysis by SEM/EDS was used to obtain composition data of the liquid phase as can be observed in Figure 2. As for the tridymite phase, a point analysis was selected for the composition measurement. The average and the standard deviation (σ) of the results are presented in Table 1. The results showed that all the phases studied were homogeneous and that experiments performed for 3 h were enough to reach equilibrium. To make sure and confirm that equilibrium was reached, 6 h of experiment time was selected for this study.

3. Results

3.1. Equilibrium of Synthetic Slag/Copper with CaO or Al2O3 Addition

The SEM/EDS area analysis of the liquid phase showed that the standard deviations were in the range of 0.1–0.4 for Al2O3 and CaO, 0.5–1.0 for SiO2, 0.2–0.4 for Fe2O3, and 0.5–1.1 for Cu2O.

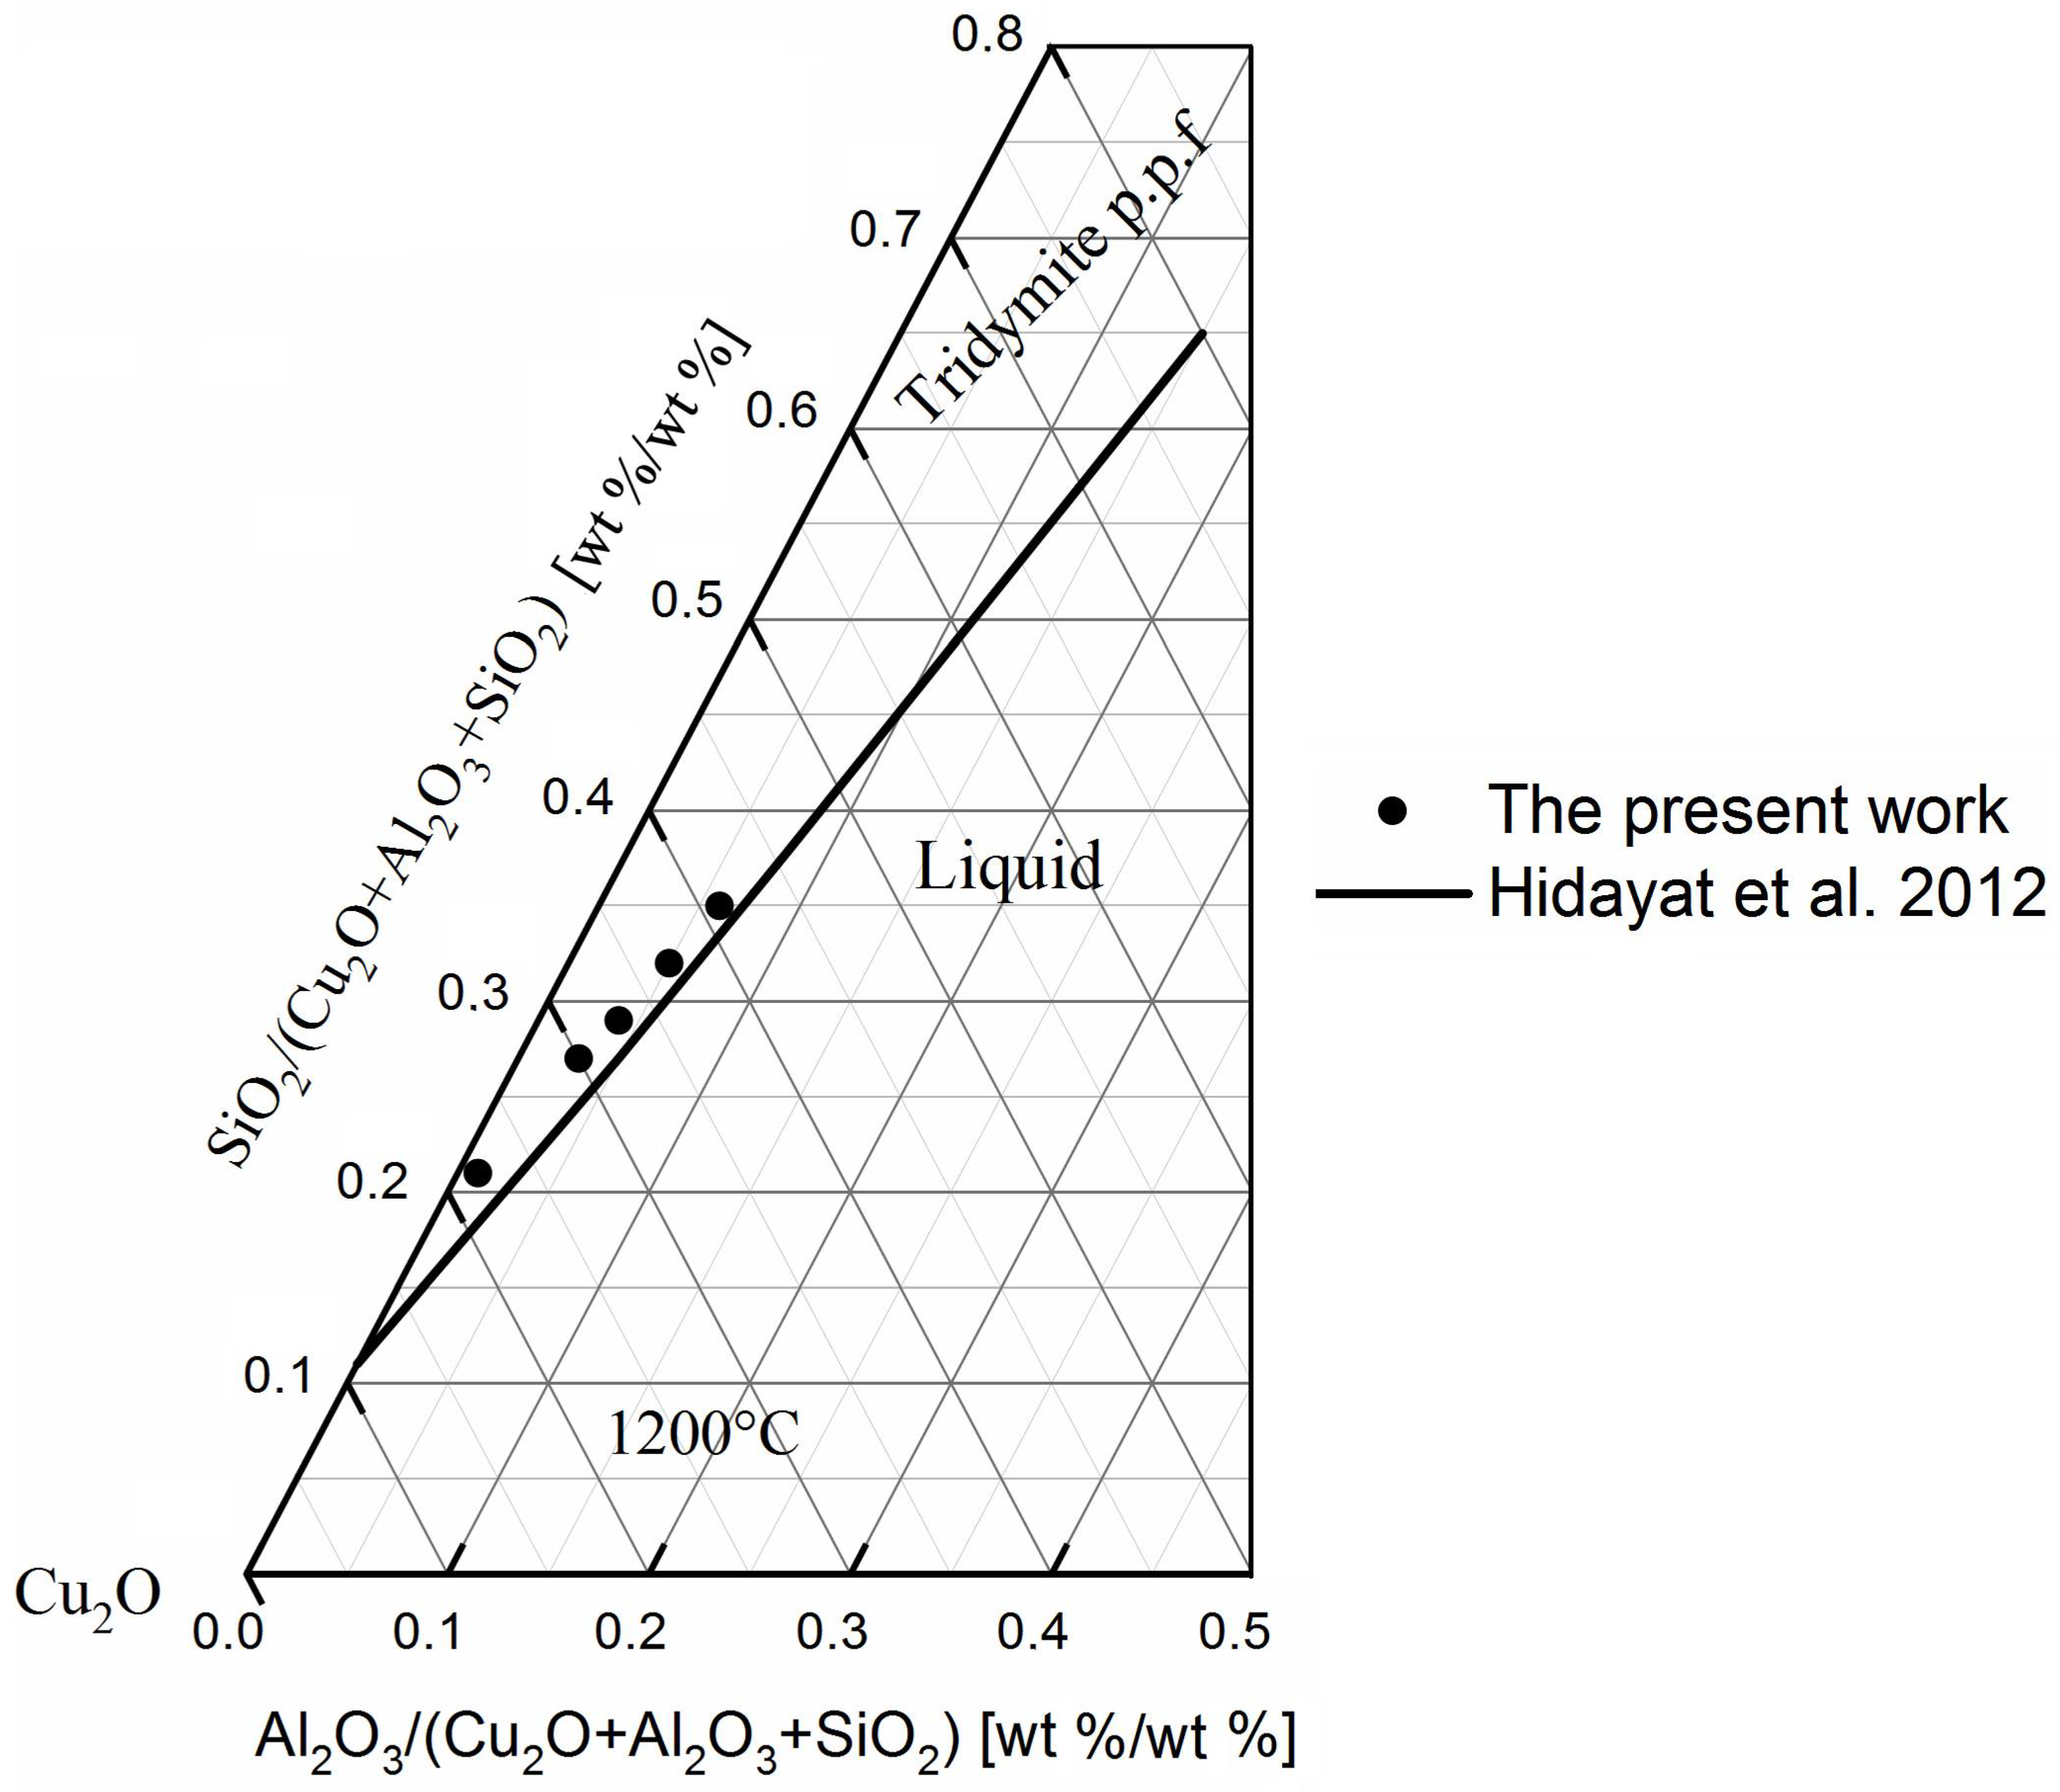
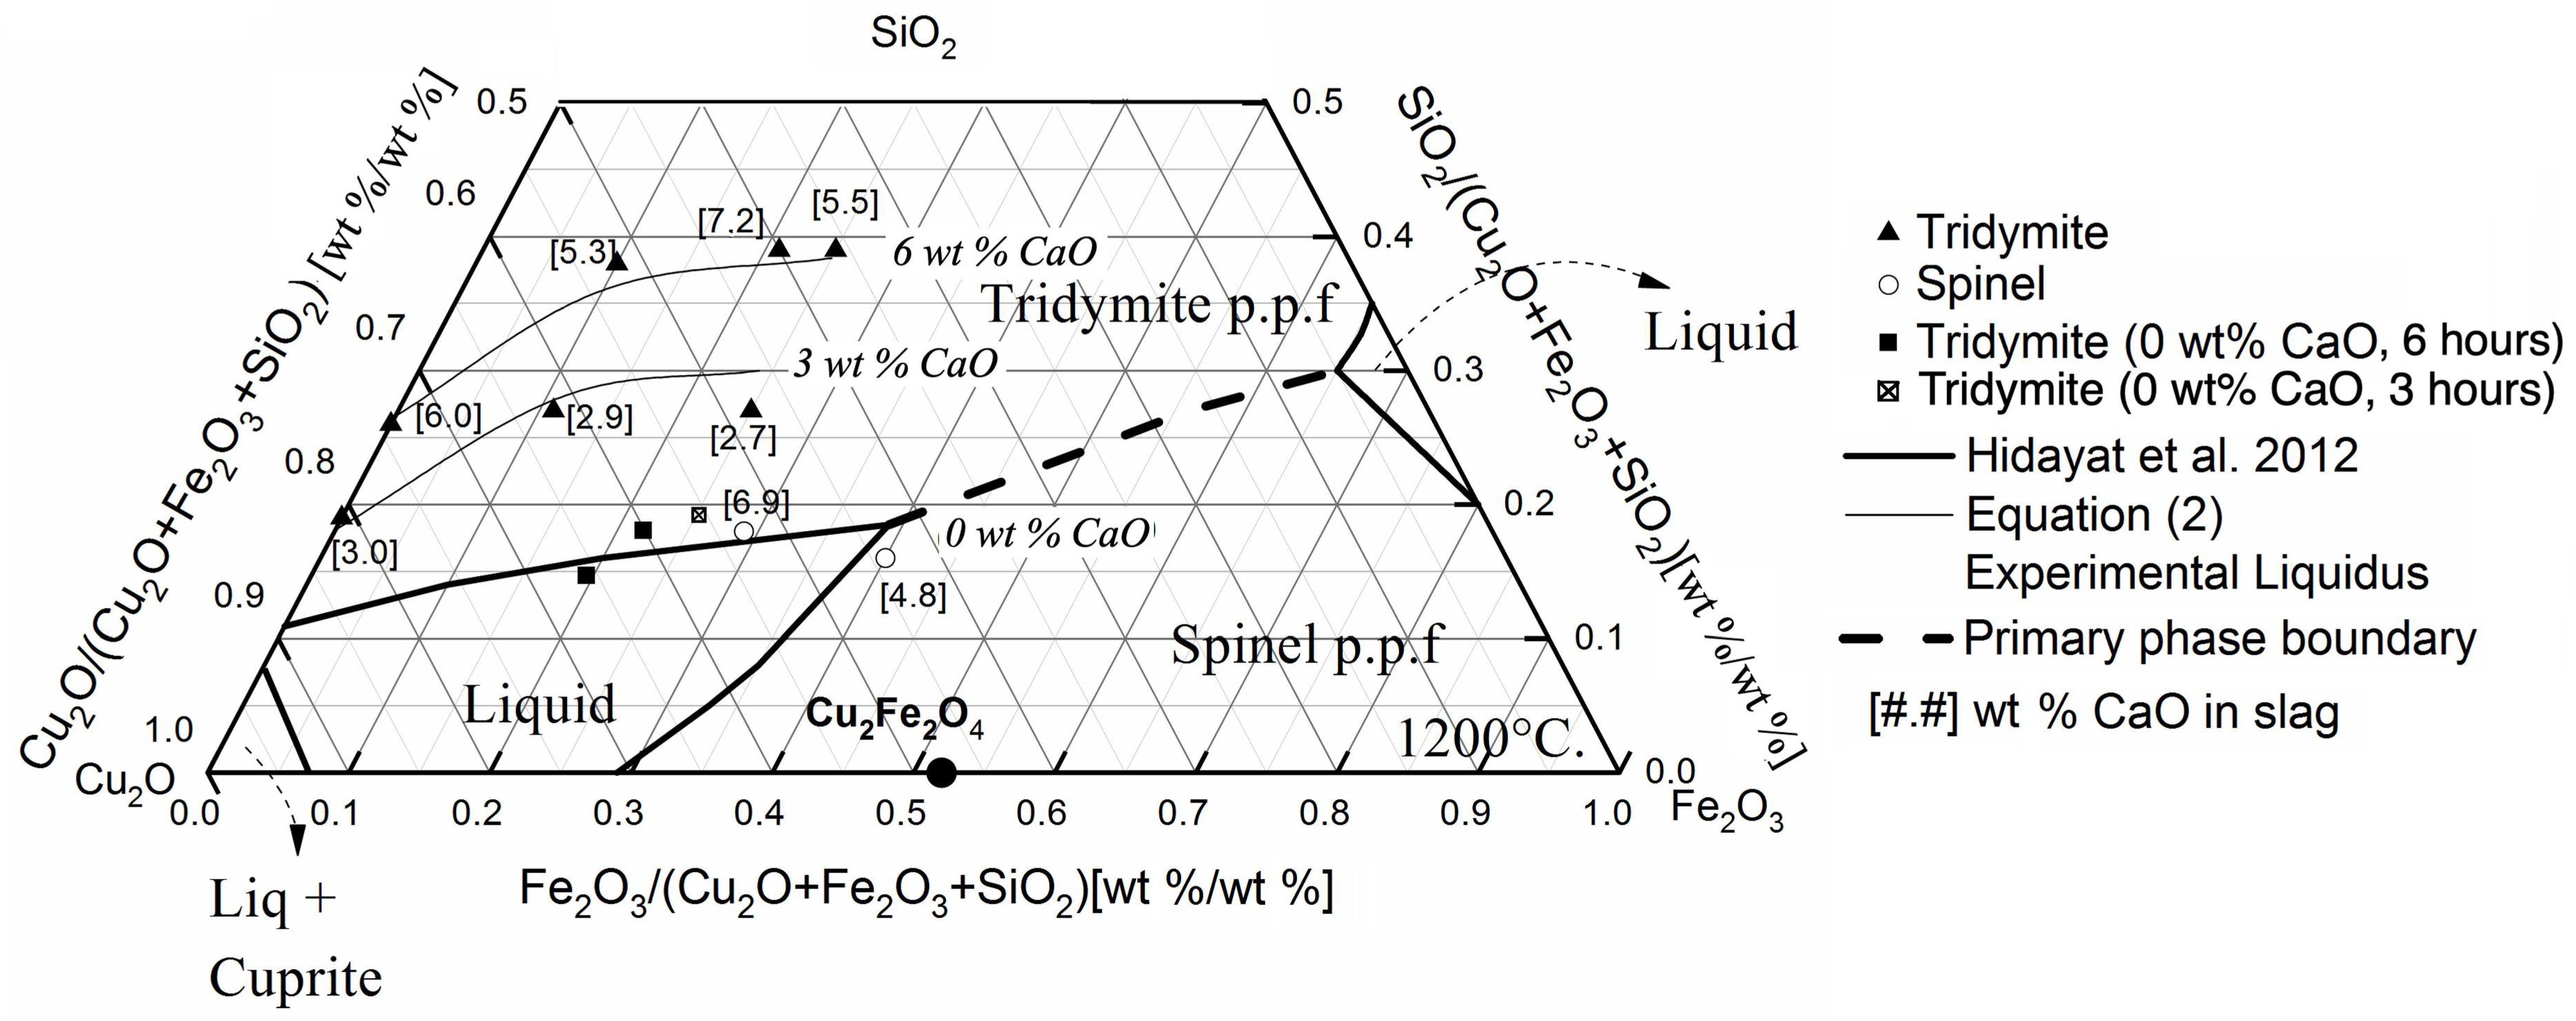
3.1.1. Al2O3 Addition
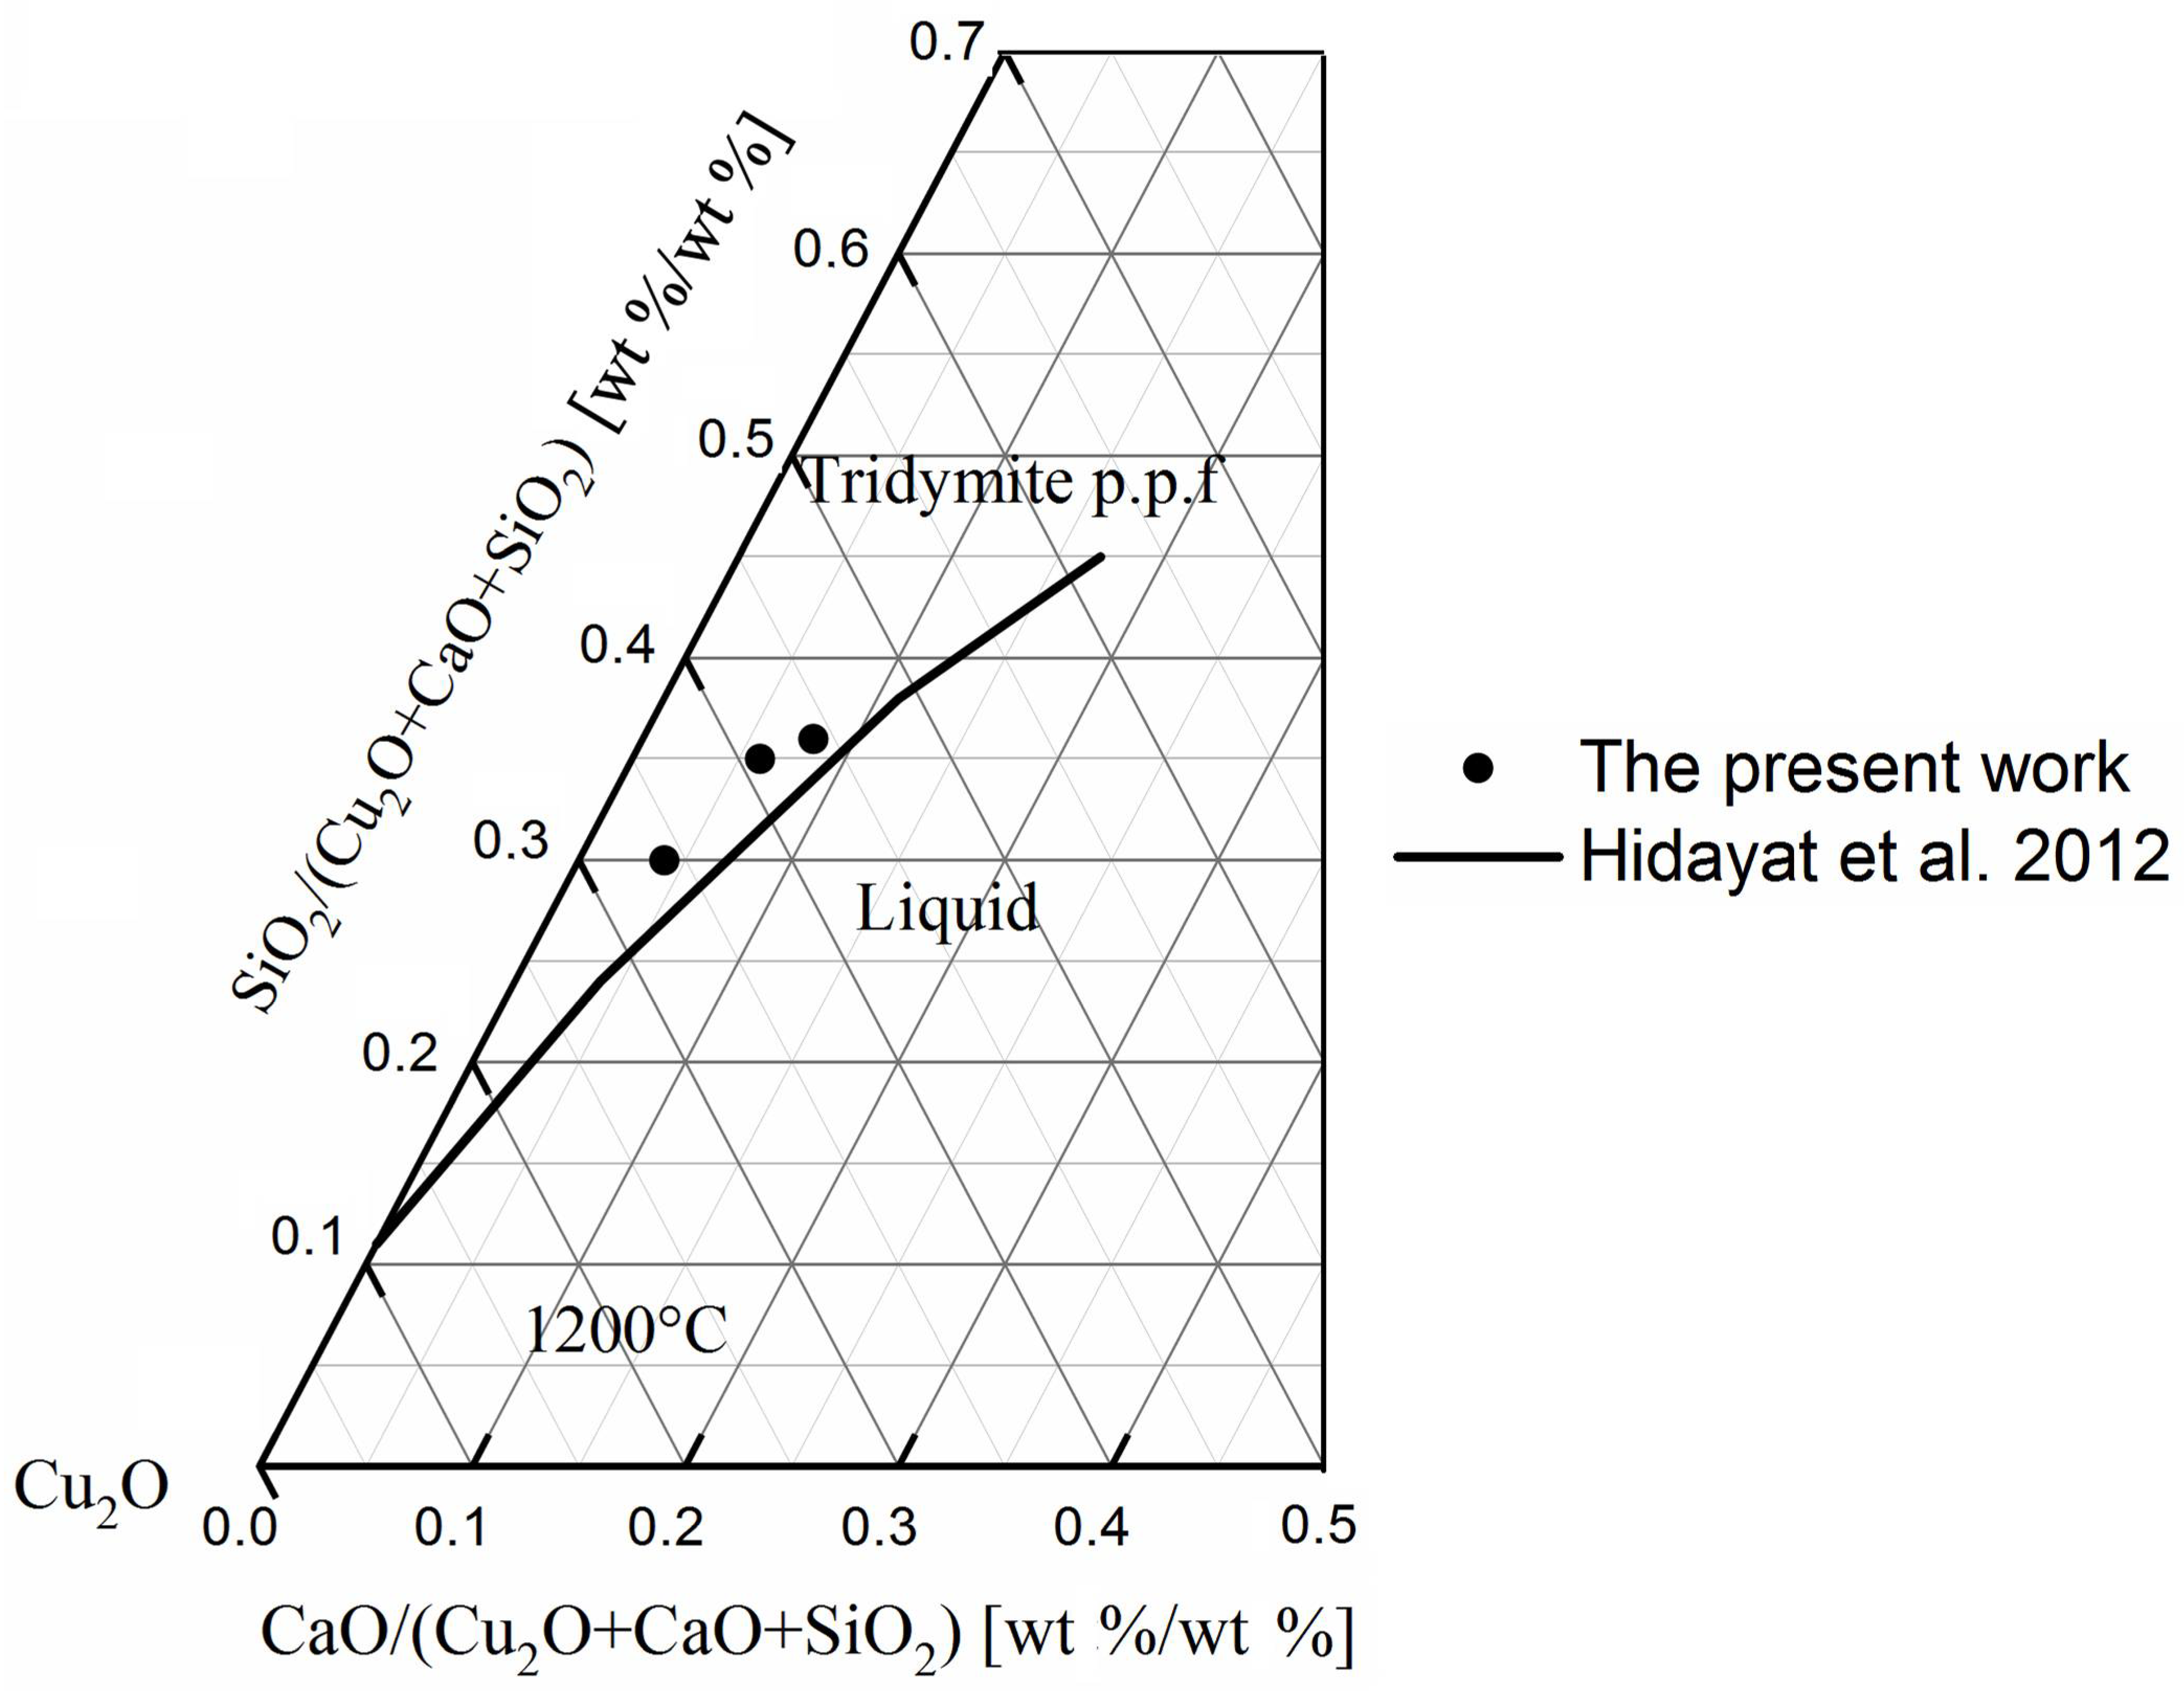
The results of EDS measurements of experiments carried out with the addition of Al2O3 at 1150 °C and 1200 °C in equilibrium with metallic copper and tridymite are summarized in Table 2. Liquid compositions of the Cu2O–Al2O3–SiO2 system are presented for samples 14–18 at 1200 °C.

3.1.2. CaO Addition

Results of the EDS analysis of experiments that were carried out with the addition of CaO at 1200 °C in the slag/tridymite and slag/spinel equilibrium under conditions of copper saturation are summarized in Table 3. Examples of scanning electron micrographs of samples with slag/tridymite and slag/spinel equilibrium are presented in Figure 3.

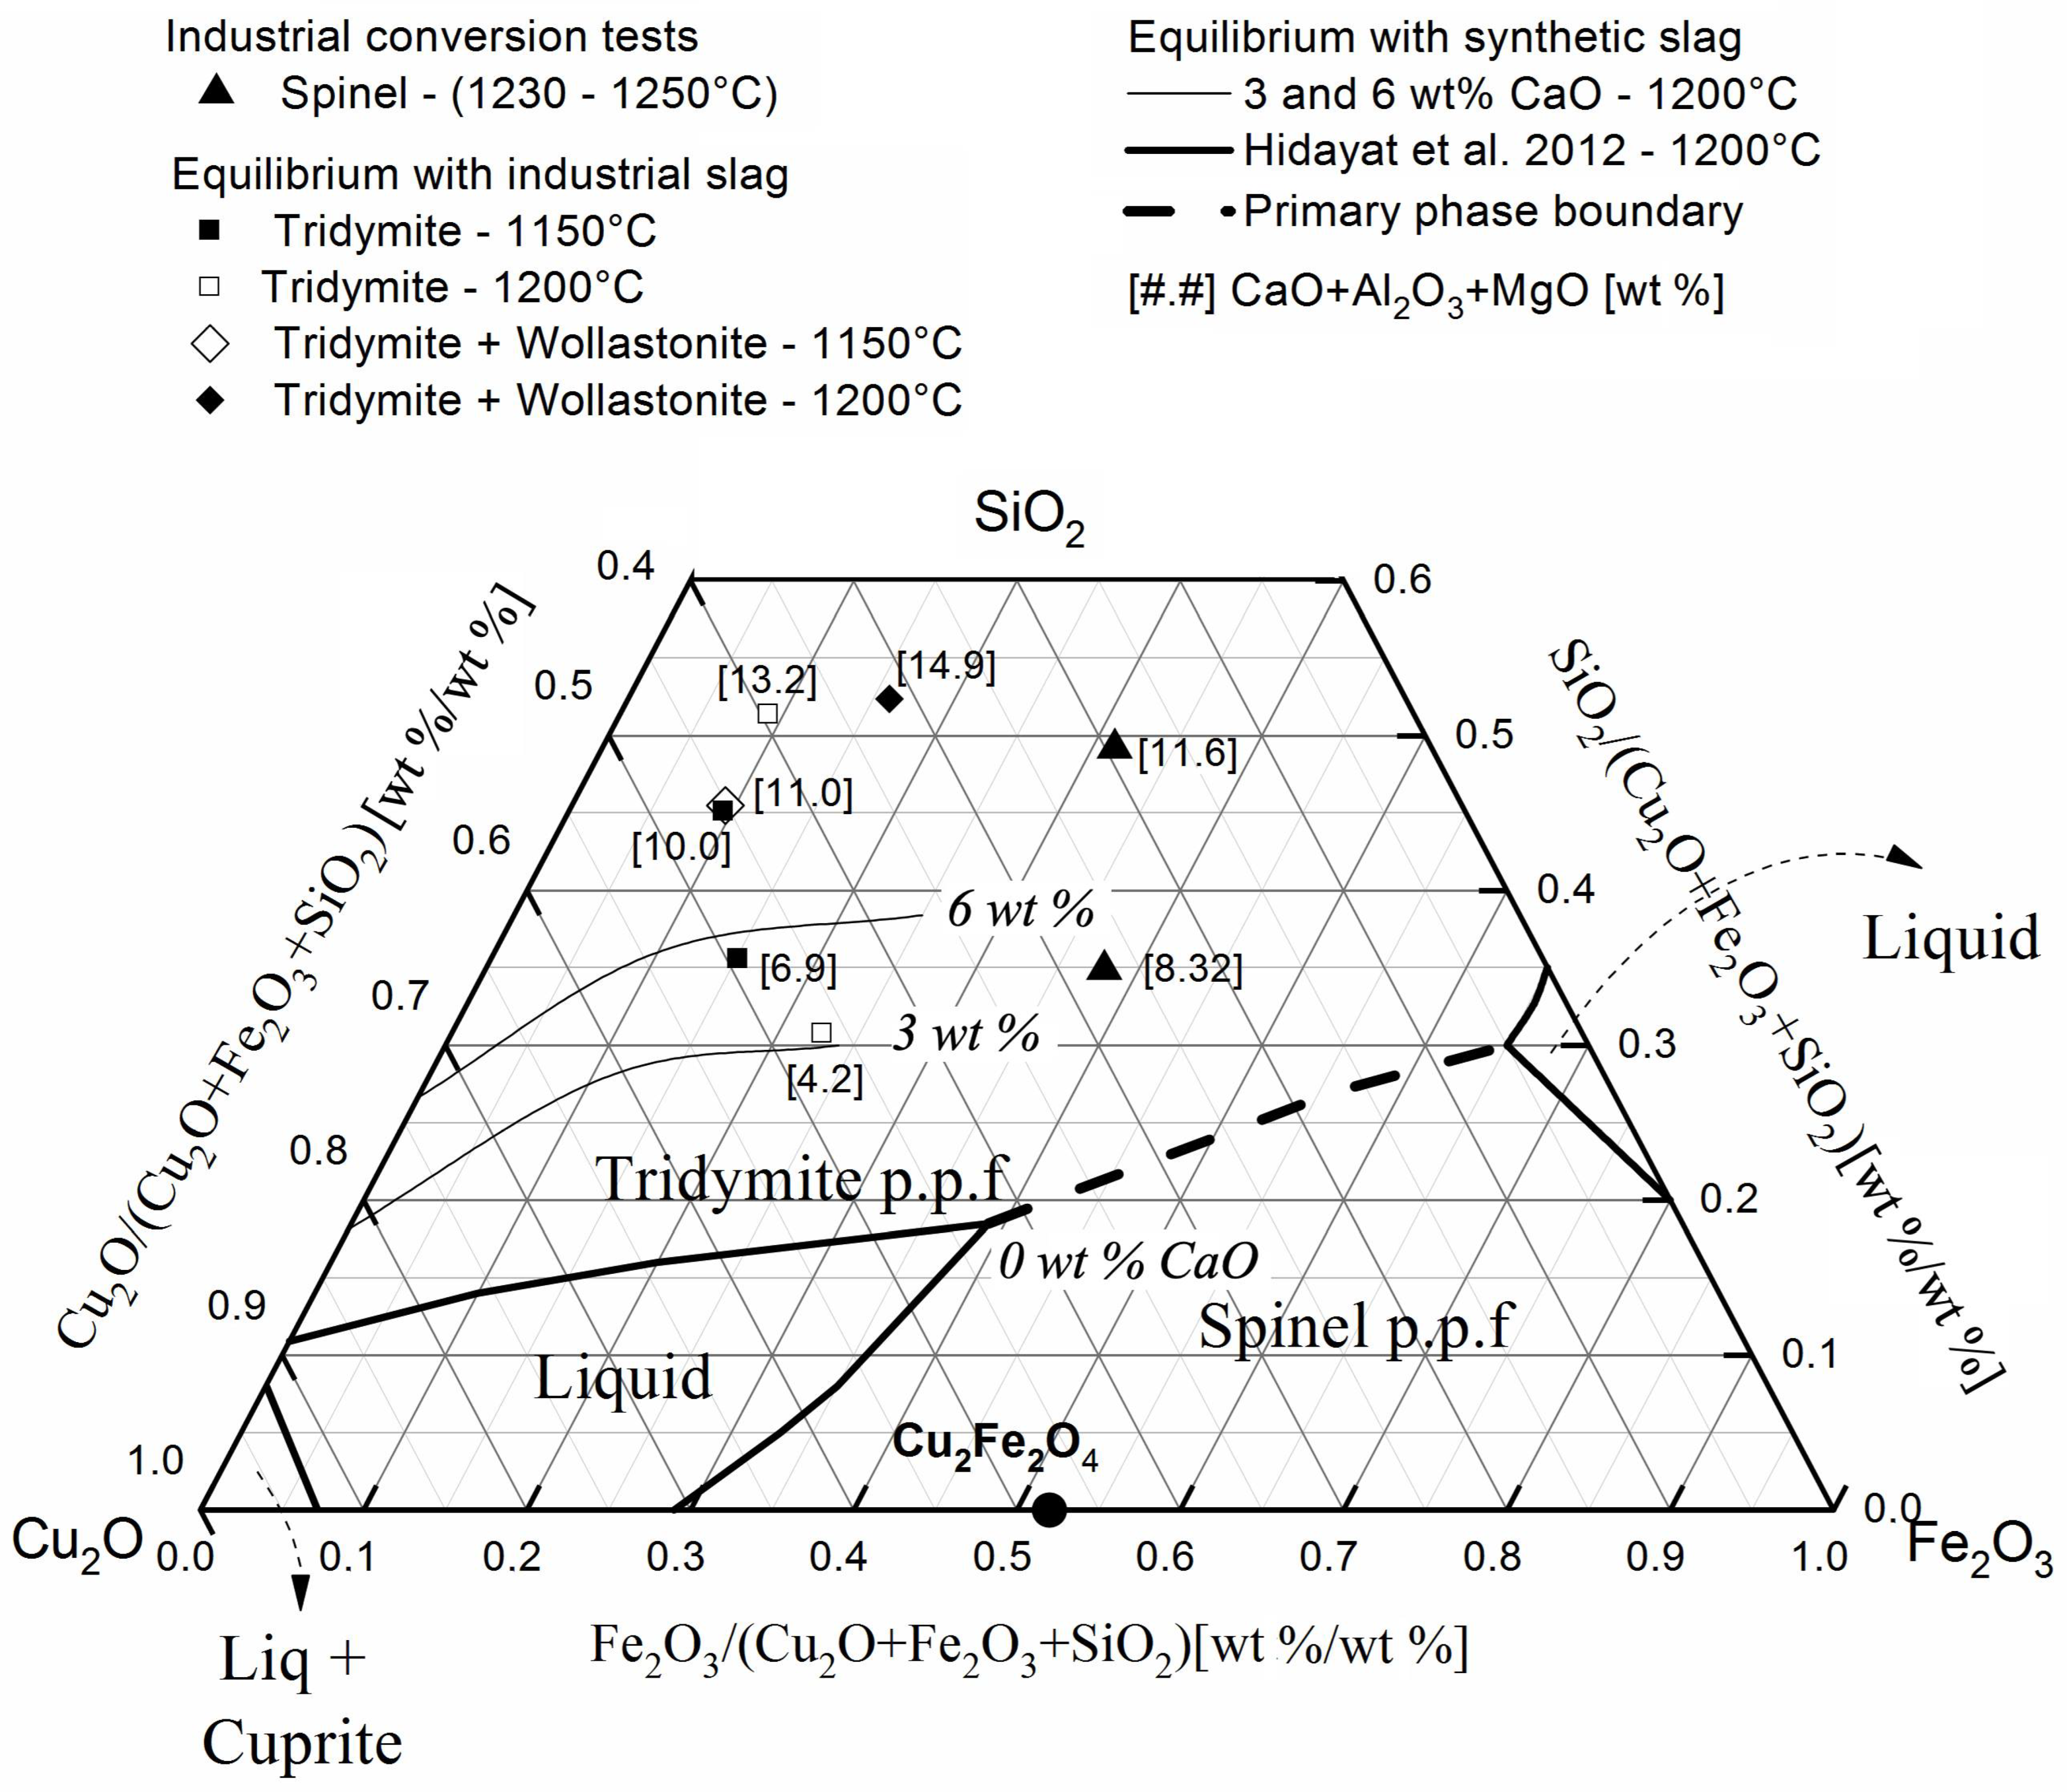
3.2. Equilibrium of Industrial Slag/Blister Copper with Addition of CaO

The compositions of liquid slags in experiments conducted with industrial slags and blister copper and with the addition of lime at 1150 °C and 1200 °C can be observed in Table 4. The solid phase wollastonite had an average composition of 52.8 wt % SiO2 and 44.4 wt % CaO and the composition of the solid phase tridymite was 98 wt % SiO2; and minor oxides make up the rest of these compositions.
Examples of scanning electron microscopy images of quenched samples are provided in Figure 4. Slag/tridymite and slag/wollastonite equilibrium can be observed.

3.3. Industrial Smelting Tests with Addition of CaO and Al2O3

As explained in the procedure, CaO and Al2O3 were directly added to the Peirce–Smith converter and the results of the samples taken are summarized in Table 5. The microscopic image shown in Figure 5 indicates the slag in equilibrium with the solid-phase spinel.

4. Discussion

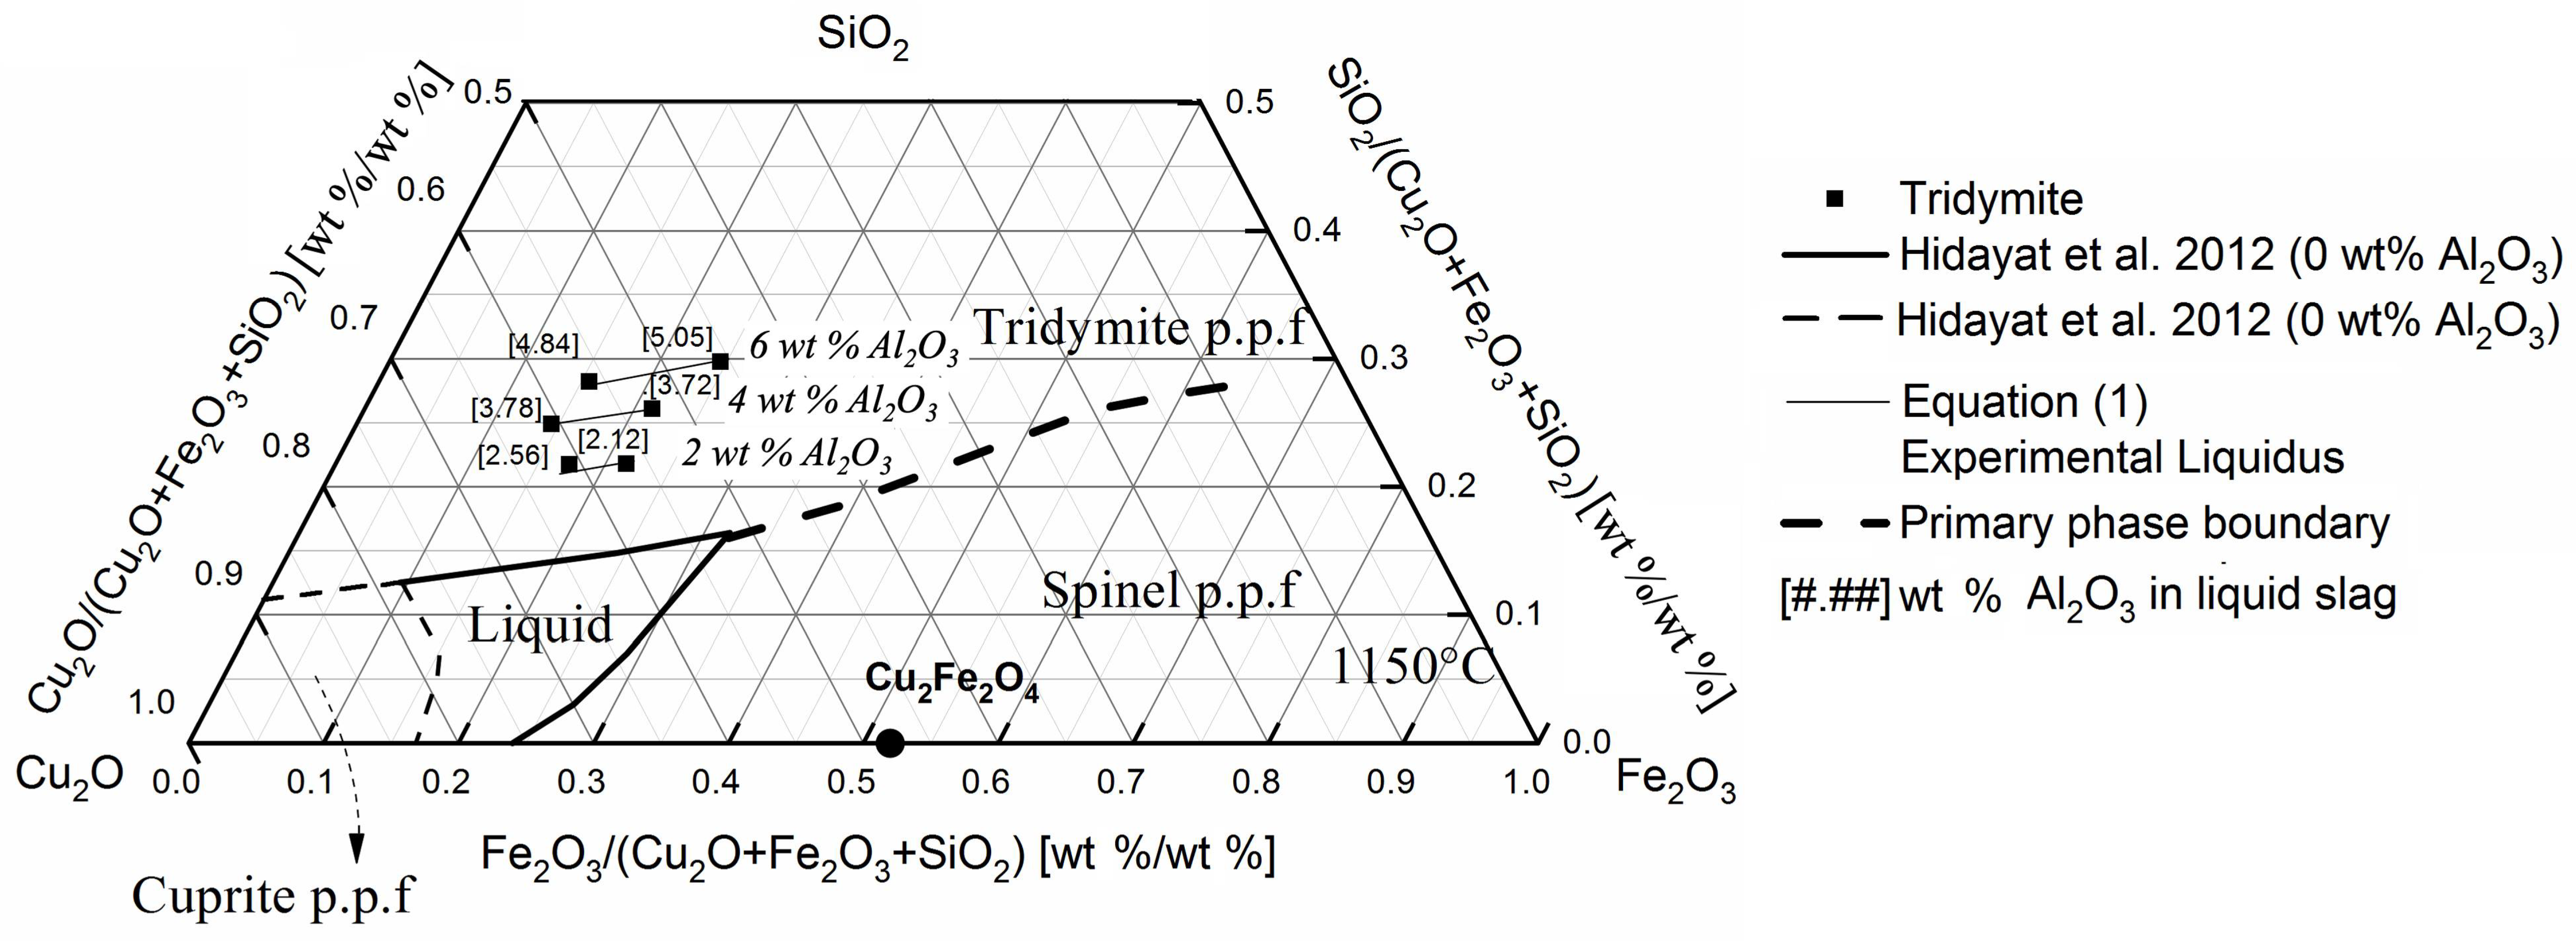
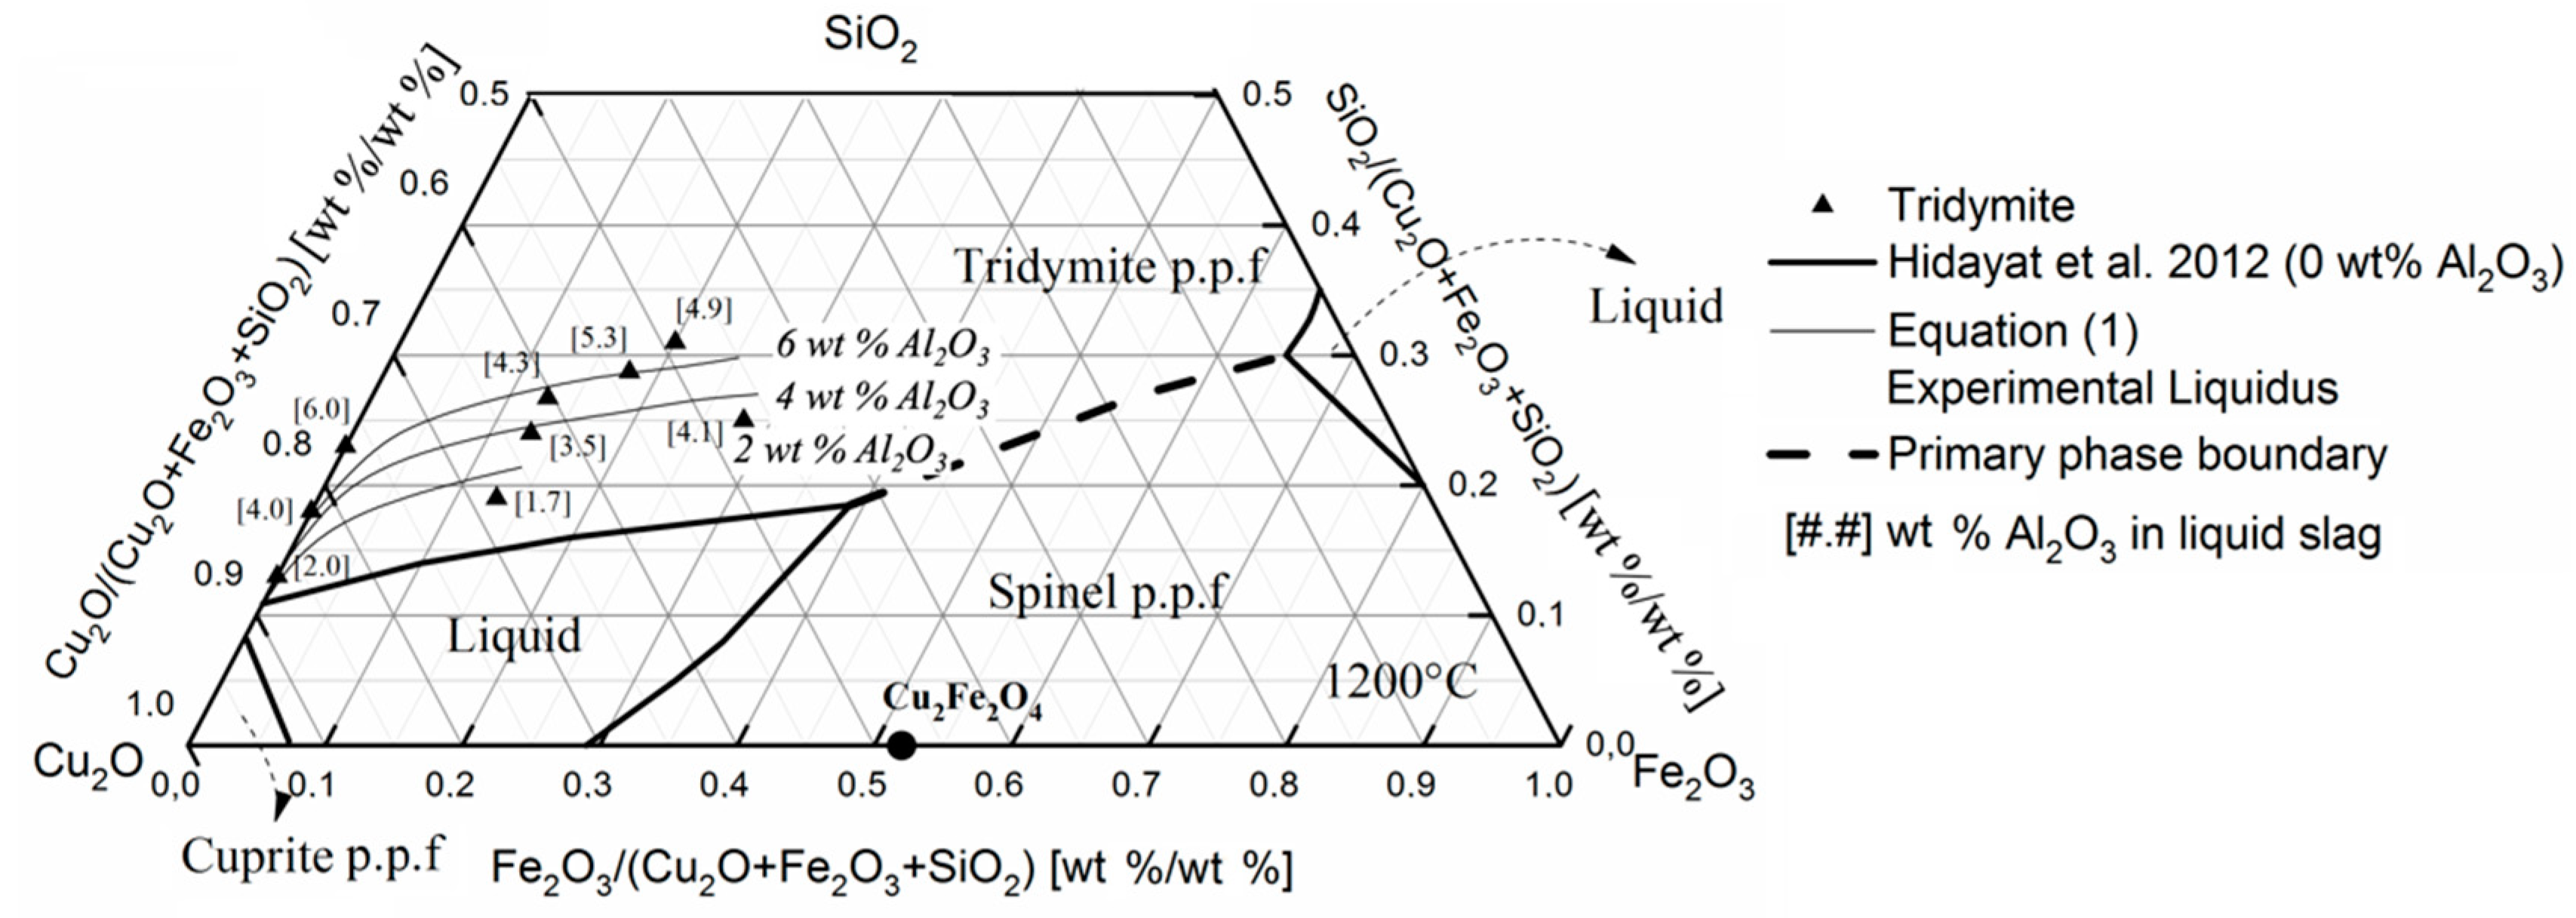
4.1. Cu2O–Fe2O3–SiO2–Al2O3 System

The experimental results of the liquid composition, presented in Table 2, for the Cu2O–Al2O3–SiO2 system at 1200 °C are shown in Figure 6. The lines indicate the results of the liquidus lines reported in the literature [17]. A reasonable agreement was observed between the present experimental work and that obtained by Hidayat [3].
Figure 7 and Figure 8 provide the phase diagrams of the Cu2O–Fe2O3–SiO2 system and the effect of Al2O3 that was observed.
Equation (2) was calculated using an adjustment of the experimental data obtained for 2 wt %, 4 wt %, and 6 wt % Al2O3 at 1200 °C and the liquidus lines were drawn, as can be seen in the phase diagram of Figure 8. The liquidus lines of the phase diagram of Figure 7 were drawn manually.
Wt % SiO2 = 5.3 (wt % Fe2O3)0.29 + 2.0 (wt % Cu2O)0.2 + 3.4 (wt % Al2O3)0.7, (T = 1200 °C).
The results were compared with the experimental work reported in the literature [3] without addition of Al2O3. It was clear that the addition of alumina resulted in a considerable increase of the liquid region in the primary phase field of tridymite.

4.2. Cu2O–Fe2O3–SiO2–CaO System

The data of the liquid composition, presented in Table 3, for the “Cu2O”–CaO–SiO2 system are shown in the phase diagram of Figure 9 and were compared with experimental results obtained by Hidayat [17]. A reasonable agreement between both experimental results was observed.
Figure 10 represents the data of Table 3 for different additions of CaO projected in the Cu2O–Fe2O3–SiO2 system. Three experiments were conducted with no addition of lime and the results of the liquid composition were plotted in the phase diagram of Figure 9. Two of these experiments were performed in 6 h and one in 3 h. It could be seen that the results of the present work were very similar to those reported by Hidayat [3], and that the difference between the compositions of experiments carried out with different experimental times was almost negligible.
From the experimental data, a mathematical expression for the relationship between wt % SiO2 and the concentration of Cu2O, Fe2O3, and CaO was obtained and is represented by Equation (3). The correlation coefficient of the equation is R2 = 0.94.
wt % SiO2 = 6.0 (wt % Fe2O3)0.2 + 3.2 (wt % Cu2O)0.1 + 6.0 (wt % CaO)0.7.
The liquidus lines at selected levels of CaO were plotted using Equation (2) and are included in Figure 10. The results of the present work were compared with the experimental work reported in the literature [3] without addition of CaO. It was clear that the addition of lime resulted in a large increase of the liquid region in the primary phase field of tridymite.

4.3. Comparison between Al2O3, CaO, and MgO Addition in the Cu2O–Fe2O3–SiO2 System at 1200 °C

A comparison between the effect of CaO, Al2O3, and MgO on the liquid isotherm at 1200 °C is made. The data of a previous study [18] on the influence of MgO over the liquidus lines of the Cu2O–Fe2O3–SiO2 system were used.
The effect on increase in the liquid region of the Cu2O–Fe2O3–SiO2 system was more pronounced with the addition of lime than with the addition of alumina or magnesia. This can be observed in Figure 11, where liquidus lines at 1200 °C, with concentrations of Al2O3 and CaO at 2, 4, and 6 wt % and MgO at 2 and 4 wt % are presented. A reduction in the trydimite primary phase field was observed with increasing concentrations of any of these three compounds in the liquid phase.

4.4. Equilibrium of Industrial Slags and Industrial Smelting Tests

The data of Table 4 and Table 5 obtained after equilibrium experiments with industrial slags and industrial tests are represented in Figure 12. Liquid compositions in equilibrium with tridymite of experiments carried out with industrial slags, were similar to those obtained with synthetic slags with the addition of CaO. The liquid compositions are represented with the liquidus lines in the phase diagram of Figure 12.
The results of equilibration experiments with industrial slags showed a liquid phase in equilibrium with tridymite and wollastonite (Figure 4b,d). The formation of wollastonite was observed with concentrations of 11.0 wt % CaO + Al2O3 at 1150 °C and 14.9 wt % CaO at 1200 °C (Table 4).
The observed micro-photography of Figure 5 shows the slags saturated in spinel with a relatively high concentration of SiO2 in the liquid phase, with values up to 50 wt % (Figure 12). A similar indication was obtained in the experimental results at saturation with spinel plotted in Figure 10. This indicated that the addition of CaO and Al2O3 reduced the liquid phase in the spinel primary phase field. However, supplementary experimental data will be required to define with precision the observed tendency and to determine the slag composition at which both spinel and tridymite precipitation occurs.
From an operational point of view, it will be convenient to generate slags with relatively high concentration of silica, between 30 wt % and 40 wt % in order to reduce the proportion of tridymite and spinel phases.
During the industrial tests, a careful observation was carried out regarding the behavior of the slags. It was apparent that the addition of CaO/Al2O3 generated a reduction in the viscosity of the slags and a decrease in the formation of accretions around the mouth of the furnace. Furthermore, the operation problems mentioned in the introduction, were significantly reduced.

5. Conclusions

The experimental results indicate that increasing the addition of Al2O3 or CaO expands the liquid field in the primary phase field of tridymite. No additional phases are observed in experiments with an Al2O3 and CaO concentration up to 5 wt % and 8 wt %, respectively. The effect of increasing the liquid region of the Cu2O–Fe2O3–SiO2 system is larger with the addition of lime than with the addition of alumina. Also, the solid-phase wollastonite appears with additions of CaO larger than 10 wt %.
From an industrial point of view, the operational difficulties associated with slag handling can be overcome with a 6 wt % addition of CaO or Al2O3 and a silica amount between 30 wt % and 40 wt %.

Author Contributions

Conceptualization, H.H. and A.M.; methodology, H.H.; Industrial validation, A.M.; formal analysis, H.H.; investigation, H.H., E.K. and L.R.; resources, H.H. and A.M.; data curation, H.H.; writing—original draft preparation, H.H., E.K. and L.R.; writing—review and editing, H.H. and L.R.; supervision, H.H.

Funding

This research received no external funding.

Conflicts of Interest

The authors declare no conflict of interest.

References

  1. Henao, H.; Moyano, A. Conversion of mattes with high grade of copper. In Proceedings of the 9th International Copper Conference, Kobe, Japan, 13–16 November 2016; pp. 901–908. [Google Scholar]
  2. Pradenas, L.; Zúñiga, J.; Parada, V. CODELCO, Chile programs its copper-smelting operations. Interfaces 2006, 36, 296–301. [Google Scholar] [CrossRef]
  3. Hidayat, T.; Henao, H.; Hayes, P.; Jak, E. Phase equilibria studies of the Cu–Fe–O–Si system in equilibrium with air and with metallic copper. Metall. Mater. Trans. B 2012, 43, 1034–1045. [Google Scholar] [CrossRef]
  4. Ohno, H.; Henao, H.; Itagaki, K. Effect of Al2O3 or MgO on liquidus line in the FeOX corner of FeOX-SiO2-CaO system at 1523 K under various oxygen partial pressures. High Temp. Mater. Process. 2011, 30, 333–338. [Google Scholar] [CrossRef]
  5. Jak, E.; Zhao, B.; Hayes, P. Phase equilibria in the system FeO–Fe2O3–Al2O3–CaO–SiO2 with applications to non-ferrous smelting slags. Miner. Process. Extr. Metall. 2008, 117, 147–152. [Google Scholar] [CrossRef]
  6. Chen, M.; Zhao, B. Phase equilibrium studies of “Cu2O”–SiO2–Al2O3 system in equilibrium with metallic copper. J. Am. Ceram. Soc. 2013, 96, 3631–3636. [Google Scholar] [CrossRef]
  7. Fallah-Mehrjardi, A.; Hayes, P.; Jak, E. The effect of CaO on Gas/Slag/Matte/Tridymite equilibria in fayalite-based copper smelting slags at 1473 K (1200 °C) and P(SO2) = 0.25 Atm. Metall. Mater. Trans. B 2018, 49, 602–609. [Google Scholar] [CrossRef]
  8. Nikolic, S.; Hayes, P.; Jak, E. Liquidus temperatures in the “Cu2O”–FeO–Fe2O3–CaO–SiO2 system at metallic copper saturation, at fixed oxygen partial pressures, and in equilibrium with spinel or dicalcium ferrite at 1200 °C and 1250 °C. Metall. Mater. Trans. B 2009, 40, 910–919. [Google Scholar] [CrossRef]
  9. Nikolic, S.; Hayes, P.; Jak, E. Liquidus temperatures in the “Cu2O”–FeO–Fe2O3–CaO system at molten metallic copper saturation. Metall. Mater. Trans. B 2009, 40, 900–909. [Google Scholar] [CrossRef]
  10. Taskinen, P.; Kojo, I. Fluxing options in the direct-to-blister copper smelting. In Proceedings of the Molten 2009 International Conference, Santiago, Chile, 18–21 January 2009; pp. 1139–1151. [Google Scholar]
  11. Somerville, M.; Chen, C.; Alvear, G.; Nikolic, S. Fluxing strategies for the direct-to-blister smelting of high silica and low iron copper concentrates. In Advances in Molten Slags, Fluxes, and Salts, Proceedings of the 10th International Conference on Molten Slags, Fluxes and Salts, Seattle, WA, USA, 22–25 May 2016; Springer: Cham, Switzerland, 2016; pp. 667–675. [Google Scholar]
  12. Syamujulu, M. Opportunities, problems and survival strategies from recent developments in the copper concentrate treatment and smelting practices at Vedanta’s Konkola copper mines in the Zambian Copperbelt. In Copper; Volume III (Book 1); CIM: Montreal, QC, Canada, 2007; pp. 155–166. [Google Scholar]
  13. Hunt, A.; Day, S.; Shaw, R.; Montgomerie, D.; West, R. Start-up and operation of the #2 direct-to-blister flash furnace at Olympic dam. In Proceedings of the 9th International Flash Smelting Congress Australia, Espoo, Finland, 6–12 June 1999; pp. 95–113. [Google Scholar]
  14. Siafakas, D.; Matsushita, T.; Eric, A.; Jarfors, W.; Hakamada, S.; Watanabe, M. Viscosity of SiO2–CaO–Al2O3 slag with low silica—Influence of CaO/Al2O3, SiO2/Al2O3 ratio. ISIJ Int. 2018, 58, 2180–2185. [Google Scholar] [CrossRef]
  15. Gan, L.; Xin, J.; Zhou, Y. Accurate viscosity calculation for melts in SiO2–Al2O3–CaO–MgO systems. ISIJ Int. 2017, 57, 1303–1312. [Google Scholar] [CrossRef]
  16. Zhang, G.-H.; Chou, K.-C. Influence of Al2O3/SiO2 ratio on viscosities of CaO–Al2O3–SiO2 melt. ISIJ Int. 2013, 53, 177–180. [Google Scholar] [CrossRef]
  17. Hidayat, T.; Henao, H.; Hayes, P.; Jak, E. Phase equilibria studies of Cu–O–Si systems in equilibrium with air and metallic copper and Cu–Me–O–Si systems (Me = Ca, Mg, Al, and Fe) in equilibrium with metallic copper. Metall. Mater. Trans. B 2012, 43, 1290–1299. [Google Scholar] [CrossRef]
  18. Crivits, T.; Hayes, P.; Jak, E. Influence of MgO on the phase equilibria in the CuOx–FeOy–MgO–SiO2 system in equilibrium with copper alloy—Part I: Methodology and liquidus in the tridymite primary phase field. Int. J. Mater. Res. 2015, 106, 454–463. [Google Scholar] [CrossRef]
Figure 1. Electrical furnace (Nabertherm RT 30-200) used in experiments and a sample placed within the silica crisol.
Minerals 09 00716 g001
Figure 2. Scanning electron micrograph of a quenched liquid slag equilibrated for 3 h saturated with tridymite and metallic copper. The white squares indicate the analyzed areas.
Minerals 09 00716 g002
Figure 3. Scanning electron micrographs of quenched liquid slags in equilibrium with spinel (a) and tridymite (b) and saturated with metallic copper.
Minerals 09 00716 g003
Figure 4. Scanning electron micrographs of quenched industrial liquid slags in equilibrium with solid phases, saturated with metallic copper and with addition of CaO. (a) Tridymite at 1150 °C; (b) wollastonite at 1150 °C; (c) tridymite at 1200 °C; (d) tridymite and wollastonite at 1200 °C.
Minerals 09 00716 g004
Figure 5. Scanning electron micrograph of liquid slags in equilibrium with spinel in industrial tests carried out with the addition of CaO and Al2O3.
Minerals 09 00716 g005
Figure 6. Liquidus lines of the Cu2O–Al2O3–SiO2 system in equilibrium with tridymite and metallic copper.
Minerals 09 00716 g006
Figure 7. Liquidus for the equilibrium slag/tridymite of the Cu2O–Fe2O3–SiO2 system with additions of Al2O3 at 1150 °C, in equilibrium with metallic copper.
Minerals 09 00716 g007
Figure 8. Liquidus for the equilibrium slag/tridymite of the Cu2O–Fe2O3–SiO2 system with additions of Al2O3 at 1200 °C, in equilibrium with metallic copper.
Minerals 09 00716 g008
Figure 9. Liquidus lines of the Cu2O–CaO–SiO2 system in equilibrium with tridymite and metallic copper at 1200 °C.
Minerals 09 00716 g009
Figure 10. Liquidus for the equilibrium slag/tridymite of the Cu2O–Fe2O3–SiO2 system with additions of CaO at 1200 °C, in equilibrium with metallic copper.
Minerals 09 00716 g010
Figure 11. Liquidus for the equilibrium slag/tridymite of the Cu2O–Fe2O3–SiO2 system with different additions of CaO and Al2O3 at 1200 °C, in equilibrium with metallic copper.
Minerals 09 00716 g011
Figure 12. Liquid compositions of equilibrium experiments with industrial slags and industrial tests projected in the phase diagram of the Cu2O–Fe2O3–SiO2 system compared with equilibrium experiments of synthetic slags with the addition of CaO.
Minerals 09 00716 g012
Table 1. Liquid and tridymite average compositions and their standard deviations determined experimentally for the Cu2O–Fe2O3–SiO2 system in equilibrium with tridymite, saturated with metallic copper, for equilibration times of 3 h and 6 h and temperature of 1200 °C.
PhaseEquilibration TimeStatisticComposition (wt %)
SiO2Fe2O3Cu2O
Tridymite3 hAverage98.40.51.2
σ0.20.10.0
Liquid3 hAverage19.625.255.2
σ0.40.80.7
Tridymite6 hAverage98.20.41.3
σ0.30.10.2
Liquid6 hAverage17.923.858.3
σ0.20.40.5
Table 2. Phase compositions determined experimentally for the Cu2O–Fe2O3–SiO2–Al2O3 system in equilibrium with metallic copper at 1150 °C and 1200 °C.
SampleTemperature °CPhaseComposition (wt %)
Cu2OFe2O3SiO2Al2O3
11150Liquid67.012.818.51.7
Tridymite6.71.491.80.1
21150Liquid60.712.823.03.5
Tridymite1.70.497.80.1
31150Liquid47.119.329.24.4
Tridymite2.40.896.40.4
41150Liquid51.016.627.15.3
Tridymite2.00.596.90.6
51150Liquid57.912.125.74.3
Tridymite0.52.696.50.4
61150Liquid52.020.725.02.3
Tridymite1.20.598.20.1
71150Liquid45.126.824.13.9
Tridymite2.00.697.40.0
81200Liquid55.421.421.22.1
Tridymite1.80.597.70.0
91200Liquid59.321.217.02.5
Tridymite1.60.298.20.0
101200Liquid50.725.120.63.6
Tridymite1.60.398.10.0
111200Liquid58.324.014.03.7
Tridymite2.00.197.90.0
121200Liquid43.528.323.44.8
Tridymite1.20.898.00.0
131200Liquid53.626.914.94.6
Tridymite4.92.093.10.0
141200Liquid58.40.036.15.4
151200Liquid61.20.032.56.3
161200Liquid77.00.021.22.0
171200Liquid70.00.026.44.0
181200Liquid65.90.029.24.9
Table 3. Phase compositions determined experimentally for the Cu2O–Fe2O3–SiO2–CaO system in equilibrium with metallic copper at 1200 °C.
SamplePhaseComposition (wt %)
SiO2Fe2O3Cu2O CaO
19Liquid17.623.858.60.0
Tridymite98.10.51.40.0
20Liquid14.421.264.40.0
Tridymite98.60.31.10.0
21Liquid30.30.066.13.6
Tridymite98.80.01.20.0
22Liquid35.90.058.55.6
Tridymite98.70.01.30.0
23Liquid36.00.056.27.8
Tridymite98.30.01.70.0
24Liquid25.710.760.72.9
Tridymite98.90.01.10.0
25Liquid36.79.248.85.3
Tridymite96.50.03.20.3
26Liquid34.09.249.67.2
Tridymite94.30.45.00.3
27Liquid26.623.647.12.7
Tridymite99.30.00.70.0
28Liquid36.423.734.45.5
Tridymite98.80.01.20.0
29Liquid16.826.749.66.9
Delafossite0.044.855.20.0
Spinel0.093.07.00.0
30Liquid15.338.241.74.8
Delafossite0.049.750.30.0
Spinel0.093.96.10.0
Table 4. Liquid compositions (wt %) of industrial slag samples after equilibration at 1150 °C and 1200 °C.
SampleT °CLiquid Slag Composition (wt %)
Cu2OFe2O3SiO2CaOAl2O3MgO
31115040.88.640.69.20.80.0
32115045.914.133.25.90.90.0
33115040.18.440.510.20.80.0
34120033.88.244.112.70.70.5
35120044.521.729.63.30.90.0
36120026.813.644.514.50.30.3
Table 5. Liquid slag compositions (wt %) of industrial tests at temperature between 1230 °C and 1250 °C.
SampleLiquid Slag Composition (wt %)
Cu2OFe2O3SiO2CaOAl2O3MgO
3724.834.732.03.74.80.0
3817.127.643.27.74.20.2

