Article

Synthesis of Chalcones with Anticancer Activities

by
Suvitha Syam
1,
Siddig Ibrahim Abdelwahab
2,*,
Mohammed Ali Al-Mamary
3 and
Syam Mohan
4
1
UPM-MAKNA Cancer Research Lab, Institute of Bioscience, University Putra Malaysia, 43400 Serdang, Selangor, Malaysia
2
Department of Pharmacy, Faculty of Medicine, University of Malaya, 50603 Kuala Lumpur, Malaysia
3
Department of Chemistry, Faculty of Science and Arts in Al-Mukhwah, Al-Baha University, Al-Baha 65431, Saudi Arabia
4
Centre for Natural Products and Drug Discovery (CENAR), Department of Pharmacology, Faculty of Medicine, University of Malaya, 50603 Kuala Lumpur, Malaysia
*
Author to whom correspondence should be addressed.
Molecules 2012, 17(6), 6179-6195; https://doi.org/10.3390/molecules17066179
Submission received: 28 March 2012 / Revised: 20 April 2012 / Accepted: 27 April 2012 / Published: 25 May 2012

Abstract

:
Several chalcones were synthesized and their in vitro cytotoxicity against various human cell lines, including human breast adenocarcinoma cell line MCF-7, human lung adenocarcinoma cell line A549, human prostate cancer cell line PC3, human adenocarcinoma cell line HT-29 (colorectal cancer) and human normal liver cell line WRL-68 was evaluated. Most of the compounds being active cytotoxic agents, four of them with minimal IC50 values were chosen and studied in detail with MCF-7 cells. The compounds 1, 5, 23, and 25 were capable in eliciting apoptosis in MCF-7 cells as shown by multiparameter cytotoxicity assay and caspase-3/7, -8, and -9 activities (p < 0.05). The ROS level showed 1.3-fold increase (p < 0.05) at the low concentrations used and thus it was concluded that the compounds increased the ROS level eventually leading to apoptosis in MCF-7 cells through intrinsic as well as extrinsic pathways.

1. Introduction

The burden of cancer is increasing across the World and thus it is the leading cause of deaths in economically developed countries and second leading cause of deaths in developing countries [1]. Cancer is considered to be one of the most intractable diseases because of the innate characteristics of cancer cells to proliferate uncontrollably, avoid apoptosis, invade and metastasize [2]. Despite the advances in chemotherapy, there are no sufficient clinically useful cytotoxic agents that selectively targets cancer cells.
Most of the chemotherapeutic agent have anticancer activity thanks to their capacity to elicit apoptosis [3]. The physiologically determined cell death, apoptosis, is necessary to maintain tissue homeostasis; where homeostasis refers to the balance between cell proliferation and cellular loss. Since it provides a mechanism of autodigestion for cells that are not functioning properly, the screening of anticancer agents for chemotherapy is designed to identify agents that selectively kill tumor cells. Many natural as well as synthetic agents have demonstrated to elicit apoptosis in cancer cells [4,5,6,7]. Synthetic derivatives are often found to be more active than parent compounds [6,7,8,9].
Chalcones, considered as the precursors of flavonoids and isoflavonoids are widely present in edible plants. Chemically, they consist of open-chain flavonoids in which the two aromatic rings are joined by a three-carbon α,β-unsaturated carbonyl system. Among the flavonoids, chalcones are an interesting target class of compounds which are extensively investigated due to their broad spectrum of biological activities, including anti-inflammatory [10], anti-invasive [11] and antitumour [12] and antibacterial [13] properties. They are regarded as promising anticancer agents against most human cancers. Previous literature suggests that chalcones are capable of inducing apoptosis [14,15] and also have the ability to uncouple mitochondrial respiration and thus collapse mitochondrial membrane potential [16]. Since a number of clinically useful anticancer drugs have genotoxic effects due to their interaction with the amino groups of nucleic acids, chalcones may be devoid of this important side effects [17]. In the ongoing search for potent and selective cytotoxic chalcones, we aimed to synthesize some chalcones and investigate their cytotoxic potential against some cancer cell lines, and also study the detailed mechanism of their cytotoxic activity. The synthesis of chalcones mentioned in this report can be done in simple steps with most of the compounds being produced in >50% overall yield.

2. Results and Discussion

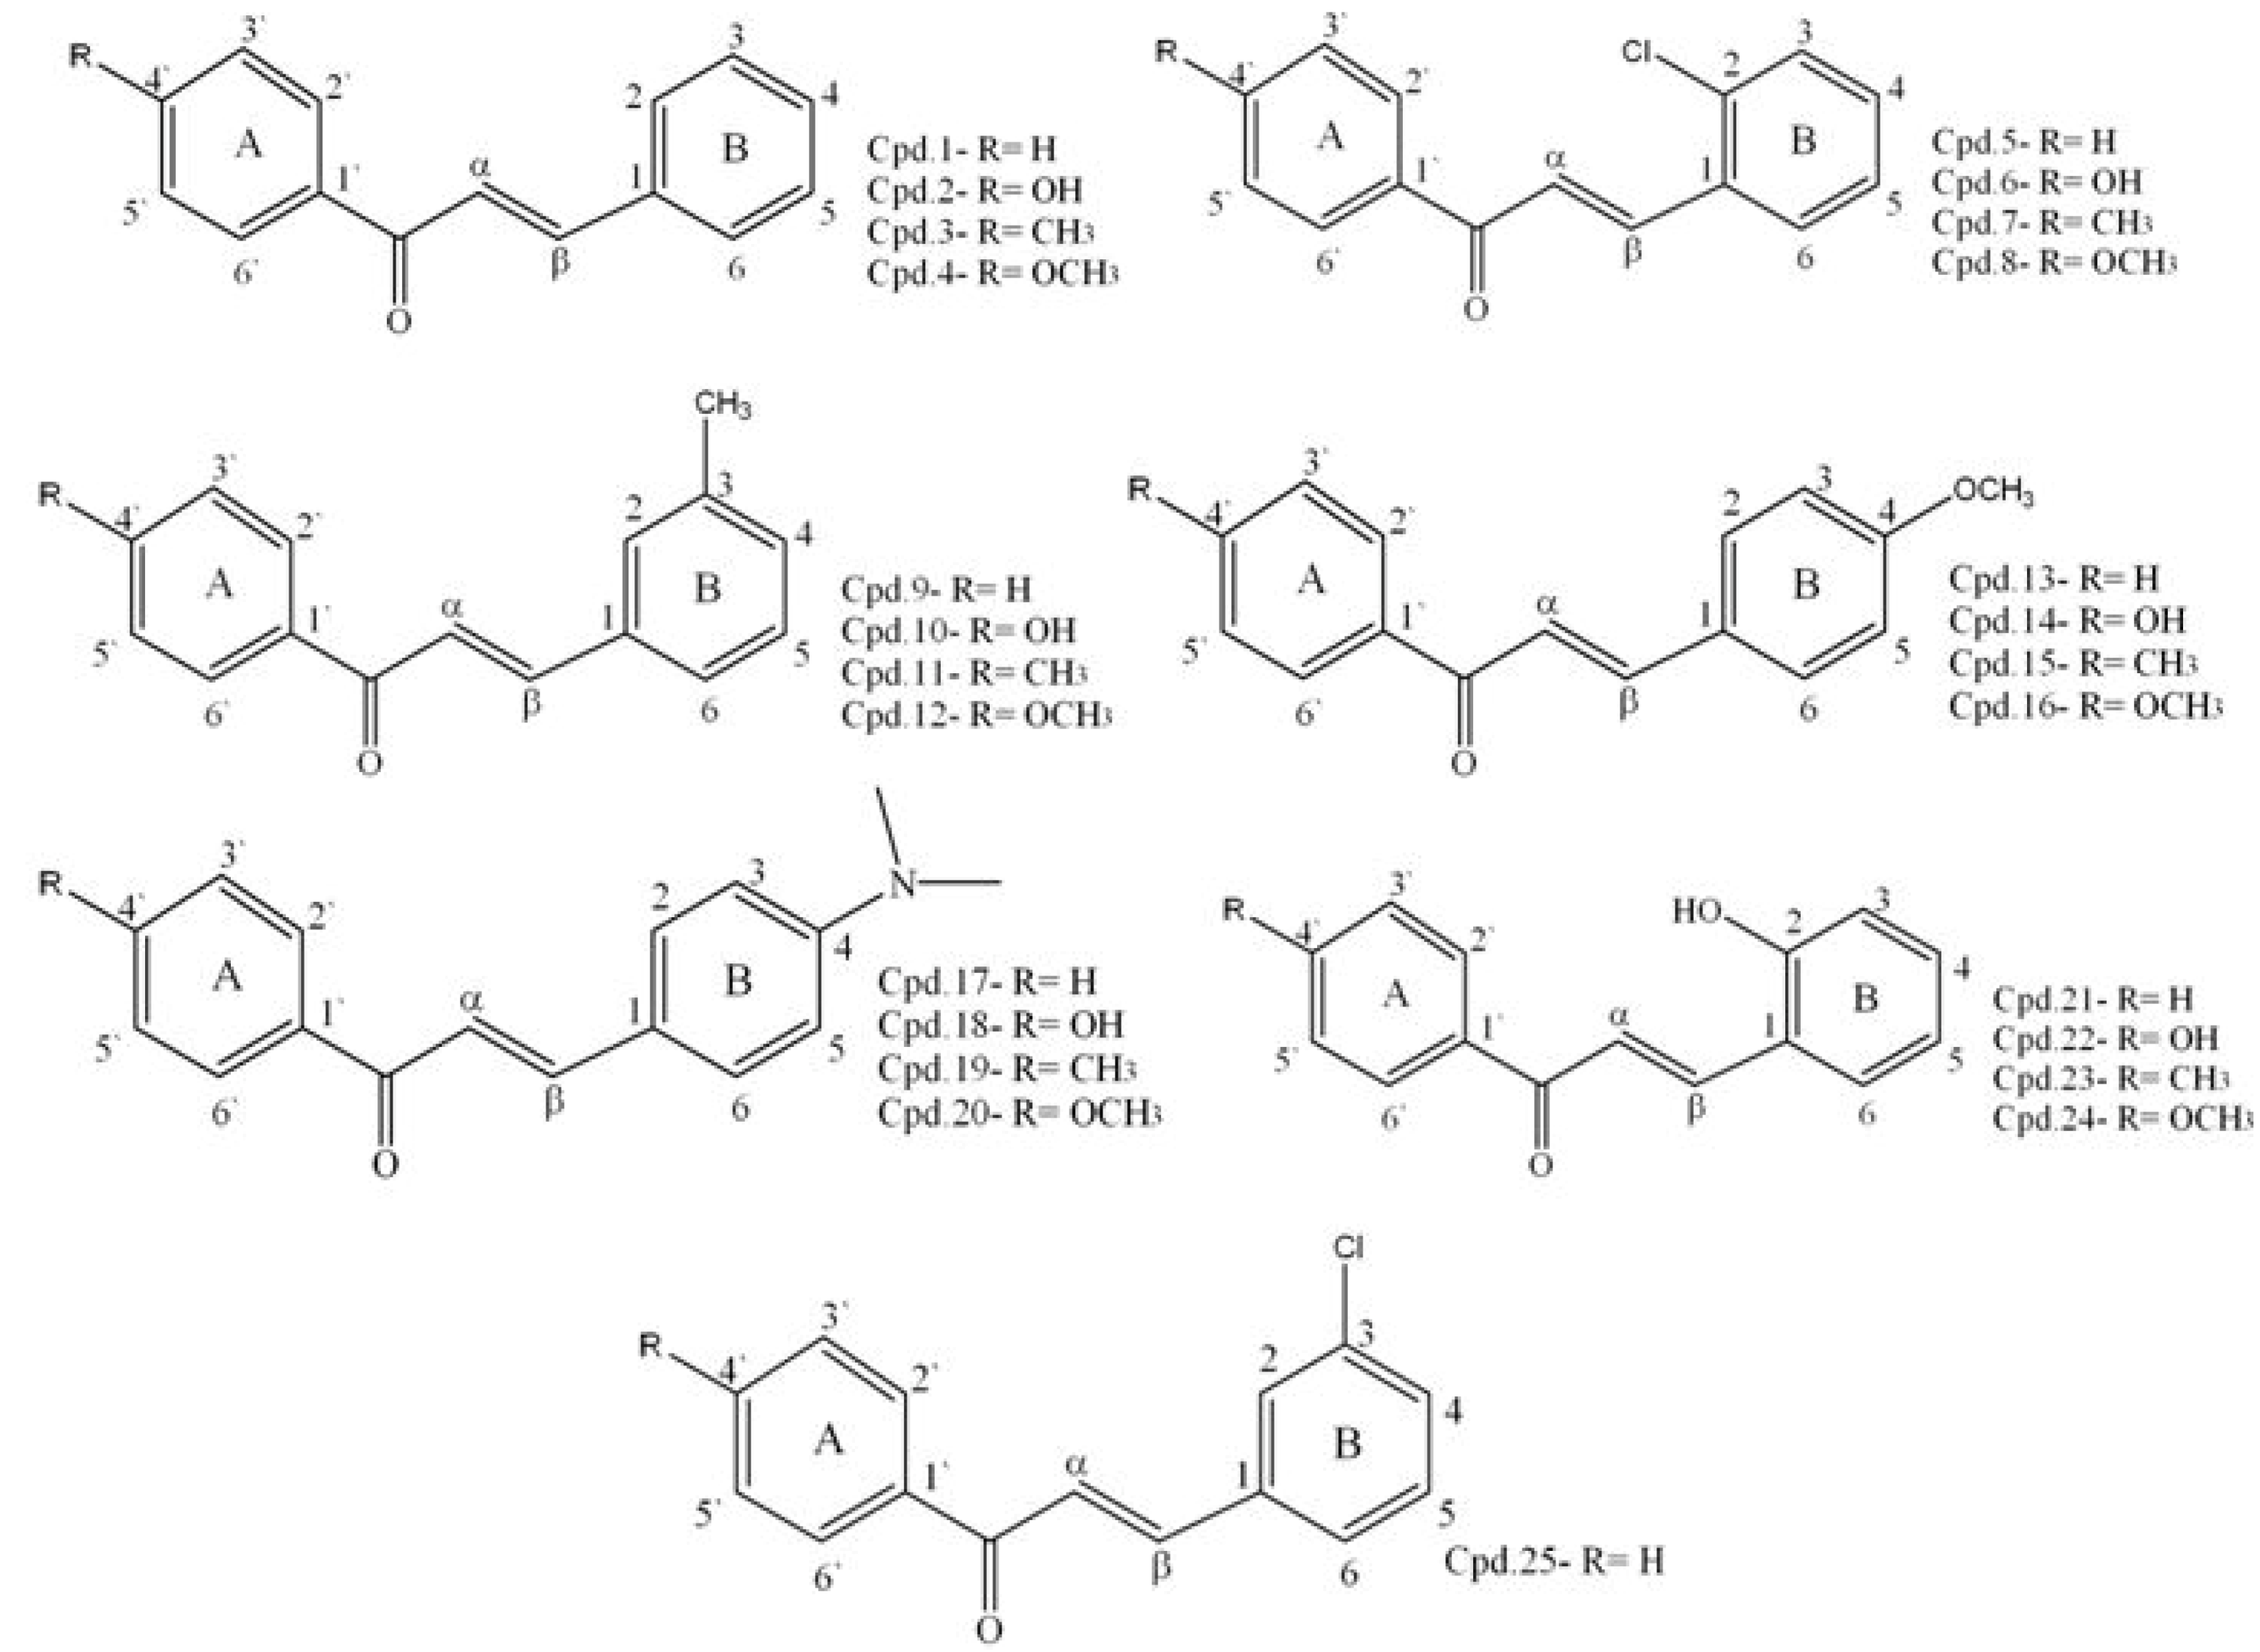
2.1. Synthesis of Chalcones

Different chalcone derivatives were obtained as indicated in Figure 1. The reactants used, chemical namea and formulae of the compounds are detailed in Table 1. The melting points, IR spectra (KBr), cm−1 and 1H-NMR spectra (δ, ppm) of the compounds were determined (refer to Table 2). Compounds 1, 5, 11–13, 15–17, 20 and 25 were obtained in high yields ranging between 75–90%; amongst which compound 15 and 20 had the maximum yield, reaching up to 90%. Compounds 3, 4, 7–9, 19 and 21 had yields ranging from 50–74% whilst compounds 2, 6, 10, 14, 18, 22–24 showed low yields of less than 50%.
Figure 1. Structures of different chalcones synthesized in this study. ‘Cpd’ stands for an abbreviation of “Compound”.
Molecules 17 06179 g001
Table 1. Chemical data for compounds 1–25.
NoReactantsChalcone (Chemical name)Formula
1Acetophenone + Benzaldehyde1,3-DiphenylpropenoneC15H12O
24H Acetophenone + Benzaldehyde1-(4-Hydroxyphenyl)-3-phenylpropenoneC15H12O2
34-Methylacetophenone + Benzaldehyde3-Phenyl-1- p-tolylpropenoneC16H14O
44-Methoxyacetophenone + Benzaldehyde1-(4-Methoxyphenyl)-3-phenylpropenoneC16H14O2
5Acetophenone + 2-Chloro-benzaldehyde3-(2-Chlorophenyl)-1-phenylpropenoneC15H11OCl
64H Acetophenone + 2-Chloro-benzaldehyde3-(2-Chlorophenyl)-(4-hydroxyphenyl)-propenoneC15H11O2Cl
74-Methylacetophenone + 2-Chloro-benzaldehyde3-(2-Chlorophenyl)-1-P-tolylpropenoneC16H13OCl
84-Methoxyacetophenone + 2-Chloro-benzaldehyde3-(2-Chlorophenyl)-1-(4-methoxy-phenyl)propenoneC16H13O2Cl
9Acetophenone + 3-Methyl-benzaldehyde1-Phenyl-3- m-tolylpropenoneC16H14O
104H Acetophenone + 3-Methyl-benzaldehyde1-(4-Hydroxyphenyl)-3- m-tolylpropenoneC16H14O2
114-Methylacetophenone + 3-Methyl-benzaldehyde3- m-Tolyl-1-p-tolylpropenoneC17H16O
124-Methoxyacetophenone + 3-Methyl-benzaldehyde1-(4-Methoxyphenyl)-3- m-tolylpropenoneC17H16O2
13Acetophenone + Anisaldehyde3-(4-Methoxyphenyl)-1-phenylpropenoneC16H14O2
144H Acetophenone + Anisaldehyde1-(4-Hydroxyphenyl)-3-(4-methoxyphenyl)-propenoneC16H15O3
154-Methylacetophenone + Anisaldehyde3-(4-Methoxyphenyl)-1- p-tolylpropenoneC17H16O2
164-Methoxyacetophenone + Anisaldehyde1,3-Bis-(4-Methoxyphenyl)-propenoneC17H16O3
17Acetophenone + 4-Dimethylamino- benzaldehyde3-(4-Dimethylaminophenyl)-1-phenyl-propenoneC17H17NO
184H Acetophenone + 4-Dimethylamino-benzaldehyde3-(4-Dimethylaminophenyl)-1-(4-hydroxy-phenyl)-propenoneC17H17NO2
194-Methylacetophenone + 4-Dimethylamino- benzaldehyde3-(4-Dimethylaminophenyl)-1- p-tolyl-propenoneC18H19NO
204-Methoxyacetophenone + 4-Dimethylamino-benzaldehyde3-(4-Dimethylaminophenyl)-1-(4-methoxy-phenyl)-propenoneC18H19NO2
21Acetophenone + Salicylaldehyde3-(2-Hydroxyphenyl)-1-phenylpropenoneC15H12O2
224H Acetophenone + Salicylaldehyde3-(2-Hydroxyphenyl)-1-(4-hydroxyphenyl)-propenoneC15H12O3
234-Methylacetophenone + Salicylaldehyde3-(2-Hydroxyphenyl)-1- p-tolylpropenoneC16H14O2
244-Methoxyacetophenone + Salicylaldehyde3-(2-Hydroxyphenyl)-1-(4-methoxyphenyl)-propenoneC16H14O3
25Acetophenone + 3-Chlorobenzaldehyde3-(3-Chlorophenyl)-1-phenylpropenoneC15H11OCl
Table 2. Spectral data, yield and melting point of compounds 1–25.
Cpd.IR-Spectrum (KBr), сm−11H-NMR spectrum (δ, ppm)Yield (%)m.p. (°C)
13030 (C-H aromatic), 1664 (C=O), 1598 (C=C)7.77 (d, 1Hα), 8.08 (d, 1Hβ), 7.4–8 (m, 10H, Ar-H)70–8056–57
23083 (C-H aromatic), 1680 (C=O), 1580 (C=C), 3380 (-OH)7.56 (d, 1Hα), 7.99 (d, 1Hβ), 7.04–7.9 (m, 9H, Ar-H), 12.9 (s, 1H, -OH)35–45120–121
33030 (C-H aromatic), 1649 (C=O), 1598 (C=C)7.38 (d, 1Hα), 8.1 (d, 1Hβ), 7.5–7.9 (m, 9H, Ar-H), 2.29 (s, 3H, -CH3)70–7370–72
43047 (C-H aromatic), 1649 (C=O), 1603 (C=C), 1128 (-OCH3)7.19 (d, 1Hα), 8.2 (d, 1Hβ), 7.29–7.9 (m, 9H, Ar-H), 3.79 (s, 3H, -OCH3)70–74108–110
53047 (C-H aromatic), 1664 (C=O), 1608(C=C), 829 (Ar-Cl)7.9 (d,1Hα), 8.2 (d, 1Hβ), 7.39–8 (m, 9H, Ar-H)75–8053–54
63452 (-OH), 1690 (C=O), 1613 (C=C), 829 (Ar-Cl)7.5 (d, 1Hα), 8.19 (d, 1Hβ), 6.4–8 (m, 8H, Ar-H), 12.7 (s, 1H, -OH)40–43191–193
73052 (C-H aromatic), 1664 (C=O), 1598 (C=C), 829 (Ar-Cl)7.9 (d, 1Hα), 8.19 (d, 1Hβ), 7.3–8.1 (m, 8H, Ar-H), 2.3 (s, 3H, -CH3)70–7550–51
83034 (C-H aromatic), 1664 (C=O), 1590 (C=C), 1130 (-OCH3), 828 (Ar-Cl)7 (d, 1Hα), 7.7 (d, 1Hβ), 6.9–8.1 (m, 8H, Ar-H), 3.79 (s, 3H, -OCH3)60–65124–126
93057 (C-H aromatic), 1664 (C=O), 1590 (C=C)7.19 (d,1Hα), 8.2 (d, 1Hβ), 7.2–8 (m, 9H, Ar-H), 2.3 (s, 3H, -CH3)68–7068–70
103457 (-OH), 3011 (C-H aromatic), 1685 (C=O), 1591 (C=C)7.2 (d, 1Hα), 7.7 (d, 1Hβ), 7.1–8 (m, 8H, Ar-H), 12.8 (s, 1H, -OH), 2.3 (s, 3H, CH3)30114–116
113027 (C-H aromatic), 1654 (C=O), 1593 (C=C)7.8 (d, 1Hα), 8.2 (d, 1Hβ), 7.1–8 (m, 8H, Ar-H), 2.3 (s, 3H, -CH3)8489–91
123011 (C-H aromatic), 1659 (C=O), 1588 (C=C), 1126 (-OCH3)7.19 (d, 1Hα), 8.21 (d, 1Hβ), 6.9–8 (m, 8H, Ar-H), 3.8 (s, 3H, -OCH3), 2.96 (s, 3H, CH3)8074–75
133057 (C-H aromatic), 1659 (C=O), 1588 (C=C), 1168 (-OCH3)7 (d, 1Hα), 8.2 (d, 1Hβ), 6.9–8.2 (m, 9H, Ar-H), 3.8 (s, 3H, -OCH3)8077–78
143380 (-OH), 3035 (C-H aromatic) 1660 (C=O), 1590 (C=C), 1166 (-OCH3)6.9 (d, 1Hα), 7.9 (d, 1Hβ), 6.7–8.1 (m, 8H, Ar-H), 12.8 (s, 1H, -OH), 3.8 (s, 3H, -OCH3)35179–181
153080 (C-H aromatic), 1649 (C=O), 1588 (C=C), 1170 (-OCH3)7.7 (d, 1Hα), 8.2 (d, 1Hβ), 6.9–8.2 (m, 8H, Ar-H), 2.29 (s, 3H, -CH3), 3.8 (s, 3H, -OCH3)85–9099–100
163033 (C-H aromatic), 1659 (C=O), 1588 (C=C), 1168 (-OCH3)7.7 (d, 1Hα), 8.2 (d, 1Hβ), 6.9–8.2 (m, 8H, Ar-H), 3.8(s, 3H, -OCH3), 3.8 (s, 3H, OCH3)80–88102–103
173010 (C-H aromatic), 1654(C=O), 1562(C=C), 1340 (C-N)6.7 (d, 1Hα), 8.21 (d, 1Hβ), 7.3–7.8 (m, 9H, Ar-H), 2.9 (s, 6H, N-(CH3)2)80111–113
183380 (-OH), 3012 (C-H aromatic), 1664 (C=O), 1598 (C=C), 1372 (C-N)6.8 (d, 1Hα), 8.7 (d, 1Hβ), 6.8–8.8 (m, 8H, Ar-H), 9.7 (s, 1H, -OH), 2.99 (s, 6H, N-(CH3)2)4776–78
193083 (C-H aromatic), 1649 (C=O), 1603 (C=C), 1360 (C-N)6.7 (d, 1Hα), 8.21 (d, 1Hβ), 7.3–8 (m, 8H, Ar-H), 2.98 (s, 6H, N-(CH3)2), 2.3 (s, 3H, -CH3)70124–125
203010 (C-H aromatic), 1650 (C=O), 1593 (C=C), 1161 (-OCH3), 1330 (C-N)6.7 (d, 1Hα), 8.2 (d, 1Hβ), 6.7–8.1 (m, 8H, Ar-H), 2.9 (s, 6H, N-(CH3)2), 3.79 (s, 3H, -OCH3)86–90129–131
211639 (C=O), 1557 (C=C), 3206 (-OH), 3010 (C-H aromatic)7.6 (d, 1Hα), 8.2 (d, 1Hβ), 6.7–8.2 (m, 9H, Ar-H), 10.3 (s, 1H, -OH)50154–155
221669 (C=O), 1590 (C=C), 3467 (-OH), 3005 (C-H aromatic)7.8 (d, 1Hα), 7.5 (d, 1Hβ), 6.3–8.3 (m, 8H, Ar-H), 10.2 (s, 1H, -OH), 10.2 (s, 1H, -OH)8–10287–289
231644 (C=O), 1577 (C=C) , 3216 (-OH), 3030 (C-H aromatic)6.8 (d, 1Hα), 7.8 (d, 1Hβ), 6.7–8.2 (m, 8H, Ar-H), 10.2 (s, 1H, -OH), 2.28 (s, 3H, -CH3)37–40165–167
243252 (-OH), 3000 (C-H aromatic), 1640 (C=O), 1603 (C=C), 1165 (-OCH3)7.96 (d, 1Hα), 8.19 (d, 1Hβ), 6.7–8.2 (m, 8H, Ar-H), 10.19 (s, 1H, -OH), 3.69 (s, 3H, OCH3)45151–153
251654 (C=O), 1603 (C=C), 3052 (C-H aromatic), 823 (Ar-Cl)7.9 (d, 1Hα), 8.2 (d, 1Hβ), 7.2–8 (m, 9H, Ar-H)8078–80

2.2. Cytotoxic Screening

The cytotoxicity of the synthesized chalcones were studied using the MTT assay in five human cancer cell lines, including MCF-7 (breast), A549 (lung), PC3 (prostate), HT-29 (colorectal) and WRL68 (liver). The results are listed in Table 3. Compounds 2, 7, 8, 14, 18, 20, 22 showed low cytotoxic effects on all the cell lines. Compounds 1, 5, 10, 23, 24, 25 showed high cytotoxicity in all cell lines with IC50 concentrations lines, except for the A549 cell line. It is already well known that chalcones (both natural and synthetic of less than 20 µg/mL. Compounds 3, 11, 12, 13, and 21 also showed IC50 values of less than 20 µg/mL in all cell origin) are cytotoxic to cancer cells [18,19,20] and this was confirmed by the data of the current study.
Table 3. Cytotoxicity of compounds on different cell lines.
CompoundCell lines/IC50 values (µg/mL)
A549PC3MCF-7HT-29WRL68
116.76 ± 1.089.108 ± 0.96.875 ± 0.21910.1 ± 1.0110.55 ± 0.89
2>100>100>100>100>100
336.58 ± 1.7617.30 ± 1.113.62 ± 1.0119.10 ± 1.0021.34 ± 3.01
477.04 ± 2.121.13 ± 1.2419.15 ± 1.037.28 ± 2.8157.29 ± 3.8
519.94 ± 1.6613.84 ± 1.27.992 ± 0.8113.24 ± 1.211.46 ± 1.1
625.22 ± 1.2110.99 ± 1.810.01 ± 1.415.52 ±13.22 ± 1.3
7>100>100>100>100>100
8>100>100>100>100>100
924.74 ± 2.09.40 ± 1.99.34 ± 0.5618.96 ± 1.59.78 ± 1.01
1019.68 ± 1.2213.71 ±1.18.343 ± 0.47212.1 ± 3.013.45 ± 2.09
1124.89 ± 1.98.73 ± 0.2110.16 ± 1.8916.30 ± 1.913.95 ± 1.3
1231.76 ± 1.59.87 ± 0.719.53 ± 1.9915.76 ± 2.111.13 ± 1.8
1332.57 ± 2.512.09 ± 0.9911.62 ± 0.10122.79 ± 2.321.46 ± 1.7
14>100>100>100>100>100
15>10043.27 ± 4.0132.37 ± 1.8829.55 ± 2.850.94 ± 3.51
16>100>10041.44 ± 1.9167.07 ± 4.160.79 ± 4.22
17>100>10099.29 ± 6.1664.26 ± 5.02>100
18>100>100>100>100>100
1958.54 ± 3.2>10057.28 ± 3.169.54 ± 4.2339.78 ± 3.9
2078.85 ± 4.4>100>100>100>100
2122.61 ± 1.111.07 ± 0.49.353 ± 1.219.84 ± 2.0117.02 ± 1.7
22>100>100>100>100>100
2316.79 ± 1.769.492 ± 0.76.873 ± 1.212.98 ± 0.549.533 ± 1.5
2414.16 ± 1.05.584 ± 0.27.149 ± 0.411.43 ± 1.08.722 ± 1.0
2514.49 ± 0.26.936 ± 0.615.251 ± 0.677.772 ± 1.17.72 ± 1.6
Figure 2. Representative images of MCF7 cells treated with medium alone and compounds, and stained with nuclear staining dye, cell permeability dye, mitochondrial membrane potential dye and cytochrome c. The images from each row are obtained from the same field of the same treatment sample. MCF7 cells produced a marked reduction in mitochondrial membrane potential, and marked increases in membrane permeability and cytochrome c. (Magnification 20X). (1A- 3 µg/mL; 1B- 6 µg/mL), (23A- 3 µg/mL; 23B- 6 µg/mL), (25A- 2 µg/mL; 25B- 4 µg/mL) and (5A- 3 µg/mL; 5B- 6 µg/mL). The positive control used in the analysis was tamoxifen (0.04 µg/mL). “Cpd” refers to compound.
Molecules 17 06179 g002

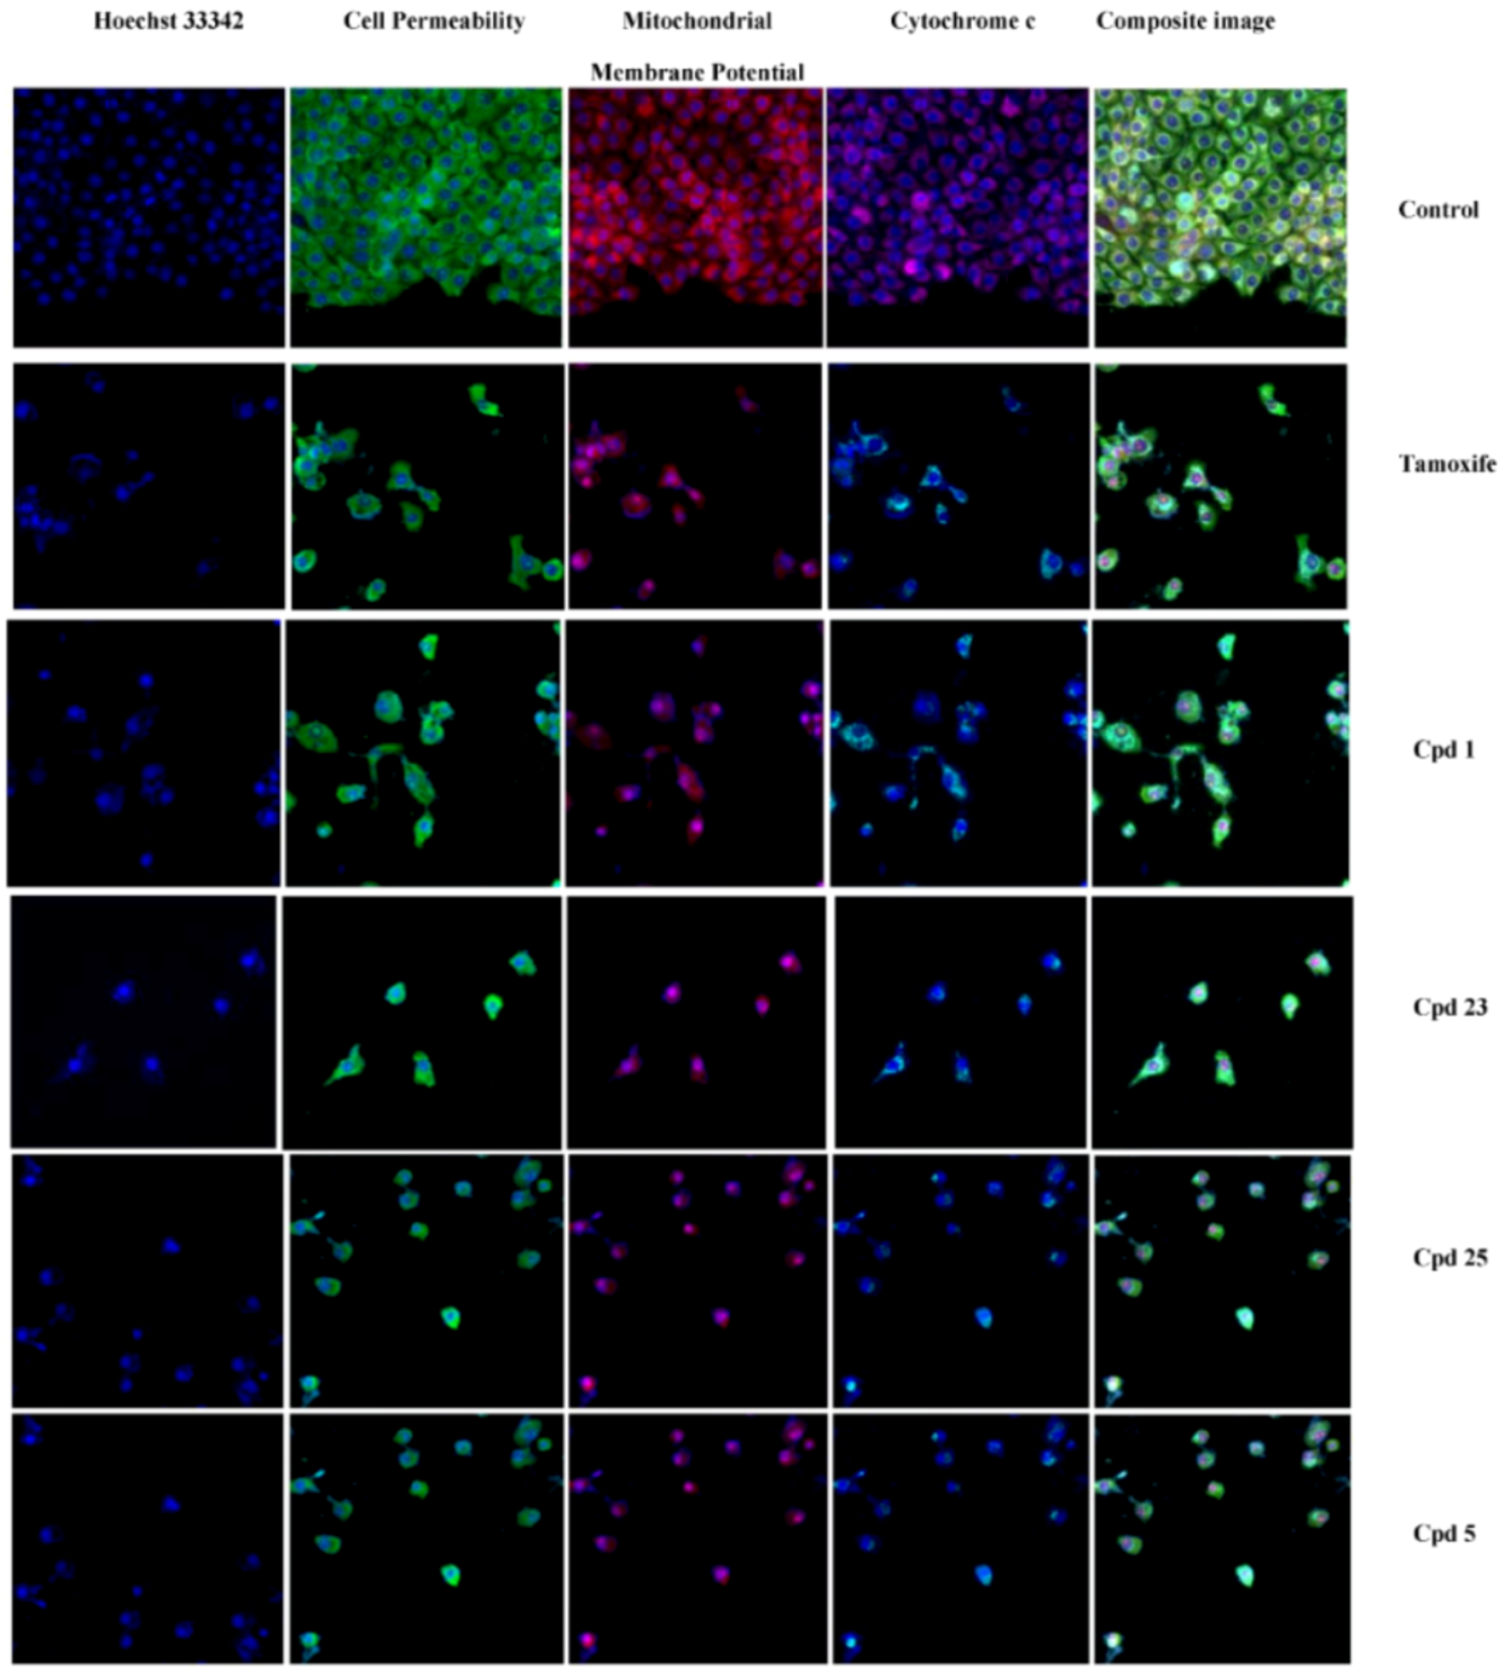
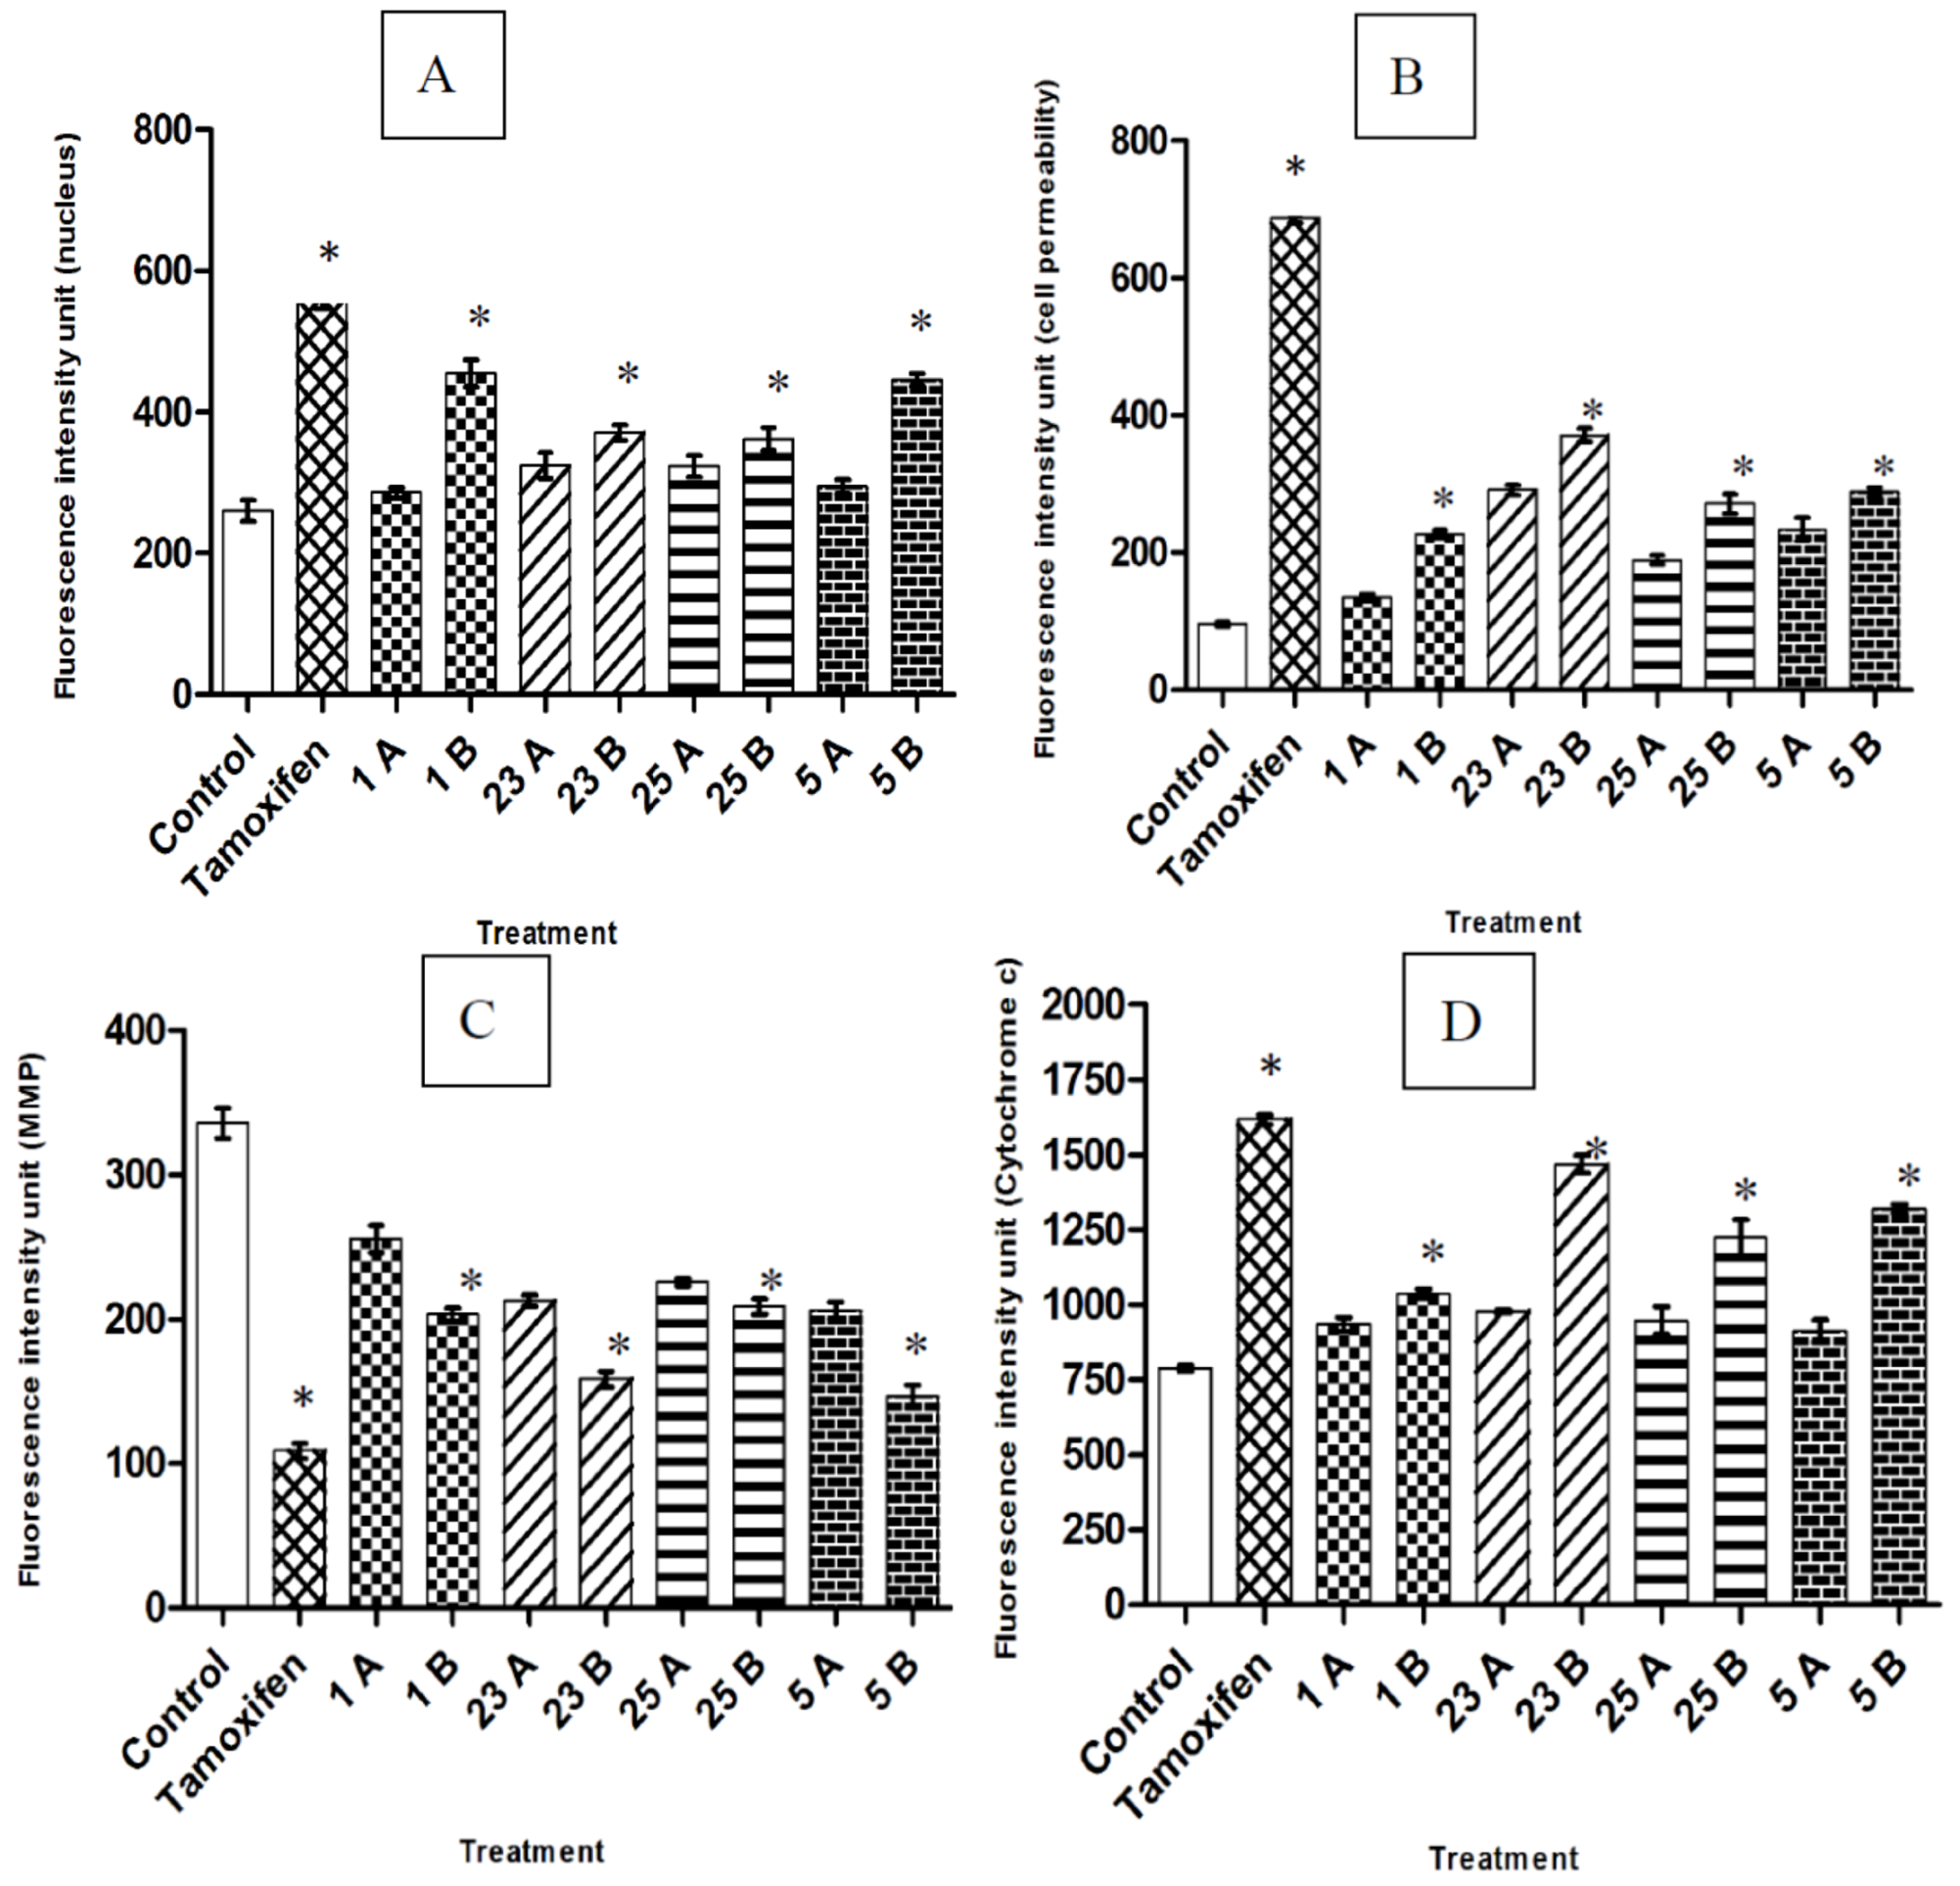
2.3. Multiparameter Cytotoxic Analysis

Though the chalcones produced growth inhibition, the mode of cell death was yet to be studied. Different modes of cell death include autophagy, apoptosis and necrosis; of which apoptosis is the desired mode of cell death in chemotherapy [21]. As such, studies are extensively focused on the apoptotic potential of a compound to be anticancer agent [5,22]. In the current study, we therefore investigated the involvement of apoptosis in the cytotoxicity produced by select compounds (1, 5, 23 and 25) in MCF-7 cells by examining the cellular changes associated with apoptosis using HCS analysis. The treated cells exhibited a concentration-dependent increase in nuclear chromatin staining with Hoechst 33342 (Figure 2 and Figure 3) with all compounds, suggesting an increase in nuclear condensation. The increase in nuclear chromatin staining to Hoechst 33342 dye was also observed in tamoxifen positive control cells whereas the fluorescent intensity was significantly lower in the control.
Figure 3. Quantitative analysis of compounds mediated apoptosis parameter. Changes in (A) total nuclear intensity; (B) cell permeability; (C) mitochondrial membrane potential and (D) cytochrome c localization were all measured simultaneously in MCF7 cells. Following treatment with compounds 1, 23, 25 and 5, there was statistically significant cell loss (data not shown), increased total nuclear intensity, increased cell permeability, loss of mitochondrial membrane potential and cytochrome c release from mitochondria with good p values. (1A- 3 µg/mL; 1B- 6 µg/mL), (23A- 3 µg/mL; 23B- 6 µg/mL), (25A- 2 µg/mL; 25B- 4 µg/mL) and (5A- 3 µg/mL; 5B- 6 µg/mL). The positive control used in the analysis was tamoxifen (0.04 µg/mL). Each experiment was performed at least two times. Results are expressed as the means value ± standard deviation (SD). Statistical analysis was performed with one-way analysis of variance (ANOVA) using GraphPad Prism software (version 4.0; GraphPad Software Inc.). Statistical significance is expressed as *, p < 0.05.
Molecules 17 06179 g003
The high fluorescence intensity for the permeability dye in the cytoplasm of chalcone treated and tamoxifen treated cells evidenced the increase in membrane permeability compared to the control cells. A reduction in mitochondrial membrane potential dye retention was observed with increasing concentrations of the compounds used for treatment and with the tamoxifen positive control whereas the control cells had intact mitochondrial membrane potential dye retention. The specific apoptosis indicator, release of cytochrome c was found to increase in concentration dependent manner with all compounds used in the treatment and with the tamoxifen treated cells. Chromatin condensation [23], increased cell permeability [24], decline in mitochondrial membrane potential [25] and cytochrome c release [26] are key events of apoptosis which were obviously observed when the selected compounds were treated on MCF-7 cells. There are previous studies demonstrating that chalcones were good candidates in producing apoptosis in MCF-7 cells [22,27].

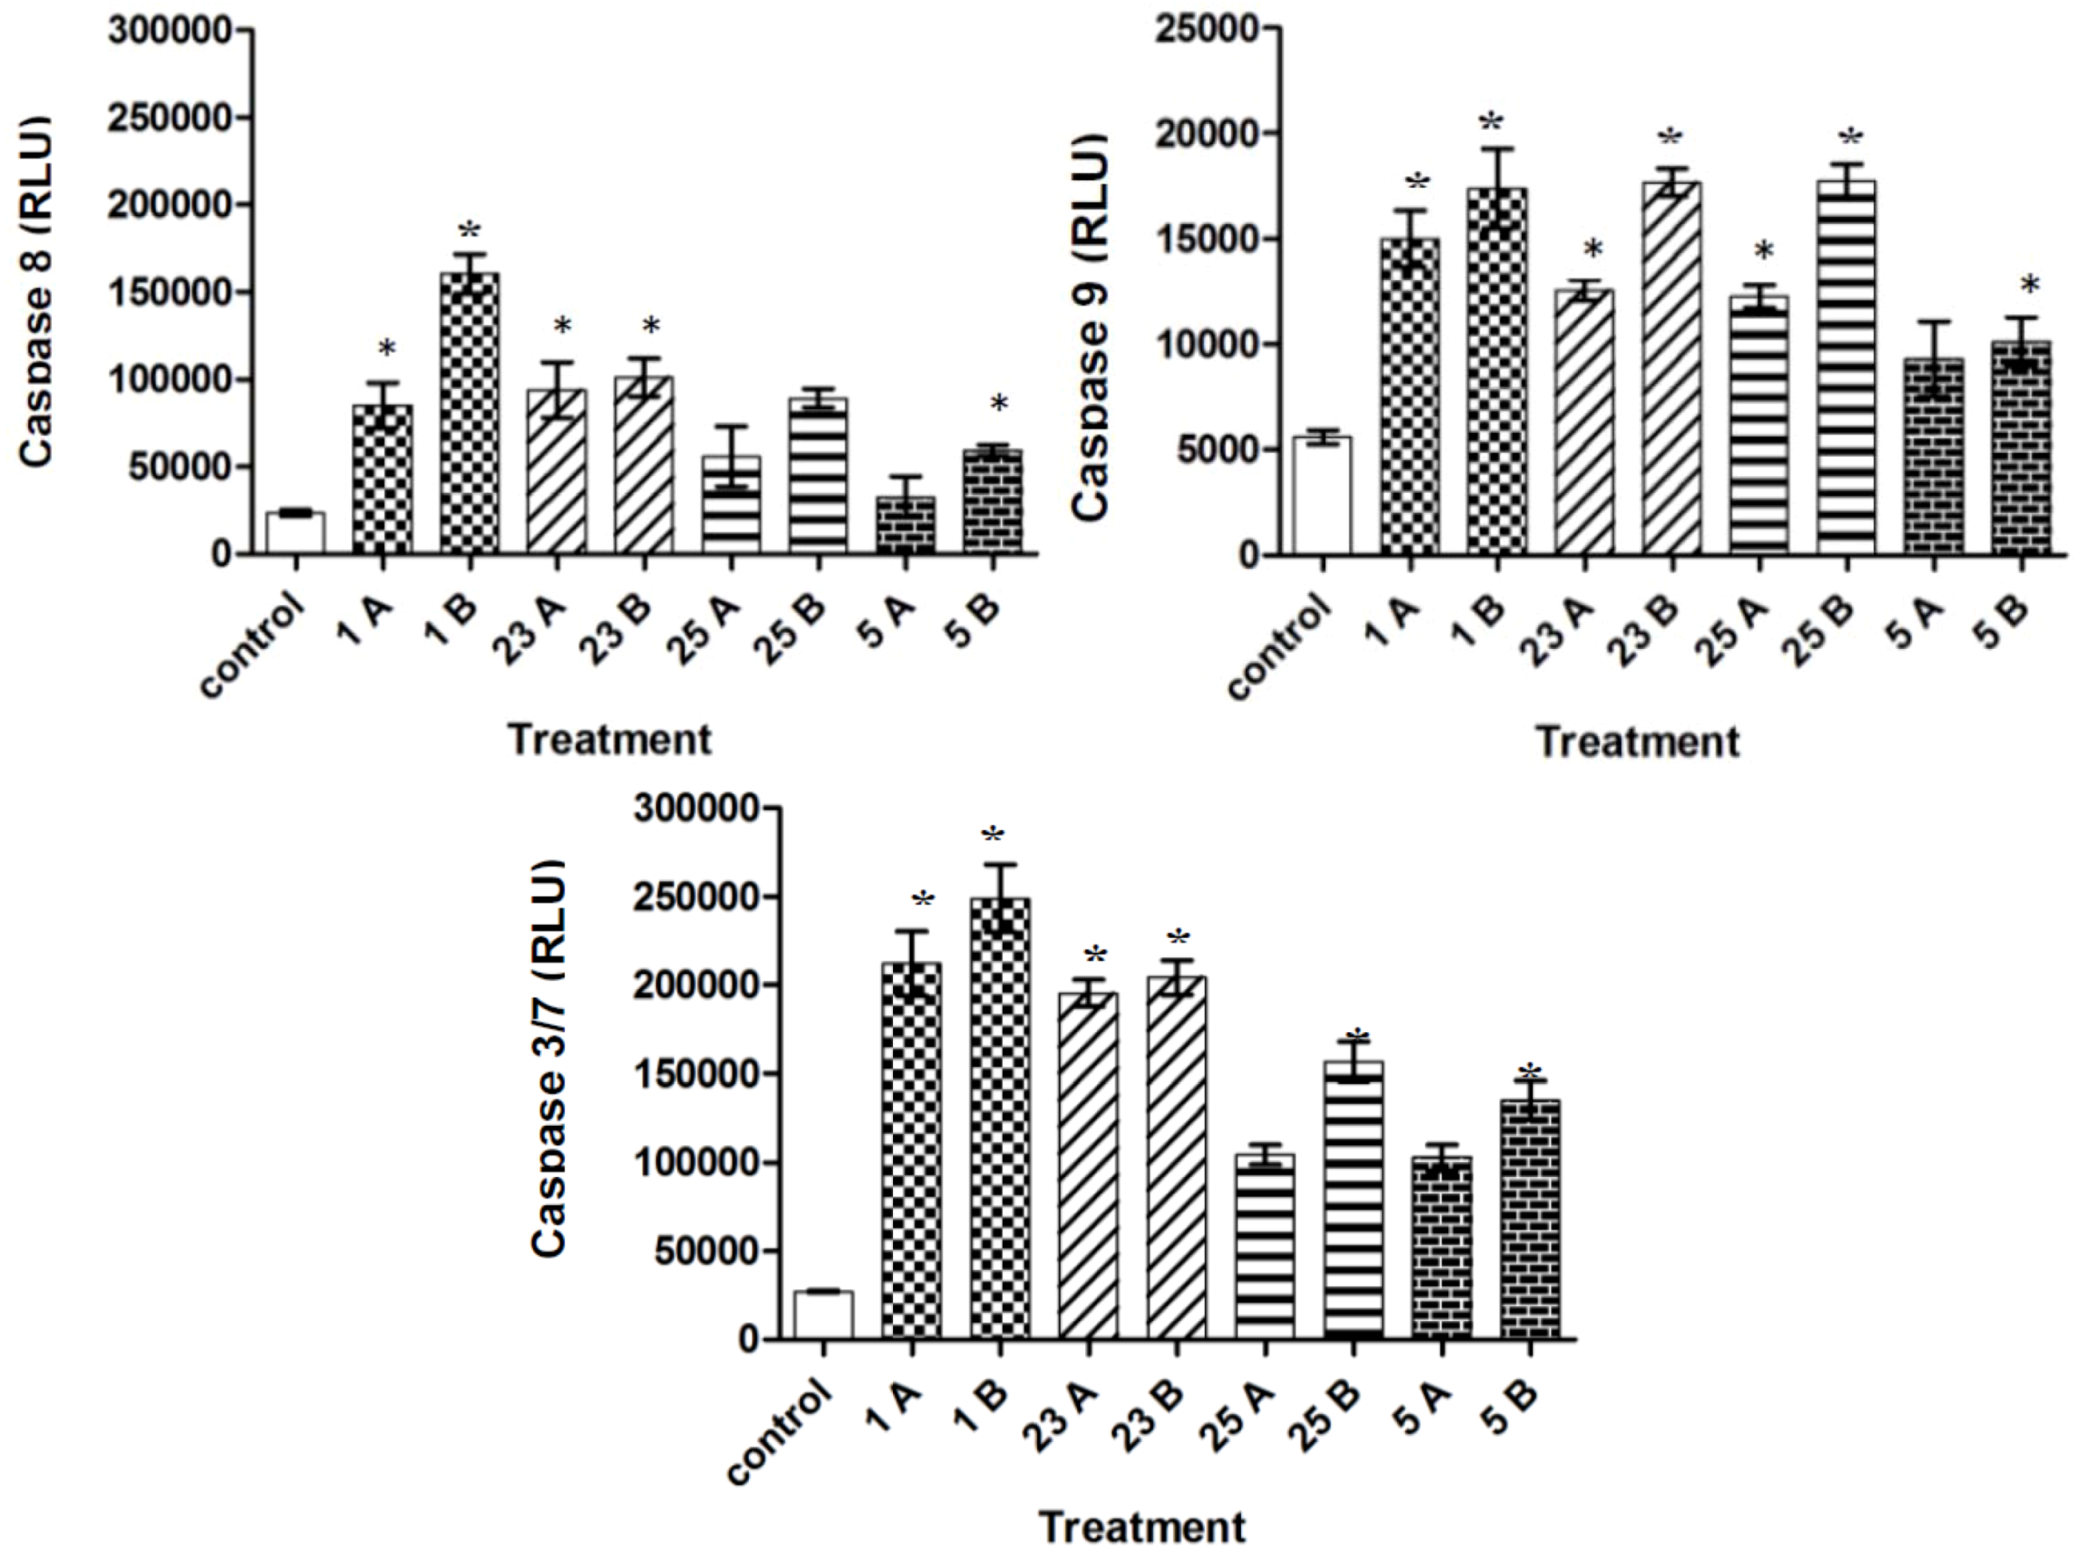
2.4. Caspase-3/7, -8, and -9 Activity

The caspases, a family of cysteine-dependent aspartate-directed proteases, are prominent among the death proteases [28]. There are two type of caspases, namely upstream (initiator) caspases and downstream (effector) caspases [29]. Upstream caspases, which include caspase-8 and caspase-9 cleave inactive pro-forms of downstream caspases like caspase-3 and caspase-7; which in turn cleave proteins involved in programmed cell death events [30]. In our analysis, following treatment with the selected synthesized compounds, the caspase-3/7, caspase-8, and caspase 9 activity was increased in MCF-7 cells as compared to control. Caspase-3/7 activity of all compounds was more than 100,000 RLU, where the maximum caspase-3/7 activity (210430 RLU) was achieved at highest concentration of compound 1. The control cells, on the other hand, had only caspase-3/7 activity of 30,140 RLU. When the caspase-8 activity of control cells were just 50892 RLU, the highest concentrations of compound 1, 23, 25 and 5 showed significant activity (p < 0.05) of 17,568 RLU, 18,342 RLU, 18,356 RLU and 10,435 RLU respectively. Similarly, caspase-9 activity was also elevated in all treatments of the compounds used to analyze. All the compounds except compound 5 showed caspase-9 activity of more than 12,000 RLU. On the whole, all the four compounds showed increase in caspase-3/7, caspase-8, and caspase-9 activity with increase in concentration suggesting that there is the activation of both intrinsic and extrinsic apoptotic pathways [31]. It is also important to note that MCF-7 cells do not have caspase-3 [32], so the activity represented is of caspase-7. Recently, Deeb et al., found that xanthohumol, a chalcone, elicited apoptosis in cancer cells by both intrinsic and extrinsic pathways [33]. Similarly, another study proved that chalcones are capable in inducing both pathways in MCF-7 and MDA-MB-231 breast cancer cell lines [27].
Figure 4. Relative luminescence expression (RLU) of caspase 3/7, 8 and 9 in the MCF7 cells treated with different concentrations compounds. (1A- 3 µg/mL; 1B- 6 µg/mL), (23A- 3 µg/mL; 23B- 6 µg/mL), (25A- 2 µg/mL; 25B- 4 µg/mL) and (5A- 3 µg/mL; 5B- 6 µg/mL). Triplicates of each treatment group were used in each independent experiment. The statistical significance is expressed as *, p < 0.05.
Molecules 17 06179 g004

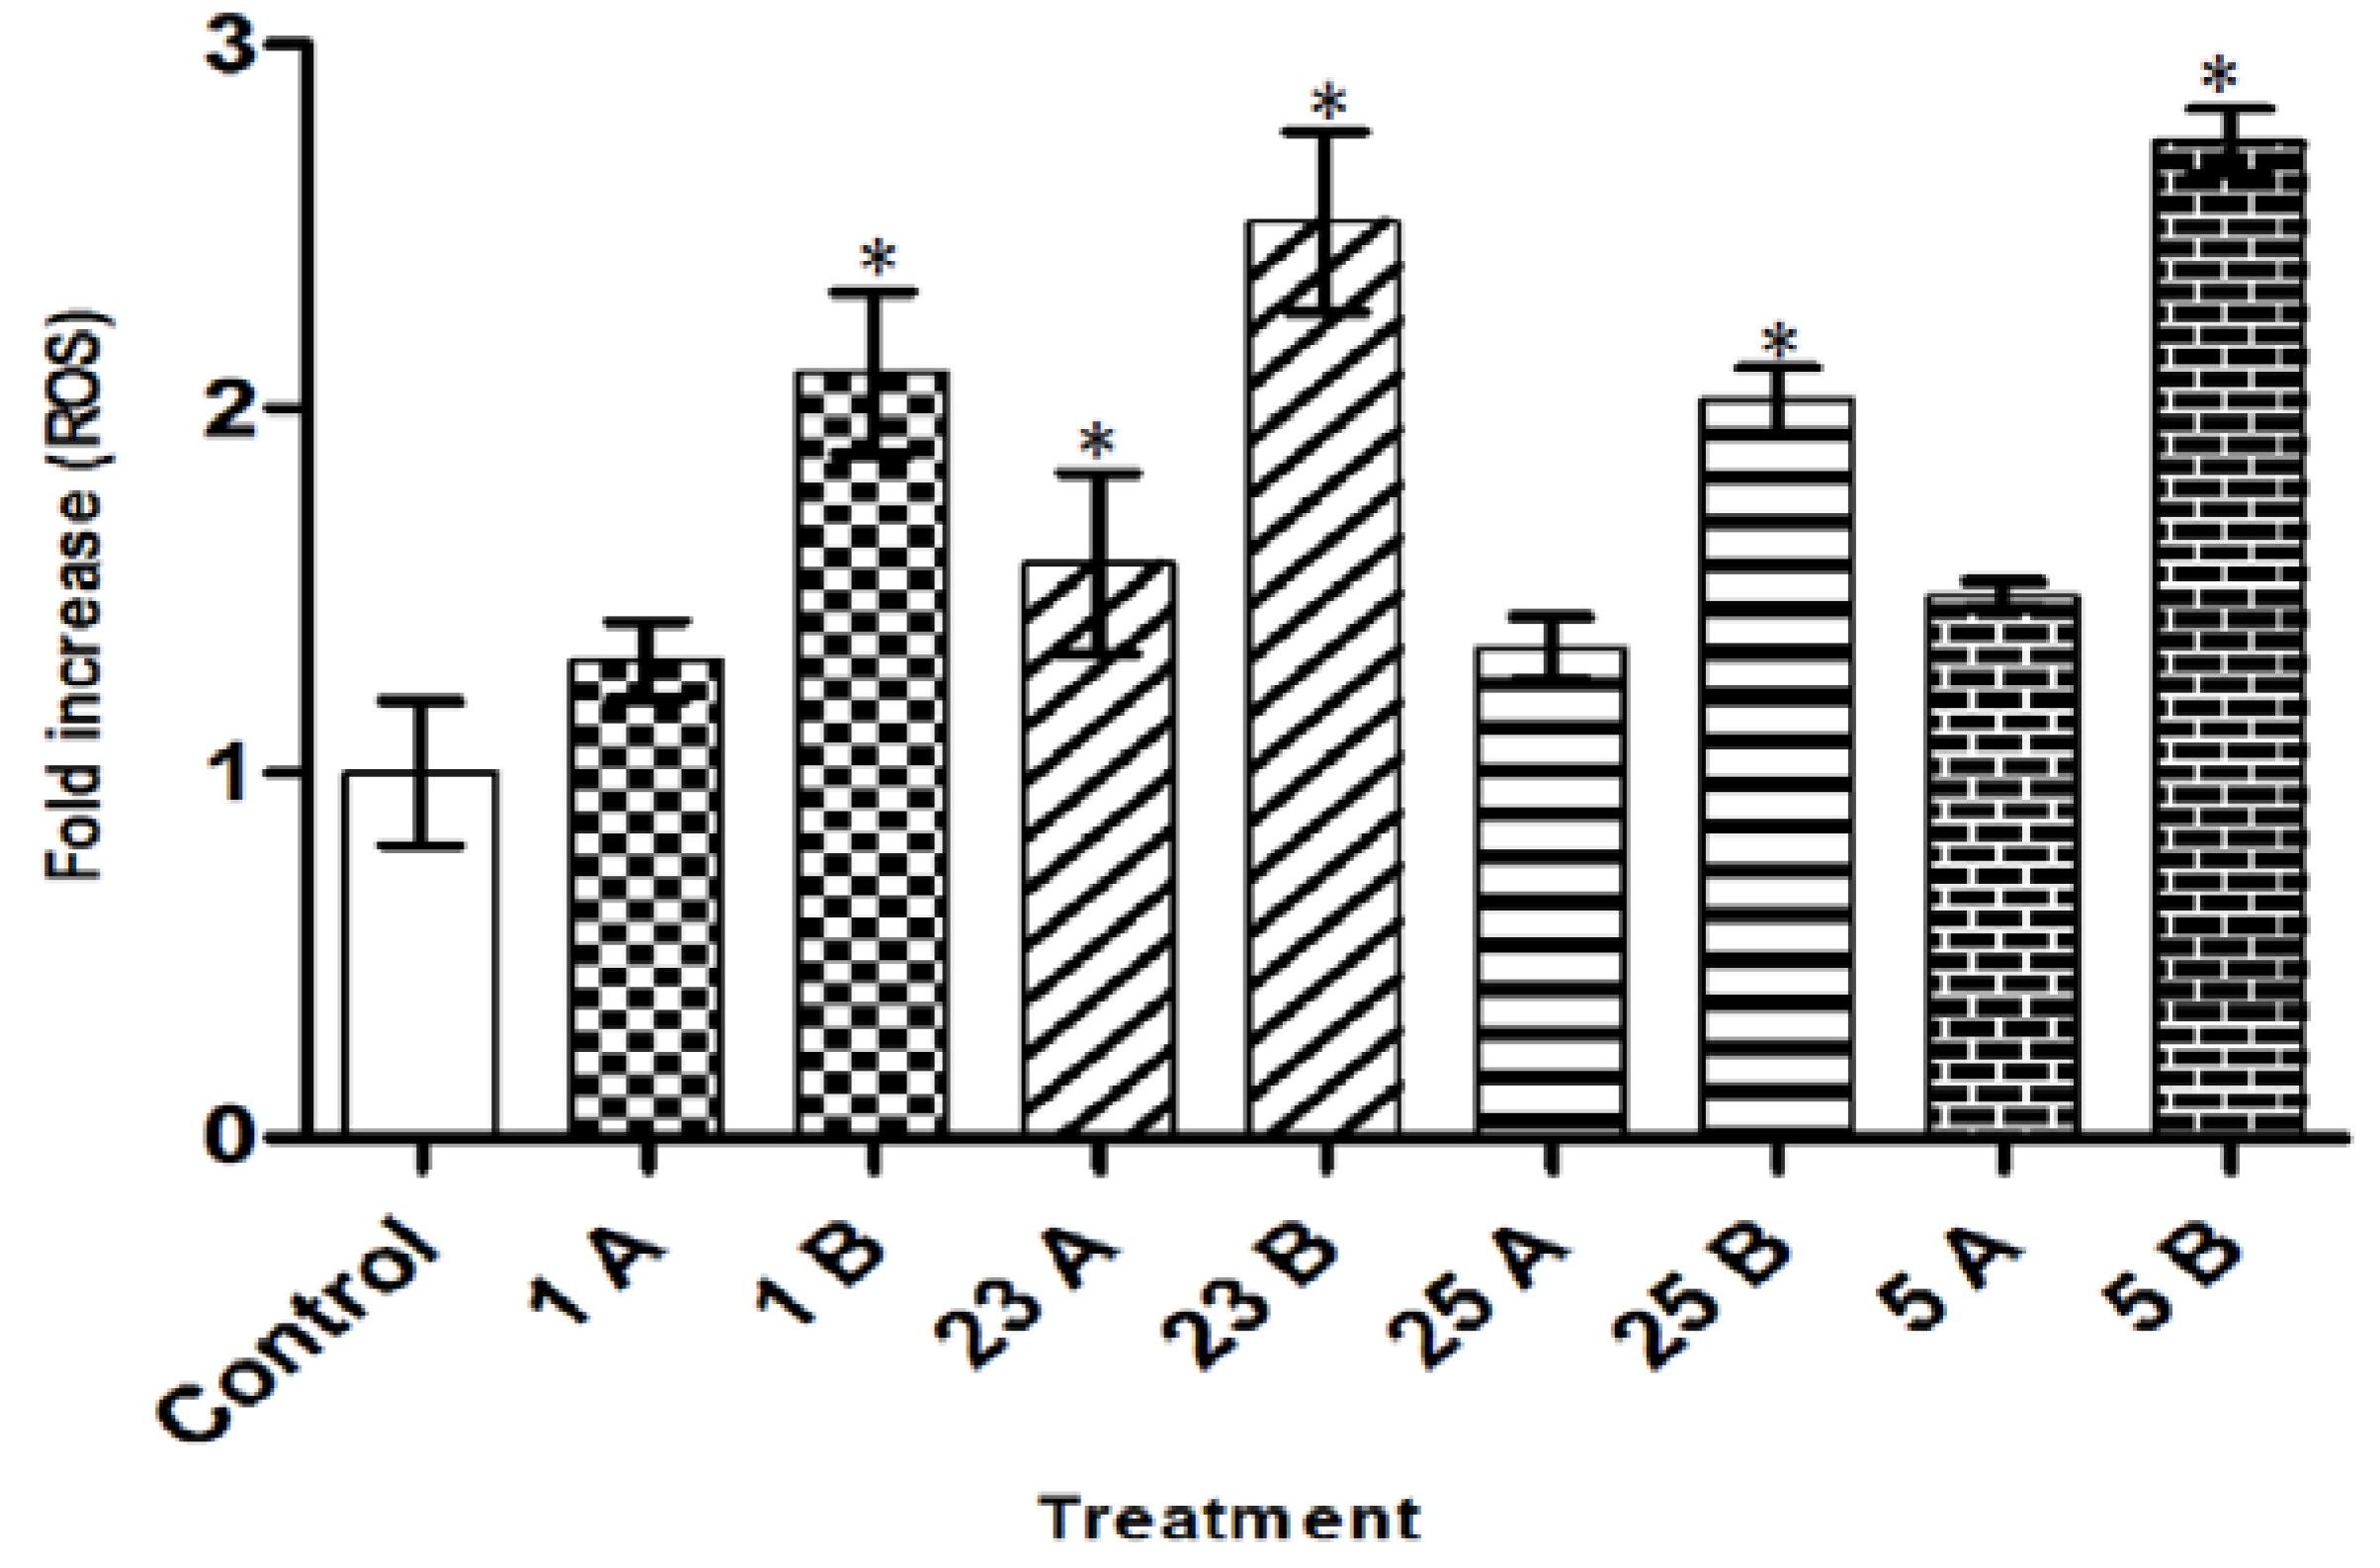
2.5. Intracellular ROS Level

There was loss of mitochondrial membrane potential (mitochondrial damage) in MCF-7 cells upon treatment with the selected compounds. This could probably be due to the reactive oxygen species (ROS) produced within the mitochondria, which primarily affect the mitochondria itself [34]. The intracellular ROS level was therefore studied with DCFDA and the resulting data showed that all the compounds used in this study significantly increased the production of ROS in MCF-7 cells compared to untreated cells. (Figure 5). All the compounds showed more than 1.3-fold increase (p < 0.05) at low concentration and more than 2.0-fold increase (p < 0.05) at high concentration as compared to control. Amongst the compounds used, compound 5 showed the highest ROS level (2.7-fold higher) (p < 0.05) at the highest concentration used (6 µg/mL). It is thus concluded that ROS production is involved in induction of apoptosis by chalcones, which is consistent with previous findings [35,36,37]. ROS-dependent apoptosis induction by chalcones was observed previously in similar studies where flavokawain B, a novel chalcone, increased the intracellular ROS levels in colon cancer HCT116 cells [35] and oral carcinoma HSC-3 cells [36].
Figure 5. Fold increase of reactive oxygen species (ROS) in MCF-7 cells after treatment with compounds 1, 23, 25, and 5 compared to control (untreated MCF-7 cells). (1A- 3 µg/mL; 1B- 6 µg/mL), (23A- 3 µg/mL; 23B- 6 µg/mL), (25A- 2 µg/mL; 25B- 4 µg/mL) and (5A- 3 µg/mL; 5B- 6 µg/mL). Triplicates of each treatment group were used in each independent experiment. The statistical significance is expressed as * p < 0.05.
Molecules 17 06179 g005

3. Experimental

3.1. Synthesis of Chalcones

Procedure A (compounds 1, 3, 4, 5, 7–9, 11–13, 15–17, 19–20): Substituted acetophenone (0.01 mol) and substituted aldehyde (0.01 mol) were mixed in ethanol (40 mL) in a round bottom flask placed in an ice bath. To this NaOH solution (10 mL, 60%) were added dropwise with continuous stirring for 30 min. The mixing was continued for another 2–3 h at room temperature. The mixture was kept in a refrigerator for overnight when it became quite thick. Then it was diluted with ice-cold distilled water (40 mL), filtered, washed well with cold water, dried in air and recrystallized from rectified methanol.
Procedure B (compounds 2, 6, 10, 14, 18, 21, 23–24): Substituted acetophenone (0.01 mol) and substituted aldehyde (0.01 mol) were mixed in ethanol (40 mL) in a round bottom flask placed in an ice bath. To this NaOH solution (10 mL, 60%) were added dropwise with continuous stirring for 30 minutes. The mixing was continued for another 2–3 h at room temperature. Turbidity appeared in the mixture, which was then diluted with cold distilled water (40 mL), and neutralized to litmus paper with 2 N HCL. The product (ppt) was filtered, washed well with cold water, dried in air and recrystallized from rectified methanol.
Procedure, C (compound 22): Substituted acetophenone (0.01 mol) and substituted aldehyde (0.01 mol) were mixed in ethanol (40 mL) in a round bottom flask placed in an ice bath. To this NaOH solution (10 mL, 60%) were added dropwise with continuous stirring for 30 min. The mixture was refluxed overnight. The stirring of the mixture was continued for 2 days at room temperature (turbidity appears in the mixture), then the mixture was diluted with cold distilled water (40 mL), and neutralized to litmus paper with 2 N HCL. The product (ppt) was filtered, washed well with cold water, dried in air and recrystallized from rectified methanol.

3.2. Identification of Chalcones

The IR spectra were obtained using a Shimadzu IR-FTIR-8300 spectrophotometer in a disk of potassium bromide, over the range of 4,000–400 cm−1. The 1H-NMR spectra were recorded on a Varian Mercury-VX-200 (300 MHz) spectrophotometer using DMSO-d6 as solvent and TMS as the internal standard. The melting temperatures were determined in sealed capillaries on a SMP3 melting point apparatus (Stuart Scientific, UK).

3.3. Cell Culture and Cell Viability Assay

A549, PC3, MCF-7, HT-29, WRL68 and MCF-7 cells were obtained from the ATTC (Rockville, MD, USA) and grown in RPMI-1640 medium, 10% fetal bovine serum (FBS) and 1% pen-strep, in humidified conditions at 5% CO2 and 37 °C. The different cell lines mentioned above were used to determine the inhibitory effects of compounds on cell growth using the MTT assay. This colorimetric assay is based on the conversion of the yellow tetrazolium bromide (MTT) to a purple formazan derivative by mitochondrial succinate dehydrogenase in viable cells. Cells were seeded in 96-well plate and incubated for 24 h at 37 °C with 5% CO2 saturation. After incubation, the cells were treated with different concentration of compounds and incubated for another 24 h. After 24 h of drug treatment, 20 µL of MTT solution at 5 mg/mL was added and incubated for 4 h. Dimethyl sulfoxide (DMSO) in volume of 100 µL is added into each well to dissolve the purple formazan formed. The colorimetric assay is measured and recorded at absorbance of 570 nm.

3.4. Cell Treatment

Due to the observation of significant cytotoxicity of selected compounds towards MCF-7 cells, the following analyses were done on them only. Cells were treated with compound 1 (1A- 3 µg/mL; 1B- 6 µg/mL), 23 (23A- 3 µg/mL; 23B- 6 µg/mL), 25 (25A- 2 µg/mL; 25B- 4 µg/mL) and 5 (5A- 3 µg/mL; 5B- 6 µg/mL).

3.5. Multiparametric High Content Screening (HCS) Assays

The toxic effects of Cpd 1, 5, 23 and 25 at different doses on MCF-7 cells were assayed using the high content screening (HCS) KineticScan Reader (Cellomics Inc, Pittsburgh, PA, USA) with the Multiparameter Cytotoxicity Kit 3. The kit contains four fluorescent dyes, i.e., blue fluorescent Hoechst 33342, membrane permeability, mitochondrial membrane potential, and cytochrome c dyes. They respectively detect changes in nuclear morphology (nuclear condensation), membrane permeability, mitochondrial membrane potential and expression of cytochrome c. The multiparametric apoptosis kit quantifies three fundamental parameters related to the process of apoptosis, i.e., nuclear condensation detected by the blue fluorescent nuclear dye, Hoechst 33342, cell permeability detected by permeability dye, mitochondrial damage detected by mitochondrial membrane potential dye and cytochrome c release by DyLight 649 Conjugates. Following treatment with different concentrations of compounds 1, 23, 25 and 5 as mentioned before, the fixation and staining for imaging analysis of the MCF-7 cells were performed according to the manufacturer’s instructions. Cells treated with tamoxifen (0.04 µg/mL) were used as positive control and untreated cells were used as negative control. Plates were analyzed using a Thermo Scientific ArrayScanHVTI HCS Reader (Cellomics Inc, Pittsburgh, PA, USA). This is a computerized automated fluorescence imaging microscope that automatically identifies stained cells and measures the intensity and distribution of fluorescence in individual cells. Images for each fluoroprobe were acquired at different channels using suitable filters with 20x objective at fixed exposure time. The Cell Health Profiling BioApplication software was used for image acquisitions and analysis. For each well, at least 25 fields, corresponding to at least 500 cells were automatically acquired and analyzed. All experiments were performed in triplicates. Cell average intensity (Mean) under the modified object mask within selected range in each channel was used as assay indicator, and reported as average fluorescence intensity.

3.6. Caspase Activity

Activity of cellular caspases was measured using the Caspase-Glo-9, Caspase-Glo-3/7 and Caspase-Glo-8 assay reagents (Promega), according to the manufacturer's instructions. The assays provide a luminogenic caspase-3/caspase-7 or caspase-8 or caspase-9 substrate, respectively, in a buffer system optimized for caspase activity measurement in cell lysates. The luciferase signal generated is proportional to the amount of caspase activity present. MCF-7 cells have no caspase-3 activity due to functional deletion of the CASP-3 gene [38]. Therefore, the activity measured in this test is that of caspase-7. Briefly, cells were plated in opaque 96-well plates in triplicate and treated with the. After 24 h treatment with compounds 1, 23, 25 and 5 as mentioned before, the assay reagents were added to the plates at room temperature and incubated for 60 min, and the luminescence was measured using a plate reader. All assays were done in triplicate, and means ± SD were calculated for each condition.

3.7. Intracellular ROS Level

The production of ROS was estimated by fluorescence using the redox-sensitive fluorescent probe DCFDA (Sigma). The oxidation of DCFDA by ROS converts the molecule to 2′,7′-dichlorodihydrofluorescein (DCF), which is highly fluorescent. Thus, ROS production by stimulated cells causes an increase in the fluorescence signal over time. ROS assays were performed as previously described (13). Briefly, the MCF-7 cells were seeded in 96-well plates (5 × 10⁴ cells/well) and allowed to attach for 24 h. After 24 h treatment with compounds 1, 23, 25 and 5 as mentioned before, the cells were washed three times with PBS and incubated for 60 min with five DCFDA at room temperature. Again the wells were washed with PBS. Fresh PBS was added (100 μL/well) and DCF fluorescence was detected using a Tecan Infinite M200 fluorescence microplate reader at excitation and emission wavelengths of 485 and 528 nm, respectively. The fluorescence intensity unit of treatments was compared with control.

3.8. Statistical Analysis

All assays were conducted in at least three separate experiments. Results are expressed as the mean value ± standard deviation (SD). Statistical analysis was performed with one-way analysis of variance (ANOVA) using GraphPad Prism software (version 4.0; GraphPad Software Inc., San Diego, CA, USA).

4. Conclusions

In summary, we have synthesized some chalcones and identified them from their spectral data. We have nhat most of the compounds were very active cytotoxic agents towards several cancer cell lines. Four active compounds chosen in the study showed apoptosis induction in MCF-7 cells with the involvement of caspase-7, caspase-8, and caspase-9. We also demonstrated that all four compounds used in the study induced ROS generation and loss of mitochondrial membrane potential to cause the release of cytochrome c to result in apoptosis. The apoptosis was through both intrinsic and extrinsic pathways.

Acknowledgments

The authors thank University of Malaya (Kuala Lumpur, Malaysia) for its financial support through the UMRG grant (RG043/11BIO).
  • Sample Availability: Samples of the compounds are available from the authors.

References

  1. Jemal, A.; Bray, F.; Center, M.M.; Ferlay, J.; Ward, E.; Forman, D. Global cancer statistics. CA Cancer J. Clin. 2011, 61, 69–90. [Google Scholar] [CrossRef]
  2. Hiss, D.C.; Gabriels, G.A. Implications of endoplasmic reticulum stress, the unfolded protein response and apoptosis for molecular cancer therapy. Part I: targeting p53, Mdm2, GADD153/CHOP, GRP78/BiP and heat shock proteins. Expert Opin. Drug Discov. 2009, 4, 799–821. [Google Scholar] [CrossRef]
  3. Johnstone, R.W.; Ruefli, A.A.; Lowe, S.W. Apoptosis-A Link between Cancer Genetics and Chemotherapy. Cell 2002, 108, 153–164. [Google Scholar] [CrossRef]
  4. Gordaliza, M. Natural products as leads to anticancer drugs. Clin. Trans. Oncol. 2007, 9, 767–776. [Google Scholar] [CrossRef]
  5. Wang, W.; Rayburn, E.R.; Velu, S.E.; Nadkarni, D.H.; Murugesan, S.; Zhang, R. In vitro and in vivo anticancer activity of novel synthetic makaluvamine analogues. Clin. Cancer Res. 2009, 15, 3511–3518. [Google Scholar] [CrossRef]
  6. Nagy, A.; Schally, A.V.; Armatis, P.; Szepeshazi, K.; Halmos, G.; Kovacs, M.; Zarandi, M.; Groot, K.; Miyazaki, M.; Jungwirth, A. Cytotoxic analogs of luteinizing hormone-releasing hormone containing doxorubicin or 2-pyrrolinodoxorubicin, a derivative 500–1000 times more potent. Proc. Natl. Acad. Sci. USA 1996, 93, 7269–7273. [Google Scholar]
  7. Sirion, U.; Kasemsook, S.; Suksen, K.; Piyachaturawat, P.; Suksamrarn, A.; Saeeng, R. New substituted C-19-andrographolide analogues with potent cytotoxic activities. Bioorg. Med. Chem. Lett. 2011, 22, 49–52. [Google Scholar]
  8. Lin, C.M.; Jiang, Y.Q.; Chaudhary, A.G.; Rimoldi, J.M.; Kingston, D.G.I.; Hamel, E. A convenient tubulin-based quantitative assay for paclitaxel (Taxol) derivatives more effective in inducing assembly than the parent compound. Cancer Chemother. Pharmacol. 1996, 38, 136–140. [Google Scholar] [CrossRef]
  9. Anand, P.; Kunnumakkara, A.B.; Newman, R.A.; Aggarwal, B.B. Bioavailability of curcumin: problems and promises. Mol. Pharm. 2007, 4, 807–818. [Google Scholar] [CrossRef]
  10. Nowakowska, Z. A review of anti-infective and anti-inflammatory chalcones. Eur. J. Med. Chem. 2007, 42, 125–137. [Google Scholar] [CrossRef]
  11. Go, M.L.; Wu, X.; Liu, X.L. Chalcones: An update on cytotoxic and chemoprotective properties. Curr. Med. Chem. 2005, 12, 483–499. [Google Scholar]
  12. Kumar, D.; Kumar, N.M.; Akamatsu, K.; Kusaka, E.; Harada, H.; Ito, T. Synthesis and biological evaluation of indolyl chalcones as antitumor agents. Bioorg. Med. Chem. Lett. 2011, 20, 3916–3919. [Google Scholar]
  13. Sivakumar, P.M.; Ganesan, S.; Veluchamy, P.; Doble, M. Novel chalcones and 1, 3, 5-triphenyl-2-pyrazoline derivatives as antibacterial agents. Chem. Biol. Drug. Des. 2010, 76, 407–411. [Google Scholar] [CrossRef]
  14. Sakai, T.; Eskander, R.N.; Guo, Y.; Kim, K.J.; Mefford, J.; Hopkins, J.; Bhatia, N.N.; Zi, X.; Hoang, B.H. Flavokawain B, a kava chalcone, induces apoptosis in synovial sarcoma cell lines. J. Orthop. Res. 2011, 30, 1045–1050. [Google Scholar]
  15. Nishimura, R.; Tabata, K.; Arakawa, M.; Ito, Y.; Kimura, Y.; Akihisa, T.; Nagai, H.; Sakuma, A.; Kohno, H.; Suzuki, T. Isobavachalcone, a chalcone constituent of Angelica keiskei, induces apoptosis in neuroblastoma. Biol. Pharm. Bull. 2007, 30, 1878–1883. [Google Scholar] [CrossRef]
  16. Hijova, E. Bioavailability of chalcones. Bratisl Lek Listy 2006, 107, 80–84. [Google Scholar]
  17. Zhang, H.J.; Qian, Y.; Zhu, D.D.; Yang, X.G.; Zhu, H.L. Synthesis, molecular modeling and biological evaluation of chalcone thiosemicarbazide derivatives as novel anticancer agents. Eur. J. Med. Chem. 2011, 46, 4702–4708. [Google Scholar] [CrossRef]
  18. Szliszka, E.; Czuba, Z.P.; Mazur, B.; Sedek, L.; Paradysz, A.; Krol, W. Chalcones enhance TRAIL-induced apoptosis in prostate cancer cells. Int. J. Mol. Sci. 2009, 11, 1–13. [Google Scholar] [CrossRef]
  19. Bandgar, B.P.; Gawande, S.S.; Bodade, R.G.; Totre, J.V.; Khobragade, C.N. Synthesis and biological evaluation of simple methoxylated chalcones as anticancer, anti-inflammatory and antioxidant agents. Bioorgan. Med. Chem. 2010, 18, 1364–1370. [Google Scholar]
  20. Bhat, B.A.; Dhar, K.L.; Puri, S.C.; Saxena, A.K.; Shanmugavel, M.; Qazi, G.N. Synthesis and biological evaluation of chalcones and their derived pyrazoles as potential cytotoxic agents. Bioorgan. Med. Chem. Lett. 2005, 15, 3177–3180. [Google Scholar] [CrossRef]
  21. Hotchkiss, R.S.; Strasser, A.; McDunn, J.E.; Swanson, P.E. Cell death. N. Engl. J. Med. 2009, 361, 1570–1583. [Google Scholar] [CrossRef]
  22. Ahmad, A.; Wang, Z.; Ali, R.; Kong, D.; Banerjee, S.; Padhye, S.; Sarkar, F.H. Apoptosis-inducing effect of garcinol is mediated by NF-κB signaling in breast cancer cells. J. Cell. Biochem. 2010, 109, 1134–1141. [Google Scholar]
  23. Syam, S.; Abdul, A.B.; Sukari, M.A.; Mohan, S.; Abdelwahab, S.I.; Wah, T.S. The Growth Suppressing Effects of Girinimbine on Hepg2 Involve Induction of Apoptosis and Cell Cycle Arrest. Molecules 2011, 16, 7155–7170. [Google Scholar] [CrossRef]
  24. Ye, N.; Qin, J.; Shi, W.; Liu, X.; Lin, B. Cell-based high content screening using an integrated microfluidic device. Lab Chip 2007, 7, 1696–1704. [Google Scholar] [CrossRef]
  25. Mantena, S.K.; Sharma, S.D.; Katiyar, S.K. Berberine inhibits growth, induces G1 arrest and apoptosis in human epidermoid carcinoma A431 cells by regulating Cdki–Cdk-cyclin cascade, disruption of mitochondrial membrane potential and cleavage of caspase 3 and PAR. Carcinogenesis 2006, 27, 2018–2027. [Google Scholar] [CrossRef]
  26. Luo, X.; Budihardjo, I.; Zou, H.; Slaughter, C.; Wang, X. Bid, a Bcl2 interacting protein, mediates cytochrome c release from mitochondria in response to activation of cell surface death receptors. Cell 1998, 94, 481–490. [Google Scholar] [CrossRef]
  27. Hsu, Y.L.; Kuo, P.L.; Tzeng, W.S.; Lin, C.C. Chalcone inhibits the proliferation of human breast cancer cell by blocking cell cycle progression and inducing apoptosis. Food Chem. Toxicol. 2006, 44, 704–713. [Google Scholar] [CrossRef]
  28. He, Y.Y.; Huang, J.L.; Chignell, C.F. Cleavage of epidermal growth factor receptor by caspase during apoptosis is independent of its internalization. Oncogene 2005, 25, 1521–1531. [Google Scholar]
  29. Carter, B.Z.; Gronda, M.; Wang, Z.; Welsh, K.; Pinilla, C.; Andreeff, M.; Schober, W.D.; Nefzi, A.; Pond, G.R.; Mawji, I.A. Small-molecule XIAP inhibitors derepress downstream effector caspases and induce apoptosis of acute myeloid leukemia cells. Blood 2005, 105, 4043–4050. [Google Scholar] [CrossRef]
  30. Riedl, S.J.; Shi, Y. Molecular mechanisms of caspase regulation during apoptosis. Nat. Rev. Mol. Cell Biol. 2004, 5, 897–907. [Google Scholar] [CrossRef]
  31. Chen, T.; Wong, Y.S. Selenocystine induces caspase-independent apoptosis in MCF-7 human breast carcinoma cells with involvement of p53 phosphorylation and reactive oxygen species generation. Int. J. Biochem. Cell Biol. 2009, 41, 666–676. [Google Scholar] [CrossRef]
  32. Jänicke, R.U. MCF-7 breast carcinoma cells do not express caspase-3. Breast Cancer Res. Treat. 2009, 117, 219–221. [Google Scholar] [CrossRef]
  33. Deeb, D.; Gao, X.; Jiang, H.; Arbab, A.S.; Dulchavsky, S.A.; Gautam, S.C. Growth inhibitory and apoptosis-inducing effects of xanthohumol, a prenylated chalone present in hops, in human prostate cancer cells. Anticancer Res. 2010, 30, 3333–3339. [Google Scholar]
  34. Ott, M.; Gogvadze, V.; Orrenius, S.; Zhivotovsky, B. Mitochondria, oxidative stress and cell death. Apoptosis 2007, 12, 913–922. [Google Scholar] [CrossRef]
  35. Kuo, Y.F.; Su, Y.Z.; Tseng, Y.H.; Wang, S.Y.; Wang, H.M.; Chueh, P.J. Flavokawain B, a novel chalcone from from Alpinia pricei Hayata with potent apoptotic activity: Involvement of ROS and GADD153 upstream of mitochondria-dependent apoptosis in HCT116 cells. Free Radic. Biol. Med. 2010, 49, 214–226. [Google Scholar]
  36. Hseu, Y.C.; Lee, M.S.; Wu, C.R.; Cho, H.J.; Lin, K.Y.; Lai, G.H.; Wang, S.Y.; Kuo, Y.H.; Senthil Kumar, K.J.; Yang, H.L. The chalcone flavokawain B induces G2/M cell-cycle arrest and apoptosis in human oral carcinoma HSC-3 cells through the intracellular ros generation and down-regulation of the Akt/p38 MAPK signaling pathway. J. Agric. Food Chem. 2012, 60, 2385–2397. [Google Scholar] [CrossRef]
  37. Kim, T.H.; Seo, W.D.; Ryu, H.W.; Seo, H.R.; Jin, Y.B.; Lee, M.; Ji, Y.H.; Park, K.H.; Lee, Y.S. Anti-tumor effects by a synthetic chalcone compound is mediated by c-Myc-mediated reactive oxygen species production. Chem.-Biol. Interact. 2010, 188, 111–118. [Google Scholar] [CrossRef]
  38. Janicke, R.U.; Ng, P.; Sprengart, M.L.; Porter, A.G. Caspase-3 is required for α-fodrin cleavage but dispensable for cleavage of other death substrates in apoptosis. J. Biol. Chem. 1998, 273, 15540–15545. [Google Scholar]

