
Optimisation of Protein Extraction from Medicinal Cannabis Mature Buds for Bottom-Up Proteomics


Agriculture Victoria Research, AgriBio, Centre for AgriBioscience, Bundoora, Victoria 3083, Australia
*
Author to whom correspondence should be addressed.
Molecules 2019, 24(4), 659; https://doi.org/10.3390/molecules24040659
Submission received: 25 January 2019
/
Revised: 11 February 2019
/
Accepted: 11 February 2019
/
Published: 13 February 2019
(This article belongs to the Special Issue Biological Sample Analysis by Liquid Chromatography)
Abstract
:Medicinal cannabis is used to relieve the symptoms of certain medical conditions, such as epilepsy. Cannabis is a controlled substance and until recently was illegal in many jurisdictions. Consequently, the study of this plant has been restricted. Proteomics studies on Cannabis sativa reported so far have been primarily based on plant organs and tissues other than buds, such as roots, hypocotyl, leaves, hempseeds and flour. As far as we know, no optimisation of protein extraction from cannabis reproductive tissues has been attempted. Therefore, we set out to assess different protein extraction methods followed by mass spectrometry-based proteomics to recover, separate and identify the proteins of the reproductive organs of medicinal cannabis, apical buds and isolated trichomes. Database search following shotgun proteomics was limited to protein sequences from C. sativa and closely related species available from UniprotKB. Our results demonstrate that a buffer containing the chaotrope reagent guanidine hydrochloride recovers many more proteins than a urea-based buffer. In combination with a precipitation with trichloroacetic acid, such buffer proved optimum to identify proteins using a trypsin digestion followed by nano-liquid chromatography tandem mass spectrometry (nLC-MS/MS) analyses. This is validated by focusing on enzymes involved in the phytocannabinoid pathway.
1. Introduction
Cannabis sativa plants have been cultivated and used as a food crop as well for textiles, ropes, paper and medicinal applications for millennia in Asia [1]. Its many uses have since spread worldwide, and it was incorporated to Western medicine in 1938, followed by a rapid adoption among the medicinal community [2]. By the end of the nineteen century, cannabis therapeutical applications had diminished due to the development of more efficient alternative therapies and analgesics, in particular opiates [2]. The beginning of the 20th century saw the surge of cannabis use as a recreational substance in Western countries, which led to the Cannabis Tax Act in 1937 and abolished its use in medicine in the U.S.A. [1]. In 1961, an international treaty called the Single Convention on Narcotic Drugs (http://www.unodc.org) was enacted to prohibit production and supply of specific drugs, including cannabis, with provision made to grant licences for medical treatment and research. Within the framework of this treaty, since 1967 the Australian Narcotic Drugs Act (www.odc.gov.au) has regulated the cultivation of cannabis for medicinal and related scientific purposes. In 1989, the Therapeutic Goods Act was established to ensure that therapeutic goods abide to Australian standards and are promptly accessible (www.tga.gov.au). The Narcotic Drugs Act was amended in 2016 (www.legislation.gov.au) and again very recently in 2018 with the Narcotic Drugs Amendment (Cannabis) Regulations (www.legislation.gov.au) to permit exports of medicinal cannabis products. In 2016, Victoria was the first Australian jurisdiction to legalise access to medicinal cannabis by enacting the Medicinal Cannabis Act 2016 (www2.health.vic.gov.au).
Phytocannabinoids are the best-known active components of C. sativa. The first cannabinoid, cannabidiolic acid (CBDA), was isolated in 1940 [3]. The most psychologically active cannabinoid delta9-tetrahydrocannabinolicacid (THCA) was identified in 1967 [4]. Since then, close to 500 compounds have been described [5], including 70 cannabinoids among which are cannabinolic acid (CBNA), cannabigerolic acid (CBGA) and cannabinodiolic acid (CBNDA). The biosynthetic pathway of phytocannabinoids from C. sativa was elucidated in 2007 [6]. The main enzymes are 3,5,7-trioxododecanoyl-CoA synthase (OLS, a polyketide synthase) and olivetolicacid cyclase (OAC) acting in succession to convert hexanoyl-CoA into olicetolic acid (OLA), geranylpyrophosphate:olivetolate geranyltransferase (GOT) which catalyses the alkylation of OLA with geranyldiphosphate leading to the formation of CBGA, THCA synthase (THCAS) converts CBGA to THCA, while CBDA synthase (CBDAS) forms CBDA and CBCA synthase (CBCAS) produces CBCA [7].
Due to legislative difficulties, scientific studies on cannabis are lagging behind compared to other economically valuable crops, particularly in the field of proteomics. In the few proteomics reports found, most dealt with nonreproductive organs from immature cannabis plants, such as roots [8] and hypocotyls [9], or processed seeds from hemp [10,11]. As far as we know, only Raharjo and colleages in 2004 published proteomics results on flowers and glands from cannabis plants [12], and ten years later, Happyana produced his PhD thesis on cannabis trichomes [13]. Sample preparation for protein extraction varied in these studies. Some reported a precipitation step in a trichloroacetic acid (TCA)/acetone solution followed by resuspension of the washed pellet in a urea-based buffer [9,12]. Other reports applied an initial powder homogenisation in a Tris-based buffer [10] or a sucrose solution [11] followed by TCA/water precipitation and resuspension in a Tris buffer [10] or a urea buffer [11]. Finally, a phase partition method including homogenisation in Tris-buffer phenol, followed by precipitation in ammonium acetate/methanol with resuspension of the rinsed pellet in a urea-based buffer has been used [8,13]. Protein extracts were then analysed by two-dimensional electrophoresis (2-DE) [8,9,11,12], one-dimensional polyacrylamide gel electrophoresis (1-D PAGE) [9,10], or two-dimensional (2-D) liquid chromatography (LC) followed by tandem mass spectrometry (MS/MS) [13]. None of these studies have used a buffer made of guanidine hydrochloride (also called guanidium chloride), a strong chaotrope reagent more stable than urea which may cause carbamylation of proteins when slightly heated [14]. Guanidine-HCl was proven effective for shotgun proteomics of whole yeast lysate [15], glycoproteins [16], as well as top-down proteomics of milk proteins [17,18,19].
As far we know no attempt was made at optimising the recovery of proteins from cannabis reproductive tissues. To this end, we designed a study where six protein extraction methods were devised and tested on apical bud tissues from medicinal cannabis plants using three biological replicates and two technical replicates. Two of these extraction methods were also tested on isolated trichomes. Protein extracts were further trypsin-digested into peptides for protein identification purpose. Our assessment was based on liquid chromatography–mass spectroscopy (LC-MS) profiles of intact proteins, nLC-MS/MS profiles of tryptic peptides, protein identification results and statistical analyses. We exemplify our observations on enzymes involved in the phytocannabinoid biosynthesis pathway. Optimisation of protein extraction is critical to achieve good coverage of the proteome and key in integrating proteomics with the other omics strategies including genomics and metabolomics. Together these techniques will better define gene function and allow for genomic selection or genome editing to produce cannabis strains with specific traits tailored for particular medical applications.
2. Results and Discussion
This experiment aims at optimising protein extraction from mature reproductive tissues of medicinal cannabis. A total of six protein extractions were tested with methods varying in their precipitation steps with the use of either acetone or ethanol as solvents, as well as changing in their final pellet resuspension step with the use of urea- or guanidine-HCl-based buffers (Figure 1).
The six methods were applied to liquid N2-ground apical buds. Trichomes were also isolated from apical buds. Because of the small amount of trichome recovered, only the single step extraction methods 1 and 2 were attempted. Extractions were performed in triplicates. Extraction efficiency was assessed both by intact protein proteomics and bottom-up proteomics each performed in duplicates. Rigorous method comparisons were then drawn by applying statistical analyses on protein and peptide abundances, linked with protein identification results.
2.1. Intact Protein Analysis
The intact proteins of the 18 apical bud extracts and the six trichome extracts were separated by ultraperformance liquid chromatography (UPLC) and analysed by electrospray ionisation-mass spectrometry (ESI-MS) in duplicates. LC-MS profiles are complex with many peaks along both retention time (RT) in min and m/z axes, particularly between 5 and 35 min and 500 and 1300 m/z (Supplementary Figure S1). Prominent proteins eluted late (25–35 min), probably due to high hydrophobicity, and within low m/z ranges (600–900 m/z), therefore bearing more positive charges. Outside this area, many proteins eluting between 5 and 25 min were resolved in samples processed using extraction methods 2, 4 and 6, irrespective of tissue types (apical buds or trichomes). Protein extracts from apical buds and trichomes overall generated 26,892 intact protein LC-MS peaks (ions), which were then clustered into 5,408 isotopic clusters, which were in turn grouped into 571 proteins of up to 11 charge states. The volumes of all the peaks comprised into a group were summed and the sum was used as a proxy for the amounts of the intact proteins. Statistical analyses were performed on the summed volumes of the 571 protein groups.
A Principal Component (PC) Analysis (PCA) was performed to verify whether the different extraction methods impacted protein LC-MS quantitative data. A plot of PC1 (60.7% variance) against PC2 (32.9% variance) clearly separates urea-based methods from guanidine-HCl-based methods (Figure 2).
Each of the six methods are well defined and do not cluster together. Extraction methods 3–6, which include an initial precipitation step, are further isolated.
Table 1 indicates the concentration of the protein extracts as well as the number of protein groups quantified in Genedata expressionist.
Extraction method 1 yields the greatest protein concentrations: 6.6 mg/mL in apical buds and 3.5 mg/mL in trichomes, followed by extraction methods 2, 4, 6, 3 and 5. Overall, 571 proteins were quantified and the extraction methods recovering most intact proteins in apical buds are methods 2 (335 ± 15), 4 (314 ± 16) and 6 (264 ± 18). In our experiment, method 1 yielding the highest protein concentrations does not equate larger numbers of proteins resolved by LC-MS. Perhaps C. sativa proteins recovered by method 1 are not compatible with our downstream analytical techniques (LC-MS). In trichomes, the method yielding the highest number of intact proteins is extraction method 2 (249 ± 45). Extraction methods 2, 4 and 6 all conclude by a resuspension step in a guanidine-HCl buffer, which consequently is the buffer we recommend for intact protein analysis.
As far as we know, this is the first time a gel-free intact protein analysis is presented. In the literature, intact protein analysis on C. sativa has thus far been achieved using 2-DE [8,11,12], which resolved 800, 300 and 1102 spots, respectively. The old-fashioned technique 2-DE separates intact proteins based first on their isoelectric point and second on their molecular weight (MW). Because it is time-consuming, labour-intensive and of low throughput, 2-DE has now been superseded by liquid-based techniques, such as LC-MS. In the present study we have chosen to separate intact proteins of medicinal cannabis based on their hydrophobicity using RP-LC and a C8 stationary phase online with a high-resolution mass analyser which separates ionised intact proteins based on their mass-to-charge ratio (m/z). In our hands, this strategy has proven successful to resolve complex mixtures of intact proteins from different types of samples, such as milk [17,18,19], wheat flour and Buffalo grass leaves.
2.2. Tryptic Peptides Analysis
The 25 tryptic digests of medicinal cannabis extracts and BSA sample were separated by nLC and analysed by ESI-MS/MS in duplicates. BSA was used as a control for the digestion with the mixture of endoproteases, trypsin and Lys-C, cleaving arginine (R) and lysine (K) residues. BSA was successfully identified with overall 88 peptides covering 75.1% of the total sequence (Supplementary Table S1), indicating that both protein digestions and nLC-MS/MS analyses were efficient.
Nano LC-MS/MS profiles are very complex (Supplementary Figure S2) with altogether 105,249 LC-MS peaks (peptide ions) clustered into 43,972 isotopic clusters, with up to 11,540 MS/MS events. If we consider apical bud patterns only, it is visually evident that guanidine-HCl-based extraction methods (2, 4 and 6) generate a lot more peaks than urea-based methods (1, 3 and 5) (Supplementary Figure S2). Indeed, extraction methods 2, 4 and 6 resolve 23,952 (CV 18%), 55,443 (CV 7%) and 59,084 (CV 11%) nLC-MS peaks, respectively, while extraction methods 1, 3 and 5 yield 8484 (CV 25%), 18,884 (CV 9%) and 2537 (CV 22%) nLC-MS peaks, respectively (Supplementary Table S2). Reduced CVs also indicate greater reproducibility of guanidine-HCl-based extraction methods. As far as trichomes are concerned, extraction methods 1 and 2 yield comparable patterns, albeit with less nLC-MS peaks than those of apical buds (Supplementary Table S2).
The volumes of all the peaks comprised into a cluster were summed and the sum was used as a proxy for the amounts of the tryptic peptides. PCA were performed on the summed volumes of the 43,972 peptide clusters. A biplot of PC 1 against PC 2 illustrates the separation of guanidine-HCl based-methods from urea-based methods along PC 1 (65.2% variance), and the distinction between acetone (method 4) and ethanol (method 6) precipitations along PC 2 (11.6% variance) (Figure 3).
Table 2 indicates the number of peptides identified with high score (Xcorr > 1.5) by SEQUEST algorithm and matching one of the 590 AA sequences we retrieved from C. sativa and closely related species for the database search.
Overall, 488 peptides were identified (Supplementary Table S3) and the extraction methods yielding the greatest number of database hits in apical buds were methods 4 (435 ± 9), 6 (429 ± 6) and 2 (356 ± 20). In trichomes, the method yielding the highest number of identified peptides was extraction method 2 (102 ± 23). Similar to our conclusions from intact protein analyses, we also recommend guanidine-HCl-based extraction methods (2, 4 and 6) for trypsin digestion followed by shotgun proteomics.
To further compare the extraction methods with each other, Venn diagrams were produced on the 488 identified peptides (Figure 4).
If we start with the trichomes and compare the simplest methods, extraction methods 1 and 2 which only involve a single resuspension step of the frozen ground plant powder into a protein-friendly buffer, we observe similar identification success 35.7% (174 out of 488 peptides) for T1 and 32.4% (158 peptides) for T2, with little overlap (16.0%; 78 peptides) between the two (Figure 4A). Therefore, both methods are complementary. If we compare trichomes and apical buds, an overlap of 27.7% (135 peptides) is observed with extraction method 1 (urea-based buffer) while 32.0% (156 peptides) of database hits are shared between both tissues when extraction method 2 (guanidine-HCl) is employed (Figure 4A). Whilst both outcomes are comparable, we would thus advice employing method 2 when handling cannabis trichomes. If we now turn our attention to just apical buds, we can see that half of the identified peptides are common between methods 1 and 2 (AB1-AB2, 246 peptides; 50.4%). Guanidine-HCl-based methods (AB2, AB4 and AB6) share a majority of hits (77.5%; 378 peptides), whereas urea-based methods (AB1, AB3 and AB5) only share 11.5% (56) of identified peptides (Figure 4B). This indicates that guanidine-HCl-based methods not only yield more identified peptides but also more consistently. Interestingly, the two most different methods (AB3 and AB6 employing different precipitant solvents and different resuspension buffers) share 80.9% (395) of the identified peptides (Figure 4B), suggesting that the initial precipitation step would make the subsequent resuspension step more homogenous, irrespective of the buffer used. All the 254 peptides identified from trichomes were also identified in apical buds (Figure 4C). Therefore, in our hands, protein extraction from trichome did not yield unique protein identification. This might be explained by the fact that due to limited sample recovery only two extraction methods were tested on trichomes. A more refined method on trichomes might help enrich in metabolism unique to C. sativa species.
2.3. Proteins Identified by Bottom-Up Proteomics
Table 3 lists the 160 protein accessions from the 488 peptides (Supplementary Table S3) identified from cannabis mature apical buds and trichomes in this study.
These 160 accessions correspond to 99 protein annotations (including 56 enzymes) and 15 pathways (Table 3). Most proteins (83.1%) matched a C. sativa accession, 5% of the accessions came from European hop and 11.8% of the accessions came from Boehmeria nivea, all of which annotated as small auxin upregulated (SAUR) proteins.
The frequency of identified proteins for each pathway is illustrated in a pie chart (Figure 5).
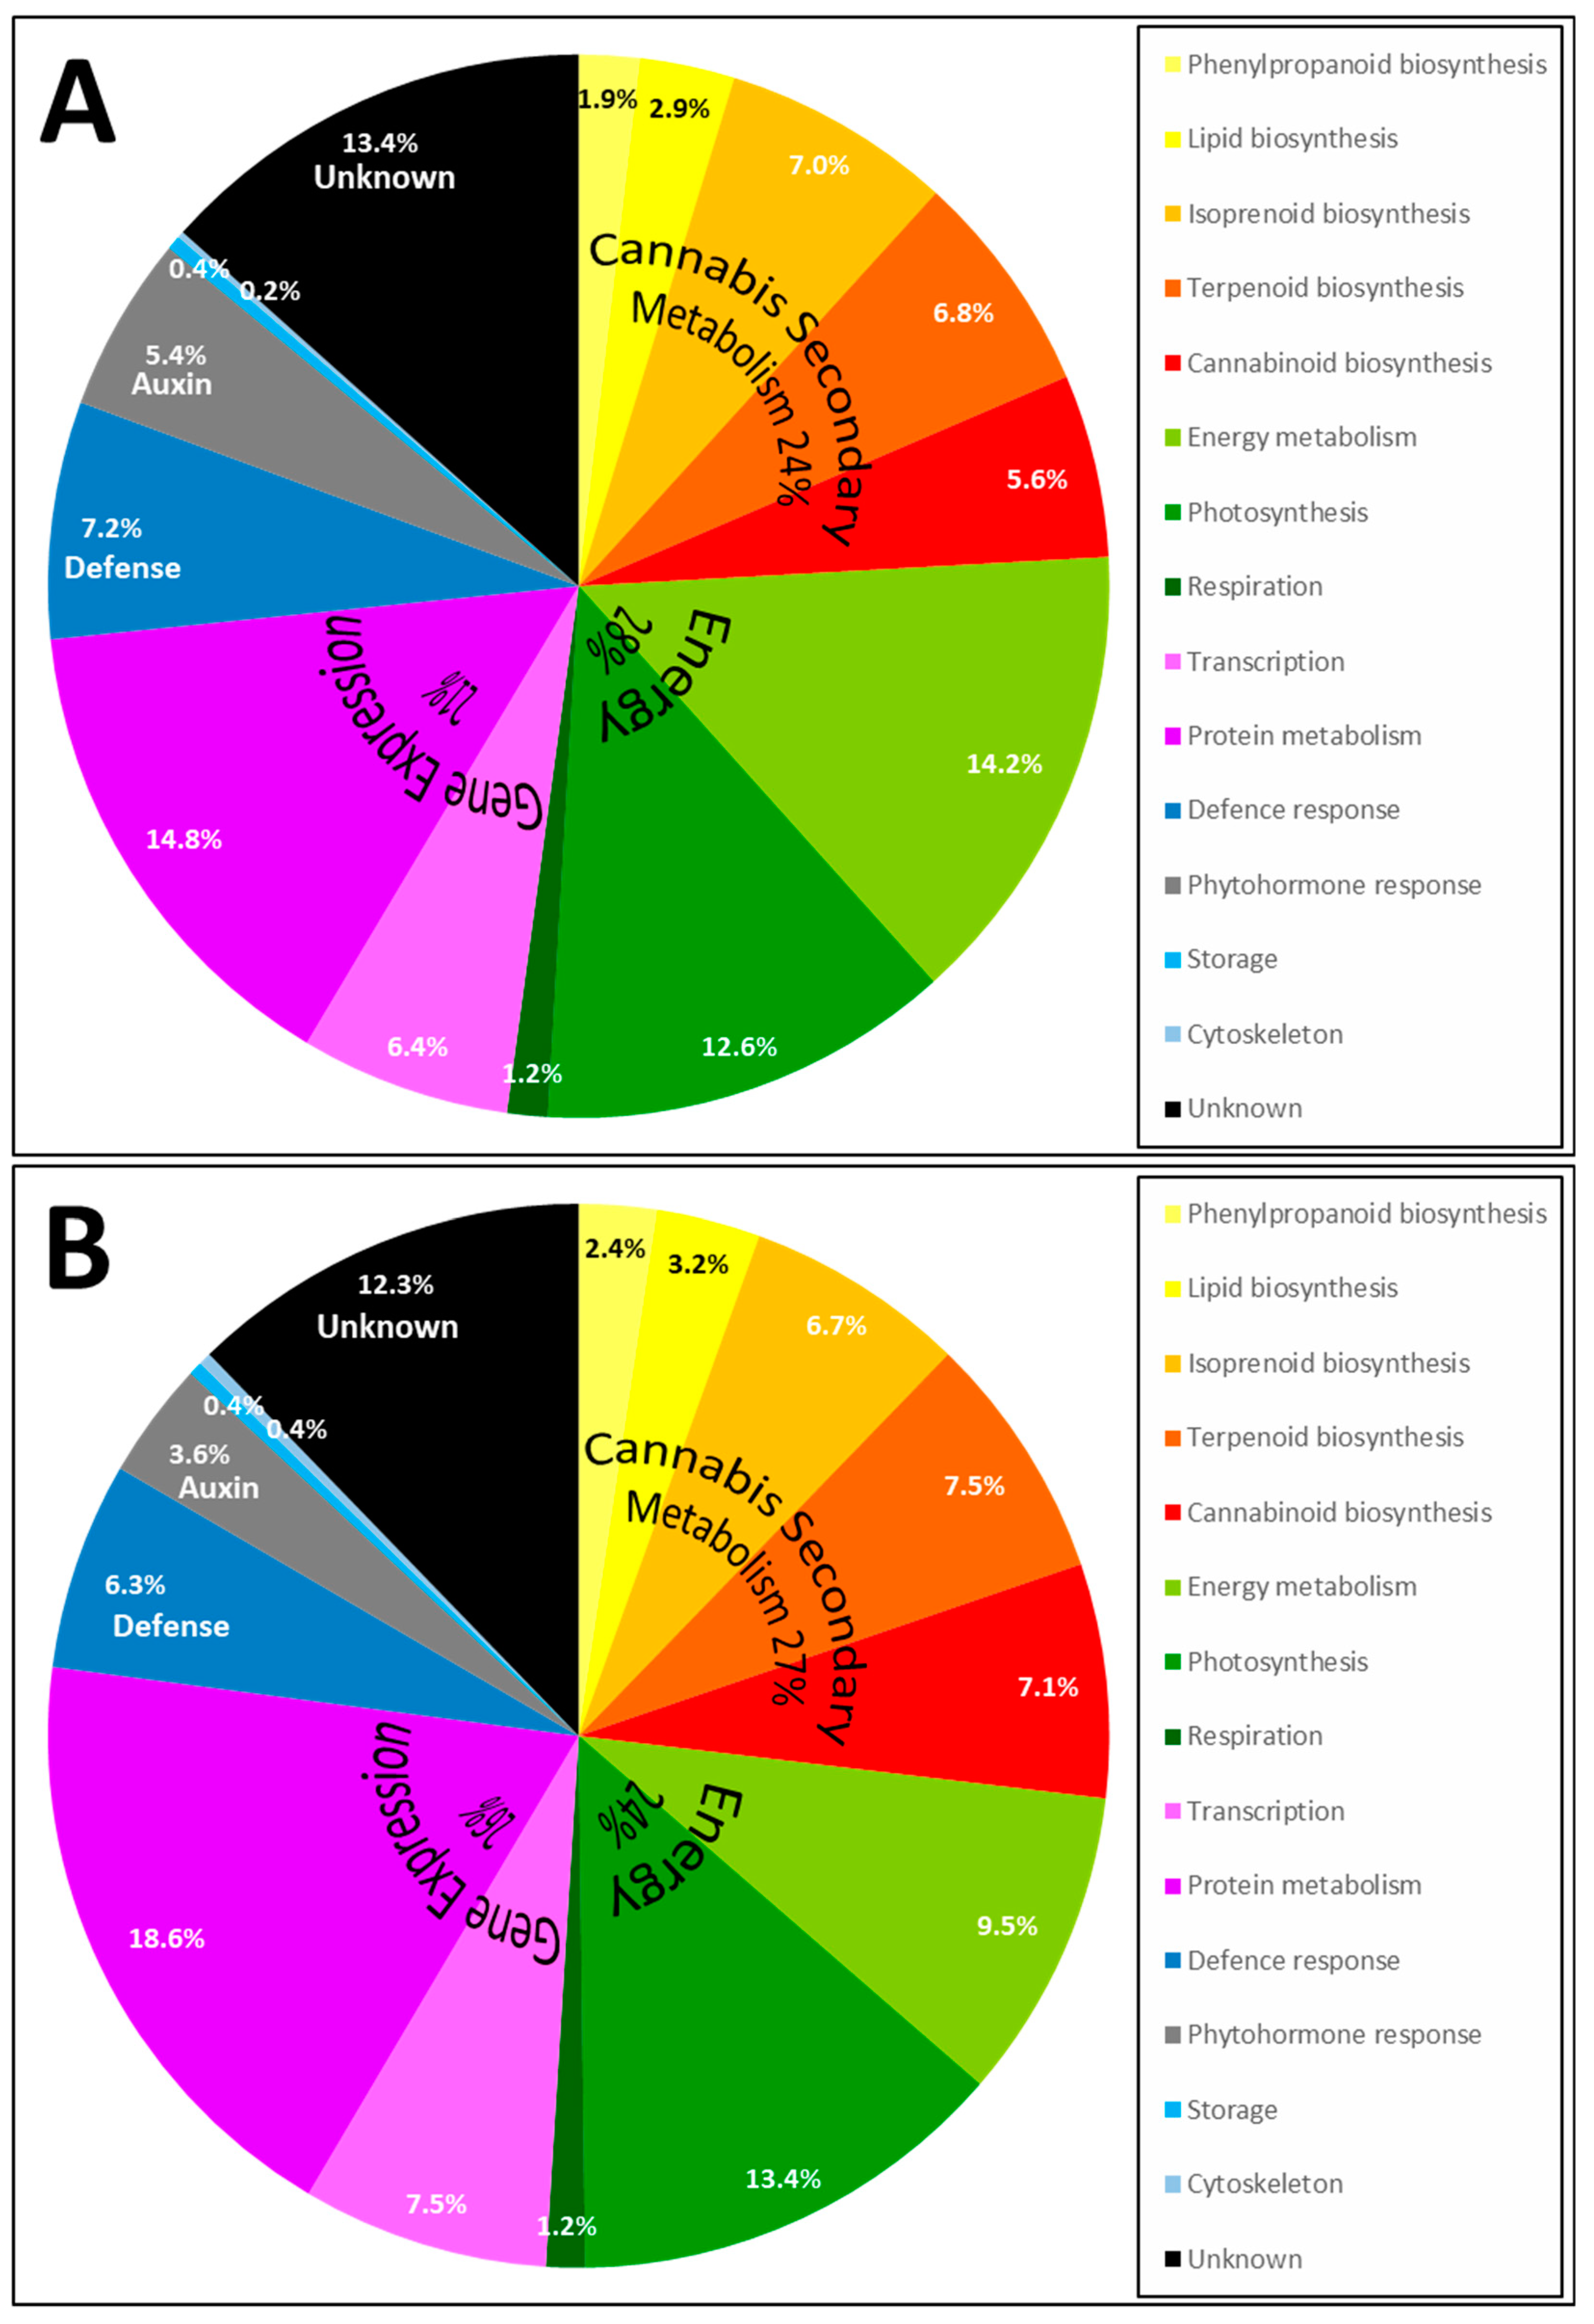
Most proteins belong to the cannabis secondary metabolism (24% in apical buds and 27% in trichomes), which encompasses the biosynthesis of phenylpropanoids, lipid, isoprenoids, terpenoids and cannabinoids [7]. Cannabinoid biosynthesis (5.6% in apical buds and 7.1% in trichomes) and terpenoid biosynthesis (6.8% in apical buds and 7.5% in trichomes) is a significant portion of this classification, with many terpene synthases (TPS, Table 3). A detailed analysis of terpene synthases and terpene metabolites in cannabis flowers was recently published [20]; nine cannabis terpene synthases (CsTPS) were discovered and their transcripts demonstrated to be upregulated in trichomes relative to nonresinous tissues. We have identified two major enzymes involved in monolignol biosynthesis: phenylalanine ammonia-lyase (PAL) and 4-coumarate:CoA ligase (4CL) (Table 3); with three accessions the phenylpropanoid pathway only contributes to 1.9% and 2.4% of the identification results, respectively in apical buds and trichomes (Figure 5). In a recent time course study on hemp hypocotyls, numerous enzymes involved in cellulose and lignin deposition were analysed using microscopic observations, lignin analysis, gel-based and shotgun proteomics, along with enzyme activity assays [9]; it would be of interest to repeat such an elaborate study on cannabis reproductive organs during the maturation process. The second most prominent category is energy metabolism (28% in apical buds and 24% in trichomes), comprising photosynthesis and respiration (Figure 5). The third major category is gene expression metabolism (22% in apical buds and 26% in trichomes) which includes transcriptional and translational mechanisms (Figure 5). A significant portion of protein accessions remain of unknown function (13.4% in apical buds and 12.3% in trichomes). To summarise, the pattern in the trichomes is very similar to that of apical buds albeit with an enrichment of cannabinoid biosynthetic proteins (7.1% in trichomes and 5.6% in apical buds) and terpenoid biosynthetic proteins (7.5% in trichomes and 6.8% in apical buds).
Most of the proteins identified in this study were also identified in a study on hempseeds published in 2016 [10], in which a labour-intensive strategy combined combinatorial peptide ligand libraries, SDS-PAGE separation, nLC-ESI-MS/MS identification, and database search including accessions from C. sativa and Arabidopsis thaliana. A total of 181 accessions were thereby identified, yet only 56 (31%) belonged to C. sativa, the rest matching A. thaliana accessions [10]. We have also searched all the viridiplantea accessions available from NCBI and consequently obtained many more hits (data not shown). Here, we only present identification results obtained with the Uniprot C. sativa list of sequences (590 AA sequences, including 440 sequences from C. sativa, 72 sequences from Chinese grass and 77 sequences from European hop) because our aim is to assess the efficiency of the six protein extraction methods by validating the occurrence of cannabis unique metabolisms, such as the phytocannabinoid pathway (presented in the next section).
In a different study on hempseeds [11], proteins were resolved by 2-DE followed by MS/MS analysis resulting in the identification of 168 proteins mostly from rice, but only one protein (Ubiquitin-like protein SMT3) from C. sativa. This reveals that plant database have improved since 2012 and incorporated more accessions from C. sativa. Proteomics studies on C. sativa published prior to that year [8,12] did not produce a hit against C. sativa sequences, as databases hosted only a few C. sativa sequences. We have retrieved all the entries referenced under the keyword “Cannabis sativa” in UniprotKB and produced a histogram of their distribution per year of creation. Most entries (81%) were created in 2015–2017, with only 10 created in 2018 (Supplementary Figure S3). This explains why only studies published after 2015 could report database hits against C. sativa entries. Whilst ever-increasing, the number of sequences from C. sativa publicly available in Uniprot is far from sufficient, and the proteomics community still must rely on information from unrelated plants species, such as Arabidopsis, and rice, to identify cannabis proteins. A draft genome and transcriptome of C. sativa was released in 2011 [21]. After a lull of several years the same research group just released on 8 November 2018 a physical and genetic map of C. sativa which reveals extensive rearrangements at the THCA/CBDA synthase loci [22]. On 31 October 2018, another research group reported that CBDAS and THCAS gene clusters were associated with transposable elements [23]. Also, in November 2018, the Open Cannabis Project (OCP, https://opencannabisproject.org) has made a dataset of approximately 850 strains of cannabis available in BigQuery as part of the 1000 Cannabis Genomes Project. This should help boost the number of C. sativa protein accessions in public protein databases in the very near future.
2.4. Enzymes Involved in Phytocannabinoid Pathway
To validate the extraction methods, we focused on the cannabis-specific pathway that attracts most of the interest in the medicinal cannabis industry, namely the biosynthesis of phytocannabinoids [24]. In our bottom-up results, five enzymes involved in phytocannabinoid biosynthesis and whose functions were described in the introduction were identified: 3,5,7-trioxododecanoyl-CoA synthase (OLS) identified with seven peptides (19% coverage), olivetolic acid cyclase (OAC) identified with six peptides (13% coverage), geranyl-pyrophosphate-olivetolic acid geranyltransferase (GOT) identified with five peptides (17% coverage), delta9-tetrahydrocannabinolic acid synthase (THCAS) identified with six peptides (15% coverage) and cannabidiolic acid synthase (CBDAS) identified with eight peptides (17% coverage). The steps these enzymes catalyse are summarised in Figure 6A.
The two-dimensional hierarchical clustering analysis (2-D HCA) presented in Figure 6B clusters guanidine-HCl-based samples away from the urea-based samples, in particular methods 3 and 5. Peptides do not cluster based on the protein they belong to. Extraction methods 4 and 6 allowed the detection and quantitation of most of the 31 peptides belonging to these phytocannabinoid enzymes, with respectively 87% and 86% of the peptides being up-regulated (Figure 6B). Both methods apply a TCA/solvent precipitation step followed by resuspension in a guanidine-HCl buffer. Consequently, this is the protein extraction method we recommend in order to recover and analyse the phytocannabinoid-related enzymes using a bottom-up proteomics strategy.
As more genomes are released, the identification of additional genes in the biosynthetic pathways is likely. Already THCAS and CBDAS gene clusters have been identified where the genes are highly homologous [22,23]. The function of all these genes is yet to be confirmed and proteomics methods will be useful to identify which of genes are translated at high efficiency in different cannabis strains. In designing medicinal cannabis strains for specific therapeutic requirements, either by genomic assisted breeding techniques (especially genomic selection) or through genome editing this protein expression information will be critical to optimise cannabinoid and terpene biosynthesis.
3. Materials and Methods
The experimental design is schematised in Figure 1.
3.1. Plant Materials
3.1.1. Apical Bud Sampling and Grinding
Fresh plant material was obtained from the Victorian Government Medicinal Cannabis Cultivation Facility. The top three centimetres of the apical bud was excised using secateurs, placed into a labelled paper bag, snap frozen in liquid nitrogen and stored at −80 °C until grinding. Samples were collected in triplicates. Frozen buds were ground in liquid nitrogen using a mortar and pestle. The ground frozen powder was transferred into a 15 mL tube and stored at stored at −80°C until protein extraction.
3.1.2. Trichome Recovery
The top three centimetres of the apical bud was cut using secateurs and placed into a labelled paper bag. Samples were collected in triplicates. Trichome recovery was inspired by the procedure devised by Yerger and colleagues [25], with modifications. The bud was further partially trimmed with the secateurs into smaller pieces and placed into a 50 mL tube. Approximately 10 mL liquid nitrogen was added to the tube and the cap was loosely attached. The tube was then vortexed for 1 min while covering the loosened lid with one hand to avoid spilling the plant material. The cap was removed, and the content of the tube was discarded by inverting the tube and tapping it on the bench, while the trichomes stuck to the walls of the tube. The process was repeated in the same tube until all the apical bud was trimmed. Tubes were stored at −80 °C until protein extraction.
3.2. Protein Extraction Methods
For the apical bud extraction, one 50 mg scoop of ground frozen powder was transferred into a 2 mL microtube kept on ice prefilled with 1.8 mL precipitant or 0.5 mL resuspension buffer depending on the extraction method employed (described below and in Figure 1). All six extraction methods described hereafter were applied to the apical bud samples. For the trichome extraction, all trichomes stuck to the walls of the tubes were resuspended into the solutions and volumes specified below. Due the limited amount of trichomes recovered, only extraction methods 1 and 2 were attempted.
3.2.1. Extraction 1: Resuspension in Urea Buffer
Plant material was resuspended in 0.5 mL of urea buffer (6M urea, 10mM DTT, 10mM Tris-HCl pH 8.0, 75mM NaCl, and 0.05% SDS). The tubes were vortexed for 1 min, sonicated for 5 min, vortexed again for 1 min. The tubes were centrifuged for 10 min at 13,500 rpm. The supernatant was transferred into fresh 1.5 mL tubes and stored at −80 °C until protein assay.
3.2.2. Extraction 2: Resuspension in Guanidine Hydrochloride Buffer
Plant material was resuspended in 0.5 mL of guanidine-HCl buffer (6 M guanidine-HCl, 10 mM DTT, 5.37 mM sodium citrate tribasic dihydrate and 0.1 M Bis-Tris). The tubes were vortexed for 1 min, sonicated for 5 min, vortexed again for 1 min. The tubes were centrifuged for 10 min at 13,500 rpm and at 4 °C. The supernatant was transferred into fresh 1.5 mL tubes and stored at −80 °C until protein assay.
3.2.3. Extraction 3: TCA/Acetone Precipitation Followed by Resuspension in Urea Buffer
Plant material was resuspended in 1.8 mL ice-cold 10% TCA/10mM DTT/acetone (w/w/v) by vortexing for 1 min. Tubes were left at −20 °C overnight. The next day, tubes were centrifuged for 10 min at 13,500 rpm and at 4 °C. The supernatant was removed, and the pellet was resuspended in ice-cold 10mM DTT/acetone (w/v) by vortexing for 1 min. Tubes were left at −20 °C for 2 h. The tubes were centrifuged as specified before and the supernatant removed. This washing step of the pellet was repeated once more. The pellets were dried for 30 min under a fume hood. The dry pellet resuspended in 0.5 mL of urea buffer as described in Extraction 1.
3.2.4. Extraction 4: TCA/Acetone Precipitation Followed by Resuspension in Guanidine Hydrochloride Buffer
Plant material was processed as detailed in Extraction 3, except that the dry pellet was resuspended in 0.5 mL of guanidine-HCl buffer.
3.2.5. Extraction 5: TCA/Ethanol Precipitation Followed by Resuspension in Urea Buffer
Plant material was processed as detailed in Extraction 3, except that acetone was replaced with ethanol.
3.2.6. Extraction 6: TCA/Ethanol Precipitation Followed by Resuspension in Guanidine Hydrochloride Buffer
Plant material was processed as detailed in Extraction 4, except that acetone was replaced with ethanol.
3.3. Alkylation and Protein Assay
Following protein extraction, DTT-reduced proteins were alkylated by adding 10 µL of 1M iodoacetamide (IAA)/water (w/v) solution to the extracts to reach a 20 mM final IAA concentration. The tubes were vortexed for 1 min and left to incubate at room temperature in the dark for 60 min.
Protein extracts from apical buds were diluted ten times into their respective resuspension buffer and protein extracts from trichomes were diluted four times. The protein concentrations were measured in triplicates using the Microplate BCA protein assay kit (Pierce) following the manufacturer’s instructions. Bovine Serum Albumin (BSA) from the kit was used as a standard as per instructions.
3.4. Trypsin/LysC protein Digestion and Desalting
3.4.1. Protease Digestion
An aliquot corresponding to 100 μg of plant proteins was used for protein digestion as follows. The DTT-reduced and IAA-alkylated proteins were diluted six times using 50 mM Tris-HCl pH 8 to drop the resuspension buffer molarity below 1 M. Trypsin/Lys-C protease (Mass Spectrometry Grade, 100 μg, Promega) was carefully solubilised in 1 mL of 50 mM Tris-HCl pH 8. A 40 µL aliquot of trypsin/Lys-C solution was added and gently mixed with the plant extracts thus achieving a 1:25 ratio of protease:plant proteins. The mixture was left to incubate overnight (19 h) at 37 °C in the dark. The digestion reaction was stopped by lowering the pH of the mixture using a 10% formic acid (FA) in H2O (v/v) to a final concentration of 1% FA.
BSA was also digested under the same conditions to be used as a control for digestion and nLC-MS/MS analysis.
3.4.2. Desalting
The 25 tryptic digests were desalted using solid phase extraction (SPE) cartridges (Sep-Pak C18 1cc Vac Cartridge, 50 mg sorbent, 55–105 μm particle size, 1 mL, Waters) by gravity as described in [26].
A 90 µL aliquot of peptide digest was mixed with 10 µL 1ng/μL Glu-Fibrinopeptide B (Sigma), as an internal standard. The peptide/internal standard mixture was transferred into a 100 μL glass insert placed into a glass vial. The vials were positioned into the autosampler at 4 °C for immediate analyses by nLC-MS/MS.
3.5. Intact Protein Analysis by Ultraperformance Liquid Chromatography Mass Spectrometry
3.5.1. UPLC separation
The Ultraperformance Liquid Chromatography Mass Spectrometry (UPLC-MS) analyses of the 24 plant protein extracts were performed in duplicates for a total of 48 MS files. Protein extracts were chromatographically separated using a UHPLC 1290 Infinity Binary LC system (Agilent) and an Aeris™ WIDEPORE XB-C8 column (3.6 µm, 200 Å, 150 × 2.1 mm, Phenomenex) kept at 75 °C as described in [17,18,19]. Flow rate was 0.2 mL/min. Mobile phase A contained 0.1% FA in water and mobile phase B contained 0.1% FA in acetonitrile. UPLC gradient was as follows: starting conditions 3% B, held for 2.5 min, ramping to 60% B in 27.5 min, ramping to 99% B in 1 min and held at 99% B for 4 min, lowering to 3% B in 0.1 min, equilibration at 3% B for 4.9 min. A 10 µL injection volume was applied to each protein extract, irrespective of their protein concentration. Each extract was injected twice.
3.5.2. MS acquisition
During the 40 min chromatographic separation, plant intact proteins were analysed using an Orbitrap Velos hybrid ion trap-Orbitrap mass spectrometer (ThermoFisher Scientific) online with the UPLC and fitted with a heated electrospray ionisation (HESI) source. HESI parameters were as follows: capillary heated to 300 °C, source heated to 250 °C, sheath gas flow 30, auxiliary gas flow 10, sweep gas flow 2, 3.6 kV, 100 µA and S-Lens RF level 60%. SID was set at 15V.
For the first 2.5 min, LC flow was sent to waste, switched to source from 2.5 to 38 min, and finally switched back to waste for the last minute of the 40 min run. Spectra were acquired in positive ion mode using the full MS scan mode of the Fourier Transform (FT) orbitrap mass analyser at a resolution of 60,000 using a 500–2000 m/z mass window and 6 microscans to improve signal-to-noise ratio. FT Penning gauge pressure difference was set at 0.05 E-10 Torr to improve the signal intensity of large molecules such as intact proteins.
All LC-MS files are available from the stable public repository MassIVE at the following URL: http://massive.ucsd.edu/ProteoSAFe/datasets.jsp with the accession number MSV000083191.
3.6. Peptide Digest Analysis by Nanoliquid Chromatography-Tandem Mass Spectrometry
The Nanoliquid Chromatography-Tandem Mass Spectrometry (nLC-ESI-MS/MS) analyses were performed on the 25 peptide digests in duplicates thus yielding 50 MS/MS files. Chromatographic separation of the peptides was performed by reverse phase (RP) using an Ultimate 3000 RSLCnano System (Dionex) online with an Orbitrap Velos hybrid ion trap-Orbitrap mass spectrometer (ThermoFisher Scientific). The parameters for nLC and MS/MS are described in [26] and here. A 1 μL aliquot (0.1 μg peptide) was loaded using a full loop injection mode onto a trap column (Acclaim PepMap100, 75 μm x 2 cm, C18 3 μm 100 Å, Dionex) at a 3 μL/min flow rate and switched onto a separation column (Acclaim PepMap100, 75 μm x 15 cm, C18 2 μm 100 Å, Dionex) at a 0.4 μL/min flow rate after 3 min. The column oven was set at 30 °C. Mobile phases for chromatographic elution were 0.1% FA in H2O (v/v) (phase A) and 0.1% FA in ACN (v/v) (phase B). Ultraviolet (UV) trace was recorded at 215 nm for the whole duration of the nLC run. A linear gradient from 3% to 40% of ACN in 35 min was applied. Then ACN content was brought to 90% in 2 min and held constant for 5 min to wash the separation column. Finally, the ACN concentration was lowered to 3% over 0.1 min and the column reequilibrated for 5 min. On-line with the nLC system, peptides were analysed using an Orbitrap Velos hybrid ion trap-Orbitrap mass spectrometer (Thermo Scientific). Ionization was carried out in the positive ion mode using a nanospray source. The electrospray voltage was set at 2.2 kV and the heated capillary was set at 280 °C. Full MS scans were acquired in the Orbitrap Fourier Transform (FT) mass analyser over a mass range of 300 to 2000 m/z with a 60,000 resolution in profile mode. MS/MS spectra were acquired in data-dependent mode. The 20 most intense peaks with charge state ≥ 2 and a minimum signal threshold of 10,000 were fragmented in the linear ion trap using collision-induced dissociation (CID) with a normalised collision energy of 35%, 0.25 activation Q and activation time of 10 msec. The precursor isolation width was 2 m/z. Dynamic exclusion was enabled, and peaks selected for fragmentation more than once within 10 sec were excluded from selection for 30 sec. Each digest was injected twice. Blanks (1 μL of mobile phase A) were injected in between each set of six extraction replicates and analysed over a 20 min nLC run to minimise carry-over.
3.7. Database Search for Protein Identification
Database searching of the 50 MS .RAW files was performed in Proteome Discoverer (PD) 1.4 using SEQUEST algorithm. All 589 C. sativa protein sequences publicly available on 13 December 2018 from UniprotKB (www.uniprot.org; key word used “Cannabis sativa”) were downloaded as a FASTA file. These also included 77 sequences from the European hop Humulus lupulus, the closest relative to C. sativa [27], as well as 72 sequences from the Chinese grass Boehmeria nivea, also closely related to cannabis [27]. Because GOT sequence was not included, we retrieved it from patent WO 2011/017798 Al [28] and included it to the FASTA file (590 entries). The FASTA file was imported and indexed in PD 1.4. The SEQUEST algorithm was used to search the indexed FASTA file. The database searching parameters specified trypsin as the digestion enzyme and allowed for up to two missed cleavages. The precursor mass tolerance was set at 10 ppm, and fragment mass tolerance set at 0.5 Da. The peptide absolute Xcorr threshold was set at 0.4 and protein relevance threshold was set at 1.5. Carbamidomethylation (C) was set as a static modification. Oxidation (M), phosphorylation (STY), conversion from Gln to pyro-Glu (N-term Q) and Glu to pyro-Glu (N-term E), and deamination (NQ) were set as dynamic modifications. The target decoy peptide-spectrum match (PSM) validator was used to estimate false discovery rates (FDR). At the peptide level, peptide confidence value set at high was used to filter the peptide identification, and the corresponding FDR on peptide level was less than 1%. At the protein level, protein grouping was enabled.
All nLC-MS/MS files are available from the stable public repository MassIVE at the following URL: http://massive.ucsd.edu/ProteoSAFe/datasets.jsp with the accession number MSV000083191.
3.8. Data Processing and Statistical Analyses
3.8.1. LC-MS and nLC-MS/MS Data Processing
The data files obtained following UPLC-MS analysis were processed in the Refiner MS module of Genedata Expressionist® 11.0 with the following parameters (1) Rentention Time (RT) Structure Removal using a 5 scan minimum RT length; (2) m/z Structure Removal using 8 points minimum m/z length; (3) Chromatogram Chemical Noise Reduction using 7 scan smoothing and a moving average estimator; (4) Spectrum Smoothing using a Savitzky-Golay algorithm with 5 points m/z window and a polynomial order of 3; (5) Chromatogram RT Alignment using a pairwise alignment-based tree and 50 RT scan search interval; (6) Chromatogram Peak Detection using a 0.3 min minimum peak size, 0.02 Da maximum merge distance, a boundaries merge strategy, a 30% gap–peak ratio, a curvature-based algorithm, using both local maximum and inflection points to determine boundaries; (7) Chromatogram Isotope Clustering using a 4 scan RT tolerance, a 20 ppm m/z tolerance, a peptide isotope shaping method with protonation, charges from 2-25, mono-isotopic masses and variable charge dependency; (8) Singleton Filter; (9) Charge and Adduct Grouping (i.e., deconvolution) using a 50 ppm mass tolerance, a 0.1 min RT tolerance, a dynamic adduct list containing ions (H), and neutrals (-H2O, K-H, and Na-H); and (10) Export Analyst using group volumes.
The data files obtained following nLC-MS/MS analysis were processed in the Refiner MS module of Genedata Expressionist® 11.0 with the following parameters (1) RT Structure Removal applying a minimum of 4 scans; (2) m/z Structure Removal applying a minimum of 8 points, (3) Chromatogram Chemical Noise Reduction using 5 scan smoothing, a moving average estimator, a 25 scan RT window, a 30% quantile and clipping an intensity of 20; (4) Grid using an adaptive grid with 10 scans and 10% deltaRT smoothing; (5) Chromatogram RT Alignment using a pairwise alignment-based tree and 50 RT scan search interval; (6) Chromatogram Peak Detection using a 0.1 min minimum peak size, 0.03 Da maximum merge distance, a boundaries merge strategy, a 20% gap–peak ratio, a curvature-based algorithm, intensity-weighed and using inflection points to determine boundaries; (7) Chromatogram Isotope Clustering using a 0.3 min RT tolerance, a 0.1 Da m/z tolerance, a peptide isotope shaping method with protonation, charges from 2–6 and mono-isotopic masses; (8) Singleton Filter; (9) MS/MS Consolidation; (10) Proteome Discoverer Import using a Xcorr above 1.5; (11) Peak Annotation; and (12) Export Analyst using cluster volumes.
3.8.2. Statistical Analyses
Statistical analyses were performed using the Analyst module of Genedata Expressionist® 11.0 where columns denote plant samples and rows denote intact proteins or tryptic digest peptides. Principal Component Analyses (PCA) were performed on rows using a covariance matrix with 50% valid values and row mean as imputation. Two-dimensional hierarchical clustering (2-D HCA) was performed on both columns and rows using positive correlation and Ward linkage method. Venn diagrams were produced by exporting quantitative data of the identified peptides to Microsoft excel 2016 (office 365) spreadsheet and using the Excel function COUNT to establish the frequency of the peptides in the samples and across extraction methods. Venn diagrams were drawn in Microsoft Powerpoint 2016 (Office 365).
4. Conclusions
Six different extraction methods were assessed to analyse proteins from medicinal cannabis apical buds and trichomes. This is the first time protein extraction is optimised from cannabis reproductive organs, and the guanidine-HCl buffer employed here has never been used before on C. sativa samples. If we convert the number of intact proteins quantified and the number of peptides identified into percent and plot them as a histogram (Supplementary Figure S4), it is evident that guanidine-HCl-based methods (2, 4 and 6) are best suited to recover proteins from medicinal cannabis buds and preceding this with a precipitation step in TCA/acetone (AB4, method 4) or TCA/ethanol (AB6, method 6), ensures optimum trypsin digestion followed by MS/MS.
Supplementary Materials
The following are available online, Figure S1: LC-MS maps of intact proteins, Figure S2: NanoLC-MS maps of tryptic peptides, Figure S3: Distribution of Cannabis sativa entries in UniprotKB from 1986 to 2018, Figure S4: Quantitative comparison of the six extraction methods. Table S1: Bottom-up identification results for Bovine Serum Albumin (BSA) sample (two injection replicates), Table S2: Number of nLC-MS peaks detected and clusters quantified in Genedata Expressionist Refiner across the various extraction methods. Table S3: List of peptides and proteins identified in cannabis apical buds and trichomes by bottom-up proteomics.
Author Contributions
Conceptualization, D.V. and S.R.; Methodology, D.V.; Software, D.V.; Validation, D.V.; Formal Analysis, D.V.; Resources, G.S.; Data Curation, D.V.; Writing—Original Draft Preparation, D.V.; Writing—Review and Editing, D.V., S.R. and G.S.; Visualization, D.V.; Supervision, S.R.; Project Administration, S.R. and G.S.; Funding Acquisition, G.S.
Funding
This research received no external funding.
Acknowledgments
The authors are grateful to Doris Ram who helped collect the apical buds and Shivi Braich who demonstrated trichome recovery.
Conflicts of Interest
The authors declare no conflicts of interest.
References
- Hand, A.; Blake, A.; Kerrigan, P.; Samuel, P.; Friedberg, J. History of medical cannabis. J. Pain Manage. 2016, 9, 387–394. [Google Scholar]
- Zuardi, A.W. History of cannabis as a medicine: A review. Rev. Bras. Psiquiatr. 2006, 28, 153–157. [Google Scholar] [CrossRef] [PubMed]
- Adams, R.; Hunt, M.; Clark, J.H. Structure of cannabidiol, a product isolated from the marihuana extract of Minnesota wild hemp. J. Am. Chem. Soc. 1940, 62, 196–200. [Google Scholar] [CrossRef]
- Mechoulam, R.; Gaoni, Y. Recent advances in the chemistry of hashish. Prog. Chem. Org. Nat. Prod. 1967, 25, 175–213. [Google Scholar]
- ElSohly, M.A.; Slade, D. Chemical constituents of marijuana: The complex mixture of natural cannabinoids. Life Sci. 2005, 78, 539–548. [Google Scholar] [CrossRef] [PubMed]
- Sirikantaramas, S.; Taura, F.; Morimoto, S.; Shoyama, Y. Recent advances in Cannabis sativa research: Biosynthetic studies and its potential in biotechnology. Curr. Pharm. Biotechnol. 2007, 8, 237–243. [Google Scholar] [CrossRef] [PubMed]
- Andre, C.M.; Hausman, J.-F.; Guerriero, G. Cannabis sativa: The Plant of the Thousand and One Molecules. Front. Plant Sci. 2016, 7, 19. [Google Scholar] [CrossRef]
- Bona, E.; Marsano, F.; Cavaletto, M.; Berta, G. Proteomic characterization of copper stress response in Cannabis sativa roots. Proteomics 2007, 7, 1121–1130. [Google Scholar] [CrossRef] [PubMed]
- Behr, M.; Sergeant, K.; Leclercq, C.C.; Planchon, S.; Guignard, C.; Lenouvel, A.; Renaut, J.; Hausman, J.F.; Lutts, S.; Guerriero, G. Insights into the molecular regulation of monolignol-derived product biosynthesis in the growing hemp hypocotyl. BMC Plant Biol. 2018, 18, 1. [Google Scholar] [CrossRef]
- Aiello, G.; Fasoli, E.; Boschin, G.; Lammi, C.; Zanoni, C.; Citterio, A.; Arnoldi, A. Proteomic characterization of hempseed (Cannabis sativa L.). J. Proteomics 2016, 147, 187–196. [Google Scholar] [CrossRef]
- Park, S.K.; Seo, J.B.; Lee, M.Y. Proteomic profiling of hempseed proteins from Cheungsam. Biochim. Biophys. Acta 2012, 1824, 374–382. [Google Scholar] [CrossRef] [PubMed]
- Raharjo, T.J.; Widjaja, I.; Roytrakul, S.; Verpoorte, R. Comparative proteomics of Cannabis sativa plant tissues. J. Biomol. Tech. 2004, 15, 97–106. [Google Scholar] [PubMed]
- Happyana, N. Metabolomics, Proteomics, and Transcriptomics of Cannabis sativa L. Trichomes. Ph.D. Thesis, TU Dortmund, Dortmund, Germany, 2014. [Google Scholar]
- McCarthy, J.; Hopwood, F.; Oxley, D.; Laver, M.; Castagna, A.; Righetti, P.G.; Williams, K.; Herbert, B. Carbamylation of proteins in 2-D electrophoresis--myth or reality? J. Proteome Res. 2003, 2, 239–242. [Google Scholar] [CrossRef] [PubMed]
- Poulsen, J.W.; Madsen, C.T.; Young, C.; Poulsen, F.M.; Nielsen, M.L. Using guanidine-hydrochloride for fast and efficient protein digestion and single-step affinity-purification mass spectrometry. J. Proteome Res. 2013, 12, 1020–1030. [Google Scholar] [CrossRef] [PubMed]
- Takakura, D.; Hashii, N.; Kawasaki, N. An improved in-gel digestion method for efficient identification of protein and glycosylation analysis of glycoproteins using guanidine hydrochloride. Proteomics 2014, 14, 196–201. [Google Scholar] [CrossRef] [PubMed]
- Raynes, J.K.; Vincent, D.; Zawadzki, J.L.; Savin, K.; Mertens, D.; Logan, A.; Williams, R.P.W. Investigation of Age Gelation in UHT Milk. Beverages 2018, 4, 95. [Google Scholar] [CrossRef]
- Vincent, D.; Elkins, A.; Condina, M.R.; Ezernieks, V.; Rochfort, S. Quantitation and Identification of Intact Major Milk Proteins for High-Throughput LC-ESI-Q-TOF MS Analyses. PLoS ONE 2016, 11, e0163471. [Google Scholar] [CrossRef]
- Vincent, D.; Mertens, D.; Rochfort, S. Optimisation of Milk Protein Top-Down Sequencing Using In-Source Collision-Induced Dissociation in the Maxis Quadrupole Time-of-Flight Mass Spectrometer. Molecules 2018, 23, 2777. [Google Scholar] [CrossRef]
- Booth, J.K.; Page, J.E.; Bohlmann, J. Terpene synthases from Cannabis sativa. PLoS ONE 2017, 12, e0173911. [Google Scholar] [CrossRef]
- van Bakel, H.; Stout, J.M.; Cote, A.G.; Tallon, C.M.; Sharpe, A.G.; Hughes, T.R.; Page, J.E. The draft genome and transcriptome of Cannabis sativa. Genome Biol. 2011, 12, R102. [Google Scholar] [CrossRef]
- Laverty, K.U.; Stout, J.M.; Sullivan, M.J.; Shah, H.; Gill, N.; Holbrook, L.; Deikus, G.; Sebra, R.; Hughes, T.R.; Page, J.E.; et al. A physical and genetic map of Cannabis sativa identifies extensive rearrangement at the THC/CBD acid synthase locus. Genome Res. 2018. [Google Scholar] [CrossRef]
- Grassa, C.J.; Wenger, J.P.; Dabney, C.; Poplawski, S.G.; Motley, S.T.; Michael, T.P.; Schwartz, C.J.; Weiblen, G.D. A complete Cannabis chromosome assembly and adaptive admixture for elevated cannabidiol (CBD) content. bioRxiv 2018. [Google Scholar] [CrossRef]
- Bridgeman, M.B.; Abazia, D.T. Medicinal Cannabis: History, Pharmacology, And Implications for the Acute Care Setting. P T. 2017, 42, 180–188. [Google Scholar] [PubMed]
- Yerger, E.H.; Grazzini, R.A.; Hesk, D.; Cox-Foster, D.L.; Craig, R.; Mumma, R.O. A rapid method for isolating glandular trichomes. Plant Physiol. 1992, 99, 1–7. [Google Scholar] [CrossRef] [PubMed]
- Vincent, D.; Ezernieks, V.; Elkins, A.; Nguyen, N.; Moate, P.J.; Cocks, B.G.; Rochfort, S. Milk Bottom-Up Proteomics: Method Optimization. Front Genet 2015, 6, 360. [Google Scholar] [CrossRef] [PubMed]
- McPartland, J.M. Cannabis Systematics at the Levels of Family, Genus, and Species. Cannabis Cannabinoid Res. 2018, 3.1, 203–212. [Google Scholar] [CrossRef] [PubMed]
- Page, J.; Boubakir, Z. Aromatic Prenyltransferase from Cannabis. Patent WO 2011/017798 Al, 4 October 2010. [Google Scholar]
Sample Availability: Samples are not available from the authors. |
Figure 1.
Experimental design.

Figure 2.
Principal component analysis (PCA) using intact protein data. AB, apical buds; T, trichomes; 1–6, extraction methods 1 to 6. For details on extraction methods (AB1-6 and T1-2) refer to Figure 1.
Figure 2.
Principal component analysis (PCA) using intact protein data. AB, apical buds; T, trichomes; 1–6, extraction methods 1 to 6. For details on extraction methods (AB1-6 and T1-2) refer to Figure 1.

Figure 3.
Principal component analysis (PCA) using bottom-up proteomics data. AB, apical buds; T, trichomes; 1–6, extraction methods 1 to 6. For details on extraction methods (AB1-6 and T1-2) refer to Figure 1.
Figure 3.
Principal component analysis (PCA) using bottom-up proteomics data. AB, apical buds; T, trichomes; 1–6, extraction methods 1 to 6. For details on extraction methods (AB1-6 and T1-2) refer to Figure 1.

Figure 4.
Venn diagram using the number of tryptic peptides identified by bottom-up proteomics. (A) Apical bud and extraction method 1 to 6; (B) trichomes and apical buds and extraction methods 1 and 2; and (C) all apical buds across all 2 methods and trichomes across both methods. For details on extraction methods 1–6 refer to Figure 1.

Figure 5.
Pie chart of the pathways in which identified Cannabis proteins are involved in and recovered from apical buds (A) and trichomes (B).
Figure 5.
Pie chart of the pathways in which identified Cannabis proteins are involved in and recovered from apical buds (A) and trichomes (B).

Figure 6.
Impact of extraction methods on enzymes involved in cannabinoid biosynthesis identified by bottom-up proteomics. (A) Cannabinoid pathway. Enzymes in red were identified in this work. (B) Two-dimensional hierarchical clustering of enzymes involved in cannabinoid synthesis. Columns represent extraction method per tissue types (AB, apical bud; T, trichomes. See Column legend as well) and rows represent the peptides identified from enzymes of interest. Peptides from the same enzymes bear the same shade of grey (see Row legend as well). CBDA, Cannabidiolic acid; CBDAS, CBDA synthase; CBGA, Cannabigerolic acid; GOT, geranyl-pyrophosphate-olivetolic acid geranyltransferase; OAC, Olivetolic acid cyclase; OLA, Olivetolic acid; OLS, 3,5,7-trioxododecanoyl-CoA synthase; THCA, delta9-tetrahydrocannabinolic acid; THCAS, THCA synthase.


Table 1.
Protein extraction efficiency of the six methods tested on cannabis apical buds and trichomes assessed by top-down proteomics.
Table 1.
Protein extraction efficiency of the six methods tested on cannabis apical buds and trichomes assessed by top-down proteomics.
| Tissue | Extraction Number | Extraction Method | Extraction Code | Protein Concentration (mg/mL) | Number of Proteins | ||
|---|---|---|---|---|---|---|---|
| Average (SD 1) | Average (SD 1) | CV 2 | Percent | ||||
| apical bud | extraction 1 | Urea | AB1 | 6.58 (± 0.89) | 254 (± 12) | 4.80 | 44.51 |
| apical bud | extraction 2 | Gnd-HCl | AB2 | 3.50 (± 0.99) | 335 (± 15) | 4.47 | 58.58 |
| apical bud | extraction 3 | TCA-A/urea | AB3 | 0.63 (± 0.15) | 247 (± 21) | 8.69 | 43.23 |
| apical bud | extraction 4 | TCA-A/Gnd-HCl | AB4 | 1.50 (± 0.28) | 314 (± 16) | 5.13 | 54.90 |
| apical bud | extraction 5 | TCA-E/urea | AB5 | 0.60 (± 0.11) | 201 (± 5) | 2.64 | 35.11 |
| apical bud | extraction 6 | TCA-E/Gnd-HCl | AB6 | 0.76 (± 0.48) | 264 (± 18) | 6.84 | 46.18 |
| trychome | extraction 1 | Urea | T1 | 3.67 (± 0.39) | 170 (± 5) | 2.97 | 29.83 |
| trychome | extraction 2 | Gnd-HCl | T2 | 2.28 (± 1.17) | 249 (± 45) | 18.12 | 43.61 |
| TOTAL | 571 | ||||||
1. SD, standard deviation; 2 CV, coefficient of variation.
Table 2.
Number of peptides identified by bottom-up proteomics with Xcorr >1.5.
| Tissue | Extraction Number | Extraction Method | Extraction Code | Number of Hits | ||
|---|---|---|---|---|---|---|
| Average (SD 1) | CV 2 | Percent | ||||
| apical bud | extraction 1 | Urea | AB1 | 211 (± 34) | 16.09 | 43.24 |
| apical bud | extraction 2 | Gnd-HCl | AB2 | 356 (± 20) | 5.51 | 72.88 |
| apical bud | extraction 3 | TCA-A/urea | AB3 | 265 (± 55) | 20.70 | 54.23 |
| apical bud | extraction 4 | TCA-A/Gnd-HCl | AB4 | 435 (± 9) | 2.09 | 89.07 |
| apical bud | extraction 5 | TCA-E/urea | AB5 | 41 (± 15) | 35.71 | 8.33 |
| apical bud | extraction 6 | TCA-E/Gnd-HCl | AB6 | 429 (± 6) | 1.33 | 87.91 |
| trychome | extraction 1 | Urea | T1 | 97 (± 22) | 22.27 | 19.88 |
| trychome | extraction 2 | Gnd-HCl | T2 | 102 (± 23) | 22.78 | 20.83 |
| TOTAL | 488 | |||||
1. SD, standard deviation; 2 CV, coefficient of variation.
Table 3.
List of proteins identified in medicinal cannabis apical buds and trichomes by bottom-up proteomics.
Table 3.
List of proteins identified in medicinal cannabis apical buds and trichomes by bottom-up proteomics.
| Protein Annotation | Abbreviation | Uniprot Accession or Patent Number | Species | Length (AA) | Number of Peptides Identified | EC Number | Function | Pathway |
|---|---|---|---|---|---|---|---|---|
| Small auxin upregulated protein | SAUR03 | A0A172J1 × 8 | Boehmeria nivea | 93 | 1 | response to auxin | Phytohormone response | |
| Small auxin upregulated protein | SAUR20 | A0A172J1Z7 | Boehmeria nivea | 147 | 1 | response to auxin | Phytohormone response | |
| Small auxin upregulated protein | SAUR23 | A0A172J212 | Boehmeria nivea | 99 | 1 | response to auxin | Phytohormone response | |
| Small auxin upregulated protein | SAUR24 | A0A172J211 | Boehmeria nivea | 102 | 1 | response to auxin | Phytohormone response | |
| Small auxin upregulated protein | SAUR28 | A0A172J206 | Boehmeria nivea | 108 | 1 | response to auxin | Phytohormone response | |
| Small auxin upregulated protein | SAUR30 | A0A172J210 | Boehmeria nivea | 100 | 1 | response to auxin | Phytohormone response | |
| Small auxin upregulated protein | SAUR31 | A0A172J276 | Boehmeria nivea | 152 | 1 | response to auxin | Phytohormone response | |
| Small auxin upregulated protein | SAUR40 | A0A172J219 | Boehmeria nivea | 105 | 1 | response to auxin | Phytohormone response | |
| Small auxin upregulated protein | SAUR44 | A0A172J227 | Boehmeria nivea | 152 | 4 | response to auxin | Phytohormone response | |
| Small auxin upregulated protein | SAUR48 | A0A172J226 | Boehmeria nivea | 133 | 1 | response to auxin | Phytohormone response | |
| Small auxin upregulated protein | SAUR54 | A0A172J237 | Boehmeria nivea | 118 | 5 | response to auxin | Phytohormone response | |
| Small auxin upregulated protein | SAUR55 | A0A172J229 | Boehmeria nivea | 97 | 3 | response to auxin | Phytohormone response | |
| Small auxin upregulated protein | SAUR58 | A0A172J236 | Boehmeria nivea | 97 | 1 | response to auxin | Phytohormone response | |
| Small auxin upregulated protein | SAUR59 | A0A172J243 | Boehmeria nivea | 106 | 5 | response to auxin | Phytohormone response | |
| Small auxin upregulated protein | SAUR60 | A0A172J238 | Boehmeria nivea | 105 | 1 | response to auxin | Phytohormone response | |
| Small auxin upregulated protein | SAUR70 | A0A172J249 | Boehmeria nivea | 183 | 1 | response to auxin | Phytohormone response | |
| Small auxin upregulated protein | SAUR71 | A0A172J2A4 | Boehmeria nivea | 183 | 1 | response to auxin | Phytohormone response | |
| Small auxin upregulated protein | SAUR51 | A0A172J290 | Boehmeria nivea | 97 | 1 | response to auxin | Phytohormone response | |
| Small auxin upregulated protein | SAUR52 | A0A172J241 | Boehmeria nivea | 149 | 1 | response to auxin | Phytohormone response | |
| Cannabidiolic acid synthase | CBDAS | A6P6V9 | Cannabis sativa | 544 | 8 | 1.21.3.8 | oxidative cyclisation of CBGA, producing CBDA | Cannabinoid biosynthesis |
| Geranylpyrophosphate:olivetolate geranyltransferase | GOT | WO 2011/017798 Al | Cannabis sativa | 395 | 4 | alkylation of OLA with geranyldiphosphate to form CBGA | Cannabinoid biosynthesis | |
| Olivetolic acid cyclase | OAC | I1V0C9 | Cannabis sativa | 545 | 1 | 4.4.1.26 | functions in concert with OLS/TKS to form OLA | Cannabinoid biosynthesis |
| Olivetolic acid cyclase | OAC | I6WU39 | Cannabis sativa | 101 | 5 | 4.4.1.26 | functions in concert with OLS/TKS to form OLA | Cannabinoid biosynthesis |
| 3,5,7-trioxododecanoyl-CoA synthase | OLS | B1Q2B6 | Cannabis sativa | 385 | 7 | 2.3.1.206 | olivetol biosynthesis | Cannabinoid biosynthesis |
| Tetrahydrocannabinolic acid synthase | THCAS | A0A0H3UZT7 | Cannabis sativa | 325 | 1 | 1.21.3.7 | oxidative cyclisation of CBGA, producing THCA | Cannabinoid biosynthesis |
| Tetrahydrocannabinolic acid synthase | THCAS | Q33DP7 | Cannabis sativa | 545 | 1 | 1.21.3.7 | oxidative cyclisation of CBGA, producing THCA | Cannabinoid biosynthesis |
| Tetrahydrocannabinolic acid synthase | THCAS | Q8GTB6 | Cannabis sativa | 545 | 4 | 1.21.3.7 | oxidative cyclisation of CBGA, producing THCA | Cannabinoid biosynthesis |
| Putative kinesin heavy chain | kin | Q5TIP9 | Cannabis sativa | 145 | 1 | microtubule-based movement | Cytoskeleton | |
| Betv1-like protein | Betv1 | I6XT51 | Cannabis sativa | 161 | 38 | Defence response | ||
| ATP synthase subunit alpha | atp1 | A0A0M5M1Z3 | Cannabis sativa | 509 | 12 | Produces ATP from ADP | Energy metabolism | |
| ATP synthase subunit alpha | atp1 | E5DK51 | Cannabis sativa | 349 | 1 | Produces ATP from ADP | Energy metabolism | |
| ATP synthase subunit 4 | atp4 | A0A0M4S8F3 | Cannabis sativa | 198 | 7 | Produces ATP from ADP | Energy metabolism | |
| ATP synthase subunit alpha | atpA | A0A0C5ARX6 | Cannabis sativa | 507 | 9 | Produces ATP from ADP | Energy metabolism | |
| ATP synthase subunit beta | atpB | F8TR83 | Cannabis sativa | 413 | 1 | 3.6.3.14 | Produces ATP from ADP | Energy metabolism |
| ATP synthase CF1 epsilon subunit | atpE | A0A0C5AUH9 | Cannabis sativa | 133 | 1 | Produces ATP from ADP | Energy metabolism | |
| ATP synthase subunit beta, chloroplastic | atpF | A0A0C5AUE9 | Cannabis sativa | 189 | 2 | Component of the F(0) channel | Energy metabolism | |
| NADH-ubiquinone oxidoreductase chain 1 | nad1 | A0A0M4S8G1 | Cannabis sativa | 324 | 1 | 7.1.1.2 | Energy metabolism | |
| NADH-ubiquinone oxidoreductase chain 5 | nad5 | A0A0M4RVP1 | Cannabis sativa | 669 | 1 | 7.1.1.2 | Energy metabolism | |
| NADH dehydrogenase subunit 7 | nad7 | A0A0M4S7M8 | Cannabis sativa | 394 | 1 | 7.1.1.2 | Energy metabolism | |
| NADH dehydrogenase subunit 9 | nad9 | A0A0M4R4N3 | Cannabis sativa | 190 | 2 | 7.1.1.2 | Energy metabolism | |
| NADH dehydrogenase subunit 7 | nadhd7 | A0A0X8GLG5 | Cannabis sativa | 394 | 1 | Energy metabolism | ||
| NADH-quinone oxidoreductase subunit H | ndhA | A0A0C5APZ2 | Cannabis sativa | 363 | 1 | 1.6.5.11 | NDH-1 shuttles electrons from NADH to quinones | Energy metabolism |
| NADH-quinone oxidoreductase subunit N | ndhB | A0A0C5B2K5 | Cannabis sativa | 510 | 1 | 1.6.5.11 | NDH-1 shuttles electrons from NADH to quinones | Energy metabolism |
| NADH-quinone oxidoreductase subunit K | ndhE | A0A0C5AUJ8 | Cannabis sativa | 101 | 4 | 1.6.5.11 | NDH-1 shuttles electrons from NADH to quinones | Energy metabolism |
| NADH-quinone oxidoreductase subunit C | ndhJ | A0A0C5B2I2 | Cannabis sativa | 158 | 2 | 1.6.5.11 | NDH-1 shuttles electrons from NADH to quinones | Energy metabolism |
| 1-deoxy-D-xylulose-5-phosphate reductoisomerase | DXR | A0A1V0QSG8 | Cannabis sativa | 472 | 2 | Converts 2-C-methyl-D-erythritol 4P into 1-deoxy-D-xylulose 5P | Isoprenoid biosynthesis | |
| Transferase FPPS1 | FPPS1 | A0A1V0QSH0 | Cannabis sativa | 341 | 1 | Isoprenoid biosynthesis | ||
| Transferase FPPS2 | FPPS2 | A0A1V0QSH7 | Cannabis sativa | 340 | 3 | Isoprenoid biosynthesis | ||
| Transferase GPPS large subunit | GPPS | A0A1V0QSH4 | Cannabis sativa | 393 | 2 | Isoprenoid biosynthesis | ||
| Transferase GPPS small subunit | GPPS | A0A1V0QSG9 | Cannabis sativa | 326 | 1 | Isoprenoid biosynthesis | ||
| Transferase GPPS small subunit2 | GPPS | A0A1V0QSI1 | Cannabis sativa | 278 | 1 | Isoprenoid biosynthesis | ||
| 4-hydroxy-3-methylbut-2-en-1-yl diphosphate reductase | HDR | A0A1V0QSH9 | Cannabis sativa | 408 | 6 | Converts (E)-4-hydroxy-3-methylbut-2-en-1-yl-2P into isopentenyl-2P | Isoprenoid biosynthesis | |
| Isopentenyl-diphosphate delta-isomerase | IDI | A0A1V0QSG5 | Cannabis sativa | 304 | 7 | Converts isopentenyl diphosphate into dimethylallyl diphosphate | Isoprenoid biosynthesis | |
| Mevalonate kinase | MK | A0A1V0QSI0 | Cannabis sativa | 416 | 3 | 2.7.1.36 | Converts (R)-mevalonate into (R)-5-phosphomevalonate | Isoprenoid biosynthesis |
| Diphosphomevalonate decarboxylase | MPDC | A0A1V0QSG4 | Cannabis sativa | 455 | 4 | Isoprenoid biosynthesis | ||
| Phosphomevalonate kinase | PMK | A0A1V0QSH8 | Cannabis sativa | 486 | 4 | Converts (R)-5-phosphomevalonate into (R)-5-diphosphomevalonate | Isoprenoid biosynthesis | |
| Non-specific lipid-transfer protein | ltp | P86838 | Cannabis sativa | 20 | 3 | transfer lipids across membranes | Lipid biosynthesis | |
| Non-specific lipid-transfer protein | ltp | W0U0V5 | Cannabis sativa | 91 | 9 | transfer lipids across membranes | Lipid biosynthesis | |
| 4-coumarate:CoA ligase | 4CL | A0A142EGJ1 | Cannabis sativa | 544 | 1 | 6.2.1.12 | forms 4-coumaroyl-CoA from 4-coumarate | Phenylpropanoid biosynthesis |
| 4-coumarate:CoA ligase | 4CL | V5KXG5 | Cannabis sativa | 550 | 3 | 6.2.1.12 | forms 4-coumaroyl-CoA from 4-coumarate | Phenylpropanoid biosynthesis |
| Phenylalanine ammonia-lyase | PAL | V5KWZ6 | Cannabis sativa | 707 | 4 | 4.3.1.24 | Catalyses L-phenylalanine = trans-cinnamate + ammonia | Phenylpropanoid biosynthesis |
| NAD(P)H-quinone oxidoreductase subunit 5, chloroplastic | ndhF | A0A0C5AUJ6 | Cannabis sativa | 755 | 1 | 1.6.5.- | NDH shuttles electrons from NAD(P)H:plastoquinone to quinones | Photosynthesis |
| Photosystem I P700 chlorophyll a apoprotein A1 | pasA | A0A0U2DTB0 | Cannabis sativa | 750 | 2 | 1.97.1.12 | bind P700, the primary electron donor of PSI | Photosynthesis |
| Photosystem I P700 chlorophyll a apoprotein A2 | psaB | A0A0C5APY0 | Cannabis sativa | 734 | 2 | 1.97.1.12 | bind P700, the primary electron donor of PSI | Photosynthesis |
| Photosystem I iron-sulfur center | psaC | A0A0C5AS17 | Cannabis sativa | 81 | 10 | 1.97.1.12 | assembly of the PSI complex | Photosynthesis |
| Photosystem II CP47 reaction center protein | psbB | A9XV91 | Cannabis sativa | 488 | 1 | binds chlorophyll in PSII | Photosynthesis | |
| Ribulose bisphosphate carboxylase large chain | rbcL | A0A0B4SX31 | Cannabis sativa | 312 | 15 | 4.1.1.39 | carboxylation of D-ribulose 1,5-bisphosphate | Photosynthesis |
| Small ubiquitin-related modifier | smt3 | Q5TIQ0 | Cannabis sativa | 76 | 2 | protein sumoylation | Protein metabolism | |
| Cytochrome c biogenesis FC | ccmFc | A0A0M4RVN1 | Cannabis sativa | 447 | 1 | Mitochondrial electron carrier protein | Respiration | |
| Cytochrome c biogenesis FN | ccmFn | A0A0M3UM18 | Cannabis sativa | 575 | 2 | Mitochondrial electron carrier protein | Respiration | |
| Cytochrome c biogenesis protein CcsA | ccsA | A0A0C5B2L0 | Cannabis sativa | 320 | 1 | biogenesis of c-type cytochromes | Respiration | |
| Cytochrome c | cytC | P00053 | Cannabis sativa | 111 | 2 | Mitochondrial electron carrier protein | Respiration | |
| 7S vicilin-like protein | Cs7S | A0A219D1T7 | Cannabis sativa | 493 | 2 | nutrient reservoir activity | Storage | |
| Edestin 1 | ede1D | A0A090CXP5 | Cannabis sativa | 511 | 1 | Seed storage protein | Storage | |
| 4-(cytidine 5’-diphospho)-2-C-methyl-D-erythritol kinase | CMK | A0A1V0QSI2 | Cannabis sativa | 408 | 4 | Adds 2-phosphate to 4-CDP-2-C-methyl-d-erythritol | Terpenoid biosynthesis | |
| 1-deoxy-D-xylulose-5-phosphate synthase | DXPS1 | A0A1V0QSH6 | Cannabis sativa | 730 | 2 | Converts d-glyceraldehyde 3P into 1-deoxy-d-xylulose 5P | Terpenoid biosynthesis | |
| 1-deoxy-D-xylulose-5-phosphate synthase | DXS2 | A0A1V0QSH5 | Cannabis sativa | 606 | 5 | Converts d-glyceraldehyde 3P into 1-deoxy-d-xylulose 5P | Terpenoid biosynthesis | |
| 4-hydroxy-3-methylbut-2-en-1-yl diphosphate synthase | HDS | A0A1V0QSG3 | Cannabis sativa | 748 | 3 | Converts (E)-4-hydroxy-3-methylbut-2-en-1-yl-2P into 2-C-methyl-d-erythritol 2,4-cyclo-2P | Terpenoid biosynthesis | |
| 3-hydroxy-3-methylglutaryl coenzyme A reductase | hmgR | A0A1V0QSF5 | Cannabis sativa | 588 | 5 | 1.1.1.34 | synthesizes (R)-mevalonate from acetyl-CoA | Terpenoid biosynthesis |
| 3-hydroxy-3-methylglutaryl coenzyme A reductase | hmgR | A0A1V0QSG7 | Cannabis sativa | 572 | 2 | 1.1.1.34 | synthesizes (R)-mevalonate from acetyl-CoA | Terpenoid biosynthesis |
| Terpene synthase | TPS | A0A1V0QSF2 | Cannabis sativa | 567 | 1 | formation of cyclic terpenes through the cyclisation of linear terpenes | Terpenoid biosynthesis | |
| Terpene synthase | TPS | A0A1V0QSF3 | Cannabis sativa | 551 | 3 | formation of cyclic terpenes through the cyclisation of linear terpenes | Terpenoid biosynthesis | |
| Terpene synthase | TPS | A0A1V0QSF4 | Cannabis sativa | 613 | 1 | formation of cyclic terpenes through the cyclisation of linear terpenes | Terpenoid biosynthesis | |
| Terpene synthase | TPS | A0A1V0QSF6 | Cannabis sativa | 551 | 1 | formation of cyclic terpenes through the cyclisation of linear terpenes | Terpenoid biosynthesis | |
| Terpene synthase | TPS | A0A1V0QSF8 | Cannabis sativa | 629 | 2 | formation of cyclic terpenes through the cyclisation of linear terpenes | Terpenoid biosynthesis | |
| Terpene synthase | TPS | A0A1V0QSF9 | Cannabis sativa | 624 | 2 | formation of cyclic terpenes through the cyclisation of linear terpenes | Terpenoid biosynthesis | |
| Terpene synthase | TPS | A0A1V0QSG0 | Cannabis sativa | 573 | 1 | formation of cyclic terpenes through the cyclisation of linear terpenes | Terpenoid biosynthesis | |
| Terpene synthase | TPS | A0A1V0QSG1 | Cannabis sativa | 640 | 1 | formation of cyclic terpenes through the cyclisation of linear terpenes | Terpenoid biosynthesis | |
| Terpene synthase | TPS | A0A1V0QSG6 | Cannabis sativa | 556 | 3 | formation of cyclic terpenes through the cyclisation of linear terpenes | Terpenoid biosynthesis | |
| Terpene synthase | TPS | A0A1V0QSH1 | Cannabis sativa | 594 | 1 | formation of cyclic terpenes through the cyclisation of linear terpenes | Terpenoid biosynthesis | |
| (-)-limonene synthase, chloroplastic | TPS1 | A7IZZ1 | Cannabis sativa | 622 | 2 | 4.2.3.16 | monoterpene (C10) olefins biosynthesis | Terpenoid biosynthesis |
| Maturase K | matK | A0A1V0IS32 | Cannabis sativa | 509 | 1 | assists in splicing its own and other chloroplast group II intron | Transcription | |
| Maturase K | matK | Q95BY0 | Cannabis sativa | 507 | 2 | assists in splicing its own and other chloroplast group II intron | Transcription | |
| Maturase R | matR | A0A0M5M254 | Cannabis sativa | 651 | 1 | assists in splicing introns | Transcription | |
| DNA-directed RNA polymerase subunit beta | rpoB | A0A0C5ARQ8 | Cannabis sativa | 1070 | 3 | 2.7.7.6 | transcription of DNA into RNA | Transcription |
| DNA-directed RNA polymerase subunit beta | rpoB | A0A0C5ARX9 | Cannabis sativa | 1393 | 4 | 2.7.7.6 | transcription of DNA into RNA | Transcription |
| DNA-directed RNA polymerase subunit beta | rpoB | A0A0U2H5U7 | Cannabis sativa | 1070 | 1 | 2.7.7.6 | transcription of DNA into RNA | Transcription |
| DNA-directed RNA polymerase subunit beta | rpoC1 | A0A0C5AUF5 | Cannabis sativa | 683 | 6 | 2.7.7.6 | transcription of DNA into RNA | Transcription |
| DNA-directed RNA polymerase subunit beta | rpoC2 | A0A0H3W6G1 | Cannabis sativa | 1389 | 1 | 2.7.7.6 | transcription of DNA into RNA | Transcription |
| DNA-directed RNA polymerase subunit beta | rpoC2 | A0A0X8GKF1 | Cannabis sativa | 1391 | 1 | 2.7.7.6 | transcription of DNA into RNA | Transcription |
| DNA-directed RNA polymerase subunit beta | rpoC2 | A0A1V0IS28 | Cannabis sativa | 1393 | 1 | 2.7.7.7 | transcription of DNA into RNA | Transcription |
| Ribosomal protein L14 | rpl14 | A0A0C5AS10 | Cannabis sativa | 122 | 2 | assembly of the ribosome | Protein metabolism | |
| 50S ribosomal protein L16, chloroplastic | rpl16 | A0A0C5AUJ2 | Cannabis sativa | 119 | 2 | assembly of the 50S ribosomal subunit | Protein metabolism | |
| Ribosomal protein L2 | rpl2 | A0A0M3ULW5 | Cannabis sativa | 337 | 2 | assembly of the ribosome | Protein metabolism | |
| 50S ribosomal protein L20 | rpl20 | A0A0C5B2J3 | Cannabis sativa | 120 | 1 | Binds directly to 23S rRNA to assemble the 50S ribosomal subunit | Protein metabolism | |
| Ribosomal protein S11 | rps11 | A0A0C5ART4 | Cannabis sativa | 138 | 1 | assembly of the ribosome | Protein metabolism | |
| 30S ribosomal protein S12, chloroplastic | rps12 | A0A0C5APY5 | Cannabis sativa | 132 | 1 | translational accuracy | Protein metabolism | |
| 30S ribosomal protein S12, chloroplastic | rps12 | A0A0C5B2L8 | Cannabis sativa | 125 | 1 | translational accuracy | Protein metabolism | |
| Ribosomal protein S13 | rps13 | A0A0M5M201 | Cannabis sativa | 116 | 1 | assembly of the ribosome | Protein metabolism | |
| Ribosomal protein S19 | rps19 | A0A0M3ULW7 | Cannabis sativa | 94 | 1 | assembly of the ribosome | Protein metabolism | |
| Ribosomal protein S2 | rps2 | A0A0C5APX8 | Cannabis sativa | 236 | 1 | assembly of the ribosome | Protein metabolism | |
| 30S ribosomal protein S3, chloroplastic | rps3 | A0A0C5ART6 | Cannabis sativa | 155 | 3 | assembly of the 30S ribosomal subunit | Protein metabolism | |
| Ribosomal protein S3 | rps3 | A0A0M3UM22 | Cannabis sativa | 548 | 1 | assembly of the ribosome | Protein metabolism | |
| Ribosomal protein S3 | rps3 | A0A110BC84 | Cannabis sativa | 548 | 1 | assembly of the ribosome | Protein metabolism | |
| Ribosomal protein S4 | rps4 | A0A0M4RG21 | Cannabis sativa | 352 | 1 | assembly of the ribosome | Protein metabolism | |
| Ribosomal protein S7 | rps7 | A0A0C5ARU3 | Cannabis sativa | 155 | 2 | assembly of the ribosome | Protein metabolism | |
| Ribosomal protein S7 | rps7 | A0A0M4R6T5 | Cannabis sativa | 148 | 1 | assembly of the ribosome | Protein metabolism | |
| Protein TIC 214 | ycf1 | A0A0C5AS14 | Cannabis sativa | 356 | 2 | protein precursor import into chloroplasts | Protein metabolism | |
| Protein TIC 214 | ycf1 | A0A0H3W815 | Cannabis sativa | 1878 | 21 | protein precursor import into chloroplasts | Protein metabolism | |
| Acyl-activating enzyme 1 | aae1 | H9A1V3 | Cannabis sativa | 720 | 1 | Unknown | ||
| Acyl-activating enzyme 10 | aae10 | H9A1W2 | Cannabis sativa | 564 | 1 | Unknown | ||
| Acyl-activating enzyme 12 | aae12 | H9A8L1 | Cannabis sativa | 757 | 2 | Unknown | ||
| Acyl-activating enzyme 13 | aae13 | H9A8L2 | Cannabis sativa | 715 | 3 | Unknown | ||
| Acyl-activating enzyme 2 | aae2 | H9A1V4 | Cannabis sativa | 662 | 3 | Unknown | ||
| Acyl-activating enzyme 3 | aae3 | H9A1V5 | Cannabis sativa | 543 | 7 | Unknown | ||
| Acyl-activating enzyme 4 | aae4 | H9A1V6 | Cannabis sativa | 723 | 3 | Unknown | ||
| Acyl-activating enzyme 5 | aae5 | H9A1V7 | Cannabis sativa | 575 | 1 | Unknown | ||
| Acyl-activating enzyme 6 | aae6 | H9A1V8 | Cannabis sativa | 569 | 1 | Unknown | ||
| Acyl-activating enzyme 8 | aae8 | H9A1W0 | Cannabis sativa | 526 | 3 | Unknown | ||
| Cannabidiolic acid synthase-like 2 | CBDAS3 | A6P6W1 | Cannabis sativa | 545 | 1 | Has no cannabidiolic acid synthase activity | Unknown | |
| Putative LOV domain-containing protein | LOV | A0A126WVX7 | Cannabis sativa | 664 | 8 | Unknown | ||
| Putative LOV domain-containing protein | LOV | A0A126WVX8 | Cannabis sativa | 1063 | 7 | Unknown | ||
| Putative LOV domain-containing protein | LOV | A0A126WZD3 | Cannabis sativa | 574 | 1 | Unknown | ||
| Putative LOV domain-containing protein | LOV | A0A126X0M1 | Cannabis sativa | 725 | 4 | Unknown | ||
| Putative LOV domain-containing protein | LOV | A0A126X1H2 | Cannabis sativa | 910 | 6 | Unknown | ||
| Putative LysM domain containing receptor kinase | lyk2 | U6EFF4 | Cannabis sativa | 599 | 1 | Unknown | ||
| Uncharacterised protein | unknown | A0A1V0IS79 | Cannabis sativa | 1525 | 2 | Unknown | ||
| Uncharacterised protein | unknown | L0N5C8 | Cannabis sativa | 543 | 1 | Unknown | ||
| Protein Ycf2 | ycf2 | A0A0C5APZ4 | Cannabis sativa | 2302 | 9 | ATPase of unknown function | Unknown | |
| Protein translocase subunit | secA | A0A0N9ZJA6 | Cannabis sativa | 158 | 7 | Binds ATP | Protein metabolism | |
| ATP synthase subunit beta, chloroplastic | atpB | A0A0U2DTF2 | Cannabis sativa subsp. sativa | 498 | 20 | 3.6.3.14 | Produces ATP from ADP | Energy metabolism |
| Acetyl-coenzyme A carboxylase carboxyl transferase subunit beta, chloroplastic | accD | A0A0U2DTG7 | Cannabis sativa subsp. sativa | 497 | 3 | 2.1.3.15 | acetyl coenzyme A carboxylase complex | Lipid biosynthesis |
| NAD(P)H-quinone oxidoreductase subunit K, chloroplastic | ndhK | A0A0U2DTF9 | Cannabis sativa subsp. sativa | 226 | 1 | 1.6.5.- | NDH shuttles electrons from NAD(P)H:plastoquinone to quinones | Photosynthesis |
| Cytochrome f | petA | A0A0U2DW83 | Cannabis sativa subsp. sativa | 320 | 1 | mediates electron transfer between PSII and PSI | Photosynthesis | |
| Photosystem II protein D1 | psbA | A0A0U2DTE4 | Cannabis sativa subsp. sativa | 353 | 2 | 1.10.3.9 | assembly of the PSII complex | Photosynthesis |
| Photosystem II CP43 reaction center protein | psbC | A0A0U2DTE2 | Cannabis sativa subsp. sativa | 473 | 5 | core complex of PSII | Photosynthesis | |
| Photosystem II D2 protein | psbD | A0A0U2DVP6 | Cannabis sativa subsp. sativa | 353 | 3 | 1.10.3.9 | assembly of the PSII complex | Photosynthesis |
| Cytochrome b559 subunit alpha | psbE | A0A0U2DTH9 | Cannabis sativa subsp. sativa | 83 | 2 | reaction center of PSII | Photosynthesis | |
| Ribulose bisphosphate carboxylase large chain | rbcL | A0A0U2DW50 | Cannabis sativa subsp. sativa | 475 | 13 | 4.1.1.39 | carboxylation of D-ribulose 1,5-bisphosphate | Photosynthesis |
| Photosystem I assembly protein Ycf4 | ycf4 | A0A0U2DVM4 | Cannabis sativa subsp. sativa | 184 | 1 | assembly of the PSI complex | Photosynthesis | |
| 30S ribosomal protein S14, chloroplastic | rps14 | A0A0U2DTI4 | Cannabis sativa subsp. sativa | 100 | 2 | Binds 16S rRNA, required for the assembly of 30S particles | Protein metabolism | |
| 30S ribosomal protein S15, chloroplastic | rps15 | A0A0U2DW79 | Cannabis sativa subsp. sativa | 90 | 1 | assembly of the 30S ribosomal subunit | Protein metabolism | |
| ATP synthase subunit beta, chloroplastic | atpB | A0A0U2H0U7 | Humulus lupulus | 498 | 2 | 3.6.3.14 | Produces ATP from ADP | Energy metabolism |
| ATP synthase subunit beta, chloroplastic | atpB | A0A0U2H587 | Humulus lupulus | 191 | 1 | Component of the F(0) channel | Energy metabolism | |
| NAD(P)H-quinone oxidoreductase subunit I, chloroplastic | ndhI | A0A0U2GY49 | Humulus lupulus | 171 | 2 | 1.6.5.- | NDH shuttles electrons from NAD(P)H:plastoquinone to quinones | Photosynthesis |
| DNA-directed RNA polymerase subunit beta | rpoC2 | A0A0U2H146 | Humulus lupulus | 1398 | 1 | 2.7.7.6 | transcription of DNA into RNA | Transcription |
| 50S ribosomal protein L20, chloroplastic | rpl20 | A0A0U2H0V8 | Humulus lupulus | 120 | 1 | Binds directly to 23S rRNA to assemble the 50S ribosomal subunit | Protein metabolism | |
| 30S ribosomal protein S4, chloroplastic | rps4 | A0A0U2H5A0 | Humulus lupulus | 202 | 1 | binds directly to 16S rRNA to assemble the 30S subunit | Protein metabolism | |
| 30S ribosomal protein S8, chloroplastic | rps8 | A0A0U2GZU5 | Humulus lupulus | 134 | 2 | binds directly to 16S rRNA to assemble the 30S subunit | Protein metabolism | |
| Protein Ycf2 | ycf2 | A0A0U2H6B6 | Humulus lupulus | 2287 | 1 | ATPase of unknown function | Unknown |
© 2019 by the authors. Licensee MDPI, Basel, Switzerland. This article is an open access article distributed under the terms and conditions of the Creative Commons Attribution (CC BY) license (http://creativecommons.org/licenses/by/4.0/).
Share and Cite
MDPI and ACS Style
Vincent, D.; Rochfort, S.; Spangenberg, G. Optimisation of Protein Extraction from Medicinal Cannabis Mature Buds for Bottom-Up Proteomics. Molecules 2019, 24, 659. https://doi.org/10.3390/molecules24040659
AMA Style
Vincent D, Rochfort S, Spangenberg G. Optimisation of Protein Extraction from Medicinal Cannabis Mature Buds for Bottom-Up Proteomics. Molecules. 2019; 24(4):659. https://doi.org/10.3390/molecules24040659
Chicago/Turabian StyleVincent, Delphine, Simone Rochfort, and German Spangenberg. 2019. "Optimisation of Protein Extraction from Medicinal Cannabis Mature Buds for Bottom-Up Proteomics" Molecules 24, no. 4: 659. https://doi.org/10.3390/molecules24040659