Article

Speciation Studies of Bifunctional 3-Hydroxy-4-Pyridinone Ligands in the Presence of Zn2+ at Different Ionic Strengths and Temperatures

1
Dipartimento di Scienze Chimiche, Biologiche, Farmaceutiche e Ambientali, Università di Messina, Viale F. Stagno d’Alcontres 31, 98166 Messina, Italy
2
Dipartimento di Fisica e Chimica Emilio Segrè, ed. 17, Università di Palermo, Viale delle Scienze, I-90128 Palermo, Italy
3
Centro de Química Estrutural, Instituto Superior Técnico, Universidade de Lisboa, Av. Rovísco Pais 1, 1049-001 Lisboa, Portugal
*
Authors to whom correspondence should be addressed.
Molecules 2019, 24(22), 4084; https://doi.org/10.3390/molecules24224084
Submission received: 11 October 2019 / Revised: 6 November 2019 / Accepted: 6 November 2019 / Published: 12 November 2019

Abstract

:
The acid–base properties of two bifunctional 3-hydroxy-4-pyridinone ligands and their chelating capacity towards Zn2+, an essential bio-metal cation, were investigated in NaCl aqueous solutions by potentiometric, UV-Vis spectrophotometric, and 1H NMR spectroscopic titrations, carried out at 0.15 ≤ I/mol −1 ≤ 1.00 and 288.15 ≤ T/K ≤ 310.15. A study at I = 0.15 mol L−1 and T = 298.15 K was also performed for other three Zn2+/Lz− systems, with ligands belonging to the same family of compounds. The processing of experimental data allowed the determination of protonation and stability constants, which showed accordance with the data obtained from the different analytical techniques used, and with those reported in the literature for the same class of compounds. ESI-MS spectrometric measurements provided support for the formation of the different Zn2+/ligand species, while computational molecular simulations allowed information to be gained on the metal–ligand coordination. The dependence on ionic strength and the temperature of equilibrium constants were investigated by means of the extended Debye–Hückel model, the classical specific ion interaction theory, and the van’t Hoff equations, respectively.

1. Introduction

The 3-hydroxy-4-pyridinones (3,4-HPs) are a family of compounds that are derivatives of deferiprone (DFP), which have been extensively developed as possible strong chelators and metal-related pharmaceutical drugs, due to their important roles in pharmaceutical and bioenvironmental processes, in the sequestration or release of specific metal cations (Mn+) from or into the human body, and as metal carriers for therapeutics or imaging purposes [1,2]. These compounds feature a 6-membered N-heterocyclic aromatoid ring with hydroxyl and ketone groups in the ortho position, conferring them a significant binding ability towards hard divalent and trivalent metal cations (M2+, M3+) [3]. In the last two decades, their development has been considerably spreading, since several studies [1,3,4] have demonstrated that the 3-hydroxy-4-pyridinones may strongly sequester metal cations (Fe3+, Al3+, etc.), resulting in the formation of species with a higher thermodynamic stability with respect to the precursor deferiprone [5,6]. At the same time, they can be considered good alternatives to deferoxamine (DFO or Desferal®) [7] as iron chelators, because the use of 3,4-HPs does not involve serious drawbacks, such as high toxicity and costs, oral activity, or other possible undesired side effects. As already reported in previous papers [8,9], the 3-hydroxy-4-pyridinones can also be extra-functionalized to improve their lipophilic–hydrophilic balance and increase their affinity towards cells biological membranes.
The present paper investigates the acid–base properties of two bifunctional 3,4-HPs, ligands (L2: (S)-2-amino-4-((2-(3-hydroxy-2-methyl-4-oxopyridin-1(4H)-yl)ethyl)amino)-4-oxobutanoic acid and L5: 1-(3-aminopropyl)-3-hydroxy-2-methylpyridin-4(1H)-one, Figure 1), at different ionic strength and temperature conditions (0.15 ≤ I/mol L−1 ≤ 1.00, 288.15 ≤ T/K ≤ 310.15) in NaCl(aq). This ionic medium was selected because it is the principal inorganic component of many natural and biological fluids [10,11,12]. Therefore, performing studies under the experimental conditions of these fluids, namely at I ~ 0.01–0.10 mol L−1 and 0.70 mol L−1 for fresh and marine waters, or I ~ 0.16 mol L−1 for blood plasma, allows simulation and possibly predictions of the behaviour of real systems [13,14]. Moreover, although these 3,4-HPs metal chelators have already proven to have an inherently high affinity towards hard metal cations, such as Al3+ [8], it is interesting to study their interaction with biologically relevant M2+, in order to assure that along with their sequestering role of hard M3+, they do not lead to a significant depletion of important divalent bio-metal cations, in particular Zn2+. In fact, Zn2+ is an essential trace mineral required for the metabolism of several enzymes, cell division processes, DNA, and protein synthesis [15]. Furthermore, it has an important role in the proper growth and development of the human body, helps to protect the skin and muscles from premature aging, and has antioxidant functions against free radicals [16]. Zinc also participates in regulation of immune functions through the activation of T lymphocytes (T cells), which help the body to control and regulate the immune responses and to attack infected or cancerous cells [17]. Therefore, the binding ability of the cited 3,4-HPs towards Zn2+ was investigated, as well as for three other ligands (L1: 4-(3-hydroxy-2-methyl-4-oxopyridin-1(4H)-yl)butanoic acid, L3: (S)-2-amino-4-((3-(3-hydroxy-2-methyl-4-oxopyridin-1(4H)-yl)propyl)amino)-4-oxobutanoic acid, and L4: (S)-2-amino-5-(3-hydroxy-2-methyl-4-oxopyridin-1(4H)-yl)pentanoic acid; Figure 1), all of which belong to the same class of compounds. From an experimental point of view, potentiometric measurements, using specific electrodes for H+ ion activity (ISE-H+), and ultraviolet-visible (UV-Vis) spectrophotometric measurements were carried out at I = 0.15 mol L−1 in NaCl(aq) and T = 298.15 K, and in the case of L2 and L5 3-hydroxy-4-pyridinones, also at 0.15 ≤ I/mol L−1 ≤ 1.00, 288.15 ≤ T/K ≤ 310.15. Electrospray mass (ESI-MS) spectrometric measurements were performed to investigate the possible formation of Zn2+/ligand species with different stoichiometry at I = 0.15, 1.00 mol L−1 in NaCl(aq) and in the absence of ionic medium, at T = 298.15 K. Proton nuclear magnetic resonance (1H NMR) spectroscopic titrations and computational studies were also carried out to gain information on the Zn2+–ligand coordination mode. The protonation and stability data, determined for the different experimental conditions, were used to model the dependence of thermodynamic parameters on ionic strength by means of the extended Debye–Hückel (EDH) equation and the specific ion interaction theory (SIT), while the effect of temperature was determined using the van’t Hoff equation. Finally, the sequestering ability of the 3-hydroxy-4-pyridinones towards the metal cation under study was investigated by calculating the empirical parameter pL0.5, already proposed in [18], at different pH, ionic strength, and temperature conditions.

2. Results and Discussion

2.1. Equilibria and Thermodynamic Models

The acid–base properties of the ligands (Lz−) were investigated, taking into account the following stepwise (logKrH; Equation (1)) and overall (logβrH; Equation (2)) equilibria, respectively:
H+ + H(r − 1)L−(z−(r − 1)) = HrL−(z − r)     logKrH
and
rH+ +Lz− = HrL−(z−r)       logβrH
where r is the rth protonation step; z is the charge of the completely deprotonated 3-hydroxy-4-pyridinones.
The metal hydrolytic behavior is described by the equilibrium:
pZn2+ + rH2O = Znp(OH)r(2p−r) + rH+      logβrOH
The stepwise and overall stability constants of the Zn2+-ligands species are given as follows:
pZn2+ + HrLq−(zq−(r−1) = ZnpLqHr(2p+r−qz) + H+     logKpqr
pZn2+ + qLz− + rH+ = ZnpLqHr(2p+r−qz)      logβpqr
If ternary metal–ligand hydrolytic species are formed, equilibria refer to:
pZn2+ + qLz− + rH2O = ZnpLq(OH)r(2p−r−zq) + rH+    logβpq-r
The protonation and stability of formation constants, concentrations, and ionic strengths are expressed in the molar (c, mol L−1) or molal (m, mol (kg H2O)−1) scales. Molar to molal conversions were performed by means of appropriate density values.
The dependence on ionic strength (I) of the thermodynamic parameters was studied using an extended Debye–Hückel-type equation [19]:
logK = logK0 − z*·DH + C·I
where logK0 is the equilibrium constant atinfinite dilution; z* is the Σ (charge)2reactants − Σ (charge)2products; DH is the 0.51·(I1/2/(1 + 1.5I1/2)), Debye–Hückel term; C is the empirical parameter for the dependence of the equilibrium constants on the ionic strength.
If the equilibrium constants are expressed in the molal concentration scale, Equation (7) can be modified to obtain the classical specific ion interaction theory (SIT) [20,21,22], where C parameter is replaced by Δε:
Δεij = ∑i ε(i, j)
where ε(i, j) is the interaction coefficient for an ith species with a jth component of opposite charge.
Furthermore, protonation and formation constants determined at different temperatures were used to calculate the enthalpy values by applying the van’t Hoff equation, assuming that the contribution of ΔCp ina small temperature range, in our case 288.15–310.15 K, is negligible:
logKT = logKθ + (ΔHθ/2.303R) (1/θ − 1/T)
where θ is the reference temperature (298.15 K); T is temperature in Kelvin; ΔHθ is enthalpy change at reference temperature; R is 8.314 J K−1 mol−1 and is the universal gas constant.
To complete the thermodynamic picture of the Zn2+/ligand system behavior in NaCl aqueous solution, the Gibbs free energy was calculated from the equilibrium constants, as reported by Equation (10):
ΔG = −RT lnK
From the knowledge of the enthalpy changes and the Gibbs free energy, the T∆S values, as known, were detemined at the same experimental conditions:
TΔS = ΔH − ΔG

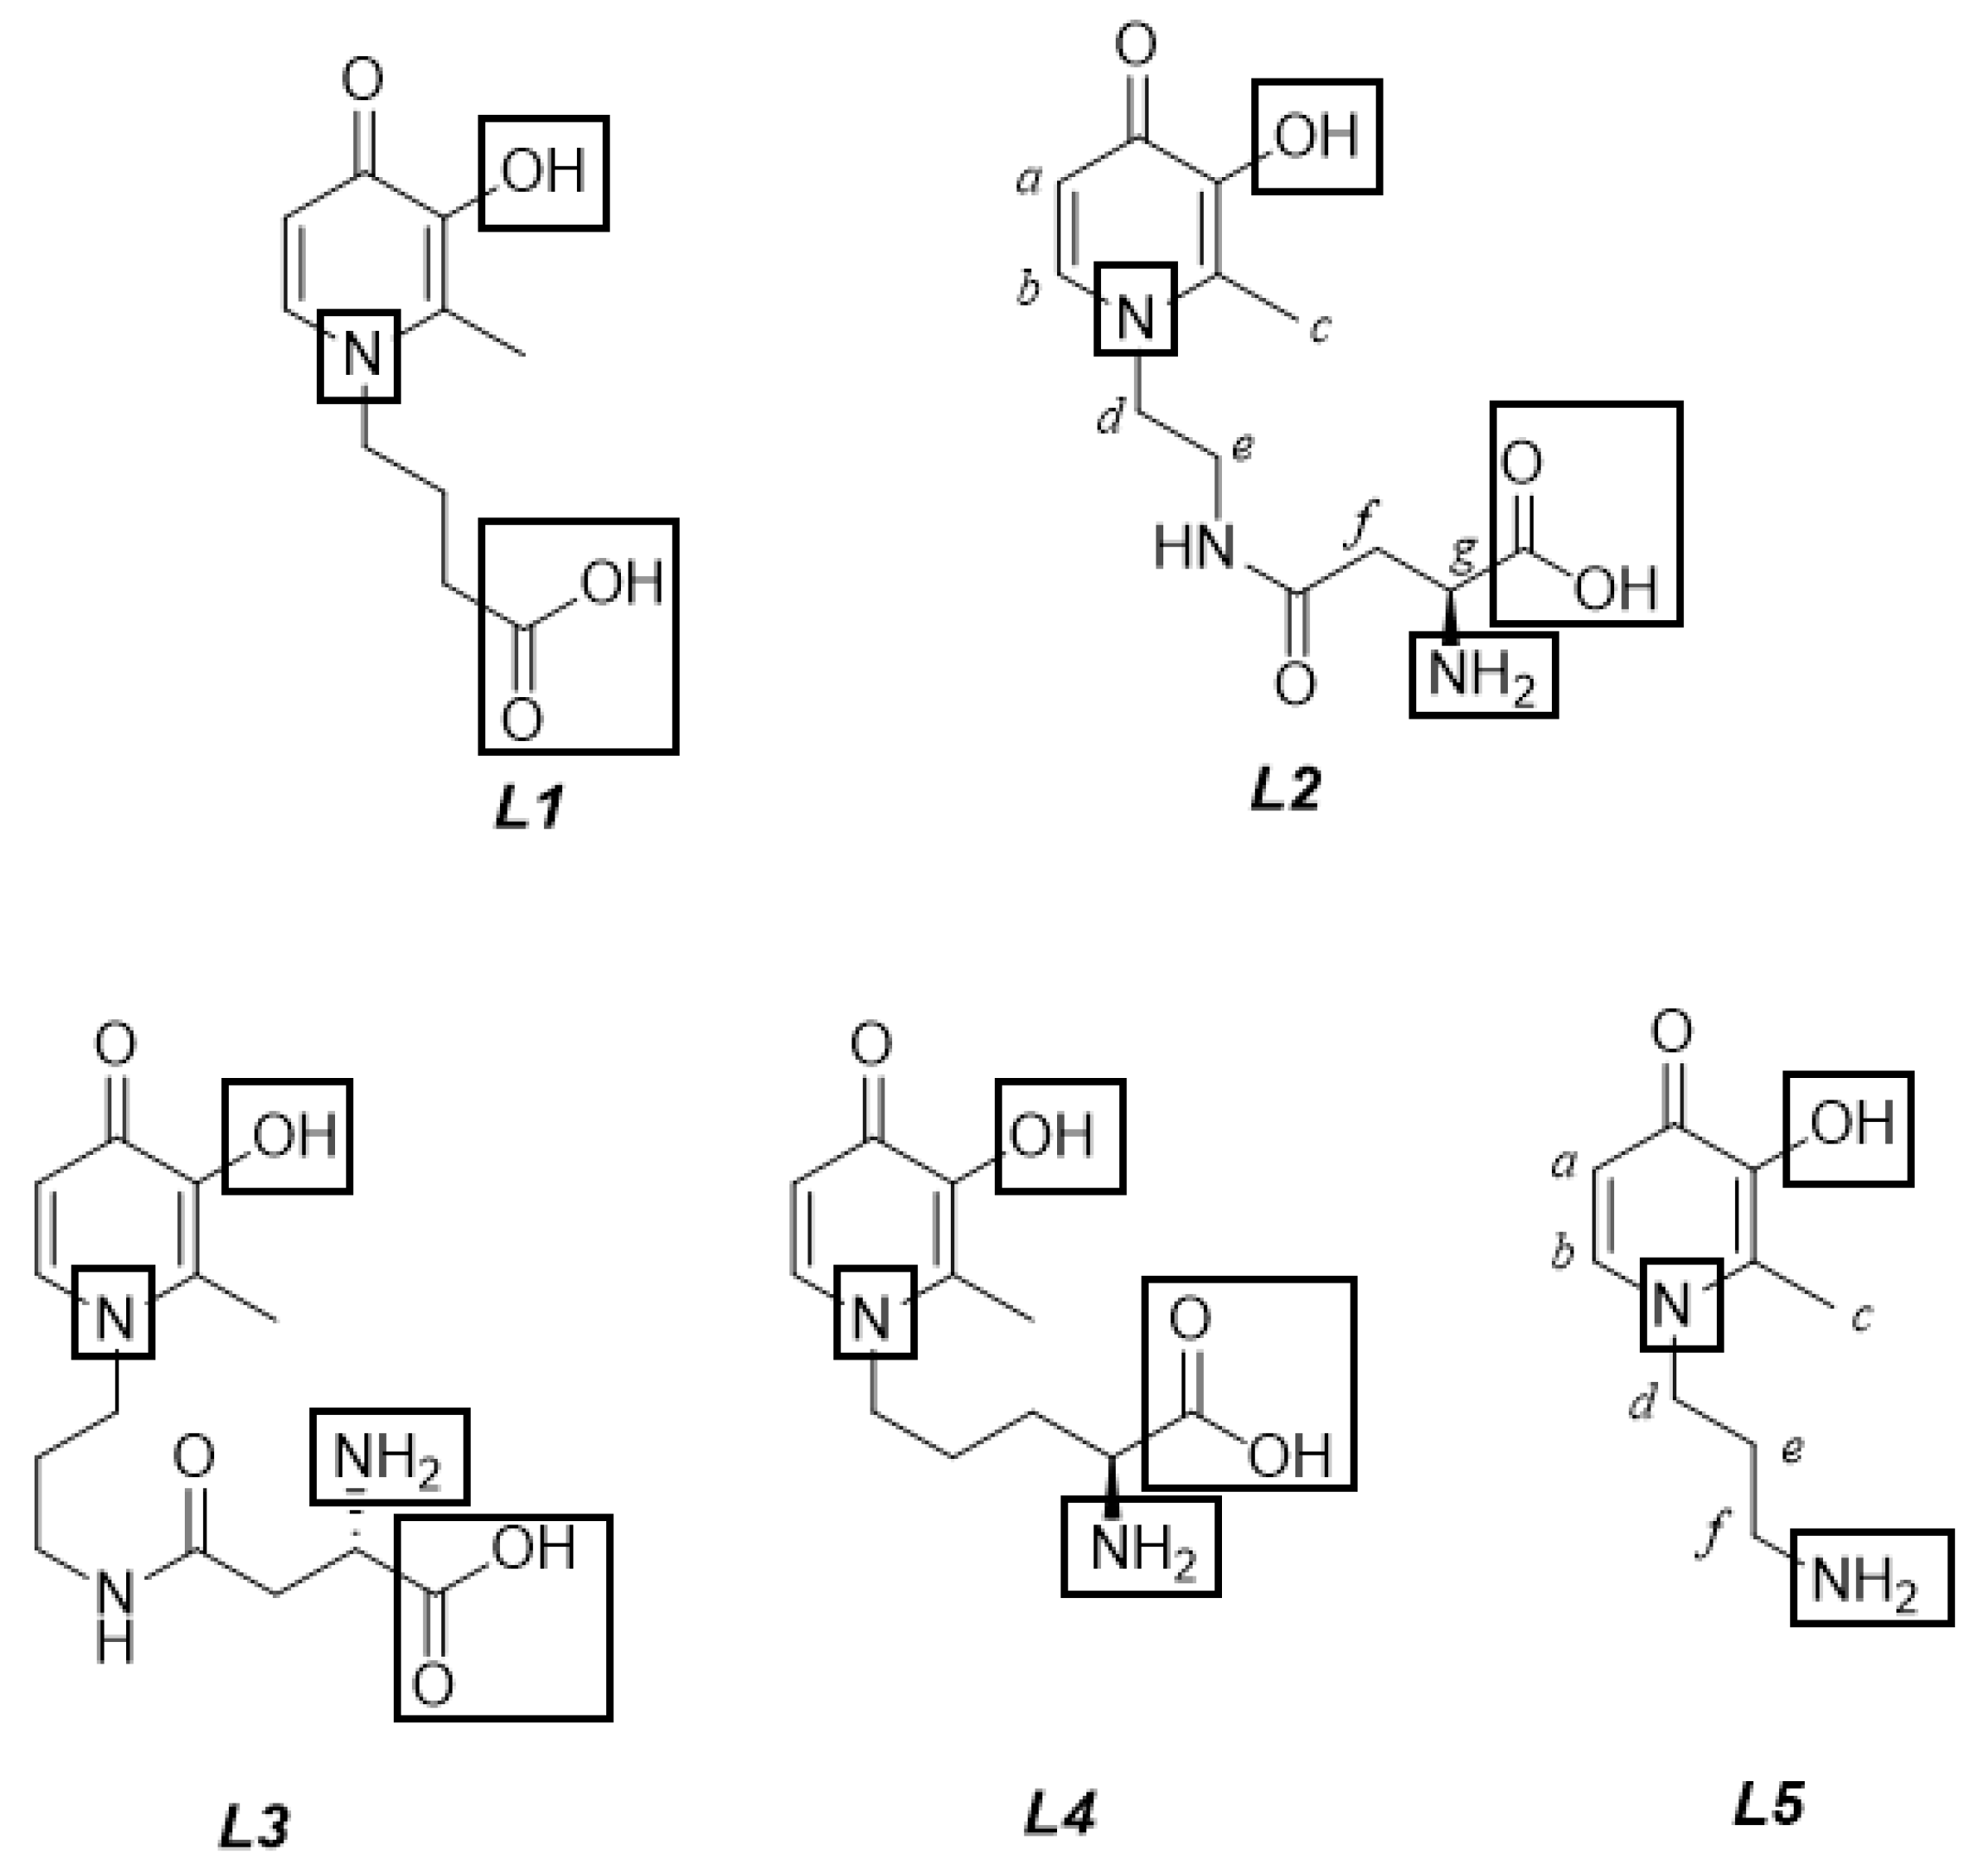
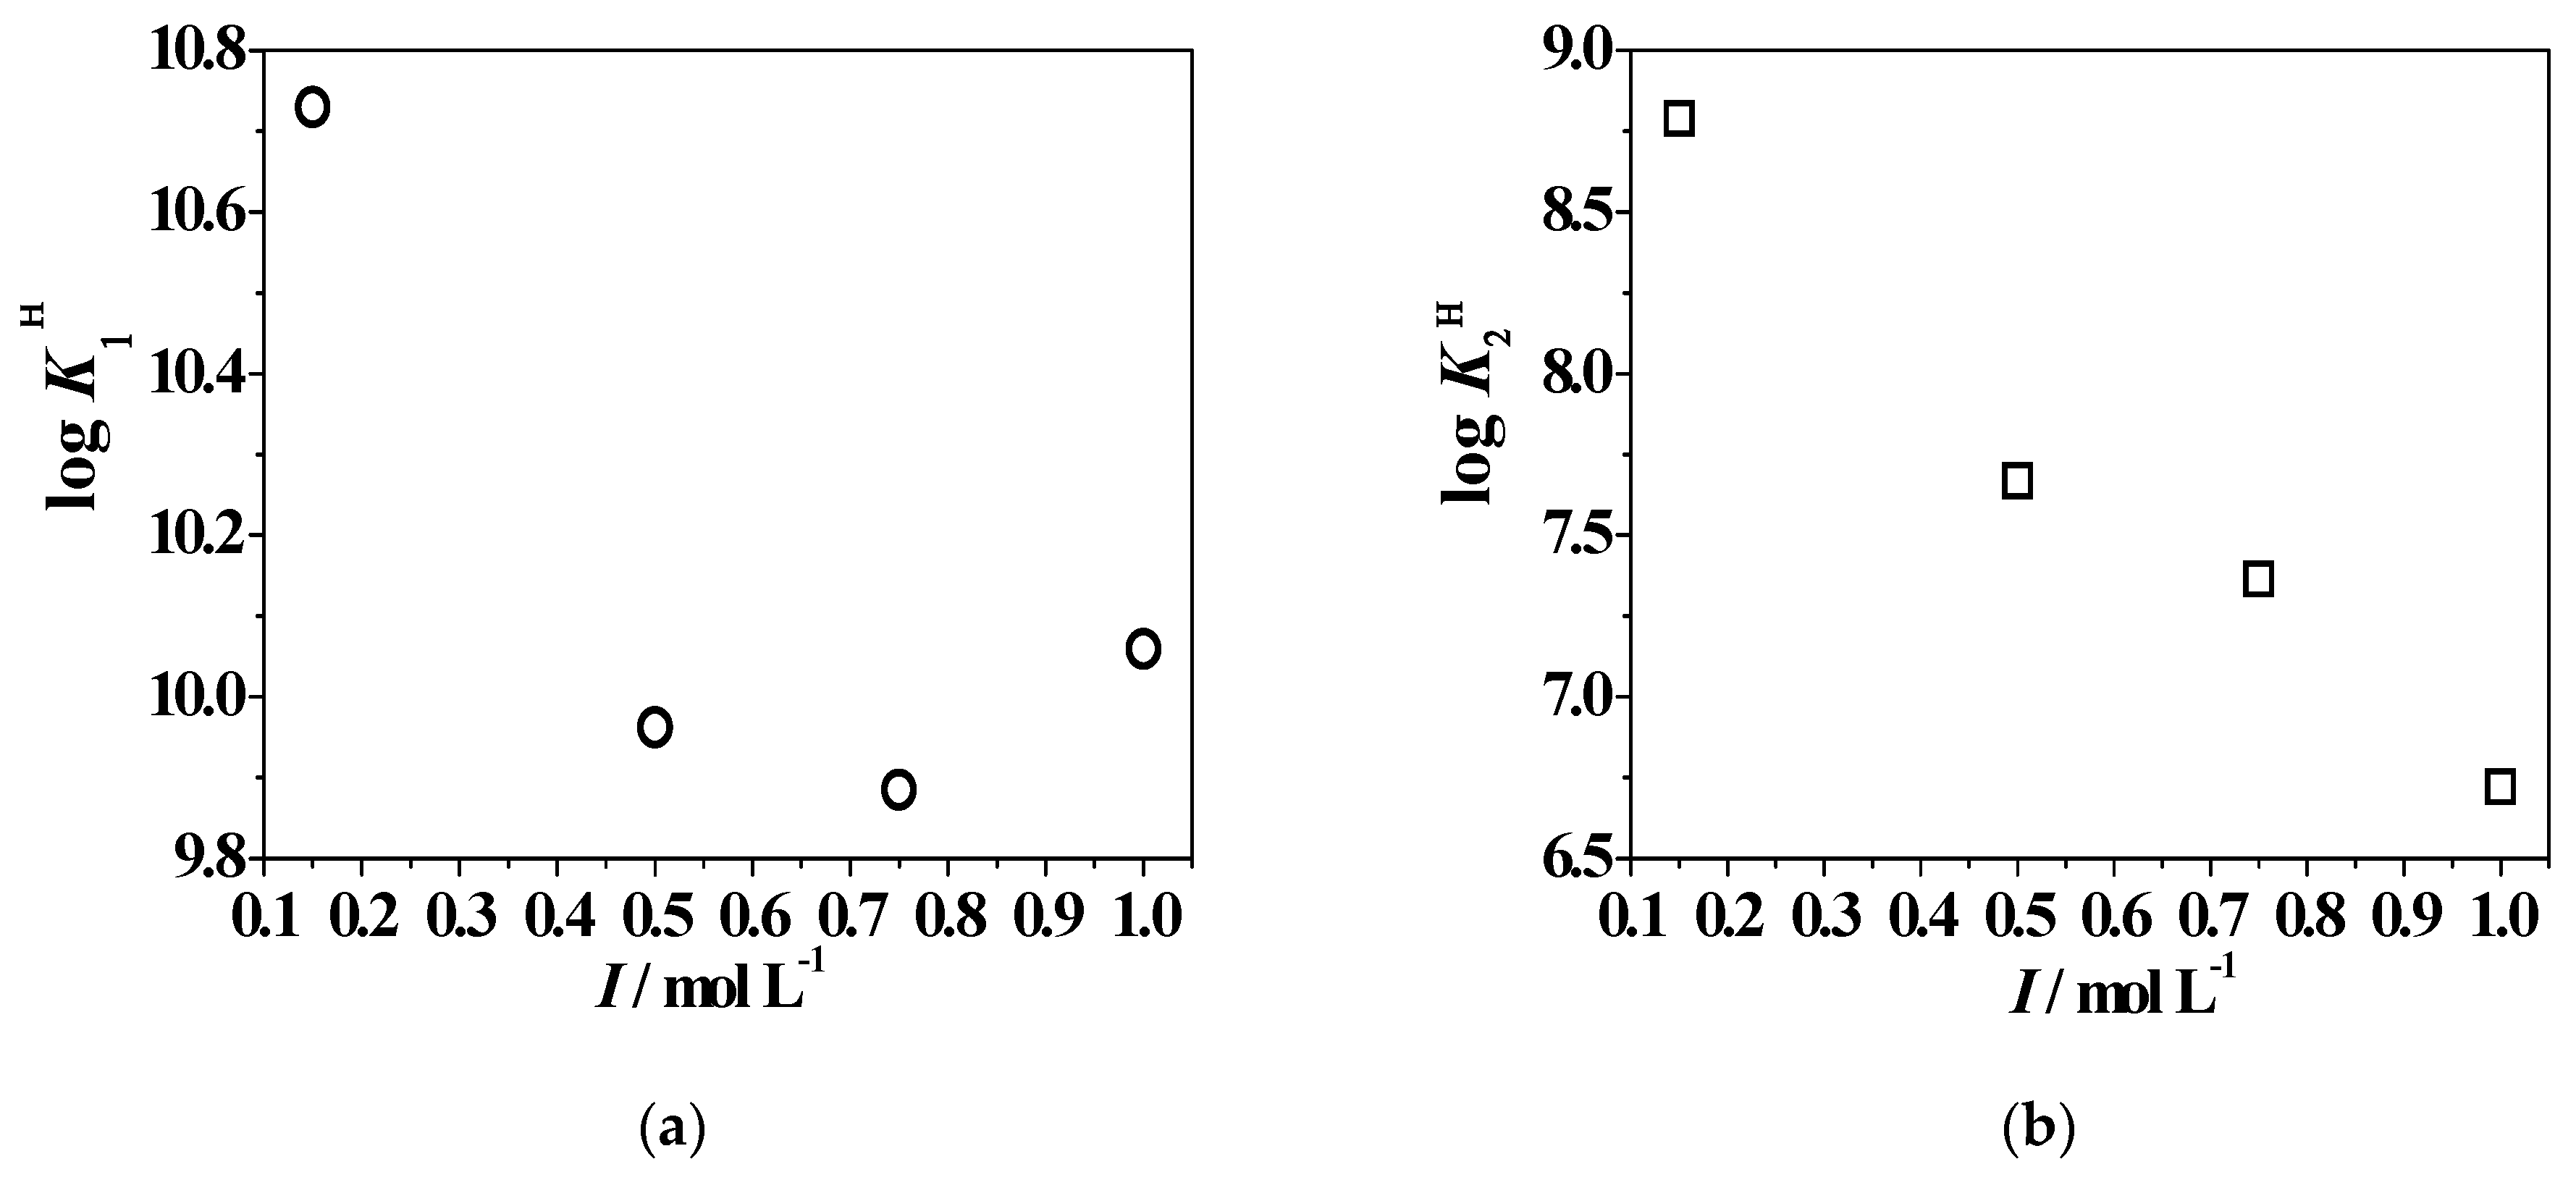
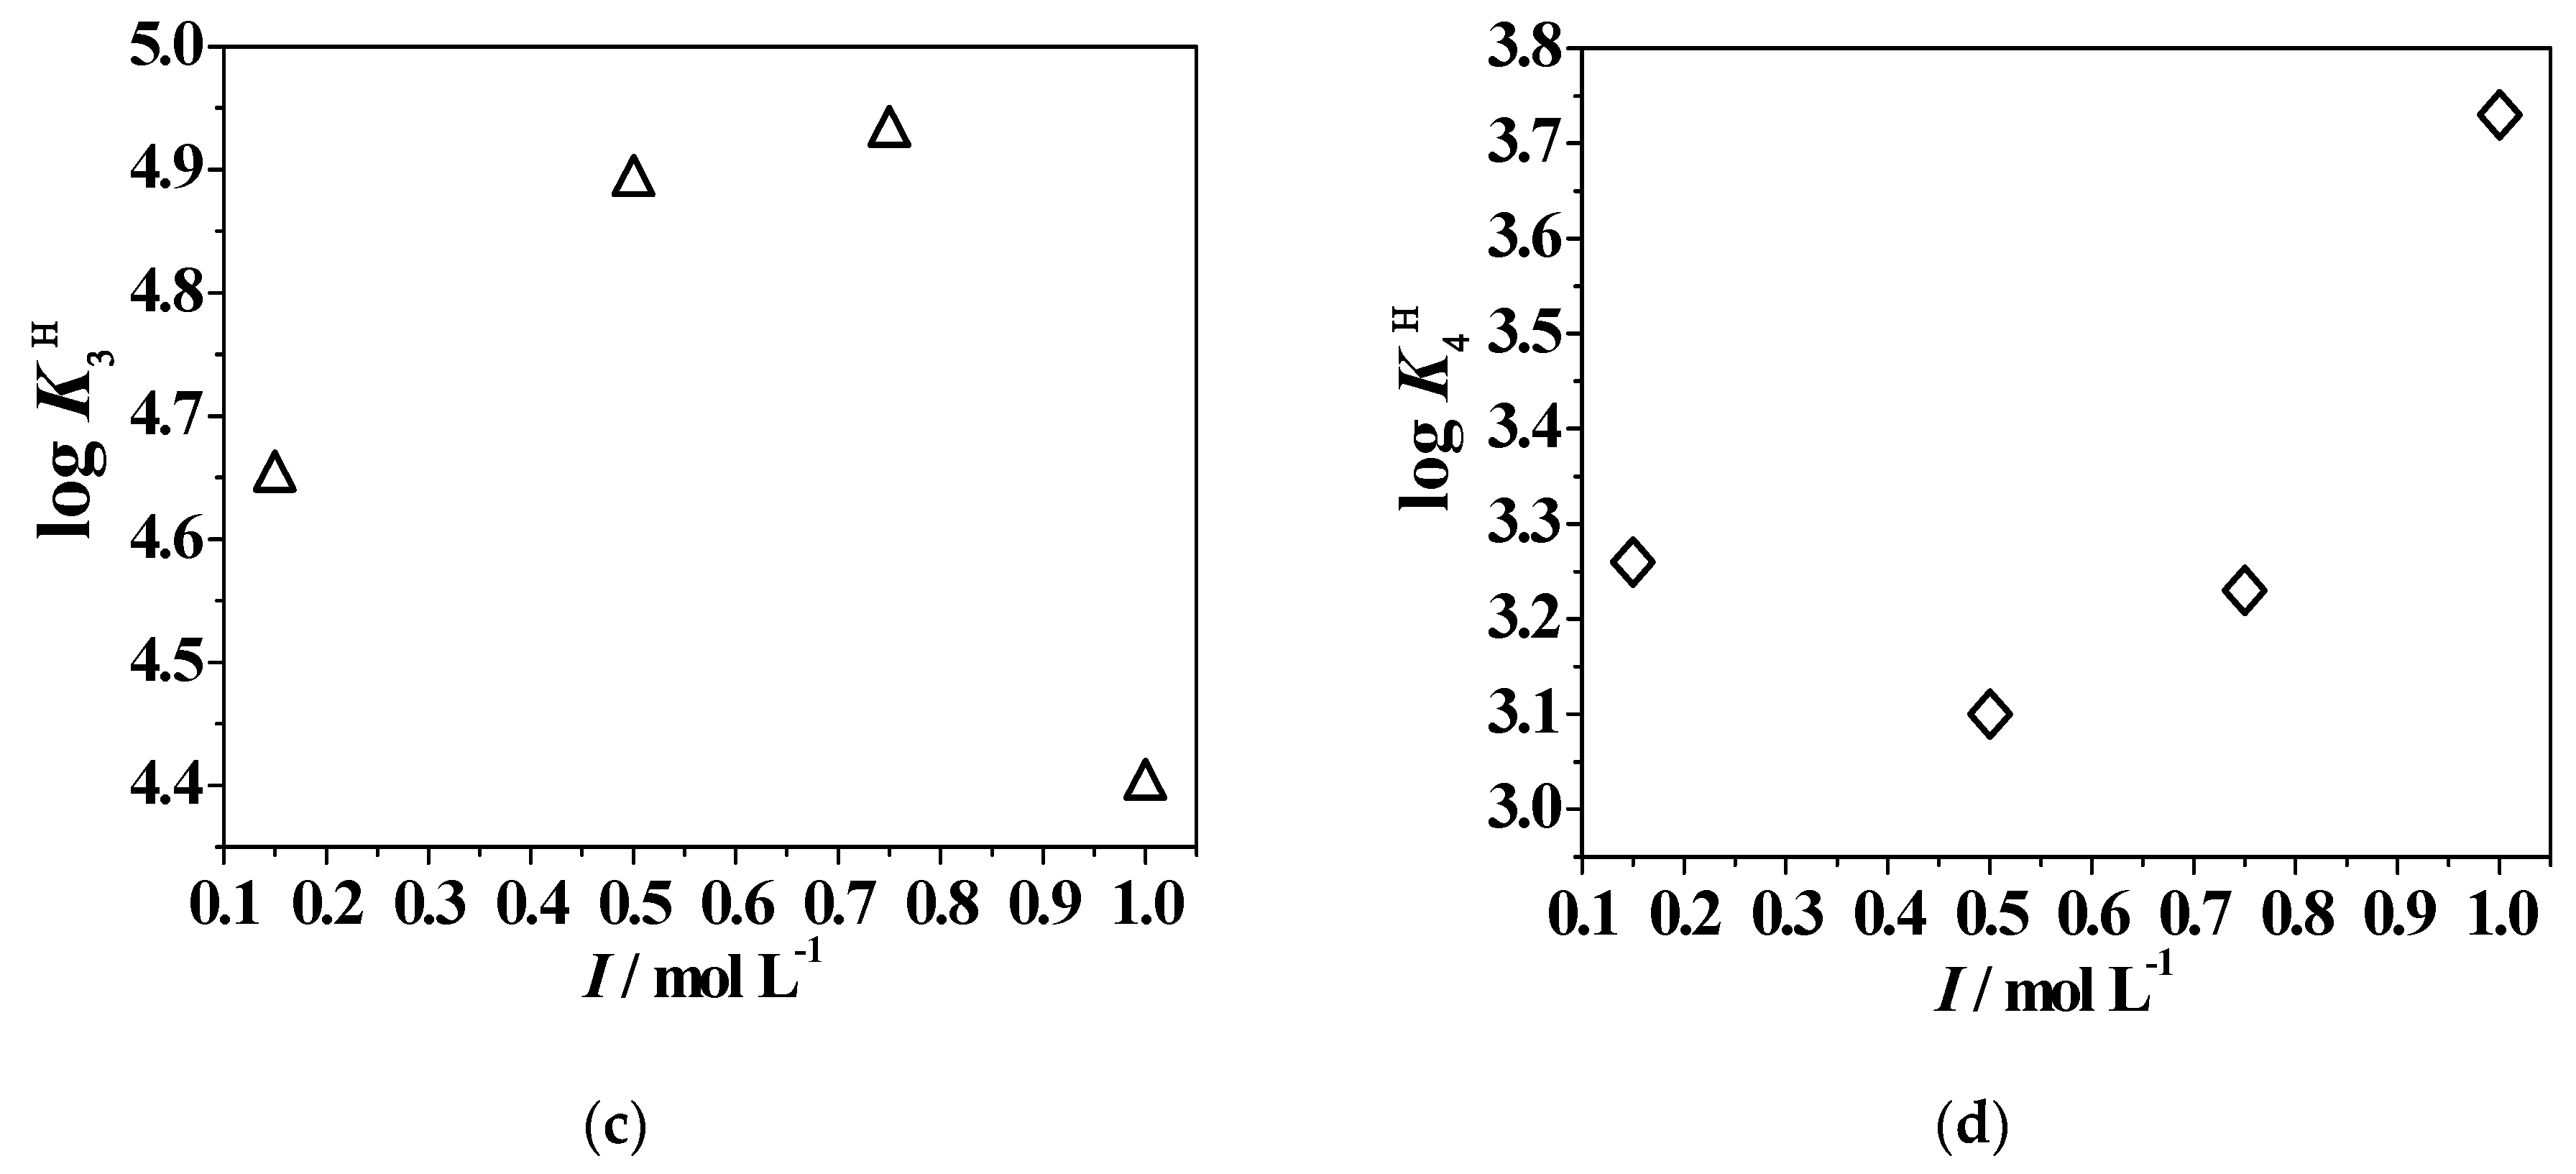
2.2. Protonation Constants of the Ligands

The protonation constants of the ligands (Figure 1) have already been published at I = 0.15 mol L−1 in NaCl(aq) and T = 298.15 K and 310.15 K (Table S1) [8]. As a continuation of this study, the research group undertook a complete investigation on the acid–base properties of two 3-hydroxy-4-pyridinones, namely L2 and L5, in NaCl(aq) at 0.15 ≤ I/mol L−1 ≤ 1.00 and 288.15 ≤ T/K ≤ 310.15.
Both the ligands were synthesized in the Hr(L)0 neutral species form; the possible protonable sites, as shown in Figure 1, can be assigned to:
  • the hydroxyl group of the aromatoid ring;
  • the –NH2 and –COOH groups, potentially present in the alkyl moiety;
  • the pyridinone nitrogen in the N-heterocyclic ring, with the proton supplied by excess of inorganic acid [8].

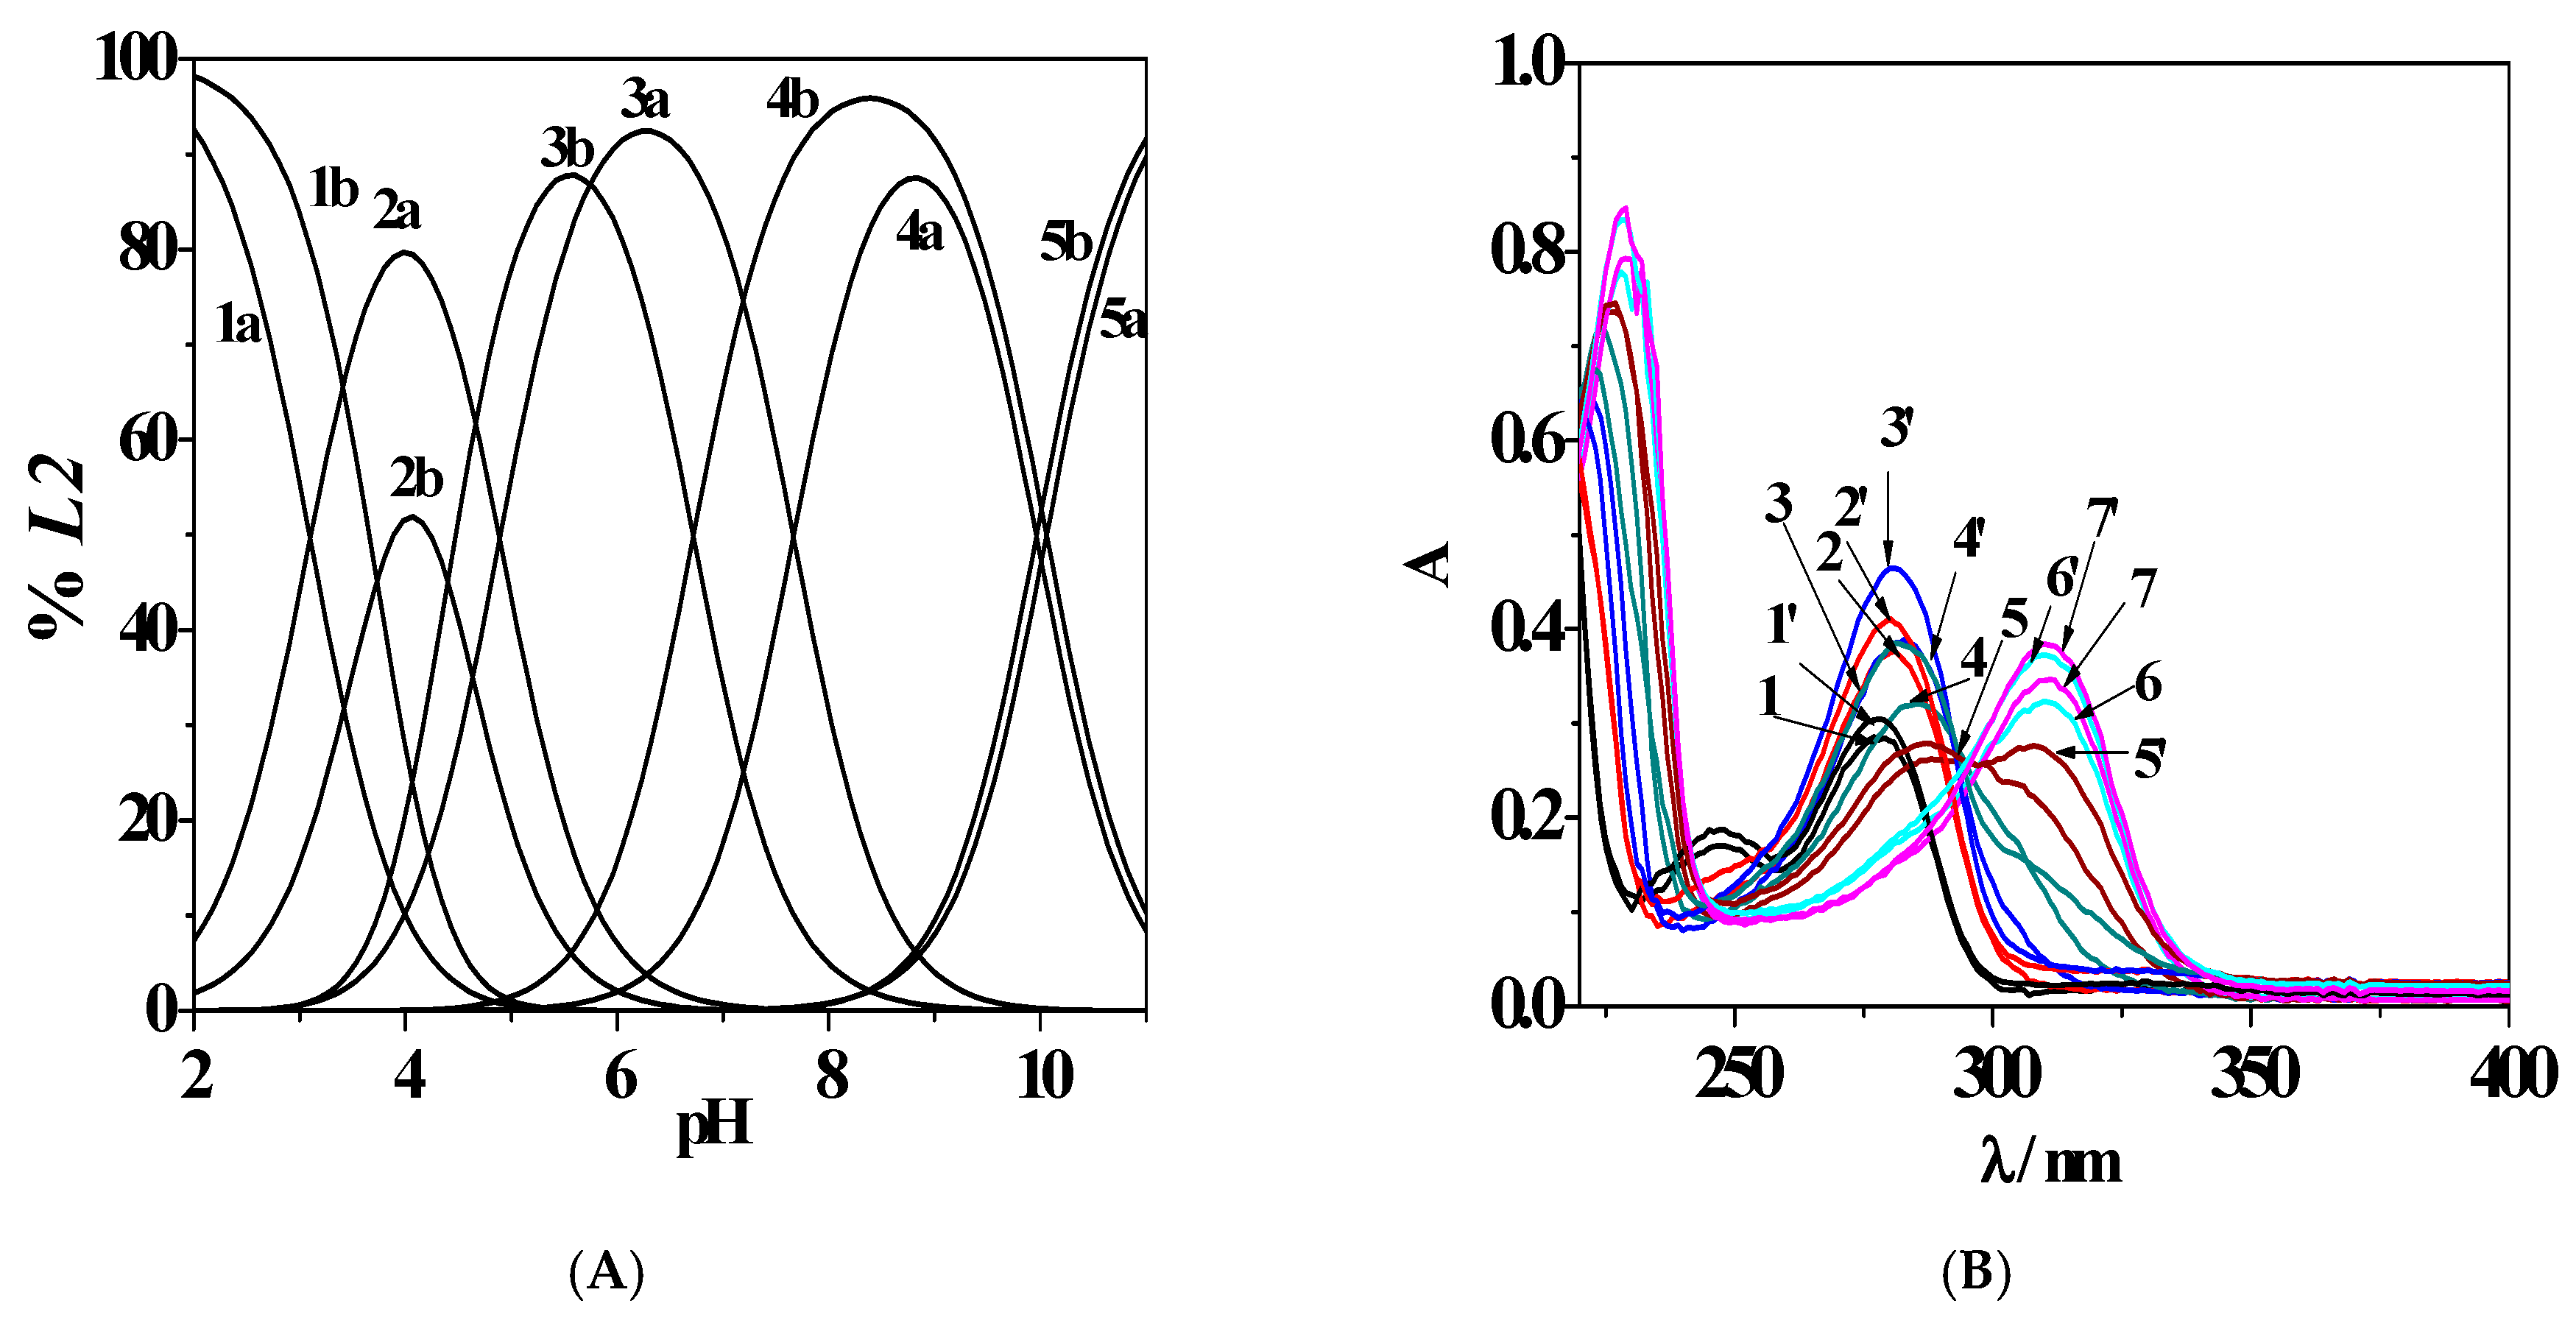
2.2.1. L2 Behavior in Aqueous Solution

L2 ligand is an aspartic acid 3-hydroxy-4-pyridinone hybrid featuring all of the abovementioned protonable groups; its acid–base properties were investigated by means of UV-Vis spectrophotometric measurements, carried out at different ionic strengths and temperatures in NaCl aqueous solution.
Analysis of the experimental data led, in all cases, to the determination of four protonation constants, namely logK1H (9.88–10.99), logK2H (6.03–9.32), logK3H (3.97–4.93), and logK4H (3.06–3.73), as reported in Table 1 and Table S2 (in molar and molal concentration scales, respectively). These were already attributed, by means of 1H NMR titrations, to –OH, –NH2, –COOH, and the pyridinone nitrogen atom, respectively. Table S3 shows the average chemical shift values calculated for each protonated species at I = 0.15 mol L−1 in NaCl(aq) and T = 298.15 K [8].
As examples of the ionic strength effect on the acid–base properties of the ligand, the protonation constant trends vs. I are shown in Figure 2, clearly indicating that the behavior of each protonable site is different than the others. With the exception of –NH2 group, whose logK2H values constantly decrease with increasing ionic strength, the remaining sites undergo a tendency inversion at I = 0.75–1.00 mol L−1 in NaCl(aq).
Furthermore, a comparison between protonated species distribution at T = 298.15 K, I = 0.506 mol L−1, and 1.012 mol L−1 is reported in Figure 3A. The H4(L2)2+ species is present at pH ~ 2.0, with percentages higher than 90% at both experimental conditions, while the H3(L2)+ reaches the 80% and 51% of formation at pH ~ 4.0 with increasing ionic strength. The bis-protonated H2(L2)0(aq) species is characterized by an opposite trend, achieving its maximum (88%) at lower pH (pH ~ 5.5) and with I = 1.012 mol L−1 than with I = 0.506 mol L−1 (pH ~ 6.3, 93%). The H(L2) starts to form at pH ~ 4.2 and reaches 87% and 96% of formation at pH ~ 8.9 and 8.4, with the variable increasing. At last, the completely deprotonated species (L2)2− reaches about 90% at both ionic strength conditions. The effect of this variable can be further examined by the analysis of Figure 3B, where a comparison between the UV-Vis titration curves is reported, recorded at the same experimental conditions as those used to draw the distribution diagram.
The absorbance spectra vary with pH increase due to the different behaviours of the protonated species. In all cases, as already found at I = 0.15 mol L−1 in NaCl(aq) and T = 298.15 K [8], an absorption band at λmax = 278 nm and pH ~ 2.0 was recorded, featuring an increase of intensity at pH ~ 4.5 and 4.9 at I = 0.506 mol L−1 and 1.012 mol L−1, respectively. A batochromic shift and the formation of different isosbestic points were noticed. Furthermore, a general intensity increase of each UV-Vis absorbance maximum with increasing ionic strength was observed across the pH range investigated, probably due to a noteworthy contribution of the ionic medium to the ligand speciation in aqueous solution.
The deconvolution of the UV-Vis spectrophotometric data allowed us to calculate the molar absorbivities (ε/mol−1 L cm−1) of each species; as an example, the ε variation with pH is reported in Figure S1 at T = 298.15 K and I = 0.506 mol L−1 and 1.012 mol L−1 in NaCl(aq). The values of the molar absorbivities in these conditions are:
  • εmax(H4(L2)2+) = 5221 and 5742 at λmax = 278 nm with increasing ionic increasing;
  • εmax(H3(L2)+) = 8756 and 9400 at λmax = 291 nm, I = 0.506 mol L−1 and 1.012 mol L−1, respectively;
  • εmax(H2(L2)0(aq)) = 7468 and 9681 at λmax = 284 nm and 281 nm, respectively;
  • εmax(H(L2)) = 5016 at λmax = 296 nm and both the variable conditions;
  • εmax((L2)2−) = 7913 and 8276 at λmax = 311 nm, with increasing ionic strength.
To investigate the effect of temperature on the speciation of the ligands in NaCl aqueous solution, UV-Vis spectrophotometric measurements were performed at I = 0.15 mol L−1 and T = 288.15 K, which together with the data already published in the literature at T = 298.15 K and 310.15 K [8] showed a trend for protonation constants with the considered variables. Analyzing the data reported in Table 1 and Table S1 (in molar and molal concentration scales, respectively), a different tendency was found for the hydroxyl group than for the others (carboxylic, amino, and pyridinone nitrogen groups); logK1H values increased with temperature, while for the other protonation constants an opposite trend can be observed. In particular, the significant variation of logK2H for T = 288.15 K–298.15 K and T = 310.15 K could probably be explained by the literature data, which reported a compound similar to L2, mimosine. It was observed that the contribution of the ligand structure to the resonance hybrid leading to a partial positive charge on the pyridinone nitrogen ring [23], together with the possible temperature effect, could cause a noteworthy decrease of protonation constants, attributed to the –NH2 group, in comparison with the typical values usually obtained for this protonable site (logKH ~ 9.0–9.5) [24].
In Figure S2, a comparison between the distribution diagrams of the ligand at I = 0.15 mol L−1 in NaCl(aq), T = 288.15 K, and T = 310.15 K showed that the species formation percentages decrease with temperature increase. In physiological conditions, they are shifted towards lower pH values, with the exception of the H(L2) species, which, as already evidenced, displays different behavior than the other ones compared with the considered variable.

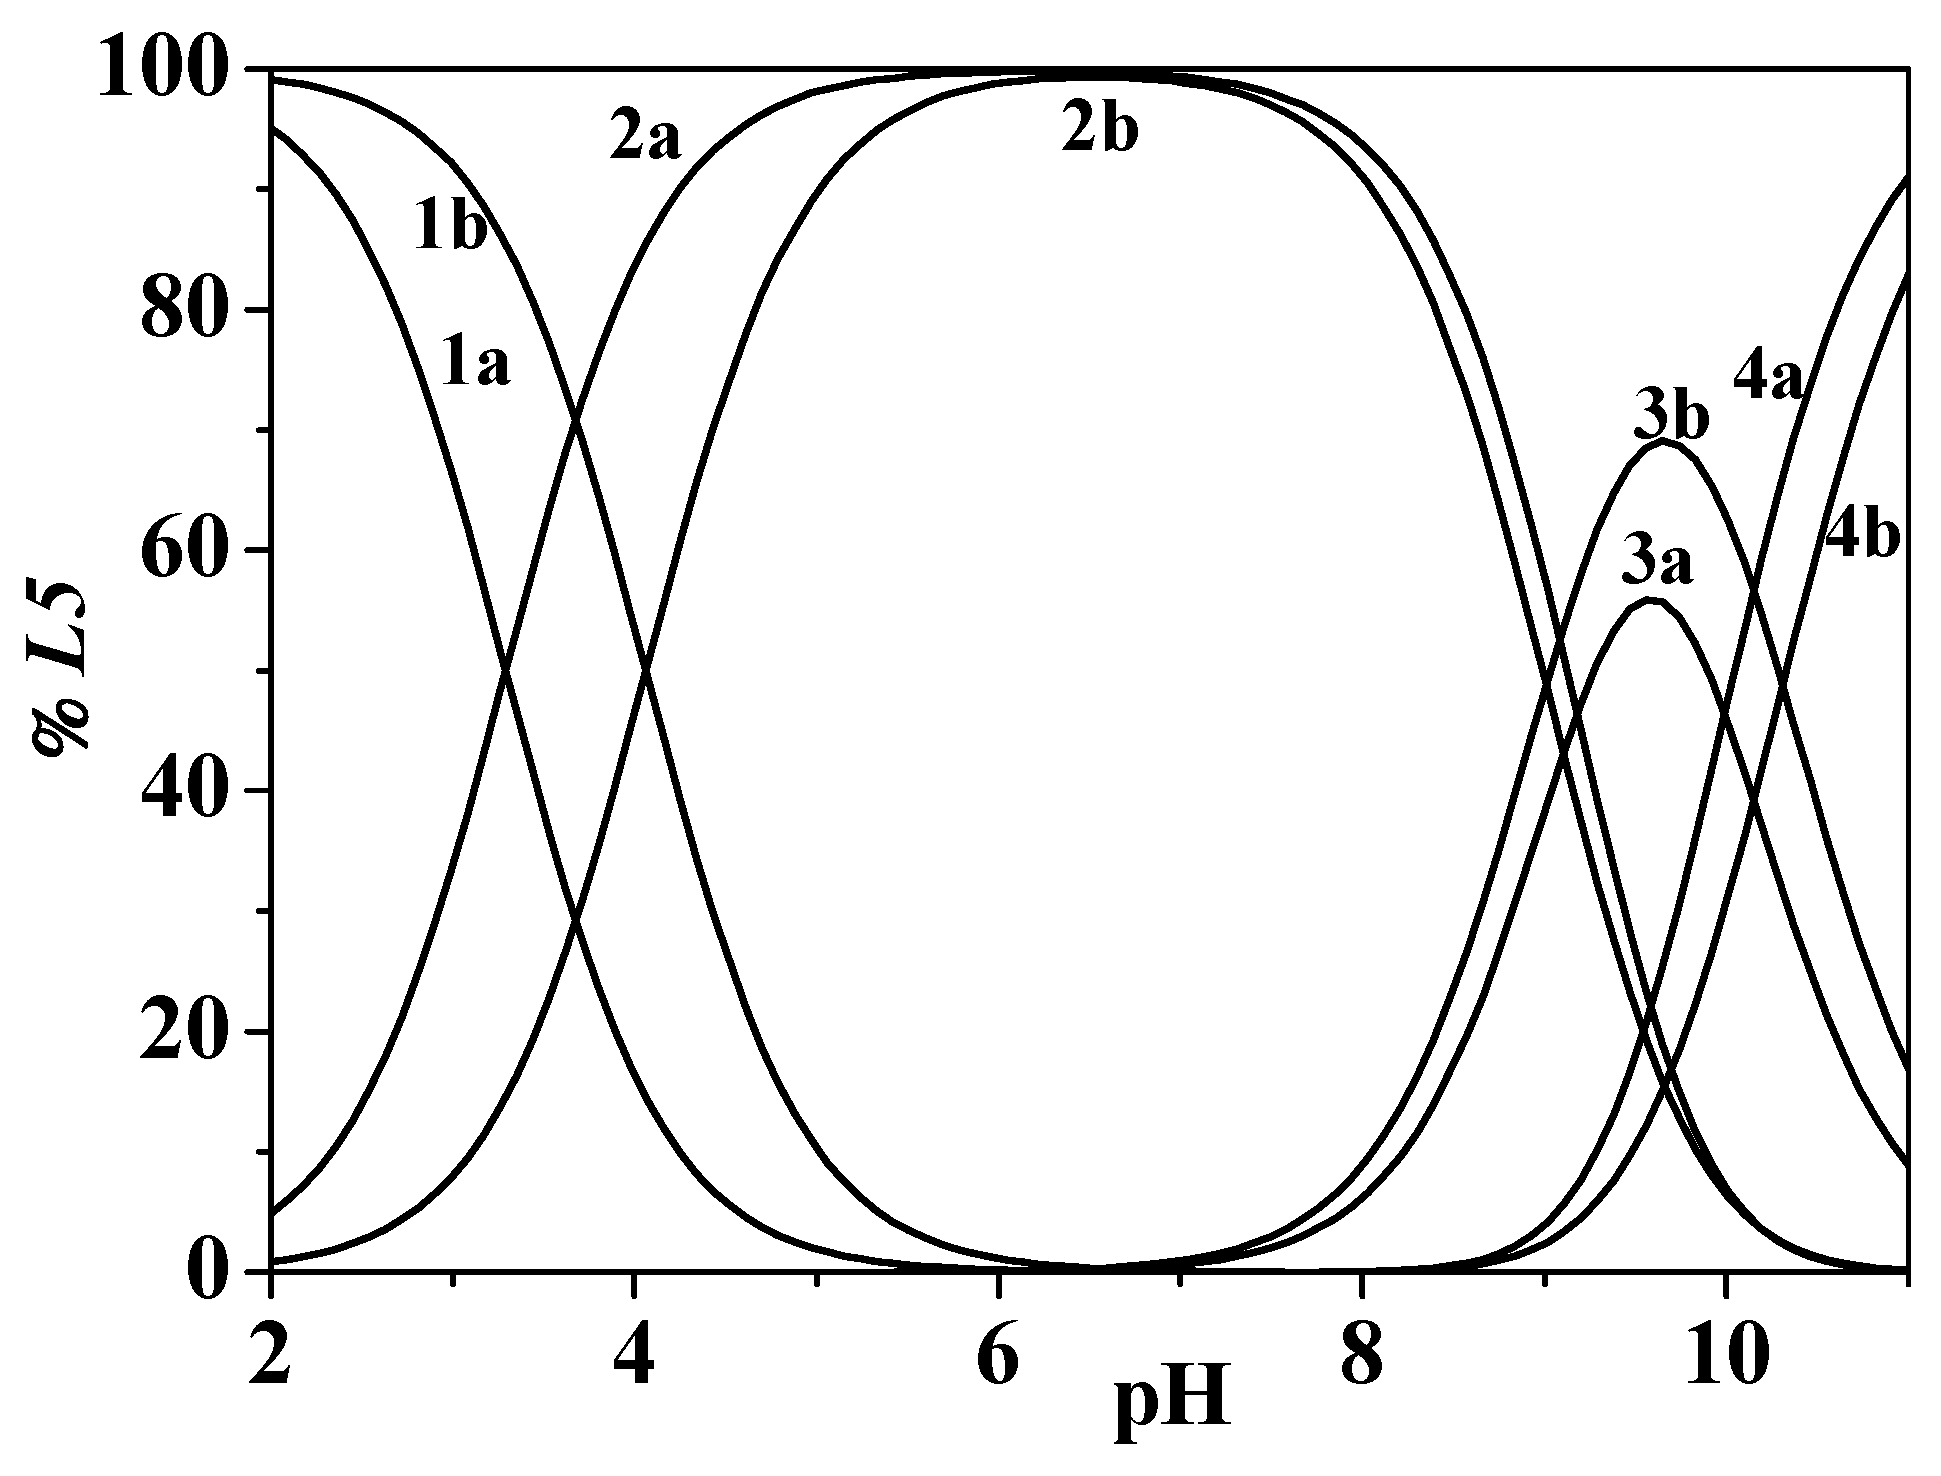
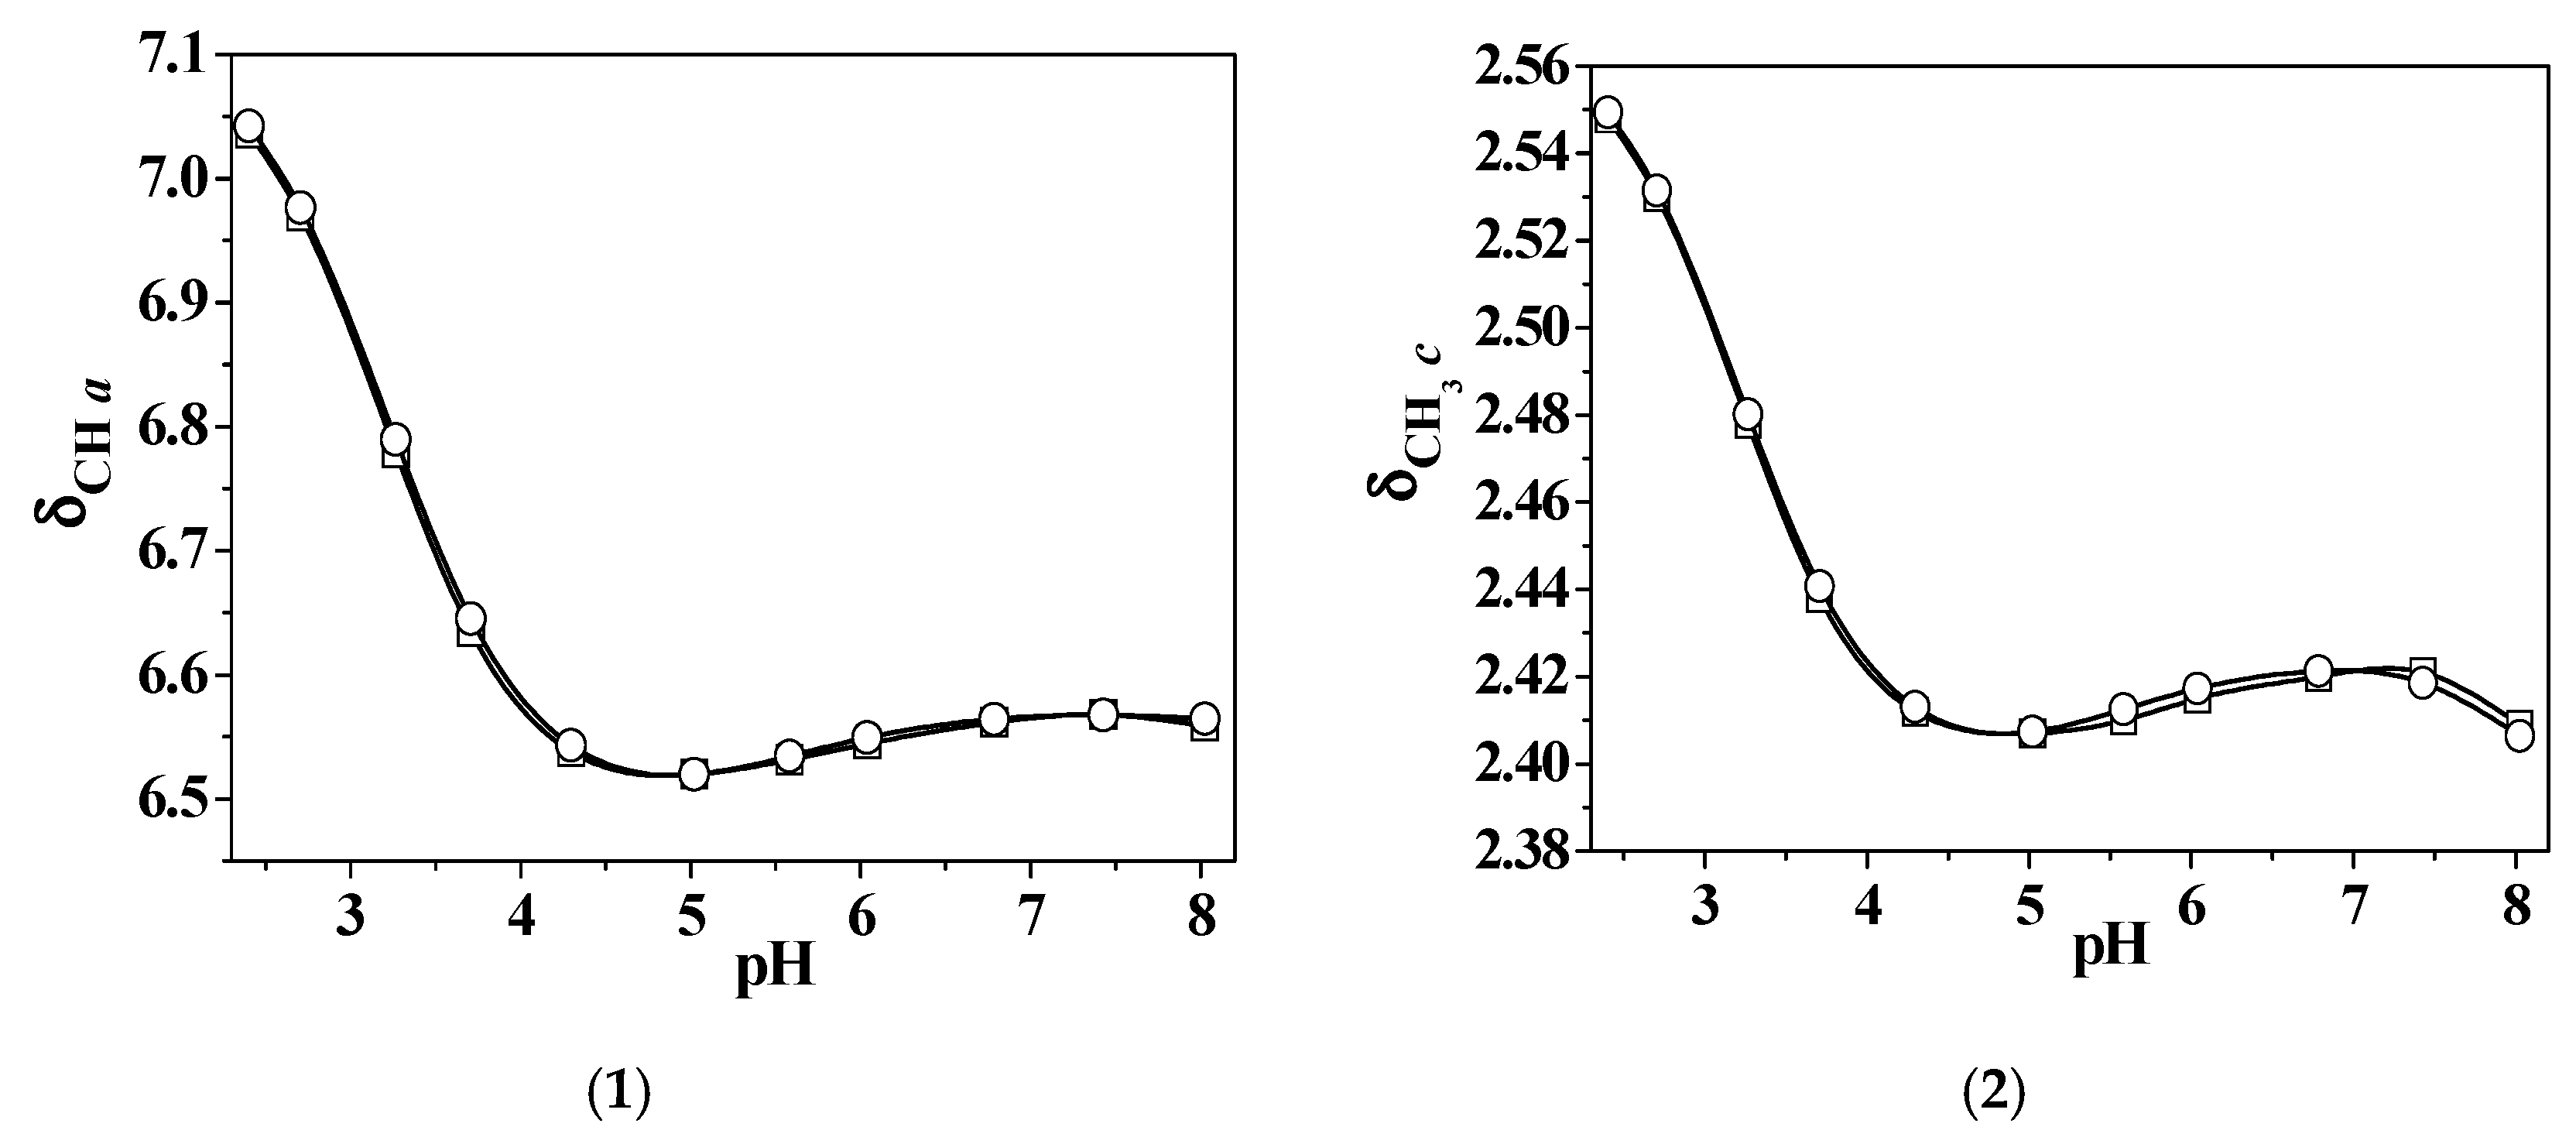
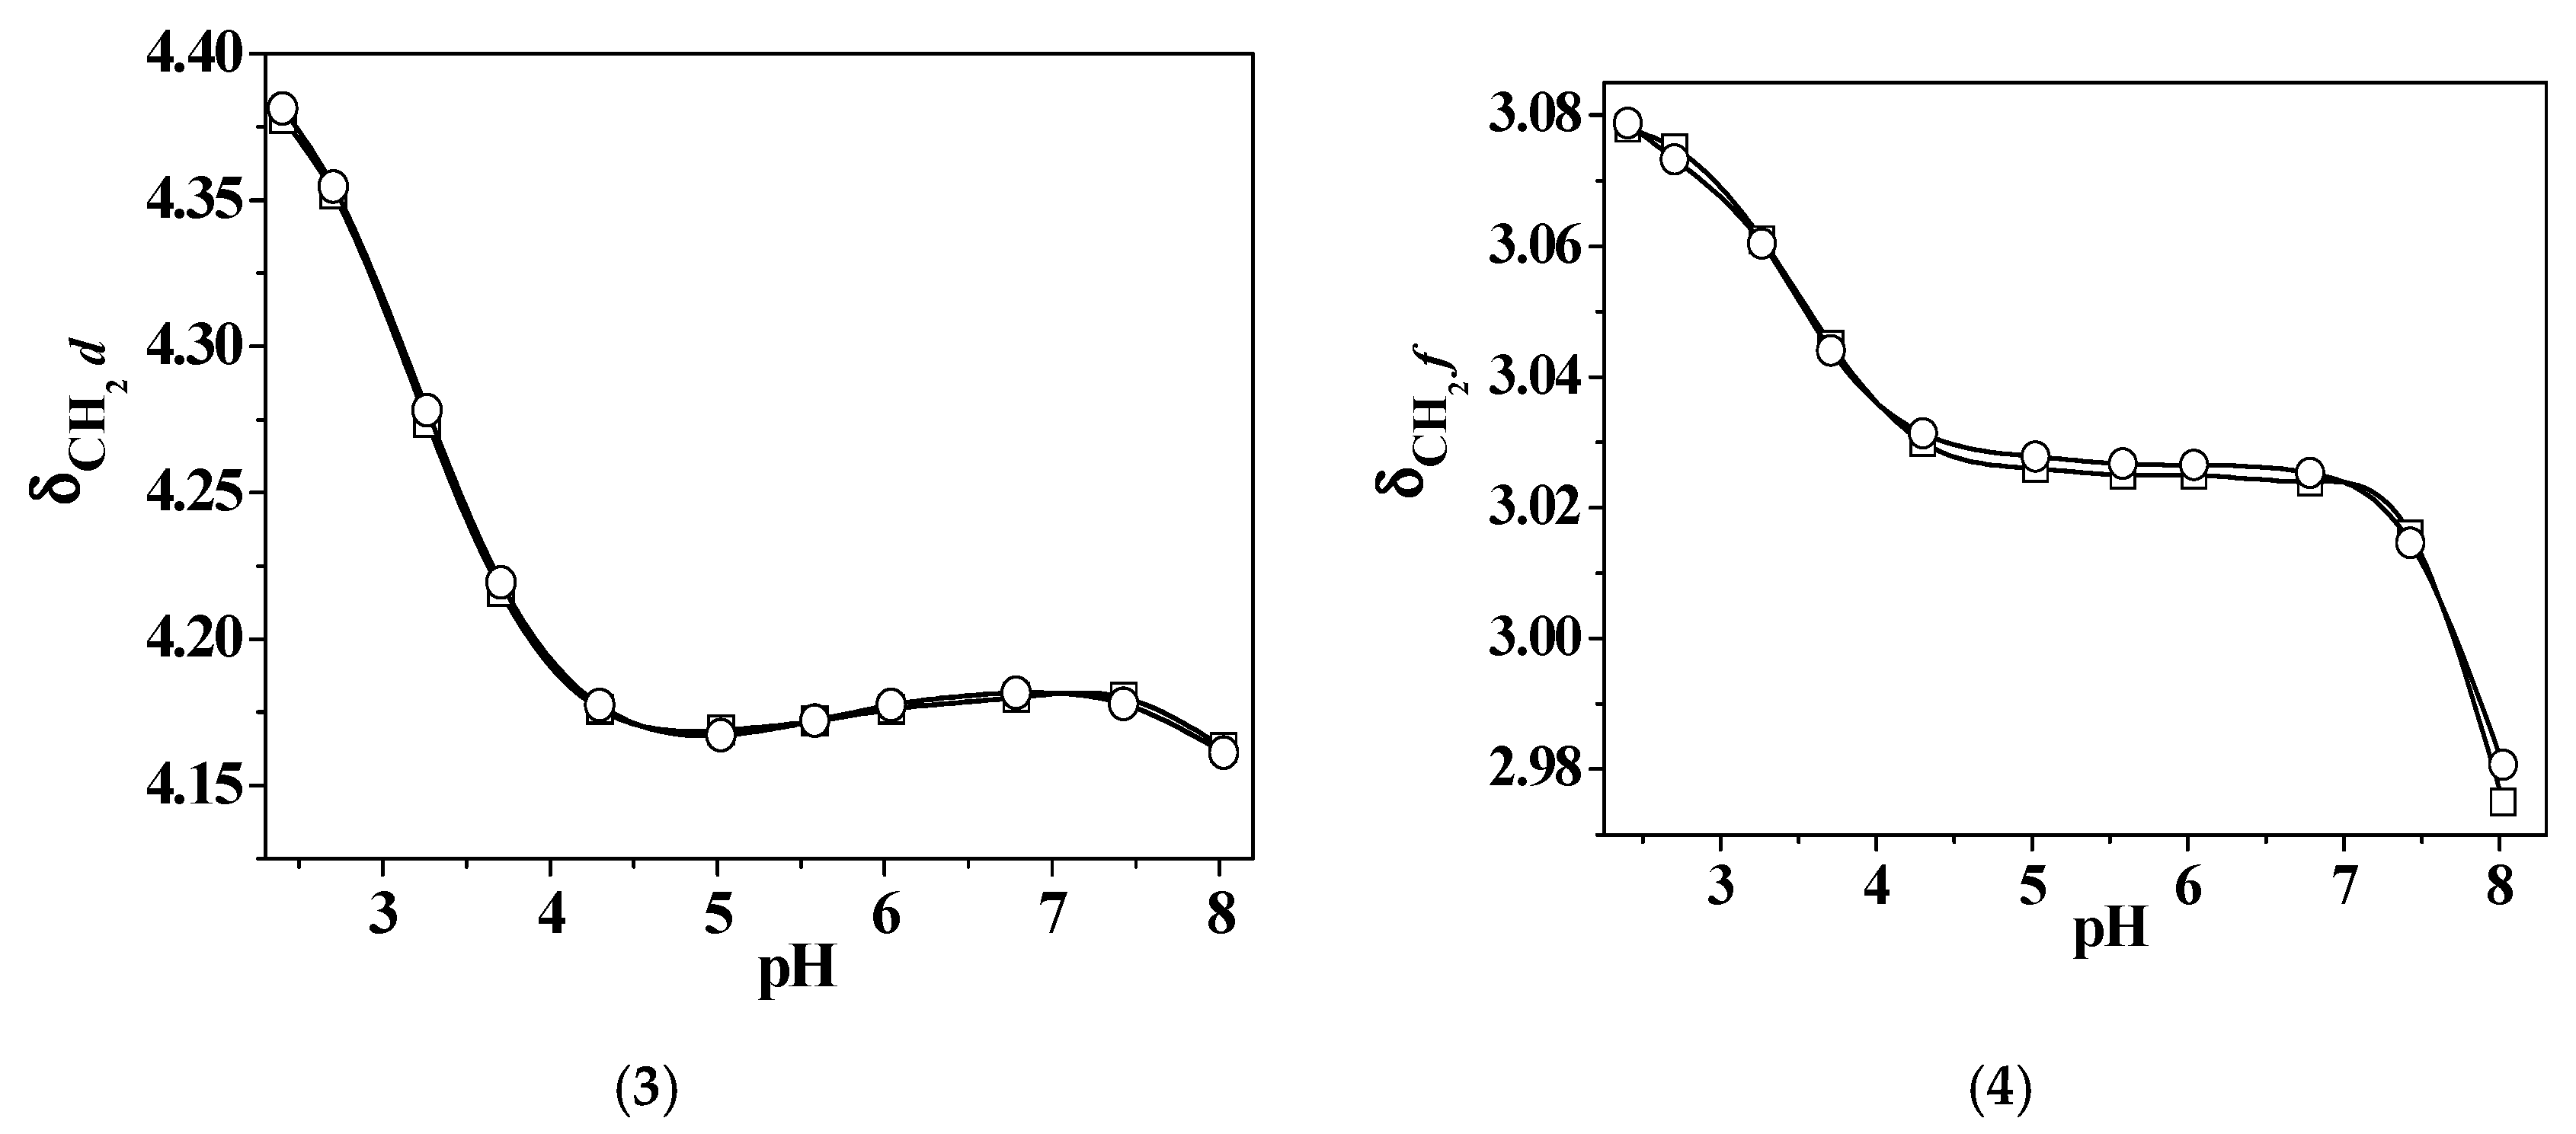
2.2.2. L5 Ligand Protonation

The second 3-hydroxy-4-pyridinone under study, L5, shown in Figure 1, features three protonable moieties, namely the hydroxyl group, the pyridinone nitrogen atom, and the terminal amine group of the alkylic chain.
1H NMR measurements were carried out at I = 0.15 mol L−1 in NaCl(aq) and T = 298.15 K to further analyze L5 acid–base behavior, which was previously investigated using UV-Vis spectrophotometric and spectrofluorimetric techniques [8]. The protonation constants (Table 1), refined using the HypNMR computer program, were in good agreement with those previously reported [8]. The collected spectra show a single set of signals shifted upfield with pH increase. As expected, all the resonances of protons closer to the pyridinone nitrogen of the aromatoid ring are more or less shielded in the pH range 2–4.5, thus confirming that this is the first group to be deprotonated, as already observed in similar ligands [8]. In detail, the a and b signals are characterized by a comparable upfield shift (0.48 and 0.33 ppm, respectively) in the cited pH range, whereas they do not change to a great extent from pH 4.5 to 7.5 and start to decrease again at alkaline pH. A less significant upfield shift can also be observed for c and d protons at pH < 4.5, and once again, the chemical shifts follow the behavior already discussed for the pyridinone protons. The other two signals, namely e and f, show an opposite trend with pH increase, since they start to considerably change from neutral pH and greater, confirming the deprotonation sequence already reported.
From the speciation data it is known that at pH ~ 2.0 the H3(L5)2+ species should be present in solution with a percentage of ca. 95%, whilst between 5.2 and 6.4 the most abundant species should be the H2(L5)+, reaching 99.8%; the spectra recorded in these conditions were compared with the calculated chemical shifts obtained by HypNMR for the same species. The calculated δ values for H3(L5)2+ and H2(L5)+, listed in Table S3, are in excellent agreement with the ones observed in the spectra recorded at the pH level where these species reach the maxima. In addition, Figure S3 shows the almost total overlap between observed and calculated chemical shifts for some selected nuclei.
The acid–base properties of L5 were also studied by potentiometric measurements performed under different ionic strength and temperature conditions in NaCl(aq). The treatment of the experimental data allowed the determination of three protonation constants (Table 1 and Table S1): logK1H (9.79–11.20), logK2H (5.96–6.92), and logK3H (3.00–4.06).
The effect of the ionic strength on the protonation of the L5 ligand can be observed in Figure 4 and Figure S4. In the first case, the trend of logKrH vs. I is reported, showing for this ligand a behavior similar to that found for analogous functional groups in L2. Therefore, the absence of the amidic moiety or the carboxyl group in the L5 ligand structure, with respect to the first ligand, would not seem to influence the effect of theionic strength increasing on the acid–base properties of the 3-hydroxy-4-pyridinone.
In Figure 4, the ligand speciation diagrams, drawn at T = 298.15 K, I = 0.473 mol L−1, and I = 1.008 mol L−1 in NaCl(aq), show that all the species are uniformly distributed along the pH range investigated. The H3(L5)2+ species is present in solution at pH ~ 2.0, reaching more than 90% in both the experimental conditions. This species achieves the maximum formation percentage at pH ~ 6.4; at pH ~ 9.6, H(L5)0(aq) reaches 56% and 70% and (L5) reaches 91% and 83% at I = 0.473 mol L−1 and I = 1.008 mol L−1, respectively. Therefore, this figure shows a trend of protonations occurring at slightly higher pH values with ionic strength increasing.
Regarding the temperature effect, potentiometric data determined at I = 0.15 mol L−1 in NaCl(aq) and T = 288.15 K allowed us to obtain a trend for protonation constants, together with the values already determined at T = 298.15 K and in physiological conditions [8]. Table 1 and Table S1 show that logK1H values increase from the lowest temperature to T = 298.15 K, followed by an inversion of tendency at T = 310.15 K. For logK2H, the variation of some logarithmic units on the protonation constant at physiological temperature was already discussed in the previous subparagraph (L2 behavior in aqueous solution) [23]. LogK3H, attributed to the pyridinone nitrogen atom, similar to the same moiety in L2, is characterized by a decrease with variable increase. To better observe the temperature effect on the speciation of the ligand in NaCl aqueous solution, in Figure S5 a comparison between the distribution diagrams of L5 at I = 0.15 mol L−1 in NaCl(aq), T = 288.15 K, and T = 310.15 K is depicted. The figure clearly indicates that the formation of protonated species occurs at higher pH values with temperature increasing.

2.3. Hydrolysis of the Metal Cation

The acid–base properties of Zn2+ in NaCl(aq) were already known and have been reported in the literature under different ionic strength and temperature conditions (Table S4) [6,25,26].

2.4. Binding Ability Towards Zn2+

The investigation on the Zn2+ interactions with the bifunctional 3-hydroxy-4-pyridinones (L1L5) led to the determination of species with different stoichiometry (ZnpLqHr(2p+r−qz)). The best possible speciation schemes were selected considering different criteria, such as:
  • simplicity and probability of the model;
  • formation percentages of the species across the pH range under investigation;
  • statistical parameters (standard deviation on logβpqr values and on the fitting values of the systems);
  • values of corresponding ratios with single variances in comparison with those from the accepted model.
The high number of experiments performed (and of experimental points collected) showed the differences in variance between the accepted model and other models to be significant.
In Table 2, the stability constants of all of the Zn2+/3-hydroxy-4-pyridinones complex species are reported at I = 0.15 mol L−1 in NaCl(aq) and T = 298.15 K. The experimental data, whenever possible, were determined by means of potentiometry (1st column), UV–Vis spectrophotometry (2nd column), and 1H NMR spectroscopy (3rd column); the average (4th column) of the obtained values was also calculated. The measurements were carried out in the pH ranges of 2.0–10.5 for potentiometric and UV–Vis investigations, and 2.0–8.1 for 1H NMR ones.
As can be inferred from the analysis in Table 2, for the mentioned experimental conditions, a trend of stability of the species can be observed due to a common complex, namely ZnL(2−z):
L4 > L3 > L5 > L2 > L1
This trend could be explained by assuming that the stability of the Zn2+/Lz− systems may be favored by the simultaneous presence on the ligand molecules of carboxylic and amino groups or even different alkyl chains; in fact, there is a decrease with decreasing alkyl chain length (L2) and with the absence of an amino group (L1). In the case of L2 and L5, experiments at 0.15 ≤ I/mol L−1 ≤ 1.00 and 288.15 ≤ T/(K≤ 310.15 were also carried out to give a more complete thermodynamic picture of the Zn2+/ligand systems.

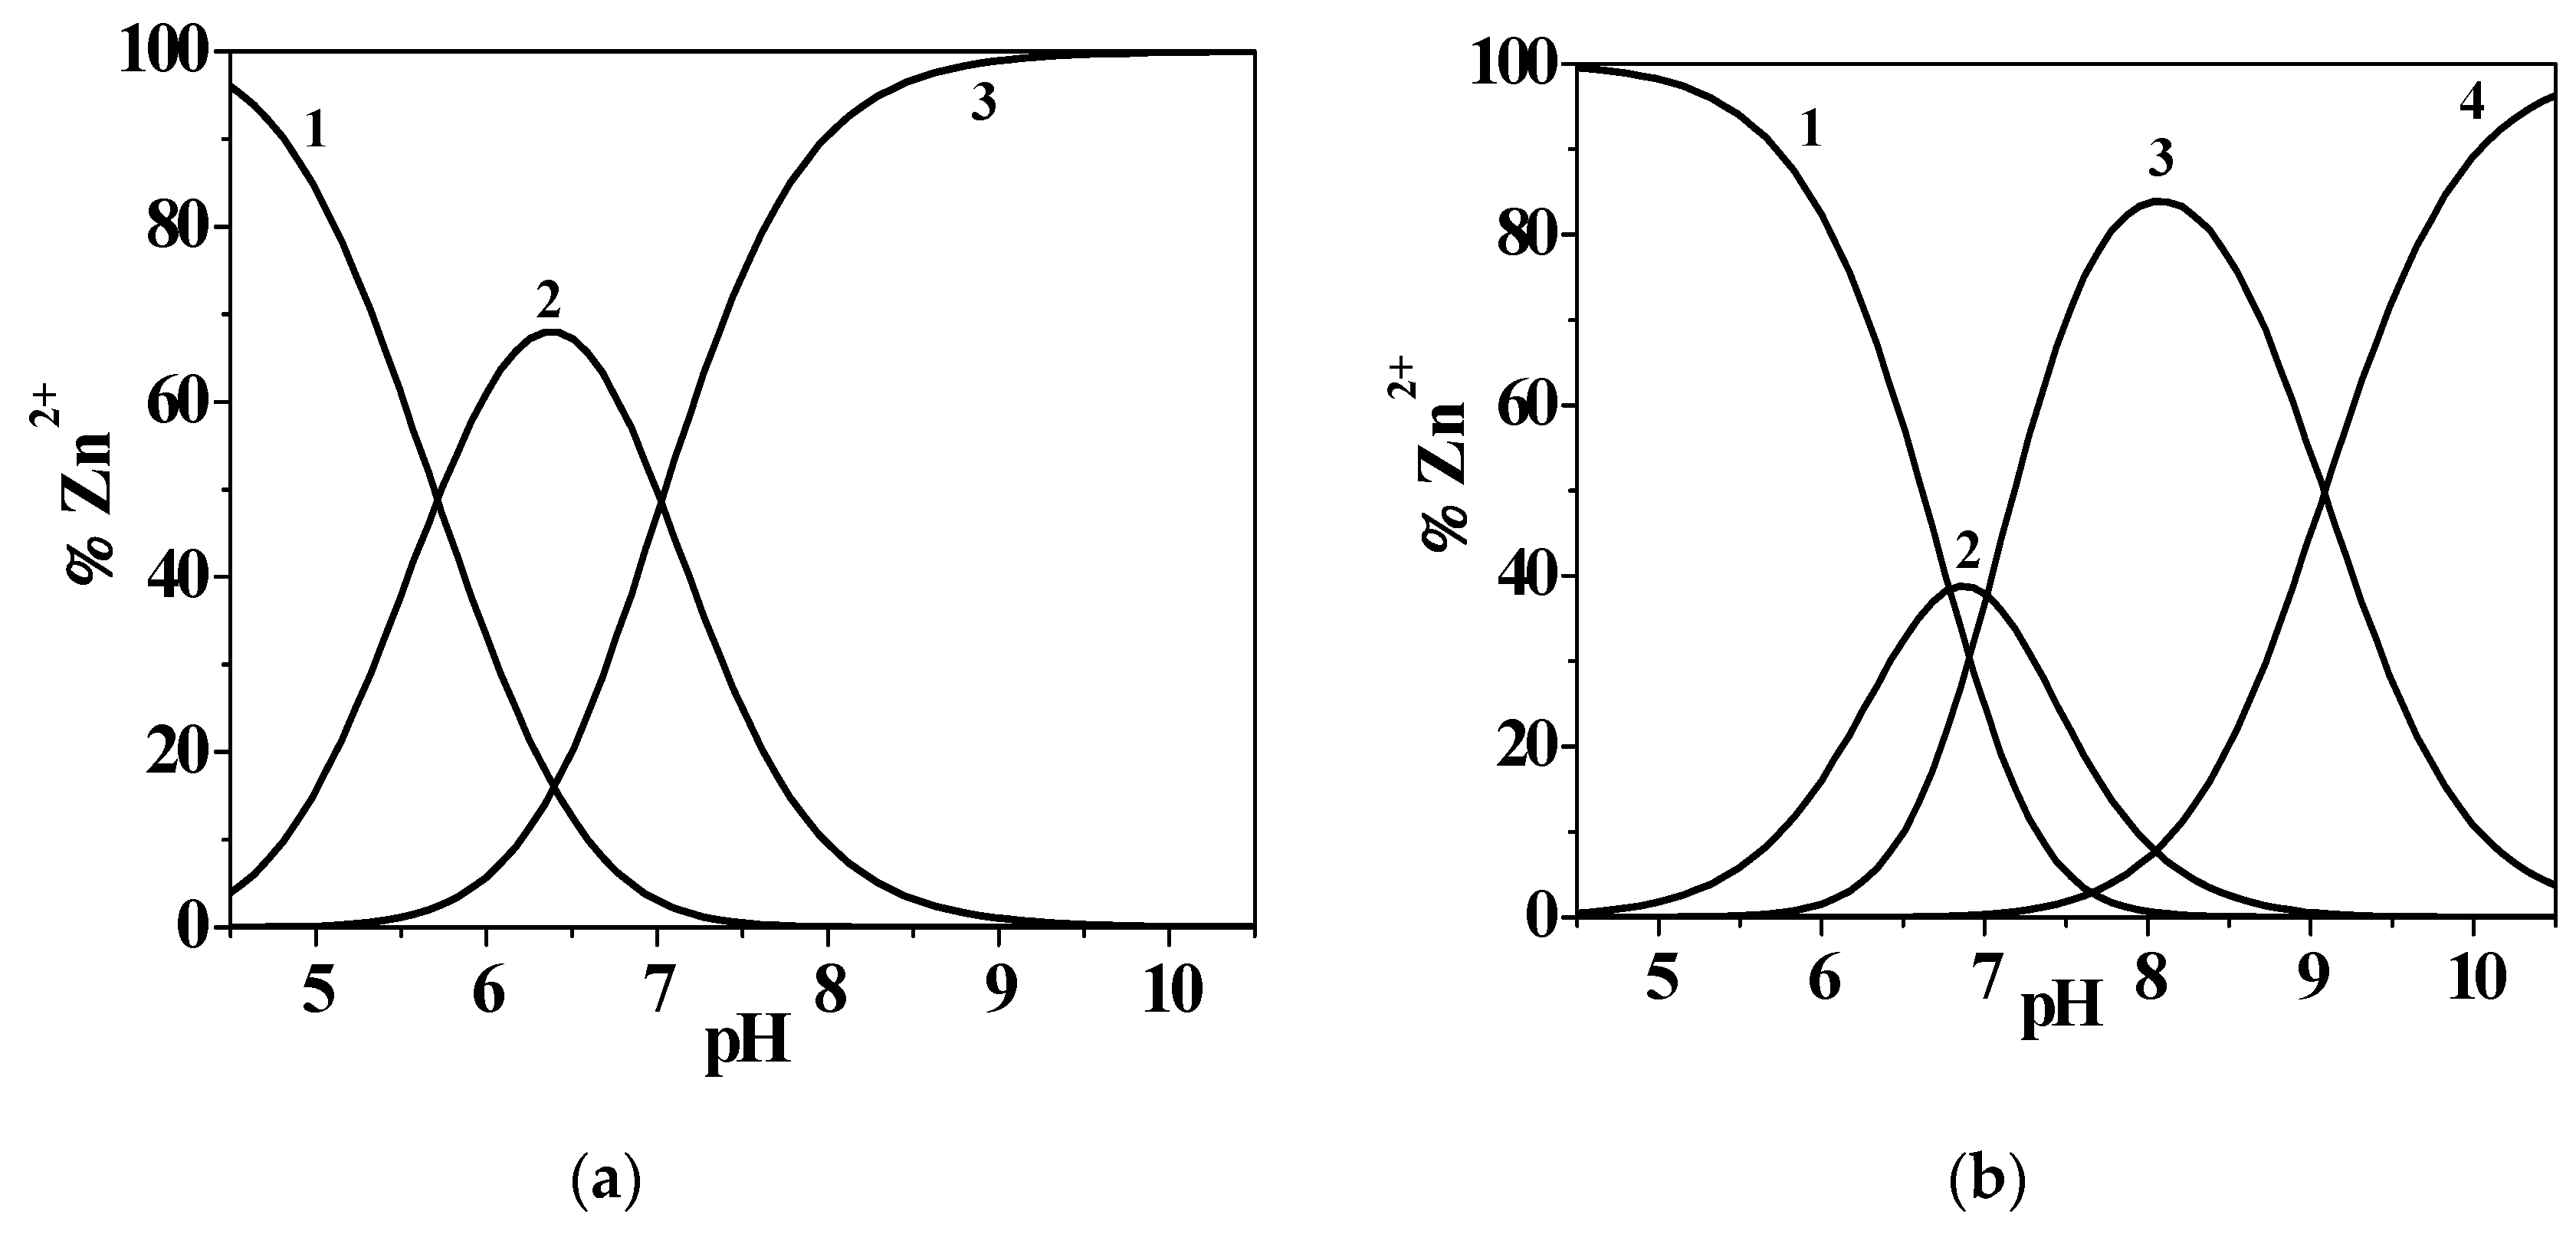
2.4.1. Zn2+/L1, L3 and L4 Systems

The study on Zn2+/L1 complexation allowed the determination of a model characterized by two species: Zn(L1)0(aq) and Zn(L1)OH. The distribution diagram reported in Figure 5a, drawn at I = 0.146 mol L−1 in NaCl(aq) and T = 298.15 K, shows that the metal–ligand interaction starts at pH ~ 3.9 with the formation of Zn(L1)0(aq) speciesreaching the 68% of formation at pH ~ 6.3, while the mixed hydroxo complex achieves its maximum formation percentage at pH ~ 10.5.
L3 and L4 ligands, as shown in Figure 1, feature another protonable site, namely the –NH2 group, with respect to L1; L3 is also characterized by an amidic moiety close to the amino and carboxylic groups.
The speciation schemes obtained for these Zn2+/3,4-HPs systems are characterized by the formation of ZnL0(aq), ZnLOH, and ZnLH+ species. As listed in Table 2, the stability constants determined for Zn2+/L3 and L5 ligands are higher than the ones obtained for L1, indicating that a possible involvement of the –NH2 and amidic moieties could not be excluded in the metal–ligand interaction (for further details, see Section 2.4.2. Zn2+/L2 system section); furthermore, in the case of the Zn2+/L4 system, the formationconstant values at I = 0.15 mol L−1 in NaCl(aq) and T = 298.15 K are in good agreement among the different analytical techniques used. Figure 5b shows a distribution diagram drawn at I = 0.147 mol L−1 in NaCl(aq) and T = 298.15 K for the Zn2+/L4 system.
With respect to the previous diagram, in this case the metal–ligand complexation starts at a higher pH value (pH ~ 4.7), in correspondence with the Zn(L4)H+ species, which reaches 39% formation at pH ~ 6.9, while the simple 1:1 stoichiometry and the mixed-hydroxo complexes achieve 84% and 95% formation at pH ~ 8.0 and 10.5, respectively. The Zn2+/L3 system displays a similar distribution, as observable in Figure S6.

2.4.2. Zn2+/L2 Investigation

The solution study of the L2 ligand in the presence of Zn2+ was performed by means of potentiometric, UV-Vis spectrophotometric, and 1H NMR investigation at I = 0.15 mol L−1 in NaCl(aq) and T = 298.15 K. The determined speciation model is characterized by three species, namely Zn(L2)H+, Zn(L2)0(aq), and Zn(L2)OH. In Table 2, the stability constants, determined with quite good accordance among the different analytical techniques, are reported together with the average of the obtained results. These last data are called “suggested values”, which are useful for describing the system behavior in a more complete way by taking into account different component concentrations, namely high concentrations (cL ~ 10−2–10−3 mol L−1) in potentiometric and 1H NMR measurements, and low concentrations (cL ~10−5 mol L−1) in UV-Vis spectrophotometric measurements.
The acid–base properties of L2 have already been studied by 1H NMR spectroscopy and reported elsewhere [8]; conversely, the titrations performed in the presence of Zn2+ are herein commented on for the first time. The measurements were stopped at about pH ~ 8.1 due to the formation of sparingly soluble species. All the collected spectra showed only a single set of peaks, thus proving that the species formed in the solution present fast exchange on the NMR time scale, as observed for similar systems [4,27]. From the comparison of the data collected from the Zn2+/L2 system with that of free L2, it can be argued that the presence of the metal cation leaves the signals referred to as a, b, c, and d almost unchanged below pH 4.5–5 (i.e., the protons closer to the hydroxo-oxo moiety). In detail, a, c, and d peaks show a common behavior, being slightly deshielded with respect to the corresponding signals of the free ligand, starting from approximately pH 5.0. At the same time, the resonance due to b undergoes a downfield shift compared to the L2 system from pH 4.5 onwards. The non-equivalent f protons, here reported as f1 and f2, display an opposite trend due to the presence of Zn2+, with one being shielded and the other deshielded, starting from a more acidic pH than before (i.e., approximately 3.2). The e methylene as well as g methyne protons seem to be unaffected by the presence of the metal along the investigated pH range. It is worth remembering that each observed shift resulting from fast-exchanging species corresponds to an averaged shift, so that apparently some signals may not change upon pH increase or in the presence of metal as a result of mutual exchange. In this case, the calculation of the single resonances for each nucleus of the species present in equilibrium is required according to the selected speciation model, to gain deeper insight into the system in solution. Accordingly, by comparing the chemical shifts of the expected species calculated by means of HypNMR (Table S5) with the free ligand ones, it appears that for Zn(L2)H+ the peaks more affected by the presence of the metal cation are a, b, f1, f2, and g, suggesting that the interactions occur both via hydroxo-oxo as well as amide part of the ligand. In the case of the other expected species, namely Zn(L2)0(aq), the shifts, although less pronounced, involve the same protons, so that similar conclusions may be drawn. On these bases, it appears that for both species all the coordination sites of L2 allow the formation of the complexes, even though we do not feel confident enough to claim that clear indications have been obtained from NMR investigations for this system. Regardless, once again NMR studies provide useful information about the reliability of the system speciation profile. Further evidence of the structural features of the complexes was gathered by computer modeling. Preliminary attempts to calculate the preferred conformation of Zn(L2)H+ and Zn(L2)0(aq) in vacuo at the functional density level of theory did not produce reliable minima. It was, therefore, envisaged that placement of the ligand L2 and the Zn2+ cation within a cluster of 100 explicit water molecules would provide a more accurate description of the zinc–ligand interaction [28]. PM6 (Parameterization Method 6) semiempirical calculations yielded minimum energy geometries for the Zn(L2)H+ and Zn(L2)0(aq) complexes, both featuring the zinc cation in close proximity to the carboxylate moiety (Figure 6). Interestingly, the pyridinone oxygen atoms are not involved in complexation, regardless of their protonation state, although they are strongly solvated (water molecules not shown). Likewise, the amide moiety is seensolvated, but the zinc cation is too far away to interact with the carbonyl oxygen. The involvement of the carboxylate group is in line with the data obtained by 1H NMR, with special reference to the diastereotopic hydrogen atoms f1 and f2. The increased chemical shift difference between the two resonances upon the addition of Zn2+ may be the result of the hampered rotational freedom of the aminoacidic moiety due to the interaction of the carboxylate with the metal. In agreement with this, the methyne proton g also undergoes a significant shift, and the modest shift of the e protons confirms the passive role played by the amide group.
UV-Vis spectrophotometric titrations were also carried out at 0.15 ≤ I/mol L−1 ≤ 1.00 and 288.15 ≤ T/K ≤ 310.15 to evaluate the effect of ionic strength and temperature on the speciation. The model obtained at I = 0.15 mol L−1 in NaCl(aq) and T = 298.15 K was confirmed atthe other experimental conditions and the Zn2+/ligand complex formation constants are reported in Table 3.
The stepwise formation constants of Zn(L2)H+ and Zn(L2)0(aq) increase with I and decrease with T, as observable in Figure 7 for the metal–ligand 1:1 stoichiometry species. Concerning the hydrolytic mixed species, the stability decreases with ionic strength, but with an inversion of tendency at I = 0.75–1.00 mol L−1, whilst the effect of temperature is opposite to that of the other two species. The influence of ionic strength on the speciation can be further examined by the analysis of Figure S7, in which a comparison between the UV-Vis titration curves is reported, recorded at I = 0.501 mol L−1 and 1.005 mol L−1 and T = 298.15 K. Analogous to the spectra reported in Figure 3B, for both ionic strength conditions, the intensity of the usual band at λmax = 278 nm increases up to pH ~ 4.1, as already observed for the protonation reaction. Above pH ~ 5.2, a decrease of absorbance with a bathochromic shift and a further raise of signal with respect to the protonated species occur. An increase of the UV-Vis titration curve intensity with the variable increase was also noticed for the complexes along all pH ranges investigated.
In Figure S8a, the distribution diagram of Zn2+/L2 species, drawn at the same experimental conditions employed for the UV-Vis titration curves described previously, shows that all the species reach percentages higher than 20%, and in particular, at I = 1.005 mol L−1 the formation of Zn(L2)H+ and Zn(L2)0(aq) is shifted towards more acidic pH values than at I = 0.501 mol L−1. In Figure S8b, the effect of temperature on the speciation is highlighted:the beginning of metal complexation is favored at higher temperature, starting from pH ~3.5 and 5.0 at T = 310.15 K and 288.15 K, respectively. The Zn(L2)H+ and Zn(L2)OH complex formations reach higher percentages at high temperature, while Zn(L2)0(aq) is characterized by an opposite trend. Low (<5%) formation percentages of the hydrolytic Zn(OH)20(aq) species are observed in both T conditions; at T = 310.15 K, these start to form at pH ~ 6.8, whereas at lower temperature values this occurs at pH > 9.0.

2.4.3. Zn2+/L5 System

The same analytical techniques employed for the previous system were used for the investigation of Zn2+/L5 complexation at I = 0.15 mol L−1 in NaCl(aq) and T = 298.15 K. The speciation model, considered the best possible match with the already cited criteria, is characterized by two complex species, namely Zn(L5)H2+ and Zn(L5)+. The stability constants are in good agreement among the different techniques, and the suggested values are reported in Table 2.
All 1H NMR investigations carried out in Zn2+/L5-containing solutions by varying the metal/ligand ratio andthe relative concentrations, show comparable spectra in the same pH conditions, as well as a single set of resonances, indicating that although complex species may be present in solution, all of them are involved in a fast mutual exchange. By comparing the spectra collected for L5 acid–base properties with the ones recorded for the titrations on the Zn2+-containing solutions, it appears that up to about pH 5.0 the chemical shifts due to the protons indicated as a, b, c, and d (i.e., the ones closer to pyridinone nitrogen on the aromatoid part of L5), are not influenced by the presence of the metal in the solution. Conversely, upon pH increasing, a and b signal results, as well as to a lesser extent c and d, shifted with respect to the corresponding free ligand peaks. In addition, the presence of the metal in the solution does not result in any shifting of e and f signals up to pH ~8.0; it is worth mentioning that the titrations stopped at approximately pH 9.0 due to the formation of sparingly soluble species. All of this experimental evidences suggest that at neutral pH only the hydroxo-oxo part of the ligand is involved in the formation of the expected species in these conditions, namely Zn(L5)H2+, whereas at higher pH the whole L5 structure is involved in the Zn(L5)+ formation. As usual, the theoretical chemical shifts, due to the nuclei belonging to each single complex species, were calculated by means of HypNMR (Table S5); once known, they were employed to recalculate the weight average chemical shifts, which should be closer to the observed ones if the proposed speciation model is reliable. From Figure 8, the almost total overlap of the experimental and the calculated average chemical shifts can be clearly observed, shown here for a, c, d, and f nuclei of L5 in the Zn2+/L5 system, thus confirming the model employed for the rationalization of the data coming from potentiometric and spectrophotometric investigations.
The geometry of the Zn(L5)H2+ and Zn(L5)+ species was obtained by performing a preliminary equilibrium conformer search with a molecular modelling force field (MMFF). The minimum energy conformers were refined by the PM6 (Parameterization Method 6) semiempirical method, and the resulting structures were used as inputs for a geometry optimization at the DFT level of theory (B3LYP/6-31G(d)) [29]. Both complexes returned a similar arrangement (Figure 9), with the Zn2+ cation interacting with both the oxygen atoms of the pyridinone ring, again confirming the conclusions drawn by the 1H NMR experiments. The only significant difference between the two complexes was in the oxygen–metal distances, which were found to be longer in Zn(L5)H2+ (=O···Zn2+···OH of 1.85 and 2.04 Å, respectively) than in Zn(L5)+ (=O···Zn2+···O of 1.85 and 1.84 Å, respectively), probably owing to the additional electrostatic attraction in the latter species.
Potentiometric studies were also performed at different ionic strengths (0.15 ≤ I/mol L−1 ≤ 1.00) and temperatures (288.15 ≤ T/K ≤ 310.15) to check the influence of these variables on the speciation. In Table 3, the formation constants determined at the different experimental conditions are reported.
As also observable in Figure S9I, the logβ110 values decrease with I and T increasing. The same behavior characterizes the logK110 trend with temperature increase, while its stability decreases with ionic strength increasing, and it shows an inversion tendency at I = 1.00 mol L−1. The variables effect can also be increased, as seen by the distribution diagrams in Figure S9II, drawn for two conditions: ionic strength increase, namely I = 0.161, 0.472, 0.951 mol L−1, T = 298.15 K; and temperature increase, I = 0.15 mol L−1, T = 288.15 K, and T = 310.15 K. In the first case, the Zn2+/3-hydroxypyridinone complexation starts at pH ~ 3.0 and the percentages of Zn(L5)H2+ species increase with ionic strength, reaching values of 67%, 81%, and 92% in the pH range of 6.6–6.9. The metal–ligand 1:1 stoichiometry species formation, instead, is shifted at more alkaline pH conditions with I increase. In the second case, similarly to the previous system, metal complexation is favored at high temperature, beginning at pH < 2.0. The main species at physiological pH levels is Zn(L5)H2+, where the formation of hydrolytic Zn(OH)20(aq) and Zn(OH)3 species occur, which does not happen at lower temperatures.

Confirmation of Zn2+/L5 Species Formation by ESI-MS

In the literature, Clarke et al. [30] reported the results of a potentiometric and UV-Vis spectrophotometric studies on the speciation of deferiprone, a 1,2-dimethyl-3-hydroxy-4-pyridinone ligand, in the presence of trivalent and divalent metal cations, including Zn2+ at I = 0.15 mol L−1 in KCl(aq) and T = 298.15 K. In the case of zinc, two complexes were obtained, namely a 1:1 and a 1:2 stoichiometry metal–ligand species. On the contrary, Grgas-Kužnar’s group [31] reported the results of an investigation on a Zn2+/dopamine system at I = 0.50 mol L−1 in NaNO3(aq) and T = 303.15 K, determining only the Zn(Dop)H+ species. Dopamine is characterized by a similar structure to L5, namely by an aromatic ring with two –OH substituents in the ortho position and an ethylamine group. As already discussed, the study presented in this paper on Zn2+/3-hydroxy-pyridinone systems, did not lead to the determination of the 1:2 stoichiometry metal–ligand species, at the experimental conditions of the measurements, performed with different analytical techniques.
In light of these considerations, amongthe Zn2+/(3-hydroxy-4-pyridinone) systems, the Zn2+/L5 system was selected for further studies. Therefore, with the aim of confirming the Zn(L5)+ complex formation and further verifying the possible determination of a Zn(L5)20(aq) species, ESI-MS (Electrospray mass) measurements were performed on samples at different ionic strength conditions, such as I = 0.15 and 1.00 mol L−1 in NaCl(aq) at pH ~ 10.5. This pH value was chosen because it represents a condition under which only the 1:1 stoichiometry metal–ligand species is present in solution (see Figure 9), taking into account the speciation model already reported. The focus on this pH is also significant because the formation of the 1:2 stoichiometry metal–ligand species may occur in approximately the same pH range. Some measurements were also carried out in the absence of ionic medium to make comparisons among the possible species formed for NaCl-containing systems.
Prior to investigating the metal–ligand complexation, the spectra of ligand and metal cation were studied separately at the already cited experimental conditions. As observable in the distribution diagrams for L5 reported in Figure S5, and in accordance with the data already reported by this research group [8], the monoprotonated ligand species is present in solution at pH ~ 10.5, together with the fully deprotonated one. From the analysis of ESI-MS spectra recorded at all selected experimental conditions, the formation of three main ligand species was noticed, with m/z = 183.1, 205.1, and 221.1 (Table 4), attributable to the [H(L5) + H]+ species and to the [H(L5) + Na]+ and [H(L5) + K]+ adducts, respectively.
The observation of the sodium and potassium adducts is very common in ESI-MS spectra, possible due to background impurities and to the considerable presence, in some cases, of ionic medium NaCl in solution [32]. Furthermore, an intensity decrease of the [H(L5) + H]+ peak with ionic strength increase was noticed, in particular at I = 1.00 mol L−1, due to a signal suppression attributable to the ionic medium effect, leading to a significant salt-adducted species formation [33,34,35].
Regarding the metal behavior, firstly it was investigated at pH ~ 10.5, but under all experimental conditions (I = 0.15, 1.00 mol L−1 in NaCl(aq), absence of ionic medium) the formation of a white, sparingly soluble species, probably attributable to Zn(OH)20(s), made this investigation difficult. For these reasons, we decided to carry out some measurements at similar experimental conditions to the literature ones in the pH range of 6.0–7.5, in order to gain information on the ESI-MS Zn2+ behavior in aqueous solution and make comparisons with some data already present in the literature. ZnI2 (cZn2+ = 0.002 mol L−1) was used instead of ZnCl2 as a source of zinc and in the absence of ionic medium, however formation of the sparingly soluble species was not observed. At this pH range, as observable in Figure S10, the distribution diagram of Zn2+ in the absence of ionic medium, drawn using literature hydrolytic constants [6,25,26], shows that the metal cation is almost totally present in the free form, together with low percentages (<10%) of Zn(OH)+ species. In accordance with the literature data [36], from the analysis of ESI-MS Zn2+ spectra, peaks related to the formation of [Zn(H2O)n]2+ and [Zn(OH)(H2O)n]+ clusters were noticed, as well as those attributable to chloride and sodium adducts, as reported in Table 4.
Concerning the Zn2+/L5 complexation, the analysis of ESI-MS spectra, recorded at I = 0.15 and 1.00 mol L−1 in NaCl(aq), and in the absence of ionic medium, showed the presence of peaks related to L5 in all cases (i.e., [H(L5) + H]+, [H(L5) + Na]+, and [H(L5) + K]+ adducts). In addition, the formation of the 1:1 stoichiometry metal–ligand complex was detected in the form of an adduct cluster with water molecules, Na+, and Cl ions, caused either by the background or the ionic medium effect (Table 4). Similar to the investigation of L5 spectra, also in this case the effect of NaCl was significant, and a signal suppression of peaks with ionic strength increasing characterized the complex under study. Moreover, regarding the possible formation of the 1:2 stoichiometry metal–ligand species, a small peak with a value of m/z = 448.9 was noticed only in the spectra in the absence of ionic medium, and was not present in any of those recorded at I = 0.15 and 1.00 mol L−1. This signal, perhaps, could be attributable to a possible adduct [Zn(L5)2 + Na]+ with a theoretical value of m/z = 449.11, but the difference between the theoretical and the experimental values seems excessive for the type of instrument used.
Actually, on light of this consideration, and taking into account that all the results reported in the present paper were obtained from measurements in the presence of NaCl, we feel confident to state that under the used experimental conditions, the 1:2 stoichiometry metal–ligand species does not form, but we cannot exclude its formation under other conditions.

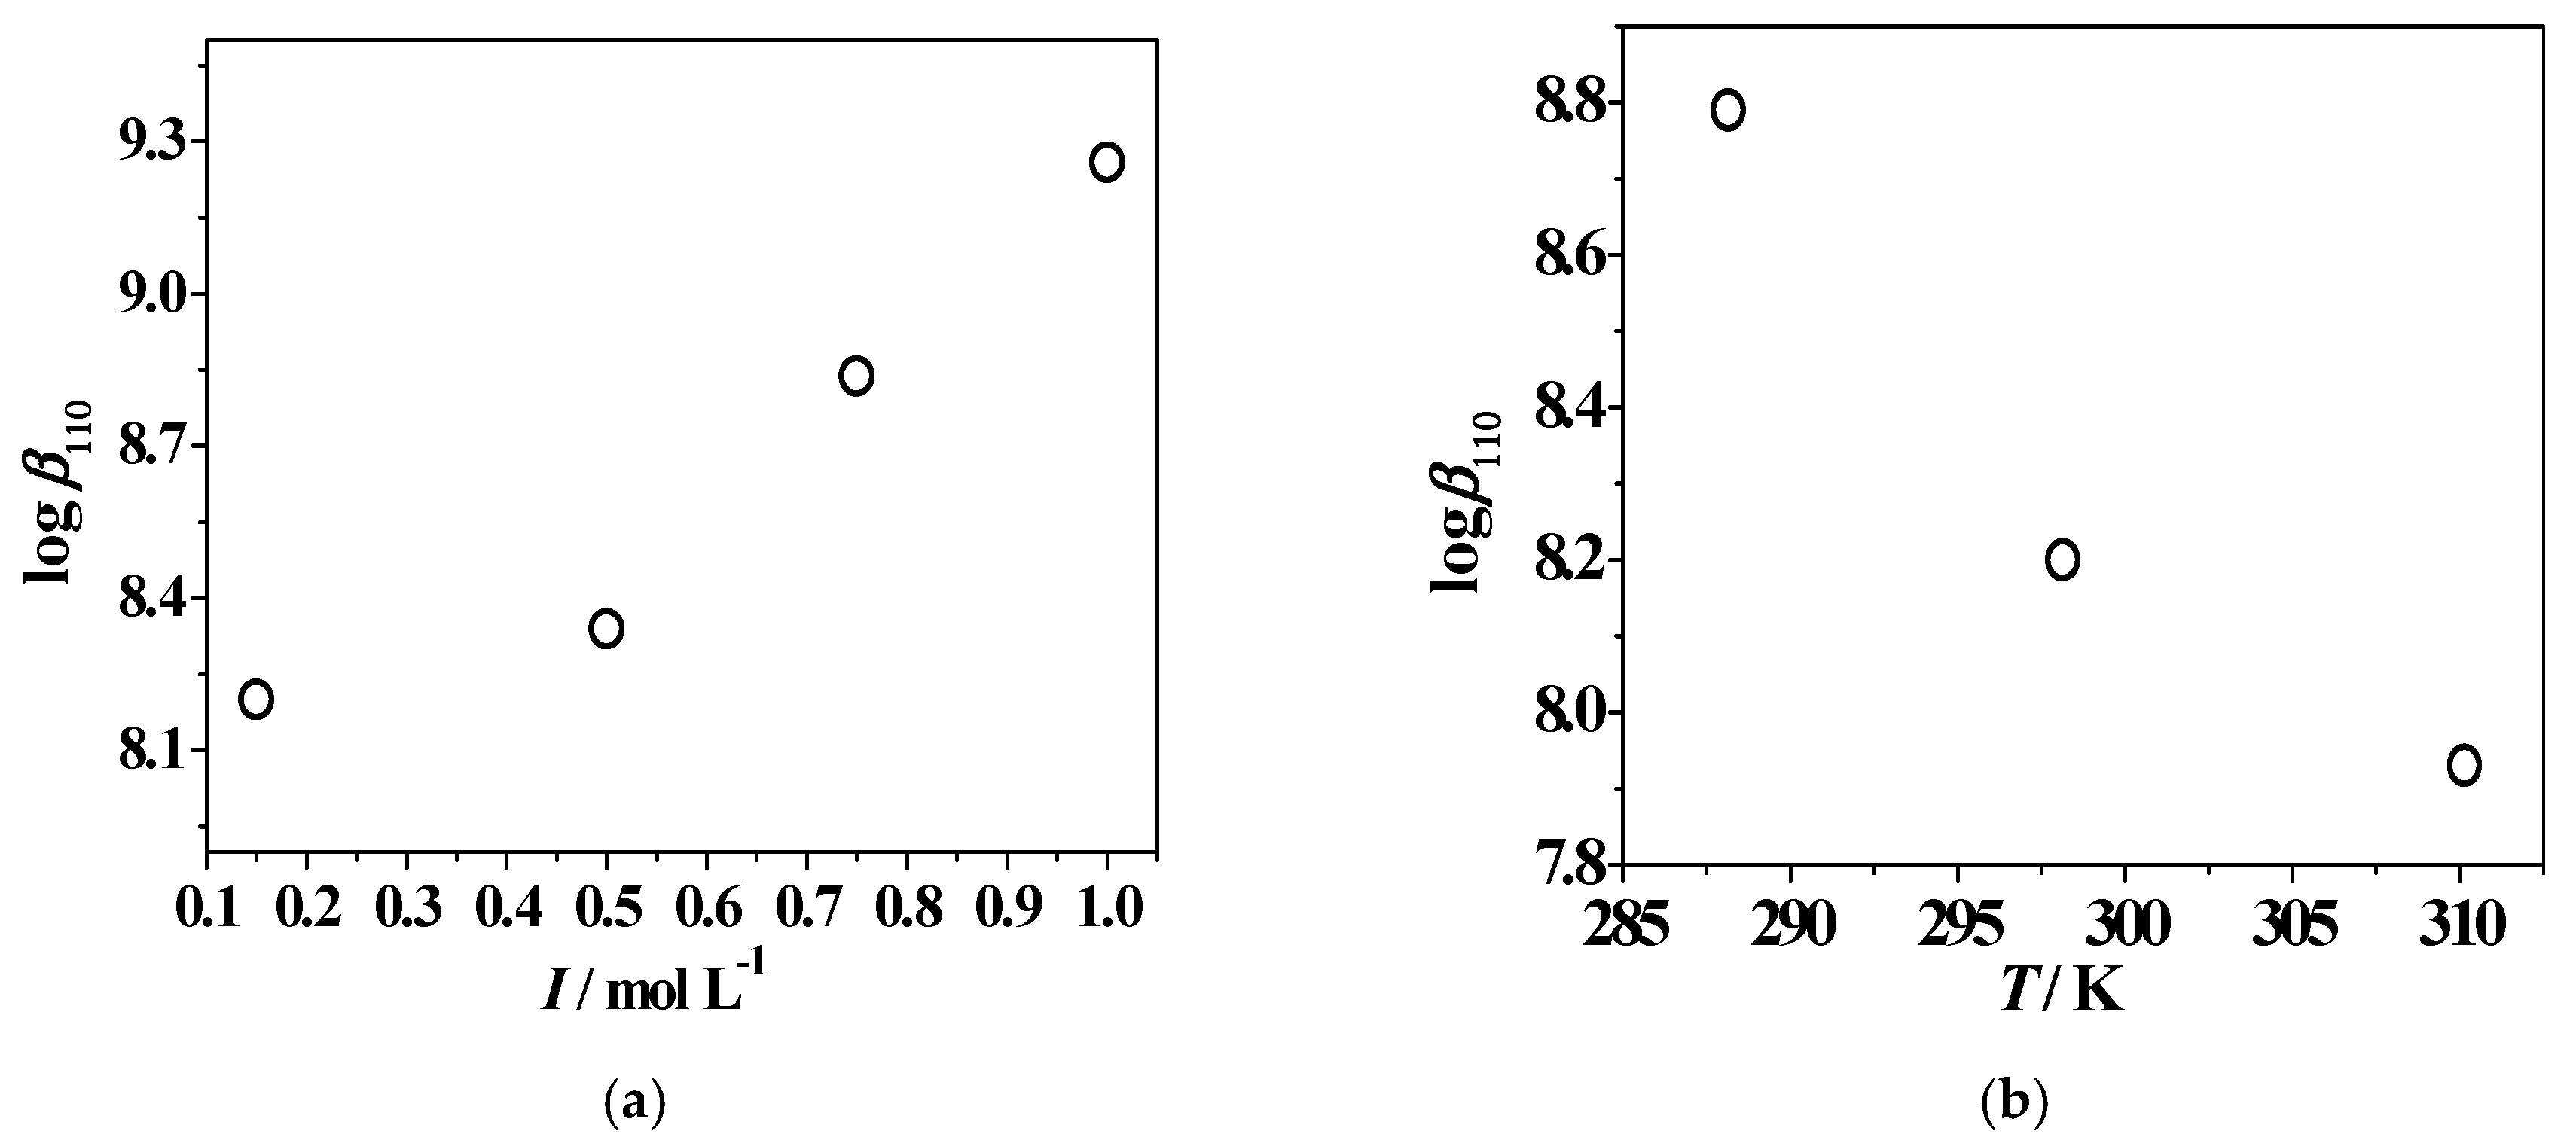
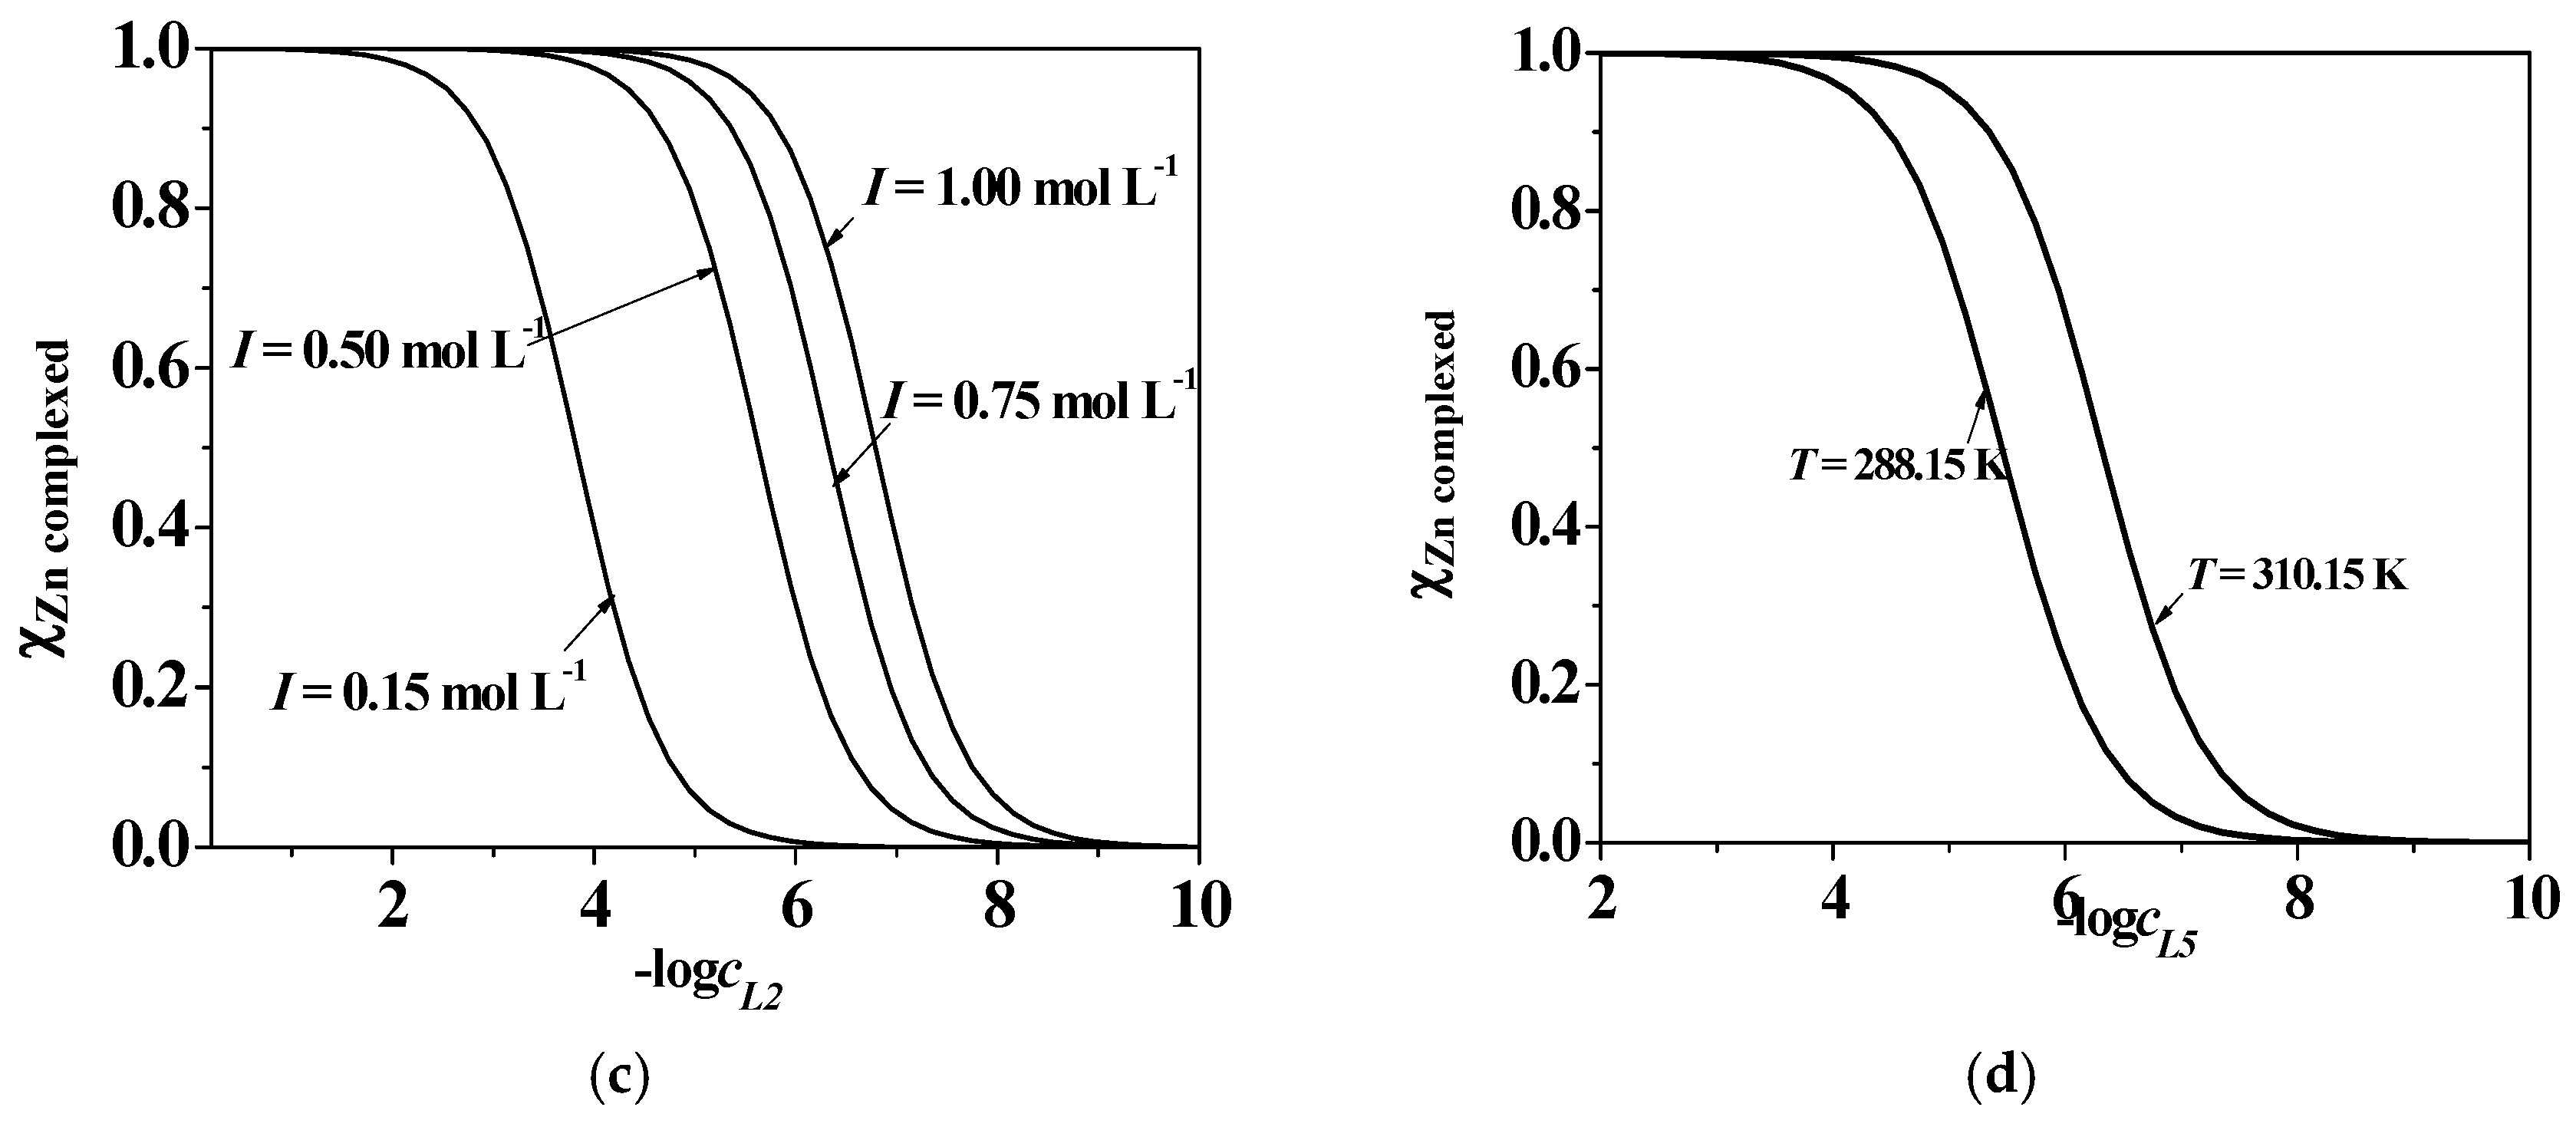
2.5. Dependence on Ionic Strength and Temperature

The dependence on ionic strength and temperature of L2 and L5 protonation and stability constants towards Zn2+ in NaCl(aq) was modeled using Equations (7)–(9). The thermodynamic parameters (equilibrium constants atinfinite dilution, C and Δε empirical parameters, ΔH values), determined by taking into account the values obtained from UV-Vis spectrophotometric, spectrofluorimetric [8], potentiometric, and 1H NMR measurements, are reported in Table 5, together with the overall and stepwise free energy (ΔG) and the entropy changes (TΔS). The assessment of thermodynamic parameters provides a complete picture of the systems, whose equilibrium constants can be predicted for any experimental conditions.
The stepwise protonation enthalpy changes calculated at I = 0.15 mol L−1 and T = 298.15 K resulted in good agreement among the protonable groups belonging to both the ligands under investigation, and in all cases the reactions were spontaneous (ΔG < 0). The protonation of –OH groups resulted an endothermic process, with positive ΔH values and a consequent heat absorbance from the system environment, while the entropic contribution was the driving force for the formation of protonated species. On the contrary, the protonation of the remaining sites is exothermic in nature, with negative ΔH values and a resulting heat transfer from the system environment. The comparison with the calculated TΔS values allowed us to assert that for –NH2, –COOH, and pyridinone nitrogen atoms, the enthalpic factor provided the driving force for the formation of protonated species. In the case of Zn2+/3-hydroxy-pyridinone interactions, as listed in Table 5, for both ligands the enthalpic contribution is the main driving force for the complex formation of ZnLH(3−z) and ZnL(2−z) species, which is exothermic in nature; Zn(L2)OH is instead characterized by an opposite tendency.

2.6. Literature Data Comparison

2.6.1. Protonation of the Ligands

The acid–base properties of L2 and L5, reported in this paper in NaCl(aq) at different ionic strength and temperature conditions, can be compared with data published in the literature by our research group on the same two ligands at I = 0.15 mol L−1 in NaCl(aq) and at T = 298.15 K and 310.15 K [8], and also by other authors for products (see Figure S11) characterized by similar structures and functional groups. In particular, it is possible to make the comparison of the two ligands’ protonation constants at I = 0.15 mol L−1 in NaCl(aq) and T = 298.15 K (Table 1), withdata from Clevette and coworkers [5], Crisponi’s group [37,38,39], and Clarke et al. [30] (listed in Table 6). The first author worked at the same experimental conditions reported above, while the second and the third groups worked at conditions of I = 0.15 mol L−1 in KCl(aq) and T = 298.15 K. Bretti et al. [40] published a complete study on deferiprone (DFP) behaviour in NaCl aqueous solution, studied by means of potentiometric measurements carried out at 0.10 ≤ I/mol L−1 ≤ 4.92 and 283.15 ≤ T/K ≤ 318.15.
The DFP protonation constants (Table 6), refined by the author at quite similar I and T conditions to those used in the present work, are in good agreement with the values obtained here for H(L2), H4(L2)2+, H(L5)0(aq), and H3(L5)2+ species, as reported in Table 1. As already mentioned in the literature [8] and in the section detailing L5 ligand acid–base properties, H(L2) and H(L5)0(aq) protonation constants are related to the –OH groups, while the H4(L2)2+ and H3(L5)2+ ones are related to the pyridinone nitrogen atom protonation.
The same research group [41] also reported the results of a potentiometric investigation carried out on pyridine in NaCl(aq), 0.29 ≤ I/mol L−1 ≤ 3.60, and at 288.15 ≤ T/K ≤ 310.15. In this case, the constant related to the nitrogen atom protonation showed similar ionic strength trends to those obtained for both the studied L2 and L5 ligands, but at similar experimental conditions to those reported here, the values reported by the author were higher than the ones we found. This difference may be due to a different electronic charge delocalization and to the absence on the pyridine ring structure of substituents and alkylic chains, which could influence the acid–base properties of the ligand. This research group [24] also investigated dopamine (Figure S11) behaviour in NaCl aqueous medium by means of potentiometric, UV-Vis spectrophotometric, and spectrofluorimetric measurements performed at 0.15 ≤ I/mol L−1 ≤ 1.02 and 288.15 ≤ T/K ≤ 318.15, where two protonable groups were determined, possibly related to the substituent groups, namely –OH in the aromatic ring and –NH2 on the alkyl chain, which were present on the molecules. The affinity between dopamine data (Table 6) and L2 and L5 protonation constants (Table 1) at the different experimental conditions could be explained by the similarity of some dopamine moieties with respect to the ligand structures under investigation. Analogous data were obtained by Grgas-Kužnar’s group [31], using a potentiometric study performed at I = 0.50 mol L−1 in NaNO3(aq) and T = 303.15 K. In this case, the only difference was the protonation constant value related to the other –OH group present on the molecule structure, which was detectable only by carrying out measurements at alkaline pH conditions.
L2 acid–base properties at different ionic strengths and temperatures can be compared with aspartic acid behavior, from which it is derived, reported by Martell et al. [6] at 0.10 ≤ I/mol L−1 ≤ 1.00 in Na+ ionic medium and T = 298.15 K and 310.15 K. The L2 protonation constants reported in this paper in Table 1 for the –NH2 and –COOH groups are in good agreement with the literature data (Table 6), also providing a logKH value for a second carboxylic group, which is not present in our structure.
Lastly, as already mentioned in the sections detailing L2 and L5 behavior in aqueous solution, there was a good accordance among the –NH2 groups’ protonation constants at I = 0.15 mol L−1 in NaCl(aq) and T = 310.15 K [9], along with the corresponding value for mimosine [23] (Table 6, Figure S11), studied at the same temperature and ionic strength but in KNO3(aq).

2.6.2. Zn2+/Ligands Systems

Comparisons can be performed among the data for ZnL(2−z) species reported in the literature (Table 7) for similar ligand structures and functional groups as the investigated 3-hydroxy-4-pyridinones.
Clarke et al. [30] published a value of logK110 = 7.19 at I = 0.15 mol L−1 in KCl(aq) and T = 298.15 K, which is similar to the corresponding one here obtained for the Zn2+/L1 system at I = 0.15 mol L−1 in NaCl(aq) and T = 298.15 K. The authors also determined the formation of a Zn(DFP)02(aq) species, while a hydrolytic mixed species was obtained here with L1.
Analogous to the acid–base properties, comparison can also be made between results and Zn2+/pyridine (L = Py) complexation data present in the literature. In particular, Desai et al. [42] and Kapinos and coworkers [43] reported the results of potentiometric studies carried out at I = 0.10 mol L−1 in NaClO4(aq) and I = 0.50 mol L−1 in NaNO3(aq) and T = 298.15 K, respectively, with stability constants values of about 7–8 orders of magnitude lower than those we obtained for the ZnL(2−z) species, as could be expected due to the absence of functional groups that may participate in the metal coordination. The first author reported a speciation model characterized by protonated, simple 1:1 (Zn(Py)2+), 1:2 (Zn(Py)22+), and 1:3 (Zn(Py)32+) metal–ligand stoichiometry species, while the second one only reported the formation of the Zn(Py)2+ complex.
Table 7. Literature stability constants of Zn2+/ligands species reported for different temperatures, ionic strengths, and ionic media in molar concentration scale.
LigandI/mol L−1T/KIonic MediumlogK111logK110logK120logK130Ref.
DFP0.100298.15KCl-7.196.34-[30]
Pyridine0.100298.15NaClO45.501.100.600.38[44]
0.500298.15NaNO3-1.15--[43]
Dopamine0.500293.15NaNO37.28---[31]
Aspartic acid0.100298.15NaNO3-5.35--[45]
0.100 Na+-5.87--[6]
0.500 Na+-5.609.93-[6]
1.000 Na+-5.64--[6]
0.100303.15Na+--10.16-[6]
0.150310.15Na+1.555.8210.13-[6]
Grgas-Kužnar’s group [31], as mentioned above, reported the results of a potentiometric investigation carried out on the Zn2+/dopamine (L = Dop) system at I = 0.50 mol L−1 in NaNO3(aq) and T = 303.15 K. The obtained speciation model was characterized only by the Zn(Dop)H+ species, confirming the formation of the monoprotonated complex, as we also obtained for all the metal/–NH2-containing ligand group (L2L5) systems, which were studied at I = 0.15 mol L−1 in NaCl(aq) and T = 298.15 K. The stability constants found in the literature (Table 7) are ~1–2 orders of magnitude higher than the values presented here, probably because the stability of the formed Zn2+/3,4-HPs species can be influenced by the absence of a hydroxyl group and the presence, in some cases, of carboxylic and amidic moieties.
Sajadi and coworkers [45] published the results of a potentiometric speciation study of Zn2+ in the presence of aspartic acid (Asp), of which L2 and L3 ligands are derivatives, carried out at I = 0.10 mol L−1 in NaNO3(aq) and T = 298.15 K, while Martell et al. [6] reported data from investigations in Na+ ionic medium at different experimental conditions, such as 0.10 ≤ I/mol L−1 ≤ 1.00 at T = 298.15 K, I = 0.10 mol L−1 at T = 303.15 K, and I = 0.15 at 310.15 K. In almost all cases, the authors obtained the Zn(Asp)0(aq) species, with values 3.5–3.8 orders of magnitude higher than the ones reported here; the formation of Zn(Asp)H+ and Zn(Asp)22− species also occurred only at some experimental conditions.

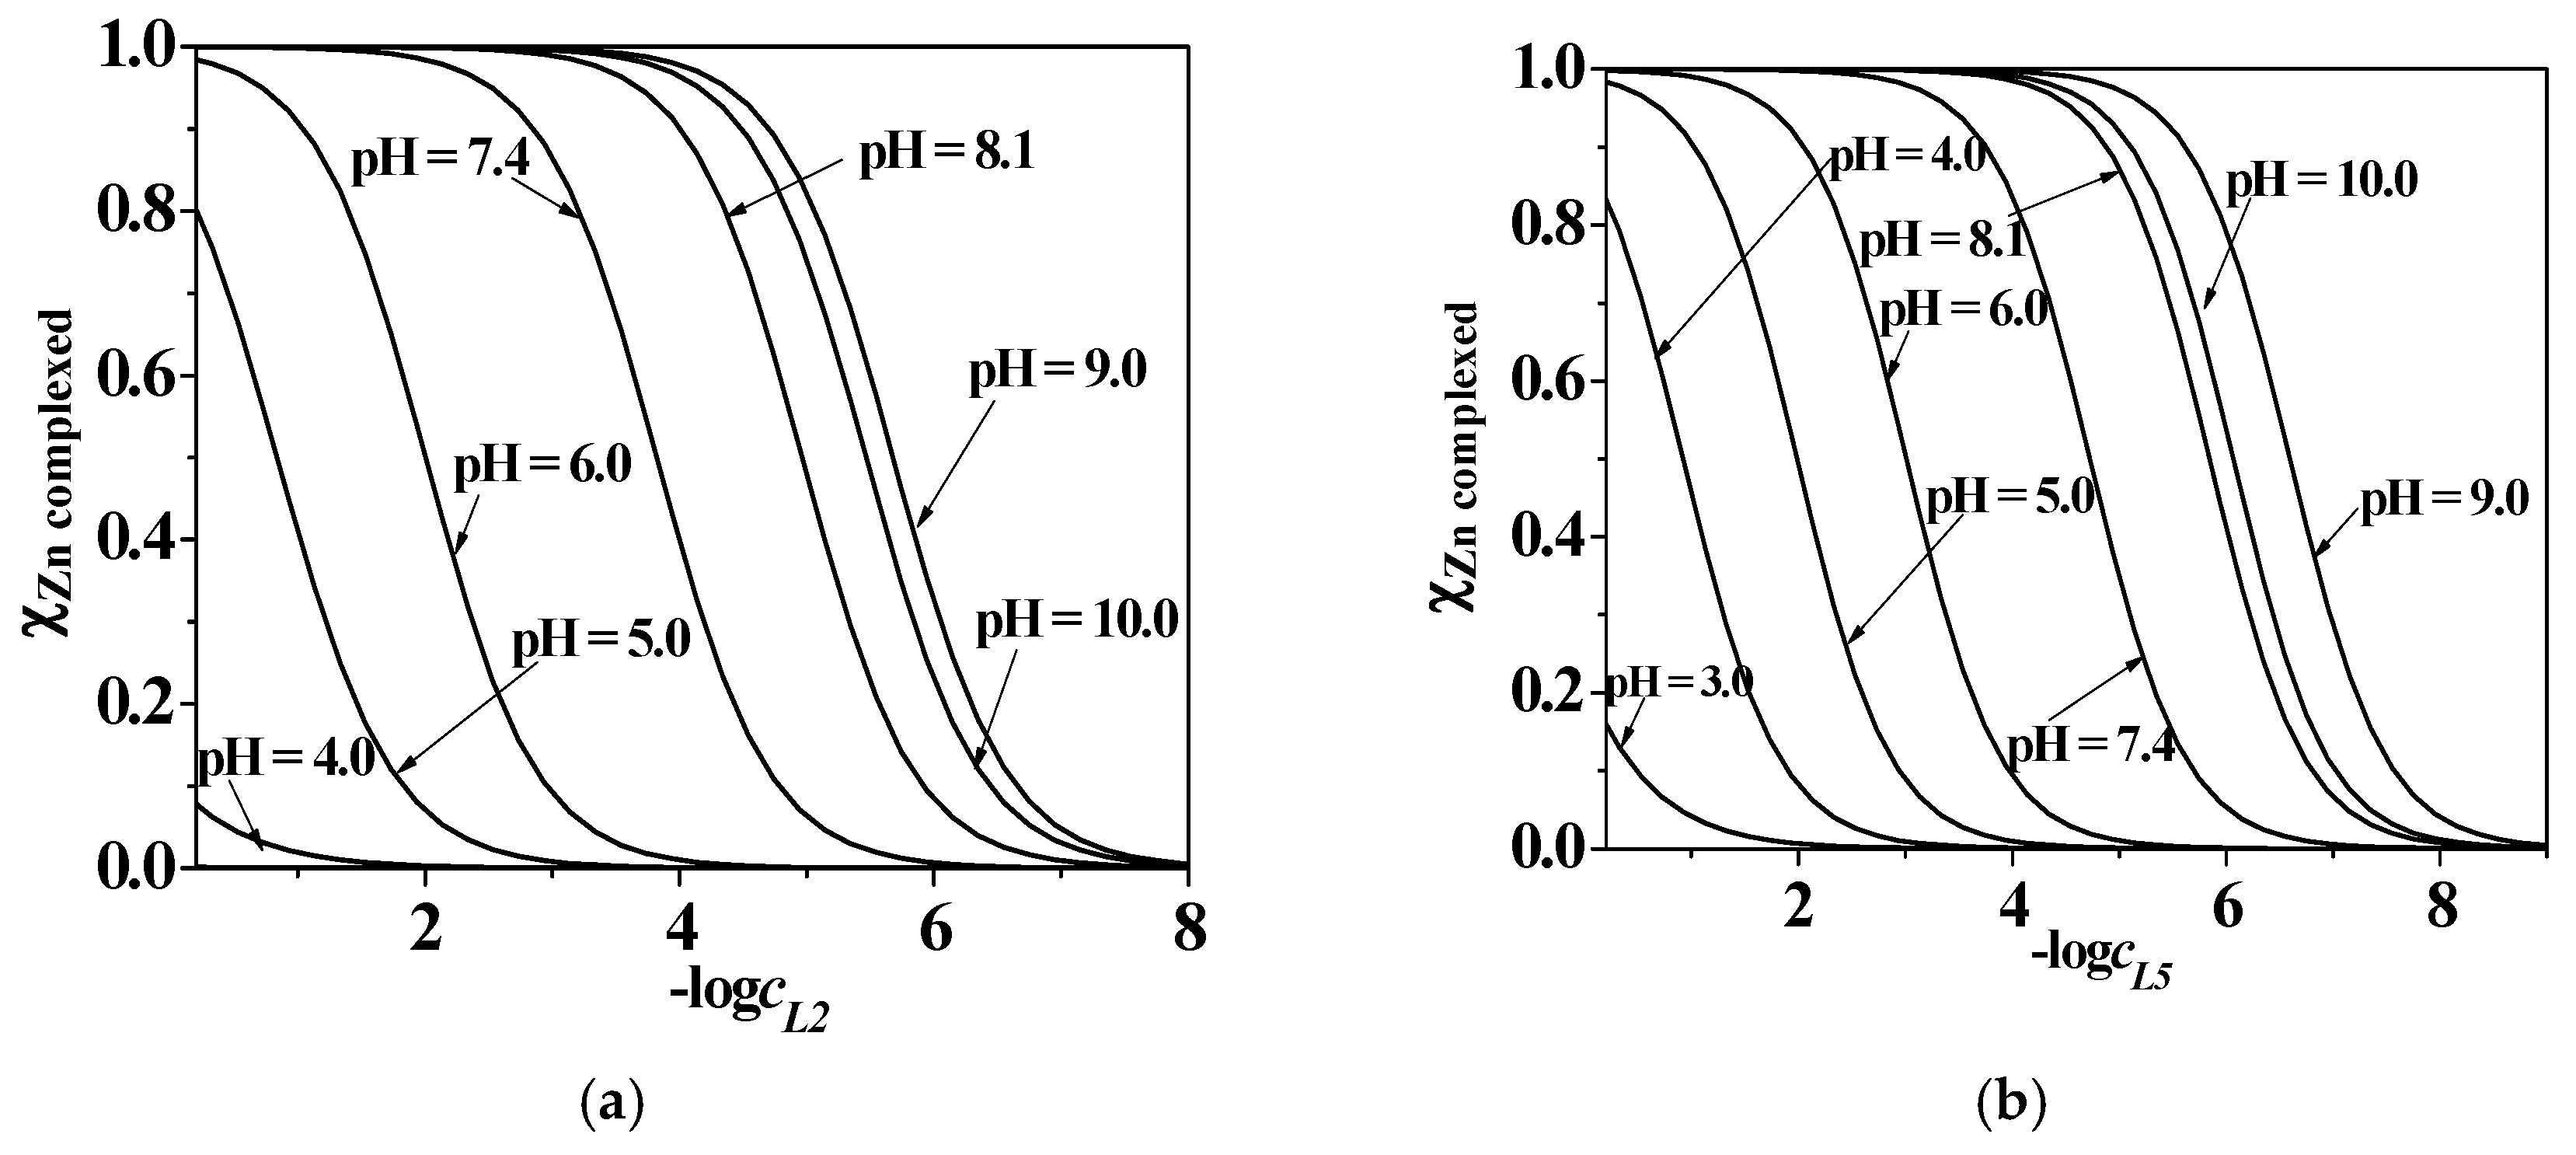
2.7. Sequestering Ability

The sequestering ability of a ligand towards a metal cation can be evaluated by the determination of an empirical parameter, pL0.5. It has already been proposed by the research group and represents the total concentration of ligand that is required to sequester 50% of a metal cation present in trace concentration in solution. This parameter is described by the following sigmoidal-type Boltzmann equation (Equation (12)):
x M = 1 1 + 10 ( pL pL 0.5 )
where xM is the mole fraction of the metal cation complexed by the ligand, pL = −log cL, and pL0.5 = −log cL, if xM = 0.5. A detailed description of pL0.5 calculation, importance, and applications is reported in the literature [18].
An investigation on the sequestering ability of the five 3-hydroxy-4-pyridinone ligands towards Zn2+ was carried out at I = 0.15 mol L−1 in NaCl(aq) and T = 298.15 K, and in the case of L2 and L5, also at different ionic strengths (0.15 ≤ I/mol L−1 ≤ 1.00) and temperatures (288.15 ≤ T/K ≤ 310.15).
From the data reported in Table 8 and the graphs in Figure 10, it can be argued that for all the systems the sequestering ability assumes significant values starting from pH ~ 3.0–4.0, due to the beginning of metal complexation with pH increasing up to pH ~ 9.0, where the possible formation of Zn2+ hydrolytic or mixed-hydrolytic species may influence the systems. At physiological pH level (pH ~ 7.4), I = 0.15 mol L−1 in NaCl(aq), and T = 298.15 K, the sequestering ability is influenced, as expected, by the different acid–base properties of the ligands, and it decreases with alkyl chain length; the trend is: L1 > L5 > L4 > L3 > L2. Concerning the ionic strength effect, as already stated for L2 protonation behaviour, the presence of sodium chloride would seem to stabilize the system, which may be the reason why, as shown in Table 8 and Figure 10, the sequestering ability increases with increasing I, while in the case of Zn2+/L5 species, it reaches its maximum value at T = 310.15 K.

2.8. Zn2+ Depletion vs. Al3+ Sequestration

A comparison of this paper’s data can be performed with those already reported in the literature by this research group for the Al3+ complexation by the same bifunctional ligands [8], at I = 0.15 mol L−1 in NaCl(aq) and T = 298.15 K. The main purpose of this paper, as already mentioned, was to verify, from a thermodynamic point of view, if there could be a significant depletion of an important divalent bio-metal such as Zn2+, along with the strong sequestering activity towards the trivalent metal cations. In particular, the determined stability constants related to the ZnL(2−z) species (Table 2) and the corresponding values reported in Table S6 at the same experimental conditions for the AlL(3−z) complex can be compared, observing that for all the bifunctional ligands the stability of the simple Al 1:1 stoichiometry species is much higher than those obtained with Zn2+. Moreover, a comparison among the physiological pL0.5 values calculated for all the ligands towards both the metal cations (Table 8 and Table S6) can be carried out, showing that the sequestering ability of 3-hydroxy-4-pyridinones is stronger towards Al3+ than Zn2+ for L1, L2, L3, and L4 ligands, with values of ΔpL0.5 = 0.8, 3.9, 2.2, and 3.0, respectively. Only in the case of L5 is the tendency is opposite, due to the absence of the –COOH group in the ligand structure (Figure 1), which, as already pointed in the literature, should allow the formation of the sparingly soluble Al(OH)30(s) species under acidic pH values (pH ~ 5.0), influencing in a noteworthy way the sequestering ability of the ligand towards Al3+ [46].
In light of these considerations, it is possible to claim, from a thermodynamic point of view, that no competition between Zn2+/Al3+ should occur since the ligands promote the removal of hard metal cations from the human body, while avoiding the possibility of bio-metal depletion.

3. Materials and Methods

3.1. Chemicals

HCl and NaOH standard solutions were prepared for dilution of Riedel–deHäen concentrated ampoules and were standardized against sodium carbonate and potassium hydrogen phthalate, respectively. Sodium hydroxide solutions were preserved from atmospheric CO2 using soda lime traps. The NaCl ionic medium aqueous solutions were prepared by weighing the pure salt purchased from Fluka, which was previously dried in an oven at T = 383.15 K for at least 2 h. The reagents used for all investigations were of the highest available purity and the solutions were prepared with analytical grade water (R = 18 MΩ cm−1), using grade A glassware. The ligands under study, namely L1–L5 (see Figure 1), were synthesized following procedures already reported in the literature [8]. The Zn2+ solutions were prepared by weighing ZnCl2 Fluka salt without further purification, and standardized using EDTA (ethylenediaminetetraacetic acid) standard solutions; their purity was always ≥98% [47].

3.2. Analytical Equipment and Procedures

3.2.1. Potentiometric Tools and Procedure

A Metrohm Titrando (model 809) and a potentiometer with a combined glass electrode (Ross type 8102, from Thermo-Orion) coupled with an automatic burette were used for the potentiometric experiments. This apparatus was connected to a computer and automatic titrations were performed with MetrohmTiAMO 1.2 software, to control titrant delivery, data acquisition, and e.m.f. (electromotive force) stability. Estimated accuracy was ±0.15 mV and ±0.003 mL for e.m.f. and titrant volume readings, respectively. The titrations were carried out using 25 mL of thermostated solution under magnetic stirring. Purified presaturated nitrogen was bubbled into the solutions to keep out the presence of oxygen and carbon dioxide.
For each measurement, titrations of hydrochloride with standard sodium hydroxide solutions were performed, at the same ionic medium, ionic strength, and temperature conditions as those used for the investigated systems, to refine the electrode potential (E0), the acidic junction potential (Ej = ja[H+]), and the ionic product of water (Kw) values. The pH scale used was the free scale and pH≡ −log[H+], where [H+] is the free proton concentration. Then, 80–100 data points were collected for each titration and the equilibrium state during the experiments was checked by adopting necessary precautions, such as checking the necessary time to reach equilibrium and performing back titrations.
The acid–base properties and binding ability of L5 (Figure 1, 5.0·10−4cL5/mol L−1 ≤ 1.5·10−3) towards Zn2+ (3.9·10−4cZn2+/mol L−1 ≤ 1.0·10−3) were investigated by means of potentiometric measurements at metal/ligand ratios between 1:4 and 1:1, 0.15 ≤ I/mol L−1 ≤ 1.00 in NaCl(aq), 288.15 ≤ T/K ≤ 310.15, and in the pH range of 2.0–10.5. Zn2+/(L1L4) complexation was studied by performing potentiometric measurements at I = 0.15 mol L−1 in NaCl(aq), T = 298.15 K, in the pH range of 2.0–10.5, and with the same concentrations of ligands and metal cations used for the Zn2+/L5 system.

3.2.2. UV-Vis Spectrophotometric Equipment and Procedure

Spectrophotometric measurements were performed by means of an UV-Vis spectrophotometer (Varian Cary 50 model) equipped with an optic fiber probe, featuring a 1 cm fixed-path length. The instrument was linked to a computer and Varian Cary WinUV software was used to record the signal of absorbance (A) vs. wavelength (λ/nm). Simultaneously, potentiometric data were collected using a combined glass electrode (Thermo-Orion Ross type 8102) connected to a potentiometer. A Metrohm 665 automatic burette was used to deliver the sodium hydroxide titrant in 25 mL thermostated cells. A magnetic stirrer ensured the homogeneity of the solutions during the measurements. N2(g) was bubbled in the solutions for at least 5 min before starting the titrations, with the purpose of excluding the possible presence of atmospheric oxygen and carbon dioxide.
UV-Vis spectrophotometric titrations were carried out in NaCl(aq) at 0.15 ≤ I/mol L−1 ≤ 1.00, 288.15 ≤ T/K ≤ 310.15, and in the wavelength range of 200 ≤ λ/nm ≤ 800, to study L2 (4.0·10−5cL/mol L−1 ≤ 6.0·10−5) protonation and binding ability towards Zn2+ (2.0·10−5cZn2+/mol L−1 ≤ 6.0·10−5), with metal/ligand ratios between 1:4 and 1:1. The metal complexation by the other ligands (L1, L3L5, Figure 1) was investigated by performing measurements at I = 0.15 mol L−1 in NaCl(aq), T = 298.15 K, 2.0 ≤ pH ≤ 10.5. An analogous wavelength range and the concentrations of 3-hydroxy-4-pyridinones and Zn2+ used for the Zn2+/L2 system were also selected for these metal–ligands investigations.

3.2.3. 1H NMR Apparatus and Procedure

1H NMR measurements were recorded using a Bruker AVANCE 300 operating at 300 MHz in 9:1 H2O/D2O solution. The chemical shifts were measured with respect to 1,4-dioxane and converted relative to tetramethylsilane (TMS), employing δ(dioxane) = 3.70 ppm. The acid–base properties of L2 have already been investigated and are reported elsewhere [8], whilst L5 behavior in aqueous solution was studied using 1H NMR titrations in 1.0·10−2 mol L−1 ligand solutions, in the pH range of 2.0–11.0, with I = 0.15 mol L−1 in NaCl(aq) and T = 298.15 K. The spectra of the Zn2+-containing solutions in the presence of L2 or L5 were recorded by adding known volumes of a sodium hydroxide solution to mixtures of the ligands (5.0·10−3cL/mol L−1 ≤ 1.0·10−2) and the metal cation (2.5·10−3cZn2+/mol L−1 ≤ 1.0·10−2), in the same ionic medium and pH range already mentioned.

3.2.4. MS Spectroscopy Apparatus and Procedure

Electrospray mass (ESI-MS) spectrometric spectra were recorded on an Agilent LC/MS instrument in positive ion mode using a LC/QQQ 6420 series spectrometer equipped with an electrospray ionization source model G1948B. The instrument was used as simple ESI-MS equipment, thus the column was bypassed and 5 µL of the samples were introduced by flow injection analysis, with water as the solvent flow phase at a flow rate of 0.4 mL min−1. Preliminary experiments were performed to establish optimal experimental settings for the ESI-MS conditions, which were capillary voltage 4 kV, fragmentor voltage 135 V, and source temperature 300 °C. Nitrogen was used as the nebulization and desolvation gas at 15 psi and 11 L min−1. Spectra were obtained in MS2 scan mode with the Agilent software Masshunter B.06.00.
The mass spectra of L5, Zn2+, and their mixtures were investigated at I = 0.15 and 1.00 mol L−1 in NaCl(aq) and in the absence of ionic medium. Ligand and metal concentrations were 1.0·10−3cL/mol L−1 ≤ 5.4·10−3 and 1.0·10−3cZn2+/mol L−1 ≤ 5.0·10−3, respectively. The pH of each measurement solution was adjusted using NaOH standard solutions.

3.3. Computer Programs

The determination of the acid–base titration parameters, such as E0, pKw, and ja, and analytical concentration of reagents was carried out using the non-linear least squares ESAB2M [48] computer program. The potentiometric data were elaborated using the BSTAC [49] computer program and checks were performed by means of the HYPERQUAD 2008 software [50]. This last program was also used to analyze UV-Vis spectrophotometric data. Since for L5 protonation investigations, as well as for Zn2+/L5 and Zn2+/L2 1H-NMR titrations, protons were found to rapidly exchange on the NMR time scale, HypNMR was employed to calculate the individual chemical shifts of all the species present at equilibria, together with the protonation constants, as well as the stability constants [51]. The LIANA [52] computer program was used to refine the parameters for the dependence of thermodynamic parameters on ionic strength and temperature. HySS program [53] allowed the calculation of species formation percentages and the representation of distribution or speciation diagrams.

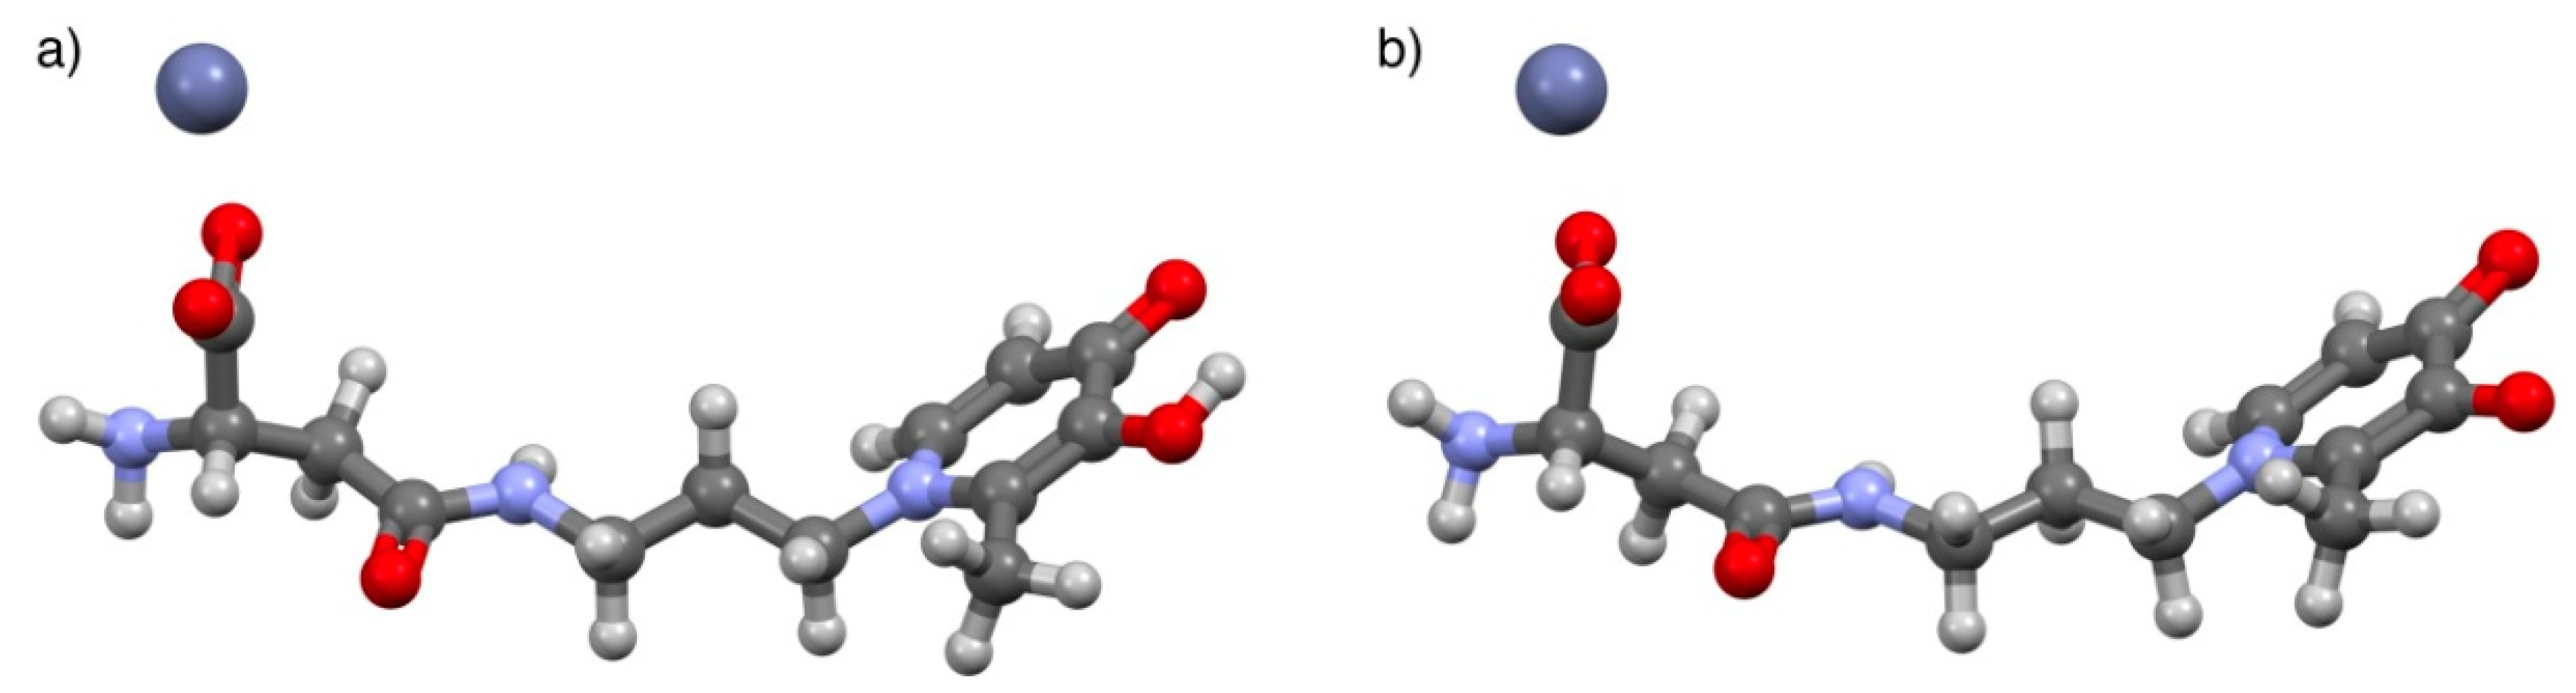
3.4. Computational Studies

The conformational analysis of the Zn2+/L2 and Zn2+/L5 systems was carried out with the molecular mechanics force field (MMFF) by using the Monte Carlo method to randomly sample the conformational space.
For the Zn2+/L5 complexes, the equilibrium geometries were further refined using semi-empirical methods (PM6), and finally optimized at the density functional level of theory (DFT, B3LYP functional) using the 6-31G(d) basis set.
As for the Zn2+/L2 complexes, the conformational analysis was carried out in a water cluster consisting of 100 explicit solvent (water) molecules with the molecular mechanics force field (MMFF), without constraints. The geometry obtained was further refined by semiempirical methods at the PM6 level. All quantum mechanical calculations were performed using Spartan’10 (Wavefunction, Inc., California) [54].

4. Conclusions

The acid–base behavior of two bifunctional 3-hydroxy-4-pyridinone ligands, namely L2 and L5, which are derivatives of deferiprone, was investigated by potentiometric, UV-Vis spectrophotometric, and 1HNMR titrations at different temperatures and ionic strengths in NaCl(aq). Regarding the protonation of L2, the results of UV-Vis studies conducted at different I values showed a speciation model with a general trend of protonations occurring at slightly higher pH values with ionic strength, probably due to a noteworthy contribution of the ionic medium to the ligand speciation in aqueous solution. The speciation model obtained for L5 was confirmed by means of 1H NMR spectroscopic titrations performed at I = 0.15 mol L−1 and T = 298.15 K. This analytical technique resulted an effective tool to possibly attribute the protonation constants to the corresponding functional groups. Furthermore, a speciation study of both 3-hydroxy-4-pyridinones in the presence of Zn2+ was performed under the same experimental conditions as the protonation study; an investigation at I = 0.15 mol L−1 and T = 298.15 K was also carried out for the other three Zn2+/Lz− systems with ligands belonging to the same class of compounds. The elaboration of the experimental data allowed the determination of overall and stepwise stability constants and metal–ligand species with different stoichiometry (ZnpLqHr(2p+r−qz)). The obtained values were in accordance with the different analytical techniques and with the data already reported in the literature for ligands with analogous structures and protonable groups. ESI-MS spectrometric measurements performed under different experimental conditions confirmed the formation of 1:1 zinc–L5 species. Computational studies provided useful information on the geometry of metal–ligand coordination, showing that L2 binds with Zn2+ mainly by its carboxylate moiety, whereas L5, in all the pH ranges where zinc–ligand species are formed, takes advantage of the hydroxo-oxo moiety of the pyridinone ring.
The dependence on ionic strength of equilibrium constants was investigated by means of two commonly used models, the extended Debye–Hückel (EDH) model and the classical specific ion interaction theory (SIT). The study of temperature effect, using the van’t Hoff equation, allowed the determination of protonation and formation enthalpy changes calculated at I = 0.15 mol L−1 and T = 298.15 K; the Gibbs free energy and the entropy change were also calculated. For both ligands, the protonation of –OH groups resulted an endothermic process, while an inverse behavior characterized the remaining sites, with reactions being exothermic in nature. Regarding Zn2+/3-hydroxy-pyridinone interactions, the enthalpic contribution resulted in the main driving force for the complex formation of ZnLH(3−z) and ZnL(2−z) species, which was exothermic in nature; the formation of Zn(L2)OH was instead characterized by an opposite tendency.
Furthermore, on the light of the comparison between the Zn2+ data reported in the present paper and those publishedin the literature for Al3+/3,4-HP complexation, from a thermodynamic point of view it is possible to affirm that no competition between Zn2+/Al3+ should occur, since the ligands are able to promote the removal of the hard metal cation from the human body, while avoiding the possibility of bio−metal (zinc) depletion. At physiological pH, I = 0.15 mol L−1 in NaCl(aq), and T = 298.15 K, the sequestering ability follows the trend: L1 > L5 > L4 > L3 > L2; in addition, it increases with I increasing, while for Zn2+/L5 species, it reaches its maximum value at T = 310.15 K.

Supplementary Materials

The following are available online, Figures S1–S11, Tables S1–S5.

Author Contributions

Conceptualization, M.A.S., S.S., C.D.S., and A.I.; formal analysis, A.I., K.C., G.G., A.P., N.M., and S.C.; investigation, A.I., P.C., and N.M.; data curation, A.I., R.M.C., F.C., and P.C.; writing—original draft preparation, A.I., P.C., G.G., and N.M.; writing—review and editing, A.I., R.M.C., and F.C.; supervision, M.A.S., S.S., and C.D.S.; project administration, M.A.S., S.S., and C.D.S.; funding acquisition, M.A.S., S.S., and C.D.S.

Funding

The authors from the University of Messina and Palermo thank Ministero dell’Istruzione, dell’Università e della Ricerca (MIUR) for financial support (co-funded by the PRIN project with prot. 2015MP34H3). The authors from (IST) University of Lisbon thank the Portuguese Fundação para a Ciência e Tecnologia (FCT) for financial support for the projects UID/QUI/00100/2013 and PEst-C/SAU/LA0001/2011-2013, and the postdoctoral fellowship (K.C.). Acknowledgements are also due to the Portuguese NMR (IST-UL Center) and Mass Spectrometry Networks (Node IST-CTN) for providing access to their facilities.

Conflicts of Interest

The authors declare no conflict of interest.

References

  1. Santos, M.A. Recent developments on 3-hydroxy-4-pyridinones with respect to their clinical applications: Mono and combined ligand approaches. Coordin. Chem. Rev. 2008, 252, 1213–1224. [Google Scholar] [CrossRef]
  2. Santos, M.A.; Chaves, S. 3-hydroxypyridinone derivatives as metal sequestering agents for therapeutic use. Future Med. Chem. 2015, 7, 383–410. [Google Scholar] [CrossRef] [PubMed]
  3. Queiros, C.; Amorim, M.J.; Leite, A.; Ferreira, M.; Gameiro, P.; de Castro, B.; Biernacki, K.; Magalhães, A.; Burgess, J.; Rangel, M. Nickel(II) and Cobalt(II) 3-Hydroxy-4-pyridinone Complexes: Synthesis, Characterization and Speciation Studies in Aqueous Solution. Eur. J. Inorg. Chem. Wiley Online Libr. 2011, 131–140. [Google Scholar] [CrossRef]
  4. Irto, A.; Cardiano, P.; Chand, K.; Cigala, R.M.; Crea, F.; De Stefano, C.; Gano, L.; Gattuso, G.; Sammartano, S.; Santos, M.A. New bis-(3-hydroxy-4-pyridinone)-NTA-derivative: Synthesis, binding ability towards Ca2+, Cu2+, Zn2+, Al3+, Fe3+ and biological assays. J. Mol. Liq. 2018, 272, 609–624. [Google Scholar] [CrossRef]
  5. Clevette, D.J.; Nelson, W.O.; Nordin, A.; Orvig, C.; Sjoeberg, S. The complexation of aluminum with N-substituted 3-hydroxy-4-pyridinones. Inorg. Chem. 1989, 28, 2079–2081. [Google Scholar] [CrossRef]
  6. Martell, A.E.; Smith, R.M.; Motekaitis, R.J. NIST Critically Selected Stability Constants of Metal Complexes Database, 8.0; National Institute of Standard and Technology: Garthersburg, MD, USA, 2004.
  7. Neilands, J.B. Microbial Iron Compounds. Annu. Rev. Biochem. 1981, 50, 715–731. [Google Scholar] [CrossRef] [PubMed]
  8. Irto, A.; Cardiano, P.; Chand, K.; Cigala, R.M.; Crea, F.; De Stefano, C.; Gano, L.; Sammartano, S.; Santos, M.A. Bifunctional 3-hydroxy-4-pyridinones as effective aluminium chelators: Synthesis, solution equilibrium studies and in vivo evaluation. J. Inorg. Biochem. 2018, 186, 116–129. [Google Scholar] [CrossRef] [PubMed]
  9. Santos, M.A.; Gil, M.; Marques, S.; Gano, L.; Cantinho, G.; Chaves, S. N-Carboxyalkyl derivatives of 3-hydroxy-4-pyridinones: Synthesis, complexation with Fe(III), Al(III) and Ga(III) and in vivo evaluation. J. Inorg. Biochem. 2002, 92, 43–54. [Google Scholar] [CrossRef]
  10. Buffle, J. Complexation Reactions in Aquatic Systems: An Analytical Approach; Ellis Horwood: Chichester, UK, 1988. [Google Scholar]
  11. Lentner, C. Geigy Scientific Tables, 8th ed.; CIBA-Geigy: Basilea, Switzerland, 1981. [Google Scholar]
  12. Millero, F.J. Physical Chemistry of Natural Waters; John Wiley & Sons, Inc.: New York, NY, USA, 2001. [Google Scholar]
  13. Kot, A.; Namiesnik, J. The role of speciation in analytical chemistry. Trends Analyt. Chem. 2000, 19, 69–79. [Google Scholar] [CrossRef]
  14. Templeton, D.M.; Ariese, F.; Cornelis, R.; Danielsson, L.G.; Muntau, H.; Van Leeuwen, H.P.; Łobinsky, R. Guidelines for terms related to chemical speciation and fractionation of elements. Definitions, structural aspects, and methological approaches. Pure App. Chem. 2000, 72, 1453–1470. [Google Scholar] [CrossRef]
  15. Deshpande, J.D.; Joshi, M.M.; Giri, P.A. Zinc: The trace element of major importance in human nutrition and health. Int. J. Med. Sci. Public Health 2013, 2, 1–6. [Google Scholar] [CrossRef]
  16. Powell, S.R. The antioxidant properties of zinc. J. Nutr. 2000, 130, 1447S–1454S. [Google Scholar] [CrossRef] [PubMed]
  17. Kaltenberg, J.; Plum, L.M.; Ober-Blöbaum, J.L.; Hönscheid, A.; Rink, L.; Haase, H. Zinc signals promote IL-2-dependent proliferation of T cells. Eur. J. Immunol. 2010, 40, 1496–1503. [Google Scholar] [CrossRef] [PubMed]
  18. Crea, F.; De Stefano, C.; Foti, C.; Milea, D.; Sammartano, S. Chelating agents for the sequestration of mercury(II) and monomethyl mercury(II). Curr. Med. Chem. 2014, 21, 3819–3836. [Google Scholar] [CrossRef] [PubMed]
  19. Foti, C.; Sammartano, S. Ionic Strength Dependence of Protonation Constants of Carboxylate Ions in NaClaq (0 ≤ I ≤ 5.6 mol·kg−1) and KClaq (0 ≤ I ≤ 4.5 mol·kg−1): Specific Ion Interaction Theory and Pitzer Parameters and the Correlation between Them. J. Chem. Eng. Data 2010, 55, 904–911. [Google Scholar] [CrossRef]
  20. Biederman, G. Ionic Media. In Dahlem Workshop on the Nature of Seawater; Dahlem Konferenzen: Berlin, Germany, 1975. [Google Scholar]
  21. Biederman, G. Introduction to the specific interaction theory with emphasis on chemical equilibria. In Metal Complexes in Solution; Jenne, E.A., Rizzarelli, E., Romano, V., Sammartano, S., Eds.; Piccin: Padua, Italy, 1986; pp. 303–314. [Google Scholar]
  22. Grenthe, I.; Puigdomenech, I. Modelling in Aquatic Chemistry; OECD: Paris, France, 1997. [Google Scholar]
  23. Stunzi, H.; Perrin, D.D.; Teitei, T.; Harris, R.L.N. Stability Constants of Some Metal Complexes Formed by Mimosine and Related Compounds. Aust. J. Chem. 1979, 32, 21–30. [Google Scholar] [CrossRef]
  24. Bretti, C.; Crea, F.; De Stefano, C.; Foti, C.; Materazzi, S.; Vianelli, G. Thermodynamic Properties of Dopamine in Aqueous Solution. Acid–Base Properties, Distribution, and Activity Coefficients in NaCl Aqueous Solutions at Different Ionic Strengths and Temperatures. J. Chem. Eng. Data 2013, 58, 2835–2847. [Google Scholar] [CrossRef]
  25. Baes, C.F.; Mesmer, R.E. The Hydrolysis of Cations; John Wyley & Sons: New York, NY, USA, 1976. [Google Scholar]
  26. Pettit, D.; Powell, K.K. Stability Constants Database, Academic Software; IUPAC: Otley, UK, 1997. [Google Scholar]
  27. Irto, A.; Cardiano, P.; Chand, K.; Cigala, R.M.; Crea, F.; De Stefano, C.; Gano, L.; Gattuso, G.; Sammartano, S.; Santos, M.A. A new bis-(3-hydroxy-4-pyridinone)-DTPA-derivative: Synthesis, complexation of di-/tri-valent metal cations and in vivo M3+ sequestering ability. J. Mol. Liq. 2019, 281, 280–294. [Google Scholar] [CrossRef]
  28. Manganaro, N.; Lando, G.; Pisagatti, I.; Notti, A.; Pappalardo, S.; Parisi, M.F.; Gattuso, G. Hydrophobic interactions in the formation of a complex between a polycationic water-soluble oxacalix [4] arene and a neutral aromatic guest. Supramol. Chem. 2016, 28, 493–498. [Google Scholar] [CrossRef]
  29. Colombo, S.; Coluccini, C.; Caricato, M.; Gargiulli, C.; Gattuso, G.; Pasini, D. Shape selectivity in the synthesis of chiral macrocyclic amides. Tetrahedron 2010, 66, 4206–4211. [Google Scholar] [CrossRef]
  30. Clarke, E.T.; Martell, A.E. Stabilities of 1,2-dimethyl-3-hydroxy-4-pyridinone chelates of divalent and trivalent metal ions. Inorg. Chim. Acta 1992, 191, 57–63. [Google Scholar] [CrossRef]
  31. Grgas-Kužnar, B.; Simeon, V.; Weber, O.A. Complexes of adrenaline and related compounds with Ni2+, Cu2+, Zn2+, Cd2+ and Pb2+. J. Inorg. Nucl. Chem. 1974, 36, 2151–2154. [Google Scholar] [CrossRef]
  32. Huang, N.; Siegel, M.M.; Kruppa, G.H.; Laukien, F.H. Automation of a Fourier transform ion cyclotron resonance mass spectrometer for acquisition, analysis, and e-mailing of high-resolution exact-mass electrospray ionization mass spectral data. J. Am. Soc. Mass Spectrom. 1999, 10, 1166–1173. [Google Scholar] [CrossRef] [Green Version]
  33. Annesley, T.M. Ion Suppression in Mass Spectrometry. Clin. Chem. 2003, 49, 1041–1044. [Google Scholar] [CrossRef] [PubMed] [Green Version]
  34. Constantopoulos, T.L.; Jackson, G.S.; Enke, C.G. Effects of salt concentration on analyte response using electrospray ionization mass spectrometry. J. Am. Soc. Mass Spectrom. 1999, 10, 625–634. [Google Scholar] [CrossRef] [Green Version]
  35. Karki, S.; Shi, F.; Archer, J.J.; Sistani, H.; Levis, R.J. Direct Analysis of Proteins from Solutions with High Salt Concentration Using Laser Electrospray Mass Spectrometry. J. Am. Soc. Mass Spectrom. 2018, 29, 1002–1011. [Google Scholar] [CrossRef] [PubMed]
  36. Cheng, Z.L.; Siu, K.W.M.; Guevremont, R.; Berman, S.S. Electrospray mass spectrometry: A study on some aqueous solutions of metal salts. J. Am. Soc. Mass Spectrom. 1992, 3, 281–288. [Google Scholar] [CrossRef] [Green Version]
  37. Crisponi, G.; Nurchi, V.M.; Zoroddu, M.A. Iron chelating agents for iron overload diseases. Thalass. Rep. 2014, 4, 2046. [Google Scholar]
  38. Crisponi, G.; Remelli, M. Iron chelating agents for the treatment of iron overload. Coordin. Chem. Rev. 2008, 252, 1225–1240. [Google Scholar] [CrossRef]
  39. Nurchi, V.M.; Crisponi, G.; Pivetta, T.; Donatoni, M.; Remelli, M. Potentiometric, spectrophotometric and calorimetric study on iron(III) and copper(II) complexes with 1,2-dimethyl-3-hydroxy-4-pyridinone. J. Inorg. Biochem. 2008, 102, 684–692. [Google Scholar] [CrossRef] [PubMed]
  40. Bretti, C.; Cigala, R.M.; Crea, F.; Lando, G.; Sammartano, S. Thermodynamics of proton binding and weak (Cl-, Na+ and K+) species formation, and activity coefficients of 1,2-dimethyl-3-hydroxypyridin-4-one (deferiprone). J. Chem. Thermodyn. 2014, 77, 98–106. [Google Scholar] [CrossRef]
  41. Bretti, C.; Cigala, R.M.; De Stefano, C.; Lando, G.; Sammartano, S. Thermodynamics for Proton Binding of Pyridine in Different Ionic Media at Different Temperatures. J. Chem. Eng. Data 2014, 59, 143–156. [Google Scholar] [CrossRef]
  42. Desai, A.G.; Kabadi, M.B. Stepwise stability constants of complexes of pyridine and substituted pyridines with zinc (II). J. Inorg. Nucl. Chem. 1966, 28, 1279–1282. [Google Scholar] [CrossRef]
  43. Kapinos, L.E.; Sigel, H. Acid–base and metal ion binding properties of pyridine-type ligands in aqueous solution.: Effect of ortho substituents and interrelation between complex stability and ligand basicity. Inorg. Chim. Acta 2002, 337, 131–142. [Google Scholar] [CrossRef]
  44. Desai, A.G.; Kabadi, M.B. On the ratio of successive stepwise complex formation constants: Zinc and cadmium complexes of pyridine and substituted pyridines. Recueil des Travaux Chimiques des Pays-Bas 1965, 84, 1066–1070. [Google Scholar] [CrossRef]
  45. Sajadi, S.A.A. Metal ion-binding properties of L-glutamic acid and L-aspartic acid, a comparative investigation. Nat. Sci. 2010, 2, 85–90. [Google Scholar] [CrossRef] [Green Version]
  46. Öhman, L.O. Equilibrium Studies of Ternary Aluminium (III) Hydroxo Complexes with Ligands Related to Conditions in Natural Waters. Ph.D. Thesis, University of Umeà, Umeà, Sweden, 1983. [Google Scholar]
  47. Flaschka, H.A. EDTA Titration; Pergamon Press: London, UK, 1959. [Google Scholar]
  48. De Stefano, C.; Princi, P.; Rigano, C.; Sammartano, S. Computer Analysis of Equilibrium Data in Solution. ESAB2M: An Improved Version of the ESAB Program. Ann. Chim. (Rome) 1987, 7, 643–675. [Google Scholar]
  49. De Stefano, C.; Foti, C.; Giuffrè, O.; Mineo, P.; Rigano, C.; Sammartano, S. Binding of Tripolyphosphate by Aliphatic Amines: Formation, Stability and Calculation Problems. Ann. Chim. (Rome) 1996, 86, 257–280. [Google Scholar]
  50. Gans, P.; Sabatini, A.; Vacca, A. Investigation of equilibria in solution. Determination of equilibrium constants with the HYPERQUAD suite programs. Talanta 1996, 43, 1739–1753. [Google Scholar] [CrossRef]
  51. Frassineti, C.; Ghelli, S.; Gans, P.; Sabatini, A.; Moruzzi, M.S.; Vacca, A. Nuclear Magnetic Resonance as a Tool for Determining Protonation Constants of Natural Polyprotic Bases in Solution. Anal. Biochem. 1995, 231, 374–382. [Google Scholar] [CrossRef] [PubMed]
  52. De Stefano, C.; Sammartano, S.; Mineo, P.; Rigano, C. Computer Tools for the Speciation of Natural Fluids. In Marine Chemistry—An Environmental Analytical Chemistry Approach; Gianguzza, A., Pelizzetti, E., Sammartano, S., Eds.; Kluwer Academic Publishers: Amsterdam, The Netherlands, 1997; pp. 71–83. [Google Scholar]
  53. Alderighi, L.; Gans, P.; Ienco, A.; Peters, D.; Sabatini, A.; Vacca, A. Hyperquad simulation and speciation (HySS): A utility program for the investigation of equilibria involving soluble and partially soluble species. Coord. Chem. Rev. 1999, 184, 311–318. [Google Scholar] [CrossRef]
  54. Shao, Y.; Molnar, L.F.; Jung, Y.; Kussmann, J.; Ochsenfeld, C.; Brown, S.T.; Gilbert, A.T.B.; Slipchenko, L.V.; Levchenko, S.V.; O’Neill, D.P.; et al. Advances in methods and algorithms in a modern quantum chemistry program package. Phys. Chem. Chem. Phys. 2006, 8, 3172–3191. [Google Scholar] [CrossRef] [PubMed]
Sample Availability: Not available.
Figure 1. Structures of the 3-hydroxy-4-pyridinones under study, with protonable groups highlighted with rectangles. The letters represent for the proton nuclear magnetic resonance (1H NMR) titration peak assignment.
Molecules 24 04084 g001
Figure 2. Trend of logK1H (a), logK2H (b), logK3H (c), and logK4H (d) L2 protonation constants vs. the ionic strength (in mol L−1) in NaCl(aq) and T = 298.15 K.
Molecules 24 04084 g002aMolecules 24 04084 g002b
Figure 3. (A) Distribution diagram of L2 (cL = 5.3·10−5 mol L−1) species at T = 298.15 K and I = 0.506 (a) and 1.012 (b) mol L−1 in NaCl(aq). Species: (1) H4(L2)2+; (2) H3(L2)+; (3) H2(L2)0(aq); (4) H(L2); (5) (L2)2−. (B) UV-Vis spectrophotometric titration curves of L2 underthe same experimental conditions as for the distribution diagram and at different pH values. At I = 0.506 mol L−1: (1) pH = 2.01, λmax = 278 nm; (2) pH = 3.62, λmax = 275 nm; (3) pH = 4.90, λmax = 283 nm; (4) pH = 7.39, λmax = 285 nm; (5) pH = 9.68, λmax = 290 nm; (6) pH = 10.56, λmax = 310 nm; (7) pH = 11.00, λmax = 310 nm. At I = 1.012 mol L−1: (1′) pH = 2.00, λmax = 278 nm; (2′) pH = 3.59, λmax = 279 nm; (3′) pH = 4.50, λmax = 280 nm; (4′) pH = 8.40, λmax = 283 nm; (5′) pH = 9.84, λmax = 296 nm; (6′) pH = 10.60, λmax = 310 nm; (7′) pH = 10.99, λmax = 311 nm.
Molecules 24 04084 g003
Figure 4. Distribution diagram of L5 (cL = 1.0·10−3 mol L−1) species at T = 298.15 K, I = 0.473 (a) and I = 1.008 (b) mol L−1 in NaCl(aq). Species: (1) H3(L5)2+; (2) H2(L5)+; (3) H(L5)0(aq); (4) (L5).
Molecules 24 04084 g004
Figure 5. Distribution diagrams of Zn2+/L1 (a) and L4 (b) (cZn2+ = 4.310−4 mol L−1, cL = 1.2·10−3 mol L−1) species at I = 0.150 mol L−1 in NaCl(aq), T = 298.15 K. (a) Species: (1) free Zn2+; 2. Zn(L1)0(aq); (3) Zn(L1)OH. (b) Species: (1) free Zn2+; 2. Zn(L4)H+; (3) Zn(L4)0(aq); (4) Zn(L4)OH.
Molecules 24 04084 g005
Figure 6. Ball-and-stick views of the PM3-optimized geometry (calculated within a cluster of 100 explicit water molecules) of the Zn2+/L2 species: (a) Zn(L2)H+ and (b) Zn(L2)0(aq). Oxygen = red; carbon = grey; hydrogen = white, nitrogen = blue; zinc = dark blue.
Molecules 24 04084 g006
Figure 7. Trends of Zn2+/L2 suggested logβ110 values vs. the ionic strength (mol L−1) in NaCl(aq) and T = 298.15 K (a) and vs. the temperature at I = 0.15 mol L−1 (b).
Molecules 24 04084 g007
Figure 8. Observed (□) and calculated (○) values of chemical shifts of: a (1), c (2), d (3), and f (4) nuclei of L5 in Zn2+/L5 system vs. pH at cZn2+ = 3.3·10−2 mol L−1, cL = 1.0·10−2 mol L−1, and I = 0.15 mol L−1 in NaCl(aq) and T = 298.15 K.
Molecules 24 04084 g008aMolecules 24 04084 g008b
Figure 9. Ball-and-stick views of the DFT-optimized geometry (B3LYP/6-31G(d)) of the Zn2+/L5 species: (a) Zn(L5)H2+ and (b) Zn(L5)+. Oxygen = red; carbon = grey; hydrogen = white, nitrogen = blue; zinc = dark blue.
Molecules 24 04084 g009
Figure 10. Sequestration diagrams of Zn2+/L2 and L5 species with different pH (a,b), ionic strength (c), and temperature (d) values.
Molecules 24 04084 g010aMolecules 24 04084 g010b
Table 1. Experimental overall 1 and stepwise 2 protonation constants of L2 and L5 ligands at different temperatures and ionic strengths in NaCl(aq).
LigandI/mol L−1T/KlogβrH 1 (logKrH) 2
HL(1−z)H2L(2−z)H3L(3−z)H4L(4−z)
L230.149288.1510.28 ± 0.01419.56 ± 0.01 4
(9.28)
24.29 ± 0.08 4
(4.73)
27.46 ± 0.08 4
(3.17)
0.506298.159.962 ± 0.00517.63 ± 0.03
(7.668)
22.52 ± 0.02
(4.89)
25.62 ± 0.02
(3.10)
0.744298.159.882 ± 0.00817.25 ± 0.07
(7.365)
22.18 ± 0.10
(4.93)
25.41 ± 0.10
(3.23)
1.012298.1510.059 ± 0.00116.78 ± 0.02
(6.721)
21.18 ± 0.03
(4.40)
24.91 ± 0.12
(3.73)
L550.166288.1510.53 ± 0.03 419.92 ± 0.02 4
(9.39)
23.58 ± 0.03 4
(3.66)
-
0.165298.1510.82 ± 0.0720.44 ± 0.06
(9.62)
24.02 ± 0.07
(3.58)
-
0.140298.1511.20 6 ± 0.0220.466 6 ± 0.006
(9.266)
23.679 6 ± 0.007
(3.213)
-
0.473298.159.99 ± 0.0119.17 ± 0.01
(9.18)
22.46 ± 0.01
(3.29)
-
0.723298.159.79 ± 0.0318.86 ± 0.03
(9.07)
22.02 ± 0.04
(3.16)
-
1.008298.1510.31 ± 0.0219.32 ± 0.03
(9.01)
23.38 ± 0.06
(4.06)
-
Note: 1 logβrH refers to Equation (2); 2 logKrH refers to Equation (1); 3 data obtained by means of ultraviolet-visible (UV-Vis) spectrophotometric measurements; 4 standard deviation; 5,6 protonation constants determined by potentiometric and 1H NMR titrations, respectively.
Table 2. Overall 1, stepwise 2 experimental, and average 3 stability constants of Zn2+/3-hydroxy-4-pyridinone species obtained by potentiometric 4, UV-Vis spectrophotometric 5, and 1H NMR 6 spectroscopic measurements at I = 0.15 mol L−1 in NaCl(aq) and T = 298.15 K.
logβpqr 1
(logKpqr) 2
logβpqr 1
(logKpqr) 2
logβpqr 1
(logKpqr) 2
I/mol L−10.1460.1470.1500.1450.1500.148
SpeciesL1L2L3
ZnLH(3−z)-15.50 4 ± 0.06 7
(4.77)
15.51 5 ± 0.08 7(4.78)15.79 6 ± 0.31 7
(5.05)
15.56 3 ± 0.08 8
(4.83)
17.06 4 ± 0.09 6
(6.10)
ZnL(2−z)7.27 4 ± 0.03 78.12 ± 0.068.11 ± 0.048.54 ± 0.488.20 ± 0.109.52 ± 0.06
ZnL(OH)(1−z)0.25 ± 0.07
(9.45) 9
−0.72 ± 0.09
(8.48) 9
−0.55 ± 0.04
(8.64) 9
−0.72 ± 0.09
(8.64) 9
−0.68 ± 0.06
(8.56) 9
0.70 ± 0.08
(9.90) 9
logβpqr 1
(logKpqr) 2
logβpqr 1
(logKpqr) 2
I/mol L−10.1450.1500.1470.1490.1500.1450.150
SpeciesL4L5
ZnLH(3−z)16.69 4 ± 0.05 7
(5.59)
16.68 5 ± 0.20 7
(5.58)
16.68 3 ± 0.02 8
(5.58)
17.21 4 ± 0.06 7
(6.13)
17.41 5 ± 0.07 7
(6.33)
17.64 6 ± 0.08 7
(6.56)
17.46 3 ± 0.09 8 (6.38)
ZnL(2−z)9.68 ± 0.049.68 ± 0.109.68 ± 0.089.89 ± 0.089.08 ± 0.029.04 ± 0.049.22 ± 0.20
ZnL(OH)(1−z)0.60 ± 0.09
(9.80) 9
0.33 ± 0.20
(9.53) 9
0.46 ± 0.08
(9.66) 9
----
Note: 1 logβpqr refers to Equation (5); 2 logKpqr refers to Equation (4); 3 values obtained by averaging potentiometric, UV–Vis spectrophotometric, and 1H NMR spectroscopic data; 4,5,6 logβpqr determined by potentiometry, UV-Vis spectrophotometry, and 1H NMR spectroscopy, respectively; 7 standard deviation; 8 errors on weighed data; 9 logK11–1 refers to equilibrium: Zn(OH)+ + Lz− = ZnL(OH)(1−z).
Table 3. Overall 1 and stepwise 2 experimental stability constants of Zn2+/L2 and L5 species determined at different ionic strengths and temperatures in NaCl(aq).
SystemI/mol L−1T/Klogβ111 1
(logK111) 2
logβ110 1,2logβ11−1 1
(logK11−1) 3
Zn2+/L20.147288.1515.90 1 ± 0.03 4
(5.62)
8.791 ± 0.104−1.50 1 ± 0.12 4
(8.18)3
0.501298.1514.95 ± 0.05
(4.99)
8.34 ± 0.03−1.26 ± 0.05
(7.82)
0.759298.1514.97 ± 0.10
(5.085)
8.839 ± 0.009−1.055 ± 0.009
(8.067)
1.005298.1515.47 ± 0.08
(5.44)
9.26 ± 0.01−0.804 ± 0.003
(8.357)
0.152310.1515.50 ± 0.04
(4.51)
7.93 ± 0.160.47 ± 0.04
(9.25)
Zn2+/L50.161288.1517.51 1 ± 0.10 4
(6.97)
9.671 ± 0.104-
0.472298.1516.45 ± 0.02
(6.46)
9.03 ± 0.04-
0.725298.1516.09 ± 0.04
(6.29)
8.91 ± 0.06-
0.951298.1516.75 ± 0.09
(6.44)
8.49 ± 0.11-
0.155310.1516.65 ± 0.10
(6.08)
8.08 ± 0.11-
Note: 1 logβpqr refers to Equation (4); 2 logKpqr refers to Equation (5); 3 logK11–1 refers to equilibrium: Zn(OH)+ + L2− = ZnL(OH); 4 standard deviation.
Table 4. ESI-MS signals obtained for L5, Zn2+, and Zn2+/L5 systems.
SpeciesTheoretical m/zExperimental m/zFormula
[H(L5) + H]+183.11183.1C9H15N2O2
[H(L5) + Na]+205.10205.1C9H14N2NaO2
[H(L5) + K]+221.07221.1C9H14N2KO2
[Zn(H2O)3]2+58.9859.0ZnH6O3
[Zn + NaCl]2+60.9461.0ZnClNa
[Zn(H2O)5]2+76.9976.9ZnH10O5
[Zn(OH)]+80.9381.0ZnHO
[Zn(OH)(H2O)]+98.9498.9ZnH3O2
[Zn(H2O)6(L5) + H + NaCl]2+206.03206.0ZnC9H26N2ClNaO8
Table 5. Thermodynamic parameters for the dependence on ionic strength and temperature of L2 and L5 protonation, and Zn2+ complex formation in NaCl(aq) at T = 298.15 K.
SpecieslogTβpqr 1 (logTKpqr) 2C 3Δε 4ΔH 5,6
(Stepwise ΔH)
ΔG 5,6
(Stepwise ΔG)
TΔS5,6
(Stepwise TΔS)
H(L2)11.32 ± 0.08 7−0.71 ± 0.10 7−0.69 ± 0.15 755 ± 12 7−61.2 ± 0.2 7116 ± 4 7
H2(L2)0(aq)20.54 ± 0.02
(9.22)
−2.72 ± 0.07−2.74 ± 0.15−200 ± 3
(−255)
−111.4 ± 0.5 (−50.2)−88 ± 3
(−204)
H3(L2)+25.35 ± 0.03
(4.81)
−2.94 ± 0.02−2.88 ± 0.07−260 ± 4
(−60)
−137.9 ± 0.5 (−26.5)−122 ± 6
(−34)
H4(L2)2+28.34 ± 0.04
(2.99)
−2.88 ± 0.02−2.86 ± 0.10−269 ± 14
(−9)
−156.5 ± 0.5
(−18.6)
−112 ± 6
(10)
Zn(L2)H+16.26 ± 0.12
(4.94)
0.59 ± 0.100.64 ± 0.07−27 ± 9
(−80)
−88.5 ± 0.2
(−27.4)
61 ± 8
(−53)
Zn(L2)0(aq)8.77 ± 0.052.12 ± 0.062.01 ± 0.01−62 ± 1−46.3 ± 0.2−16 ± 1
Zn(L2)OH−0.10 ± 0.01
(8.86)
0.25 ± 0.100.37 ± 0.05153 ± 3
(96)
3.0 ± 0.2
(−49.4)
150 ± 3
(146)
H(L5)0(aq)11.12 ± 0.10 7−0.83 ± 0.10 7−0.80 ± 0.1971 ± 4 7−63 ± 0.4 764 ± 4 7
H2(L5)+20.54 ± 0.10
(9.42)
−1.26 ± 0.20−1.24 ± 0.20−271 ± 2
(−272)
−112.6 ± 1.1 (−49.6)−158 ± 7
(−222)
H3(L5)2+23.86 ± 0.08
(3.32)
−1.42 ± 0.20−1.50 ± 0.32−322 ± 12
(−51)
−135.1 ± 1.1 (−22.5)−187 ± 12
(−29)
Zn(L5)H2+17.33 ± 0.18
(6.00)
−0.60 ± 0.09−0.49 ± 0.14−65 ± 8
(−66)
−97.7 ± 0.3
(−34.7)
33 ± 8
(−31)
Zn(L5)+10.57 ± 0.10−1.24 ± 0.11−1.38 ± 0.10−127 ± 15−52.1 ± 0.8−75 ± 15
Note: 1,2 logTβpqr and logTKpqr refer to Equations (1) and (2), and (4)–(6), respectively, and are calculated under infinite dilution; in the molal concentration scale, their values are very similar to the results reported in molar one, with maximum differences of 0.002 logarithmic units; 3 parameter determined using Equation (7); 4 parameter calculated using Equation (8); 5 in kJ mol−1; 6 at I = 0.15 mol kg−1; 7 standard deviation.
Table 6. Literature protonation constants reported at different temperatures, ionic strengths, and ionic media in molar concentration scale.
LigandI/molL−1T/KIonic MediumlogK1HlogK2HlogK3HlogK4HRef.
DFP0.099283.15NaCl10.003.80--[40]
0.152298.15NaCl9.823.67--[40]
0.150 NaCl9.863.70--[5]
0.495 NaCl9.703.74--[40]
1.005 NaCl9.663.83--[40]
0.100310.15NaCl9.703.60--[40]
0.100298.15KCl9.823.66--[39]
0.150 KCl9.823.66--[37,38]
0.150 KCl9.773.68--[30]
0.500 KCl9.783.75--[39]
1.000 KCl9.753.80--[39]
0.100310.15KCl9.703.57--[39]
Pyridine0.294283.15NaCl5.50---[41]
0.197298.15NaCl5.28---[41]
0.480 NaCl5.37---[41]
0.960 NaCl5.52---[41]
2.018310.15NaCl5.66---[41]
Dopamine0.147288.15NaCl10.619.41--[24]
0.162298.15NaCl10.599.18--[24]
0.504 NaCl10.449.07--[24]
0.737 NaCl10.2788.99--[24]
0.982 NaCl10.258.85--[24]
0.165310.15NaCl10.028.69--[24]
0.500303.15NaNO312.0510.609.06-[31]
Aspartic acid0.100298.15Na+9.663.711.95-[6]
0.500 Na+9.583.681.98-[6]
1.000 NaCl9.613.642.00-[6]
0.150310.15Na+9.333.641.94-[6]
Mimosine0.150310.15KNO38.867.002.621.10[23]
Table 8. The pL0.5 1 values of Zn2+/ligand systems with different pH, ionic strengths, and temperatures in NaCl(aq).
SystempHpL0.5I/mol L−1T/KSystempHpL0.5I/mol L−1T/K
Zn2+/L12.5<1.00.15298.15Zn2+/L27.46.30.75298.15
3.0<1.00.15298.15 7.46.81.00298.15
4.01.00.15298.15 7.45.20.15310.15
5.02.50.15298.15Zn2+/L37.44.20.15298.15
6.03.60.15298.15Zn2+/L47.44.40.15298.15
7.45.50.15298.15Zn2+/L57.45.40.15288.15
8.16.70.15298.15 2.5<1.00.15298.15
9.07.60.15298.15 3.0<1.00.15298.15
10.07.30.15298.15 4.0<1.00.15298.15
Zn2+/L27.46.30.15288.15 5.02.00.15298.15
2.5<1.00.15298.15 6.03.00.15298.15
3.0<1.00.15298.15 7.44.70.15298.15
4.0<1.00.15298.15 8.15.80.15298.15
5.01.00.15298.15 9.06.60.15298.15
6.02.00.15298.15 10.04.70.15298.15
7.43.80.15298.15 7.45.20.50298.15
8.15.00.15298.15 7.45.30.75298.15
9.05.70.15298.15 7.45.11.00298.15
10.05.50.15298.15 7.46.30.15310.15
7.45.60.50298.15
Values calculated using Equation (12).

