Human Serum Albumin Aggregation/Fibrillation and its Abilities to Drugs Binding

 , ,
, ,
Abstract
:
1. Introduction
2. Materials and Methods
2.1. Chemicals
2.2. Methods
2.2.1. Sample Preparation
2.2.2. Emission, Synchronous and Absorption Spectra Measurements
2.2.3. Circular Dichroism (CD) Measurements
2.3. Statistics
3. Results and Discussion
3.1. In-Vitro Quantitative Assesment of Amyloid Fibrils
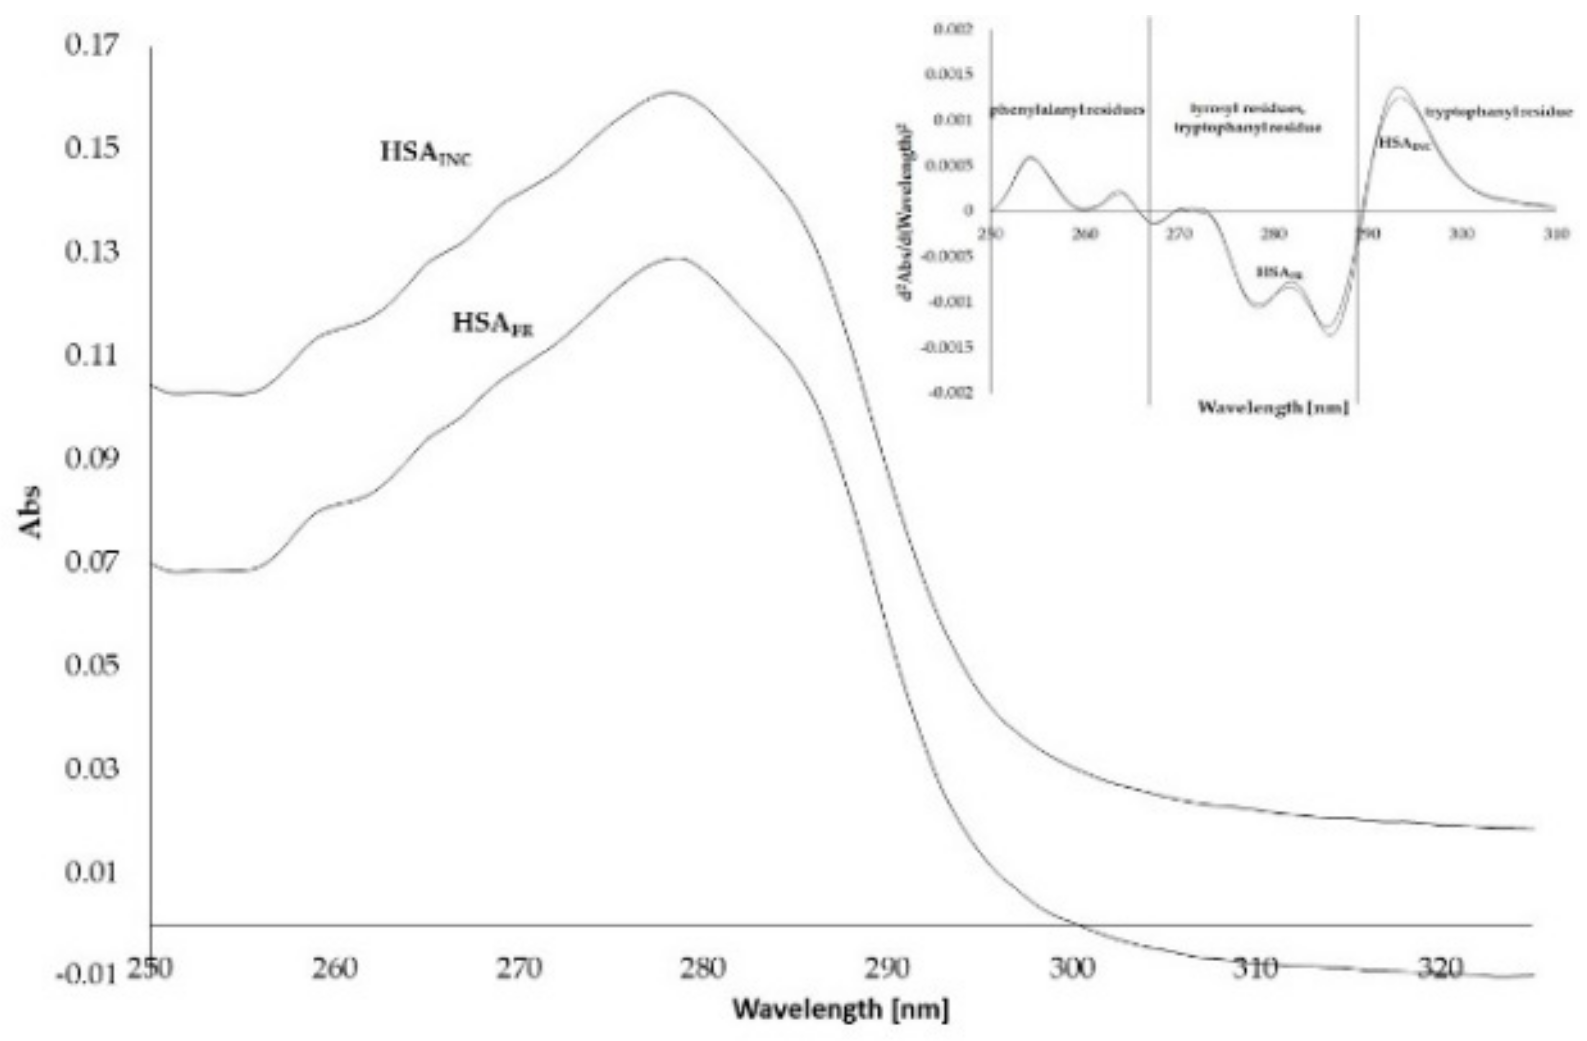
3.2. Absorption Spectra of Human Serum Albumin (HSA)
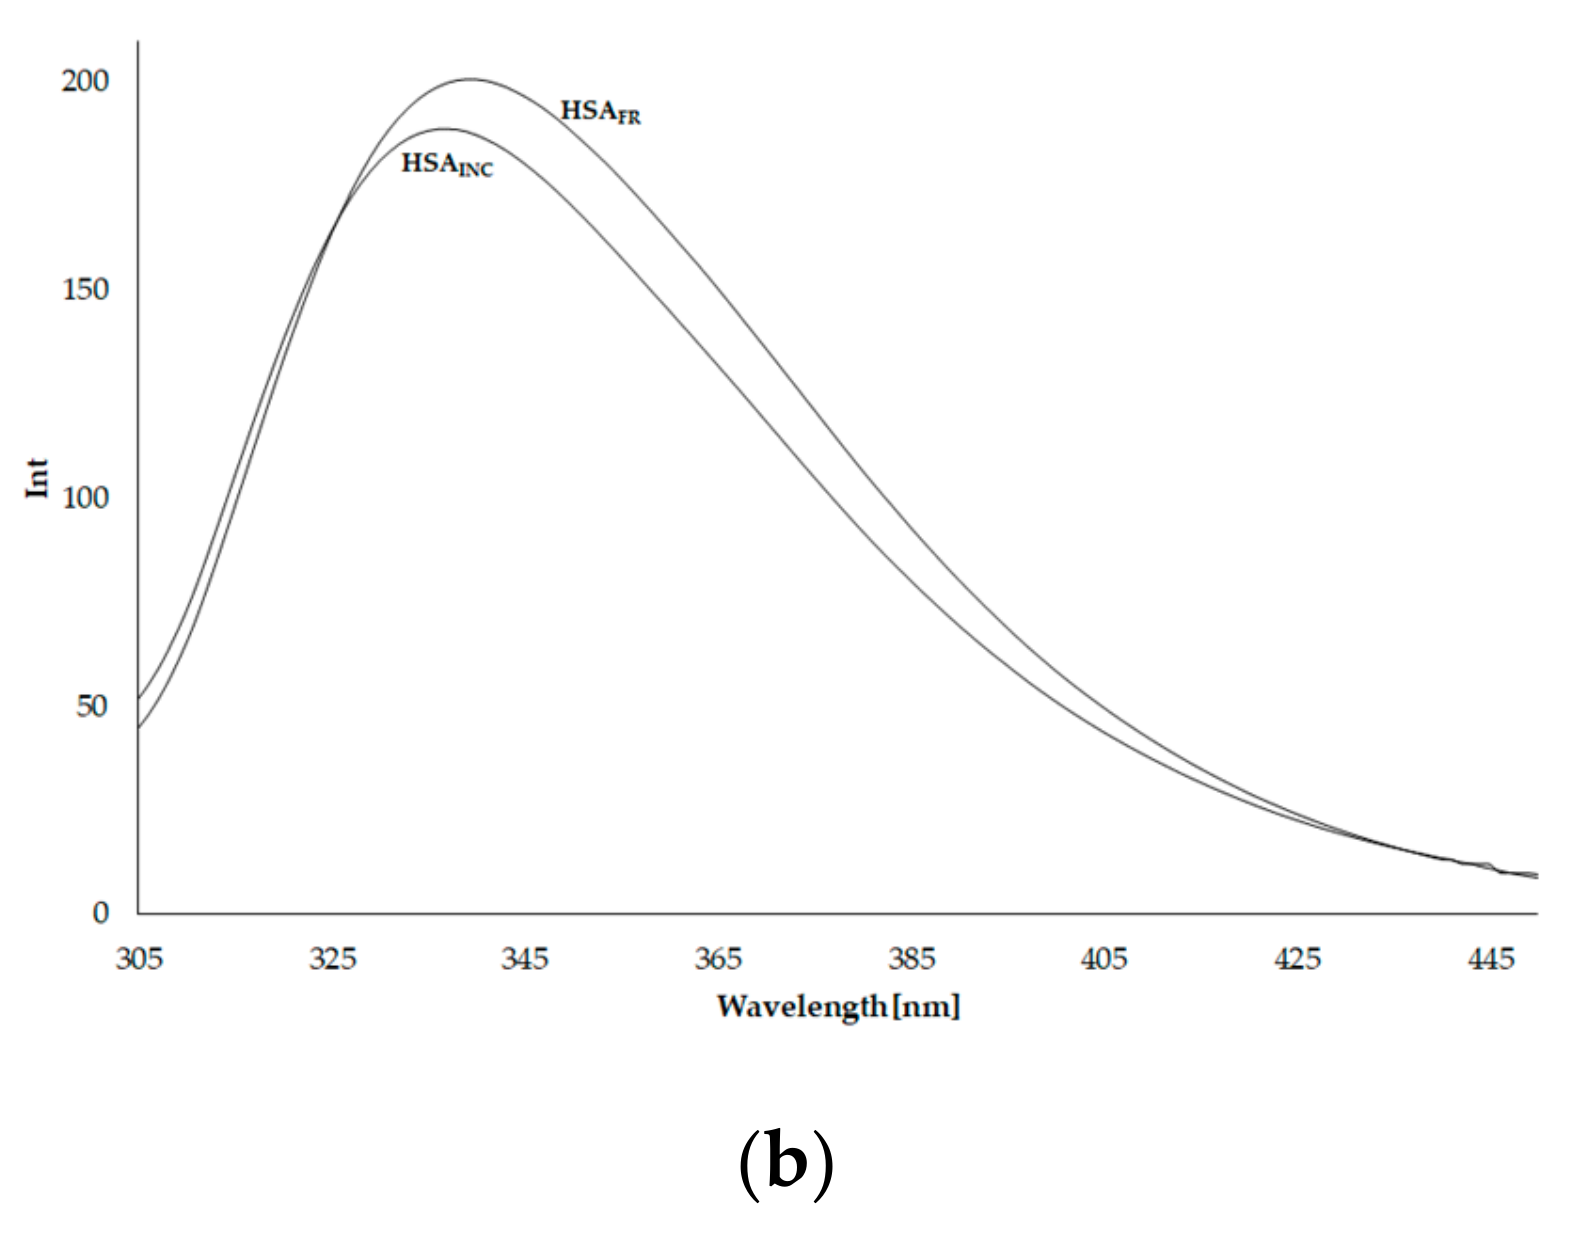
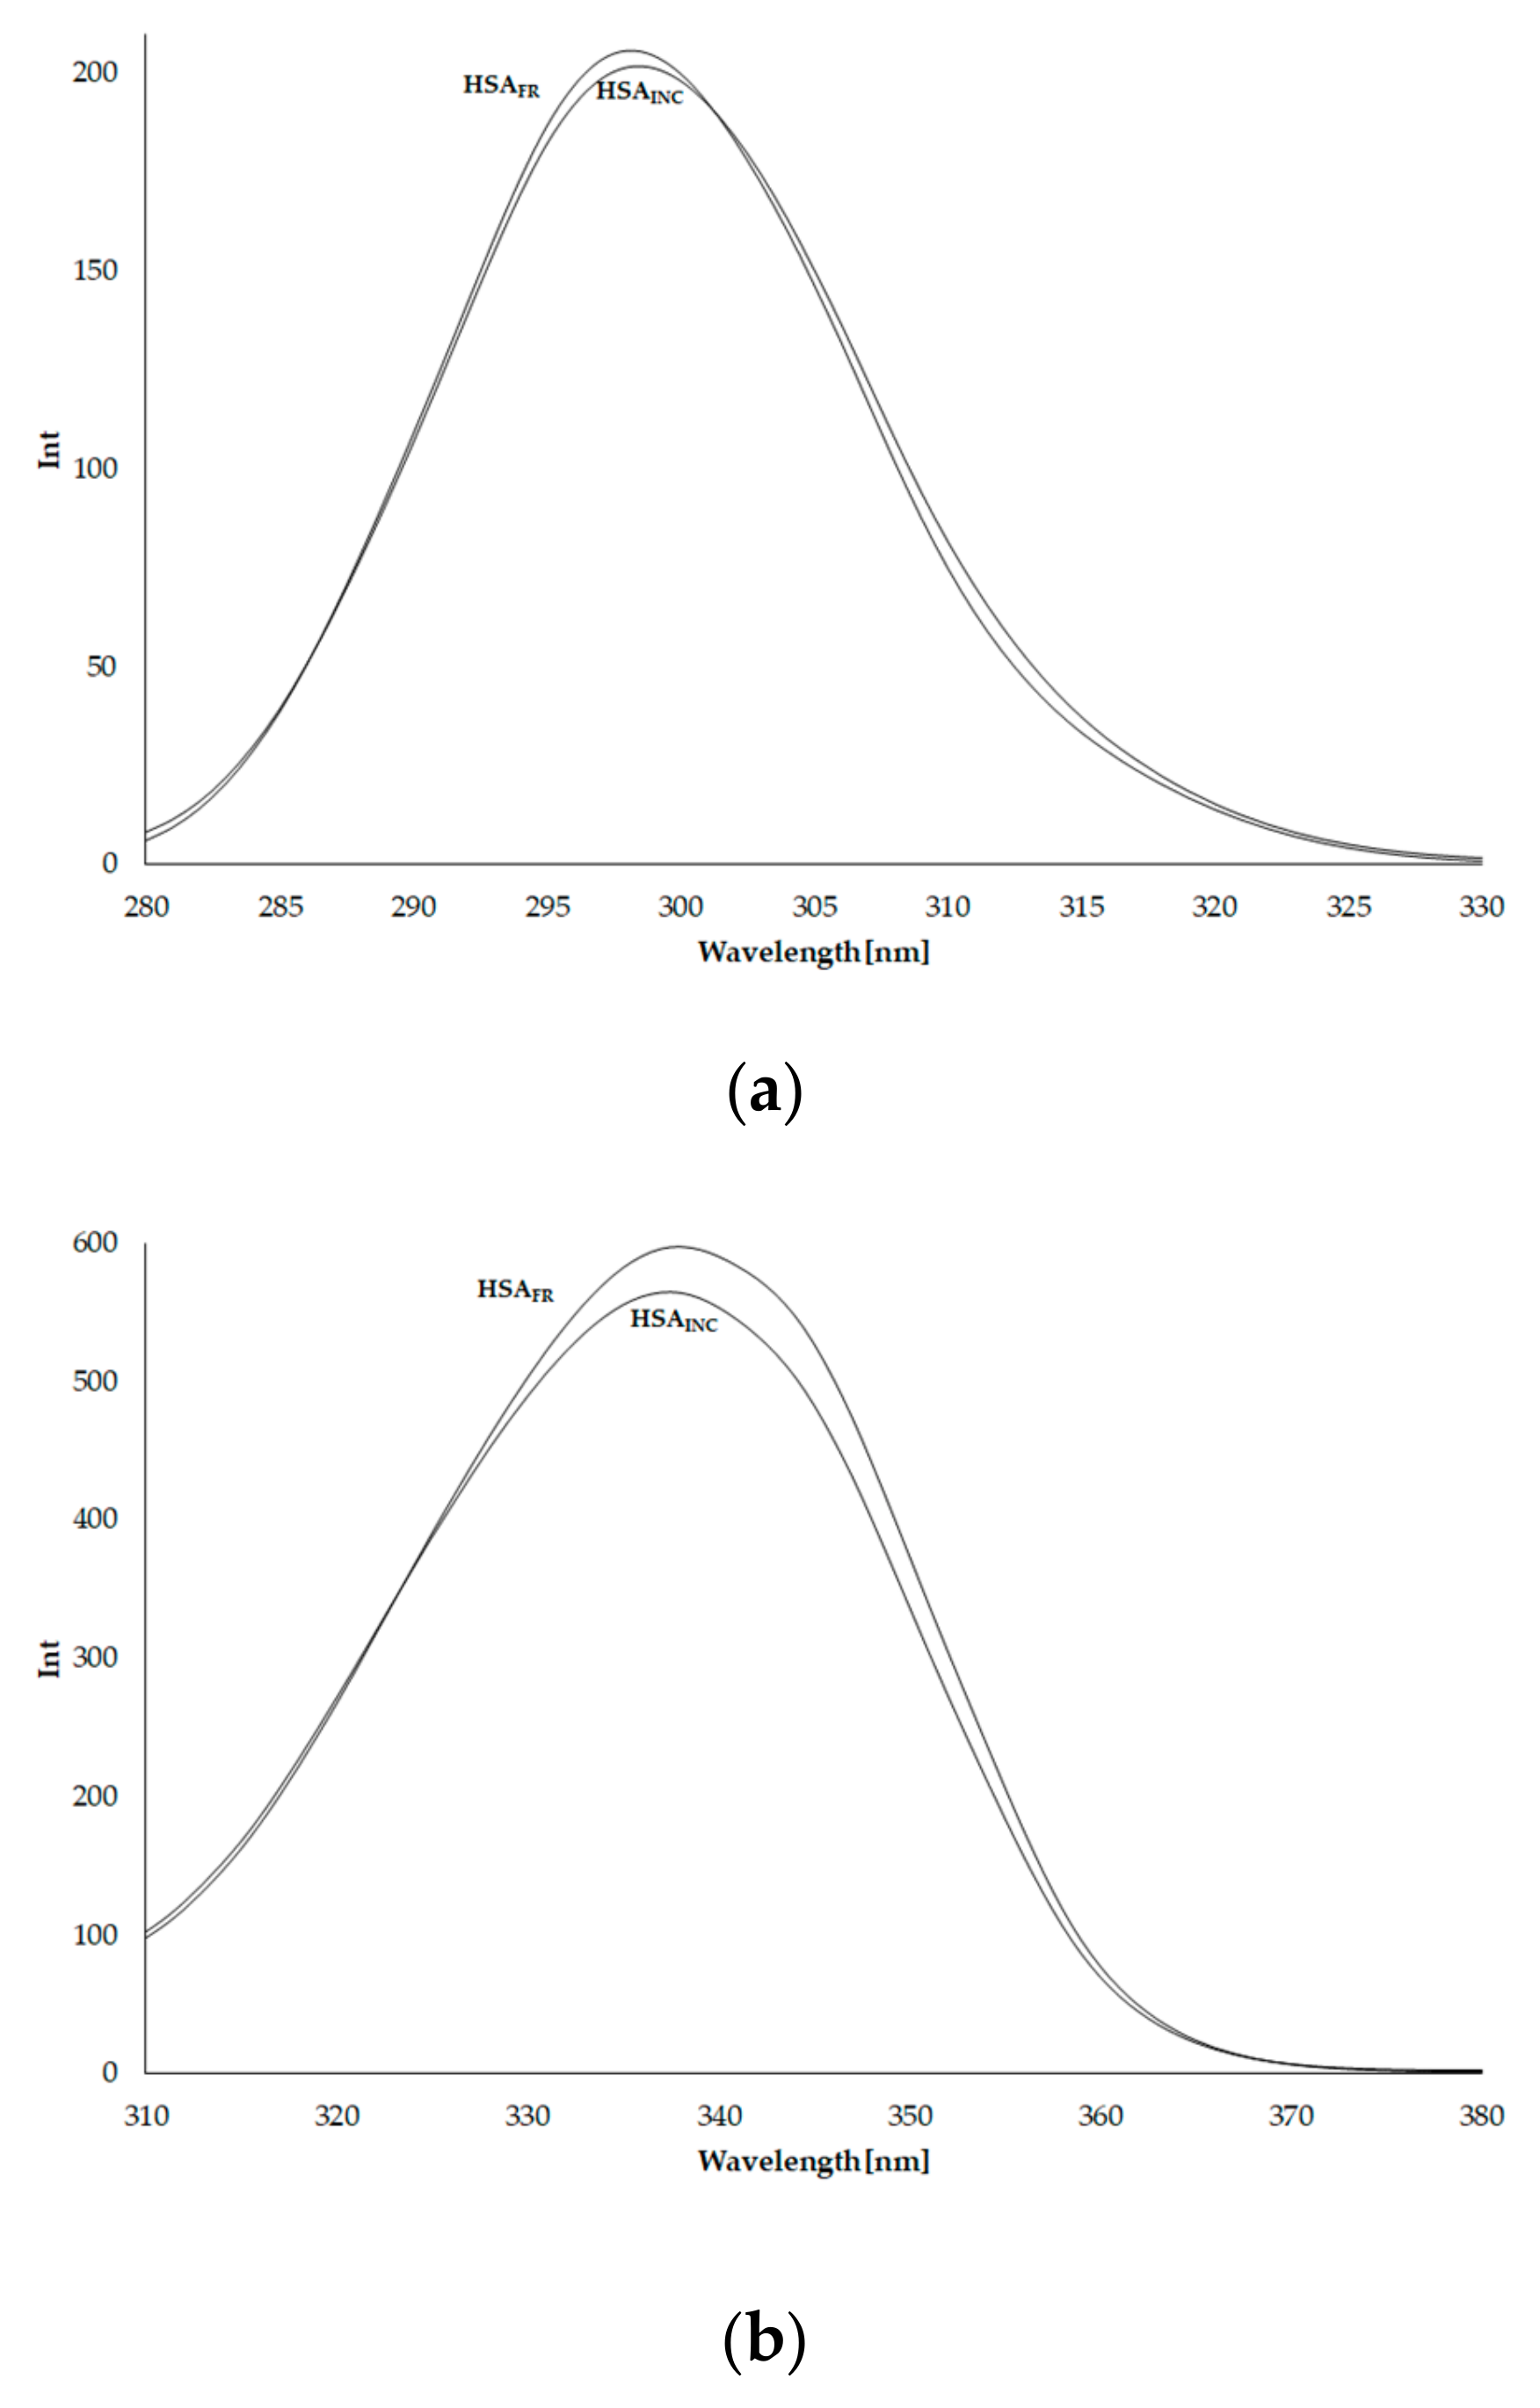
3.3. Emission Fluorescence Spectra of Human Serum Albumin (HSA)
3.4. Synchronous Fluorescence Spectra of Human Serum Albumin (HSA)
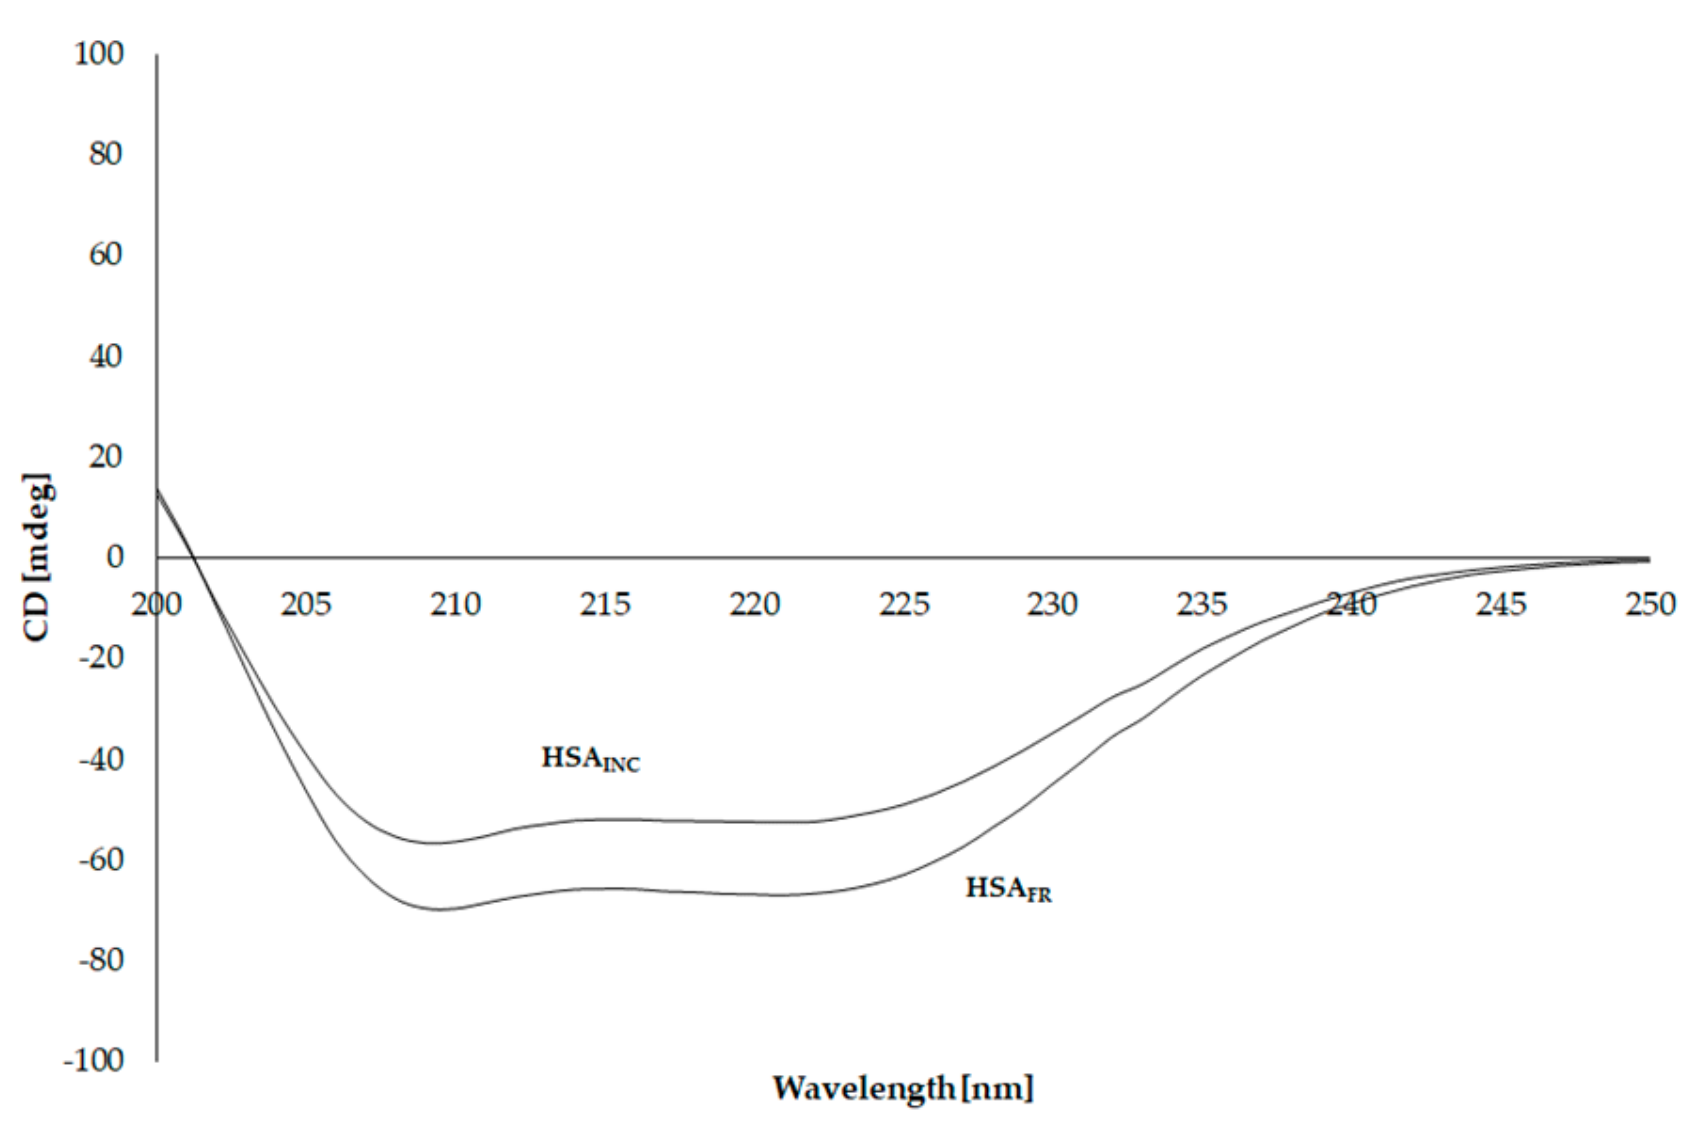
3.5. Circular Dichroism (CD) Spectra of Human Serum Albumin (HSA)
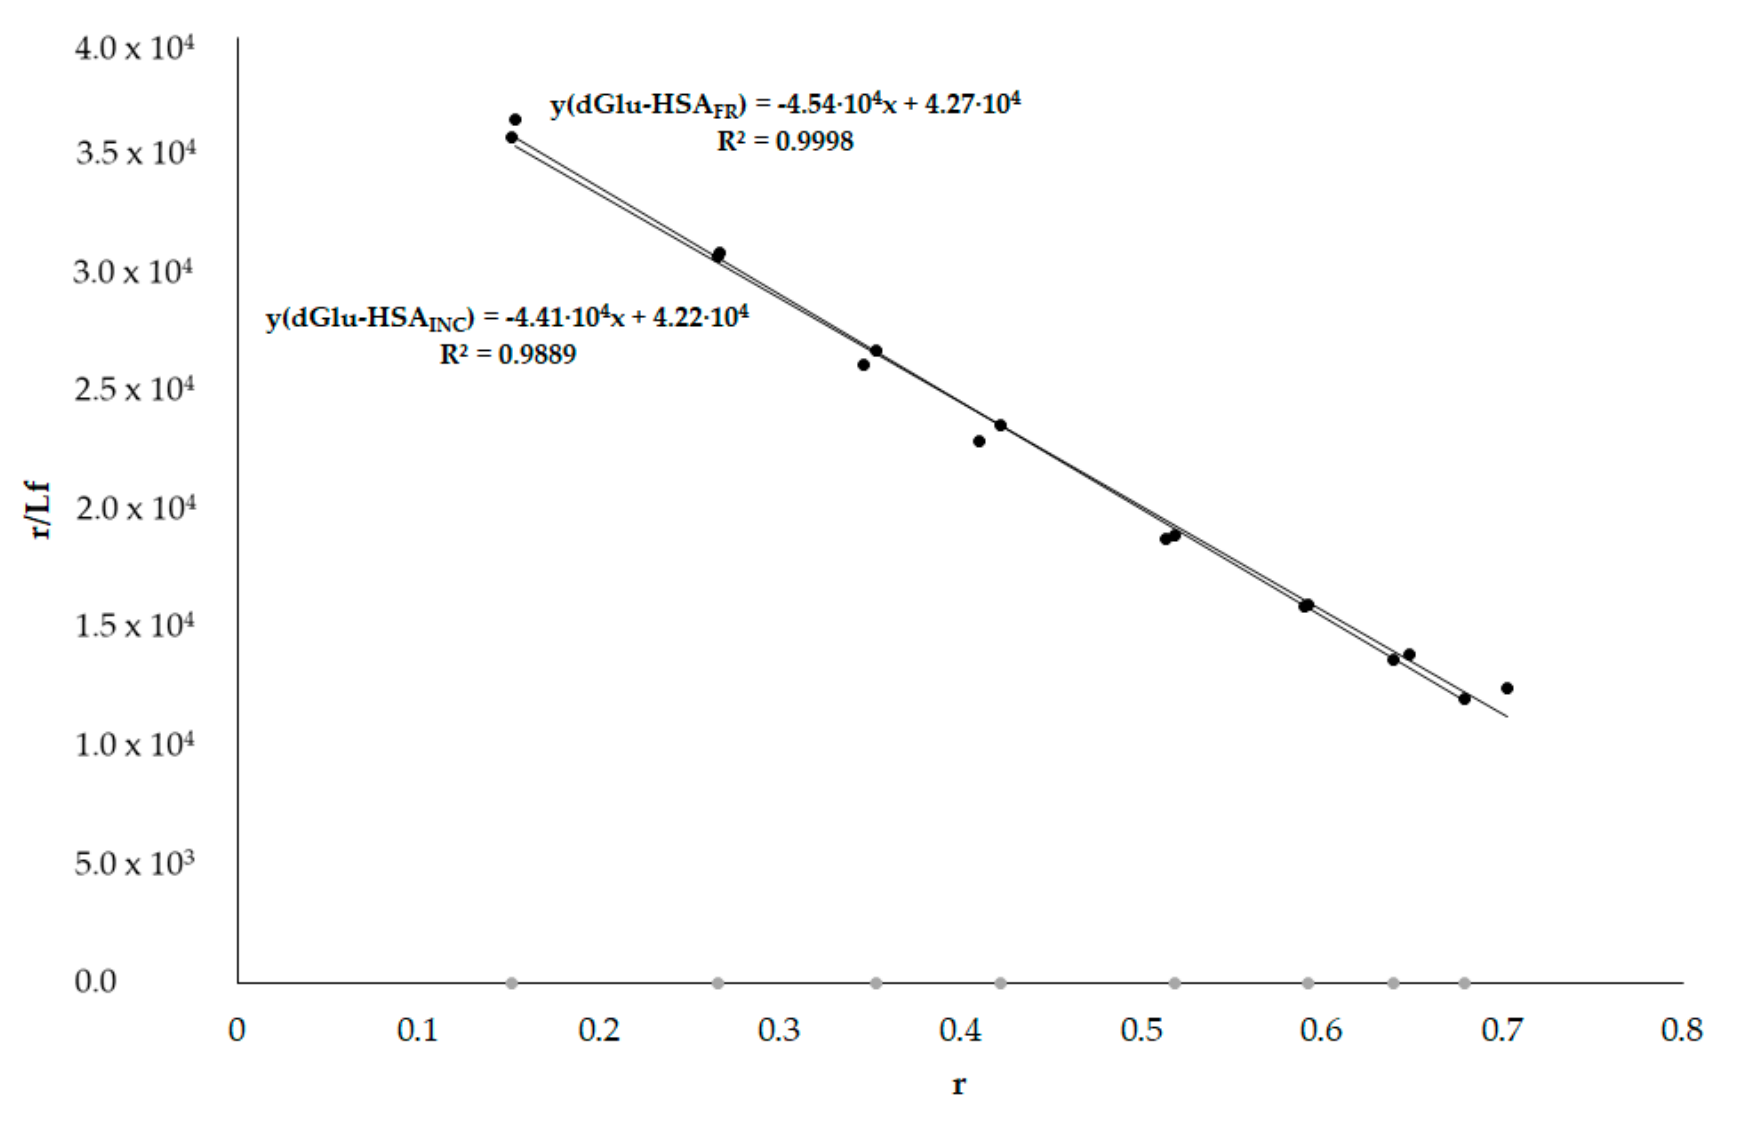
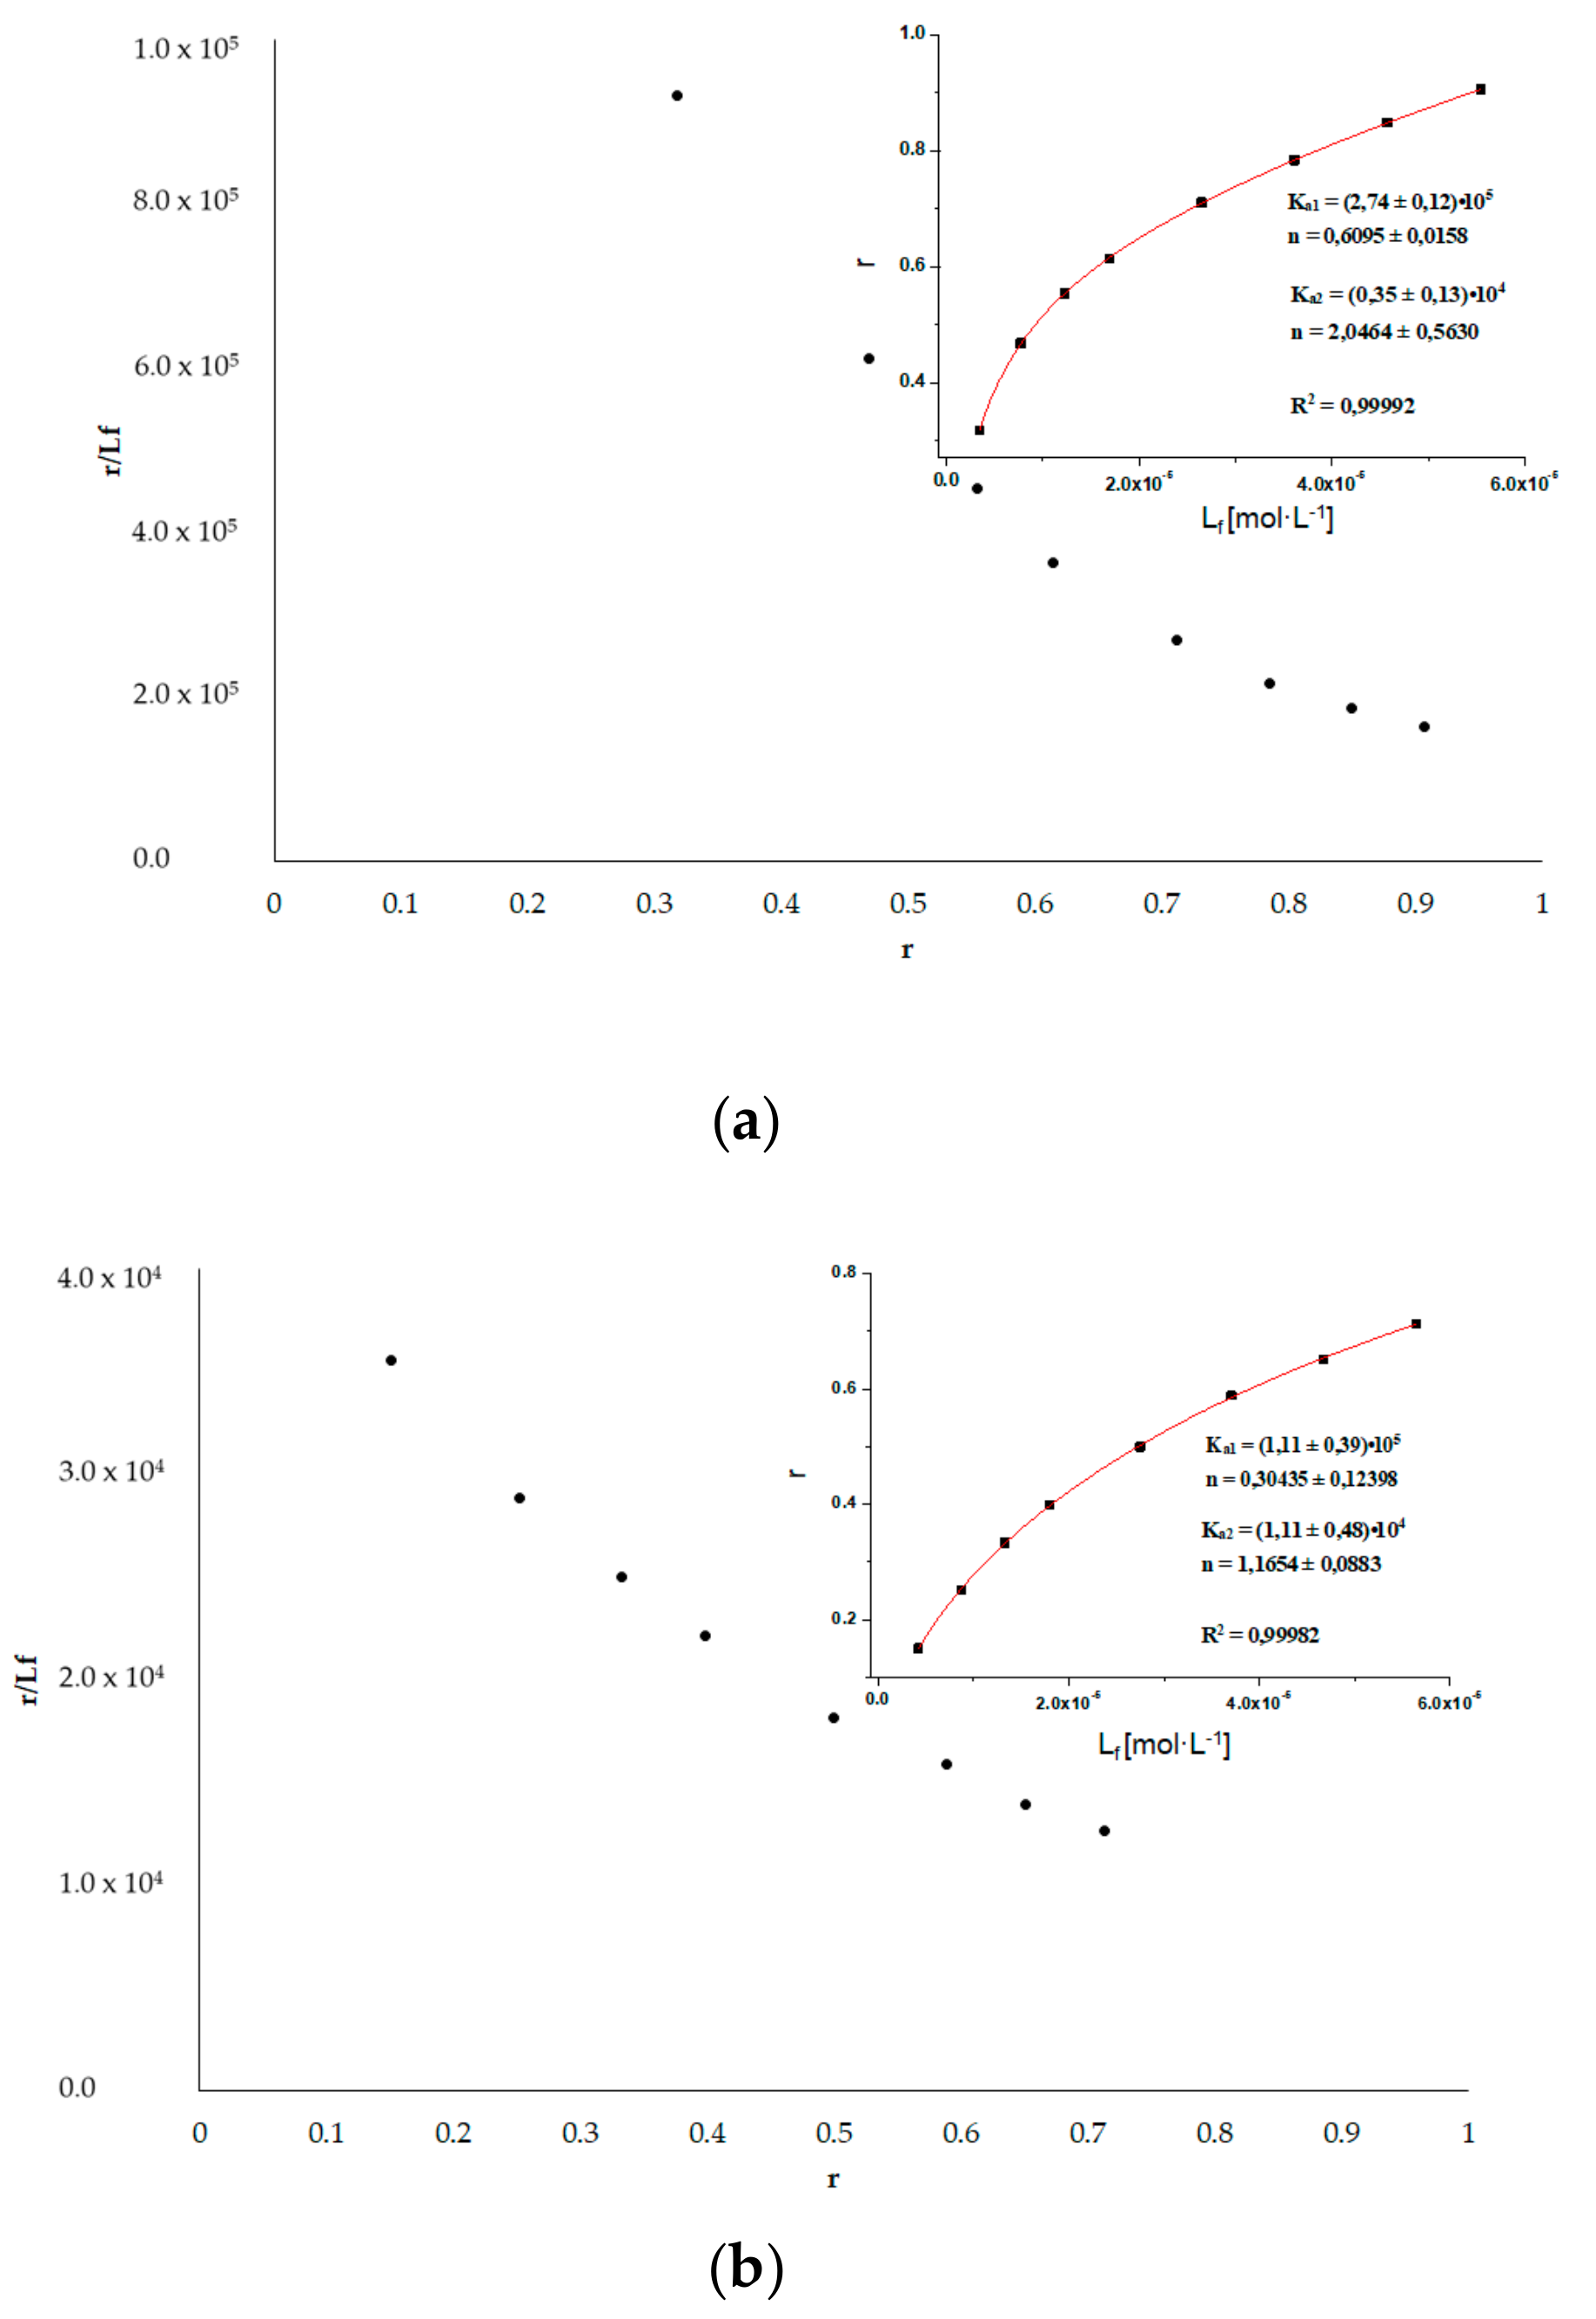
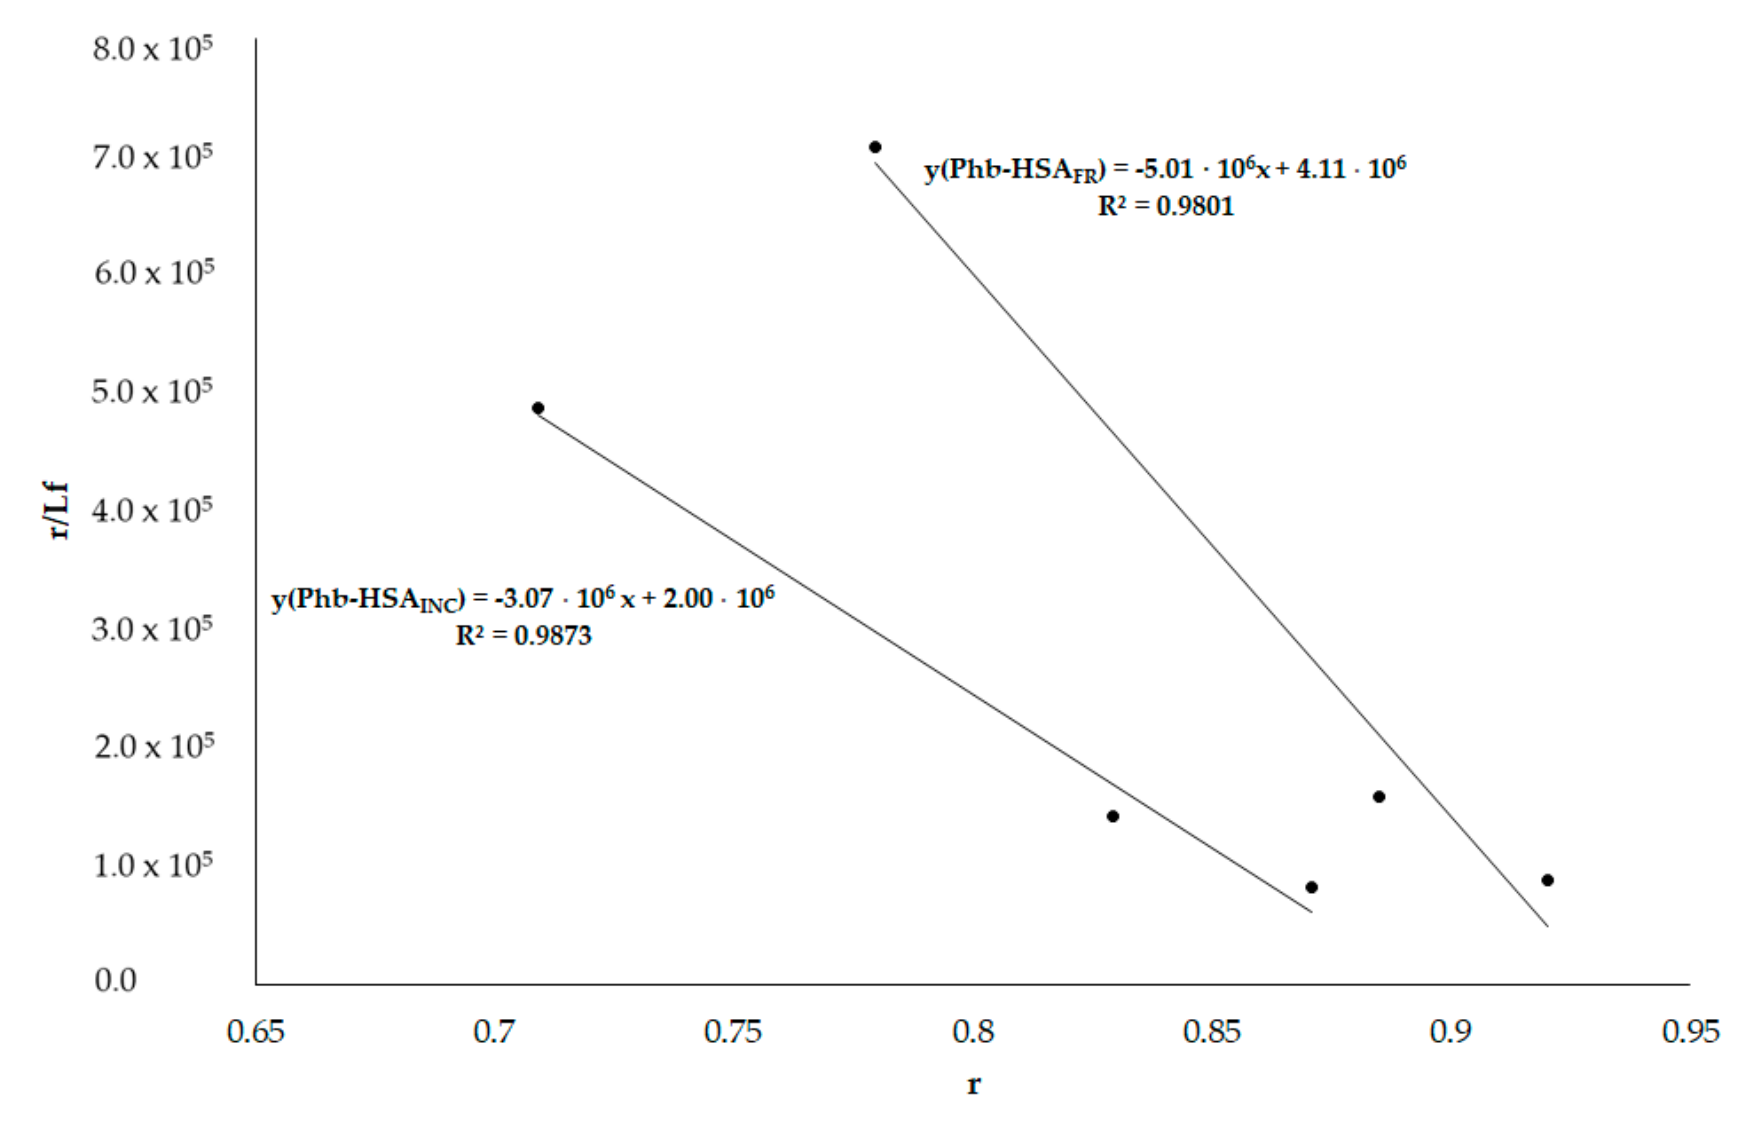
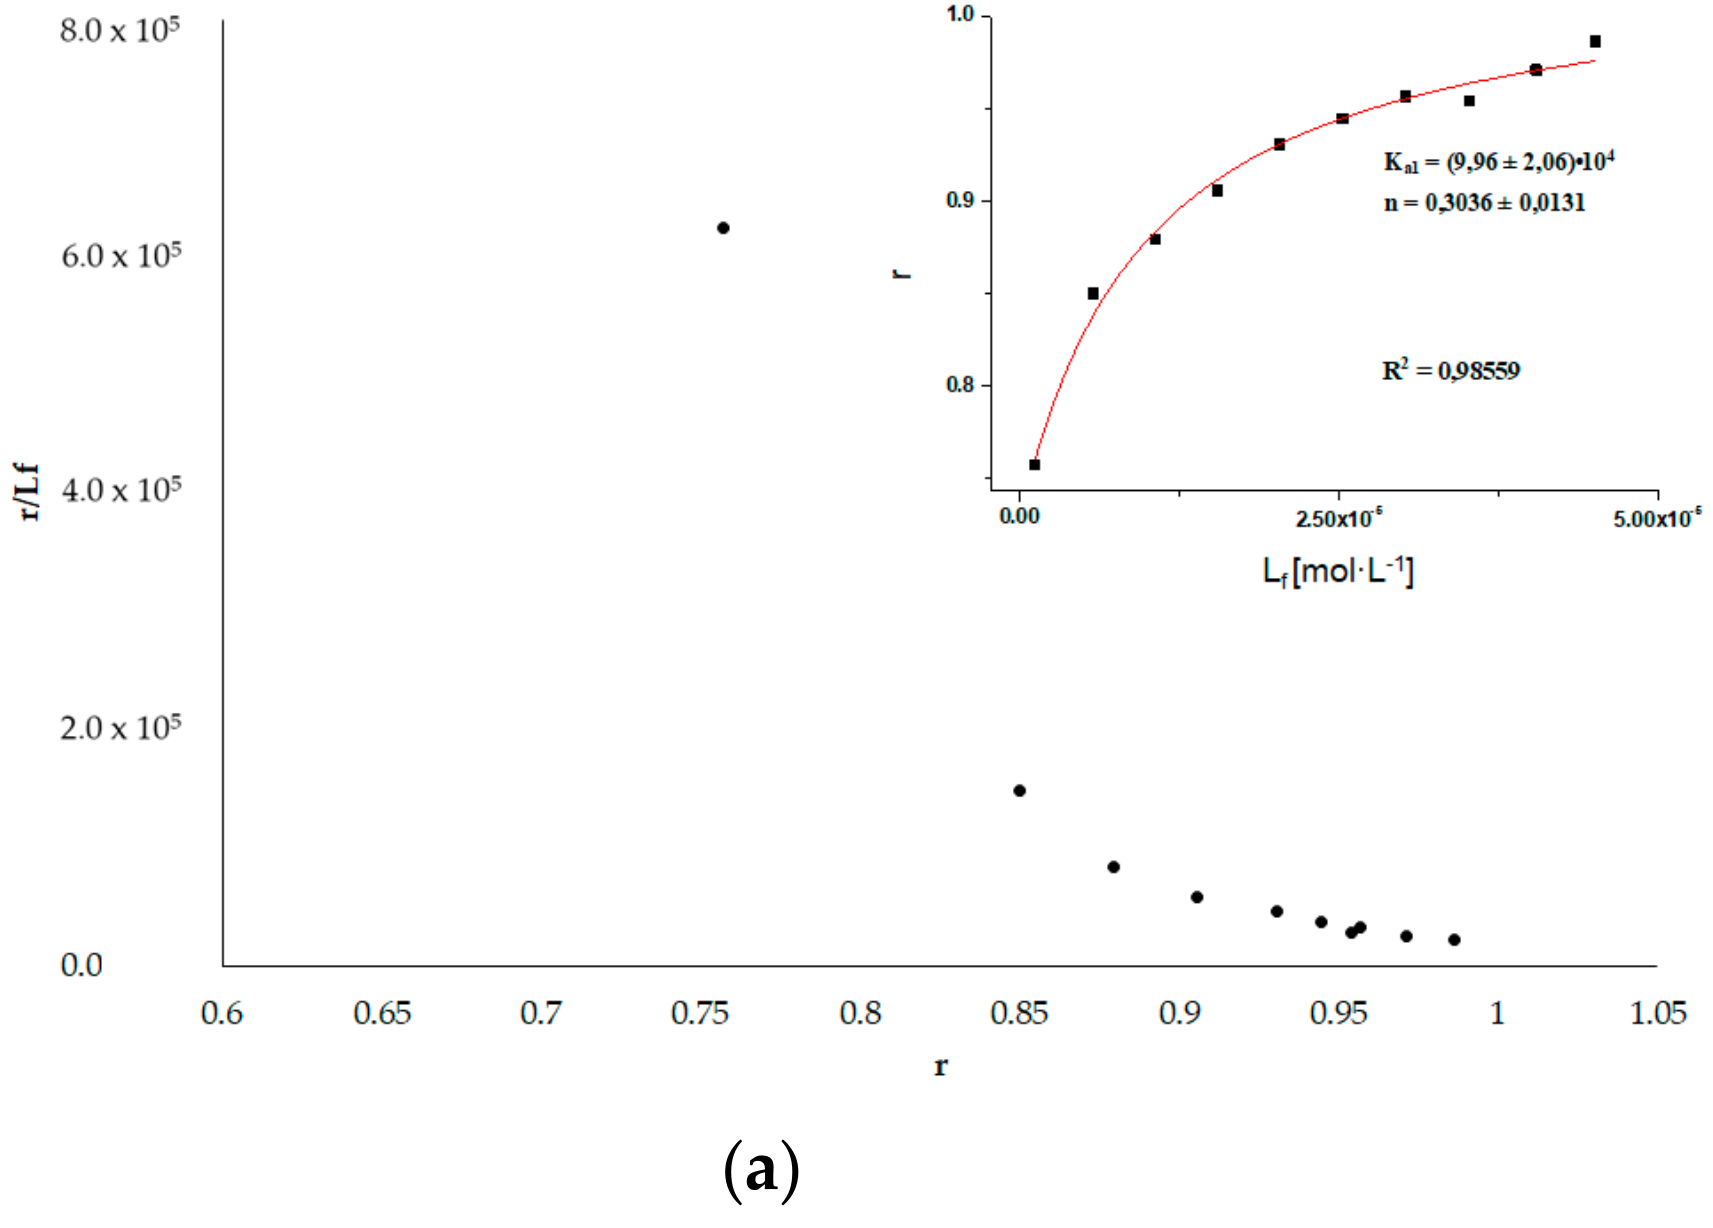
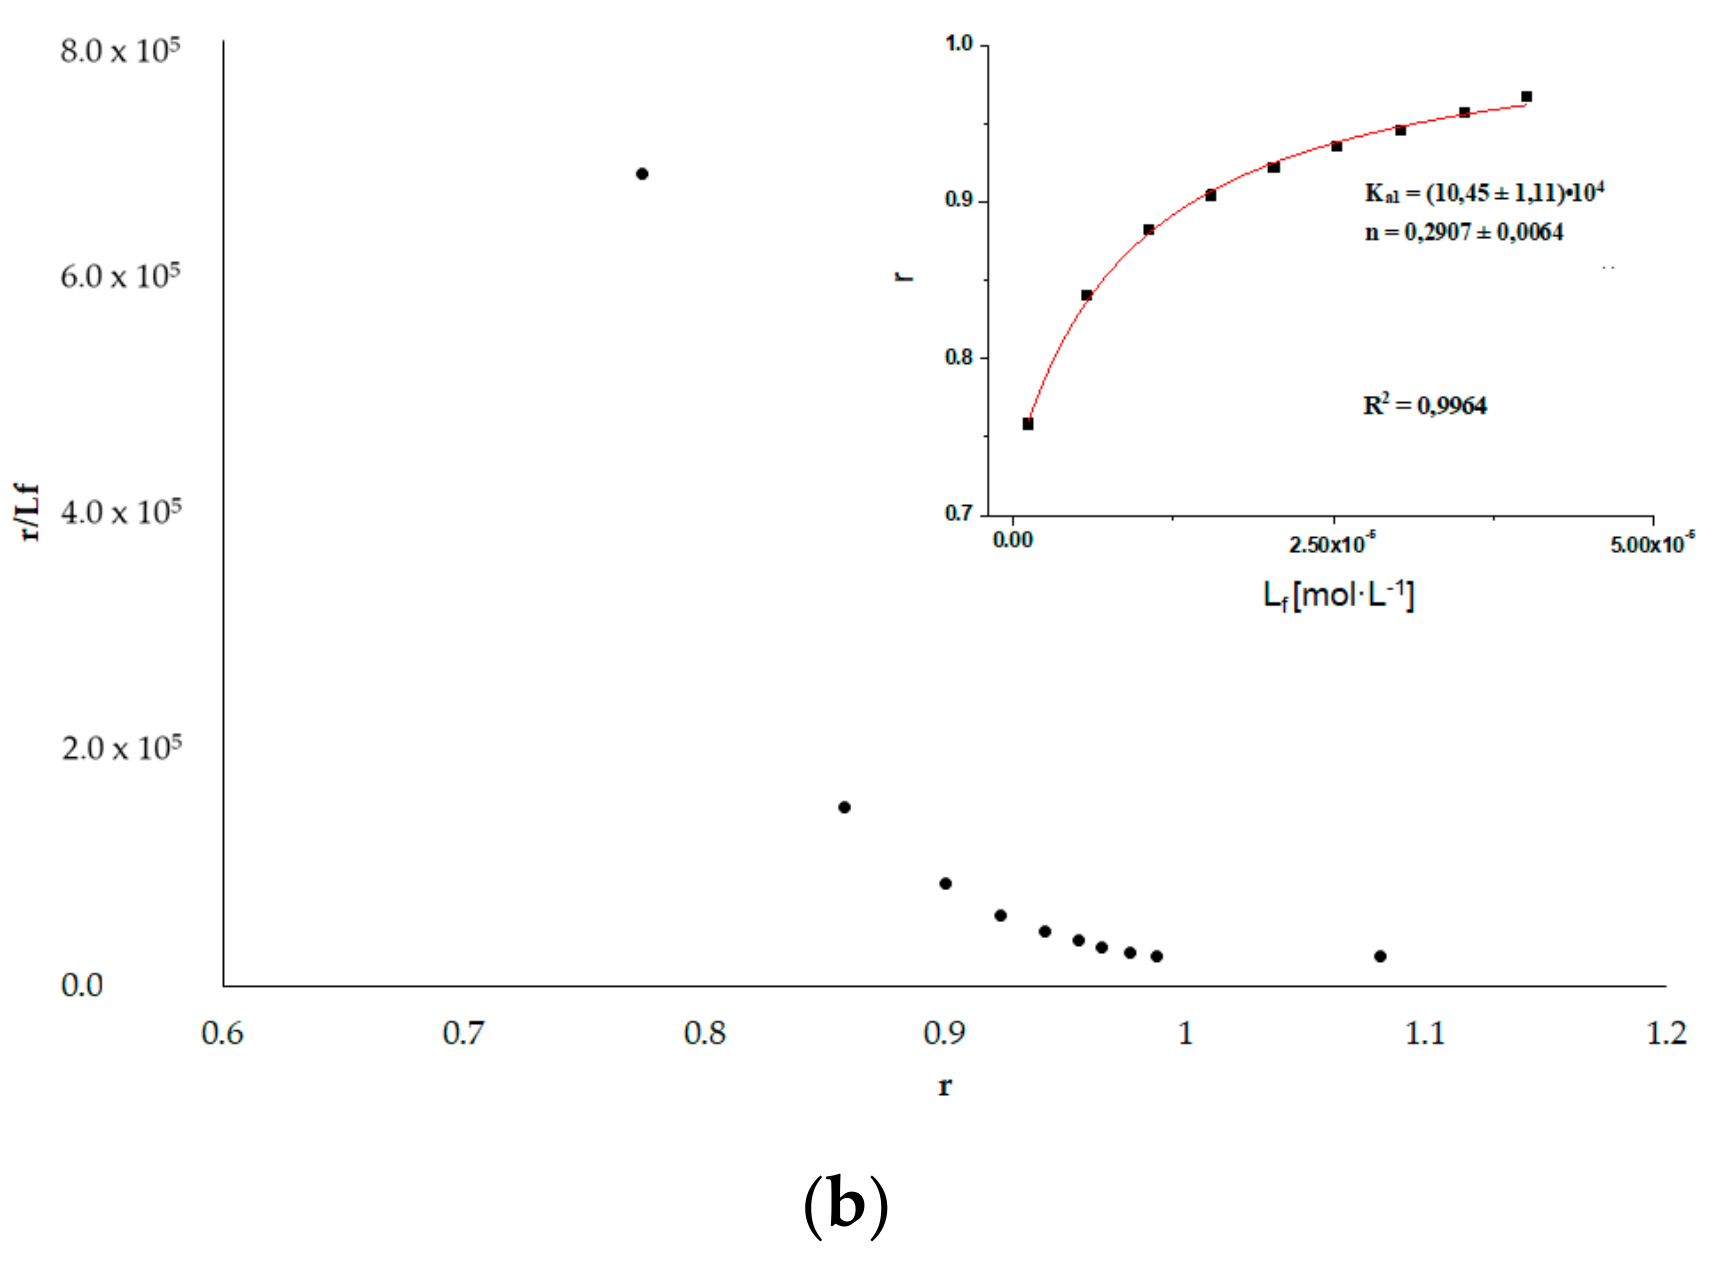
3.6. HSA Binding Sites Assessment
3.6.1. Dansyl-l-glutamine (dGlu) and Dansyl-l-proline (dPro)
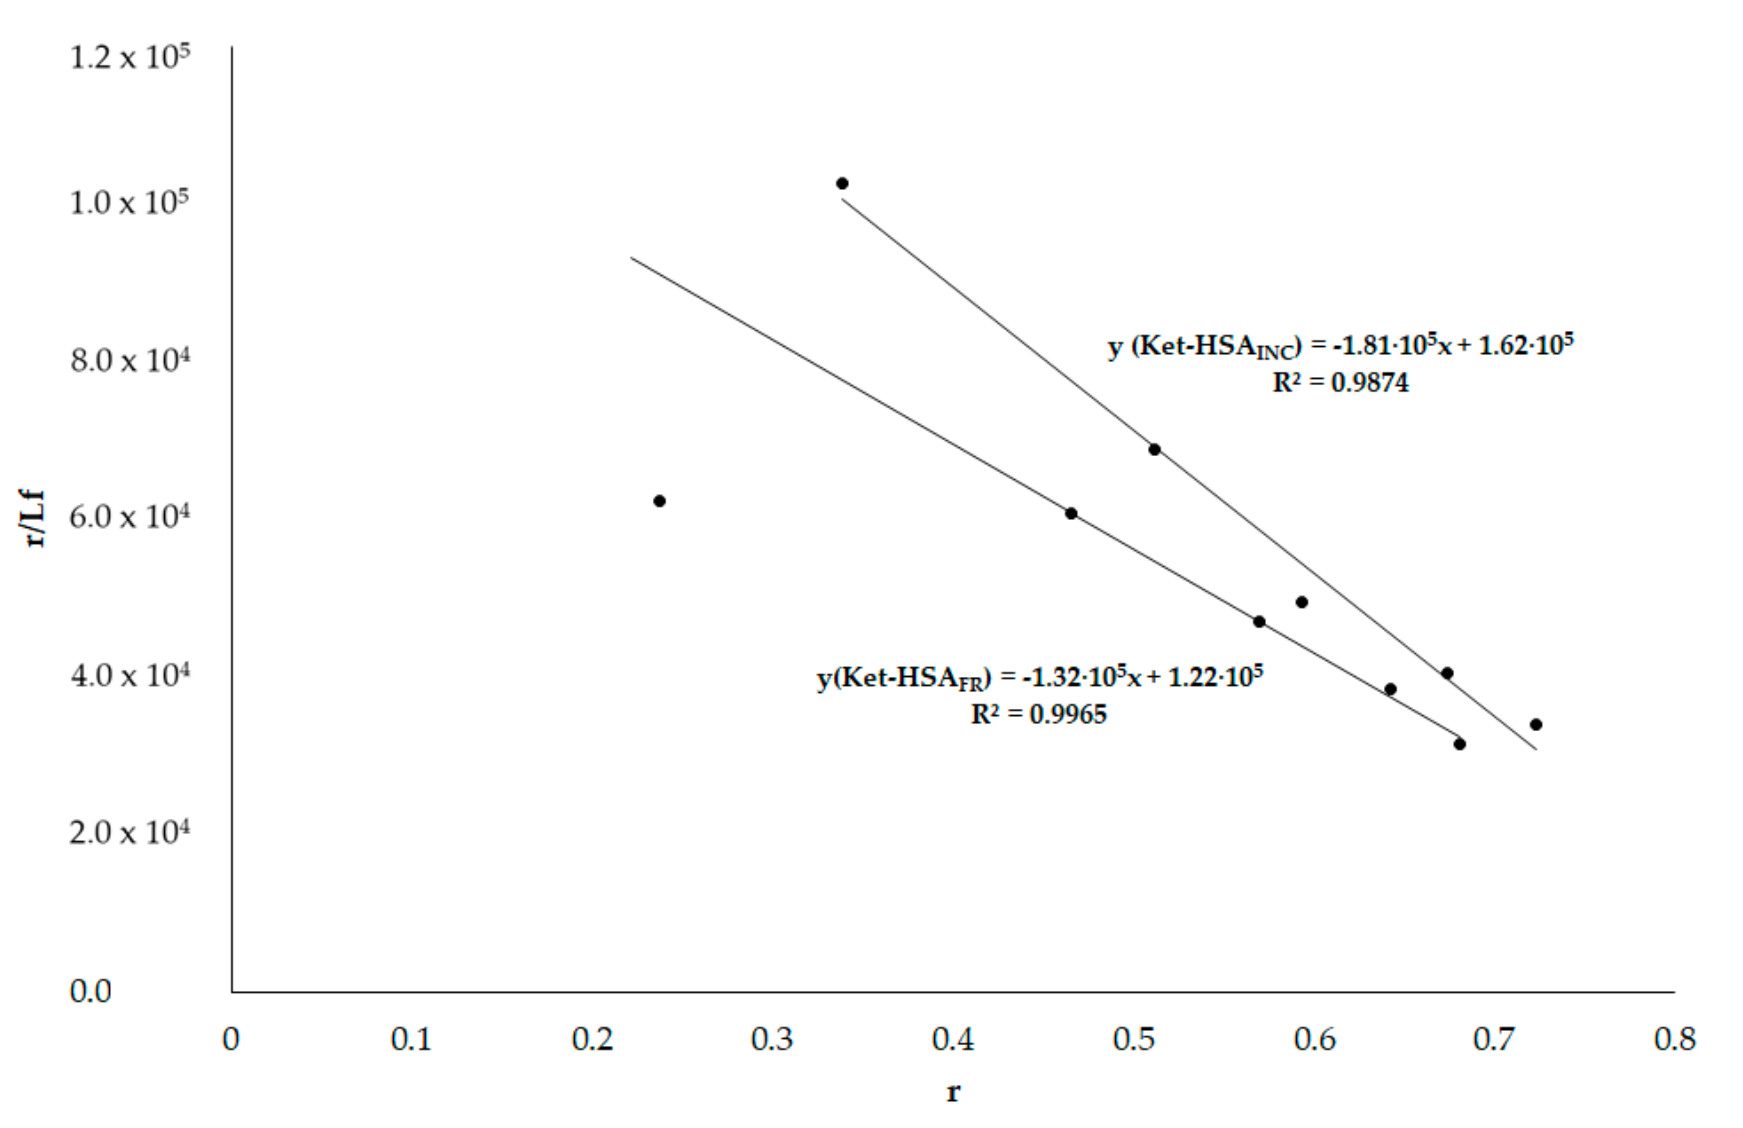
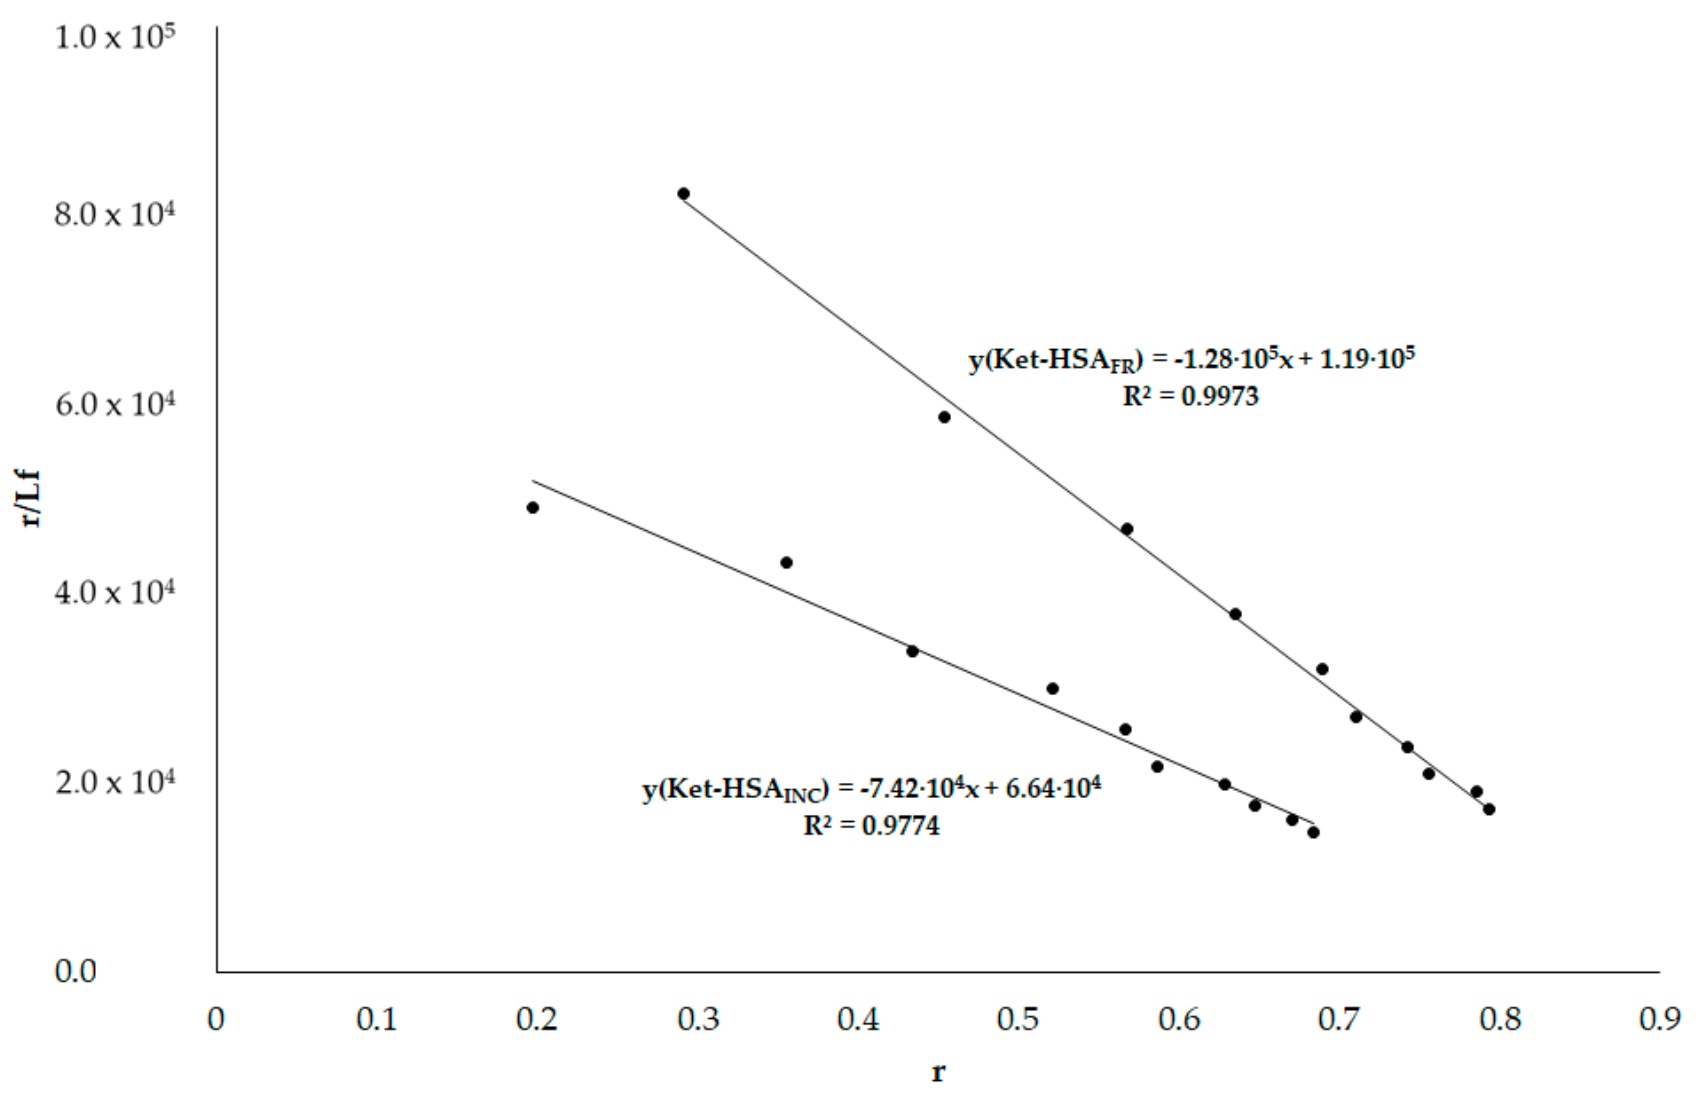
3.6.2. Phenylobutazone (Phb) and Ketoprofen (Ket)
4. Conclusions
Author Contributions
Funding
Conflicts of Interest
References
- Gulam, R.; Saeyoung, N.A. Structure, enzymatic activities, glycation and therapeutic potential of human serum albumin: A natural cargo. Int. J. Biol. Macromol. 2019, 123, 979–990. [Google Scholar]
- Gburek, J.; Gołąb, J.; Juszczyńska, K. Nerkowy katabolizm albuminy – aktualne poglądy i kontrowersje. Post. Hig. Med. Dośw. 2011, 65, 668–677. [Google Scholar] [CrossRef]
- Carter, D.C.; Ho, J.X. Structure of serum albumin. Adv. Protein Chem. 1994, 45, 153–203. [Google Scholar] [PubMed]
- Peters, T. All About Albumin. In Biochemistry, Genetics, And Medical Applications; Academic Press: San Diego, CA, USA, 1995; pp. 9–19, 228–234. [Google Scholar]
- Sudlow, G.; Birkett, D.J.; Wade, D.N. Further characterization of specific drug binding sites on human serum albumin. Mol. Pharmacol. 1976, 12, 1052–1061. [Google Scholar] [PubMed]
- Yamasaki, K.; Maruyama, T.; Kragh-Hansen, U.; Otagiri, M. Caharcteriztion of site I on human serum albumin: Concept about the structure of a binding site. Biochim. Biophys. Acta 1996, 1295, 147–157. [Google Scholar] [CrossRef]
- Patel, S.; Sharma, K.K.; Datta, A. Competitive binding of Chlorin p6 and Dansyl-l-Proline to Sudlow’s site II of human serum albumin. Spectrochim. Acta Mol. Biomol. Spectrosc. 2015, 138, 925–931. [Google Scholar] [CrossRef] [PubMed]
- Dockal, M.; Carter, D.C.; Ruker, F. Conformational Transitions of the Three Recombinant Domains of Human Serum Albumin Depending on pH. J. Biol. Chem. 2000, 275, 3042–3050. [Google Scholar] [CrossRef] [PubMed] [Green Version]
- Yang, F.; Philips, G.N., Jr. Crystal structures of CO-, deoxy- and met-myoglobins at various pH values. J. Mol. Biol. 1996, 256, 762–774. [Google Scholar] [CrossRef]
- Basova, L.V.; Ilyina, N.B.; Vasilenko, K.S.; Tiktopulo, E.I.; Bychkova, V.E. Conformational states of the water-soluble fragment of cytochrome b5. I. pH-induced denaturation. J. Mol. Biol. 2002, 36, 718–725. [Google Scholar] [CrossRef]
- Taboada, P.; Barbosa, S.; Castro, E.; Mosquera, V.J. Amyloid fibril formation and other aggregate species formed by human serum albumin association. J. Phys. Chem. B 2006, 110, 20733–20736. [Google Scholar] [CrossRef]
- Barbosa, S.; Taboada, P.; Mosquera, V. Bio-nanoimaging; Elsevier: Amsterdam, Netherlands, 2014; pp. 345–362. [Google Scholar]
- Gazit, E. The “Correctly Folded” state of proteins: Is it a metastable state. Angew. Chem. Int. Ed. Engl. 2002, 41, 257–259. [Google Scholar] [CrossRef]
- Surguchev, A.; Surguchov, A. Conformational diseases: Looking into the eyes. Brain Res Bull 2010, 81, 12–24. [Google Scholar] [CrossRef] [PubMed]
- Chiti, F.; Webster, P.; Taddei, N.; Clark, A.; Stefani, M.; Ramponi, G.; Dobson, C.M. Designing conditions for in vitro formation of amyloid protofilaments and fibrils. PNAS 1999, 96, 3590–3594. [Google Scholar] [CrossRef] [PubMed] [Green Version]
- Bhattacharya, M.; Jain, N.; Mukhopadhyay, S. Insights into the Mechanism of Aggregation and Fibril Formation from Bovine Serum Albumin. J. Phys. Chem. B 2011, 115, 4195–4205. [Google Scholar] [CrossRef] [PubMed]
- Juárez, J.; Taboada, P.; Goy-Lopez, S.; Cambon, A.; Madec, M.B.; Yeates, S.G.; Mosquera, V. Additional Supra-Self-Assembly of Human Serum Albumin under Amyloid-Like-Forming Solution Conditions. J. Phys. Chem. B 2009, 113, 12391–12399. [Google Scholar]
- Pandey, N.K.; Ghosh, S.; Tripathy, D.R.; Dasgupta, S. Effect of Temperature and Solvent on Fibrillation of Human Serum Albumin. Protein Peptide Lett. 2015, 22, 112–118. [Google Scholar] [CrossRef]
- Juárez, J.; López, S.G.; Cambón, A.; Taboada, P.; Mosquera, V. Influence of Electrostatic Interactions on the Fibrillation Process of Human Serum Albumin. J. Phys. Chem. B 2009, 113, 10521–10529. [Google Scholar] [CrossRef]
- Dasgupta, M.; Kishore, N. Selective inhibition of aggregation/fibrillation of bovine serum albumin by osmolytes: Mechanistic and energetics insights. PLoS ONE 2017. [Google Scholar] [CrossRef]
- Kundu, S.; Banerjee, C.; Sarkar, N. Inhibiting the Fibrillation of Serum Albumin Proteins in the Presence of Surface Active Ionic Liquids (SAILs) at Low pH: Spectroscopic and Microscopic Study. J. Phys. Chem. B 2017, 121, 7550–7560. [Google Scholar] [CrossRef]
- Bhattacharya, S.; Pandey, N.K.; Roy, A.; Dasgupta, S. Effect of (−)-epigallocatechin gallate on the fibrillation of human serum albumin. Int. J. Biol. Macromol. 2014, 70, 312–319. [Google Scholar] [CrossRef]
- Pandey, N.K.; Ghosh, S.; Dasgupta, S. Fructose restrains fibrillogenesis in human serum albumin. Int. J. Biol. Macromol. 2013, 61, 424–432. [Google Scholar] [CrossRef] [PubMed]
- Rondeau, F.; Navarra, G.; Cacciabaudo, F.; Leone, M.; Bourdon, E.; Militelo, V. Thermal aggregation of glycated bovine serum albumin. BBA-Proteins Proteom 2010, 1804, 789–798. [Google Scholar] [CrossRef]
- Ahmad, B.; Borana, M.S.; Chaudhary, A.P. Understanding curcumin-induced modulation of protein aggregation. Int. J. Biol. Macromol. 2017, 100, 89–96. [Google Scholar] [CrossRef] [PubMed]
- Mothi, N.; Muthu, S.A.; Kale, A.; Ahmad, B. Curcumin promotes fibril formation in F isomer of human serum albumin via amorphous aggregation. Biophys. Chem. 2015, 207, 30–39. [Google Scholar] [CrossRef] [PubMed]
- Finn, T.E.; Nunez, A.C.; Sunde, M.; Easterbrook-Smith, S.B. Serum albumin prevents protein aggregation and amyloid formation and retains chaperone-like activity in the presence of physiological ligands. J. Biol. Chem. 2012, 25, 21530–21540. [Google Scholar] [CrossRef] [Green Version]
- Pearce, F.G.; Mackintosh, S.H.; Gerrard, J.A. Formation of amyloid-like fibrils by ovalbumin and related proteins under conditions relevant to food processing. J. Agr. Food Chem. 2007, 55, 318–322. [Google Scholar] [CrossRef]
- Arasteh, A.; Rashvand, M.; Habibi, A.E.; Rezaei, M.H.; Moosavi Movahedi, A.A.M. Optimization of bovine serum albumin fibrillation by Congored spectrophotometry for using as a new bio-nanomaterial. IJASEAT 2016, 2, 59–65. [Google Scholar]
- Sebastiao, M.; Quittot, N.; Bourgault, S. Thioflavin T fluorescence to analyse amyloid formation kinetics: Measurement frequency as a factor explaining irreproducibility. Anal. Biochem. 2017, 532, 83–86. [Google Scholar] [CrossRef]
- Schleeger, M.; van den Akker, C.; Deckert-Gaudig, T.; Deckert, V.; Velikov, K.P.; Koenderink, G.; Bonna, M. Amyloids: From molecular structure to mechanical properties. Polymer 2013, 54, 2473–2488. [Google Scholar] [CrossRef] [Green Version]
- Sharma, N.; Sivalingam, V.; Maurya, S.; Prasad, A.; Khandelwal, P.; Yadav, C.S.; Patel, B.K. New insights into in vitro amyloidogenic properties of human serum albumin suggest considerations for therapeutic precautions. FEBS Letters 2015, 589, 4033–4038. [Google Scholar] [CrossRef]
- Makin, O.S.; Sikorski, P.; Serpell, L.C. Diffraction to study protein and peptide assemblies. Curr. Opin. Chem. Biol. 2006, 10, 417–422. [Google Scholar] [CrossRef] [PubMed]
- Tycko, R. Insights into the Amyloid Folding Problem from Solid-State NMR. Biochemistry 2003, 42, 3151–3159. [Google Scholar] [CrossRef] [PubMed]
- Der-Sarkissian, A.; Jao, C.C.; Chen, J.; Langen, R. Structural organization of alpha-synuclein fibrils studied by site-directed spin labeling. J. Biol. Chem. 2003, 278, 37530–37535. [Google Scholar] [CrossRef] [PubMed] [Green Version]
- Hodara, R.; Norris, E.H.; Giasson, B.I.; Mishizen-Eberz, A.J.; Lynch, D.R.; Lee, V.M.-Y.; Ischiropoulos, H. Functional Consequences of α-Synuclein Tyrosine Nitration: Diminished binding to lipid vesicles and increased fibril formation. J. Biol. Chem. 2004, 279, 47746–47753. [Google Scholar] [CrossRef] [PubMed] [Green Version]
- Török, M.; Milton, S.; Kayed, R.; Wu, P.; McIntire, T.; Glabe, C.G.; Langen, R. Structural and dynamic features of Alzheimer’s Abeta peptide in amyloid fibrils studied by site-directed spin labeling. J. Biol. Chem. 2002, 277, 40810–40815. [Google Scholar] [CrossRef] [PubMed] [Green Version]
- Lakowicz, J.R. Principles of Fluorescence Spectroscopy, 3rd ed.; Springer: New York, NY, USA, 2006; pp. 130–135. [Google Scholar]
- Scatchard, G. The attractions of proteins for small molecules and ions. Ann. N Y Acad. Sci. 1949, 51, 660–672. [Google Scholar] [CrossRef]
- Venyaminov, S.Y.; Yang, J.T. Circular dichroism and the conformational analysis of biomolecules; Fasman, G.D., Ed.; Plenum Press: New York, NY, USA, 1996; pp. 69–109. [Google Scholar]
- Sreerama, N.; Woody, R.W. Estimation of Protein Secondary Structure from Circular Dichroism Spectra: Comparison of CONTIN, SELCON, and CDSSTR Methods with an Expanded Reference Set. Anal. Biochem. 2000, 287, 252–260. [Google Scholar] [CrossRef]
- Venyaminov, S.Y.; Vassilenko, K.S. Determination of protein tertiary structure class from circular dichroism spectra. Anal. Biochem. 1994, 222, 176–184. [Google Scholar] [CrossRef]
- Rovnyagina, N.R.; Sluchanko, N.N.; Tikhonova, T.N.; Fadeev, V.V.; Litskevich, A.Y.; Maskevich, A.A.; Shirshin, E.A. Binding of thioflavin T by albumins: An underestimated role of protein oligomeric heterogeneity. Int. J. Biol. Macromol. 2018, 108, 284–290. [Google Scholar] [CrossRef]
- Maskevich, A.A.; Stsiapura, V.I.; Kuzmitsky, V.A.; Kuznetsova, I.M.; Povarova, O.I.; Uversky, V.N.; Turoverov, K.K. Spectral properties of thioflavin T in solvents with different dielectric properties and in a fibril-incorporated form. J. Proteome Res. 2007, 6, 1392–1401. [Google Scholar] [CrossRef]
- Juárez, J.; Taboada, P.; Mosquera, V. Existence of Different Structural Intermediates on the Fibrillation Pathwayof Human Serum Albumin. Biophys. J. 2009, 96, 2353–2370. [Google Scholar] [CrossRef] [Green Version]
- Holm, N.K.; Jespersen, S.K.; Thomassen, L.V.; Wolff, T.Y.; Sehgal, P.; Thomsen, L.A.; Christiansen, G.; Andersen, C.B.; Knudsen, A.D.; Otzen, D.E. Aggregation and fibrillation of bovine serum albumin. BBA 2007, 1774, 1128–1138. [Google Scholar] [CrossRef] [PubMed]
- Stanyon, H.F.; Viles, J.H. Human Serum Albumin Can Regulate Amyloid-β Peptide Fiber Growth in the Brain Interstitium: Implications for alzheimer disease. J. Biol. Chem. 2012, 287, 28163–28168. [Google Scholar] [CrossRef] [Green Version]
- Dobson, C.M. Protein misfolding, evolution and disease. Trends Biochem. Sci. 1999, 24, 329–332. [Google Scholar] [CrossRef]
- Vetri, V.; Librizzi, F.; Leone, M.; Militello, V. Thermal aggregation of bovine serum albumin at different pH: Comparison with human serum albumin. Eur. Biophys. J. 2007, 36, 717–725. [Google Scholar] [CrossRef] [PubMed]
- Vetri, V.; D’Amico, M.; Foderà, V.; Leone, M.; Ponzoni, A.; Sberveglieri, G.; Militello, V. Bovine Serum Albumin protofibril-like aggregates formation: Solo but not simple mechanism. Arch. Biochem. Biophys. 2011, 508, 13–24. [Google Scholar] [CrossRef] [PubMed]
- Biancalana, M.; Koide, S. Molecular mechanism of Thioflavin-T binding to amyloid fibrils. BBA 2010, 1804, 1405–1412. [Google Scholar] [CrossRef] [Green Version]
- Jordens, S.; Adamcik, J.; Amar-Yuli, I.; Mezzenga, R. Disassembly and Reassembly of Amyloid Fibrils in Water-Ethanol Mixtures. Biomacromolecules 2011, 12, 187–193. [Google Scholar] [CrossRef]
- Kosa, T.; Maruyama, T.; Sakai, N.; Yonemura, N.; Yahara, S.; Otagiri, M. Species differences of serum albumins: III. Analysis of structural characteristics and ligand binding properties during N-B transitions. Pharmacol. Res. 1998, 15, 592–598. [Google Scholar] [CrossRef]
- Vaiana, S.M.; Emanuele, A.; Palma-Vittorelli, M.B.; Palma, M.U. Irreversible formation of intermediate BSA oligomers requires and induces conformational changes. Proteins 2004, 55, 1053–1062. [Google Scholar] [CrossRef]
- Wang, W.; Nema, S.; Teagarden, D. Protein aggregation-pathways and influencing factors. Int. J. Pharm. 2010, 390, 89–99. [Google Scholar] [CrossRef] [PubMed]
- Pandey, N.K.; Ghosh, S.; Dasgupta, S. Fibrillation in Human Serum Albumin Is Enhanced in the Presence of Copper(II). J. Phys. Chem. B 2010, 114, 10228–10233. [Google Scholar] [CrossRef] [PubMed]
- Stirpe, A.; Pantusa, M.; Rizzuti, B.; Sportelli, L.; Bartucci, R.; Guzzi, R. Early stage aggregation of human serum albumin in the presence of metal ions. Int. J. Biol. Macromol. 2011, 49, 337–342. [Google Scholar] [CrossRef] [PubMed]
- Zsila, F. Subdomain IB Is the Third Major Drug Binding Region of Human Serum Albumin: Toward the Three-Sites Model. Mol. Pharm. 2013, 10, 1668–1682. [Google Scholar] [CrossRef]
- Ryan, A.J.; Ghuman, J.; Zunszain, P.A.; Chung, C.; Curry, S. Structural basis of binding of fluorescent, site-specific dansylated amino acids to human serum albumin. J. Struct. Biol. 2011, 174, 84–91. [Google Scholar] [CrossRef]
- Yamasaki, K.; Miyoshi, T.; Maruyama, T.; Takadate, A.; Otagiri, M. Characterization of Region Ic in Site I on Human Serum Albumin. Microenvironmental Analysis Using Fluorescence Spectroscopy. Biol. Pharm. Bull. 1994, 17, 1656–1662. [Google Scholar] [CrossRef] [Green Version]
Sample Availability: Samples of the compounds are available from the authors. |


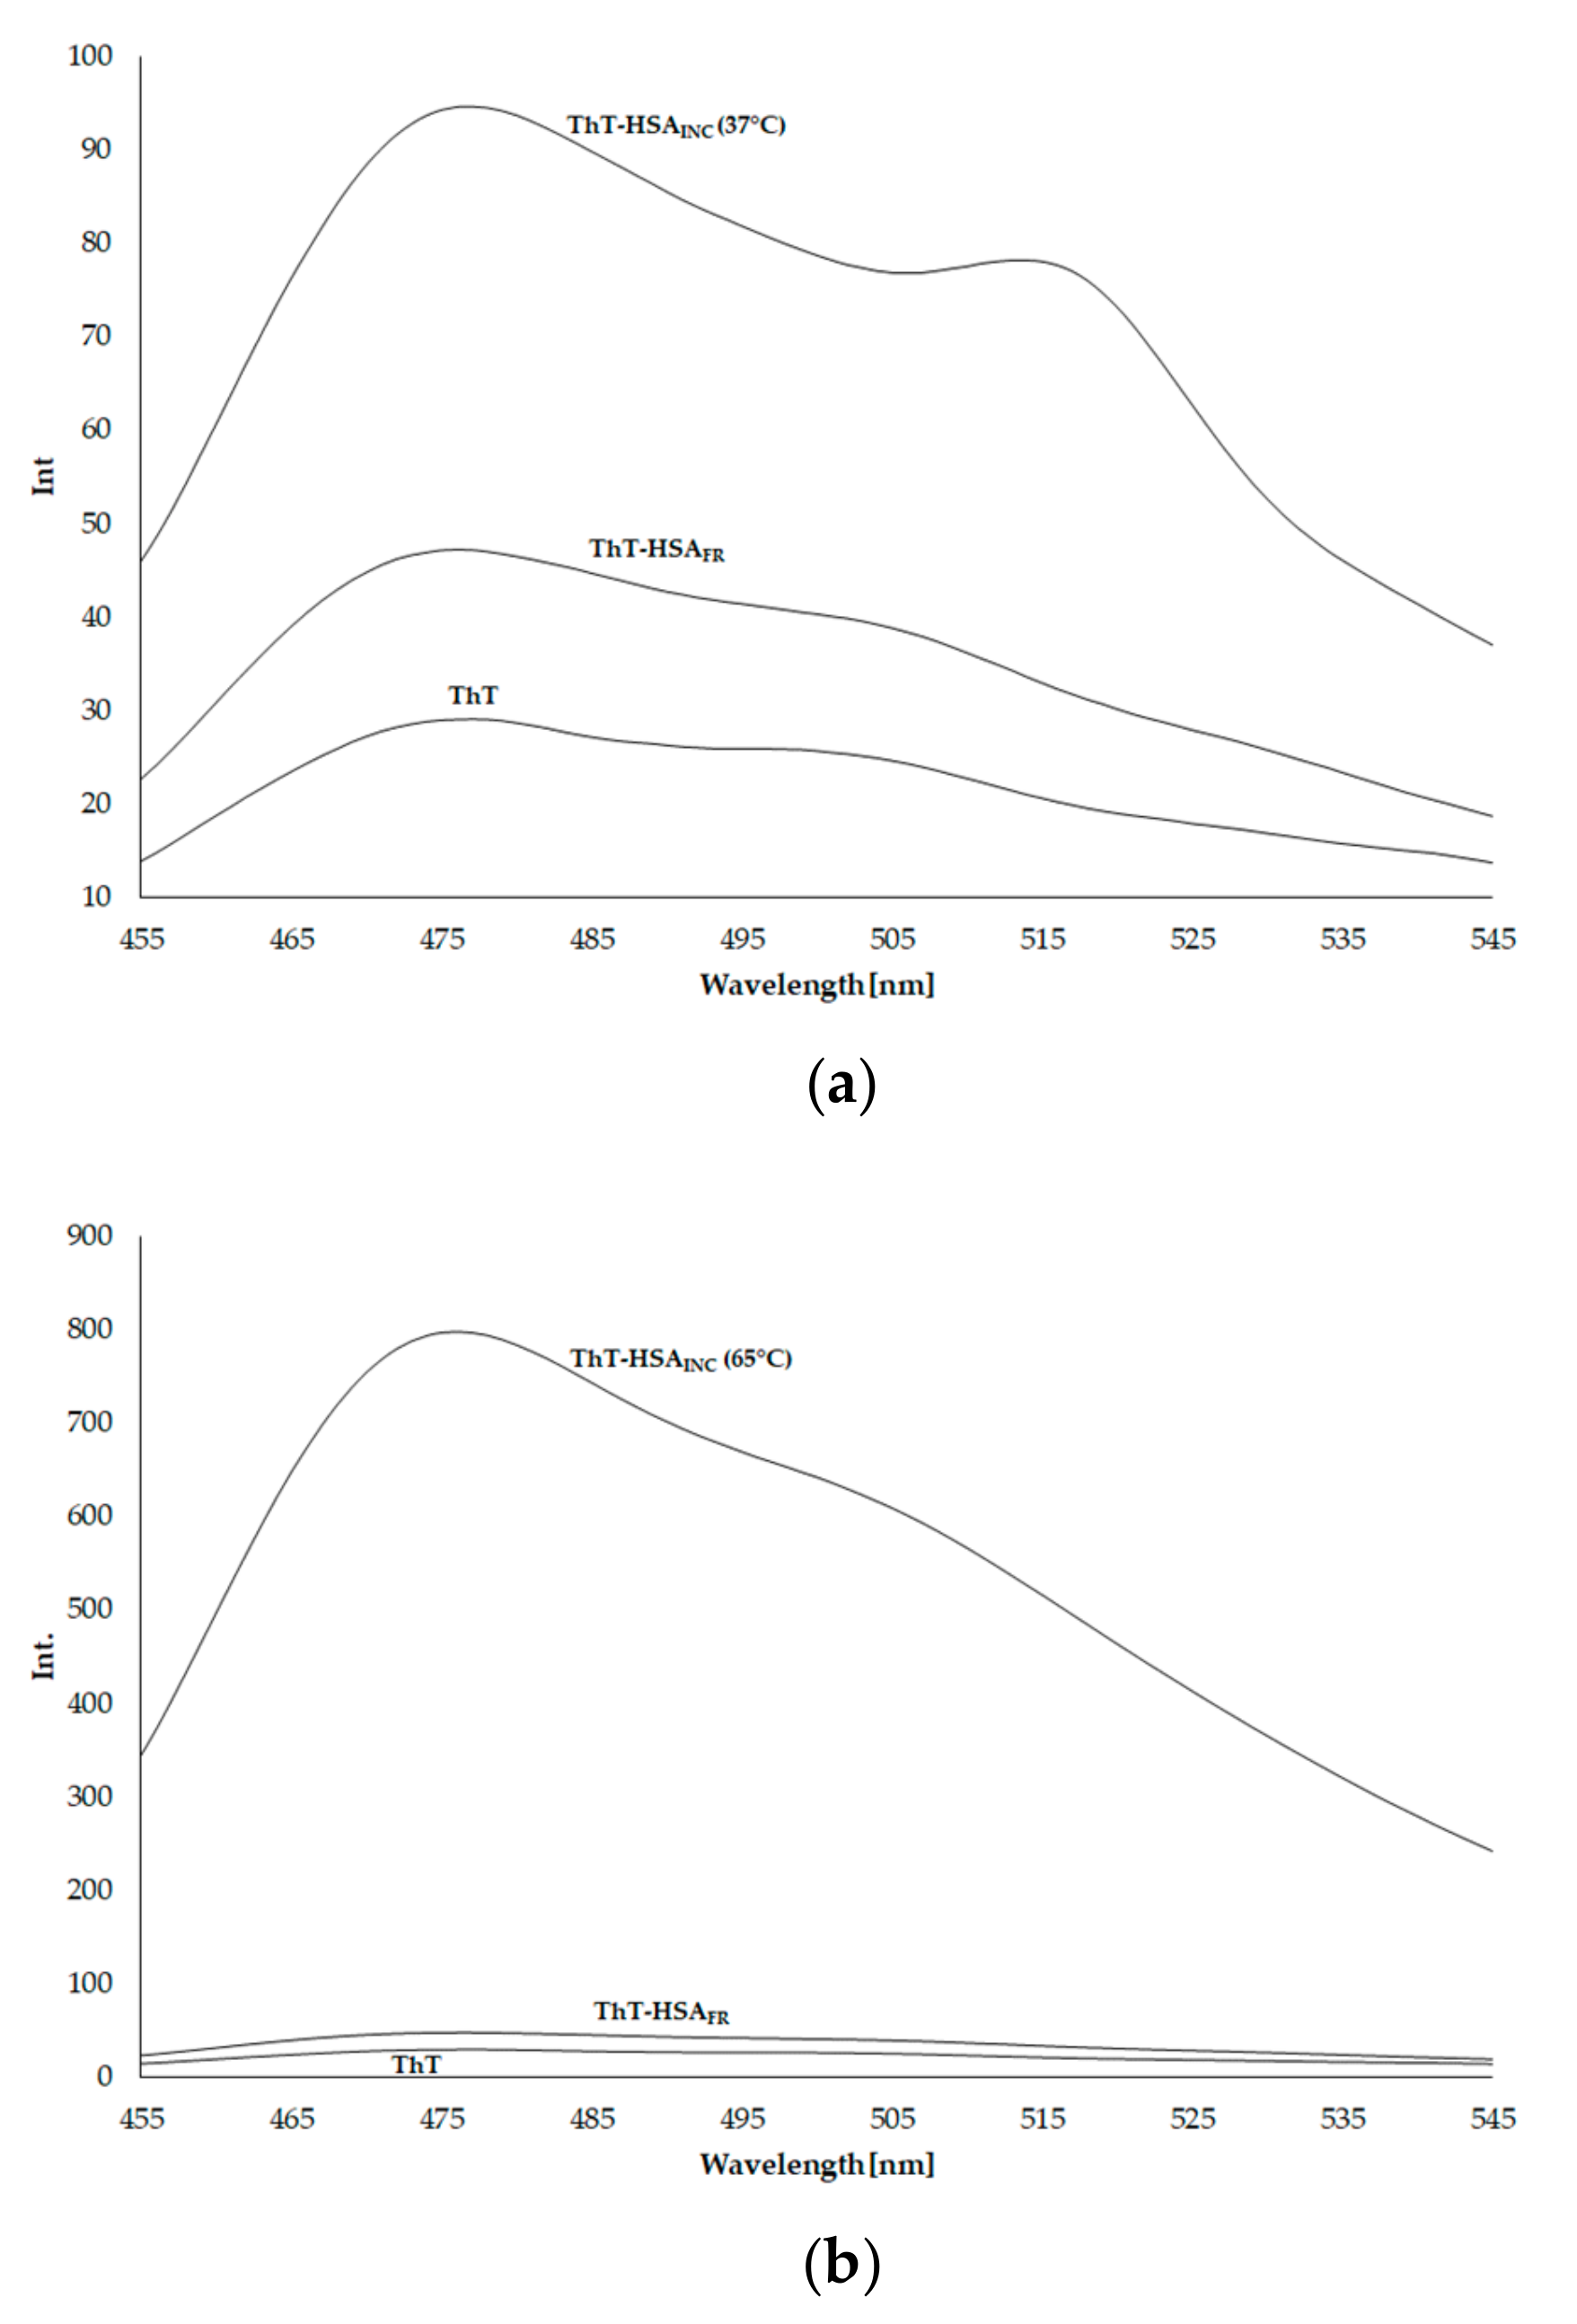
| System | λmax [nm] | Fcor |
|---|---|---|
| ThT | 477 | 29.032 |
| ThT–HSAFR | 476 | 47.185 |
| ThT–HSAINC (incubated at 37 °C for 9 days) | 477 | 94.624 |
| ThT–HSAINC (incubated at 65 °C for 7 days) | 476 | 797.720 |
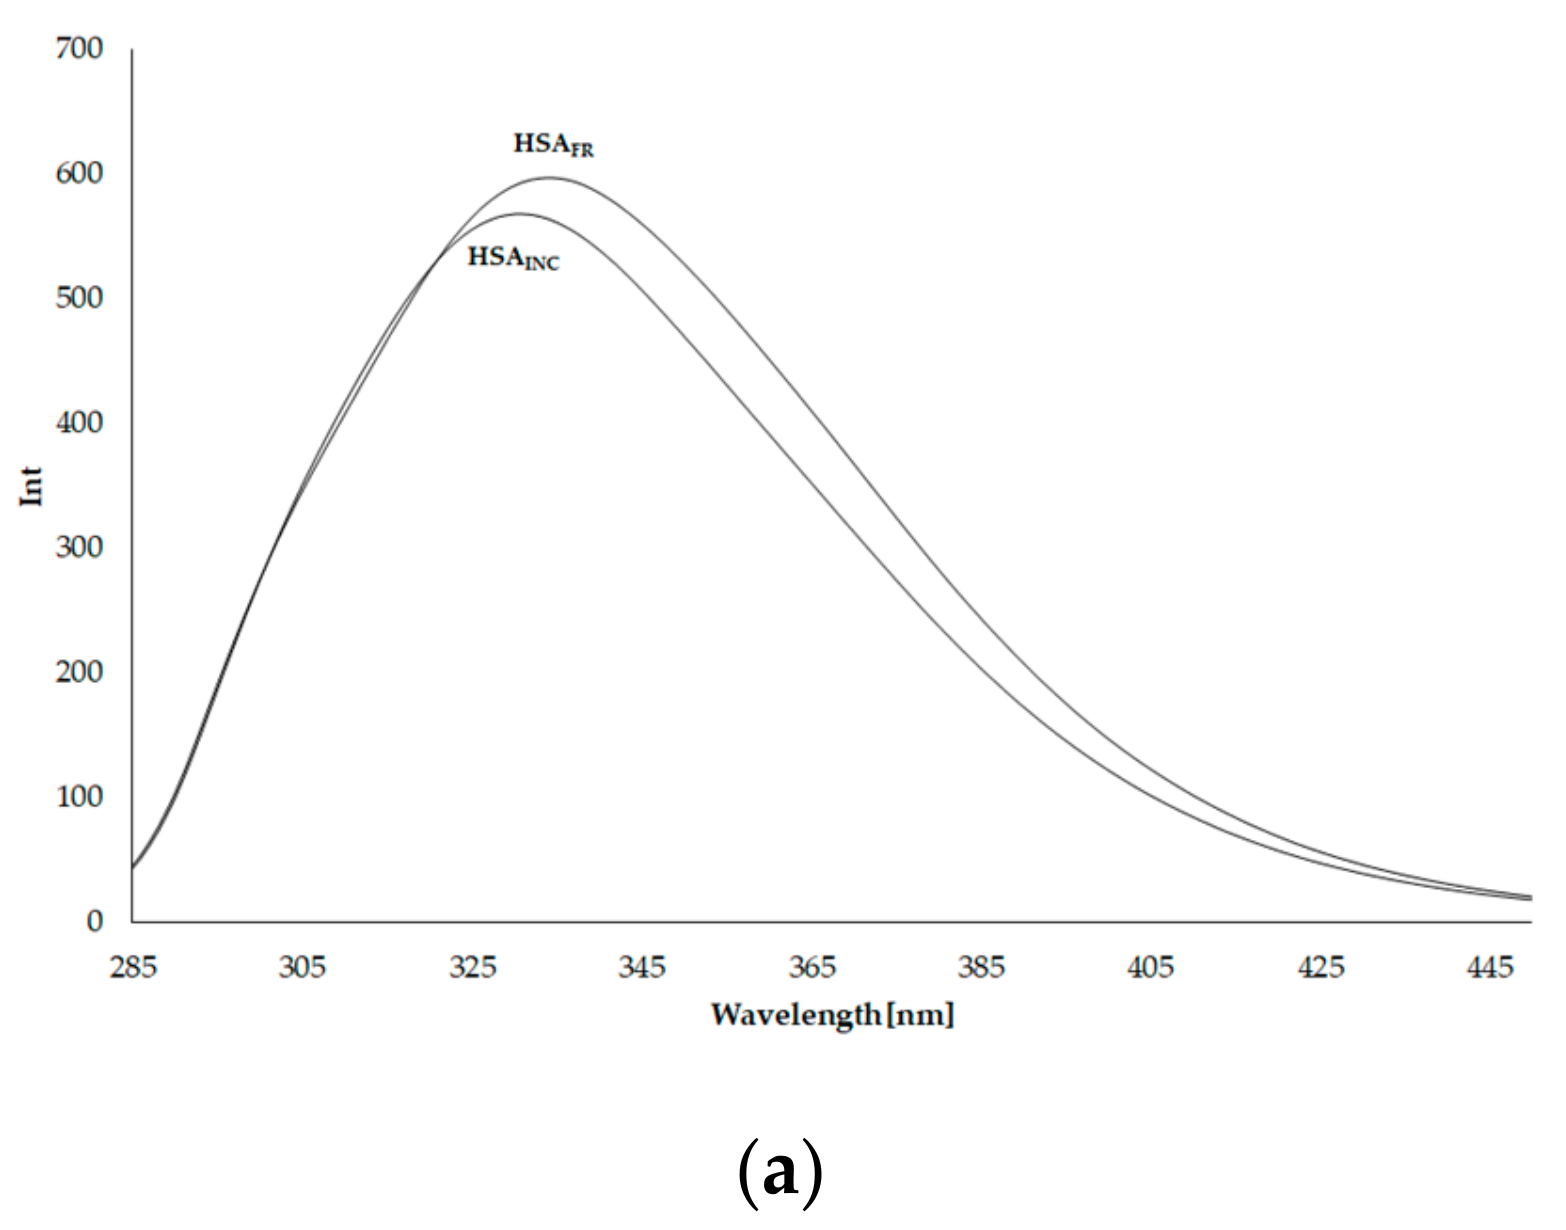
| 5 × 10⁻⁶ mol·L−1 | λex 275 nm | λex 295 nm | ||||||
|---|---|---|---|---|---|---|---|---|
| λmax (nm) | F | Parameter A | FWHM (nm) | λmax (nm) | F | Parameter A | FWHM (nm) | |
| HSAFR | 334 | 596.771 | 0.785 | 73.351 | 339 | 200.726 | 1.126 | 60.698 |
| HSAINC | 331 | 567.627 | 0.673 | 70.217 | 337 | 188.772 | 0.954 | 57.787 |
| 5 × 10⁻⁶ mol·L−1 | ∆15 nm | ∆60 nm | ||
|---|---|---|---|---|
| λmax (nm) | Fcor | λmax (nm) | Fcor | |
| HSAFR | 298 | 205.72 | 338 | 597.00 |
| HSAINC | 298 | 201.66 | 337 | 564.46 |
| 3 × 10⁻⁶ mol·L−1 | λmin [nm] | [ΘMRW] | λmin [nm] | [ΘMRW] |
|---|---|---|---|---|
| HSAFR | 210 | −19825.20 | 220 | −19012.80 |
| HSAINC | 209 | −16118.50 | 221 | −14941.03 |
| Albumin | % α-Helix | % β-Sheet | % Other |
|---|---|---|---|
| HSAFR | 35.2 | 8.4 | 56.4 |
| HSAINC | 32.9 | 11.9 | 55.2 |
© 2020 by the authors. Licensee MDPI, Basel, Switzerland. This article is an open access article distributed under the terms and conditions of the Creative Commons Attribution (CC BY) license (http://creativecommons.org/licenses/by/4.0/).
Share and Cite
Maciążek-Jurczyk, M.; Janas, K.; Pożycka, J.; Szkudlarek, A.; Rogóż, W.; Owczarzy, A.; Kulig, K. Human Serum Albumin Aggregation/Fibrillation and its Abilities to Drugs Binding. Molecules 2020, 25, 618. https://doi.org/10.3390/molecules25030618
Maciążek-Jurczyk M, Janas K, Pożycka J, Szkudlarek A, Rogóż W, Owczarzy A, Kulig K. Human Serum Albumin Aggregation/Fibrillation and its Abilities to Drugs Binding. Molecules. 2020; 25(3):618. https://doi.org/10.3390/molecules25030618
Chicago/Turabian StyleMaciążek-Jurczyk, Małgorzata, Kamil Janas, Jadwiga Pożycka, Agnieszka Szkudlarek, Wojciech Rogóż, Aleksandra Owczarzy, and Karolina Kulig. 2020. "Human Serum Albumin Aggregation/Fibrillation and its Abilities to Drugs Binding" Molecules 25, no. 3: 618. https://doi.org/10.3390/molecules25030618