Article

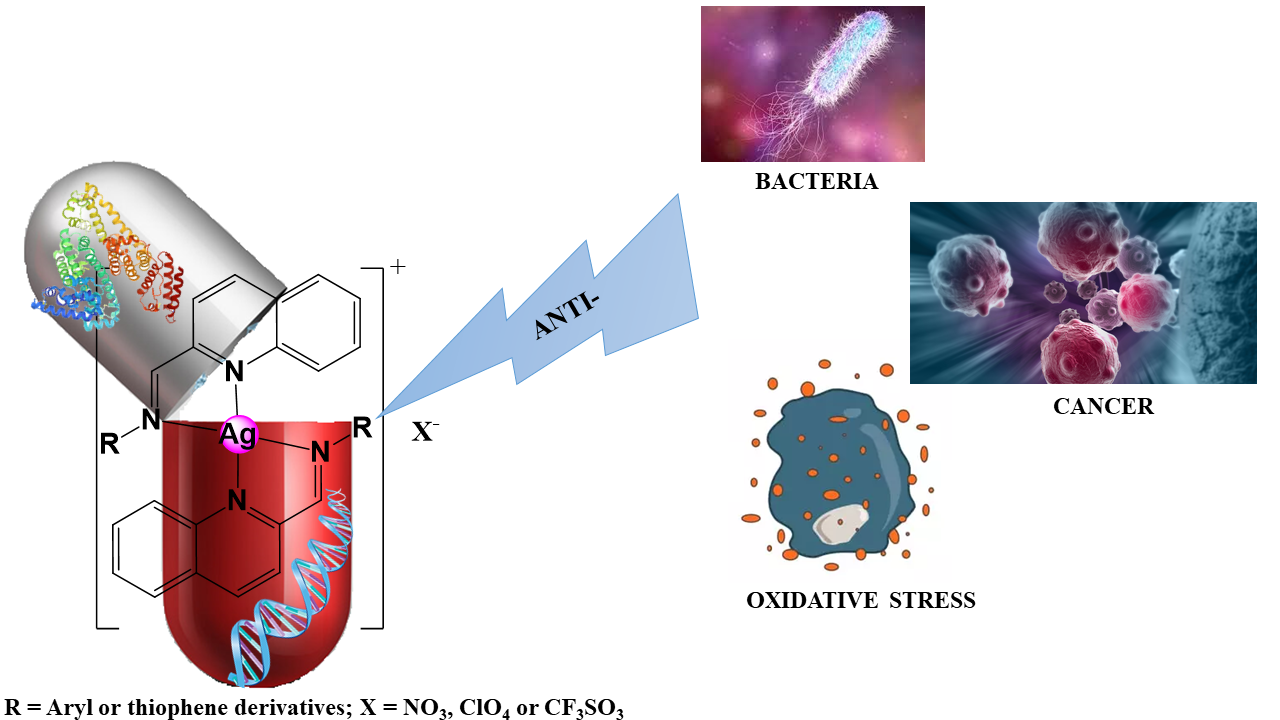
Quinoline Functionalized Schiff Base Silver (I) Complexes: Interactions with Biomolecules and In Vitro Cytotoxicity, Antioxidant and Antimicrobial Activities

by
Adesola A. Adeleke
1,2,
Sizwe J. Zamisa
3,
Md. Shahidul Islam
4,
Kolawole Olofinsan
4,
Veronica F. Salau
4,
Chunderika Mocktar
5 and
Bernard Omondi
1,*
1
School of Chemistry and Physics, Pietermaritzburg Campus, University of Kwazulu-Natal, Private Bag X01, Scottsville 3209, South Africa
2
Department of Chemical Sciences, Olabisi Onabanjo University, P. M. B. 2002, Ago-Iwoye 120107, Nigeria
3
School of Chemistry and Physics, Westville Campus, University of Kwazulu-Natal, Private Bag X54001, Westville 4001, South Africa
4
Discipline of Biochemistry, School of Life Sciences, Westville Campus, University of Kwazulu-Natal, Private Bag X54001, Durban 4000, South Africa
5
Discipline of Pharmaceutical Sciences, School of Health Sciences, Westville Campus, University of Kwazulu-Natal, Private Bag X54001, Durban 4000, South Africa
*
Author to whom correspondence should be addressed.
Molecules 2021, 26(5), 1205; https://doi.org/10.3390/molecules26051205
Submission received: 29 December 2020 / Revised: 16 January 2021 / Accepted: 18 January 2021 / Published: 24 February 2021

Abstract

:
A series of fifteen silver (I) quinoline complexes Q1Q15 have been synthesized and studied for their biological activities. Q1Q15 were synthesized from the reactions of quinolinyl Schiff base derivatives L1L5 (obtained by condensing 2-quinolinecarboxaldehyde with various aniline derivatives) with AgNO3, AgClO4 and AgCF3SO3. Q1Q15 were characterized by various spectroscopic techniques and the structures of [Ag(L1)2]NO3 Q1, [Ag(L1)2]ClO4 Q6, [Ag(L2)2]ClO4 Q7, [Ag(L2)2]CF3SO3 Q12 and [Ag(L4)2]CF3SO3 Q14 were unequivocally determined by single crystal X-ray diffraction analysis. In vitro antimicrobial tests against Gram-positive and Gram-negative bacteria revealed the influence of structure and anion on the complexes′ moderate to excellent antibacterial activity. In vitro antioxidant activities of the complexes showed their good radical scavenging activity in ferric reducing antioxidant power (FRAP). Complexes with the fluorine substituent or the thiophene or benzothiazole moieties are more potent with IC50 between 0.95 and 2.22 mg/mL than the standard used, ascorbic acid (2.68 mg/mL). The compounds showed a strong binding affinity with calf thymus-DNA via an intercalation mode and protein through a static quenching mechanism. Cytotoxicity activity was examined against three carcinoma cell lines (HELA, MDA-MB231, and SHSY5Y). [Ag(L2)2]ClO4 Q7 with a benzothiazole moiety and [Ag(L4)2]ClO4 Q9 with a methyl substituent had excellent cytotoxicity against HELA cells.

Graphical Abstract

1. Introduction

Schiff bases are an extensively studied important class of ligands. They are commonly synthesized by the condensation reaction of aromatic aldehydes or ketones with primary amines resulting in an azomethine moiety with at least one aryl group attached to either the carbon or nitrogen atom. The interest in Schiff base ligands is therefore as such due to their ease of synthesis, selectivity to the central metal ion [1], synthesis flexibility [2], structural diversity [3], and their broad biological applications [4].
Quinolines are derivatives of pyridine and are found in many biologically active natural [5,6] and synthetic [7,8,9] compounds. Their Schiff base derivatives have also been identified with various pharmaceutical activities [10,11]. Although some free Schiff base ligands are known to be bioactive, literature has shown that incorporating metal in such ligands enhances their activities [12,13]. This has lately driven research in metal-based drugs. Transition metal ions regarded as potential biological agents are platinum, cobalt, copper, zinc, and ruthenium [14,15,16,17]. However, there is an emerging curiosity in exploring silver(I) and its complexes as antimicrobial and antioxidant agents as well as efficient DNA and protein binders [18] with potential cytotoxicity activity. Our interest in silver(I) ion is due to its low toxicity to human at low concentration [19], high cytotoxicity [20], and good potency compared to other bioactive metal complexes such as cisplatin, known to have drawbacks which include nephrotoxicity, drug resistance, and cervical renal problems [21].
Silver(I) complexes have been reported to have significant anti-tumor activity [22,23] with minimum side effects; this is in addition to their well-known antimicrobial activities [24,25] and their effective scavenging of free radicals and reactive oxygen species (ROSs) [26].
The interaction of metal complexes with deoxyribonucleic acid (DNA) and plasma proteins are important when designing effective bioactive drugs that target the DNA since binding of small organic and inorganic molecules to DNA can influence numerous biological processes in which DNA participate, like transcription and replication [27].
The serum albumins are also considered to be one of the main molecular targets in the action of anticancer agents. Since proteins play an important role in the transportation and deposition of various endogenous and exogenous substances in the blood, their interactions with drugs lead to the formation of stable drug-protein complexes [28].
Inspired by the biological activities of pyridinyl imine reported previously by our group [29], we decided to incorporate a quinoline moiety into an imine ligand to investigate the effect of an additional phenyl ring in the ligand in biological systems. We have as such explored some ligands derived from the condensation reaction of 2-quinolinecarboxaldehyde with 2-fluoroaniline, 2-aminobenzenethiol, 4-chloroaniline, p-toluidine, and thiophene-2-ylmethanamine, respectively. Report herein is the synthesis, characterization, and biological studies of N,N-bidentate quinolinyl Schiff base ligands, and their Ag(I) -nitrate, -perchlorate, and -triflate complexes.

2. Results and Discussion

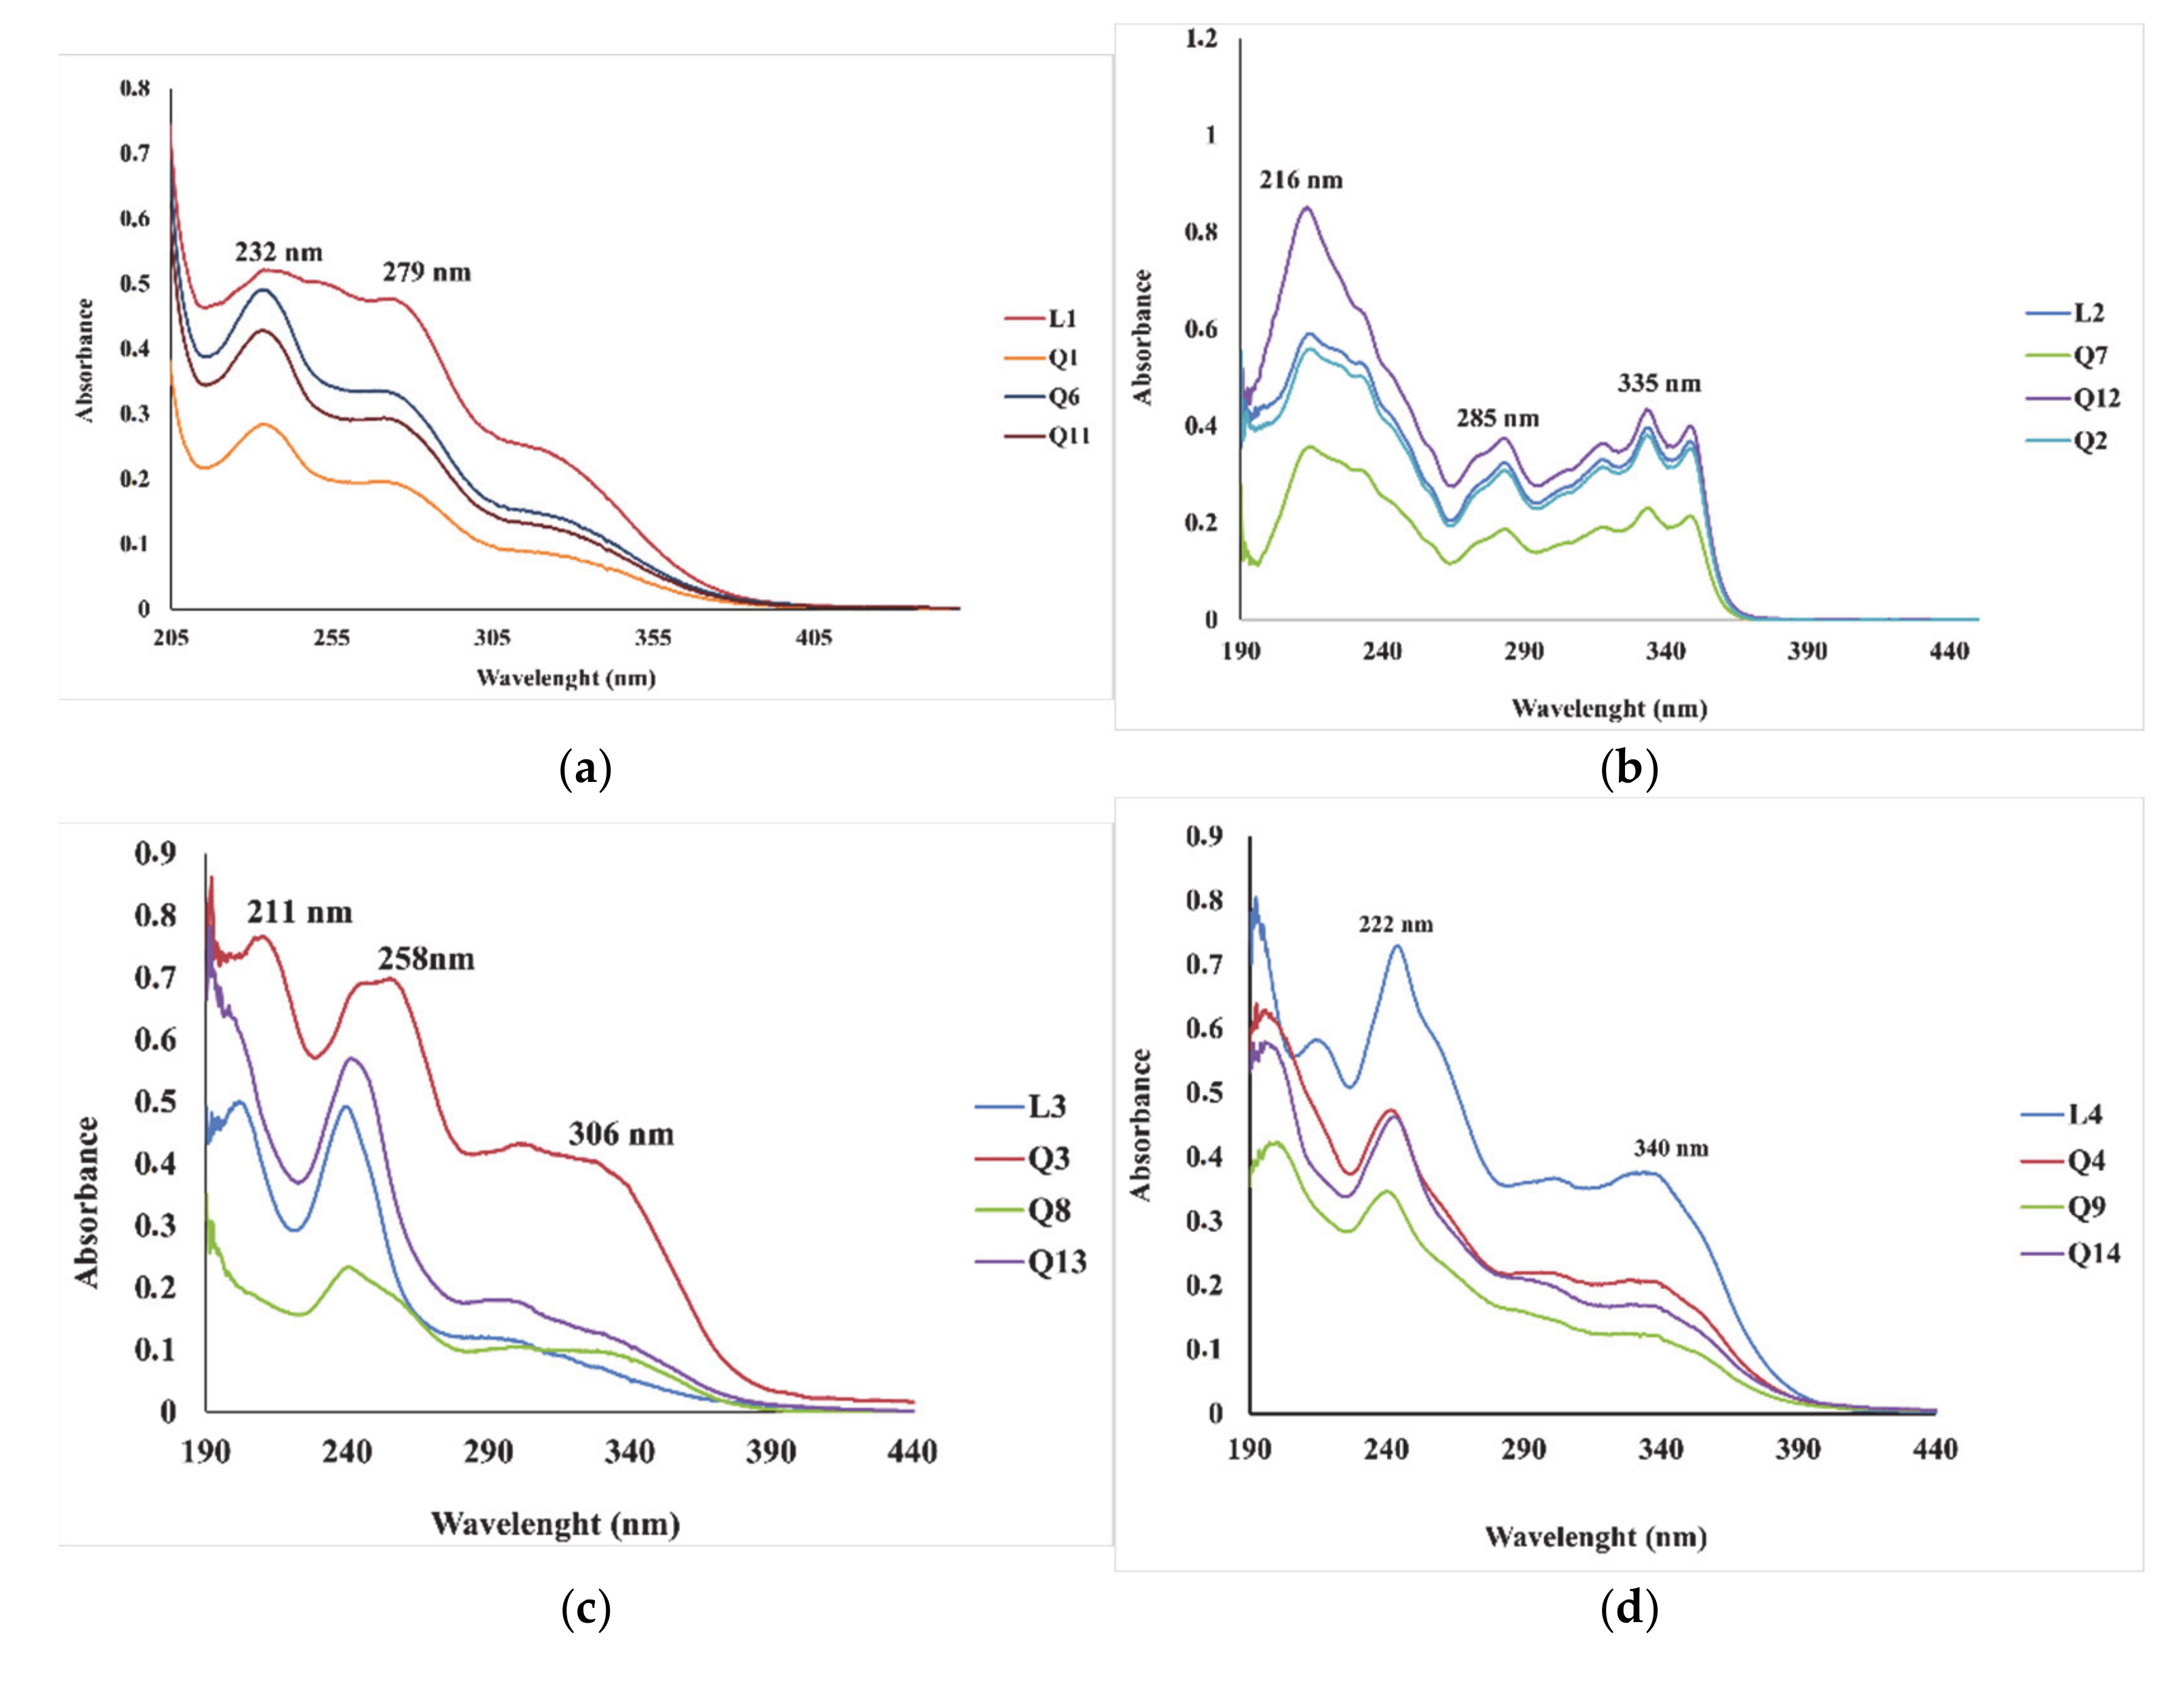
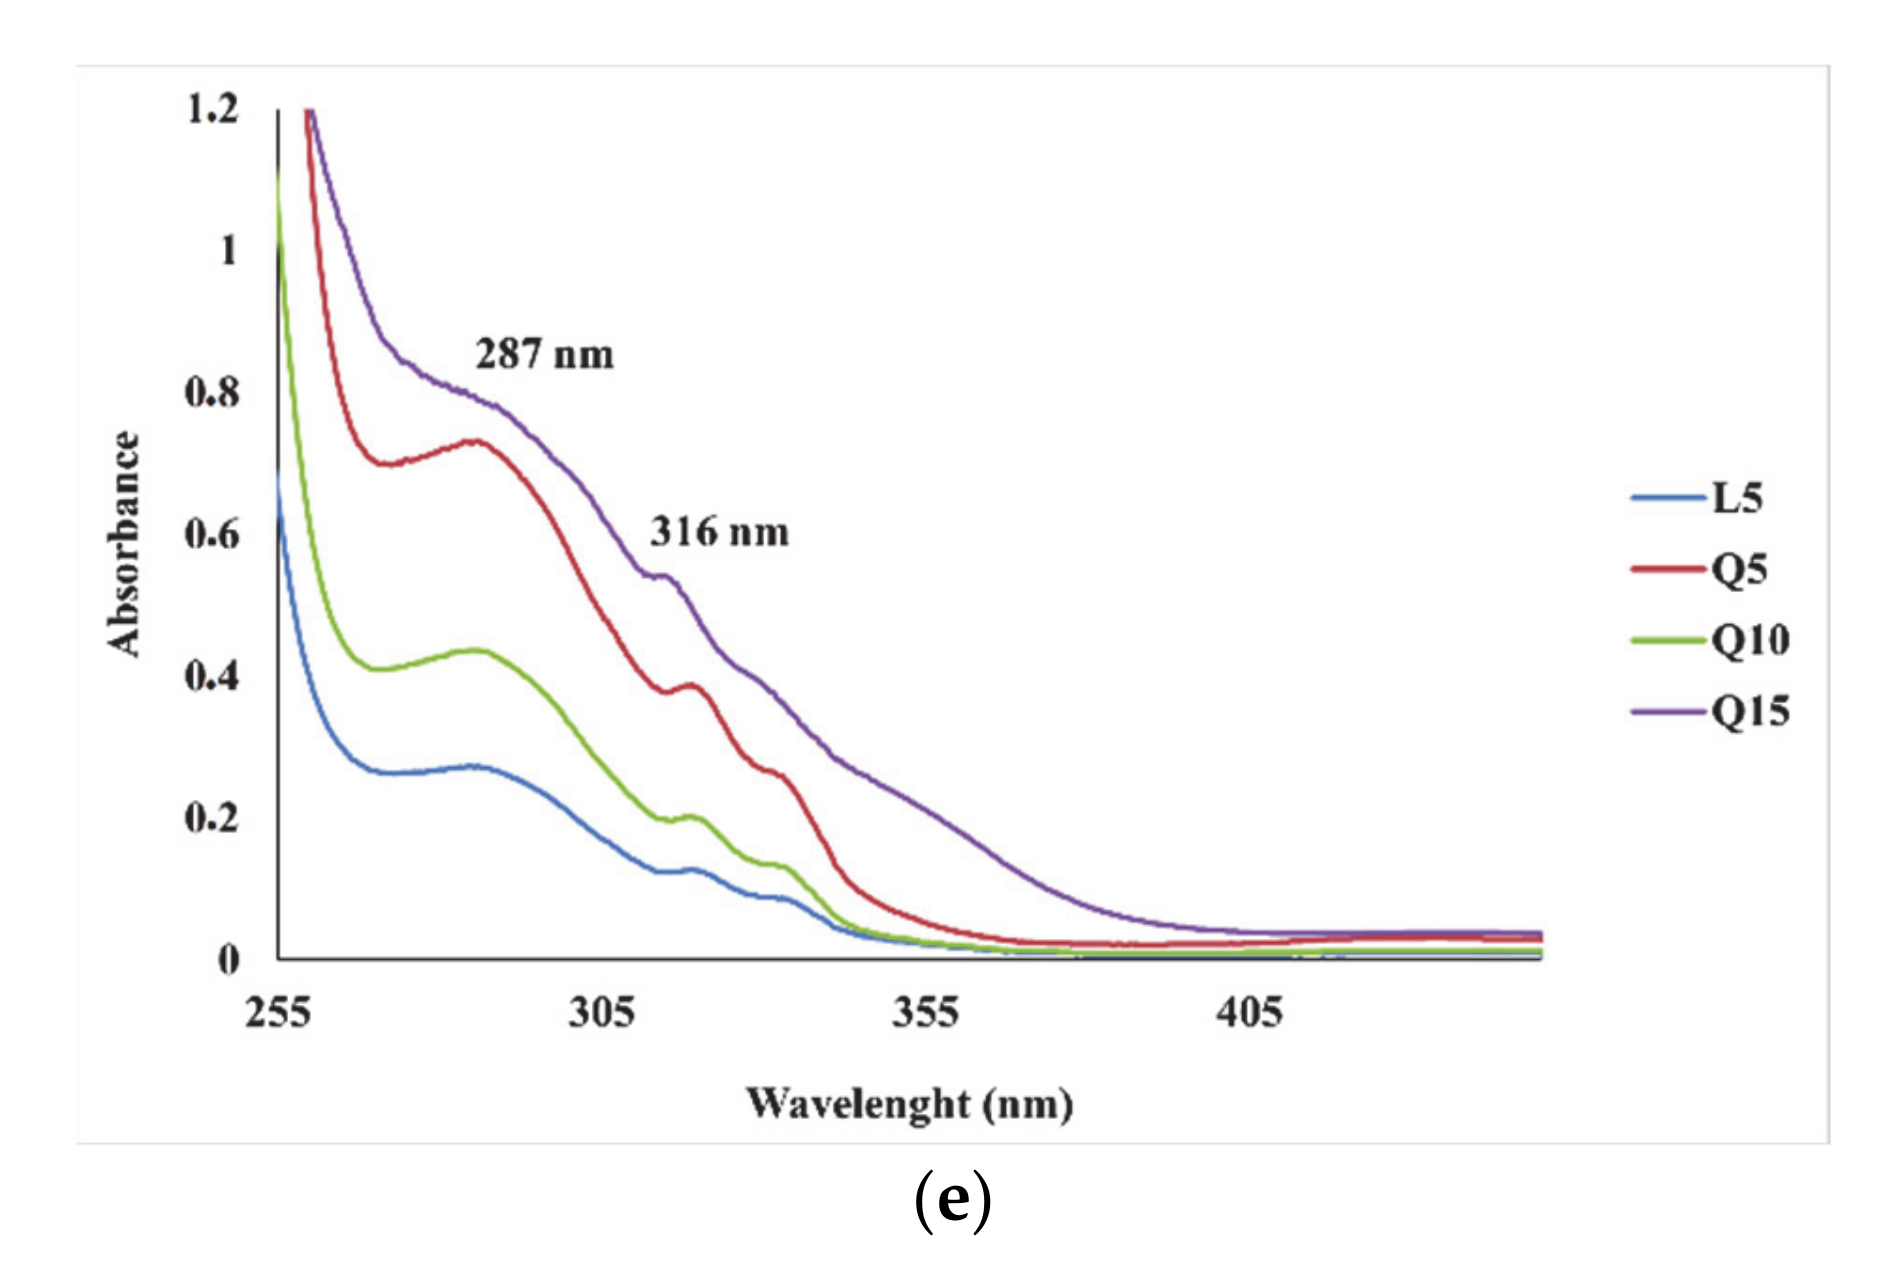
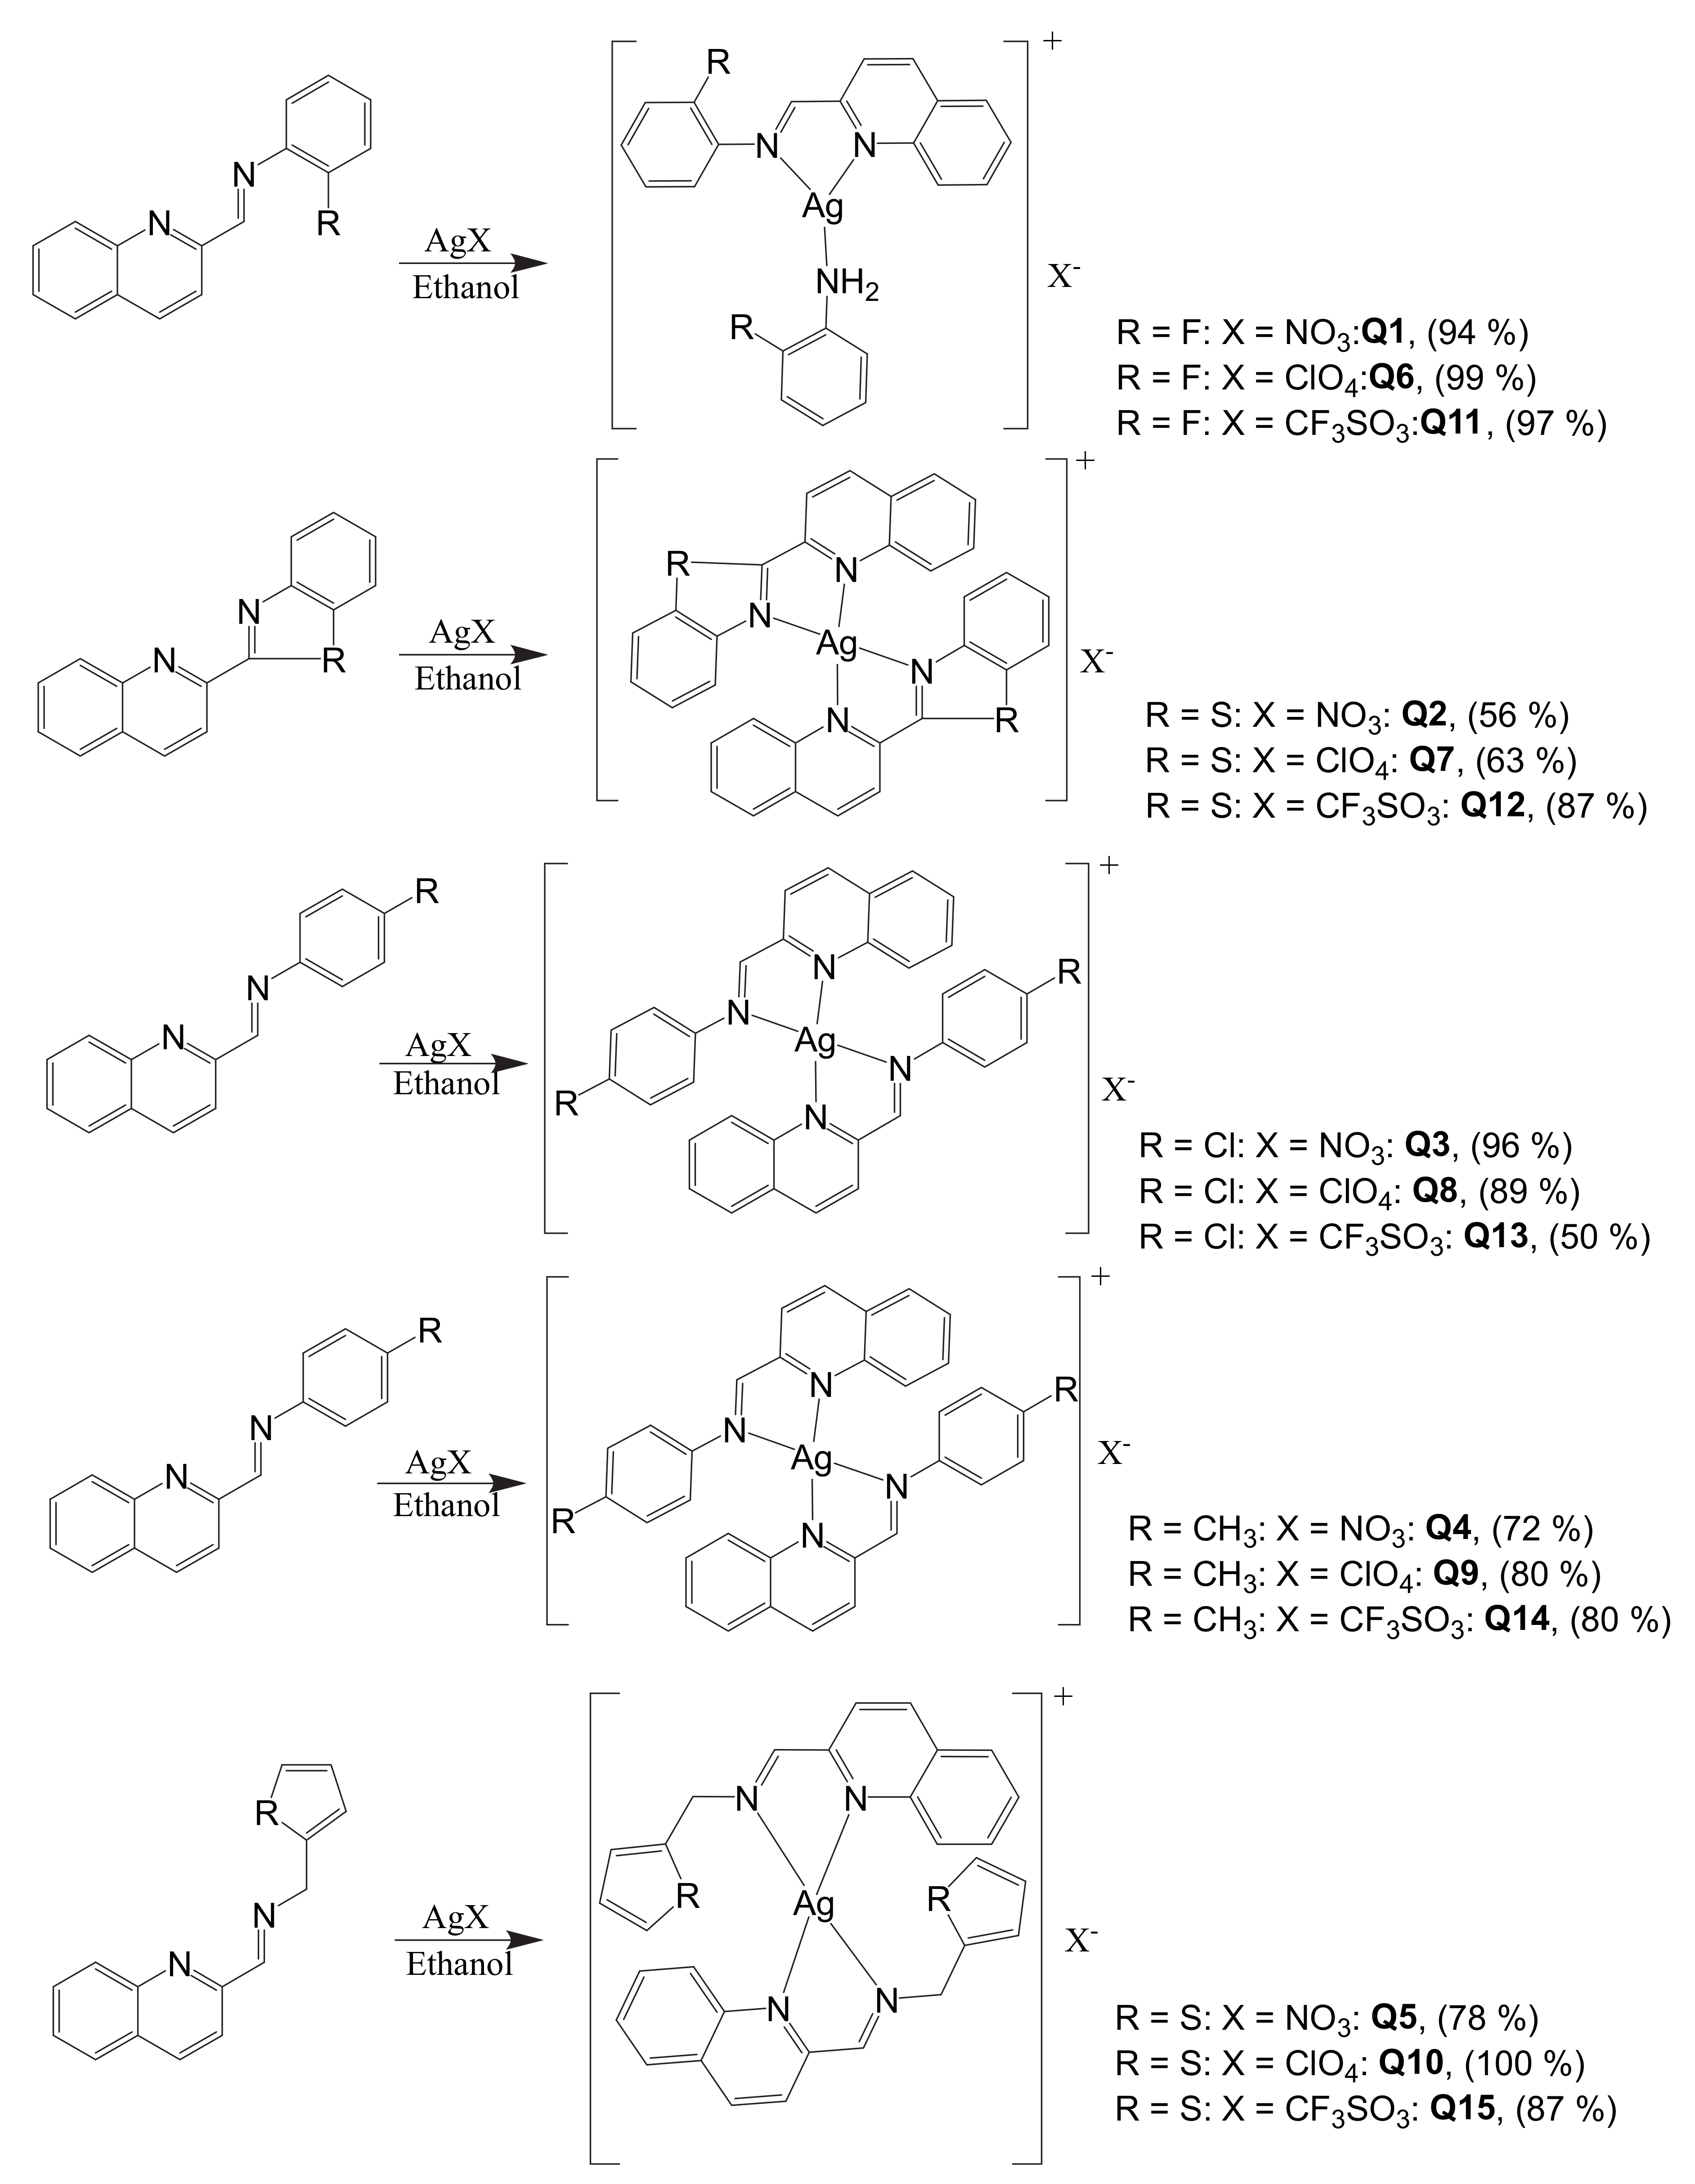
2.1. Synthesis and Characterization of L1L5

The ligands were prepared by the condensation reaction of 2-quinolinecarboxaldehyde with five substituted aromatic anilines (2-fluoroaniline, L1; 2-aminobenzenethiol, L2; 4-chloroaniline, L3; p-toluidine, L4; and 2-thiophenemethylamine, L5) in anhydrous ethanol in excellent yields as per the method in literature [30]. All the physical and spectral data for the known ligands [31,32,33] were "in agreement" with the ones previously reported.

2.2. Synthesis and Characterization of the Complexes

Complexes Q1Q15 were obtained in good to excellent yields between 50 and 100% by reacting two equivalents of the respective ligands (L1L5) with one equivalent of the silver(I) salts in anhydrous ethanol (Scheme 1). The air-stable solids are soluble in common organic solvents such as dichloromethane, acetonitrile, tetrahydrofuran, dimethylsulfoxide, dimethylformamide, and some in water.
The reaction of L1L5 with silver(I) metal ion in a 1:2 (Ag:L) molar ratio in anhydrous ethanol afforded fifteen complexes (Q1Q15) and was followed using 1H NMR spectroscopy in DMSO-d6. The solution behavior of the complexes differs in the solid-state as observed in the crystal structures of Q7, Q12, and Q14 and their 1H NMR spectra peaks. In the 1H NMR spectra of Q1Q15, three and four coordinate geometries were observed, indicating the presence of two types of complex species in solution. In the 1H-NMR spectra of Q1Q15 (except Q1, Q6, and Q11), the integration values and the significant downfield shifts in the resonance of the protons in the vicinity of the -C=N- atoms and the alpha proton on the quinoline ring relative to their free ligand resonance peaks (Table S1) point to the formation of the complexes in 1:2 (Ag:L) stoichiometry. This suggests that L2, L3, L4, and L5 are four coordinates in solution coordinating to the silver metal center via the Nim and Nqy atoms and in L2 via Nthiazole and Nqy atoms. This mode of coordination is consistent with other reported silver(I) complexes of similar ligand [34,35,36].
The pattern of coordination is different in complexes Q1, Q6, and Q11. The integration values of Q1, Q6, and Q11 showed that the complexes adopt a 3-coordinate geometry as is evident from their 1H-NMR spectra. A significant downfield shift in the azomethine protons and upfield shift in the alpha protons with respect to the N atom in the quinoline ring was observed in comparison with their free ligand resonance. In addition to this, protons on the carbon of aniline in Q1, Q6, and Q11 and a singlet of amine protons at δ 5.04 ppm was seen, which shows that the silver ion coordinated to one ligand L1 (through the Nim and Nqy atoms) and the N atom of aniline from the fraction of the second ligand resulting in a three-coordinate geometry. In the 1H-NMR spectrum of Q11, the NH2 proton is absent which could be attributed to the low concentration of the complex in solution. The tricoordinate observed in Q1, Q6, and Q11 are likely due to the steric repulsions between the two Schiff bases resulting in the hydrolysis of one of the ligands. Further, the electron-withdrawing substituent in Q1, Q6, and Q11 could have influenced this type of coordination because electron-withdrawing substituent is known for their ability to reduce electron density around the metal center and thus affects binding interaction between the metal and the coordination donor [37]. The effects of solvent on the Schiff base hydrolysis can also not be overlooked as this type of Schiff base hydrolysis during coordination has been reported [38,39].
Coordination of L1L5 to the Ag(I) centers were confirmed by comparing the FT-IR spectroscopy (Table S1). Bands observed between 1613 and 1636 cm−1 associated with the -C=N- bond stretching frequencies shifted to higher frequencies between 1624 and 1684 cm−1 in the spectra of the L4 and L5 upon coordination to Ag(I) while in L1 and L3, the -C=N- band shifted to lower frequencies from 1618–1693 cm−1 to 1613–1624 cm−1, respectively, on coordination to Ag(I).
In the spectrum of L2 with thiazole moiety, the -C=N- bond shifted from 1452 cm−1 to higher frequency on coordination to Ag(I) in the spectra of Q2, Q7, and Q12 between ca. 1456 and 1457 cm−1. The absorption bands associated with the C=N quinolinyl ring in the range 1591–1593 cm−1 in the spectra of L1, L2, L4, and L5 shifted to the lower frequency on coordination to 1585–1592 cm−1. In L3 spectra, the C=N quinolinyl ring at 1588 cm−1 blue-shifted to 1591–1592 cm−1 on coordination in the spectra of Q3, Q8, and Q13. Coordination of L2, L3, L4, and L5 to Ag(I) can thus be proposed to be via either Nim or Nthiazole and Nqui donor atoms [34,40,41], while for L1, coordination was via Nim, Nqui, and Namine donor atoms.
The mass spectra of Q1Q15 were all obtained in the positive ion mode. Molecular ion peaks m/z = 468 for Q1, Q6, and Q11 arise from [Ag(L1)]+, Q2, Q7, and Q12 had their base peak at m/z 633 corresponding to [Ag(L2)2]+ while for Q3, Q8, and Q13 and Q4, Q9, and Q14 base peaks corresponding to [Ag(L3)2]+ and [Ag(L4)2]+ were observed at m/z 641 and m/z 601, respectively. The molecular formula [Ag(L5)2]+ corresponded to a prominent molecular ion peak at m/z 613 for complexes Q5, Q10, and Q15. All spectroscopic studies, along with the elemental analysis (see Supplementary Materials Tables S1 and S2), confirmed the formation and purity of the proposed structures in Scheme 1.
Molar conductivity of Q1Q15 was measured in dimethylformamide at 25 °C and the values range between 0.28 and 4.05 × 10⁴ S m2 mol−1 (see Supplementary Materials Table S2), indicating that the complexes act as electrolytes.
Electronic absorption spectra recorded in acetonitrile at room temperature in the UV-Vis region of the free L1L5 ligands and their corresponding complexes Q1Q15 are presented in Figure 1. The absorption spectra of L1, L3, and L4 (Figure 1a,c,d) and their respective complexes are similar having two major absorption bands in the UV region between 232–275 nm and 300–340 nm. In L2 and its complexes absorption spectra (Figure 1b), five similar absorption bands in the UV region between 216–289 and 318–350 nm attributed to intraligand (IL) π–π * and n–π * transitions respectively are displayed. L5 and its complexes showed one major absorption spectra between 287 and 291, accompanied by two shoulders between 316 and 337 nm. All the complexes′ bands can be attributed to intra-ligand n–π *, π–π *, and metal to ligand charge transfer transitions (MLCT) [42,43]. A general slight red-shift in the spectra of L1L5 complexes was observed, which can be associated with a decrease in energy at the excited states upon coordination to silver(I) [44,45,46]. The steric effects of the various substituents were observed to have influenced the mode of coordination in the structures of L1, L2, and L4 complexes.
In the structures of L2 complexes, the involvement of anion in the coordination to the Ag(I) center seems to be influenced by the less steric hindrance of the benzothiazole moiety as seen in complexes Q7 and Q12 structures (Figure 2c,d). These types of coordination by trifluoromethanesulfonate anion have been reported [47]. In L1 complexes, the hydrolytic cleavage of one molecule of the Schiff base ligands could be related to the steric repulsions between the two Schiff bases.

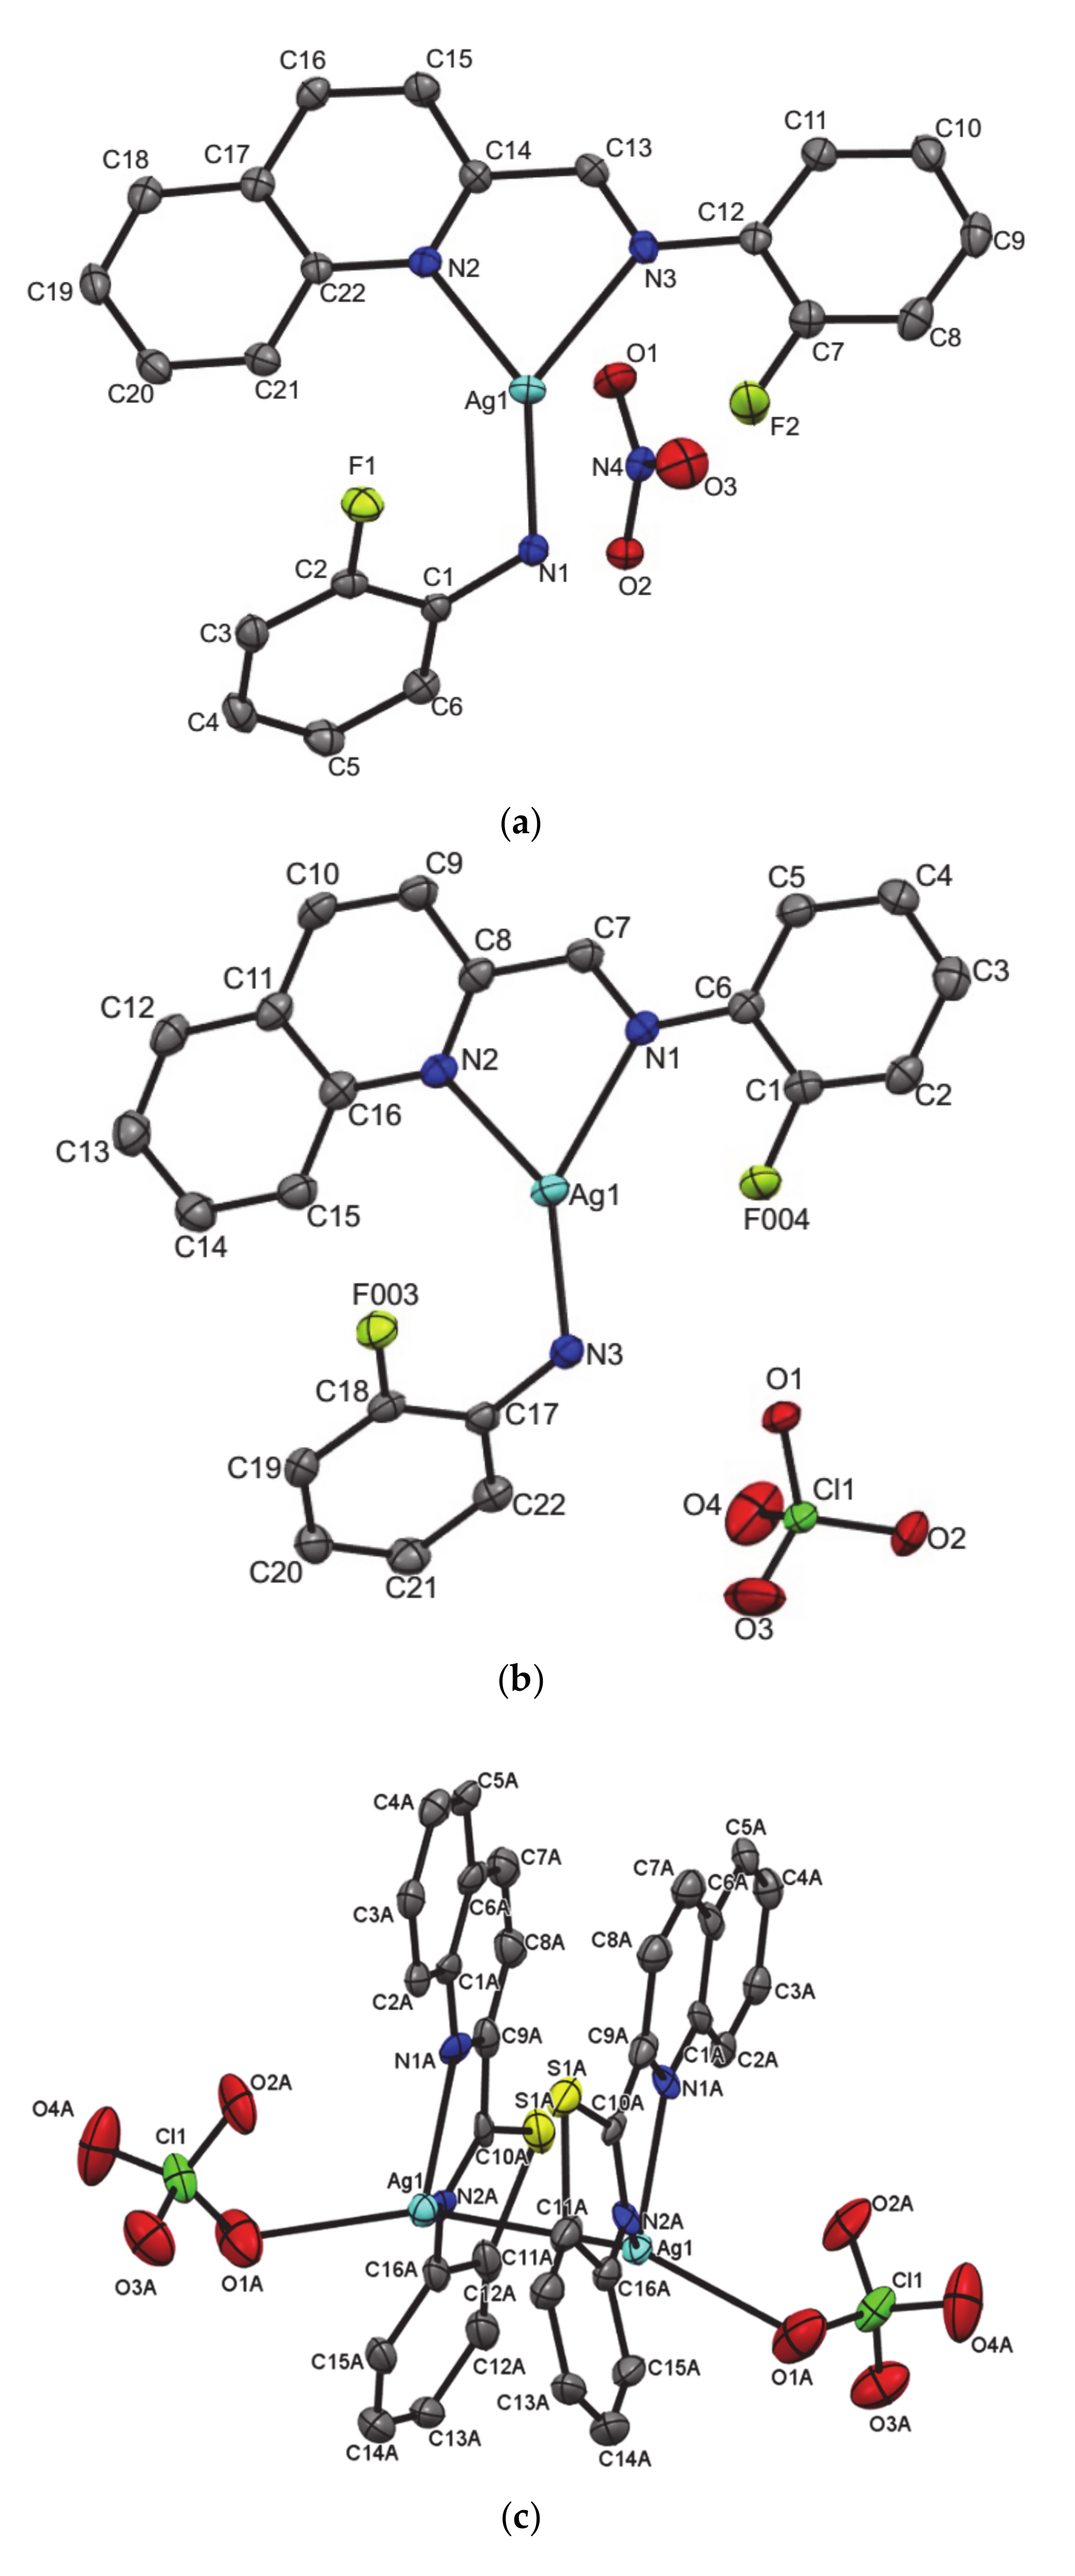
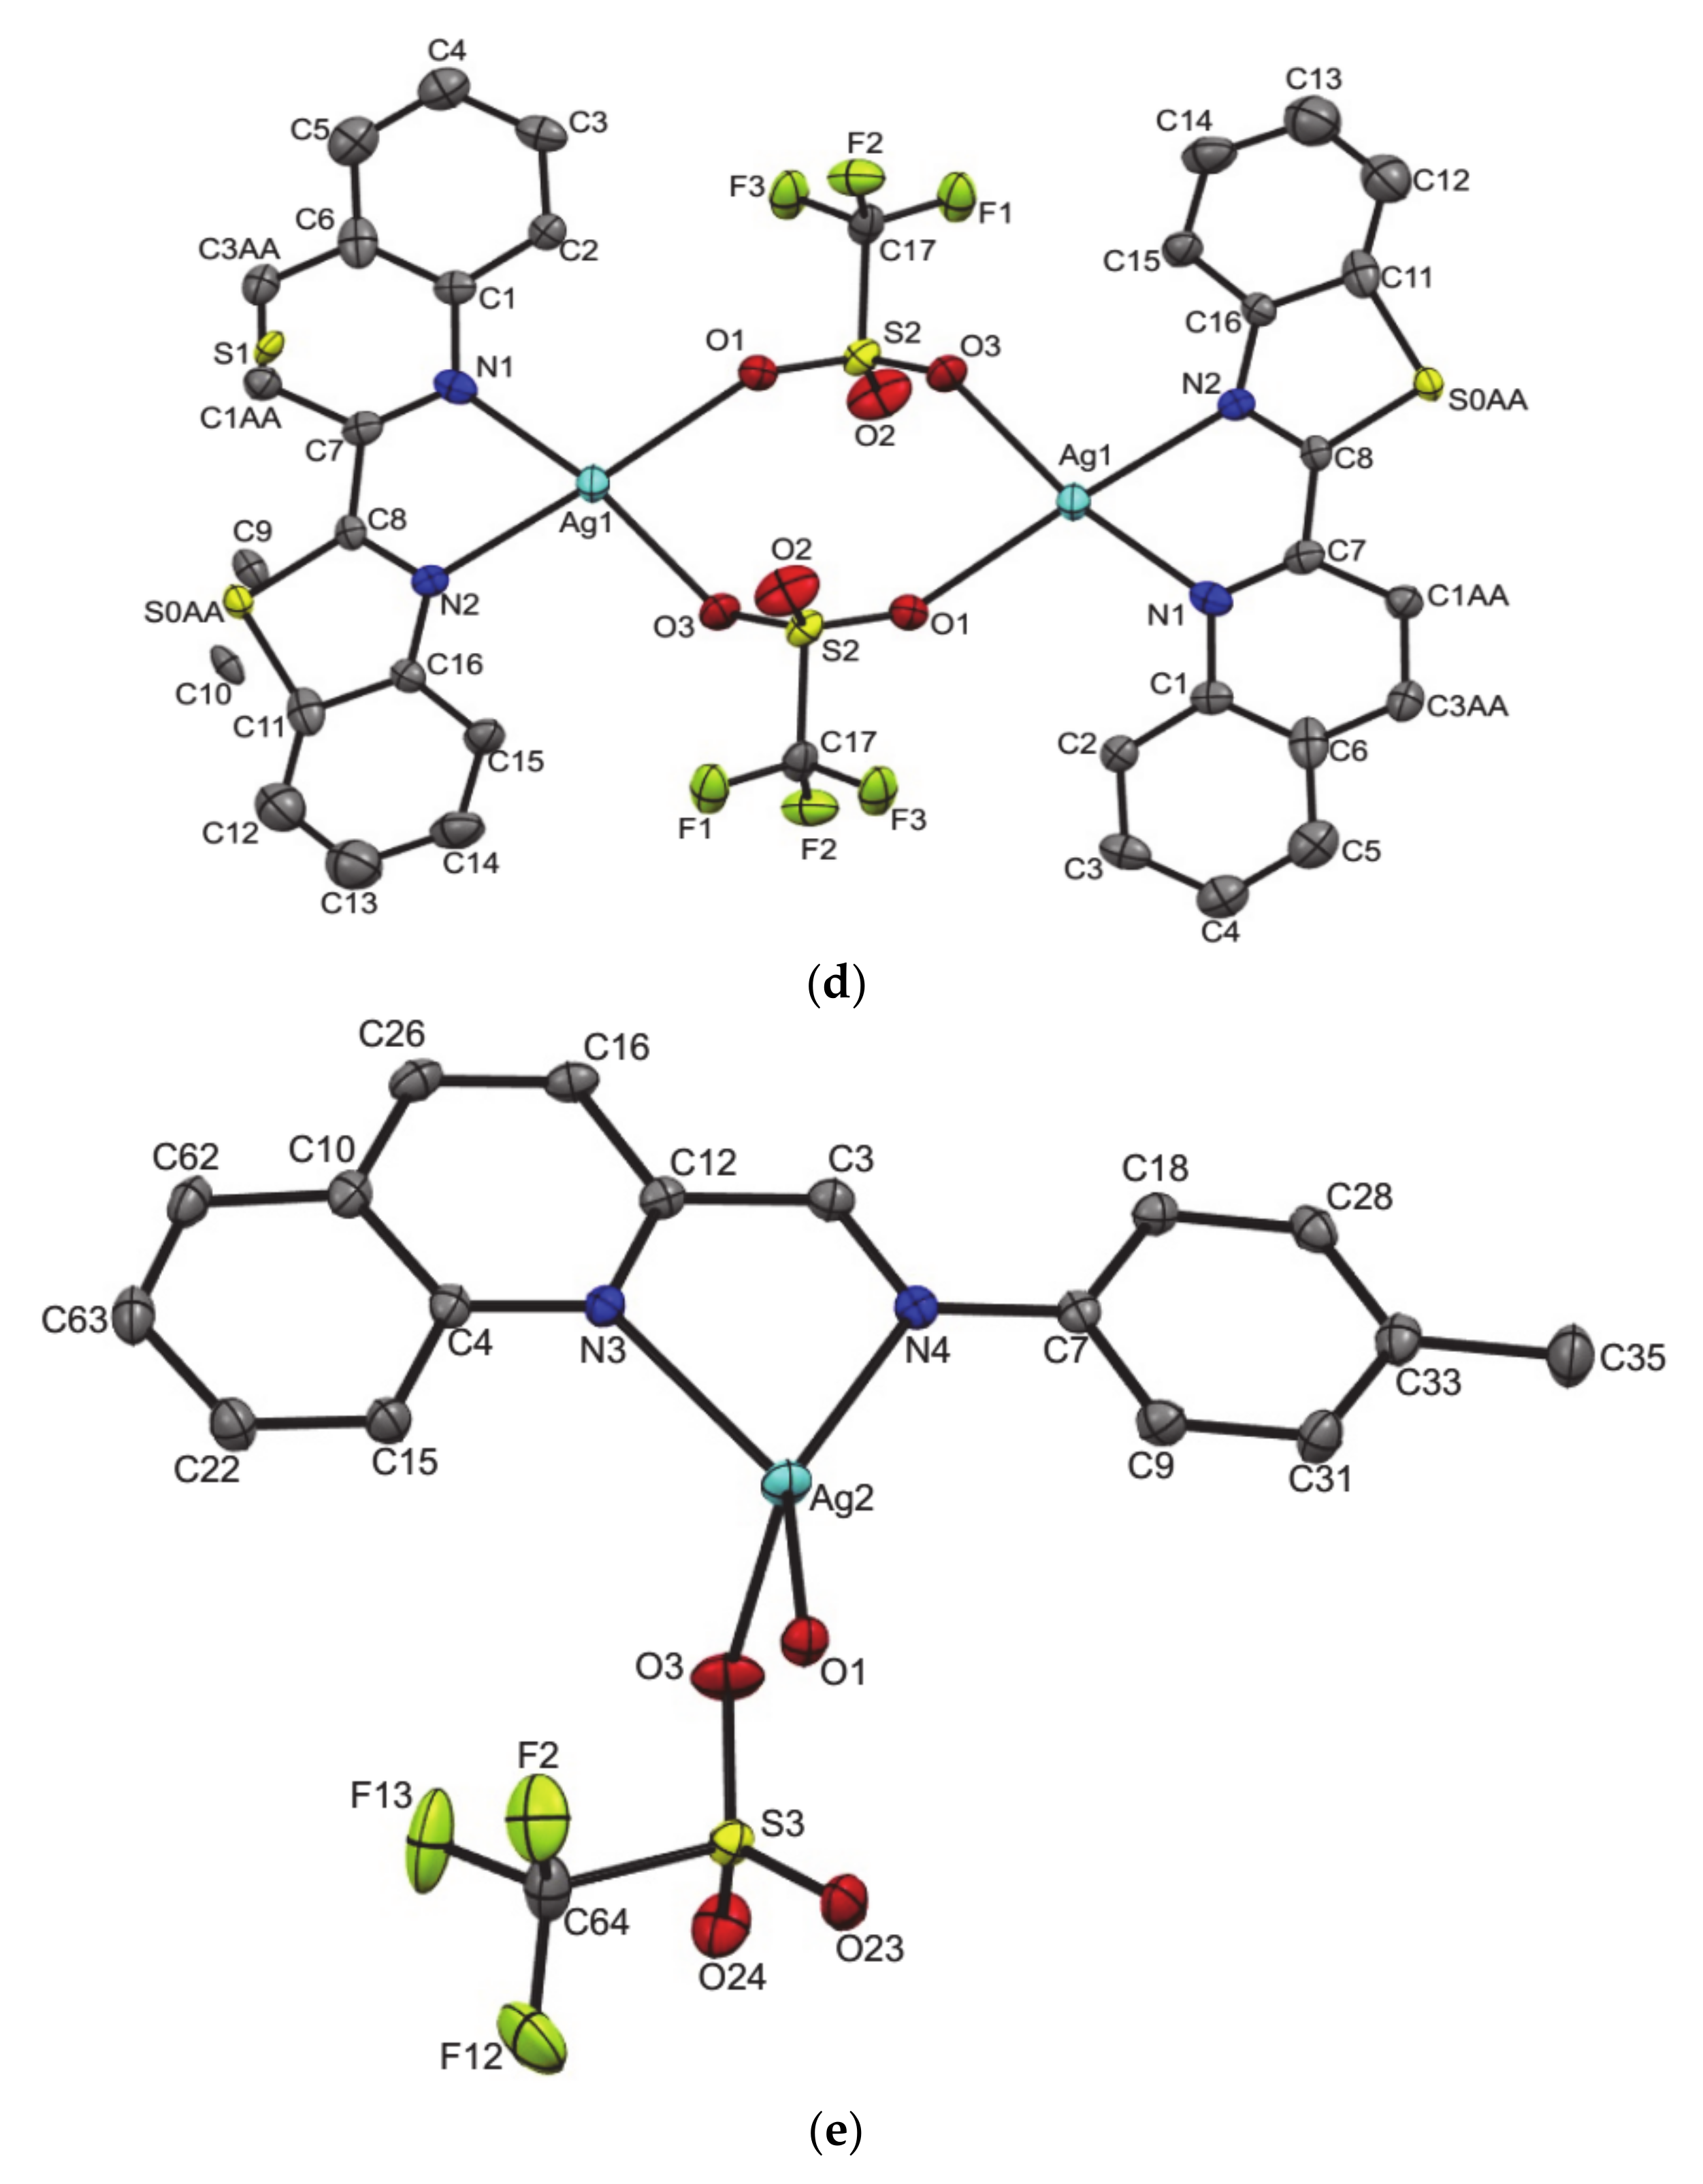
2.3. Crystal Structures of Complexes Q1, Q6, Q7, Q12, and Q14

The crystals of Q1, Q6, Q7, Q12, and Q14 were each grown by slow evaporation of toluene diffused into dichloromethane solution of the complexes. The structures of Q1 and Q6 confirmed their solution behavior while that of Q7, Q12, and Q14 are different in solution. The asymmetric units of Q1 and Q6 (Figure 2a,b) had a full molecule of the ligand coordinated to the metal center in a bidentate manner, an amine (from the hydrolytic cleavage of the second ligand molecule) and a molecule of the nitrate (Q1) or perchlorate (Q6), kicked out of the coordination sphere. The coordination to the metal center was via a N atom of the quinoline moiety, an imine N atom and a N atom of amine forming a three-coordinate geometry. The silver(I) centers in Q1 and Q6 fits in Davis et al. 2015 [48] "Extended Y" geometry description (120 ± 2° < α & β < 180 ± 2°, γ < 120 ± 2°; Σ∡′s ≥ 354°) with the sum of their angles almost 360° (Q1, Σ∡′s = 359.96°; Q6, Σ∡′s = 359.31°). The bond angles around the Ag(I) center lie between 72.96(6) and 146.71 (6)° (Table 1). The asymmetric unit of Q7 consists of a disordered ligand, one silver(I) center with a perchlorate anion with coordination via the quinoline N atom, the imine N atom in a bidentate manner, and to an O atom of the perchlorate anion making half of the complex. The other unsymmetrically related half is generated through an Ag.Ag interaction and in the process the Ag(I) centers adopt a pseudo tetrahedral geometry. The bond angles around the Ag(I) center lie between 72.8 (4) and 105.49 (2)°. This type of coordination has been observed in related silver(I) complexes [46,49]. Q12 has a molecule of the disordered ligand, an Ag(I) metal center and a molecule of the trifluoromethanesulfonate anion in the asymmetric unit. The other half is generated through a center of inversion lying in the center of an eight-member metallacycle in which two trifluoromethanesulfonate anions through two O atoms each bridge two metal centers. While the two sets of O atoms occupy two coordination sites of each Ag(I) center, the other two sites are occupied by two N atoms of the ligand in a bidentate manner. The resulting geometry is distorted pseudo tetrahedral with the bond angles around the Ag(I) center being 99.86 (10), 105.57 (10), 162.01 (10), and 175.69 (9)°. A similar mode of coordination has been reported [50]. The asymmetric unit of Q14 has a molecule of the ligand, an Ag(I) metal center, a trifluoromethanesulfonate molecule and a molecule of water. Coordination in this complex is via a N atom of the quinoline moiety, an imine N atom, an O atom of a trifluoromethanesulfonate, and an O atom of a water molecule forming a pseudo tetrahedral with the bond angles around the Ag(I) center lying between 93.18 (6) and 145.17 (6)°.
All the complexes feature two sets of planes described by a five-member metallacycle including the quinoline imine unit (Plane 1) and by substituted phenyl ring for Q1, Q6, and Q14 and by the thiazole moiety in the structures of complexes Q7 and Q12.
The Ag–Nim bond distances in Q1, Q6, Q7, and Q12 range between 2.317 (18) and 2.465 (3) Å and are generally longer than the Ag–Nqy bond distance between the range 2.240 (16) and 2.346 (3) Å but shorter in Q14 (Table 1). The Ag–O bond distances range from 2.233 (16) and 2.609 Å. The Ag–N and Ag–O bond distances in complexes Q1, Q6, Q7, Q12, and Q14 are within expected ranges and are comparable with those reported in the literature [50,51]. Complexes Q7 has Ag Ag interaction where the bond distance is 3.0563 (11) Å.

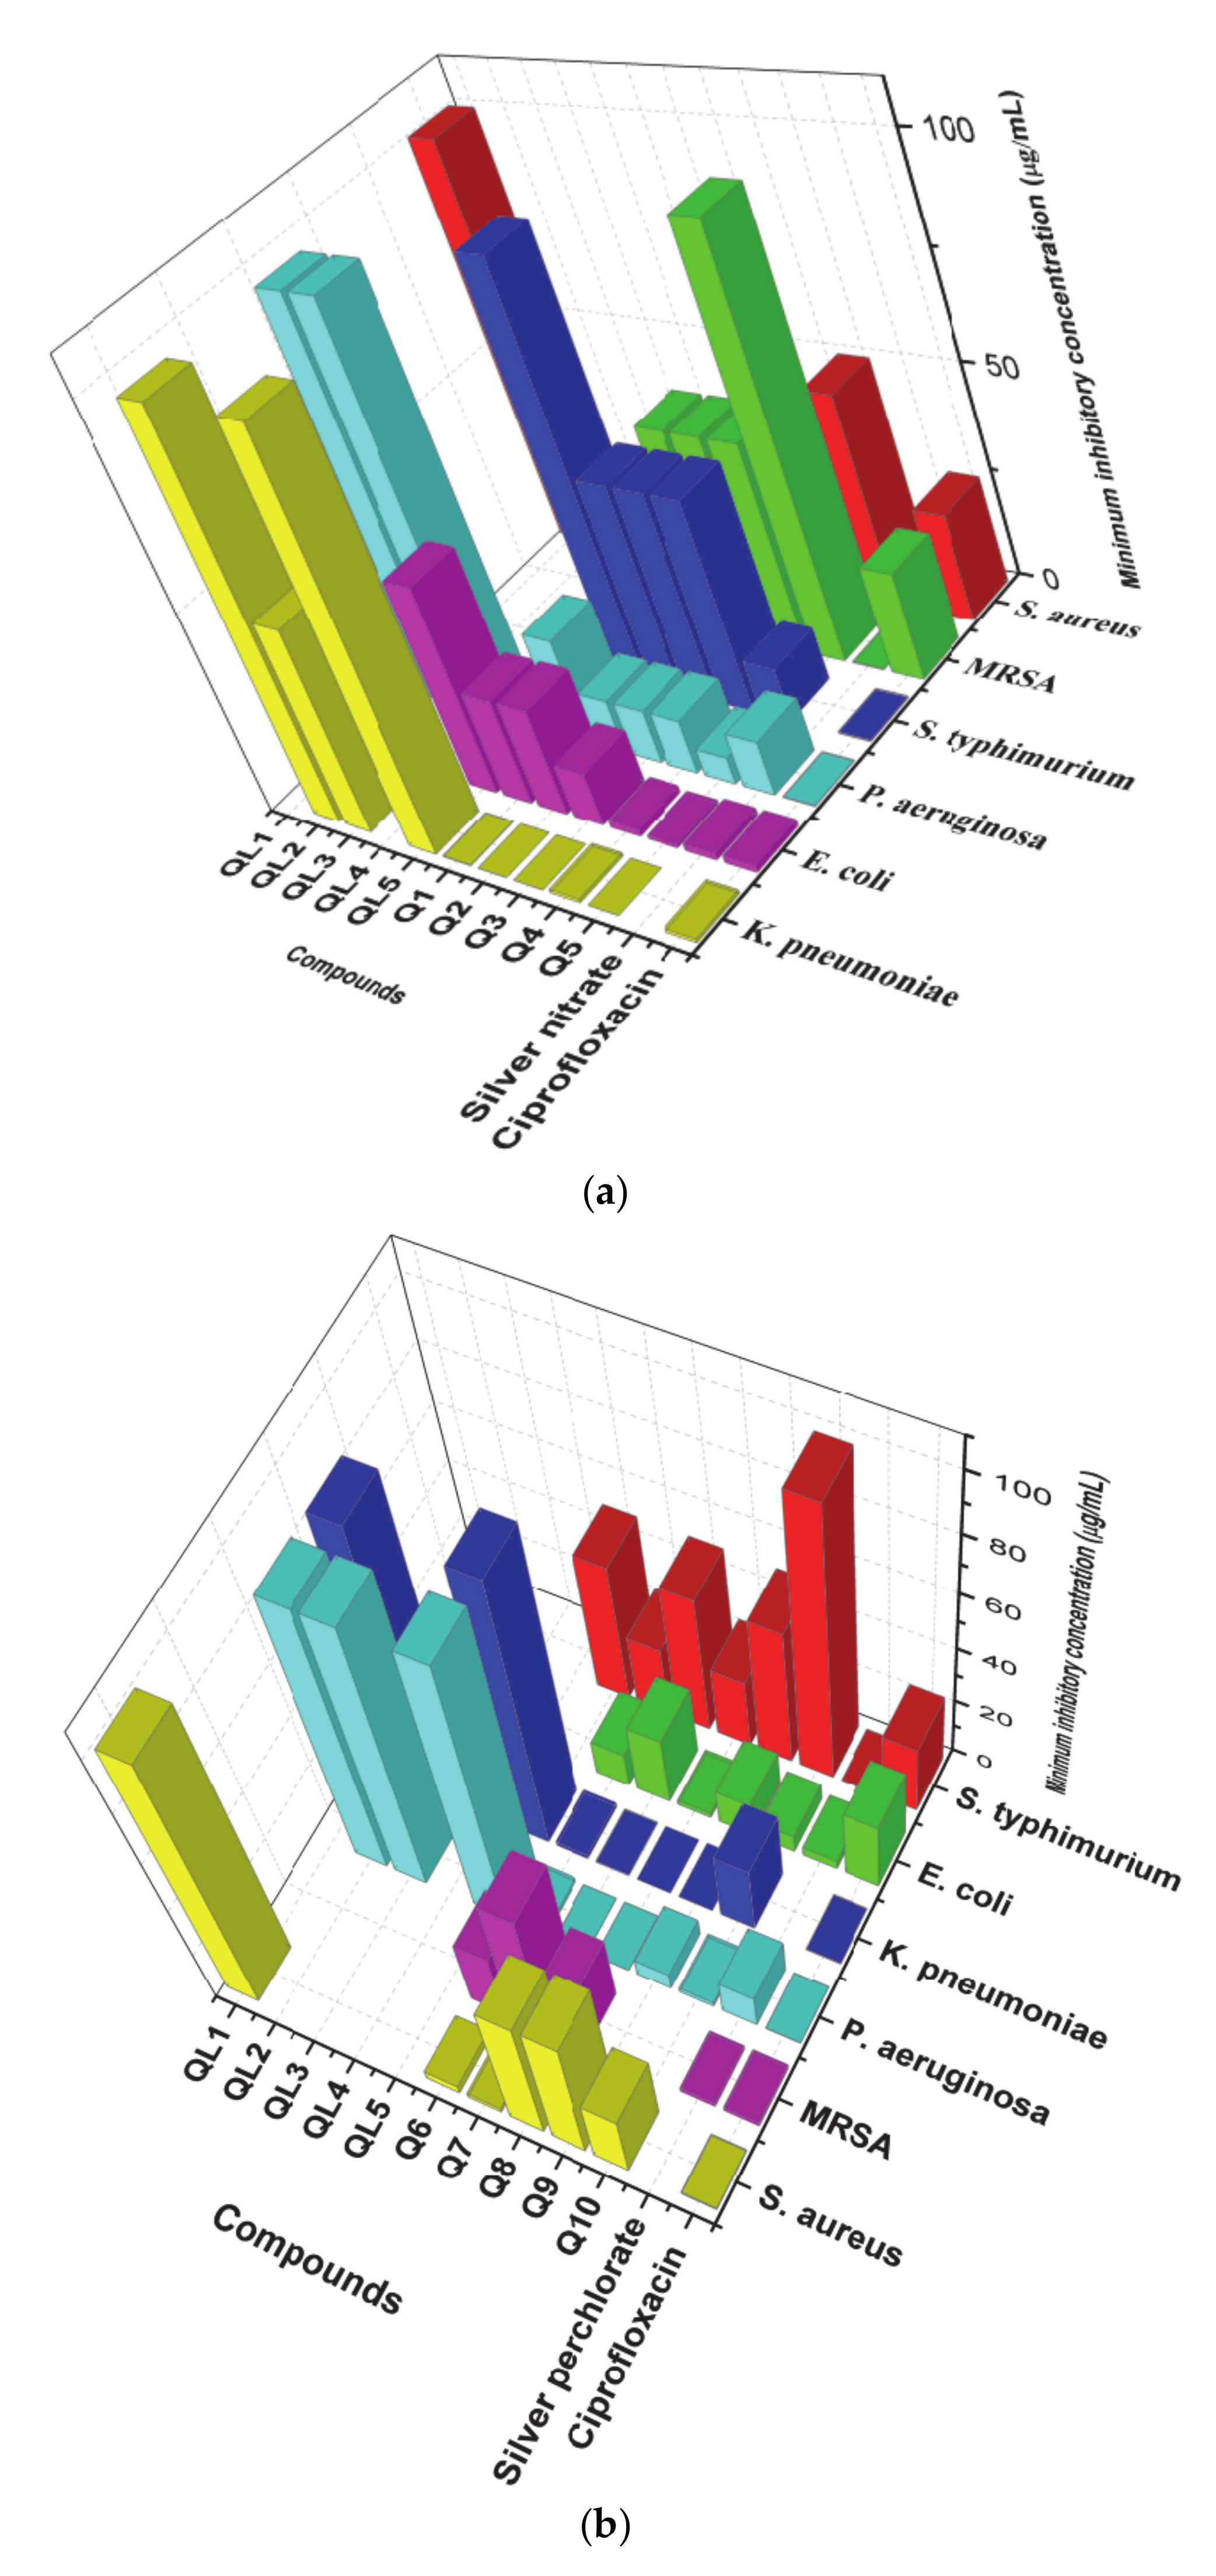
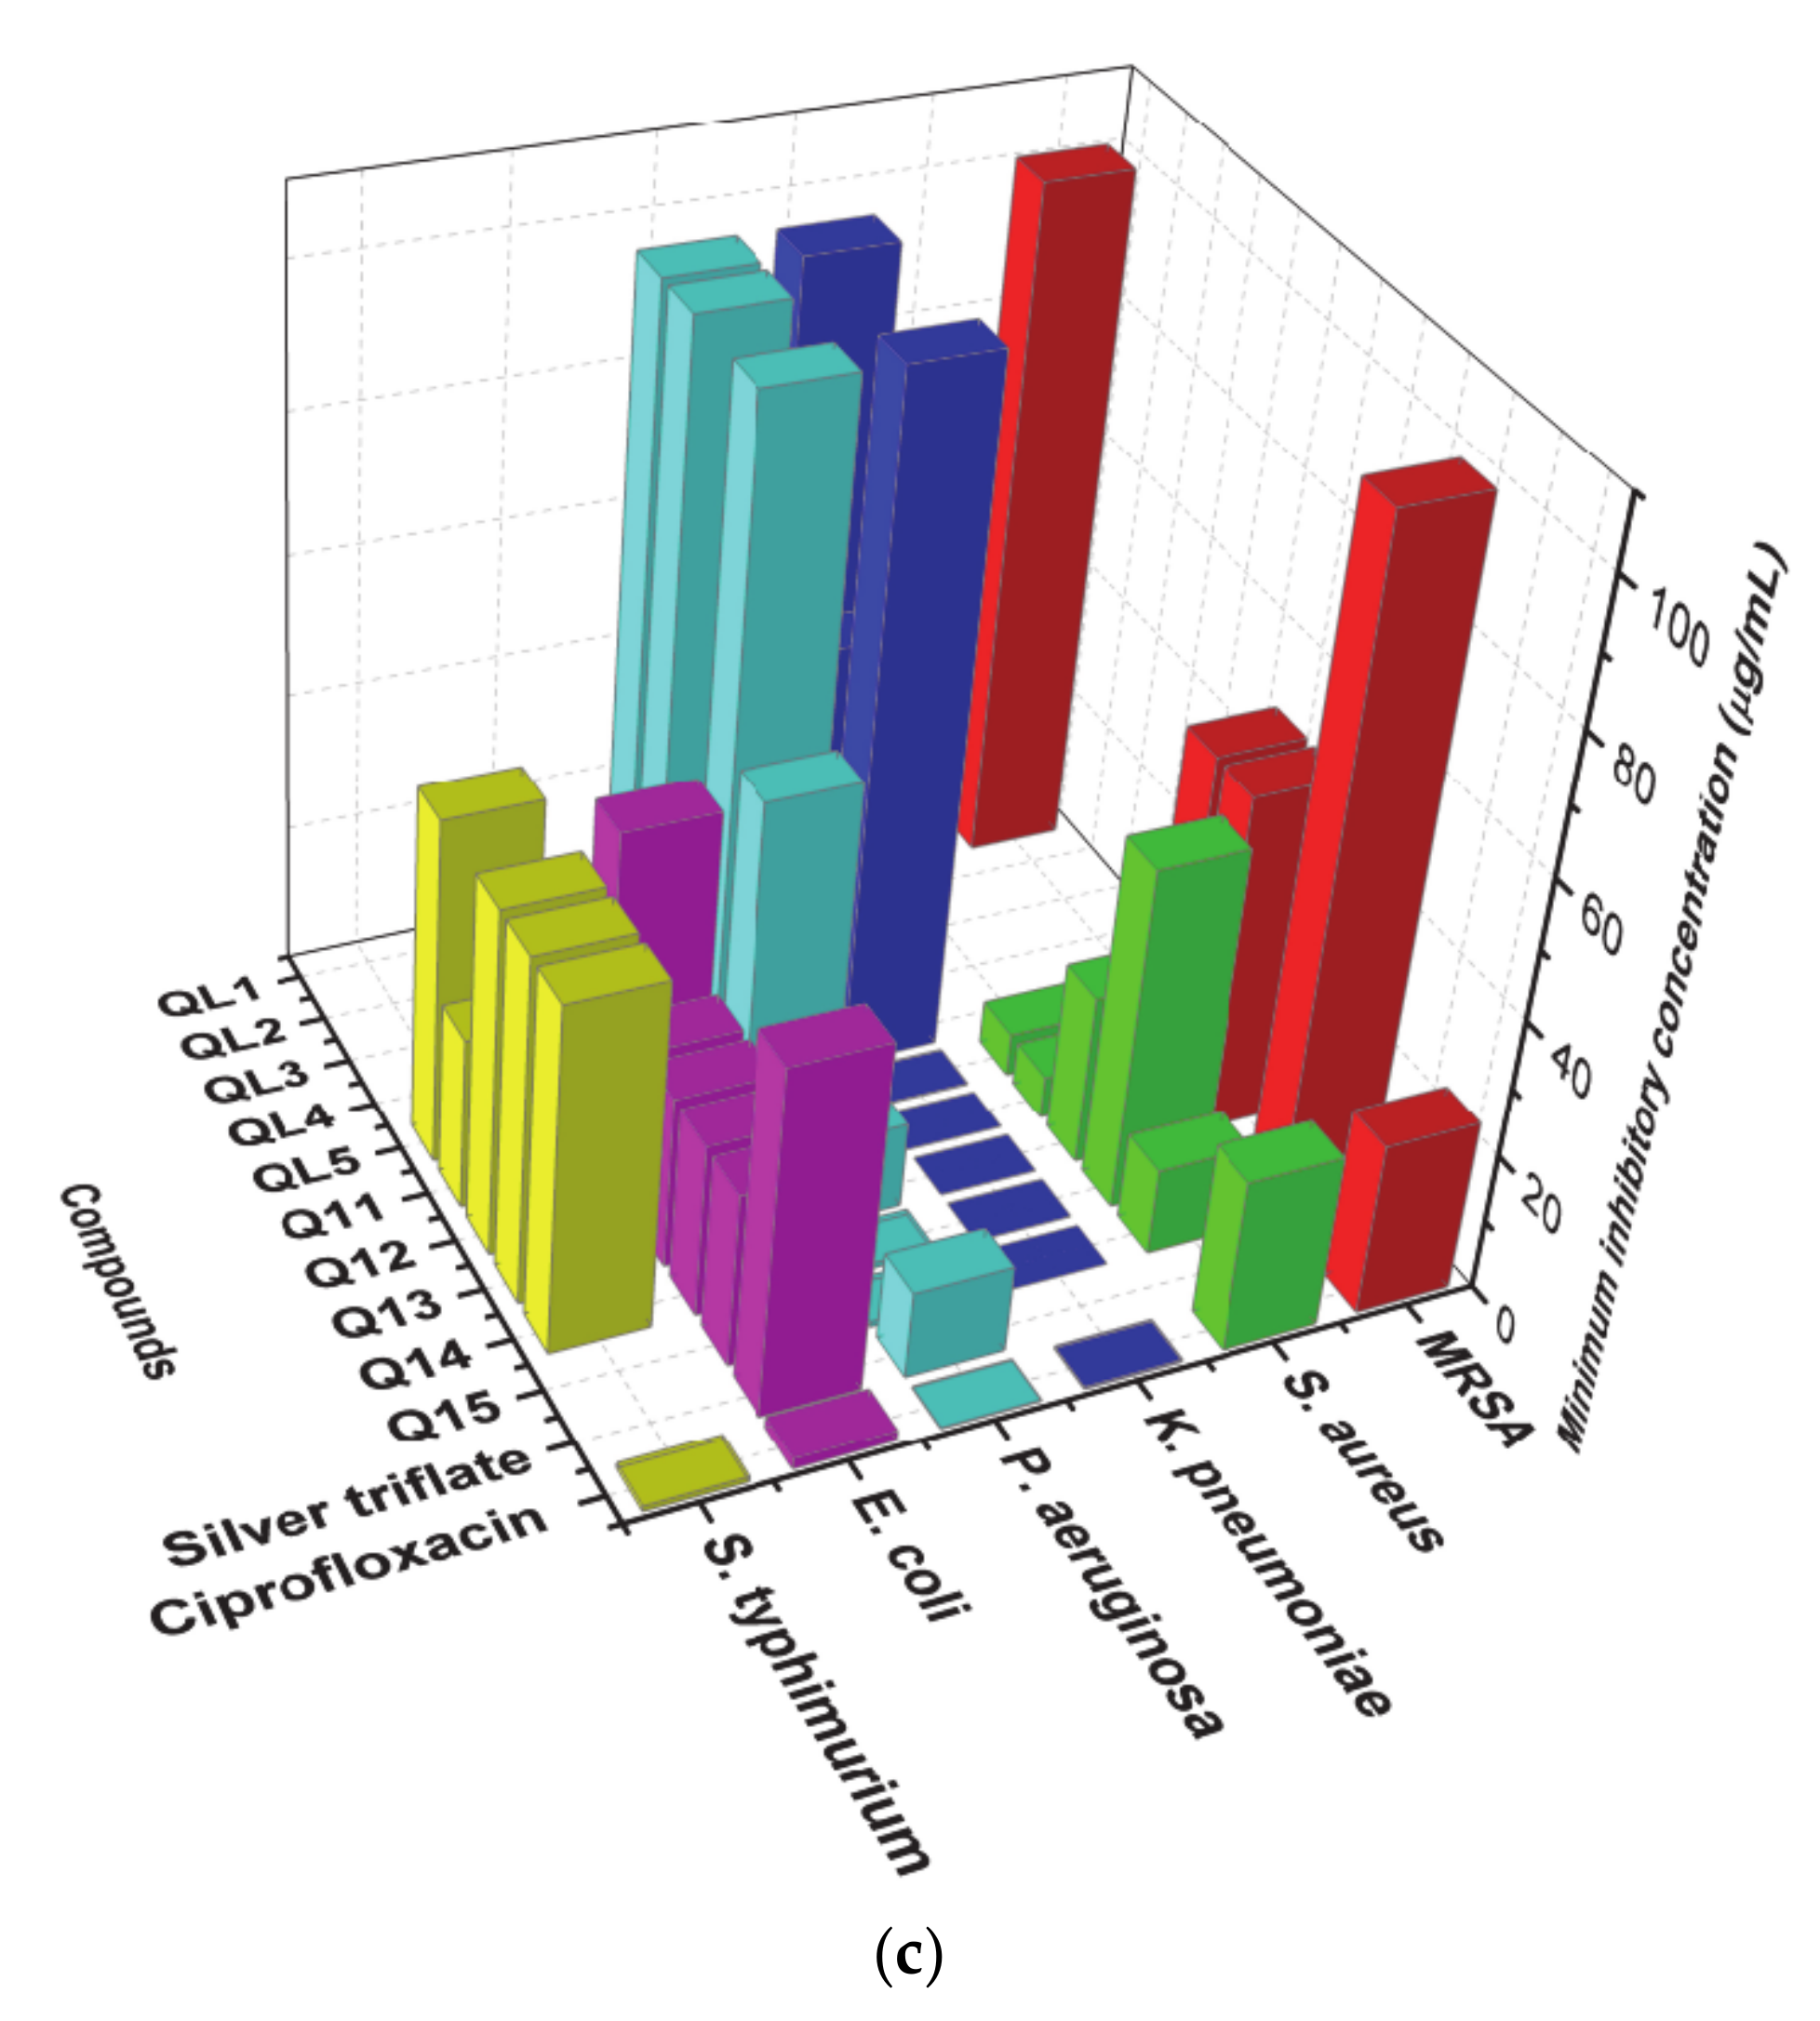
2.4. In Vitro Antimicrobial Studies

All the ligands and complexes were tested against two Gram-positive bacteria, Methicillin-resistant Staphylococcus aureus (MRSA) and Staphylococcus aureus (S. aureus), and four Gram-negative bacteria, Escherichia coli (E. coli), Salmonella typhimurium (S. typhi), Klebsiella pneumoniae (K. pneumoniae), and Pseudomonas aeruginosa (P. aeruginosa). The minimum inhibitory concentrations (MIC) values were compared to Ciprofloxacin and the three silver(I) salts as standards (Table 2). The aim was to investigate the effect of introducing the silver metal to the ligands in the bacteria strains. Q1Q15 showed better antibacterial activity compared to L1L5 in general an indication of enhanced activity of the ligands on complexation to Ag(I). The general belief is that complexation of the ligands leads to high lipophilicity which in turn can lead to the rupturing of the cell membranes of the microorganisms [52]. In addition, silver(I) ion is well known for its bactericidal effects, mechanistically acting by obstruction of bacteria cell functions through direct interaction with the bacteria enzymes, DNA and the negatively charged peptidoglycan from the bacterial cell wall. This interrupts cell division and replication and cell breathing leading to cell death through the release of their fluid and electrolyte content into the environment [53].
Only L1 showed some activity against S. aureus (100 µg/mL) while L3 also had some activity against MRSA (1000 µg/mL). Against the Gram-negative bacteria, the ligands showed selective activity. L1 is active against E. coli with an MIC value of 1000 µg/mL, L2 and L3 against P. aeruginosa and K. pneumoniae with MIC values between 50 and 100 µg/mL, L4 against S. typhi and E. coli and L5 against P. aeruginosa, S. typhi, and K. pneumoniae with MIC values of 100 µg/mL, 50 µg/mL, and 100 µg/mL, respectively. Q7 and Q8 showed the highest antimicrobial activity against all bacteria strains. The ligands of each of Q7 and Q8 possess either the benzothiazole moiety or the p-chloro substituent. Enhanced antimicrobial activity of compounds containing either benzothiazole moiety or the chlorine substituent in the para-position is in accordance with the literature report [55,56] making them targets for drug design. In addition, both Q7 and Q8 have the perchlorate anion. Enhance antimicrobial activity was also observed in other complexes with perchlorate anion against most of the bacteria strains.
All the complexes with the exception of Q4, Q6, and Q10, were selectively active against K. pneumoniae (in comparison to the other strains) with MIC values between 0.0125 and 0.4 µg/mL, lower than that of Ciprofloxacin (0.8 µg/mL). The activity of Q7 against S. aureus with an MIC value of 1.6 µg/mL can be singled out as it was better than that of the standard ciprofloxacin, AgNO3, AgClO4, or AgCF3SO3. Similarly, Q4, Q6, Q11, Q12, and Q15 with an MIC value below 25 µg/mL signified their better activity than ciprofloxacin against S. aureus. Those of Q1, Q2, Q10, and Q13 have the same MIC value as the standard reference against S. aureus. All the complexes are fairly active against MRSA with only Q6 and Q8 with MIC value 25 µg/mL showing the same activities as ciprofloxacin. Q6 and Q8 have fluorine and chlorine respectively, as their substituent and perchlorate as their counter anion. This revealed the influence of electron-withdrawing functional groups on antimicrobial activity. This type of compound with an electron-withdrawing group has been reported to have excellent antimicrobial activity [57]. Against P. aeruginosa, Q8 having chlorine as its substituent, showed excellent activity higher than the reference standards while Q7 has the same MIC value of 0.2 µg/mL as ciprofloxacin. Q14 and Q15 have similar MIC value as AgClO4 (0.8 µg/mL), Q5, Q6, Q9, Q10, have MIC values within 1.6–6.25 µg/mL lower than AgNO3 and AgCF3SO3 while Q2, Q3, Q4, Q12, and Q13 (6.25 µg/mL) have similar MIC value as AgNO3. Q6, Q10, Q14, and Q15 having either thiophene moiety, fluorine, methyl substituent in their ligand performed better than the standard against P. aeruginosa, these complexes also have either perchlorate or triflate as their anion.
The MIC of all the complexes except Q15 and AgNO3 (1000 µg/mL) against S. typhi is within 12.5–100 µg/mL, these values are higher than the ciprofloxacin standard (0.4 µg/mL), only AgClO4 (0.2 µg/mL) had better activity than the standard. Q5 having thiophene moiety and nitrate ion as counter anion has the same MIC value as AgCF3SO3 (12.5 µg/mL). This shows complexes Q1Q15 fair activity against S. typhi. The activities of Q5 (with thiophene) and Q8 (with chlorine) against E. coli are the same as the standard (1.6 µg/mL). Complexes Q6 and Q9 (12.5 µg/mL) were half of their salt (25 µg/mL), while Q10 (6.25 µg/mL) was four times lower than the salt against E. coli. The enhanced activity of Q8 with chlorine substituent and Q5 (with thiophene) are 64 and 32 times higher than the standard respectively against K. pneumoniae. All the complexes showed excellent antibacterial activities against K. pneumoniae. Q4 has the same MIC value as the standard (0.8 µg/mL).
In summary, the antimicrobial activities of the complexes exhibited a structural activity relationship because those with the chlorine substituents, benzothiazole, and thiophene moieties and with perchlorate anion displayed a remarkable antimicrobial activity. Enhanced antimicrobial activities of compounds containing similar electron-withdrawing groups [58,59], benzothiazole [60], and thiophene [61] moieties have been reported. Reports on the effects of different counter anions are also known [62].
A comparison bar chart representing each salt complex is shown in Figure 3a–c. Compounds with 1000 µg/mL MIC value and those without antimicrobial activity are omitted from the bar plot for clarity.

2.5. In Vitro Antioxidant Studies

Antioxidants are important in protecting the human body against damage by reactive oxygen species (ROS). Accumulation of ROS in the cells may lead to damage of the DNA, RNA, and proteins which subsequently leads to several physiological disorders such as cardiovascular disease, diabetes, rheumatism, atherosclerosis, cancer, aging and cell death [63,64]. The antioxidant activity of some compounds such as dithiocarbamate complexes [65] and pyridine derivatives complexes [66,67,68] have been reported to possess the ability to slow down and stop damage to DNA, RNA, protein substrates and thereby prevent the occurrence of diseases. The free radical scavenging ability of all ligands and complexes in this study were investigated using ferric reducing antioxidant power (FRAP). In antioxidant studies, FRAP assay is often preferred because it is simple, fast, economical, and direct in antioxidant measurement. FRAP assay is based on the electron-donating ability of an antioxidant compound. This involves the reduction of a colorless Fe3+ tripyridyltriazine complex (Fe3+ (TPTZ)) to an intense blue-colored Fe2+ tripyridyltriazine complex (Fe2+ (TPTZ)) by the electron-donating antioxidants at low pH [69]. The reducing power is to determine the reductive ability of the test compounds. Table 3 summarizes the mean values from three independent experiments of in vitro antioxidant activities of the ligands L1L5 and complexes Q1Q15 at different concentrations. The antioxidant activities of the compounds are expressed as 50% inhibitory concentration (IC50 in mg/mL). Ascorbic acid with an IC50 value of 2.68 mg/mL was used as a standard for the study.
All the compounds tested showed some antioxidant activity. Of the ligands, L2 had the highest activity with an IC50 value of 2.29 mg/mL even better than that of the standard reference. The complexes and the metal salts had better activities than the ligands on the general. The antioxidant activity of the silver salts was evaluated to study the influence of the metal salts on the ligand′s antioxidant activity. Interestingly, the silver salts exhibit significant antioxidant activity comparable to the standard, but the introduction of an organic ligand to a metal ion is known to help with the regulation of metal ion absorption, distribution and metabolism in the biological systems [70,71]. Hence, we focus on the antioxidant activity of complexes Q1Q15 as an alternative synthetic antioxidant in this study.
Q2, Q4, Q5, Q6, Q7, Q9, Q10, and Q13 had IC50 values between 0.95 and 2.22 mg/mL (Table 3) better than that of ascorbic acid (2.68 mg/mL) but not those of the free metal salts. The implication is that the complexes had a good ability to reduce Fe3+ to Fe2+ (in FRAP) was good. The common occurrence in these complexes is either a fluorine substituent, thiophene or a benzothiazole moiety. There have been reports of compounds with fluorine substituent (C0.5 FRAP = 424.5–502.6 μM) with potent antioxidant activities in FRAP [72]. Similarly, other reports have shown significant antioxidant activities of benzothiazole (553.5 mmol Fe2+/mmol Compound) [73] and thiophene (4.55 mmol TE/g compound) [74] derivatives. In this study, Q6 with fluorine substituent and perchlorate counter anion had the lowest ferric reducing power. It is assumed that the Ag(I) center in Q6 which is tricoordinate, could be responsible for the enhanced activity. Q10 has the thiophene moiety with a lone pair of electrons on its thiophene. However, despite a fluoro substituent in Q1 and a chloro substituent in Q3, the two complexes had the lowest activities, with IC50 values of 4.97 and 4.75 mg/mL. The counter anions in both complexes is a nitrate and that could be responsible for their low activities. The bar chart in Figure 4 represent Q1Q15 free radical scavenging activity by FRAP assay.
Summarily, most of the complexes tested had significant antioxidant activity. The antioxidant data obtained for complexes Q1Q15 clearly showed that complexes with either a fluorine substituent, thiophene or a benzothiazole moiety had good reducing power. This is an evidence of their effective antioxidant activities. Thus, these complexes are potential synthetic antioxidant supplements required to protect the body against free radical damages.

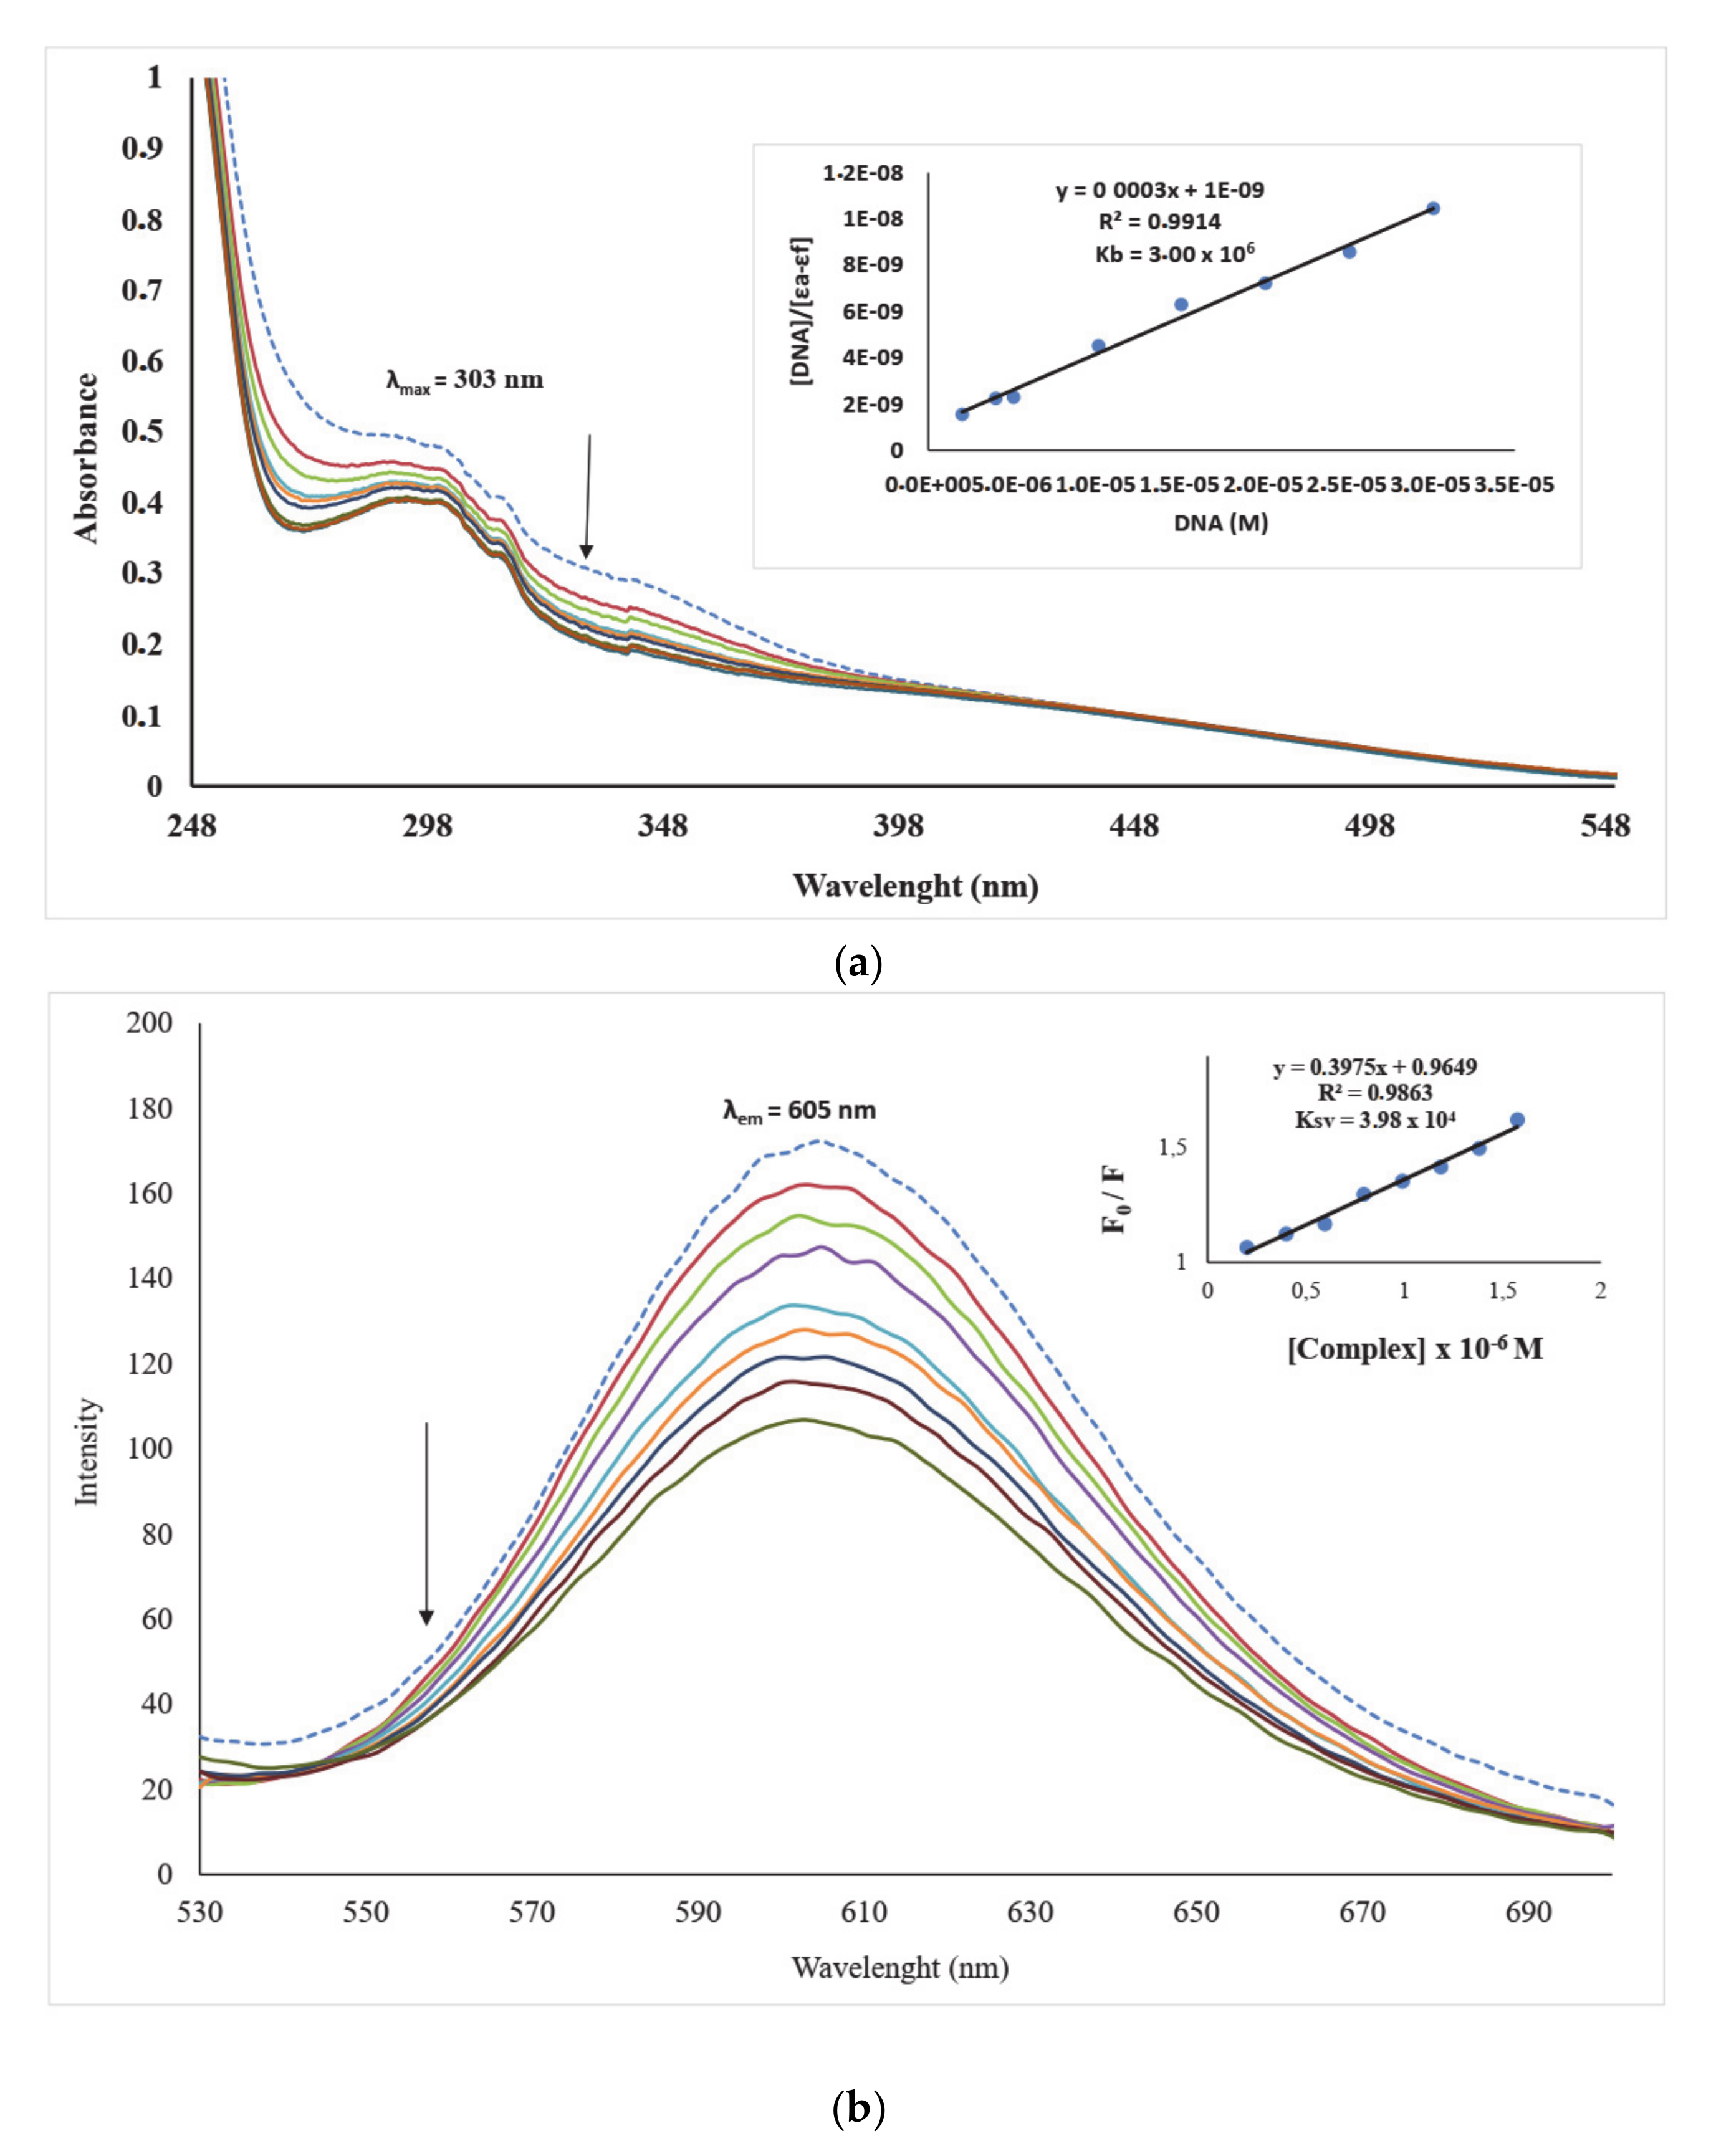
2.6. DNA Binding Studies

Deoxyribonucleic acid (DNA) is a molecule possessing genetic information in living cells. It is an important molecular target for anticancer agents because of its involvement in gene expression and protein synthesis, which are fundamental steps in cell division and growth [75]. DNA binding studies are significant when developing novel therapeutic drugs. Their interactions with potential drugs have been associated with the anticarcinogenic activity of such drugs. This makes the determination of the type of interaction between metal complexes and DNA important. In studying DNA interaction with metal complexes, electronic absorption spectroscopy is one of the most convenient techniques usually used to investigate the possible modes of binding. DNA can interact with metal complexes either through the covalent or non-covalent bond. Non-covalent interaction of the DNA with metal complexes is usually via three major modes namely: intercalations between base pairs, binding into the groove of DNA, and electrostatic binding [76], while the covalent interaction involves the replacement of the DNA N atom by the metal complex′s labile ligand [77].
In this study, we set to examine the extent to which the ligands and the complexes interact with calf thymus DNA (CT-DNA) by monitoring the hyperchromic and hypochromic effects of the electronic absorption titration. Incremental additions of DNA to the test compounds showed prominent hypochromic shifts with intraligand π–π * bands absorption bands between 249 and 372 nm in the absorption spectra of the ligands and complexes studied. The hypochromism is probably due to the formation of strong stacking interaction between the quinoline planar aromatic chromophore and the base pairs of CT-DNA [27] which is an indication of intercalation binding behavior of the compounds to CT-DNA. Intercalators are molecules that stack perpendicular to the DNA backbone without forming covalent bonds or breaking up the hydrogen bonds between DNA bases. The p-orbital of the compounds could be coupled with the p-orbital of the base pairs, which decreases the transition energy and induces hypochromism.
In complexes Q1Q15, a hypochromic shift between 6.27 and 80.49% in the absorption bands with slight bathochromic between 1 and 3 nm was observed in all the compounds (Supplementary Materials Figures S6–S19) except for Q1, Q6, and Q11, whose absorption bands are accompanied by a slight hypsochromic shift between 2 and 4 nm as the concentration of the CT-DNA was increased. L1L5, Q1Q15 and AgNO3, AgClO4, and AgCF3SO3 in the absence and presence of CT-DNA are shown in Figures S1–S22 (see Supplementary Materials).
AgNO3, AgClO4, and AgCF3SO3 were used as the standard in this study and the titration of these metal salts against CT-DNA also showed notable hypochromic shifts of 23.64–50.86% with absorption bands between 263 and 274 nm. The silver salts: A hypochromic shift in the absorption bands with a slight bathochromic shift of ~2 nm was observed in the spectra of the metal salts (Supplementary Materials Figures S20–S22).
The intrinsic binding constant of L1L5, Q1Q15 and AgNO3, AgClO4, and AgCF3SO3 were evaluated using the Wolfe–Shimer equation (Equation (5)) by determining the ratio of the slope to the intercept from the plot of [DNA]/(εa − εf) versus [DNA]. The binding affinity of the free ligands and free metal salts are lower than those of complexes Q1Q15, an indication that the ligands binding affinities were enhanced on complexation of ligands to Ag(I). The binding constant obtained lie between 3.33 × 10⁵ and 3.0 × 10⁶ M−1 for Q1Q15, between 7.50 × 10⁴ and 1.38 × 10⁵ in L1L5, and between 2.00 × 10⁵ and 3.30 × 10⁵ for AgNO3, AgClO4, and AgCF3SO3 (Table 4). Q8 had the highest binding affinity (Figure 5a) with a calculated intrinsic binding constant (Kb) of 3.00 × 10⁶, followed by Q3 and Q7 with 1.57 × 10⁶ and 1.5 × 10⁶, respectively. The high binding affinities of the three complexes (Q3, Q7, and Q8) are probably due to the π-electron interactions of the quinolinyl with the base pairs of the DNA [78]. In addition, the presence of electron-withdrawing chlorine atoms in para-position in Q3 and Q8 and the presence of benzothiazole moiety in Q7 probably also contributes to the binding affinity to CT-DNA. High DNA interaction with similar compounds has been reported for complexes with electron withdrawing group and benzothiazole moiety [78,79,80]. This interaction favors the aromatic environment of the CT-DNA base pairs resulting in strong structural perturbations in the DNA molecule. These perturbations increase the distance between the adjacent base pairs [27]. The order of the interaction of complexes Q1Q15 and their metal salts with DNA are Q8 > Q3 > Q7 > Q11 > Q9 = Q10 > Q12 > Q13 > Q1 = Q4 = Q5 = Q15 > Q6 > Q14 > Q2 > AgClO4 > AgNO3 > AgCF3SO3. The binding mode needs to be proved by further studies, whereas ligands L1L5 were exempted since their binding affinity to CT-DNA are lower than those of the complexes.

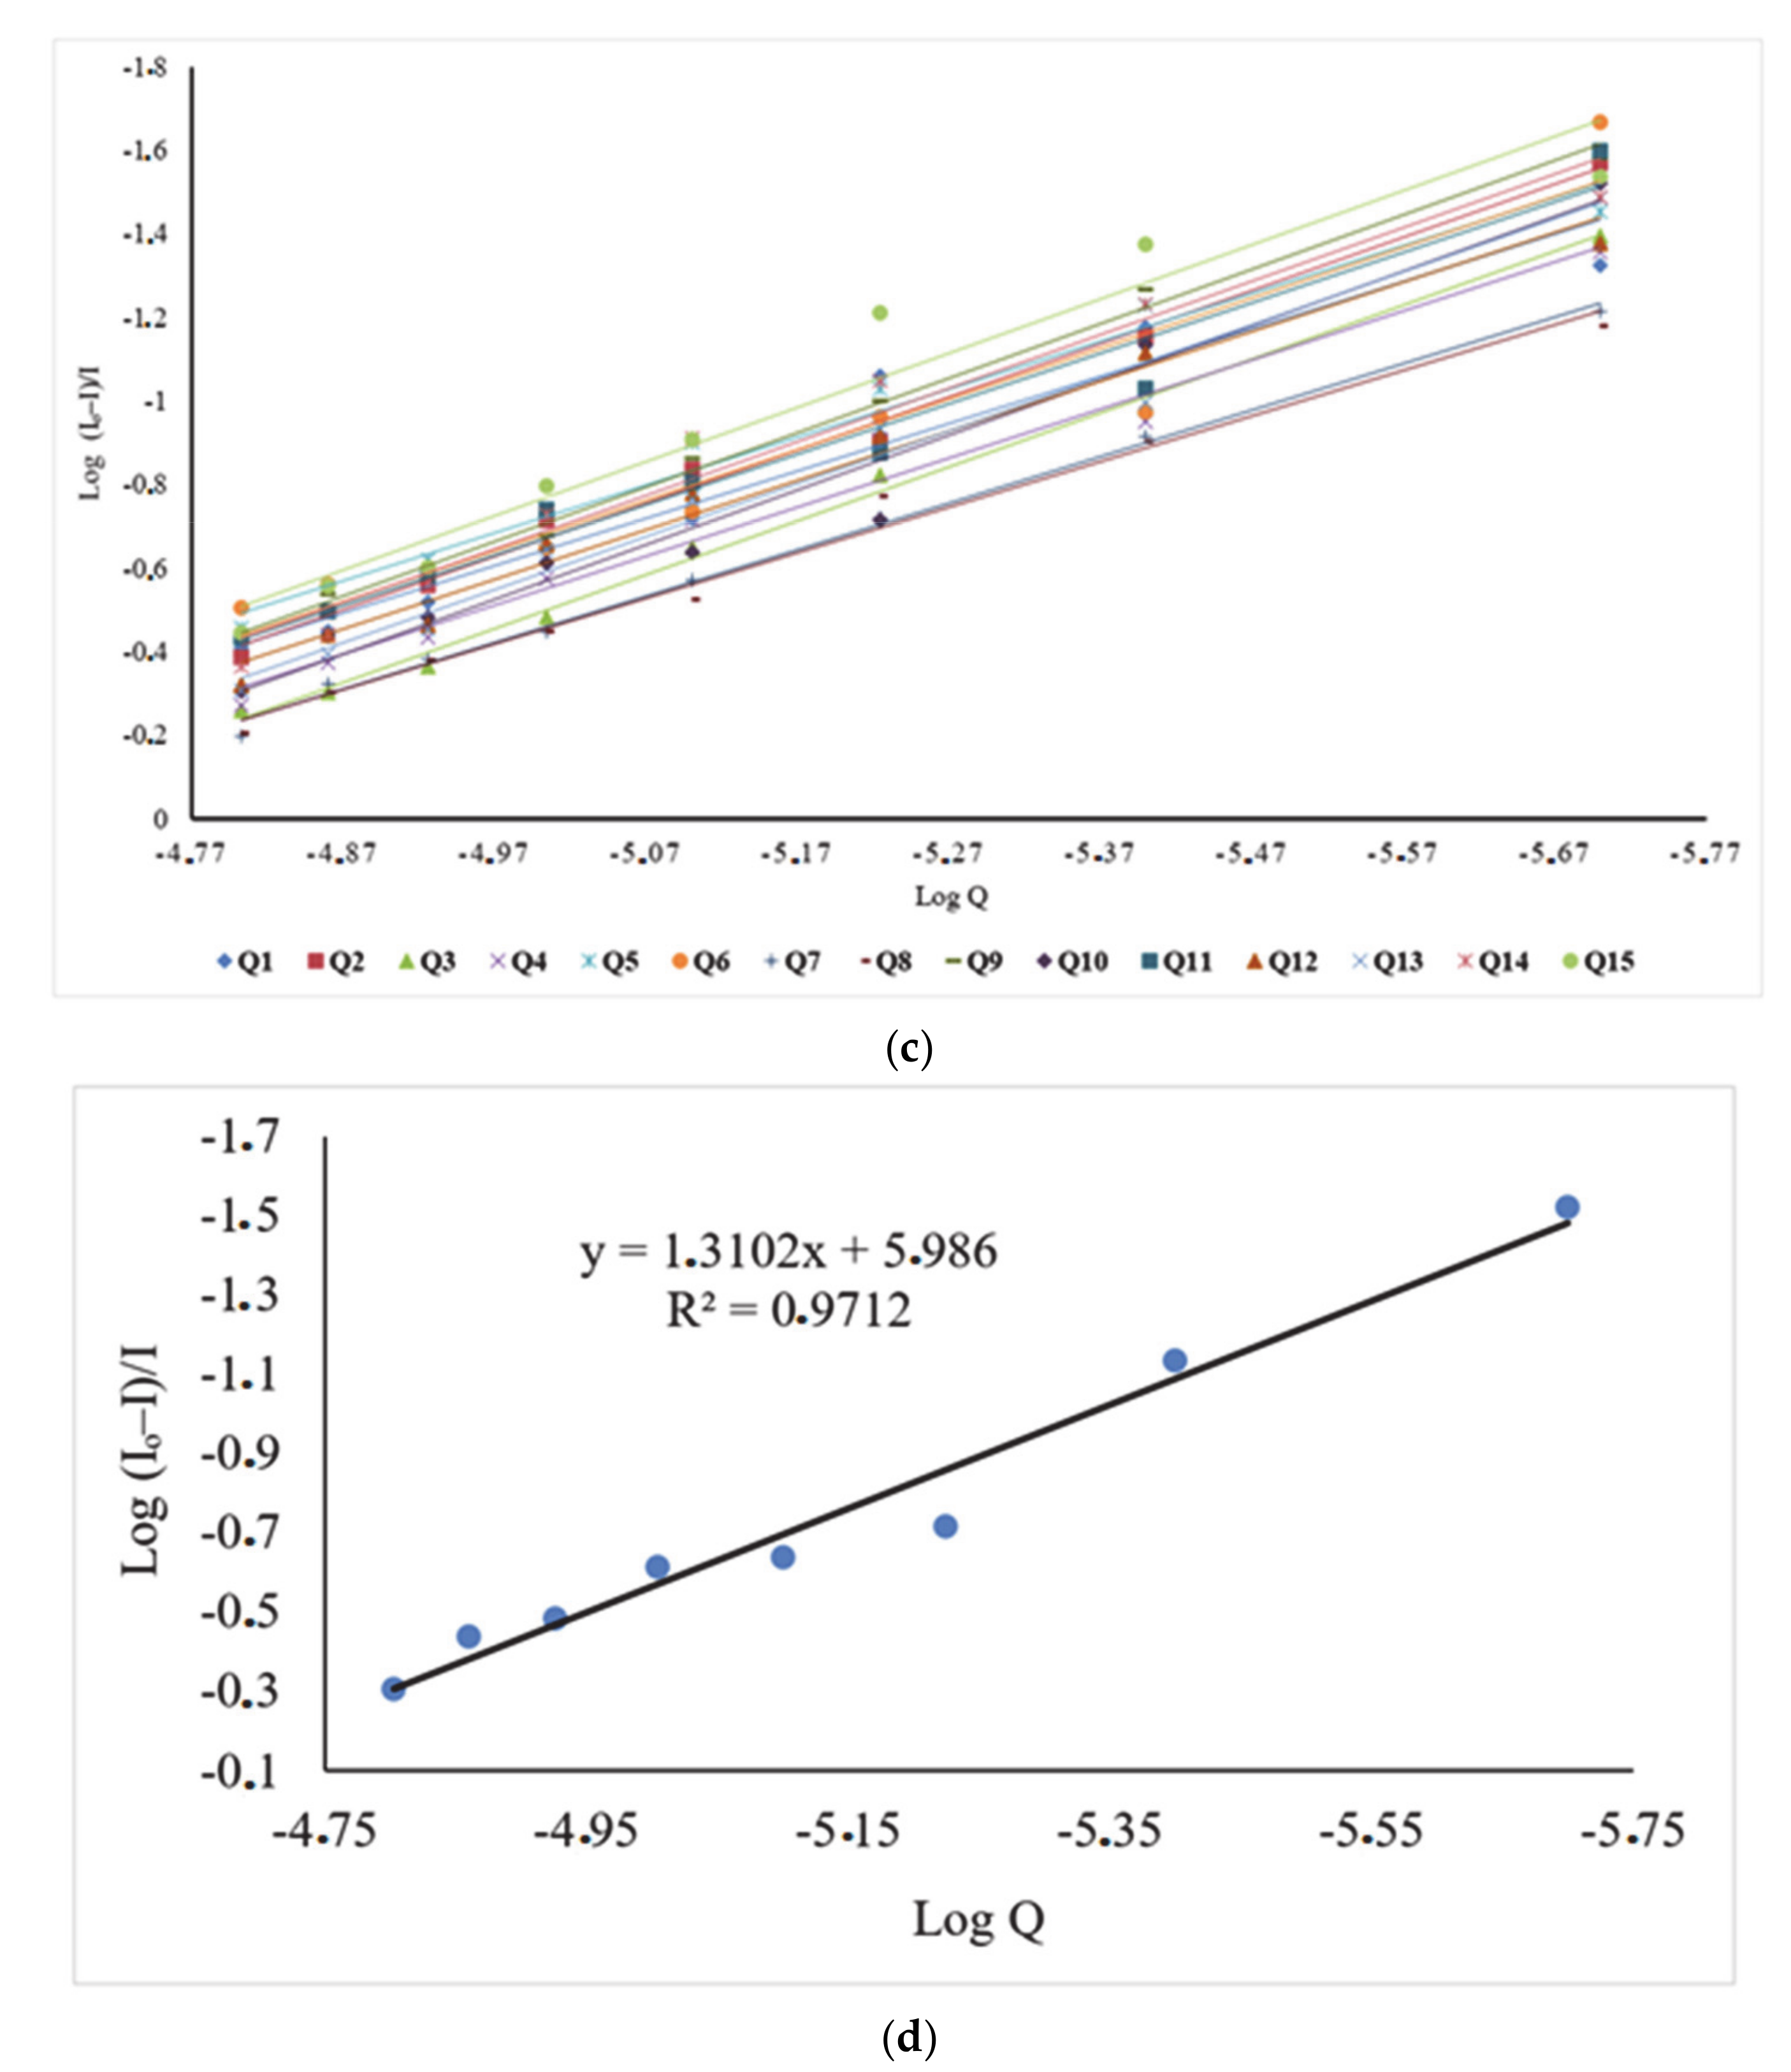
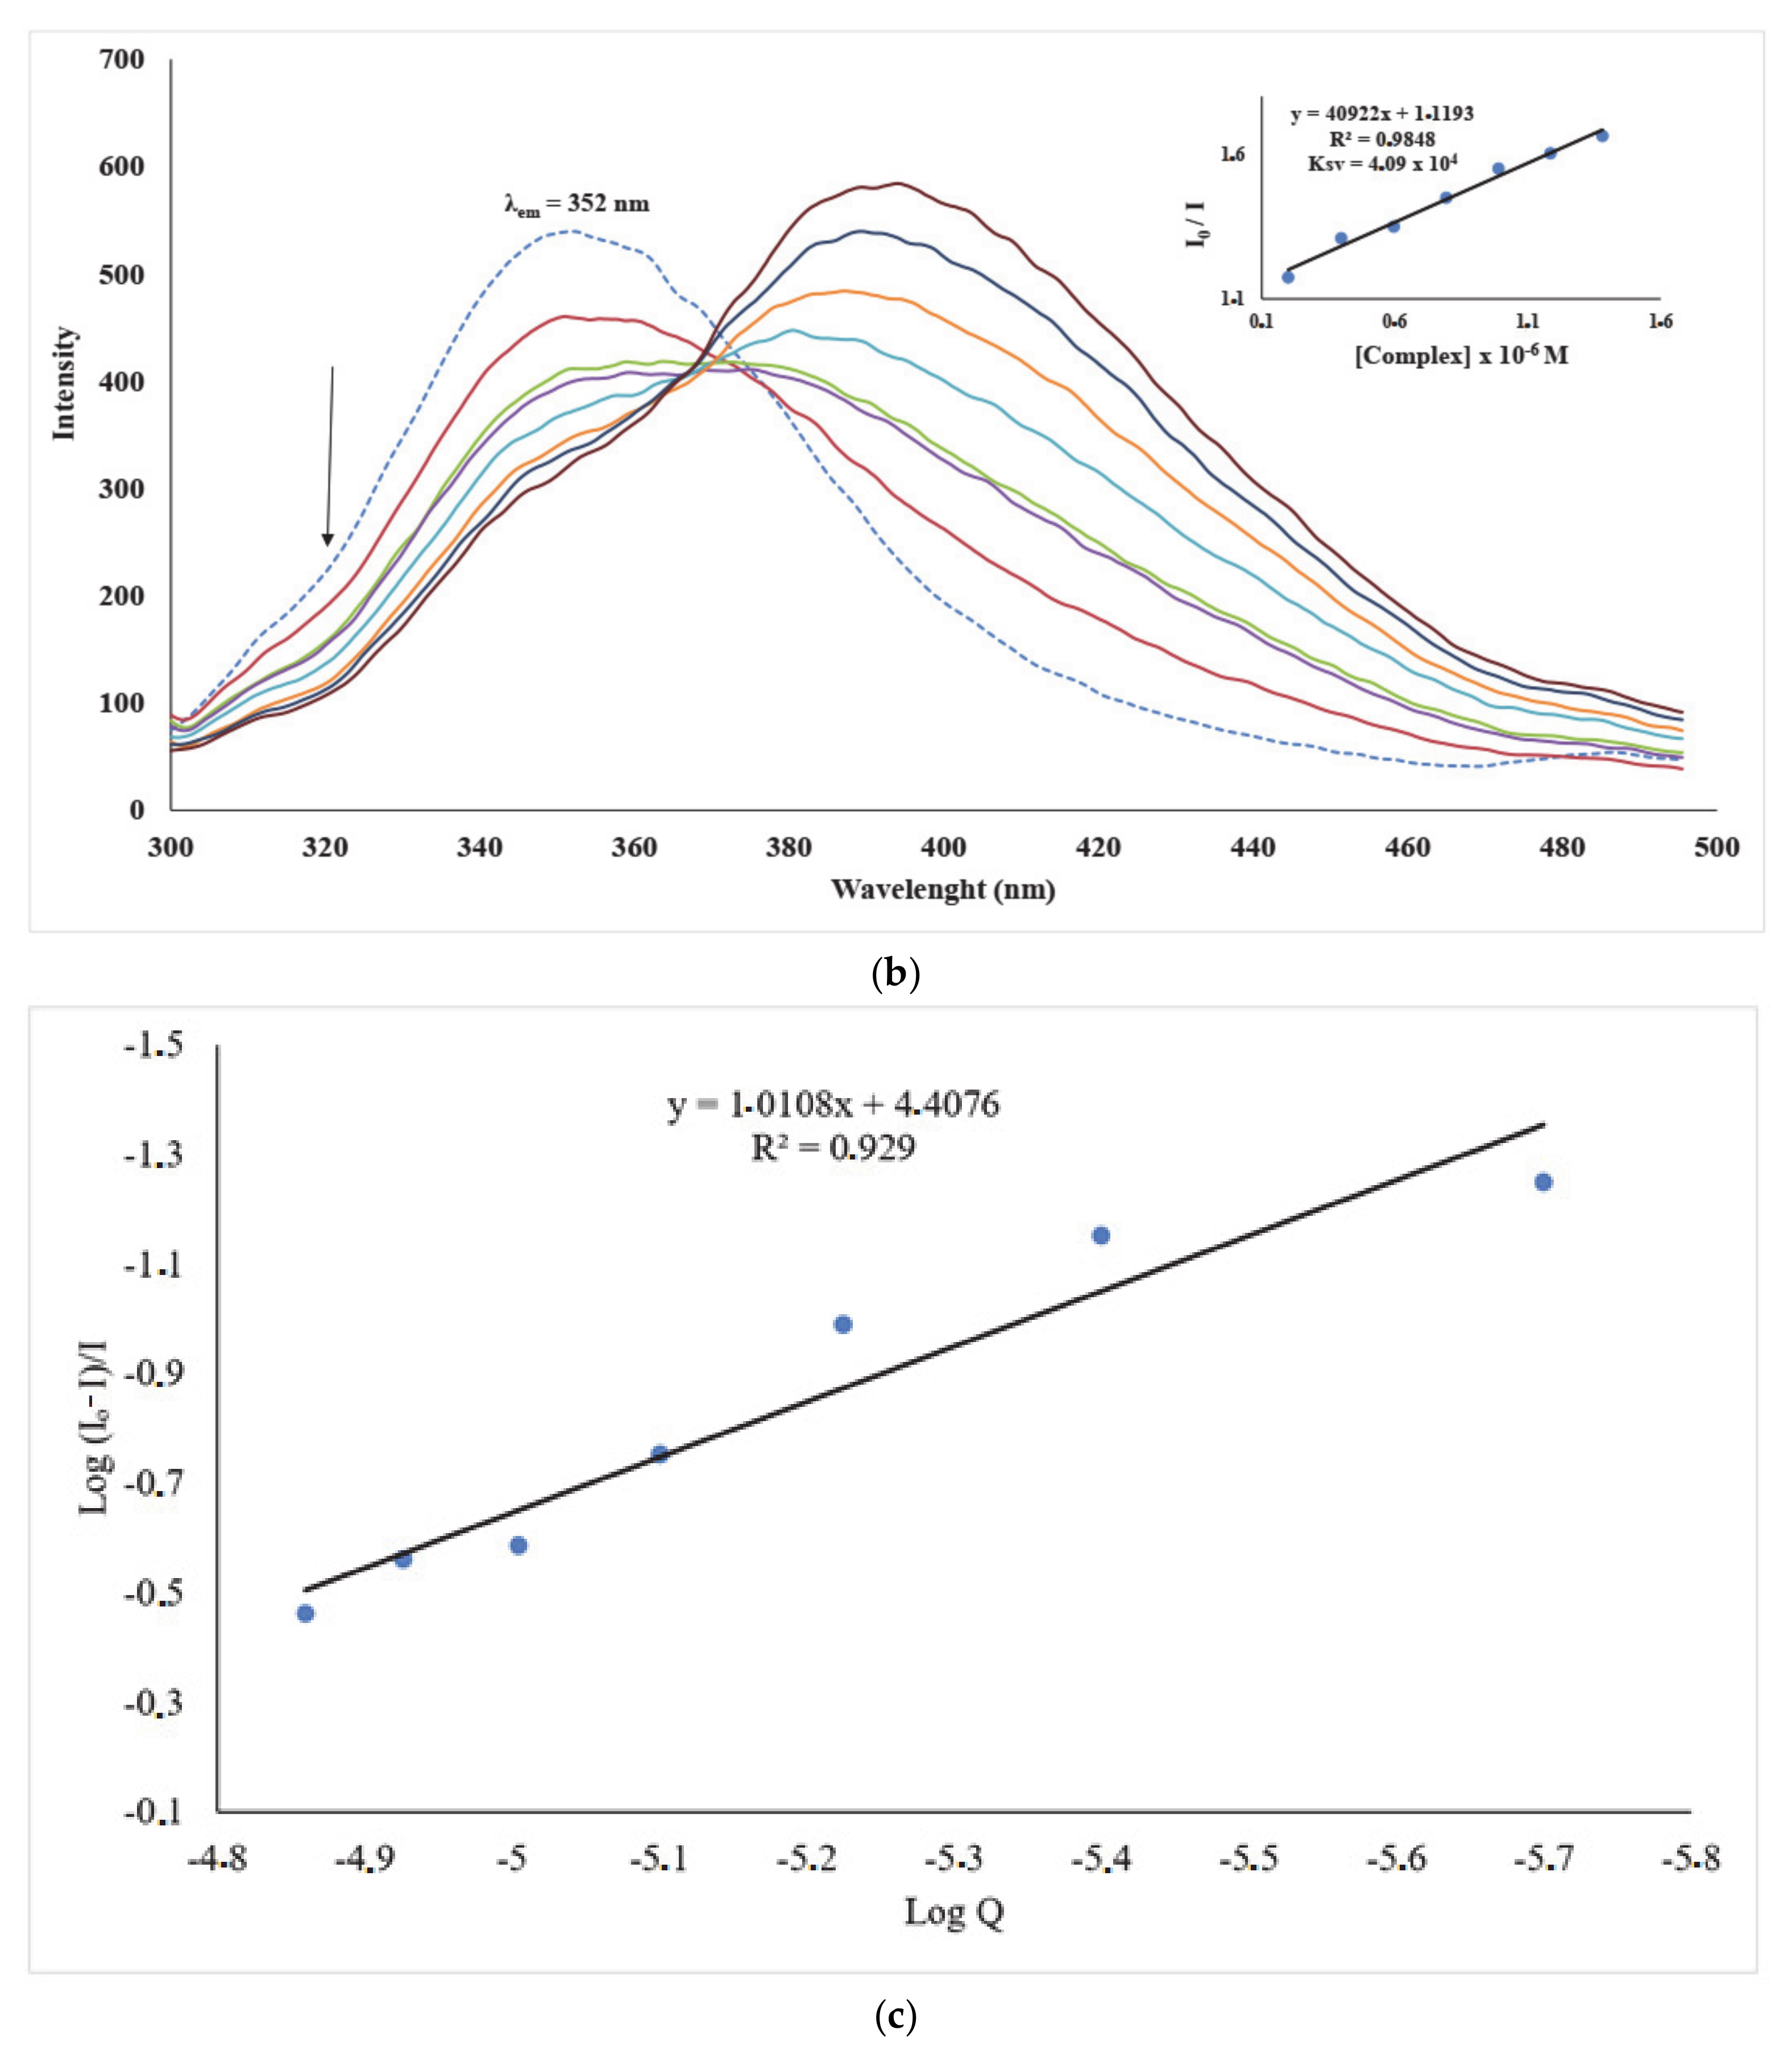
Fluorescence Competitive Displacement Studies

Further studies on binding interactions of Q1Q15 and the silver salts with CT-DNA were done using fluorescence competitive displacement assay. Although the complexes absorb UV radiation, they do not fluoresce. The fluorescence competitive displacement study is based on the displacement of ethidium bromide from the CT-DNA-EB adduct by the test compounds. Ethidium bromide, a well-known intercalating agent, is a planar cationic dye that fluoresces weakly in phosphate buffer saline solution but emits intensely in the presence of CT-DNA due to the strong intercalation between the DNA double helix base pairs [81]. The intense fluorescence of the ethidium bromide in the presence of CT-DNA can be quenched by introducing another molecule that can displace the bound ethidium bromide. A phenomenon known as fluorescence quenching [80]. The incremental addition of the complexes concentration to ethidium bromide pre-treated with CT-DNA resulted in an appreciable decrease in the ethidium bromide fluorescent intensity at 605 nm (Figure 5b and Figures S23–S39). The gradual decrease in the intensity of the EB pre-treated with CT-DNA upon addition of Q1Q15 complexes could be as a result of the complexes interacting with DNA via intercalation.
The relative binding interaction of the complexes with CT-DNA was determined by the quenching strength, Ksv calculated from the slope of the linear quenching plot of Fo/F versus [complex] (Equation (6)). The Ksv values for Q1Q15 were between 2.03 and 3.98 × 10⁴ M−1 and those of the silver salts are between 3.01 and 3.31 × 10⁴ M−1 (Table 4). These Ksv values indicated the displacement of ethidium bromide by Q1Q15 and confirmed binding via intercalation mode to CT-DNA. The complexes have high quenching efficiency and a binding affinity to CT-DNA. Complex Q8 (Figure 5b) had the highest binding affinity to CT-DNA which is consistent with the compound with the highest intrinsic Kb constant (Figure 5a). The quenching of the fluorescence intensity of EB-CT-DNA adduct by the complexes was further used to determine the binding constant (Kbin) and the number of binding sites (n).
Fluorescence quenching can take place via two mechanisms, namely, static quenching and dynamic quenching. The static quenching involves the collision of the fluorophore and the quencher (complex) in the ground state while the dynamic quenching involves the collision of the fluorophore and the quencher in the excited state. In order to determine the type of quenching taking place, two approaches are commonly used, namely: temperature-dependent approach and the Stern–Volmer plot approach.
The Stern–Volmer plot approach was used based on the fact that the Stern–Volmer plots for Q1Q15 (Figure 5c), were linear an indication of only one mechanism for the quenching fluorescence, i.e., either dynamic or static. Evaluation of Kq using Equation (1) would, therefore, suggest the quenching mechanism through which the complexes quench ethidium bromide emission.
K s v = K q τ o
where Ksv, Kq, and τo represent Stern–Volmer quenching constant, bimolecular quenching constant, and an average lifetime of the fluorophore in the absence of the quencher, respectively. τₒ normally takes about 10−8 s in biomacromolecules [82]. The values of Kq were found to be between 2.03 and 3.98 × 10¹² M−1S−1 (Table 4), which is greater than the maximum diffusion collision quenching rate constant of various quenchers of biological macromolecules (2 × 10¹⁰ M−1S−1) [82]. These values showed that the quenching by Q1Q15 was not initiated by a dynamic mechanism but happened via a static quenching mechanism; thus, at the ground state, complexes formed between quenching molecules and fluorescence molecules are stabilized [83].
The double-logarithmic Equation (2) was used in determining the binding constant of complexes Q1Q15 and CT-DNA.
log F o F F = log K b + n   log Q  
A plot of log Fₒ − F/F vs. log [Q] of complexes Q1Q15 gave a straight line with a slope of n and y-axis intercept of log Kb (Figures S40–S56) (where Fₒ and F denote the relative fluorescence intensities of CT-DNA in the absence and presence of the quencher, respectively, while [Q] is the concentration of the quencher, Kb is the binding constant and n is the number of binding sites. The values of n for complexes Q1Q15 are approximately equal to 1 (Table 4), suggesting that all the complexes bind to one reactive site on the CT-DNA. The corresponding results are shown in Table 4. Complex Q10 (Figure 5d) showed the most binding affinity to CT-DNA with a binding constant (Kbin) equal to 9.61 × 10⁵ M−1 and the number of binding sites (n) approximately equal to 1.
Based on the spectroscopic studies of the interaction of L1L5 and complexes Q1Q15 with CT-DNA, it can be summarized that the test compounds in this study had a strong binding affinity to calf thymus DNA, especially those with either electron-withdrawing substituent or benzothiazole moiety. The binding interaction of the compounds to CT-DNA was via intercalation mode mainly due to the planarity of the chelating quinolinyl ligand and the competitive study with EB shows that the complexes can displace EB from the CT-DNA-EB adduct and compete for the DNA-binding sites with EB, which is usually characteristic of an intercalative interaction of compounds with DNA.

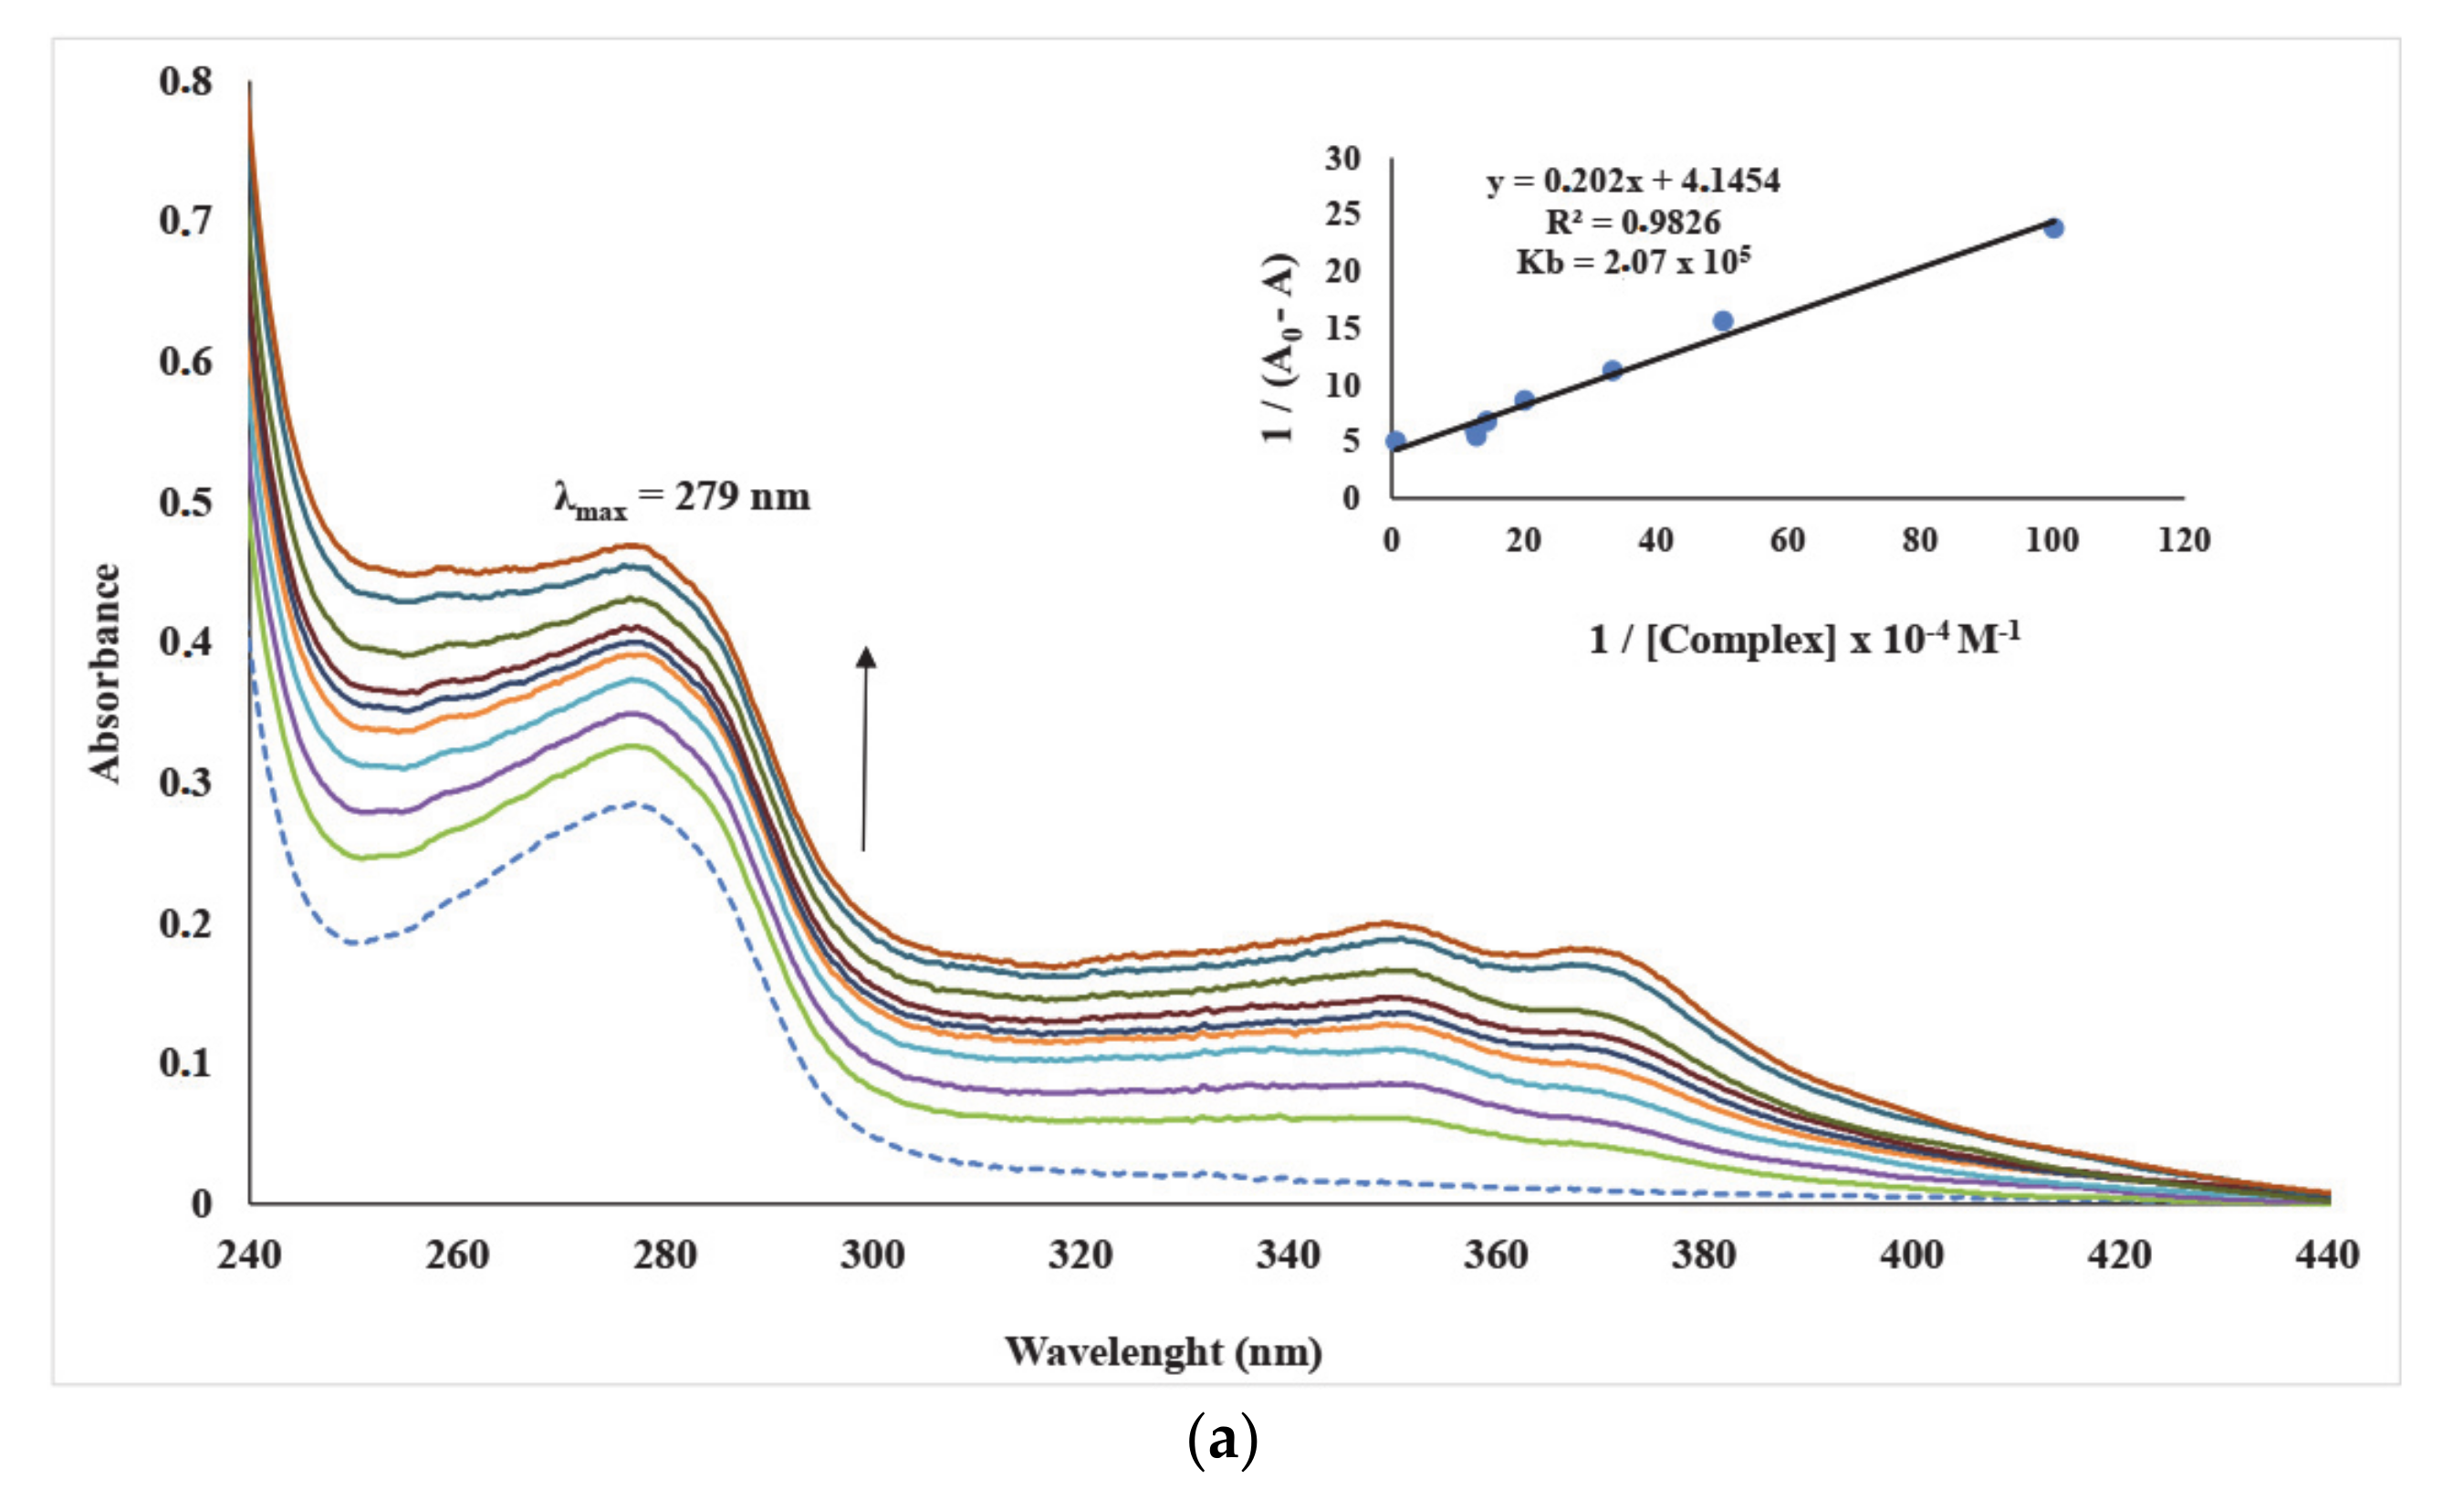
2.7. Albumin Binding Studies Using Absorption Spectroscopy Titration

Interaction of potential therapeutic drugs with carrier proteins is very important in bio-inorganic studies because the binding properties of the drug–protein reveal the absorption, transportation, distribution, and metabolism of the drugs. For this reason, the protein-binding study of Q1 to Q15 is an important way of studying the compounds metabolism in vivo.
Bovine serum albumin (BSA) was used as the protein standard in this study because of its close resemblance to human serum albumin (HSA), its stability, high solubility, neutrality in many biochemical reactions and low cost [84]. In protein binding study, absorption spectroscopy titration is a known method used in studying the conformational changes in proteins, and this protein is characterized by an intense absorbance peak at 280 nm depicting the microenvironment around tyrosine and tryptophan residue polarity [85]. On each addition of various concentrations of complexes Q1Q15 and the silver salts to a constant BSA concentration, the intensity of the BSA absorbance intensified between 260 and 300 nm with slight shifts (Figures S57–S73). This shows some binding interactions between the complexes and BSA exist. Kb in this instance was determined from the intercept to the slope ratio of the linear curve of a plot of 1/[A-A°] vs. 1/[complex]. The Kb of all the complexes were in the range of 2.16 × 10⁴–2.07 × 10⁵ M−1 (Table 4) which are in conformation with reported related BSA binding constants, normally between 104 and 106 M−1 [86]. This range is a recognized range for drug-carrier complexes. The silver salts with Kb value between 4.46 and 4.82 × 10⁴ is lower than those of the complexes except Q1 (Figure S57) and Q13 (Figure S68). This shows that the binding affinity of the ligands to BSA was enhanced on coordination. Complex Q12 had the highest binding affinity (Figure 6a), followed by Q4 (Figure S60) and Q15 (Figure S70). The influence of Q4, Q12, and Q15 ligand substituents on their binding affinity to BSA can be related to similar literature reports [87,88,89]. The order of binding constant for the complexes is: Q12 > Q15 > Q4 > Q8 > Q7 > Q11 > Q10 > Q2 > Q14 > Q5 > Q6 > Q9 > Q3 > Q1 > Q13.

Fluorescence Quenching of Bovine Serum Albumin in the Presence of Complexes Q1Q15

The fluorescence quenching of protein can provide information on protein binding mechanisms, binding mode, binding sites and the rates of interaction with drugs or complexes of study [86]. When BSA is excited at 280 nm, it fluoresces strongly between 300 and 400 nm leading to excitation in tyrosine (Tyr) and tryptophan (Trp) residues in proteins. In the presence of a small molecule, BSA has the possibility of undergoing different types of interactions such as hydrophobic, hydrogen bonding, van der Waals, and electrostatic interactions. The ability of a complex to quench BSA fluorescence intensity depends on the hydrophobic interaction between the Trp and the hydrophobic ligand of a complex. The interaction is either enhanced or stabilized by the surrounding amino acid residues [90]. The binding of BSA to compounds was studied by fluorescence measurements at room temperature.
The free BSA has strong fluorescence emission around 350–360 nm when excited at 280 nm and on adding complexes Q1Q15, the BSA fluorescence intensity of only Q1, Q6, and Q11 decreased gradually as the concentration of these three complexes was increased (Figure 6b and Figures S74–S75). The reduction in the fluorescence intensity of Q1, Q6, and Q11 is accompanied by a redshift of the emission wavelength between 2 and 15 nm, an indication that the interaction of Q1, Q6, and Q11 with BSA causes a conformational change in the protein structure [91]. Furthermore, an isosbestic point between 366 and 388 nm in the spectra of the complex–BSA interaction was observed, implying the formation of a stable complex–protein complex. Q11 (Figure 6b) quenched the intrinsic fluorescence of BSA more than Q1 and Q6.
The inability of all the complexes (with the exception of Q1, Q6, and Q11) to quench the intrinsic fluorescence of BSA after the addition of between 1 and 2 μM concentration could be structurally related because from our previous report where pyridine moiety was involved as against the quinoline moiety in this study, a contrary behavior regarding the interaction of the protein with complexes of similar substituents and moieties were reported. Complexes Q1, Q6, and Q11 mode of coordination are different from other complexes mode of coordination which means their interaction with BSA was probably via the aniline substituent while the quinoline ring of L2, L3, L4, and L5 complexes were not planar enough and are not readily available for quenching the active site of the protein buried in the hydrophobic environment. This suggests no interaction of the complexes with the BSA protein.
The quenching mechanism of the Q1, Q6, and Q11 was evaluated using the Stern–Volmer Equation (Equation (7)). Ksv values for the complexes were obtained from the slope of the plot of I0/I vs. [Q] and found to be between 2.50 × 10⁴ and 4.09 × 10⁴ M−1. The calculated values of Ksv and Kq for the interaction of the complexes with BSA are given in Table 4. The linearity of the Stern–Volmer plots (inset Figures S64–S71) is an indicator of either a static or a dynamic quenching mechanism. The Kq values obtained for the complexes are between 2.50 × 10¹² and 4.09 × 10¹² M−1S−1, which are greater than the maximum scatter collision-quenching constant of biomacromolecules (2 × 10¹⁰ M−1 S−1). This indicates that the interactions between the complexes and BSA are static. Therefore, the binding constant (Kbin) and the number of binding sites (n) can be determined using Scatchard Equation (3):
log I o I I = log K bin + n log Q  
The n and Kbin can be calculated from the slope and the intercept of the double logarithm regression curve of log(Iₒ − I)/I versus log[Q] (Figures S76–S77). The values of the binding constant (Kbin) suggest BSA has a moderate binding affinity to the complexes. Complex Q6 (Figure 6c) has the highest binding affinity to BSA. The number of the binding site (n) for Q1, Q6, and Q11 are approximately one; this suggests that one molecule of the complexes bound per bovine serum albumin. The binding constant values of Q1, Q6, and Q11 fall within 104–106 M−1, which is the recognized values of non-covalent interaction of BSA with drugs [92].
In summary, the interaction of the complexes with BSA causes conformation changes of both tyrosine and tryptophan environments due to the hydrophobic interactions of the complexes′ ligand with BSA. In essence, the complexes possess a moderate binding affinity for protein. Thus, most of the complexes can be stored in protein and can be easily released in desired target areas.

2.8. Anticancer Studies

Cancer is one of the major life-threatening diseases worldwide. The clinical application of chemotherapy is still considered a major method in treating cancer, therefore, the development of novel effective anticancer drugs is of importance. For this study, we picked complexes Q6, Q7, and Q9 based on the significant effect the fluorine and methyl substituent and benzothiazole moiety has on their complexes′ biological activities. All these complexes have perchlorate as their anion since perchlorate has been identified to likely enhance biological activities as seen in the antimicrobial, antioxidant, activities, and DNA and protein binding assays.
The in vitro cytotoxicity of metal complexes, Q6, Q7, Q9, and cisplatin toward human embryonic kidney 293 (HEK293), cervical cancer cell line (HELA), breast cancer cell line (MDA-MB231) and neuronal cancer cell line (SHSY5Y) were examined via standard method. The EC50 and the selectivity index (SI) values obtained are summarized in Table 5. The result obtained indicate that there is a structure activity relationship of the complexes in terms of cytotoxicity of the complexes. Q7 and Q9 showed potent cytotoxicity activity towards HELA cells with EC50 values of 22.80 ± 3.11 and 22.34 ± 4.86 μM, respectively which is lower than cisplatin (EC50 > 50). Q7 and Q9 also showed slight cytotoxicity against MDA-MB231 and SHSY5Y.
The remarkable cytotoxicity recorded for Q7 and Q9 towards HELA cells might be due to the presence of benzothiazole moiety and methyl substituent, respectively. In similar reports, Saeed et al. 2010 [93] in their anticancer study of various benzothiazole derivatives obtained IC50 values in the range 38–46 μM, and Sreelatha et al. 2014 [94], identified the influence of methyl group in the anticancer activity of naphthoquinone amide derivatives against HELA with IC50 value of 20 μM.
The positive charge of the metal is also known to influence the cytotoxic activity of the complexes. The charge increases the acidity of the coordinated ligand that accept protons [95]. Q6 had low cytotoxicity activity (EC50 > 100 μM) towards all the cancer cell lines which could be attributed to their unusual mode of coordination. In comparison, the cytotoxic activity of the complexes toward HeLa cell follows the order Q9 > Q7 > Q6.
In MDA-MB231, Q7 and Q9 with EC50 of 41.62 ± 4.25 μM and 38.84 ± 4.33 μM, respectively, showed fair cytotoxicity when compared to cisplatin (EC50 = 22.68 ± 4.89 μM), similarly, Q7 and Q9 had moderate anticancer activity when compared with cisplatin (EC50 = 19.74 ± 3.77 μM) against SHSY5Y with EC50 value of 30.33 ± 4.67 μM and 47.23 ± 3.34 μM respectively.
All the complexes are less toxic toward the normal cell (HEK293), with EC50 ≥ 100 μM and are significantly higher than that of cisplatin with EC50 values of 14.2 ± 3.8 μM. The SI data shown in Table 5 demonstrates the differential activity of the complexes and cisplatin, the greater the SI value is, the more selective it is. An SI value of less than two indicates the general toxicity of the compound. Based on this, the SI values indicate that complexes Q7 and Q9 displayed excellent selectivity towards all the cancer cell lines, while complexes Q6 had better selectivity towards all the cancer cell lines better than the Cisplatin standard.
In conclusion, the cytotoxicity activity of the studied complexes is coordination geometry, structural substituent, and moiety dependent. The introduction of benzothiazole moiety and methyl substituent on the phenyl ring enhance the anticancer activity especially towards HELA, as a consequence, complexes Q7 and Q9 are promising anti-cervical cancer agents. Notably, all the tested complexes are benign to the normal cell and they all demonstrated a remarkable selectivity for cancer cells over normal cells.

3. Experimental

3.1. Materials and Instrumentation

Ethanol 99.5% (Aldrich, St. Louis, MO, USA), diethyl ether 99.8% (Aldrich, St. Louis, MO, USA), DMSO–d6 99.8% (Merck, Darmstadt, Germany), 2-quinolinecarboxaldehyde 99% (Aldrich, St. Louis, MO, USA), 2-aminobenzenethiol 99.5% (Aldrich, St. Louis, MO, USA), 2-thiophenemethylamine > 92% (MerckDarmstadt, Germany), p-toluidine 99.5% (Aldrich, St. Louis, MO, USA), 2-fluoroaniline 99.5% (Aldrich, St. Louis, MO, USA), 4-chloroaniline 99.5% (Aldrich, St. Louis, MO, USA), dichloromethane 99% (Aldrich, St. Louis, MO, USA), calf-thymus DNA (CT-DNA), ethidium bromide 95% (Aldrich, St. Louis, MO, USA), bovine serum albumin 99% (Aldrich, St. Louis, MO, USA), and nitrogen gas, 5.0 technical grade (Air flex Industrial Gases, Pietermaritzburg, Africa) were purchased from local suppliers. All chemicals were in analytical grade and used as received, while most of the solvents were dried using conventional techniques.
1H NMR and 13C NMR spectra were recorded on a BRUKER 400 MHz spectrometer in DMSO–d6 and acetone-d6. Chemical shift values are reported in parts per million (ppm) relative to the solvent residual peaks in DMSO-d6 and acetone-d6; 2.5 and 2.05 ppm respectively for 1H NMR and 39.5 and 29.4 ppm respectively for 13C NMR. The splitting patterns in 1H NMR spectra are reported as s for singlet, d for doublet, m for multiplet while J (the coupling constant is given in Hertz). The infrared spectra were recorded using a PerkinElmer Spectrum 100 FT-IR spectrometer, and the data are reported as percentage transmittances at the respective wavenumbers (cm−1), between 4000 and 650 cm−1. The mass spectra were recorded using Shimadzu LCMS-2020 instrument with only molecular ions (M+) and major fragmentation peaks being reported with intensities quoted as percentages of the base peak. Elemental analyses were performed on Thermal-Scientific Flash 2000 CHNS/O analyzer. All melting points were determined using the Stuart Scientific melting point apparatus. Absorption studies of CT-DNA and protein were recorded using Shimadzu UV-1800 UV-Vis Spectrophotometer. The photoluminescence studies of CT-DNA and protein were recorded using PerkinElmer LS 45 Fluorescence spectrometer.

3.2. Synthesis of Quinolinyl Schiff Bases L1L5

L1L5 were synthesized using a modified method from the literature [96,97] for similar ligands. The ligands were synthesized by the addition of a solution of 2-quinolinecarboxaldehyde (1 mmol, 0.16 g) in anhydrous ethanol (10 mL) to a solution of 2-fluoroaniline (1 mmol, 0.10 mL), 2-aminothiophenol (1 mmol, 0.10 mL), 4-chloroaniline (1 mmol, 0.13 g), p-toluidine (1 mmol, 0.11 g), and 2-thiophenemethylamine (1 mmol, 0.10 mL), respectively, in anhydrous ethanol (10 mL) in the presence of glacial acetic acid. The resulting reactions for L1, L3, and L4 were refluxed at ca. 80 °C for 4 h while L2 and L5 were subjected to constant stirring at ambient temperature for 6 h. L2, L3, and L4 solutions were evaporated to one-third of their initial volume under reduced pressure after which 10 mL of ether was added to each solutions to afford precipitates. The precipitates were isolated via filtration, washed twice with 10 mL cold ether, recrystallized from ethanol and dried over anhydrous magnesium sulfate. L1 and L5 on the other hand were evaporated completely under pressure. The oil obtained was recrystallized from ethanol and dried over anhydrous magnesium sulfate.

3.3. Single-Crystal X-ray Analysis

Crystal evaluation and data collection of Q1, Q6, Q7, Q12, and Q14 were recorded on a Bruker Apex Duo diffractometer equipped with an Oxford Instruments Cryojet operating at 100 (2) K and an Incoatec microsource operating at 30 W power. The data were collected with Mo Kα (λ = 0.71073 Å) radiation at a crystal-to-detector distance of 50 mm using omega and phi scans. The data were reduced with the programme SAINT [98] using outlier rejection, scan speed scaling, as well as standard Lorentz and polarization correction factors. A SADABS [99] semi-empirical multi-scan absorption correction was applied to the data.
The structures of Q1, Q6, Q7, Q12, and Q14 were solved by the direct method using the SHELXS [100] program and refined. The visual crystal structure information was performed using ORTEP-3 [101], system software. Non-hydrogen atoms were first refined isotropically and then by anisotropic refinement with a full-matrix least-squares method based on F2 using SHELXL [102]. All hydrogen atoms were positioned geometrically, allowed to ride on their parent atoms, and refined isotropically. The crystallographic data and structure refinement parameters for Q1, Q6, Q7, Q12, and Q14 are given in Table S3 (See Supplementary Materials).
In complex Q7, the perchlorate ion including the bidentate ligand was disordered over two positions with each component having 50% site occupancy. The bridging ligand was disordered over a special position with an equal site occupancy factor. PART-1 instruction was used to model the disorder.

3.4. Synthesis of Q1Q15

Q1Q15 were synthesized by dropwise addition of ethanolic solution (ca. 15 mL) of each of L1L5 (1 mmol) to an ethanolic (ca. 10 mL) solution of silver nitrate (0.5 mmol, ca. 0.09 g), silver perchlorate (0.5 mmol, ca. 0.10 g), and silver trifluoromethanesulfonate (0.5 mmol, ca. 0.13 g), respectively, under constant stirring in the dark. The reactions were carried out under nitrogen at ambient temperature for 6 h. The resulting precipitates were isolated using a vacuum filter. Afterward, the precipitates were washed with cold ethanol (10 mL × 2) followed by cold ether (10 mL × 2) and dried in vacuo. The obtained complexes were recrystallized by dissolving the complexes in dichloromethane and layering with toluene.

3.4.1. [Ag(L1)2]NO3 Q1

Yellow solid, 0.50 g, 94%, Melting point; 152–153 °C. 1H-NMR (400 MHz, DMSO-d6, δ ppm): 8.93 (1H, s, Hg-CH=N-), 8.62 (1H, d, J = 8.69 Hz, He-C9H6N), 8.31 (1H, d, J = 8.55 Hz, Hf-C9H6N), 8.18 (1H, d, J = 8.46 Hz, Hd-C9H6N), 8.12 (1H, d, J = 8.46 Hz, Ha-C9H6N), 7.89 (1H, m, Hb-C9H6N), 7.75 (1H, m, Hc-C9H6N), 7.55 (1H, m, Hj-C6H4), 7.34 (3H, m, Hk, i, h-C6H4), 6.95 (1H, m, Ho-C6H4), 6.86 (1H, m, Hm-C6H4), 6.75 (1H, m, Hn-C6H4), 6.50 (1H, m, Hl-C6H4), 5.04 (2H, s, Hp-NH2). 13C-NMR (400 MHz, DMSO-d6, δ ppm 25 °C): δ = 162.97 (C10-C=N-), 156.35 (C22-C6H4), 153.11 (C16-C6H4), 149.43 (C1-C9H6N), 146.99 (C9-C9H6N), 137.74 (C7-C9H6N), 136.36 (C11-C6H4), 136.23 (C17-C6H4), 130.70 (C6-C6H4), 129.36 (C3-C6H4), 128.89 (C2-C6H4), 128.58 (C14-C6H4N), 128.37 (C5-C9H6N), 128.18 (C4-C6H4N), 125.18 (C13-C9H6N), 125.14 (C19-C6H4), 124.41 (C12-C6H4), 124.38 (C20-C6H4), 121.73 (C8-C9H6N), 119.60 (C15-C6H4), 116.45 (C18-C6H4), 116.17 (C21-C6H4). FT-IR (cm−1): (-C=N-) 1612, (C=N quinolinyl) 1588, (C-F) 1500. UV/Vis (CH3CN): λmax 234, 276, 326 nm. MS: m/z Calcd. For [C22H16AgF2N3]: 468; found [Ag(L1)–2F + Na + CH3CN]+: 495 (79%), 496 (26%), [Ag(L1) + 2EtOH]+: 583 (53%), 584 (18%). Anal. Calcd. (%) for [C22H17AgF2N4O3]: C, 49.74; H, 3.23; N, 10.55; found (%): C, 49.67; H, 3.14; N, 10.38.

3.4.2. [Ag(L2)2]NO3 Q2

Brown solid, 0.39 g, 56%, Melting point; 266–267 °C. 1H-NMR (400 MHz, (DMSO, δ ppm): 8.62 (2H, d, J = 8.58 Hz, Hg-C6H4-), 8.46 (2H, d, J = 8.53 Hz, He-C9H6N-), 8.17 (8H, Hj-C6H4, Hd-C9H6N, Ha-C9H6N, Hf-C9H6N), 7.88 (2H, t, J = 7.68 Hz, Hb-C9H6N), 7.72 (2H, d, J = 7.50 Hz, Hc-C9H6N), 7.58 (4H, m, Hh-C6H4, Hi-C6H4). 13C-NMR (400 MHz, (DMSO, 25 °C): δ = 168.94 (C9-C9H6N), 153.60 (C16-C6H4), 150.38 (C10-C=N-), 147.04 (C1-C9H6N), 138.04 (C7-C9H6N), 135.61 (C11-C6H4), 130.83 (C3-C9H6N), 128.94 (C2-C9H6N), 128.77 (C5-C9H6N), 128.23 (C4-C9H6N), 128.03 (C6-C9H6N), 126.76 (C14-C6H4), 126.35 (C13-C9H6N), 123.53 (C12-C6H4), 122.65 (C15-C6H4), 118.12 (C8-C9H6N). FT-IR (cm−1): (Ar-CH) 3051, (C-S-C) 750, (quinolinyl) 1588. UV/Vis (CH3CN): λmax 217, 284, 318, 335, 350 nm. MS: m/z Calcd. For [C32H20AgN4S2]: 632,53; found [Ag(L2)2 + H)]+: 633 (100%), 631 (90%), 634 (38 %). Anal. Calcd. (%) for [C32H20AgN5O3S2]: C, 55.34; H, 2.90; N, 10.08; found (%): C, 55.23; H, 2.85; N, 9.92.

3.4.3. [Ag(L3)2]NO3 Q3

Brown solid, 0.67 g, 96%, Melting point; 182–183 °C. 1H-NMR (400 MHz, (CD3)2CO, δ ppm): 9.08 (2H, s, Hg-CH=N-), 8.72 (2H, d, J = 8.47 Hz, He-C9H6N), 8.27 (2H, d, J = 8.46 Hz, Hf-C9H6N), 8.17 (4H, m, Hd, a-C9H6N), 7.90 (2H, m, Hb-C9H6N), 7.77 (2H, m, Hc-C9H6N), 7.56 (8H, m, Hi, h-C6H4). 13C-NMR (400 MHz, (CD3)2CO, 25 °C): δ = 152.20 (C10-C=N-), 148.00 (C1-C6H4), 146.81 (C11-C9H6N), 138.90 (C9-C9H6N), 132.52 (C7-C9H6N), 131.52 (C14-C9H6N), 131.56 (C6-C6H4), 129.79 (C13, C15-C9H6N), 129.75 (C3-C6H4), 129.68 (C2-C6H4), 128.94 (C5-C6H4), 128.61 (C4-C6H4), 124.16 (C12 & C16-C9H6N), 122.27 (C8-C9H6N). FT-IR (cm−1): (Ar-CH) 3063, (-C=N-) 1613, (C=N quinolinyl) 1584. UV/Vis (CH3CN): λmax 212, 257, 313, 331 nm. MS: m/z Calcd. for [C32H22AgCl2N4]: 641.32; found [Ag(L3)2]+: 641 (100%), 639 (54%), 643 (48%), 642 (31%), [Ag(L3) + H + CH3CN + Na]+: 597 (56%), 595 (23%). Anal. Calcd. (%) for [C32H22AgCl2N5O3]: C, 54.65; H, 3.15; N, 9.96; found (%): C, 54.32; H, 3.15; N, 9.93.

3.4.4. [Ag(L4)2]NO3 Q4

Yellow solid, 0.47 g, 72%, Melting point; 141–142 °C. 1H-NMR (400 MHz, DMSO-d6, δ ppm): 9.21 (2H, s, Hg-CH=N-), 8.76 (2H, d, J = 8.26 Hz, He-C9H6N), 8.28 (2H, d, J = 8.46 Hz, Hf-C9H6N), 8.14 (4H, m, Hd, a-C9H6N), 7.86 (2H, m, Hb-C9H6N), 7.75 (2H, m, Hc-C9H6N), 7.52 (4H, m, Hi-C6H4), 7.29 (4H, d, Hh-C6H4), 2.33 (6H, m, Hj-CH3). 13C-NMR (400 MHz, DMSO-d6, 25 °C): δ = 159.06 (C10-C9H6N), 151.67 (C1-C6H4), 146.26 (C11-C9H6N), 145.71 (C9-C9H6N), 138.88 (C15-C9H6N), 138.16 (C7-C=N-), 131.43 (C6-C6H4), 130.02 (C13 & C16-C9H6N), 129.35 (C3-C6H4), 129.19 (C2-C6H4), 128.58 (C5-C6H4), 128.33 (C4-C6H4), 122.75 (C12 & C17-C9H6N), 122.25 (C8-C9H6N), 20.64 (C14-C9H6N). FT-IR (cm−1): (Ar-CH) 3050, (-C=N-) 1684, (quinolinyl) 1586. UV/Vis (CH3CN): λmax 243, 302, 339 nm. MS: m/z Calcd. For [C34H28AgN4]: 600.49; found [Ag(L4)2 + H)]+: 601 (100%), 599 (90%), 602 (33%), 600 (23%). Anal. Calcd. (%) for [C34H28AgN5O3]: C, 61.64; H, 4.26; N, 10.57; found (%): C, 61.54; H, 4.04; N, 10.38.

3.4.5. [Ag(L5)2]NO3 Q5

Brown solid, 0.54 g, 78%, Melting point; 134–135 °C, 1H-NMR (400 MHz, DMSO-d6, δ ppm): 9.03 (2H, t, J = 1.48 Hz, 1.51 Hz, Hg-CH=N-), 8.79 (2H, d, J = 8.22 Hz, He-C9H6N), 8.16 (2H, d, J = 7.36 Hz, Hd-C9H6N), 8.09 (2H, d, J = 8.41 Hz, Hf-C9H6N), 8.01 (2H, d, J = 8.32 Hz, Ha-C9H6N), 7.87 (2H, m, Hb-C9H6N), 7.76 (2H, m, Hc-C9H6N), 7.45 (2H, m, Hk-C4H3S), 7.06 (2H, m, Hi-C4H3S), 6.97 (2H, m, Hj-C4H3S), 5.20 (4H, s, Hh-CH2). 13C-NMR (400 MHz, DMSO-d6, 25 °C): δ = 162.60 (C10-C=N-), 149.61 (C9-C9H6N), 145.82 (C1-C9H6N), 140.21 (C15-C4H3S), 139.53 (C7-C9H6N), 131.67 (C6-C9H6N), 129.40 (C3-C9H6N), 128.78 (C2-C9H6N), 128.32 (C5-C9H6N), 127.42 (C4-C9H6N), 127.33 (C13-C4H3S), 126.96 (C12-C4H3S), 126.24 (C14-C4H3S), 123.71 (C8-C9H6N), 57.40 (C11-CH2). FT-IR (cm−1): (Ar-CH) 3059, (-C=N-) 1645, (C=N quinolinyl) 1589. UV/Vis (CH3CN): λmax 288, 320sh, 334sh nm. MS: m/z Calcd. for [C30H24AgN4S2]: 612.54; found [Ag(L5)2 + H]+: 613 (100%), 611 (85%), 614 (29%), 612 (18%), 615 (10%), [Ag(L5) + CH3CN]+: 400 (30%), 402 (29%). Anal. Calcd. (%) for [C30H24AgN5O3S2]: C, 53.42; H, 3.59; N, 10.38; found (%): C, 53.14; H, 3.29; N, 10.19.

3.4.6. [Ag(L1)2]ClO4 Q6

Brown solid, 0.56 g, 99%, Melting point; 198–199 °C. 1H-NMR (400 MHz, DMSO-d6, δ ppm): 8.98 (1H, s, Hg-CH=N-), 8.66 (1H, d, J = 8.46 Hz, He-C9H6N), 8.30 (1H, d, J = 8.46 Hz, Hf-C9H6N), 8.18 (1H, d, J = 8.26 Hz, Hd-C9H6N), 8.13 (1H, d, J = 8.04 Hz, Ha-C9H6N), 7.89 (1H, m, Hb-C9H6N), 7.76 (1H, m, Hc-C9H6N), 7.57 (1H, m, Hj-C6H4), 7.34 (3H, m, Hk, i, h-C6H4), 6.95 (1H, m, Ho-C6H4), 6.86 (1H, m, Hm-C6H4), 6.75 (1H, m, Hn-C6H4), 6.50 (1H, m, Hl-C6H4), 5.04 (2H, s, Hp-NH2). 13C-NMR (400 MHz, DMSO-d6, δ ppm 25 °C): δ = 162.73 (C10-C=N-), 155.88 (C22-C6H4), 153.90 (C16-C6H4), 150.85 (C1-C9H6N), 150.28 (C9-C9H6N), 138.64 (C7-C9H6N), 137.72 (C11-C6H4), 137.46 (C17-C6H4), 128.71 (C6-C6H4), 128.64 (C3-C6H4), 128.42 (C2-C6H4), 127.50 (C14-C6H4N), 127.31 (C5-C9H6N), 126.38 (C4-C6H4N), 125.12 (C13-C9H6N), 125.09 (C19-C6H4), 124.41 (C12-C6H4), 124.38 (C20-C6H4), 122.16 (C8-C9H6N), 121.83 (C15-C6H4), 116.41 (C18-C6H4), 116.25 (C21-C6H4). FT-IR (cm−1): (Ar-CH) 3070, (-C=N-) 1624, (pyridyl) 1585, (C-F) 1490. UV/Vis (CH3CN): λmax 234, 276, 327 nm. MS: m/z Calcd. [C22H16AgF2N3]: 468; found [Ag(L1) + K]+: 507 (57%), 508 (54%), [Ag(L1)-F]+: 463 (37%). Anal. Calcd. (%) for [C22H17AgClF2N3O4]: C, 46.46; H, 3.01; N, 7.39; found (%): C, 46.32; H, 2.89; N, 7.14.

3.4.7. [Ag(L2)2]ClO4 Q7

Light brown solid, 0.46 g, 63%, Melting point; 242–243 °C, 1H-NMR (400 MHz, (DMSO-d6, δ ppm): 8.62 (2H, d, J = 8.54 Hz, Hg-C6H4-), 8.47 (2H, d, J = 8.54 Hz, He-C9H6N-), 8.17 (8H, Hj-C6H4, Hd-C9H6N, Ha-C9H6N, Hf-C9H6N), 7.89 (2H, t, J = 7.67 Hz, Hb-C9H6N), 7.73 (2H, d, J = 7.50 Hz, Hc-C9H6N), 7.57 (4H, m, Hh-C6H4, Hi-C6H4). 13C-NMR (400 MHz, (DMSO-d6, 25 °C): δ = 169.27 (C9-C9H6N), 153.93 (C11-C6H4), 150.73 (C10-C=N-), 147.37 (C1-C9H6N), 138.33 (C7-C9H6N), 135.94 (C16-C6H4), 131.14 (C3-C9H6N), 129.25 (C2-C9H6N), 129.08 (C5-C9H6N), 128.54 (C4-C9H6N), 128.34 (C6-C9H6N), 127.06 (C13-C6H4), 126.66 (C14-C6H4), 123.85 (C15-C6H4), 122.95 (C12-C6H4), 118.41 (C8-C9H6N). FT-IR (cm−1): (Ar-CH) 3062, (C-S-C) 751, (quinolinyl) 1586. UV/Vis (CH3CN): λmax 217, 289, 318, 335, 350 nm. MS: m/z Calcd. For [C32H20AgN4S2]: 632,53; found [Ag (L2)2 + H)]: 633 (100%), 631 (81%), 634 (30%), [Ag(L2) + H + CH3CN)]+: 412 (38%), 410 (35%). Anal. Calcd. (%) for [C48H30Ag2ClN6O4S3]: C, 52.31; H, 2.74; N, 7.63; found (%): C, 52.16; H, 2.64; N, 7.60.

3.4.8. [Ag(L3)2]ClO4 Q8

Yellow solid, 0.66 g, 89%, Melting point; 190–191 °C. 1H-NMR (400 MHz, (CD3)2CO, δ ppm): 9.19 (2H, s, Hg-CH=N-), 8.80 (2H, d, J = 8.30 Hz, He-C9H6N), 8.25 (4H, q, J = 8.48 Hz, J = 8.41 Hz, Hd, f-C9H6N), 8.18 (2H, d, J = 7.27 Hz, Ha-C9H6N), 7.94 (2H, m, Hb-C9H6N), 7.80 (2H, m, Hc-C9H6N), 7.67 (4H, m, Hi-C6H4), 7.60 (4H, m, Hh-C6H4). 13C-NMR (400 MHz, (CD3)2CO, 25 °C): δ = 151.31 (C10-C=N-), 147.64 (C1-C6H4), 146.62 (C11-C9H6N), 139.73 (C9-C9H6N), 132.16 (C7-C9H6N), 131.40 (C14-C9H6N), 130.25 (C6-C6H4), 130.18 (C13 & C15-C9H6N), 130.01 (C3-C6H4), 128.96 (C2-C6H4), 128.88 (C5 & C8-C6H4), 124.69 (C4-C6H4), 124.13 (C12 & C16-C9H6N). FT-IR (cm−1): (Ar-CH) 3065, (quinolinyl) 1592. UV/Vis (CH3CN): λmax 242, 320 nm. MS: m/z Calcd. for [C32H22AgCl2N4]: 641.32; found [Ag(L3)2]+: 641 (81%), 639 (41%), 643 (39%), [Ag(L3) + H + CH3CN]+: 416 (56%), 414 (44%), 418 (15%). Anal. Calcd. (%) for [C32H22AgCl3N4O4]: C, 51.89; H, 2.99; N, 7.56; found (%): C, 51.69; H, 2.85; N, 7.31.

3.4.9. [Ag(L4)2]ClO4 Q9

Brown solid, 0.55 g, 80%, Melting point: 149–150 °C. 1H-NMR (400 MHz, DMSO-d6, δ ppm): 9.20 (2H, s, Hg-CH=N-), 8.76 (2H, d, J = 8.37 Hz, He-C9H6N), 8.27 (2H, d, J = 8.50 Hz, Hf-C9H6N), 8.15 (4H, m, Hd, a-C9H6N), 7.87 (2H, m, Hb-C9H6N), 7.76 (2H, m, Hc-C9H6N), 7.52 (4H, m, Hi-C6H4), 7.29 (4H, d, J = 7.95 Hz, Hh-C6H4), 2.34 (6H, m, Hj-CH3). 13C-NMR (400 MHz, DMSO-d6, 25 °C): δ = 159.03 (C10-C9H6N), 151.62 (C1-C6H4), 146.25 (C11-C9H6N), 145.71 (C9-C9H6N), 138.89 (C15-C9H6N), 138.16 (C7-C=N-), 131.43 (C6-C6H4), 130.02 (C13 & C16-C9H6N), 129.37 (C3-C6H4), 129.18 (C2-C6H4), 128.58 (C5-C6H4), 128.33 (C4-C6H4), 122.79 (C12 & C17-C9H6N), 122.26 (C8-C9H6N), 20.64 (C14-C9H6N). FT-IR (cm−1): (Ar-CH) 3043, (-C=N-) 1682, (quinolinyl) 1587. UV/Vis (CH3CN): λmax 242, 301, 339 nm. MS: m/z Calcd. For [C34H28AgN4]: 600.49; found [Ag (L4)2 + H)]: 601 (100%), 599 (90%), 602 (29%), 600 (19%) [Ag(L4) + H + CH3CN)]+: 396 (26%), 394 (21%). Anal. Calcd. (%) for [C34H28AgClN4O4]: C, 58.34; H, 4.03; N, 8.00; found (%): C, 58.11; H, 3.98; N, 7.92.

3.4.10. [Ag(L5)2]ClO4 Q10

Orange solid, 0.71 g, 100%, Melting point; 132–133 °C. 1H-NMR (400 MHz, (CD3)2CO, δ ppm): 9.02 (2H, s, Hg-CH=N-), 8.76 (2H, d, J = 8.41 Hz, He-C9H6N), 8.12 (4H, d, J = 8.48 Hz, Hf, d-C9H6N), 7.71 (6H, m, Ha, b, c-C9H6N), 7.23 (2H, m, Hk-C4H3S), 6.98 (2H, d, J = 3.43 Hz, Hi-C4H3S), 6.77 (2H, m, Hj-C4H3S), 5.13 (4H, s, Hh-CH2). 13C-NMR (400 MHz, DMSO-d6, 25 °C): δ = 162.47 (C10-C=N-), 150.07 (C9-C9H6N), 146.13 (C1-C9H6N), 140.31 (C15-C4H3S), 136.65 (C7-C9H6N-), 132.09 (C6-C9H6N), 130.19 (C3-C9H6N), 129.24 (C2-C9H6N), 128.70 (C5-C9H6N), 127.92 (C4-C9H6N), 127.47 (C13-C4H3S), 127.35 (C12-C4H3S), 126.26 (C14-C4H3S), 124.00 (C8-C9H6N), 57.70 (C11-CH2). FT-IR (cm−1): (Ar-CH) 3063, (-C=N-) 1644, (quinolinyl) 1589. UV/Vis (CH3CN): λmax 287, 320sh, 334sh nm. MS: m/z Calcd. for [C30H24AgN4S2]: 612.54; found [Ag(L5)2 + H]+: 613 (100%), 611 (79%), 614 (30%), 612 (15%), 615 (11%). Anal. Calcd. (%) for [C30H24AgClN4O4S2]: C, 50.61; H, 3.40; N, 7.87; found (%): C, 50.32; H, 3.40; N, 7.83.

3.4.11. [Ag(L1)2]CF3SO3 Q11

Brown solid, 0.60 g, 97%, Melting point; 154–155 °C, 1H-NMR (400 MHz, DMSO-d6, δ ppm): 9.17 (1H, s, Hg-CH=N-), 8.78 (1H, d, J = 8.36 Hz, He-C9H6N), 8.30 (1H, d, J = 8.45 Hz, Hf-C9H6N), 8.17 (2H, m, Ha, d-C9H6N), 7.88 (1H, m, Hb-C9H6N), 7.77 (1H, m, Hc-C6H4), 7.62 (1H, m, Hj-C9H6N), 7.34 (3H, m, Hk, i, h-C6H4), 6.95 (1H, m, Ho-C6H4), 6.86 (1H, m, Hm-C6H4), 6.76 (1H, m, Hn-C6H4), 6.50 (1H, m, Hl-C6H4). 13C-NMR (400 MHz, DMSO-d6, δ ppm 25 °C): δ = 162.83 (C10-C=N-), 156.48 (C22-C6H4), 154.00 (C16-C6H4), 151.17 (C1-C9H6N), 146.26 (C9-C9H6N), 139.02 (C7-C9H6N), 137.11 (C11-C6H4), 137.02 (C17-C6H4), 131.51 (C6-C6H4), 129.48 (C3-C6H4), 129.33 (C2-C6H4), 129.25 (C14-C6H4N), 128.84 (C5-C9H6N), 128.34 (C4-C6H4N), 125.24 (C13-C9H6N), 125.21 (C19-C6H4), 124.42 (C12-C6H4), 124.39 (C20-C6H4), 122.81 (C8-C9H6N), 122.11 (C15-C6H4), 116.57 (C18-C6H4), 116.37 (C21-C6H4). FT-IR (cm−1): (Ar-CH) 3061, (-C=N-) 1624, (C=N quinolinyl) 1585. UV/Vis (CH3CN): λmax 234, 276, 327 nm. MS: m/z Calcd. for [C22H16AgF2N3]: 468; found [Ag(L1) + CH3CN]+: 509 (98%), 507 (87%). Anal. Calcd. (%) for [C23H17AgF5N3O3S]: C, 44.68; H, 2.77; N, 6.80; found (%): C, 44.62; H, 2.51; N, 6.73.

3.4.12. [Ag(L2)2]CF3SO3 Q12

Yellow solid, 0.68 g, 87%, Melting point; 245–246 °C. 1H-NMR (400 MHz, (CD3)2CO, δ ppm): 8.62 (2H, d, J = 8.11 Hz, Hg-C6H4-), 8.48 (2H, d, J = 8.54 Hz, He-C9H6N-), 8.16 (8H, Hj-C6H4, Hd-C9H6N, Ha-C9H6N, Hf-C9H6N), 7.89 (2H, m, Hb-C9H6N), 7.72 (2H, m, Hc-C9H6N), 7.58 (4H, m, Hh-C6H4, Hi-C6H4). 13C-NMR (400 MHz, (CD3)2CO, 25 °C): δ = 150.84 (C9-C9H6N), 138.27 (C11-C6H4), 135.97 (C10-C=N-), 131.10 (C1-C9H6N), 129.22 (C7-C9H6N), 129.06 (C16-C6H4), 128.54 (C3-C9H6N), 128.32 (C2 & C5-C9H6N), 127.03 (C4-C9H6N), 126.63 (C6 & C13-C9H6N), 123.85 (C14-C6H4), 122.94 (C12 & C15-C6H4), 118.30 (C8-C9H6N). FT-IR (cm−1): (Ar-CH) 3059, (C-S-C) 754, (quinolinyl) 1588. UV/Vis (CH3CN): λmax 217, 285, 320, 335, 350 nm. MS: m/z Calcd. For [C32H20AgN4S2]: 632,53; found [Ag (L2)2 + H)]+: 633 (100%), 631 (81%), 634 (30%), [Ag(L2) + H + CH3CN)]+: 412 (38%), 410 (35%). Anal. Calcd. (%) for [C34H20Ag2F6N4O6S4]: C, 39.32; H, 1.94; N, 5.39; found (%): C, 39.15; H, 1.78; N, 5.27.

3.4.13. [Ag(L3)2]CF3SO3 Q13

Brown solid, 0.40 g, 50%, Melting point; 193–194 °C. 1H-NMR (400 MHz, (CD3)2CO, δ ppm): 9.16 (2H, s, Hg-CH=N-), 8.77 (2H, d, J = 8.30 Hz, He-C9H6N), 8.24 (4H, q, J = 8.48 Hz, J = 8.41 Hz, Hd, f-C9H6N), 8.17 (2H, d, J = 7.27 Hz, Ha-C9H6N), 7.92 (2H, m, Hb-C9H6N), 7.78 (2H, m, Hc-C9H6N), 7.63 (4H, m, Hi-C6H4), 7.58 (4H, m, Hh-C6H4). 13C-NMR (400 MHz, (CD3)2CO, 25 °C): δ = 151.20 (C10-C=N-), 147.32 (C1-C6H4), 146.24 (C11-C9H6N), 138.99 (C9-C9H6N), 132.44 (C7-C9H6N), 131.50 (C14-C9H6N), 129.59 (C6-C6H4), 129.58 (C13 & C15-C9H6N), 129.47 (C3-C6H4), 128.79 (C2-C6H4), 128.34 (C5-C6H4), 124.05 (C4-C6H4), 123.00 (C12 & C16-C9H6N), 121.94 (C8-C9H6N). UV/Vis (CH3CN): λmax 244, 307, 335 nm. MS: m/z Calcd. for [C32H22AgCl2N4]: 641.32; found [Ag(L3)2]+: 641 (100%), 639 (65%), 643 (52%), 642 (25%), [Ag(L3) + H + CH3CN ]+: 416 (37%), 414 (29%). Anal. Calcd. (%) for [C33H22AgCl2F3N4O3S]: C, 50.15; H, 2.81; N, 7.09; found (%): C, 50.15; H, 2.70; N, 6.98. FT-IR (cm−1): (Ar-CH) 3063, (quinolinyl) 1591.

3.4.14. [Ag(L4)2]CF3SO3 Q14

Brown solid, 0.60 g, 80%, Melting point: 152–153 °C. 1H-NMR (400 MHz, DMSO-d6, δ ppm): 9.04 (2H, s, Hg-CH=N-), 8.66 (2H, d, J = 8.58 Hz, He-C9H6N), 8.28 (2H, d, J = 8.50 Hz, Hf-C9H6N), 8.14 (4H, m, Hd, a-C9H6N), 7.89 (2H, m, Hb-C9H6N), 7.75 (2H, m, Hc-C9H6N), 7.47 (4H, m, Hi-C6H4), 7.31 (4H, d, J = 7.92 Hz, Hh-C6H4), 2.36 (6H, m, Hi-CH3). 13C-NMR (400 MHz, DMSO-d6, 25 °C): δ = 159.01 (C10-C9H6N), 151.62 (C1-C6H4), 146.21 (C11-C9H6N), 145.66 (C9-C9H6N), 138.83 (C15-C9H6N), 138.11 (C7-C=N-), 129.97 (C6-C6H4), 129.43 (C13 & C16-C9H6N), 129.30 (C3-C6H4), 129.14 (C2-C6H4), 128.53 (C5-C6H4), 128.28 (C4-C6H4), 122.70 (C12 & C17-C9H6N), 122.20 (C8-C9H6N), 20.59 (C14-C9H6N). UV/Vis (CH3CN): λmax 245, 299, 340 nm. FT-IR (cm−1): (Ar-CH) 3067, (-C=N-) 1626, (quinolinyl) 1584. MS: m/z Calcd. For [C34H28AgN4]: 600.49; found [Ag (L4)2 + H)]+: 601 (100%), 599 (99%), 602 (34%), 600 (22%), 603 (6%), [Ag(L4) + H + CH3CN)]+: 396 (38%), 394 (34%). Anal. Calcd. (%) for [C35H28AgF3N4O3S]: C, 56.08; H, 3.77; N, 7.47; found (%): C, 55.96; H, 3.67; N, 7.23.

3.4.15. [Ag(L5)2]CF3SO3 Q15

Brown solid, 0.66 g, 87%, Melting point; 148–149 °C. 1H-NMR (400 MHz, DMSO-d6, δ ppm): 8.84 (2H, s, Hg-CH=N-), 8.62 (2H, d, J = 8.62 Hz, He-C9H6N), 8.10 (4H, t, J = 7.22 Hz, Hf, d-C9H6N), 7.99 (2H, d, J = 8.29 Hz, Ha-C9H6N), 7.82 (2H, m, Hb-C9H6N), 7.71 (2H, t, J = 7.49 Hz, Hc-C9H6N), 7.42 (2H, m, Hk-C4H3S), 7.09 (2H, m, Hi-C4H3S), 6.97 (2H, m, Hj-C4H3S), 5.15 (2H, s, Hl-CH2). 13C-NMR (400 MHz, DMSO-d6, 25 °C): δ = 162.40 (C10-C=N-), 150.00 (C9-C9H6N), 146.06 (C1-C9H6N), 140.24 (C15-C4H3S), 136.58 (C7-C9H6N-), 132.03 (C6-C9H6N), 130.12 (C3-C9H6N), 129.47 (C2-C9H6N), 128.63 (C5-C9H6N), 127.85 (C4-C9H6N), 127.40 (C13-C4H3S), 127.28 (C12-C4H3S), 126.19 (C14-C4H3S), 123.93 (C8-C9H6N), 57.63 (C11-CH2). FT-IR (cm−1): (Ar-CH) 3068, (-C=N-) 1646, (C=N quinolinyl) 1591. UV/Vis (CH3CN): λmax 291, 316 sh, 330 sh nm. MS: m/z Calcd. for [C30H24AgN4S2]+: 612.54; found [Ag(L5)2 + H]+: 613 (100%), 611 (85%), 614 (29%), 612 (18%), 615 (10%), [Ag(L5) + CH3CN]+: 400 (30%), 402 (29%). Anal. Calcd. (%) for [C31H24AgF3N4O3S3]: C, 48.89; H, 3.18; N, 7.36; found (%): C, 48.65; H, 3.11; N, 7.24.

3.5. In Vitro Antimicrobial Studies

3.5.1. Müeller–Hinton Agar Test Plates Preparation

Sterilized Nutrient agar medium was first prepared by dissolving 38 g of Müeller–Hinton agar (MHA) (Biolab, Midrand, Africa) in distilled water (1 L). The resulting Nutrient agar medium was subjected to sterilization by autoclaving for 15 min at 121 °C and then cooled down to 45 °C in a water bath. The cooled Agar medium was poured in Petri dishes while ensuring a uniform 4 mm depth of the medium and cooling further to ambient temperature [25].

3.5.2. Inoculation Procedure

Complexes Q1Q15 and their ligands were tested against four Gram-negative bacteria: Salmonella typhimurium ATCC 14026, Pseudomonas aeruginosa ATCC 27853, Escherichia coli ATCC 25922, and Klebsiella pneumoniae ATCC 31488; and two Gram-positive bacteria, viz., Staphylococcus aureus ATCC 700699 (methicillin-resistant) and Staphylococcus aureus ATCC 25923. These bacteria were inoculated in a sterilized Nutrient Broth (NB) (Biolab, Midrand, Africa) through streak plate technique and incubated at 37 °C for 18 h. The nutrient broth was sterilized by dissolving 1.3 g in distilled water (100 mL). Ca. 10 mL of the nutrient broth was transferred into a cotton wool-plugged test tubes and wrapped with an aluminium foil. The nutrient broth in the test tubes was then autoclaved for 15 min at 121 °C and cooled to 37 °C. Following this was the isolation of a single colony of the bacteria and inoculated into a 10 mL sterile NB which was then incubated in a shaking incubator at 37 °C for 18 h. Each of the bacteria strain concentrations was adjusted with sterile distilled water to get a final concentration of 1.5 × 10⁸ cfu/mL, i.e., 0.5 Mc Farland’s Standard using a densitometer (Mc Farland Latvia) [62]. The bacteria were lawn inoculated on the set MHA Petri dishes using a sterile cotton swab. Screening of L1L5 and Q1Q15 for antibacterial activity was first carried out by spotting 5 µL of their solution (prepared from the dissolution of 1000 µg of the L1L5 and Q1Q15 in 1 mL dimethyl sulfoxide (DMSO)) on an MHA petri dish and incubated at 37 °C for 18 h. The antibacterial activity was determined by looking out for a clear zone at the spotting point. The compounds with potential antimicrobial activity were then tested for their minimum inhibitory concentration (MIC) against six bacterial. Ten serial dilution of L1L5 and Q1Q15 was done to obtain 1000 µg/mL to 0.2 µg/mL concentrations, where the compounds showed lower MICs than 0.2 µg/mL, the solution was further diluted 5 times to obtain 0.100 µg/mL to 0.00625 µg/mL concentrations. Evaluation of the compounds MIC was determined by spotting 5 µL of each concentration of L1L5 and Q1Q15 on the MHA plates, and the plates were incubated at 37 °C for 18 h. These procedures were done in triplicate to give the accurate lowest concentration of the compounds where no visible bacterial growth was seen after incubation. Ciprofloxacin was used as a standard and DMSO used as a negative control showed no bactericidal effect against all the bacteria strains [50,62,103].

3.6. Antioxidant Assay

Antioxidant activity studies of L1L5 and Q1Q15 were done using ferric reducing antioxidant power (FRAP) assay. The ferric reducing antioxidant power assay is often used to evaluate the ability of an antioxidant to donate an electron. The reducing ability of the compounds was measured using a previously published method [104] after slight modifications where different concentrations (0.25 mg/mL, 0.5 mg/mL, 1 mg/mL, and 2 mg/mL) of L1L5 and Q1Q15 and standard (Ascorbic acid) were mixed with 2.5 mL of phosphate buffer (0.2 mol/L, pH 6.6) and 2.5 mL of 1% w/v potassium ferricyanide respectively. The resulting mixture was incubated at 50 °C for 20 min, and 2.5 mL of 10% trichloroacetic acid was added to acidify the mixture. After that, 1 mL of the acidified mixture was added to 1 mL of distilled water and 0.5 mL of 0.1% FeCl3. The absorbance of the resulting solution was then measured at 700 nm. The antioxidant power of the compounds was expressed as a percentage of ferric reducing antioxidant power Ascorbic acid equivalent, as shown in Equation (4).
%   F R A P   = A b s o r b a n c e   o f   A b s o r b a n c e   o f   S a m p l e A b s o r b a n c e   o f   A s c o r b i c   A c i d   × 100  

3.7. DNA Binding Experiments

The interaction of the L1L5 and complexes Q1Q15 with calf thymus-DNA was carried out in a Phosphate buffer saline solution pH 7.2 stored at 4 °C. The DNA stock solution was prepared by dissolving CT-DNA sodium salt in Phosphate buffer saline solution with continuous stirring overnight. It was filtered and stored at 4 °C and used within four days. The final concentration of CT-DNA sodium salt was determined by UV-visible absorption using the extinction coefficient ε260 = 6600 M−1 cm−1 [105]. The ratio of CT-DNA at 260 and 280 nm UV absorbance was 1.8–1.93:1, indicating that it is pure and sufficiently free of protein contamination. A fixed amount of the L1L5 and complexes Q1Q15 (50 µM) were prepared by dissolving an appropriate amount in DMSO. At a low DMSO concentration, the stability of biomolecules is known to be retained [106,107]. Therefore, in all the experimental of the interaction of L1L5 and complexes Q1Q15 with biomolecules, the final concentration of DMSO in the incubation mixture was ~2% (v/v). Thus, the effect of DMSO on the stability of the biomolecules are negligible.

3.7.1. DNA Absorption Spectral Study

The binding modes of L1L5 and complexes Q1Q15 to CT-DNA were characterized through electronic absorption titration by varying concentrations of CT-DNA (0–30 µM) in phosphate buffer saline solution against fixed concentrations (20 µM) of L1L5 and complexes Q1Q15. The compounds-CT-DNA mixture was incubated for 10 min before measuring the absorbance using UV-vis absorption spectroscopy [108]. The absorbance of CT-DNA is cancelled by adding equivalent amounts of CT-DNA to both the tested compounds and the reference solutions.
The compounds intrinsic binding constant, Kb were determined using Wolfe–Shimer equation as follows:
DNA ε a ε f = DNA ε b ε f = 1 ε b ε f
where [DNA], εa, εb, and εf are DNA concentration, apparent, fully bound complex, and free complex extinction coefficients, respectively. The ratio of the slope to the intercept from the plot of [DNA]/(εa − εf) against [DNA] gave the binding constant Kb of the compounds.

3.7.2. Luminescence Competitive Displacement Study

Ethidium bromide (EB) is one of the most sensitive fluorescent probes which can bind to DNA through intercalation. Competitive binding of complexes Q1Q15 to DNA with EB could provide information with regards to the DNA-binding affinity.
A competitive displacement study was carried out using fluorescence spectroscopy between CT-DNA pre-treated with ethidium bromide (EB) and complexes Q1Q15 to establish the complexes′ actual mode of binding to CT-DNA. Ethidium bromide in buffer solution has low fluorescence intensity due to fluorescence quenching of the free ethidium bromide by the solvent molecule, but on binding through intercalation to DNA, its emission intensity is drastically enhanced [109]. The competitive luminescence displacement assay was done using a modified method [91]. Pre-treated 15 µM solution of EB with 15 µM of CT-DNA was prepared in a phosphate buffer of pH 7.2 and left to equilibrate for 30 min. Keeping CT-DNA-EB concentrations constant, different concentrations (0–20 µM) of the complexes were added at 8 min incubation interval at room temperature. The fluorescence quenching ability of CT-DNA bound EB by the complexes were recorded in the wavelength range of 530–700 nm with an excitation wavelength at 525 nm at 25 °C.
F o F = 1 + K S V Q = 1 + K q τ o Q
A Stern–Volmer (Equation (6)) was used to evaluate the CT-DNA-EB fluorescence quenching of the complexes. Where Fo and F denote the relative fluorescence intensities of CT-DNA in the absence and presence of the quencher, Ksv, Stern–Volmer quenching constant, [Q], quencher concentration, Kq, bimolecular quenching constant and τo, average lifetime of the fluorophore in the absence of the quencher which is typically equal to 10−8 s in biomacromolecules.

3.7.3. Albumin Binding Assay Using Absorption Spectroscopy Titration

The absorbance assay of albumin binding is a very simple method used in identifying the conformational changes in protein. The studies aimed at the binding of bioactive compounds with protein to provide useful information on their biodistribution, toxicity, and mechanism of action [18]. A stock solution of bovine serum albumin (BSA) was prepared by dissolving an appropriate amount of BSA in phosphate buffer saline solution (pH 7.2) under constant stirring for 1 h at 25 °C. It was kept at 4 °C and used within four days. The BSA concentration was determined spectrophotometrically by using ε280 = 44300 M−1 cm−1 absorption coefficient. The stock solution of the complex was prepared by dissolving 1 mmol of the complexes in DMSO. The absorption titration assay was done by adding different concentrations (0–10 µM) of the complexes to a constant BSA concentration (6 µM). The sample solution was incubated after each addition of the concentrations for 10 min at 25 °C before recording the absorbance at λmax 280 nm. Binding constant Kb was calculated from the intercept to the slope ratio of 1/[A-A°] vs. 1/[complex] linear curve where A and A° represent BSA absorbance in the presence and absence of complexes, respectively [86].

3.7.4. Albumin Binding Studies Using Fluorescence Quenching Method

A solution of 1 µM of BSA was titrated against various concentrations of the complexes (0–35 µM) and incubated for 8 min at 25 °C. BSA was excited at 280 nm and emitted at 346 nm wavelength [92]. Ksv constant was determined from the Stern–Volmer equation:
I o / I = 1 + K q   τ o   Q = 1 + K s v Q
where Io and I represent the intensities of the fluorescence in the presence and absence of the quencher respectively while Kq, Ksv, τo, [Q] represent the BSA quenching rate constant, dynamic quenching constant, the average lifetime of BSA without the quencher (τo = 10−8 s) and concentration of quencher, respectively.

3.8. Cytotoxicity Evaluation

In vitro cell viability with cultured cells is a method commonly used for cytotoxicity activities of potential anticancer compounds due to reduced cost speed, and potential for automation, and tests using human cells other than some in vivo animal tests [110]. The significant effect the perchlorate anion has on the complexes’ biological activities, as seen in the antimicrobial, antioxidant, DNA and protein binding assays prompted the choice of complexes to be assayed for cytotoxicity activity. Therefore, the cytotoxicity of some selected complexes; Q6, Q7, Q9, and cisplatin as reference standard was evaluated on four human cell lines, human embryonic kidney 293 (HEK293), cervical cancer cell line (HELA), breast cancer cell line (MDA-MB231), and neuronal cancer cell line (SHSY5Y).
The cytotoxicity assay was conducted as per the standard method and as described by Abrahams et al. 2018 [111]. Briefly, 96-well microtiter plates were seeded with HEK293 (non -cancerous cell line), HELA, MDA-MB231, and SHSY5Y at a concentration of 1 × 10⁵ cells/mL and allowed to stabilize for 4 h at 37 °C and 5% CO2. Thereafter, Q6, Q7, Q9, and cisplatin were added to the plate through twofold serial dilution to allow for eight final compound concentrations ranging from 100 to 0.781 µM in a total volume of 200 µL / well. The plate was then incubated for 72 h at 37 °C and 5% CO2. To each well, 20 µL CellTiter 96 AQueous One Solution (Promega, Madison, WI, USA) was added and the plates were incubated for 4 h as previously described. Thereafter, absorbance was read at 490 nm on a multiplate reader (Molecular Devices, San Jose, CA, USA). EC50 values were determined as the concentration of each compound required to reduce cell viability by 50% and were calculated using GraphPad Prism 8 (2019) (GraphPad Software, San Diego, CA, USA). The values recorded are averages of at least three separate experiments (n = 3).

4. Conclusions

Herein, we have described the synthesis and characterization of silver(I) complexes of five quinolinyl imine. The influence of the quinolinyl imine variable substituents and silver(I) anion on the interaction of the compounds with Ct-DNA, protein, and their antimicrobial, antioxidant, and cytotoxicity activities were evaluated. The antimicrobial evaluation data revealed that all the complexes had moderate to excellent antibacterial activity and complexes [Ag(L2)2]ClO4 Q7 and [Ag(L3)2]ClO4 Q8 showed remarkable antimicrobial activity compare to the standard ciprofloxacin against all the bacteria tested. The ligands of each of [Ag(L2)2]ClO4 Q7 and [Ag(L3)2]ClO4 Q8 possess either the benzothiazole moiety or the p-chloro substituent, and both complexes have perchlorate as the anion, which could have enhanced their antimicrobial activity. Similarly, complexes with notable antimicrobial activity also displayed good antioxidant activity than the ascorbic acid (2.68 mg/mL) as seen in Q2, Q4, Q5, Q6, Q7, Q9, Q10, and Q13 with IC50 between 0.95 and 2.22 mg/mL. In the absorption and emission spectral of the interaction of the compounds with CT-DNA and bovine serum albumin, the results indicate that the compounds bind to CT-DNA via intercalation mode due to the planarity of the chelating ligand and the competitive study with ethidium bromide shows that the complexes can displace EB from the CT-DNA-EB adduct and compete for the DNA-binding sites with EB, which is usually characteristic of the intercalative interaction of compounds with DNA.
Further study demonstrated that the complexes exhibit a moderate affinity for protein and the possible quenching mechanism between the complexes and bovine serum albumin is static. Thus, [Ag(L1)2]NO3 Q1, [Ag(L1)2]ClO4 Q6 and [Ag(L1)2]CF3SO3 Q11 can be stored in protein and can be easily released in desired target areas.
Complexes [Ag(L2)2]ClO4 Q7 and [Ag(L4)2]ClO4 Q9 with benzothiazole moiety and Methyl substituent respectively displayed a remarkable cytotoxicity activity especially towards Hela (cervical cancer cell line) ca. two times better than the cisplatin standard and five times than [Ag(L1)2]ClO4 Q6 with fluorine substituent and a trigonal geometry.
Based on the remarkable biological activities recorded for silver(I) quinolinyl Schiff base derivatives in this study, Ag(I) quinolinyl Schiff bases tend to be promising candidates for the development of novel anticancer, antioxidant, and antibiotics drugs.

Supplementary Materials

The following are available online at https://www.mdpi.com/1420-3049/26/5/1205/s1, Figures S1–S22: Electronic absorption spectra of L1L5, silver salts and Q1Q15 at 5.0 × 10⁵ M in the absence (dashed line) and the presence of difference concentrations of CT-DNA, Figures S23–S39: The fluorescence spectra of EB-CT-DNA in the absence (dashed line) and the presence of different concentration of silver salts and Q1Q15, Figures S40–S56: The double-logarithmic plot of EB-CT-DNA–Complex Q1Q15 and silver salts interaction, Figures S57–S73: Electronic Absorption Spectra of BSA in the absence (dashed line) and the presence of different concentrations of Q1Q15 and silver salts, Figures S74 and S75: Fluorescence emission spectra of BSA in the absence(dashed line) and the presence of different concentration of complex Q1 and Q6, Figures S76 and S77: The double-logarithmic plot of BSA–Complex Q1 and Q11 interactions, Figures S78–S97: 1H NMR spectra of L1L5 and Q1Q15, Figures S98–S117: 13C NMR spectra of L1L5 and Q1Q15, Figures S118–S137: IR spectra of L1L5 and Q1Q5, Figure S138-S157: Mass Spec. spectra of L1L5 and Q1Q15, Table S1: 1H-NMR chemical shifts of some protons in L1L5 complexes (Q1Q15) and the IR band of (C=N) and quinolinyl N for L1L5 and complexes Q1Q15, Table S2: Physical and chemical data of silver(I) complexes Q1Q15, Table S3: Crystal data and structure refinement for complexes Q1, Q6, Q7, Q12 and Q14.

Author Contributions

B.O. conceived and designed the experiments; A.A.A. carried out the synthesis, characterized the synthesized compounds, carried out the in vitro cytotoxicity, CT-DNA, and protein binding studies; B.O. and S.J.Z. reported the crystal structures; M.S.I., K.O., and V.F.S. carried out the in vitro antioxidant experiment; C.M. and A.A.A. performed the in vitro antimicrobial assay. A.A.A. drafted the manuscript; B.O. revised the manuscript. All authors have read and agreed to the published version of the manuscript.

Funding

This research was funded by the National Research Foundation of South Africa (Grant number: 119342) and the APC was funded by National Research Foundation of South Africa.

Acknowledgments

Adesola A. Adeleke acknowledges Olabisi Onabanjo University, Ago-Iwoye, for granting her study leave to pursue the programme at the University of KwaZulu-Natal. The authors would like to appreciate the University of KwaZulu-Natal and the National Research Foundation of South Africa (Grant number: 119342) for their financial assistance for Adesola A. Adeleke.

Conflicts of Interest

The authors declare no conflict of interest.

Disclosure Statement

No potential conflict of interest was reported by the authors.

References

  1. Bine, F.K.; Nkungli, N.K.; Numbonui, T.S.; Numbonui Ghogomu, J. Structural Properties and Reactive Site Selectivity of Some Transition Metal Complexes of 2,2’(1E,1’E)-(ethane-1,2-diylbis(azan-1-yl-1-ylidene))bis(phenylmethan-1-yl-1-yli dene)dibenzoic Acid: DFT, Conceptual DFT, QTAIM, and MEP Studies. Bioinorg. Chem. Appl. 2018, 2018, 4510648. [Google Scholar] [CrossRef] [PubMed] [Green Version]
  2. Manna, A.K.; Rout, K.; Chowdhury, S.; Patra, G.K. A dual-mode highly selective and sensitive Schiff base chemosensor for fluorescent colorimetric detection of Ni(2+) and colorimetric detection of Cu(2). Photochem. Photobiol. Sci. 2019, 18, 1512–1525. [Google Scholar] [CrossRef] [PubMed]
  3. Khandar, A.A.; Afkhami, F.A.; Hosseini-Yazdi, S.A.; White, J.M.; Kassel, S.; Dougherty, W.G.; Lipkowski, J.; van Derveer, D.; Giester, G.; Costantino, F. Anion influence in the structural diversity of cadmium coordination polymers constructed from a pyridine based Schiff base ligand. Inorg. Chim. Acta 2015, 427, 87–96. [Google Scholar] [CrossRef]
  4. Kajal, A.; Bala, S.; Kamboj, S.; Sharma, N.; Saini, V. Schiff Bases: A Versatile Pharmacophore. J. Catal. 2013, 2013, 1–14. [Google Scholar] [CrossRef] [Green Version]
  5. Garrido Montalban, A. Quinolines and Isoquinolines. Heterocycl. Nat. Prod. Synth. 2011, 299–339. [Google Scholar] [CrossRef]
  6. Kouznetsov, V.V.; Meléndez Gómez, C.M.; Peña, J.L.V.; Vargas-Méndez, L.Y. Natural and synthetic quinoline molecules against tropical parasitic pathologies: An analysis of activity and structural evolution for developing new quinoline-based antiprotozoal agents. In Discovery and Development of Therapeutics from Natural Products against Neglected Tropical Diseases; Elsevier: Amsterdam, The Netherlands, 2019; pp. 87–164. [Google Scholar] [CrossRef]
  7. Rajesh, Y.B. Quinoline Heterocycles: Synthesis and Bioactivity. In Heterocycles-Synthesis and Biological Activities; IntechOpen: London, UK, 2018. [Google Scholar] [CrossRef] [Green Version]
  8. Casal, J.J.; Asís, S.E. Natural and synthetic quinoline derivatives as anti-tuberculosis agents. Austin Tuberc. Res. Treat. 2017, 2, 1007–1010. [Google Scholar]
  9. Kumar, S.; Bawa, S.; Gupta, H. Biological activities of quinoline derivatives. Mini Rev. Med. Chem. 2009, 9, 1648–1654. [Google Scholar] [CrossRef]
  10. Adsule, S.; Barve, V.; Chen, D.; Ahmed, F.; Dou, Q.P.; Padhye, S.; Sarkar, F.H. Novel Schiff base copper complexes of quinoline-2 carboxaldehyde as proteasome inhibitors in human prostate cancer cells. J. Med. Chem. 2006, 49, 7242–7246. [Google Scholar] [CrossRef]
  11. Beyzaei, H.; Moghadam, H.H.; Bagherzade, G.; Aryan, R.; Moghaddam-Manesh, M. Synthesis and In Vitro Antibacterial Evaluation of Schiff Bases Derived from 2-Chloro-3-Quinolinecarboxaldehyde. Avicenna J. Med. Biochem. 2019, 7, 9–15. [Google Scholar] [CrossRef]
  12. Sakthi, M.; Ramu, A. Synthesis, structure, DNA/BSA binding and antibacterial studies of NNO tridentate Schiff base metal complexes. J. Mol. Struct. 2017, 1149, 727–735. [Google Scholar] [CrossRef]
  13. Shivakumar, L.; Shivaprasad, K.; Revanasiddappa, H.D. SODs, DNA binding and cleavage studies of new Mn(III) complexes with 2-((3-(benzyloxy)pyridin-2-ylimino)methyl)phenol. Spectrochim. Acta A Mol. Biomol. Spectrosc. 2013, 107, 203–212. [Google Scholar] [CrossRef] [PubMed]
  14. Ommenya, F.K.; Nyawade, E.A.; Andala, D.M.; Kinyua, J. Synthesis, Characterization and Antibacterial Activity of Schiff Base, 4-Chloro-2-{(E)-[(4-Fluorophenyl)imino]methyl}phenol Metal (II) Complexes. J. Chem. 2020, 2020, 1–8. [Google Scholar] [CrossRef]
  15. Buldurun, K.; Turan, N.; Savcı, A.; Çolak, N. Synthesis, structural characterization and biological activities of metal(II) complexes with Schiff bases derived from 5-bromosalicylaldehyde: Ru(II) complexes transfer hydrogenation. J. Saudi Chem. Soc. 2019, 23, 205–214. [Google Scholar] [CrossRef]
  16. Lapasam, A.; Kollipara, M.R. A survey of crystal structures and biological activities of platinum group metal complexes containing N-acylthiourea ligands. Phosphorus Sulfur Silicon Relat. Elem. 2020, 195, 1–26. [Google Scholar] [CrossRef]
  17. Al-Hamdani, A.A.S.; BALKHI, A.; Falah, A.; Shaker, S.A. New Azo-Schiff Base Derived with Ni (II), Co (II), Cu (II), Pd (II) and Pt (II) Complexes: Preparation, Spectroscopic Investigation, Structural Studies and Biological Activity. J. Chil. Chem. Soc. 2015, 60, 2774–2785. [Google Scholar] [CrossRef] [Green Version]
  18. Duric, S.Z.; Vojnovic, S.; Andrejevic, T.P.; Stevanovic, N.L.; Savic, N.D.; Nikodinovic-Runic, J.; Glisic, B.D.; Djuran, M.I. Antimicrobial Activity and DNA/BSA Binding Affinity of Polynuclear Silver(I) Complexes with 1,2-Bis(4-pyridyl)ethane/ethene as Bridging Ligands. Bioinorg. Chem. Appl. 2020, 2020, 3812050. [Google Scholar] [CrossRef] [PubMed] [Green Version]
  19. Medici, S.; Peana, M.; Crisponi, G.; Nurchi, V.M.; Lachowicz, J.I.; Remelli, M.; Zoroddu, M.A. Silver coordination compounds: A new horizon in medicine. Coord. Chem. Rev. 2016, 327, 349–359. [Google Scholar] [CrossRef]
  20. Liao, C.; Li, Y.; Tjong, S.C. Bactericidal and Cytotoxic Properties of Silver Nanoparticles. Int. J. Mol. Sci. 2019, 20, 449. [Google Scholar] [CrossRef] [Green Version]
  21. Abdel-Rahman, L.H.; Adam, M.S.S.; Abu-Dief, A.M.; Moustafa, H.; Basha, M.T.; Aboraia, A.S.; Al-Farhan, B.S.; Ahmed, H.E. Synthesis, theoretical investigations, biocidal screening, DNA binding, in vitro cytotoxicity and molecular docking of novel Cu(II), Pd(II) and Ag(I) complexes of chlorobenzylidene Schiff base: Promising antibiotic and anticancer agents. Appl. Organomet. Chem. 2018, 32, e4527. [Google Scholar] [CrossRef]
  22. Kyros, L.; Kourkoumelis, N.; Kubicki, M.; Male, L.; Hursthouse, M.B.; Verginadis, I.I.; Gouma, E.; Karkabounas, S.; Charalabopoulos, K.; Hadjikakou, S.K. Structural properties, cytotoxicity, and anti-inflammatory activity of silver(I) complexes with tris(p-tolyl)phosphine and 5-chloro-2-mercaptobenzothiazole. Bioinorg. Chem. Appl. 2010, 2010, 386860. [Google Scholar] [CrossRef]
  23. Radko, L.; Stypula-Trebas, S.; Posyniak, A.; Zyro, D.; Ochocki, J. Silver(I) Complexes of the Pharmaceutical Agents Metronidazole and 4-Hydroxymethylpyridine: Comparison of Cytotoxic Profile for Potential Clinical Application. Molecules 2019, 24, 1949. [Google Scholar] [CrossRef] [PubMed] [Green Version]
  24. Kalinowska-Lis, U.; Felczak, A.; Checinska, L.; Szablowska-Gadomska, I.; Patyna, E.; Malecki, M.; Lisowska, K.; Ochocki, J. Antibacterial Activity and Cytotoxicity of Silver(I) Complexes of Pyridine and (Benz)Imidazole Derivatives. X-ray Crystal Structure of [Ag(2,6-di(CH2OH)py)2]NO3. Molecules 2016, 21, 87. [Google Scholar] [CrossRef] [PubMed] [Green Version]
  25. Njogu, E.M.; Omondi, B.; Nyamori, V.O. Silver(I)-pyridinyl Schiff base complexes: Synthesis, characterisation and antimicrobial studies. J. Mol. Struct. 2017, 1135, 118–128. [Google Scholar] [CrossRef]
  26. Wu, H.; Yang, Z.; Chen, C.; Zhang, J.; Zhang, H.; Peng, H.; Wang, F. Synthesis, crystal structures, antioxidant activities, and DNA-binding studies of two silver(I) complexes with 1,3-bis(1-ethylbenzimidazol-2-yl)-2-thiapropane, andα,β-unsaturated carboxylates. J. Coord. Chem. 2016, 69, 1076–1087. [Google Scholar] [CrossRef]
  27. Aleksić, M.; Kapetanović, V. An overview of the optical and electrochemical methods for detection of DNA-drug interactions. Acta Chim. Slov. 2014, 61, 555–573. [Google Scholar] [PubMed]
  28. Alagesan, M.; Bhuvanesh, N.S.P.; Dharmaraj, N. Potentially cytotoxic new copper(ii) hydrazone complexes: Synthesis, crystal structure and biological properties. Dalton Trans. 2013, 42, 7210. [Google Scholar] [CrossRef] [PubMed]
  29. Adeleke, A.A.; Islam, M.S.; Sanni, O.; Mocktar, C.; Zamisa, S.J.; Omondi, B. Aryl variation and anion effect on CT-DNA binding and in vitro biological studies of pyridinyl Ag(I) complexes. J. Inorg. Biochem. 2021, 214, 111266. [Google Scholar] [CrossRef] [PubMed]
  30. Ammar, R.A.; Alaghaz, A.N.; Alturiqi, A.S. New dimeric Schiff base quinoline complexes: Synthesis, spectral characterization, electrochemistry and cytotoxicity. Appl. Organomet. Chem. 2018, 32, e4361. [Google Scholar] [CrossRef]
  31. Wang, A.; Fan, R.; Dong, Y.; Chen, W.; Song, Y.; Wang, P.; Hao, S.; Liu, Z.; Yang, Y. (E)-4-Methyl-N-((quinolin-2-yl)ethylidene)aniline as ligand for IIB supramolecular complexes: Synthesis, structure, aggregation-induced emission enhancement and application in PMMA-doped hybrid material. Dalton Trans. 2017, 46, 71–85. [Google Scholar] [CrossRef]
  32. Pinto, M.N.; Chakraborty, I.; Sandoval, C.; Mascharak, P.K. Eradication of HT-29 colorectal adenocarcinoma cells by controlled photorelease of CO from a CO-releasing polymer (photoCORP-1) triggered by visible light through an optical fiber-based device. J. Control. Release 2017, 264, 192–202. [Google Scholar] [CrossRef]
  33. Liu, L.; Li, Y.; Deng, S.; Zhang, Y. A dysprosium(III) complex based on Schiff-base ligand exhibiting two magnetic relaxation processes. Inorg. Chim. Acta 2017, 457, 1–6. [Google Scholar] [CrossRef]
  34. Stenger-Smith, J.; Chakraborty, I.; Sameera, W.M.C.; Mascharak, P.K. Antimicrobial silver(I) complexes derived from aryl-benzothiazoles as turn-on sensors: Syntheses, properties and density functional studies. Inorg. Chim. Acta 2018, 471, 326–335. [Google Scholar] [CrossRef]
  35. Greenfield, J.L.; Rizzuto, F.J.; Goldberga, I.; Nitschke, J.R. Self-Assembly of Conjugated Metallopolymers with Tunable Length and Controlled Regiochemistry. Angew. Chem. Int. Ed. Engl. 2017, 56, 7541–7545. [Google Scholar] [CrossRef] [PubMed]
  36. Hannon, M.J.; Painting, C.L.; Alcock, N.W. A metallo-supramolecular double-helix containing a major and a minor groove. Chem. Commun. 1999, 2023–2024. [Google Scholar] [CrossRef]
  37. Zhu, G.; Zhang, X.; Zhao, M.; Wang, L.; Jing, C.; Wang, P.; Wang, X.; Wang, Q. Influences of Fluorine Substituents on Iminopyridine Fe(II)- and Co(II)-Catalyzed Isoprene Polymerization. Polymers 2018, 10, 934. [Google Scholar] [CrossRef] [PubMed] [Green Version]
  38. Gharamaleki, J.A.; Akbari, F.; Karbalaei, A.; Ghiassi, K.B.; Olmstead, M.M. Synthesis, Characterization and Crystal Structure of a New Schiff Base Ligand from a Bis(Thiazoline) Template and Hydrolytic Cleavage of the Imine Bond Induced by a Co(II) Cation. Open, J. Inorg. Chem. 2016, 6, 76–88. [Google Scholar] [CrossRef] [Green Version]
  39. Lashanizadegan, M.; Sarkheil, M. Solvent-dependent synthesis and mono-hydrolysis of di-Schiff base of (+/−)trans-1,2-cyclohexanediamine and 2-pyridinecarboxaldehyde in Cu(II), Co(II) and Zn(II) complexes. J. Serb. Chem. Soc. 2012, 77, 1589–1597. [Google Scholar] [CrossRef]
  40. Esmadi, F.T.; Khabour, O.F.; Abbas, K.; Mohammad, A.E.; Obeidat, R.T.; Mfady, D. Synthesis, characterization and biological activity of some unsymmetrical Schiff base transition metal complexes. Drug Chem. Toxicol. 2016, 39, 41–47. [Google Scholar] [CrossRef]
  41. Abd El-Halim, H.F.; Mohamed, G.G.; Anwar, M.N. Antimicrobial and anticancer activities of Schiff base ligand and its transition metal mixed ligand complexes with heterocyclic base. Appl. Organomet. Chem. 2018, 32, e3899. [Google Scholar] [CrossRef]
  42. Dehghanpour, S.; Mahmoudi, A. Synthesis, structure, and redox properties of copper(I) complexes with phenylpyridin-2-ylmethyleneamine derivatives. Main Group Chem. 2007, 6, 121–130. [Google Scholar] [CrossRef]
  43. Vallejos, J.; Brito, I.; Cardenas, A.; Bolte, M.; Conejeros, S.; Alemany, P.; Llanos, J. Self-Assembly of Discrete Metallocycles versus Coordination Polymers Based on Cu(I) and Ag(I) Ions and Flexible Ligands: Structural Diversification and Luminescent Properties. Polymers 2016, 8, 46. [Google Scholar] [CrossRef]
  44. Njogu, E.M.; Omondi, B.; Nyamori, V.O. Synthesis, physical and antimicrobial studies of ferrocenyl-N-(pyridinylmethylene)anilines and ferrocenyl-N-(pyridinylmethyl)anilines. S. Afr. J. Chem. 2016, 69, 51–66. [Google Scholar] [CrossRef]
  45. Njogu, E.M.; Omondi, B.; Nyamori, V.O. Coordination polymers and discrete complexes of Ag(I)-N-(pyridylmethylene)anilines: Synthesis, crystal structures and photophysical properties. J. Coord. Chem. 2017, 70, 2796–2814. [Google Scholar] [CrossRef]
  46. Njogu, E.M.; Omondi, B.; Nyamori, V.O. Silver(I)-pyridinyl Schiff base complexes: Synthesis, structural characterization and reactivity in ring-opening polymerisation of ε-caprolactone. Inorg. Chim. Acta 2017, 457, 160–170. [Google Scholar] [CrossRef]
  47. Argyle, V.J.; Woods, L.M.; Roxburgh, M.; Hanton, L.R. Triflate anion and ligand influences in silver(i) coordination polymers of four isomeric dipyridyl ketone oximes. CrystEngComm 2013, 15, 120–134. [Google Scholar] [CrossRef]
  48. Davis, T.L.; Watts, J.L.; Brown, K.J.; Hewage, J.S.; Treleven, A.R.; Lindeman, S.V.; Gardinier, J.R. Structural classification of metal complexes with three-coordinate centres. Dalton Trans. 2015, 44, 15408–15412. [Google Scholar] [CrossRef] [Green Version]
  49. Ahmad, S.; Georgieva, I.; Hanif, M.; Monim-Ul-Mehboob, M.; Munir, S.; Sohail, A.; Isab, A.A. Periodic DFT modeling and vibrational analysis of silver(I) cyanide complexes of thioureas. J. Mol. Model. 2019, 25, 90. [Google Scholar] [CrossRef]
  50. Njogu, E.M.; Martincigh, B.S.; Omondi, B.; Nyamori, V.O. Synthesis, characterization, antimicrobial screening and DNA binding of novel silver(I)-thienylterpyridine and silver(I)-furylterpyridine complexes. Appl. Organomet. Chem. 2018, 32, e4554. [Google Scholar] [CrossRef]
  51. Feazell, R.P.; Carson, C.E.; Klausmeyer, K.K. Variability in the structures of [4-(aminomethyl) pyridine] silver (I) complexes through effects of ligand ratio, anion, hydrogen bonding, and π-stacking. Inorg. Chem. 2006, 45, 935–944. [Google Scholar] [CrossRef]
  52. Santos, A.F.; Brotto, D.F.; Favarin, L.R.V.; Cabeza, N.A.; Andrade, G.R.; Batistote, M.; Cavalheiro, A.A.; Neves, A.; Rodrigues, D.C.M.; dos Anjos, A. Study of the antimicrobial activity of metal complexes and their ligands through bioassays applied to plant extracts. Rev. Bras. Farmacogn. 2014, 24, 309–315. [Google Scholar] [CrossRef] [Green Version]
  53. Tabacaru, A.; Pettinari, C.; Busila, M.; Dinica, R.M. New Antibacterial Silver(I) Coordination Polymers Based on a Flexible Ditopic Pyrazolyl-Type Ligand. Polymers 2019, 11, 1686. [Google Scholar] [CrossRef] [PubMed] [Green Version]
  54. Oladipo, S.D.; Omondi, B.; Mocktar, C. Synthesis and structural studies of nickel(II)- and copper(II)-N,N′-diarylformamidine dithiocarbamate complexes as antimicrobial and antioxidant agents. Polyhedron 2019, 170, 712–722. [Google Scholar] [CrossRef]
  55. Jadhav, G.R.; Deshmukh, D.G.; Medhane, V.J.; Gaikwad, V.B.; Bholay, A.D. 2,5-Disubstituted 1,3,4-oxadiazole derivatives of chromeno[4,3-b]pyridine: Synthesis and study of antimicrobial potency. Heterocycl. Commun. 2016, 22, 123–130. [Google Scholar] [CrossRef]
  56. Tariq, S.; Kamboj, P.; Amir, M. Therapeutic advancement of benzothiazole derivatives in the last decennial period. Arch. Pharm. 2019, 352, e1800170. [Google Scholar] [CrossRef] [Green Version]
  57. Desai, N.C.; Vaghani, H.V.; Patel, B.Y.; Karkar, T.J. Synthesis and Antimicrobial Activity of Fluorine Containing Pyrazole-clubbed Dihydropyrimidinones. Indian, J. Pharm. Sci. 2018, 80, 242–252. [Google Scholar] [CrossRef]
  58. Ibrahim, H.M.; Behbehani, H.; Elnagdi, M.H. Approaches towards the synthesis of a novel class of 2-amino-5-arylazonicotinate, pyridazinone and pyrido [2, 3-d] pyrimidine derivatives as potent antimicrobial agents. Chem. Cent. J. 2013, 7, 123. [Google Scholar] [CrossRef] [Green Version]
  59. Gopalakrishnan, M.; Thanusu, J.; Kanagarajan, V. Design, synthesis, spectral analysis and in vitro microbiological evaluation of 2-phenyl-3-(4,6-diarylpyrimidin-2-yl)thiazolidin-4-ones. J. Enzym. Inhib. Med. Chem. 2009, 24, 1088–1094. [Google Scholar] [CrossRef]
  60. Ali, R.; Siddiqui, N. Biological Aspects of Emerging Benzothiazoles: A Short Review. J. Chem. 2013, 2013, 1–12. [Google Scholar] [CrossRef]
  61. Shah, R.; Verma, P.K. Therapeutic importance of synthetic thiophene. Chem. Cent. J. 2018, 12, 137. [Google Scholar] [CrossRef] [Green Version]
  62. Zhang, J.-A.; Pan, M.; Zhang, J.-Y.; Zhang, H.-K.; Fan, Z.-J.; Kang, B.-S.; Su, C.-Y. Syntheses, structures and bioactivities of silver(I) complexes with a tridentate heterocyclic N- and S-ligand. Polyhedron 2009, 28, 145–149. [Google Scholar] [CrossRef]
  63. Phaniendra, A.; Jestadi, D.B.; Periyasamy, L. Free Radicals: Properties, Sources, Targets, and Their Implication in Various Diseases. Indian, J. Clin. Biochem. 2014, 30, 11–26. [Google Scholar] [CrossRef] [PubMed] [Green Version]
  64. Liguori, I.; Russo, G.; Curcio, F.; Bulli, G.; Aran, L.; Della-Morte, D.; Gargiulo, G.; Testa, G.; Cacciatore, F.; Bonaduce, D.; et al. Oxidative stress, aging, and diseases. Clin. Interv. Aging 2018, 13, 757–772. [Google Scholar] [CrossRef] [PubMed] [Green Version]
  65. Oladipo, S.D.; Mocktar, C.; Omondi, B. In vitro biological studies of heteroleptic Ag(I) and Cu(I) unsymmetrical N,N’-diarylformamidine dithiocarbamate phosphine complexes; the effect of the metal center. Arab. J. Chem. 2020, 13, 6379–6394. [Google Scholar] [CrossRef]
  66. Prakash Naik, H.R.; Rajappa, J.J.; Karmakar, B.; Raja Naika, H.; Ramachandra Naik, M. Synthesis of Fe(III) Complexes as Antioxidants and DNA Cleavage Protectors. Nat. Prod. Chem. Res. 2018, 6, 2. [Google Scholar]
  67. Jayanthi, E.; Anusuya, M.; Anusuya, R.; Thenmozhi, K.; Nagaveni, A.; Bhuvanesh, N.S.P. Synthesis, Structure and Antioxidant Activity of Mixed Ruthenium(III) Benzoyl Pyridine Complex. Asian, J. Chem. 2020, 32, 641–645. [Google Scholar] [CrossRef]
  68. Karekal, M.R.; Biradar, V.; Bennikallu Hire Mathada, M. Synthesis, characterization, antimicrobial, DNA cleavage, and antioxidant studies of some metal complexes derived from schiff base containing indole and quinoline moieties. Bioinorg. Chem. Appl. 2013, 2013, 315972. [Google Scholar] [CrossRef] [Green Version]
  69. Irshad, M.; Zafaryab, M.; Singh, M.; Rizvi, M.M. Comparative Analysis of the Antioxidant Activity of Cassia fistula Extracts. Int. J. Med. Chem. 2012, 2012, 157125. [Google Scholar]
  70. Martín, J. An overview on ligands of therapeutically interest. Pharm. Pharmacol. Int. J. 2018, 6, 198–214. [Google Scholar] [CrossRef] [Green Version]
  71. Sodhi, R.K.; Paul, S. Metal Complexes in Medicine: An Overview and Update from Drug Design Perspective. Cancer Ther. Oncol. Int. J. 2019, 14. [Google Scholar] [CrossRef]
  72. Sharma, V.; Jaiswal, P.K.; Saran, M.; Yadav, D.K.; Mathur, M.; Swami, A.K.; Misra, S.; Kim, M.H.; Chaudhary, S. Discovery of C-3 Tethered 2-oxo-benzo[1,4]oxazines as Potent Antioxidants: Bio-Inspired Based Design, Synthesis, Biological Evaluation, Cytotoxic, and in Silico Molecular Docking Studies. Front. Chem. 2018, 6, 56. [Google Scholar] [CrossRef]
  73. Racané, L.; Ptiček, L.; Fajdetić, G.; Tralić-Kulenović, V.; Klobučar, M.; Pavelić, S.K.; Perić, M.; Paljetak, H.Č.; Verbanac, D.; Starčević, K. Green synthesis and biological evaluation of 6-substituted-2-(2-hydroxy/methoxy phenyl)benzothiazole derivatives as potential antioxidant, antibacterial and antitumor agents. Bioorg. Chem. 2020, 95, 103537. [Google Scholar]
  74. Kizilkaya, H.; Dag, B.; Aral, T.; Genc, N.; Erenler, R. Synthesis, characterization, and antioxidant activity of heterocyclic Schiff bases. J. Chin. Chem. Soc. 2020, 67, 1696–1701. [Google Scholar] [CrossRef]
  75. Miri, R.; Bohlooli, F.; Razzaghi-Asl, N.; Ebadi, A. Molecular Modeling of indeno [1, 2-b] quinoline-9, 11-diones as cytotoxic agents. Iran. J. Pharm. Sci. 2018, 17, 1249. [Google Scholar]
  76. Li, L.J.; Yan, Q.Q.; Liu, G.J.; Yuan, Z.; Lv, Z.H.; Fu, B.; Han, Y.J.; Du, J.L. Synthesis characterization and cytotoxicity studies of platinum(II) complexes with reduced amino pyridine schiff base and its derivatives as ligands. Biosci. Biotechnol. Biochem. 2017, 81, 1081–1089. [Google Scholar] [CrossRef] [PubMed] [Green Version]
  77. Banti, C.N.; Giannoulis, A.D.; Kourkoumelis, N.; Owczarzak, A.M.; Poyraz, M.; Kubicki, M.; Charalabopoulos, K.; Hadjikakou, S.K. Mixed ligand-silver(I) complexes with anti-inflammatory agents which can bind to lipoxygenase and calf-thymus DNA, modulating their function and inducing apoptosis. Metallomics 2012, 4, 545–560. [Google Scholar] [CrossRef] [PubMed]
  78. Murugavel, S.; Stephen, C.J.P.; Subashini, R.; AnanthaKrishnan, D. Synthesis, structural elucidation, antioxidant, CT-DNA binding and molecular docking studies of novel chloroquinoline derivatives: Promising antioxidant and anti-diabetic agents. J. Photochem. Photobiol. B 2017, 173, 216–230. [Google Scholar] [CrossRef] [PubMed]
  79. Tomosaka, H.; Omata, S.; Hasegawa, E.; Anzai, K. The effects of substituents introduced into 9-aminoacridine on frameshift mutagenicity and DNA binding affinity. Biosci. Biotechnol. Biochem. 1997, 61, 1121–1125. [Google Scholar] [CrossRef] [Green Version]
  80. Daravath, S.; Rambabu, A.; Shankar, D.S. Structure elucidation of copper(II), cobalt(II) and nickel(II) complexes of benzothiazole derivatives: Investigation of DNA binding, nuclease efficacy, free radical scavenging and biocidal properties. Chem. Data Collect. 2019, 24, 100293. [Google Scholar] [CrossRef]
  81. Rendosova, M.; Vargova, Z.; Kuchar, J.; Sabolova, D.; Levoca, S.; Kudlacova, J.; Paulikova, H.; Hudecova, D.; Helebrandtova, V.; Almasi, M.; et al. New silver complexes with bioactive glycine and nicotinamide molecules—Characterization, DNA binding, antimicrobial and anticancer evaluation. J. Inorg. Biochem. 2017, 168, 1–12. [Google Scholar] [CrossRef]
  82. Kazemi, Z.; Rudbari, H.A.; Mirkhani, V.; Sahihi, M.; Moghadam, M.; Tangestaninejad, S.; Mohammadpoor-Baltork, I. Synthesis, characterization, crystal structure, DNA- and HSA-binding studies of a dinuclear Schiff base Zn(II) complex derived from 2-hydroxynaphtaldehyde and 2-picolylamine. J. Mol. Struct. 2015, 1096, 110–120. [Google Scholar] [CrossRef]
  83. Saeidifar, M.; Sohrabi Jam, Z.; Shahraki, S.; Khanlarkhani, A.; Javaheri, M.; Divsalar, A.; Mansouri-Torshizi, H.; Akbar Saboury, A. Multi-spectroscopic and electrochemical approaches of the interaction between a new binuclear agent and DNA. J. Biomol. Struct. Dyn. 2017, 35, 2557–2564. [Google Scholar] [CrossRef] [PubMed]
  84. Vanekova, Z.; Hubcik, L.; Toca-Herrera, J.L.; Furtmuller, P.G.; Mucaji, P.; Nagy, M. Analysis of Binding Interactions of Ramipril and Quercetin on Human Serum Albumin: A Novel Method in Affinity Evaluation. Molecules 2020, 25, 547. [Google Scholar] [CrossRef] [PubMed] [Green Version]
  85. Abeydeera, N.; Perera, I.C.; Perera, T. Synthesis, Characterization, and BSA-Binding Studies of Novel Sulfonated Zinc-Triazine Complexes. Bioinorg. Chem. Appl. 2018, 7563820, 1–7. [Google Scholar]
  86. Anjomshoa, M.; Fatemi, S.J.; Torkzadeh-Mahani, M.; Hadadzadeh, H. DNA- and BSA-binding studies and anticancer activity against human breast cancer cells (MCF-7) of the zinc(II) complex coordinated by 5,6-diphenyl-3-(2-pyridyl)-1,2,4-triazine. Spectrochim. Acta A Mol. Biomol. Spectrosc. 2014, 127, 511–520. [Google Scholar] [CrossRef]
  87. Zhang, F.; Lin, Q.; Li, S.; Zhao, Y.; Wang, P.; Chen, M. Synthesis, interaction with DNA and bovine serum albumin of the transition metal complexes of demethylcantharate and 2-aminobenzothiazole. Spectrochim. Acta Part A 2012, 98, 436–443. [Google Scholar] [CrossRef]
  88. Kumar, R.R.; Ramesh, R. Synthesis, molecular structure and electrochemical properties of nickel(ii) benzhydrazone complexes: Influence of ligand substitution on DNA/protein interaction, antioxidant activity and cytotoxicity. RSC Adv. 2015, 5, 101932–101948. [Google Scholar] [CrossRef]
  89. Soares, F.; Ceschi, M.; Franceschini, D.; do Canto, V.; Netz, P.; Campo, L. Tianeptine Esters Derivatives: A Study of Protein-Drug Interaction Performed by Fluorescence Quenching and Molecular Docking. J. Braz. Chem. Soc. 2019, 30, 2125–2135. [Google Scholar] [CrossRef]
  90. Crouse, H.F.; Potoma, J.; Nejrabi, F.; Snyder, D.L.; Chohan, B.S.; Basu, S. Quenching of tryptophan fluorescence in various proteins by a series of small nickel complexes. Dalton Trans. 2012, 41, 2720–2731. [Google Scholar] [CrossRef] [Green Version]
  91. Gomathi, A.; Vijayan, P.; Viswanathamurthi, P.; Suresh, S.; Nandhakumar, R.; Hashimoto, T. Organoruthenium(II) compounds with pyridyl benzoxazole/benzthiazole moiety: Studies on DNA/protein binding and enzyme mimetic activities. J. Coord. Chem. 2017, 70, 1645–1666. [Google Scholar] [CrossRef]
  92. Hong, M.; Geng, H.; Niu, M.; Wang, F.; Li, D.; Liu, J.; Yin, H. Organotin(IV) complexes derived from Schiff base N’-[(1E)-(2-hydroxy-3-methoxyphenyl)methylidene]pyridine-4-carbohydrazone: Synthesis, in vitro cytotoxicities and DNA/BSA interaction. Eur. J. Med. Chem. 2014, 86, 550–561. [Google Scholar] [CrossRef]
  93. Saeed, S.; Rashid, N.; Jones, P.G.; Ali, M.; Hussain, R. Synthesis, characterization and biological evaluation of some thiourea derivatives bearing benzothiazole moiety as potential antimicrobial and anticancer agents. Eur. J. Med. Chem. 2010, 45, 1323–1331. [Google Scholar] [CrossRef] [PubMed]
  94. Sreelatha, T.; Kandhasamy, S.; Dinesh, R.; Shruthy, S.; Shweta, S.; Mukesh, D.; Karunagaran, D.; Balaji, R.; Mathivanan, N.; Perumal, P.T. Synthesis and SAR study of novel anticancer and antimicrobial naphthoquinone amide derivatives. Bioorg. Med. Chem. Lett. 2014, 24, 3647–3651. [Google Scholar] [CrossRef] [PubMed]
  95. El-Tabl, A.S.; Mohamed Abd El-Waheed, M.; Wahba, M.A.; Abou El-Fadl, A.E.H. Synthesis, Characterization, and Anticancer Activity of New Metal Complexes Derived from 2-Hydroxy-3-(hydroxyimino)-4-oxopentan-2-ylidene)benzohydrazide. Bioinorg. Chem. Appl. 2015, 126023, 1–14. [Google Scholar] [CrossRef] [PubMed] [Green Version]
  96. Dong, Y.; Fan, R.; Chen, W.; Wang, P.; Yang, Y. A simple quinolone Schiff-base containing CHEF based fluorescence ‘turn-on’ chemosensor for distinguishing Zn(2+) and Hg(2+) with high sensitivity, selectivity and reversibility. Dalton Trans. 2017, 46, 6769–6775. [Google Scholar] [CrossRef] [PubMed]
  97. Dong, Y.; Wang, P.; Fan, R.; Chen, W.; Wang, A.N.; Yang, Y. Different conjugated system Cd(II)/Hg(II) Schiff base complexes: Syntheses, supramolecular metal−organic frameworks, luminescent properties and DFT study. J. Coord. Chem. 2017, 70, 1953–1972. [Google Scholar] [CrossRef]
  98. Bruker AXS Inc. Data Reduction Software; Bruker AXS Inc.: Madison, WI, USA, 2009. [Google Scholar]
  99. Bruker AXS Inc. Saint and SADABS.; Bruker AXS Inc.: Madison, WI, USA, 2009. [Google Scholar]
  100. Sheldrick, G.M. Crystal structure solution with SHELXT. Acta Crystallogr. A 2015, 71, 3–8. [Google Scholar] [CrossRef] [PubMed] [Green Version]
  101. Farrugia, L. WinGX and ORTEP for Windows: An update. J. Appl. Cryst. 2012, 45, 849–854. [Google Scholar] [CrossRef]
  102. Sheldrick, G.M. Crystal structure refinement with SHELXL. Acta Crystallogr. C Struct. Chem. 2015, 71, 3–8. [Google Scholar] [CrossRef]
  103. Nayak, S.G.; Poojary, B. Synthesis of novel Schiff bases containing arylpyrimidines as promising antibacterial agents. Heliyon 2019, 5, e02318. [Google Scholar] [CrossRef] [Green Version]
  104. El Jemli, M.; Kamal, R.; Marmouzi, I.; Zerrouki, A.; Cherrah, Y.; Alaoui, K. Radical-Scavenging Activity and Ferric Reducing Ability of Juniperus thurifera (L.), J. oxycedrus (L.), J. phoenicea (L.) and Tetraclinis articulata (L.). Adv. Pharmacol. Sci. 2016, 6392656, 1–6. [Google Scholar]
  105. Raman, N.; Sakthivel, A.; Jeyamurugan, R. Synthesis, characterization, DNA binding, photo-induced DNA cleavage, and antimicrobial activity of metal complexes of a Schiff base derived frombis(3-aminophenyl)malonamide. J. Coord. Chem. 2009, 62, 3969–3985. [Google Scholar] [CrossRef]
  106. Tayyab, S.; Min, L.H.; Kabir, M.Z.; Kandandapani, S.; Ridzwan, N.F.W.; Mohamad, S.B. Exploring the interaction mechanism of a dicarboxamide fungicide, iprodione with bovine serum albumin. Chem. Pap. 2019, 74, 1633–1646. [Google Scholar] [CrossRef]
  107. Sharma, N.K.; Ameta, R.K.; Singh, M. Biological Impact of Pd (II) Complexes: Synthesis, Spectral Characterization, In Vitro Anticancer, CT-DNA Binding, and Antioxidant Activities. Int. J. Med. Chem. 2016, 2016, 1–10. [Google Scholar]
  108. Abdel-Rahman, L.H.; Abu-Dief, A.M.; El-Khatib, R.M.; Abdel-Fatah, S.M.; Seleem, A.A. New Cd(II), Mn(II) and Ag(I) Schiff Base Complexes: Synthesis, Characterization, DNA Binding and Antimicrobial Activity. IJNC 2016, 2, 83–91. [Google Scholar] [CrossRef]
  109. Vamsikrishna, N.; Kumar, M.P.; Ramesh, G.; Ganji, N.; Daravath, S. DNA interactions and biocidal activity of metal complexes of benzothiazole Schiff bases: Synthesis, characterization and validation. J. Chem. Sci. 2017, 129, 609–622. [Google Scholar] [CrossRef] [Green Version]
  110. Aslantürk, Ö.S. In Vitro Cytotoxicity and Cell Viability Assays: Principles, Advantages, and Disadvantages; IntechOpen: London, UK, 2018. [Google Scholar]
  111. Abrahams, S.; Mosebi, S.; Fish, M.Q.; Papathanasopoulos, M.A.; Hewer, R. Screening of the NIH Clinical Collection for inhibitors of HIV-1 integrase activity. S. Afr. J. Chem. 2018, 114, 1–5. [Google Scholar]
Scheme 1. Synthesis of Q1Q15 under constant magnetic stirring in anhydrous ethanol.
Molecules 26 01205 sch001
Figure 1. (a): Electronic absorption spectra of L1 and Complexes Q1, Q6 and Q11, (b) Electronic absorption spectra of L2 and Complexes Q2, Q7 and Q12, (c) Electronic absorption spectra of L3 and Complexes Q3, Q8 and Q13, (d) Electronic absorption spectra of L4 and Complexes Q4, Q9 and Q14, (e) Electronic absorption spectra of L5 and Complexes Q5, Q10 and Q15.
Molecules 26 01205 g001aMolecules 26 01205 g001b
Figure 2. The ORTEP diagrams showing the atom numbering scheme with the thermal ellipsoids drawn at the 50% probability level for molecule of complexes (a) Q1, (b) Q6, (c) Q7, (d) Q12, and (e) Q14. Hydrogen atoms have been omitted for clarity.
Molecules 26 01205 g002aMolecules 26 01205 g002b
Figure 3. (a) Minimum inhibitory concentration (µg/mL) of L1L5 silver(I) complexes with nitrate as counter anion, (b) Minimum inhibitory concentration (µg/mL) of L1L5 silver(I) complexes with perchlorate as counter anion, and (c) Minimum inhibitory concentration (µg/mL) of L1L5 silver(I) complexes with triflate as counter anion.
Molecules 26 01205 g003aMolecules 26 01205 g003b
Figure 4. FRAP % free radical scavenging vs. Concentration (mg/mL) of complexes Q1Q15, silver nitrate, silver perchlorate, silver triflate, and Ascorbic Acid. AgN = silver nitrate, AgC = silver perchlorate, AgF = silver triflate and As = Ascorbic acid values represent mean ± standard deviation (n = 3). a–f Different alphabets over the bars for a given concentration for each complex represent significant difference (Tukey′s-HSD multiple range post hoc test, p < 0.05).
Molecules 26 01205 g004
Figure 5. (a) Electronic Absorption Spectra of complex Q8 at 3.0 × 10⁶ M in the absence (dashed line) and the presence of different concentrations of CT-DNA (0–3.0 × 10⁵ M) at 303 nm λmax. (inset) A Stern–Volmer plot of Q8 interaction with CT- DNA. (b) Fluorescence spectra of EB-CT-DNA in the absence (dashed line) and the presence of a different concentration of complex Q8. (inset) The stern–Volmer plot of Q8 interaction with EB-CT- DNA. (c) Stern–Volmer plot of Complexes Q1Q15 interaction with EB-CT- DNA. (d) The double-logarithmic plot of Complex Q10.
Molecules 26 01205 g005aMolecules 26 01205 g005b
Figure 6. (a) Electronic Absorption Spectra of BSA in the absence (dashed line) and the presence of different concentrations of complexes Q12. (inset) Plot of 1/(Aₒ − A) vs. 1/[Complex] × 10−4 M−1. (b) Fluorescence emission spectra of BSA in the absence(dashed line) and the presence of a different concentration of complex Q11. Inset: A Stern–Volmer plot of the interaction of Q11 with BSA. (c) The double-logarithmic plot of BSA–Complex Q6 interactions.
Molecules 26 01205 g006aMolecules 26 01205 g006b
Table 1. Selected geometric parameters for complexes Q1, Q6, Q7, Q12, and Q14.
Q1Q6Q7Q12Q14
Ag–Nim2.398 (16)2.400 (17) 2.317 (18)
Ag–Nqy2.240 (16)2.246 (18)2.37 (6)2.346 (3)2.321 (17)
Ag–Nam2.192 (16)2.208 (17)
Ag–Nth 2.37 (2)2.465 (3)
Ag–O 2.66 (6)2.587 (3)
2.397 (3)
2.609 (2)
2.233 (16)
Ag–Ag 3.06 (7)
N–Ag–N146.71 (6)
140.28 (6)
72.97 (6)
145.25 (6)
140.93 (6)
73.12 (6)
72.8 (4)70.42 (10)73.08 (6)
N–Ag–O 105.49 (2)
83.23 (2)
105.57 (10)
162.01 (10)
175.69 (9)
99.86 (10)
145.17 (6)
134.92 (6)
95.22 (6)
93.18 (6)
O–Ag–O 83.56 (9)101.85 (7)
Table 2. Minimum inhibitory concentration of Silver complexes of L1L5 (µg/mL).
CompoundsGram + Ve Bacteria Gram − Ve Bacteria
SAMRSAPASTECKP
L1100NANANA1000NA
L2NANA100NANA100
L3NA1000100NANA50
L4NANANA10001000NA
L5NANA10050NA100
Q125100025100500.2
Q2255012.550250.05
Q3505012.550250.05
Q412.55012.55012.50.8
Q5501006.2512.51.60.025
Q63.125251.62512.51.6
Q71.6500.250250.4
Q850250.1251.60.0125
Q95010006.255012.50.05
Q102510001.61006.2525
Q116.2510005025500.2
Q126.255012.550250.1
Q13255012.550250.1
Q145010000.850250.1
Q1512.51000.81000250.05
AgNO33.1250.212.510000.81000
AgClO43.1256.250.80.2251.6
AgCF3SO3NA1000100012.5501000
Ciprofloxacin s [54]25250.20.41.60.8
Table 3. In vitro antioxidant activities of L1L5 and Complexes Q1Q15 done in triplicate.
Antioxidant (IC50 mg/mL)
COMPOUNDFRAP
L122.42 ± 0.0048
L22.29 ± 0.0041
L320.35 ± 0.0047
L44.50 ± 0.0053
L53.79 ± 0.0052
Q14.97 ± 0.002
Q21.10 ± 0.0044
Q34.75 ± 0.0042
Q42.14 ± 0.0035
Q52.04 ± 0.0032
Q60.95 ± 0.003
Q71.13 ± 0.044
Q83.27 ± 0.093
Q91.62 ± 0.078
Q100.98 ± 0.055
Q116.27 ± 0.038
Q121.86 ± 0.024
Q132.22 ± 0.0055
Q143.55 ± 0.022
Q153.35 ± 0.012
AgNO31.43 ± 0.03
AgClO40.88 ± 0.051
AgCF3SO30.88 ± 0.054
Ascorbic Acid2.68 ± 0.11
Table 4. The binding parameters of complexes Q1Q15 interactions with CT-DNA, ethidium bromide, and bovine serum albumin.
Cmp.CT-DNA-Cmp.CT-DNA-EB-ComplexProtein-Complex
Kb (M−1) × 105R2Ksv (M−1) × 104Kq
(M−1S−1) × 1012
Kbin
(M−1) × 105
nKb
(M−1) × 104
Ksv
(M−1) × 104
Kq
(M−1S−1) × 1012
Kbin
(M−1) × 104
n
Q14.000.992.762.751.071.132.162.502.500.1170.69
Q23.000.992.682.685.031.277.97
Q315.70.993.933.939.171.295.11
Q44.000.993.503.502.111.1710.3
Q54.000.992.312.311.031.155.95
Q63.330.992.032.032.411.215.732.592.592.561.01
Q715.00.993.963.961.291.119.38
Q830.00.993.983.981.021.099.48
Q95.000.992.492.496.531.305.43
Q105.000.992.982.989.611.318.01
Q116.670.992.382.383.451.218.624.094.090.1380.68
Q124.500.993.143.142.121.1920.7
Q134.290.993.333.335.741.272.89
Q143.330.992.982.985.311.287.50
Q154.000.992.482.485.291.3013.1
AgNO33.000.993.123.124.501.244.49
AgClO43.300.993.313.316.001.264.82
AgCF3SO32.000.993.013.011.601.154.46
L11.380.96
L21.500.98
L37.500.97
L41.600.99
L51.170.98
R is the correlation coefficient.
Table 5. EC50 and SI values of the cytotoxic activity of complexes Q6, Q7, Q9, and cisplatin against various human cell lines.
CompoundEC50 ± Std Dev (µM)Selectivity Index (SI)
HEK293HELAMDA-MB231SHSY5YHELAMDA-MB231SHSY5Y
Cisplatin14.2 ± 3.8>5022.68 ± 4.8919.74 ± 3.770.280.630.72
Q6≥100≥100≥ 100≥1001.001.001.00
Q7≥10022.80 ± 3.1141.62 ± 4.2530.33 ± 4.674.392.403.30
Q9≥10022.34 ± 4.8638.84 ± 4.33 47.23 ± 3.344.482.572.12
EC50 value calculated as the compound concentration required to reduce cell viability by 50%. Std Dev = Standard deviation. n = 3 for all samples. SI values: selectivity index; calculated as the quotient of the EC50 value obtained in HEK293 over the EC50 value obtained in the respective cancer cell lines.
Publisher’s Note: MDPI stays neutral with regard to jurisdictional claims in published maps and institutional affiliations.

