
A Novel Fluorescent Probe for Hydrogen Peroxide and Its Application in Bio-Imaging


State Key Laboratory of Fine Chemicals, Dalian University of Technology, Dalian 116024, China
*
Author to whom correspondence should be addressed.
Molecules 2021, 26(11), 3352; https://doi.org/10.3390/molecules26113352
Submission received: 1 May 2021
/
Revised: 23 May 2021
/
Accepted: 28 May 2021
/
Published: 2 June 2021
(This article belongs to the Special Issue Explorations in Luminescent Complexes)
Abstract
:Hydrogen peroxide (H2O2) plays an important role in the human body and monitoring its level is meaningful due to the relationship between its level and diseases. A fluorescent sensor (CMB) based on coumarin was designed and its ability for detecting hydrogen peroxide by fluorescence signals was also studied. The CMB showed an approximate 25-fold fluorescence enhancement after adding H2O2 due to the interaction between the CMB and H2O2 and had the potential for detecting physiological H2O2. It also showed good biocompatibility and permeability, allowing it to penetrate cell membranes and zebrafish tissues, thus it can perform fluorescence imaging of H2O2 in living cells and zebrafish. This probe is a promising tool for monitoring the level of H2O2 in related physiological and pathological research.
1. Introduction
Reactive oxygen species (ROS) play important roles in a wide variety of biological functions [1,2], and its abnormal production or accumulation is also closely related to many physiological and pathological processes [3,4], especially, the concentration of ROS in cancer cells is much higher than that in normal cells. Hydrogen peroxide (H2O2), the least reactive and mildest oxidant among reactive oxygen species [5], can regulate many physiological processes in organisms and even affect the growth and development of cell [6,7,8]. It is produced in low levels during the metabolism of normal living cells and excessive H2O2 production or accumulation in vivo is also considered as the key contributor to many diseases [9,10,11]. H2O2 is overproduced when there is an exogenous stimulus or the content of antioxidants is severely reduced, which may be found in numerous diseases, such as cardiovascular disease and cancer [12,13,14]. Thus, it is significant to find a method that can detect and quantify the production of H2O2 to facilitate the diagnosis and treatment of diseases.
In recent years, various analytical methods that can detect hydrogen peroxide have been reported, such as fluorescence spectroscopy, electroanalysis, chemiluminescence, etc. [15]. The fluorescence detection method is paid much attention among many other analytical methods due to its characteristics of good selectivity, high sensitivity, quick response rate, as well as real-time detection [16,17,18]. It tends to be used for detecting and tracking certain biomolecules in cells or organisms [19] because of its non-invasiveness and ease of operation [20,21,22], and thus has great potential in detecting small molecules’ markers to help in the diagnosis of some diseases. Some fluorescent small-molecule probes for detecting ROS have been reported [23,24,25,26,27]. These studies proved the feasibility of using fluorescent small-molecule probes to detect H2O2 and can promote the development and progress of H2O2 probes, which may facilitate the realization of its applications in medicine.
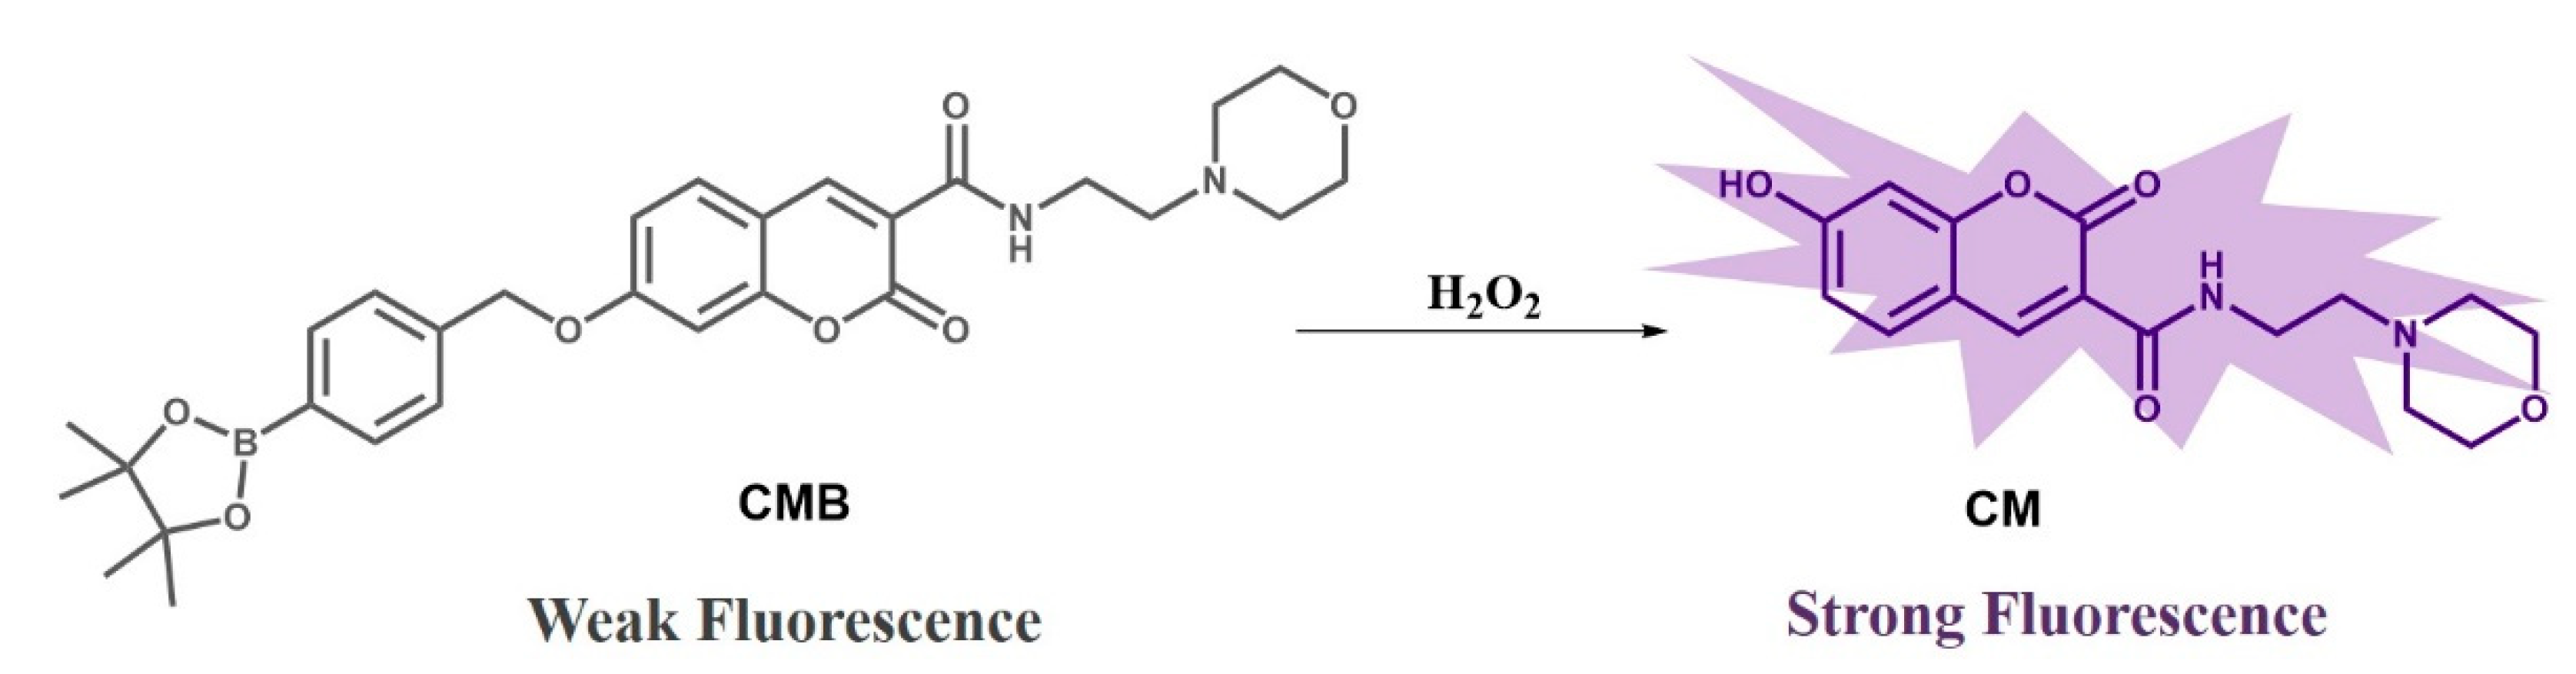
Herein, a smart small-molecule fluorescent probe, CMB, was designed and synthesized for H2O2 imaging in solution, cells, and zebrafish by employing coumarin as fluorophore and the boronate as the recognition group [28,29,30] (Scheme 1). A short alkyl chain is used to connect the morpholine group with coumarin to improve the biological applicability of the probe. The fluorescence signal of CMB would be enhanced in the presence of H2O2 due to the reaction between probe CMB and H2O2, and the good linear relationship between the fluorescence intensity and the concentration of H2O2 also facilitates its detection. Probe CMB can not only shows enhanced fluorescence signal to H2O2 with good selectivity, but also exhibits desirable imaging effects on H2O2 in cells and zebrafish, which indicates that CMB has the potential to monitor the content and level of hydrogen peroxide in biological systems.
2. Results and Discussion
2.1. Design Strategy of Probe CMB
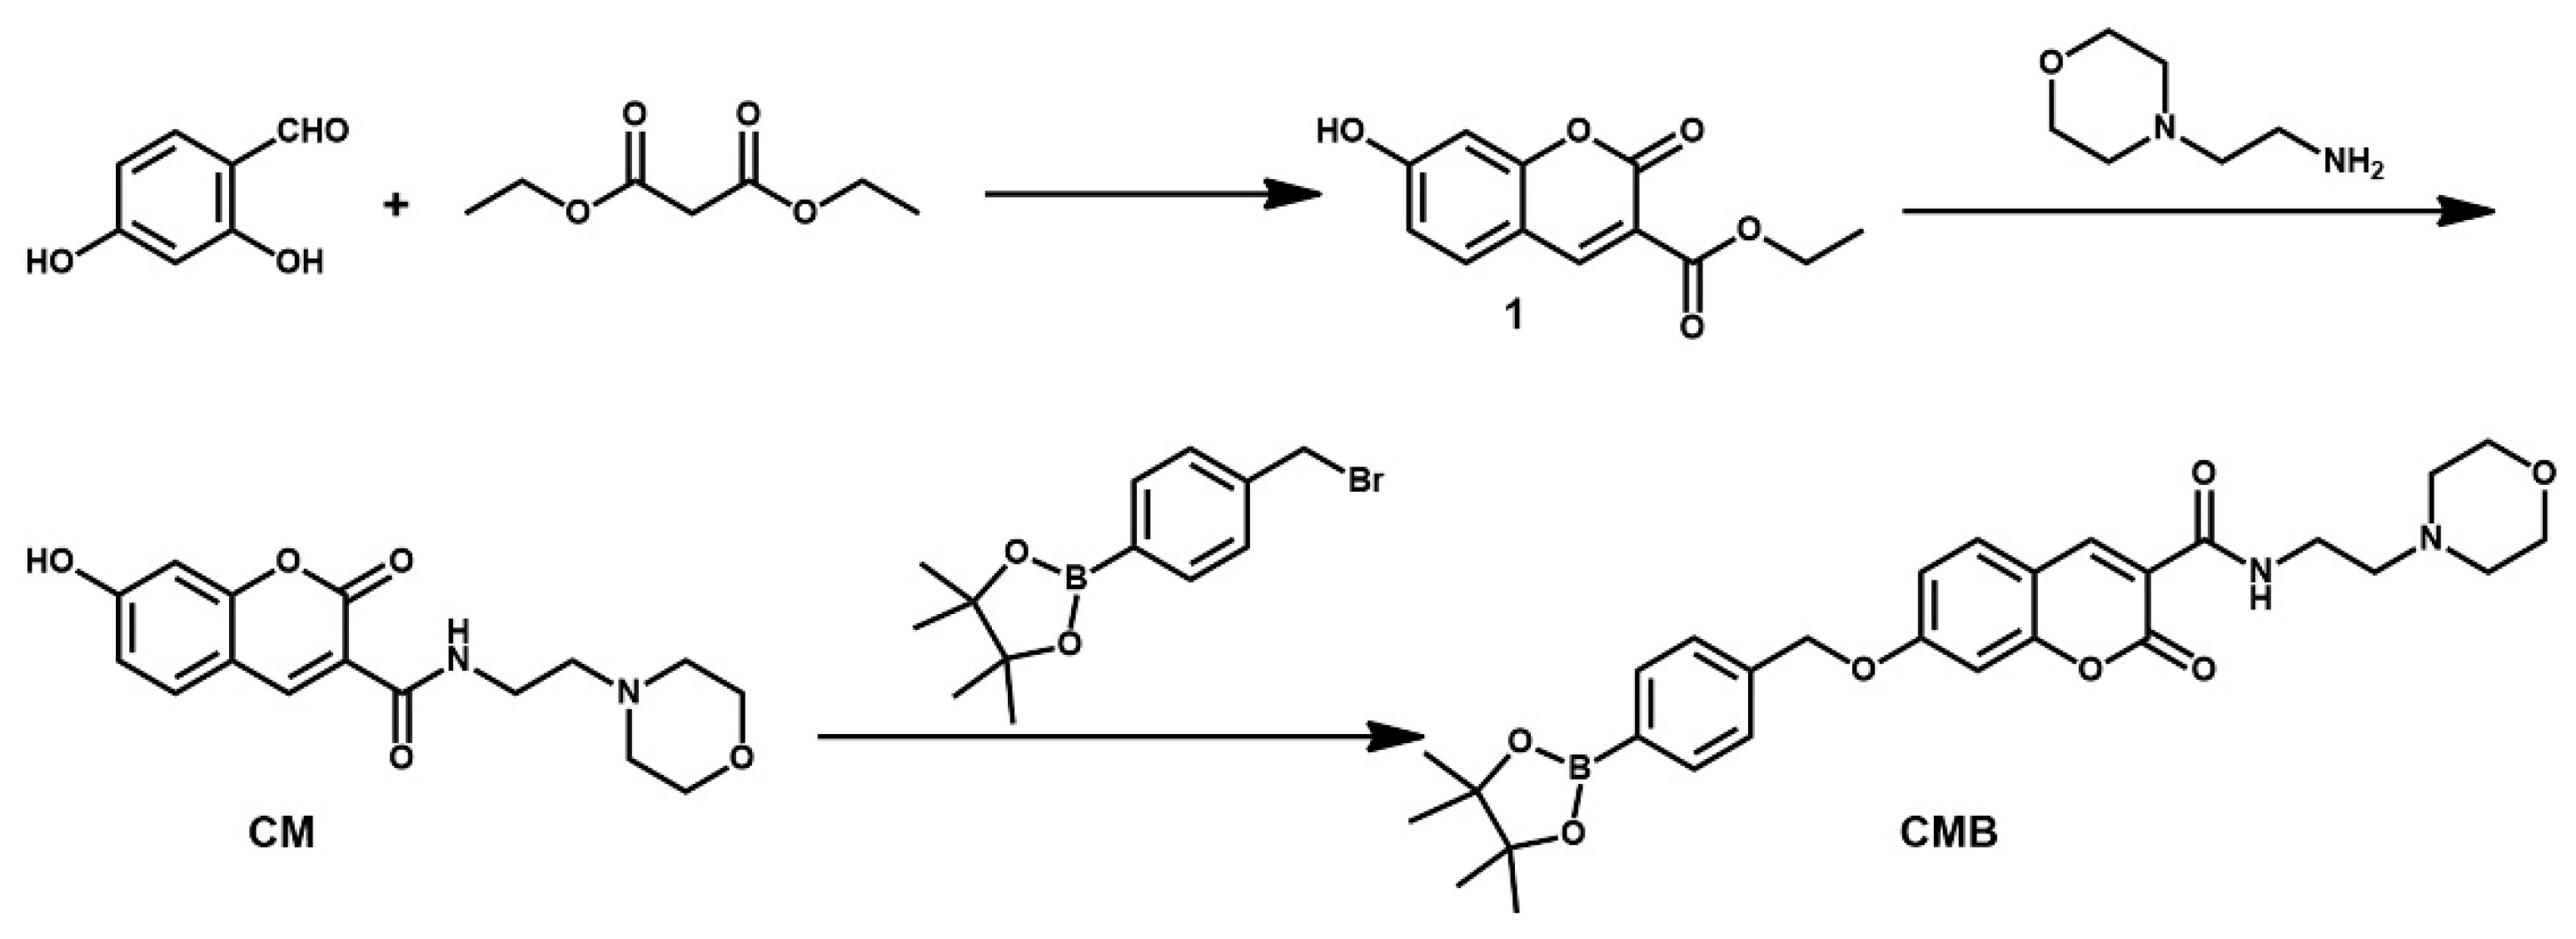
The probe CMB was designed and synthesized in three steps from the coumarin moiety (Scheme 2) that possesses excellent photo-physical properties [31,32]. The morpholine group can increase the solubility of the probe in water, thereby increasing biocompatibility and making it more beneficial for imaging in biological environments. The aryl boronate can be bound to the hydroxyl group of CM by the ether linkage strategy to form CMB and react with H2O2 as well as providing the specificity for H2O2 over other interference species [33,34]. The synthetic route of probe CMB was provided and shown in Scheme 2. The structure of CMB was accurately validated using the 1H NMR and HRMS analyses presented in the Supporting Information (Supplementary Figures S1–S4).
2.2. Optical Response of CMB to H2O2
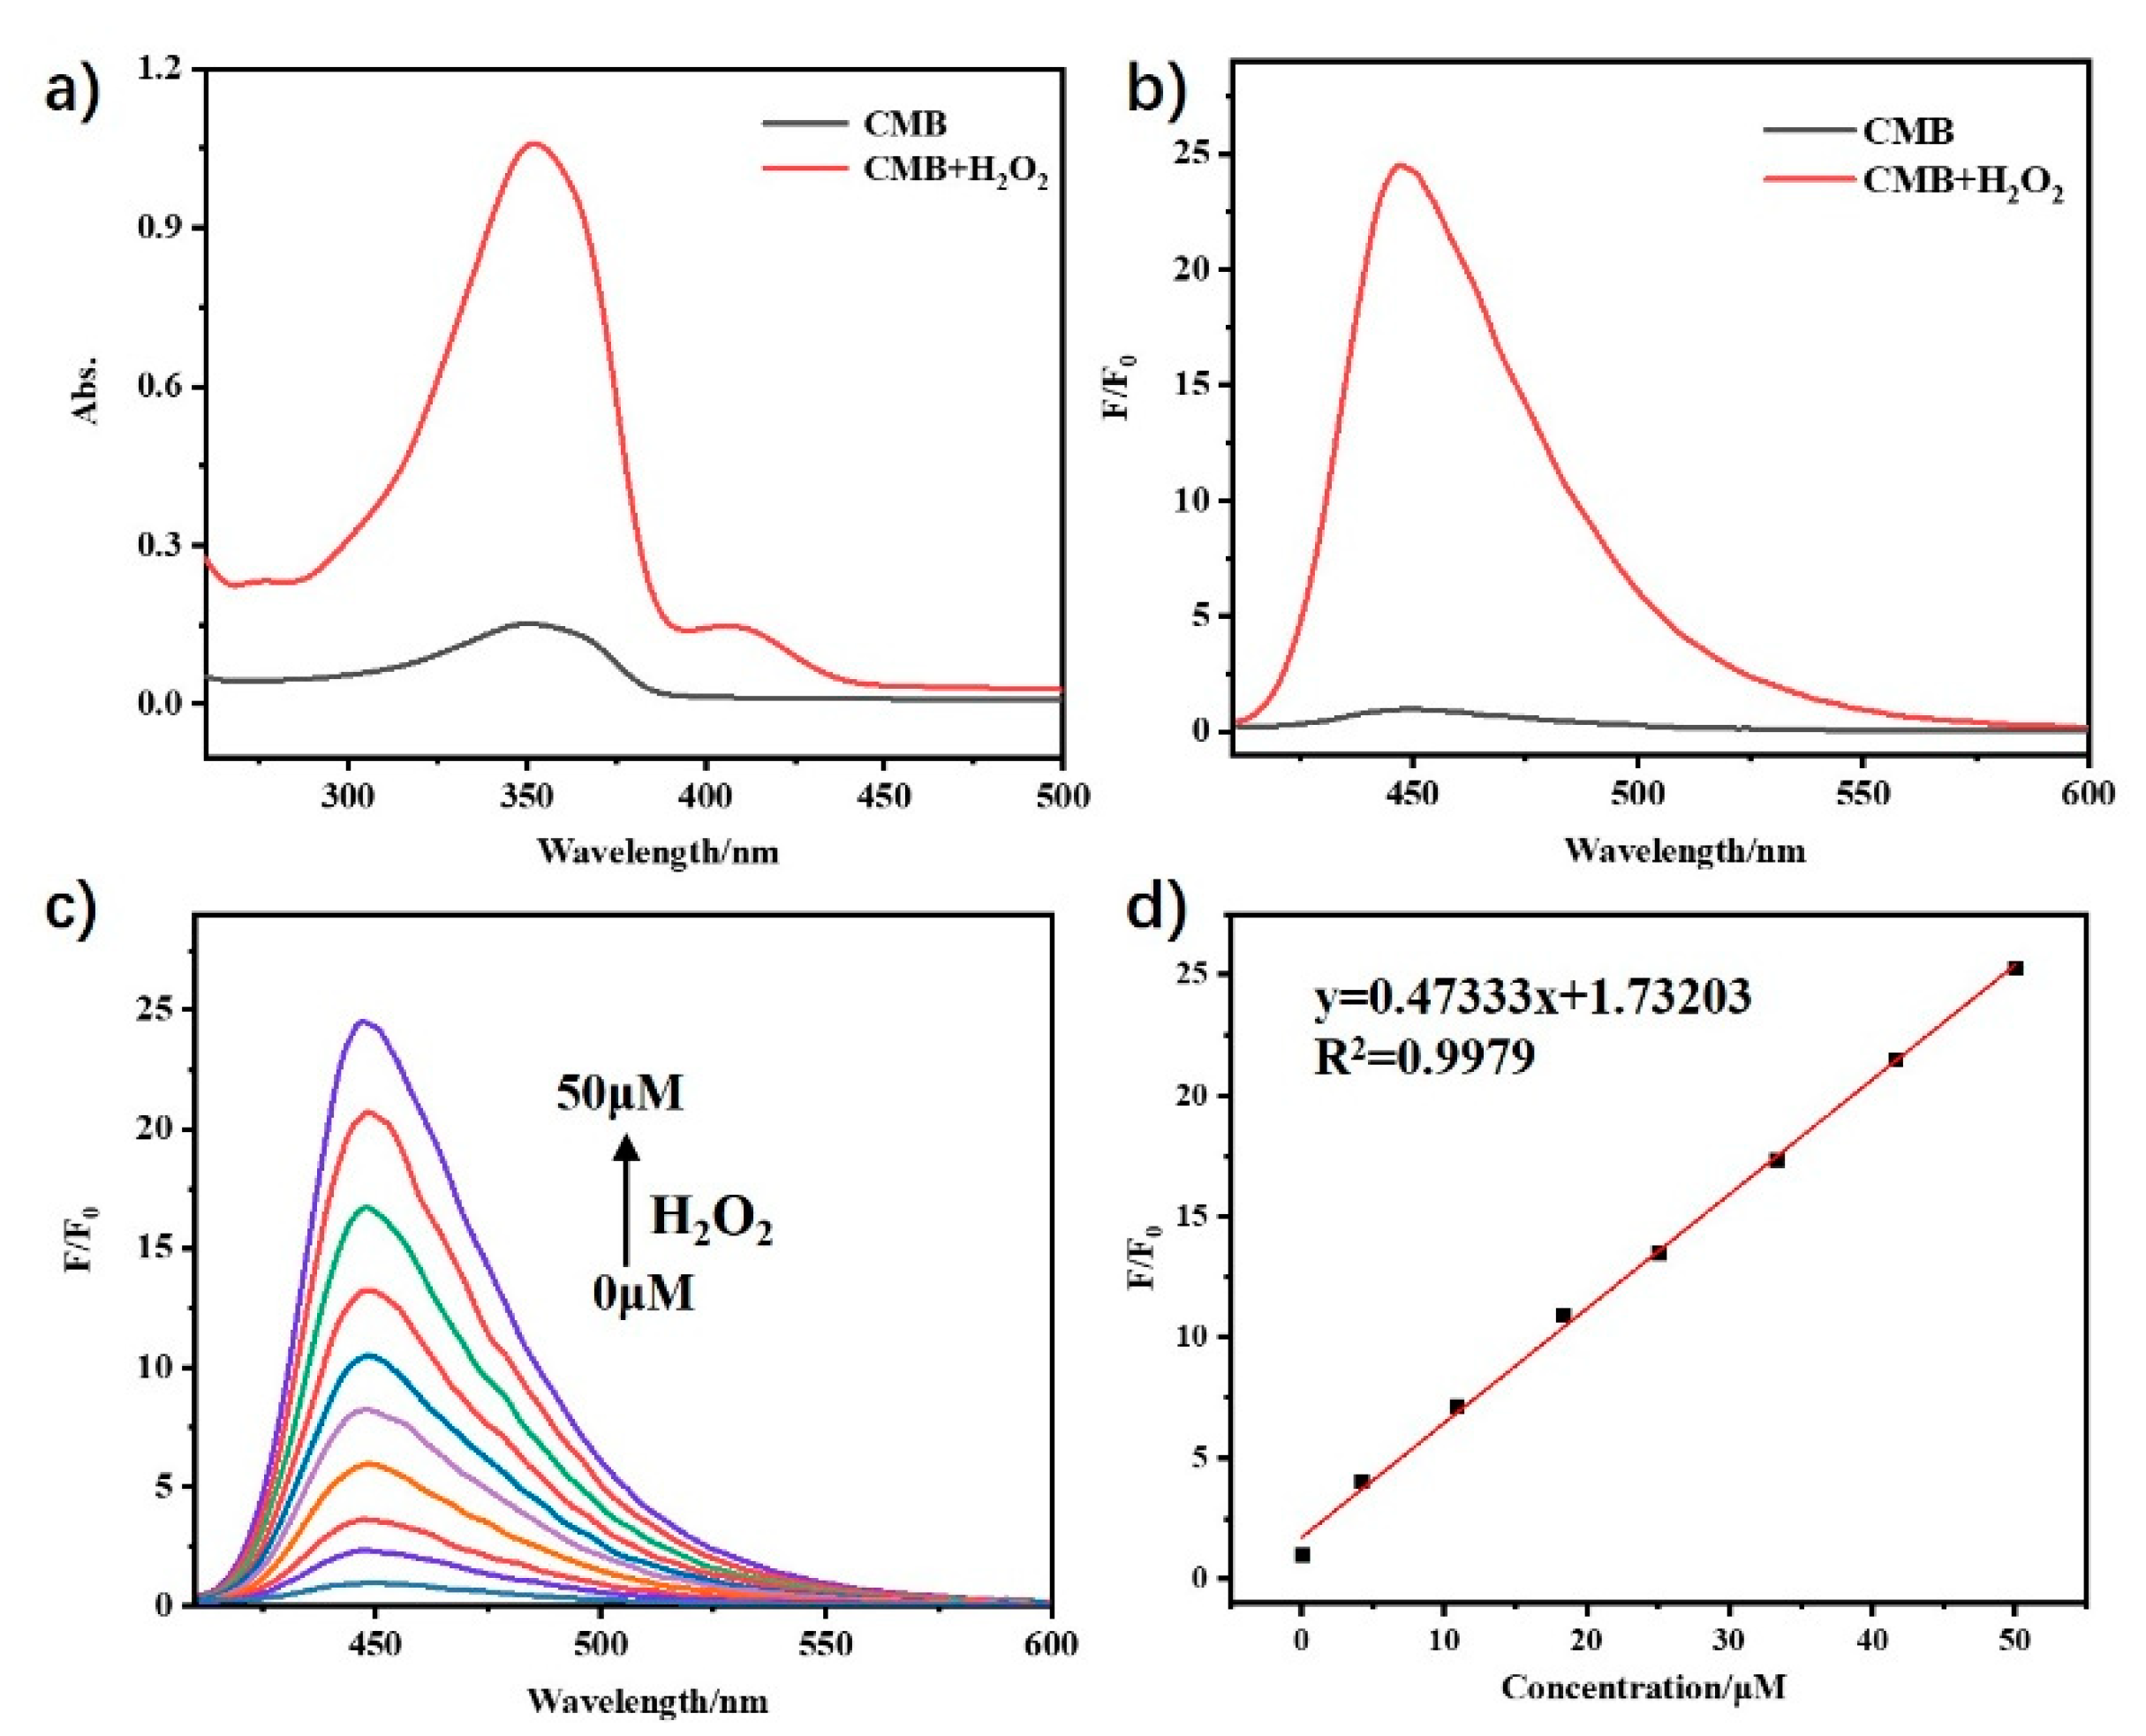
The UV-vis absorption and fluorescence emission spectra were both studied in acetonitrile/phosphate buffer (1:9 v/v, 10 mM, pH 7.4) at room temperature to test the optical properties of CMB in the presence or absence of H2O2. The UV-vis spectrum of the probe CMB (6 μM) showed a absorption band at 350 nm, then a new band appeared at 405 nm after being treated with H2O2 (Figure 1a), which may be attributed to the chemical structure change from CMB to CM. As shown in Figure 1b, CMB had only a very weak fluorescence when excited at 400 nm, while a significant increase in fluorescence was observed at 450 nm after adding H2O2. With the increase of hydrogen peroxide concentration, the fluorescence intensity of CMB increased by about 25-fold (Figure 1c). There is a good linear relationship between the fluorescence intensity and the concentration of H2O2 in the range of 0 to 50 μM with a correlation coefficient of 0.9979 (Figure 1d) and the detection limit was 0.13 μM, thus being able to be used for direct imaging of physiological H2O2 [23]. This fluorescence change may be attributed to the structural change from CMB to CM caused by the reaction with H2O2. The good “off–on” response of CMB toward H2O2 showed its potential for detection of H2O2 and may realize the detection of H2O2 level.
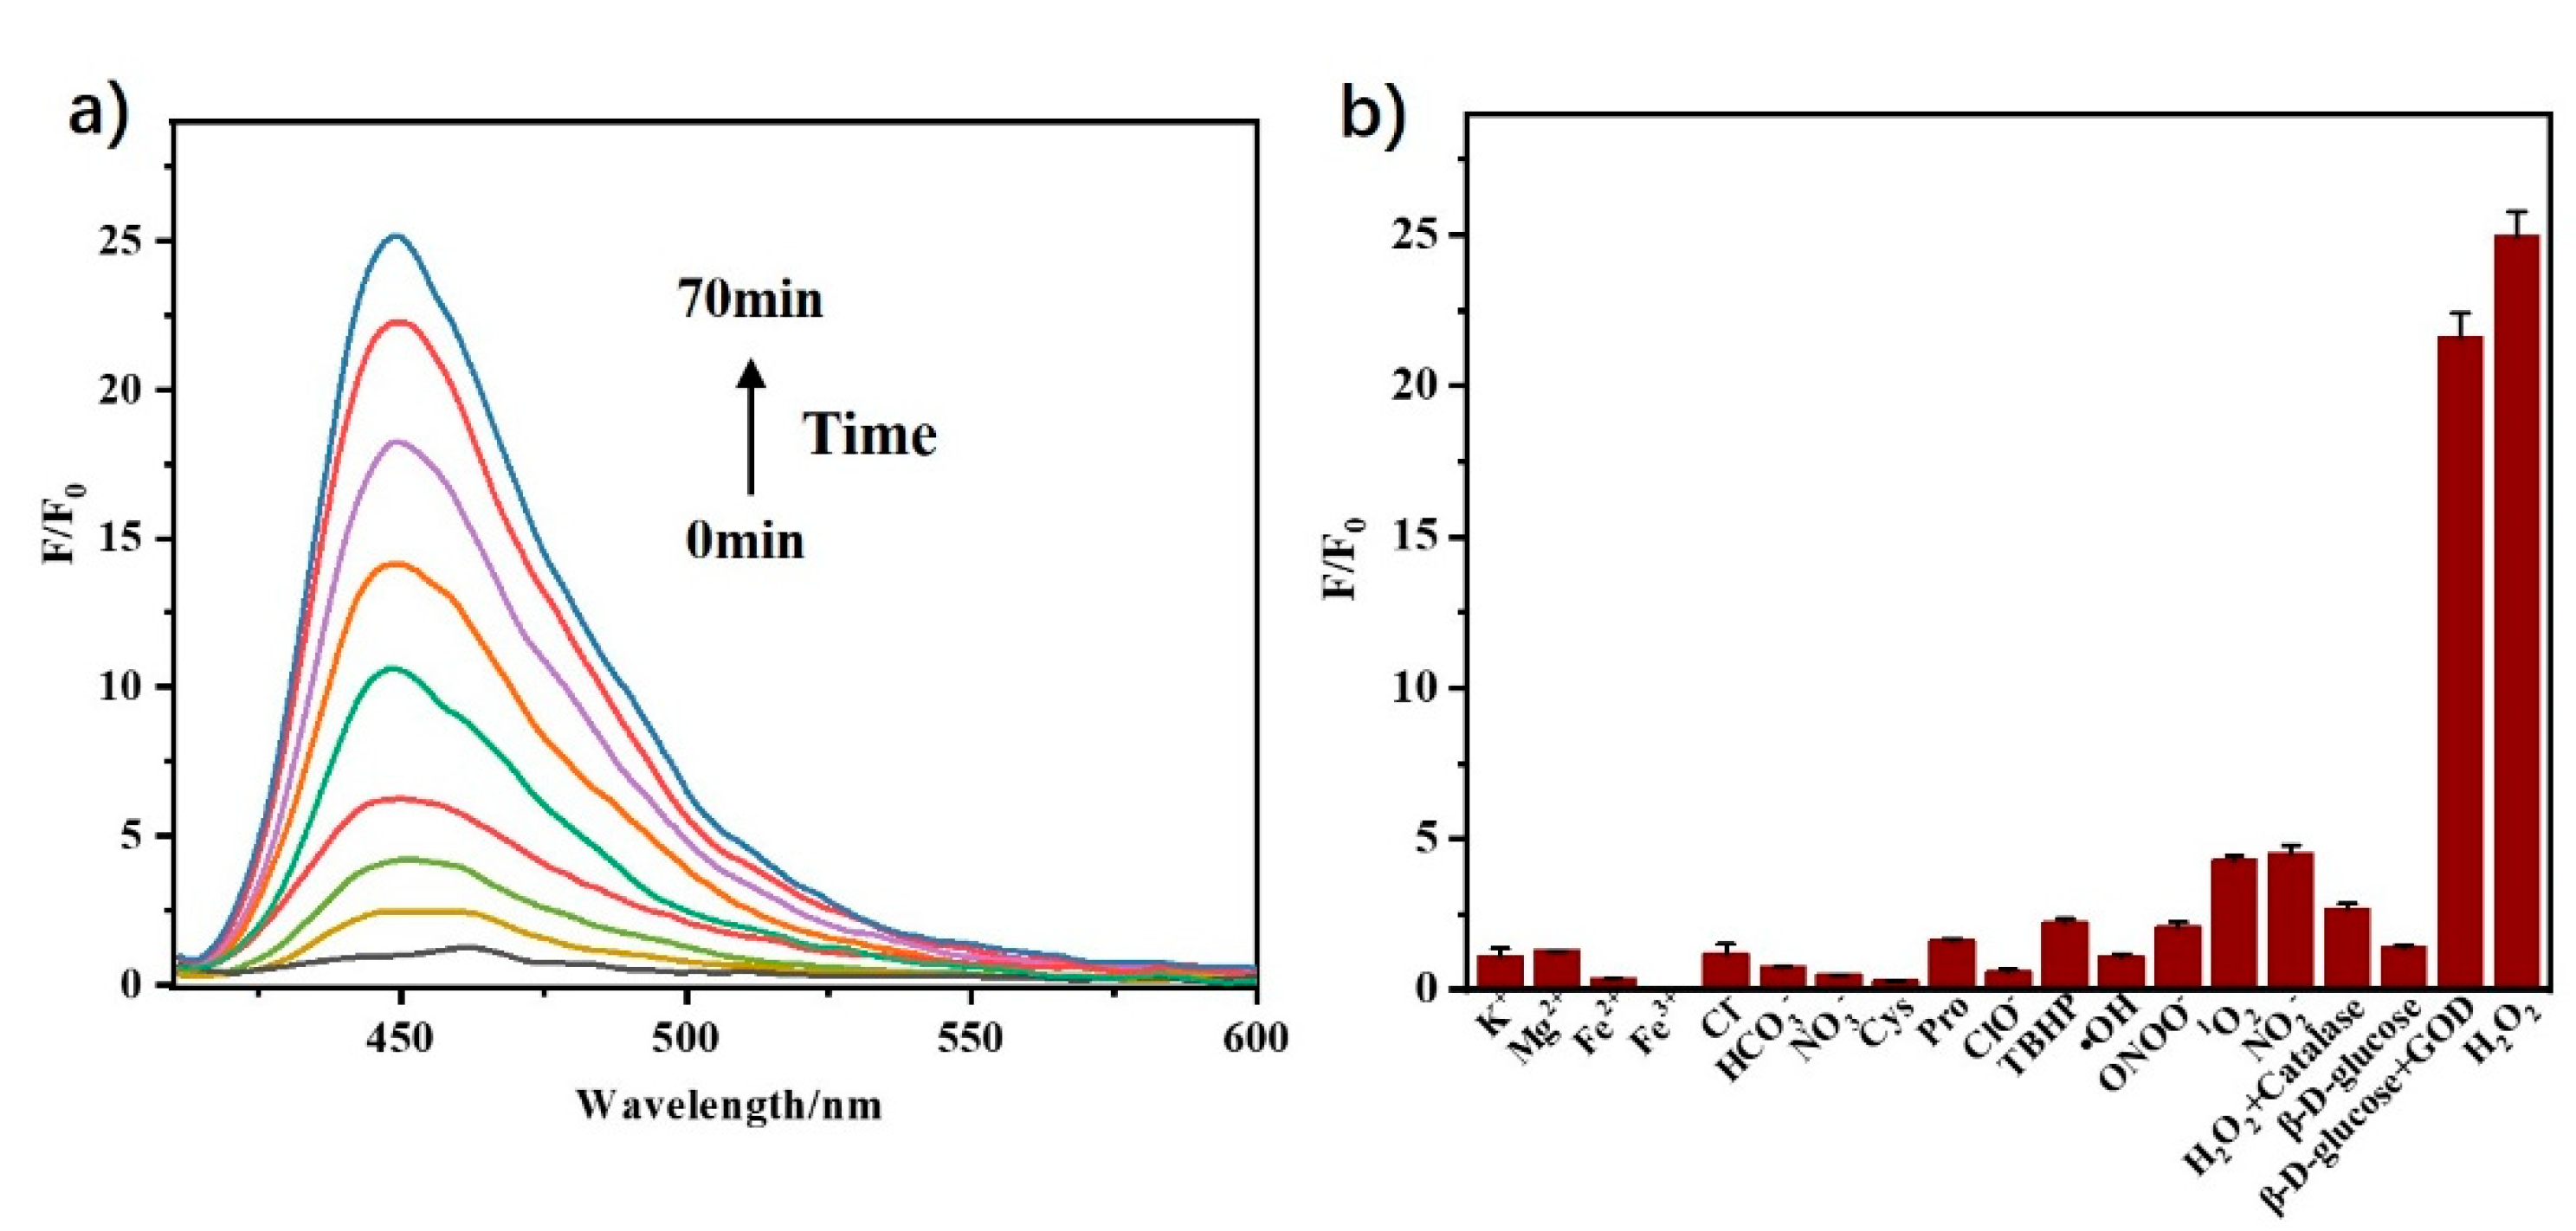
The response time of probe CMB toward H2O2 was also investigated by the time-dependent fluorescence intensity. After adding H2O2 to the solution of probe CMB, the fluorescence intensity at 450 nm gradually increased with time and stabilized finally. The selectivity study of probe CMB was carried out in the presence of various biologically relevant possible competing species, mainly including ions (K+, Mg2+, Fe3+, Cl−, etc.), amino acids (Cys, Pro), reactive oxygen species (•OH, TBHP, ClO−, etc.) [35,36]. As shown in Figure 2b, ions, amino acids, and most of the reactive oxygen species showed negligible changes in fluorescence and 1O2 and NO2− caused a slight response. The fluorescence enhancement of CMB to H2O2 is more obvious relative to the interferences. In order to further verify the specific reaction between the probe and H2O2, the catalase (hydrogen peroxide quencher) and glucose oxidase (hydrogen peroxide producer) were used to perform the fluorescence experiment. When H2O2 is treated with catalase, CMB no longer produced a significant increase in fluorescence toward it, but when glucose reacted with glucose oxidase was added, the obvious fluorescence enhancement was observed due to the H2O2 produced by the reaction, which proved the specificity of CMB to H2O2. The obvious fluorescence response and extended linear range as well as good biocompatibility and permeability make CMB an excellent candidate and can serve as the indicators for H2O2 detection compared with other candidates (Supplementary Table S1). All the results illustrated that CMB can react with hydrogen peroxide selectively to achieve fluorescence enhancement and we hope that it is suitable in a bio-environment.
2.3. Response Mechanism of CMB to H2O2
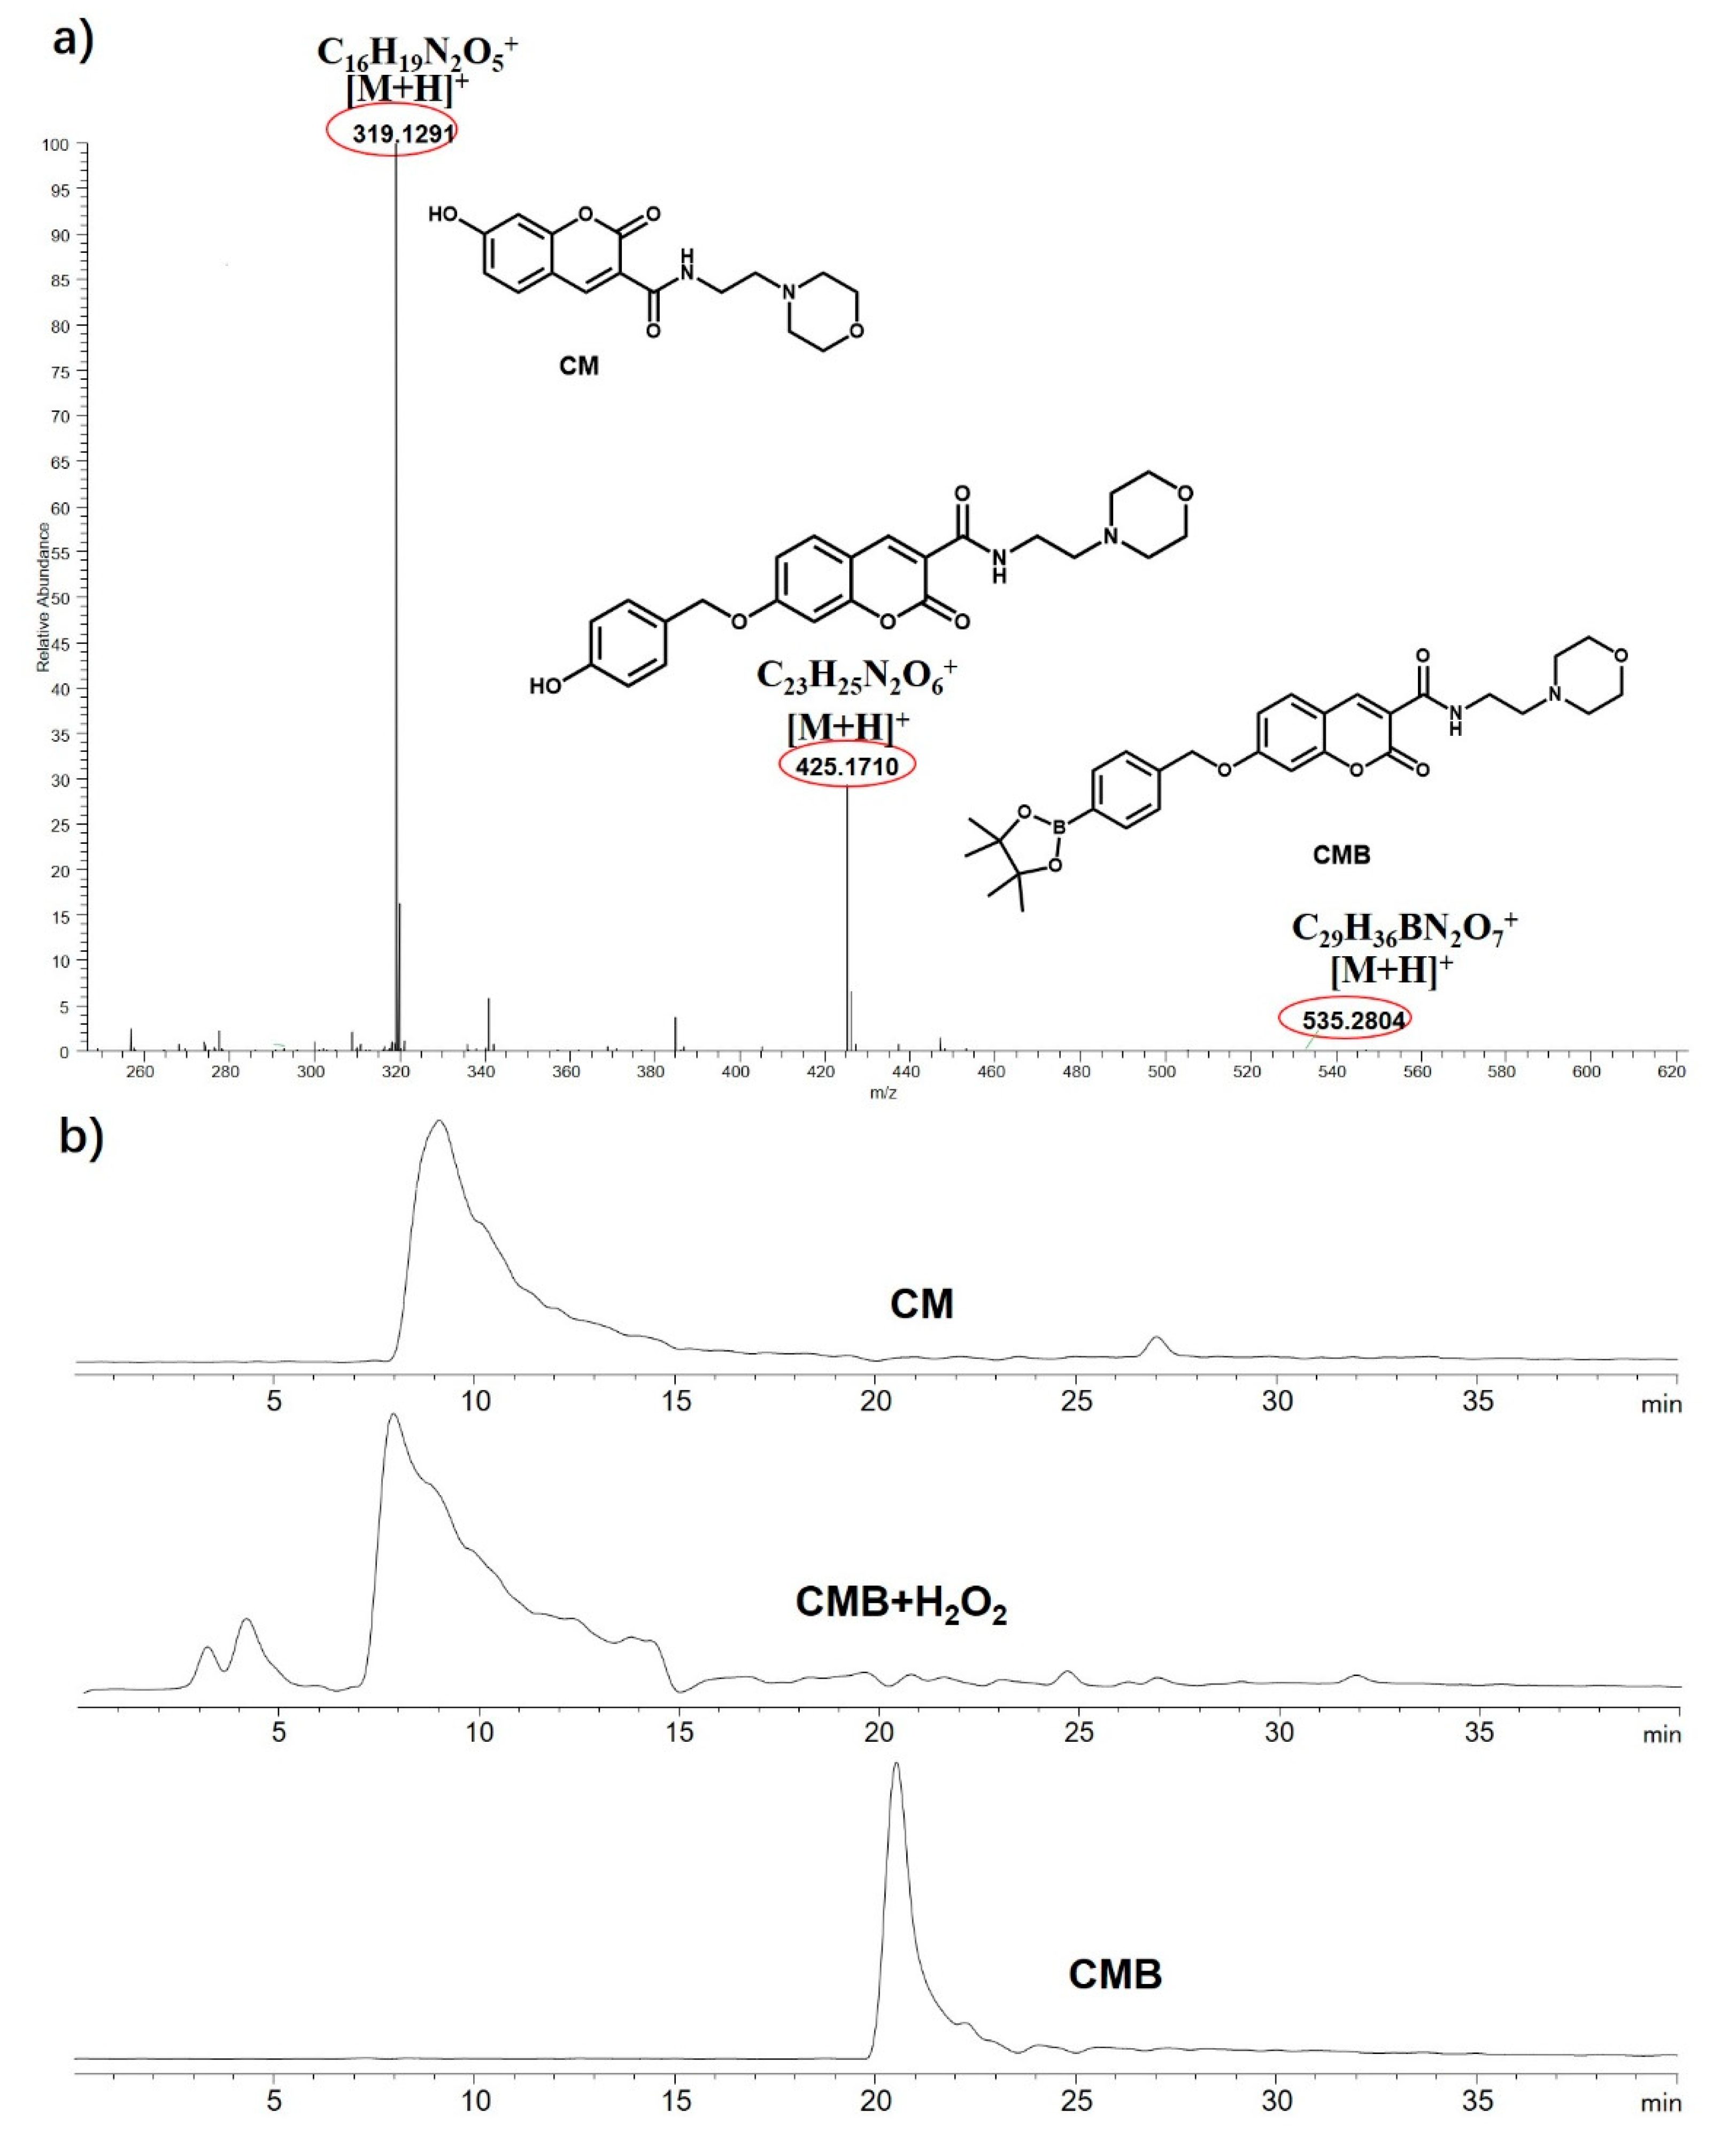
According to the fluorescence response of CMB to H2O2, the possible response mechanism of H2O2 detection can be preliminarily assumed (Scheme 1). When the fluorophore was connected with the aryl boronate, CMB showed almost no fluorescence due to the intramolecular interaction. The added H2O2 will react with the aryl boronate group, causing the hydroxyl of the fluorophore to be released, thereby revealing a strong fluorescent signal. In order to confirm the mechanism, high-resolution mass spectrometry (HRMS) was performed. CMB showed an intense peak at m/z = 535.2606 (Supplementary Figure S4). After adding H2O2, the peak of CMB had almost disappeared, while a new peak at m/z = 319.1291 appeared accompanied by the peak of the intermediate product at m/z = 425.1710, proving the transformation of CMB into CM by the reaction of aryl boronate group and H2O2. The liquid chromatography experiments were also done. As shown in Figure 3b, the CMB had a signal peak at 20.528 min. After adding H2O2, a new peak appeared at 9.116 min, which had the same as the retention time of CM. Thus, the experiments both supported the fact that the structural transformation caused by the reaction of CMB with H2O2 triggers the enhanced fluorescence signal, proving our inference about the response mechanism of CMB to H2O2 proposed in Scheme 1.
2.4. Cytotoxicity and Fluorescence Imaging in Living Cells
Taking into account the particularity of the biological environment, the viability of cells against the probe was determined using the CCK8 assay technique [37] to evaluate the cytotoxicity of the CMB. The relative growth rate of cells was detected upon exposure to CMB with concentrations of 0 to 20 μM for 24 h. As is shown in Figure 4, the cell survival rate was greater than 90% at probe concentrations up to 20 μM, demonstrating that CMB has an acceptable cytotoxicity to cells within this concentration range and can be used in biological systems. Thus, it can perform the subsequent cell imaging experiment.
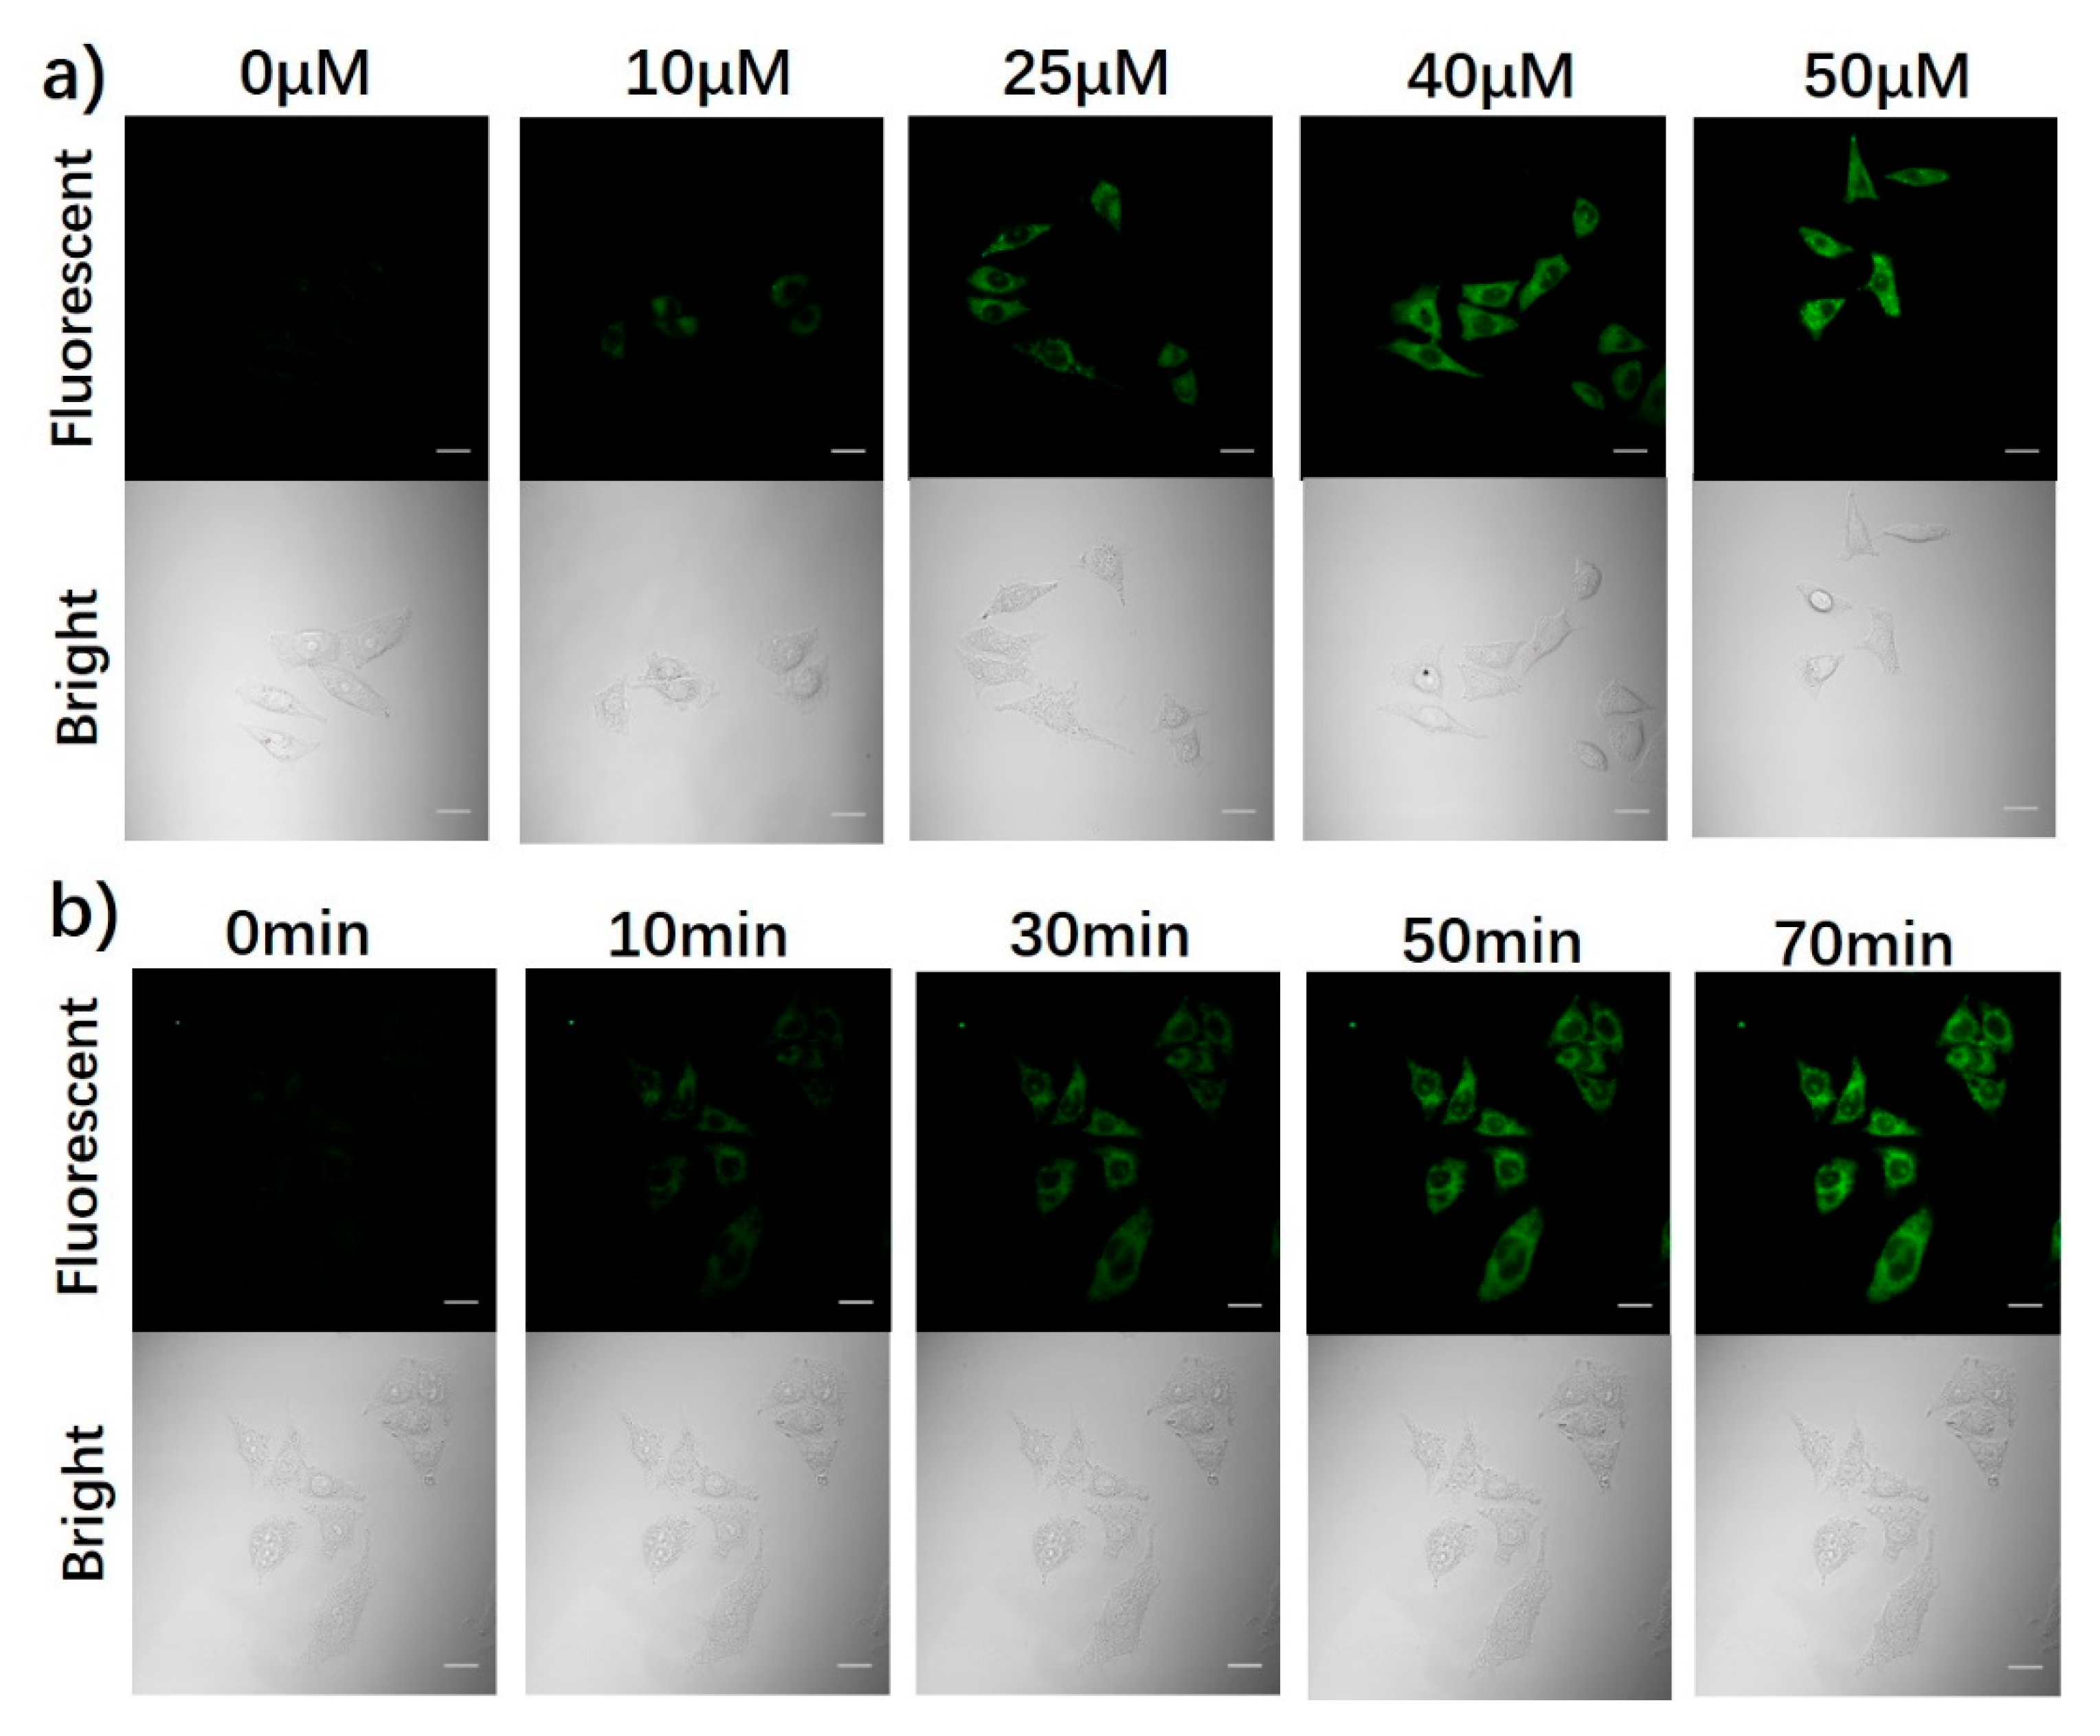
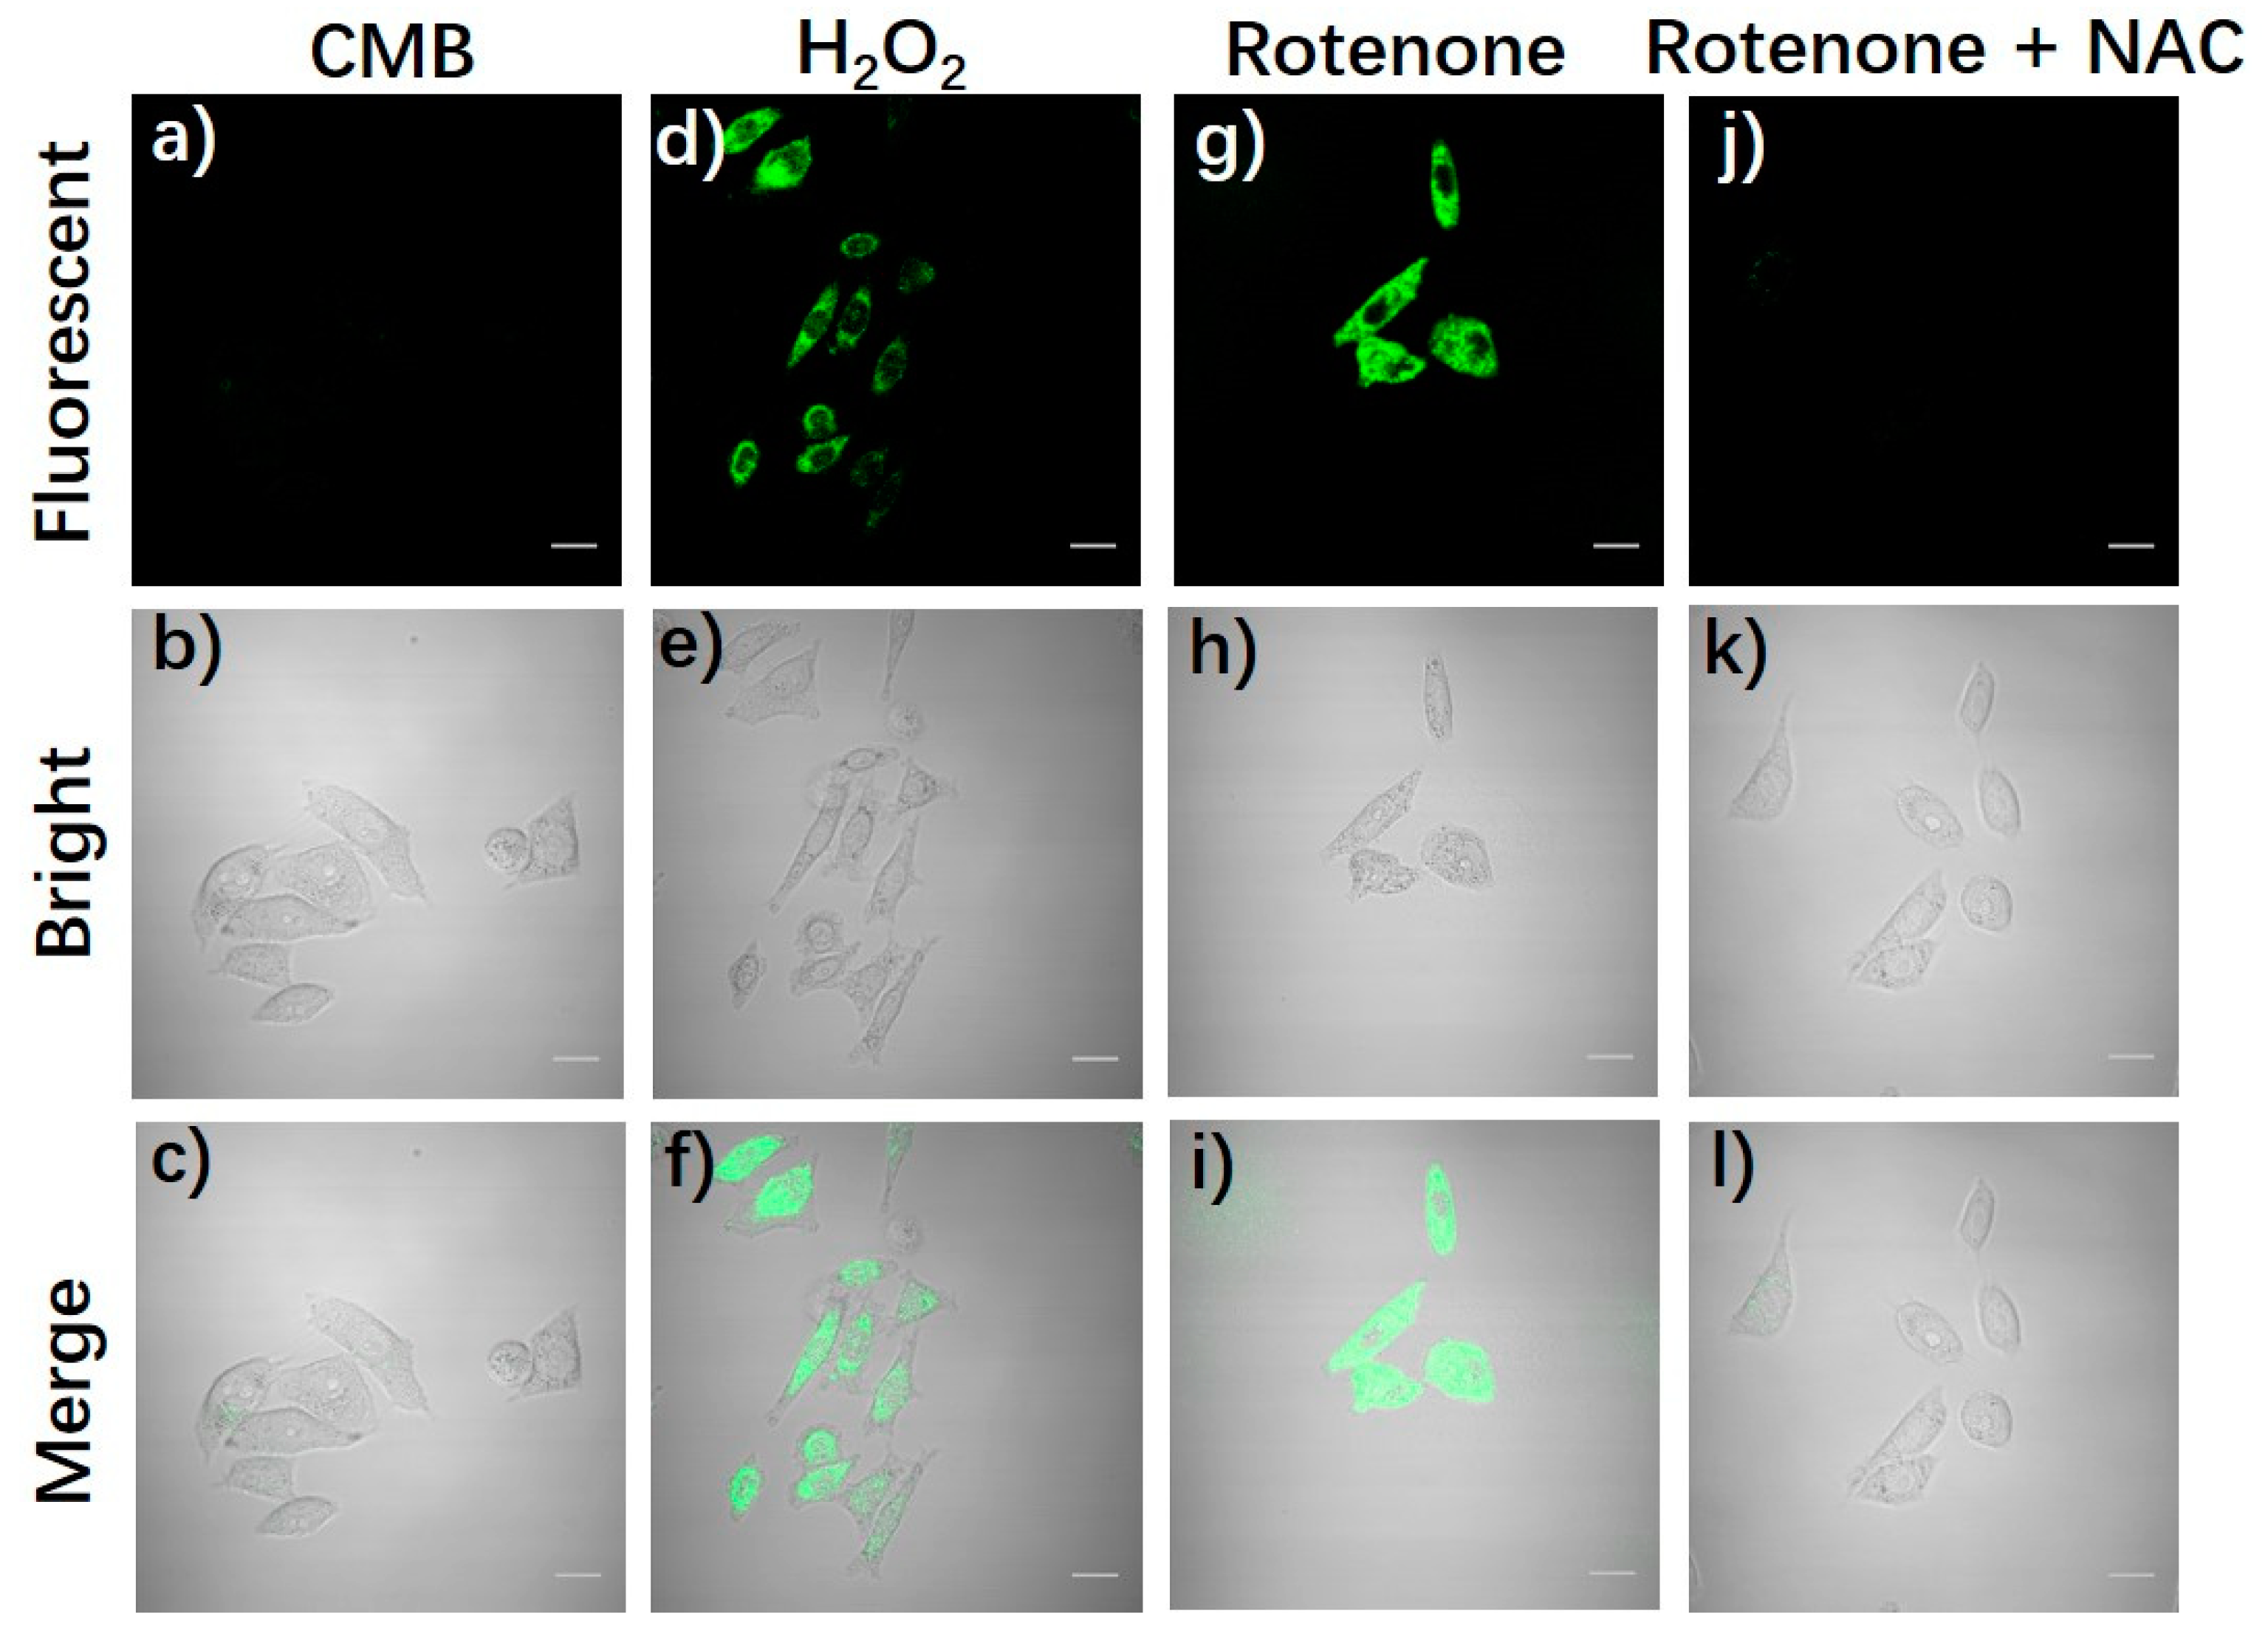
Then, we carried out the imaging experiment to test the practical feasibility of CMB for exogenous and endogenous H2O2 detection. When MCF-7 cells were stained with CMB alone, there was almost no fluorescence, but was observed that the fluorescence signal increased significantly and dose-dependently after treating cells with different concentrations of H2O2 (0 to 50 μM) (Figure 5a), which also proved that the CMB could effectively penetrate the cell membrane and disperse in the cytoplasm. In addition, the cells were incubated with H2O2 and then treated with CMB for imaging at different time points. It was found that the fluorescence intensity gradually increased over time (Figure 5b), which further indicates that CMB can be used to detect exogenous H2O2.
In addition, endogenous hydrogen peroxide is generated by the stimulation of rotenone [38,39], so the imaging ability of CMB to the endogenous H2O2 level of MCF-7 cells could be studied by adding rotenone. When cells were treated with rotenone with the addition of CMB, an obvious fluorescence could be observed (Figure 6). After incubating the rotenone-pretreated cells with N-acetylcysteine (NAC) [40], a common H2O2 inhibitor, the intracellular fluorescence was basically negligible, indicating the H2O2 produced by the stimulation of rotenone was eliminated. These results proved the ability of CMB to detect endogenous H2O2. The cell imaging experiment demonstrated that the CMB has favorable membrane-permeability, showing its potential for fluorescence imaging of exogenous and endogenous H2O2 levels in cells.
2.5. Zebrafish Imaging
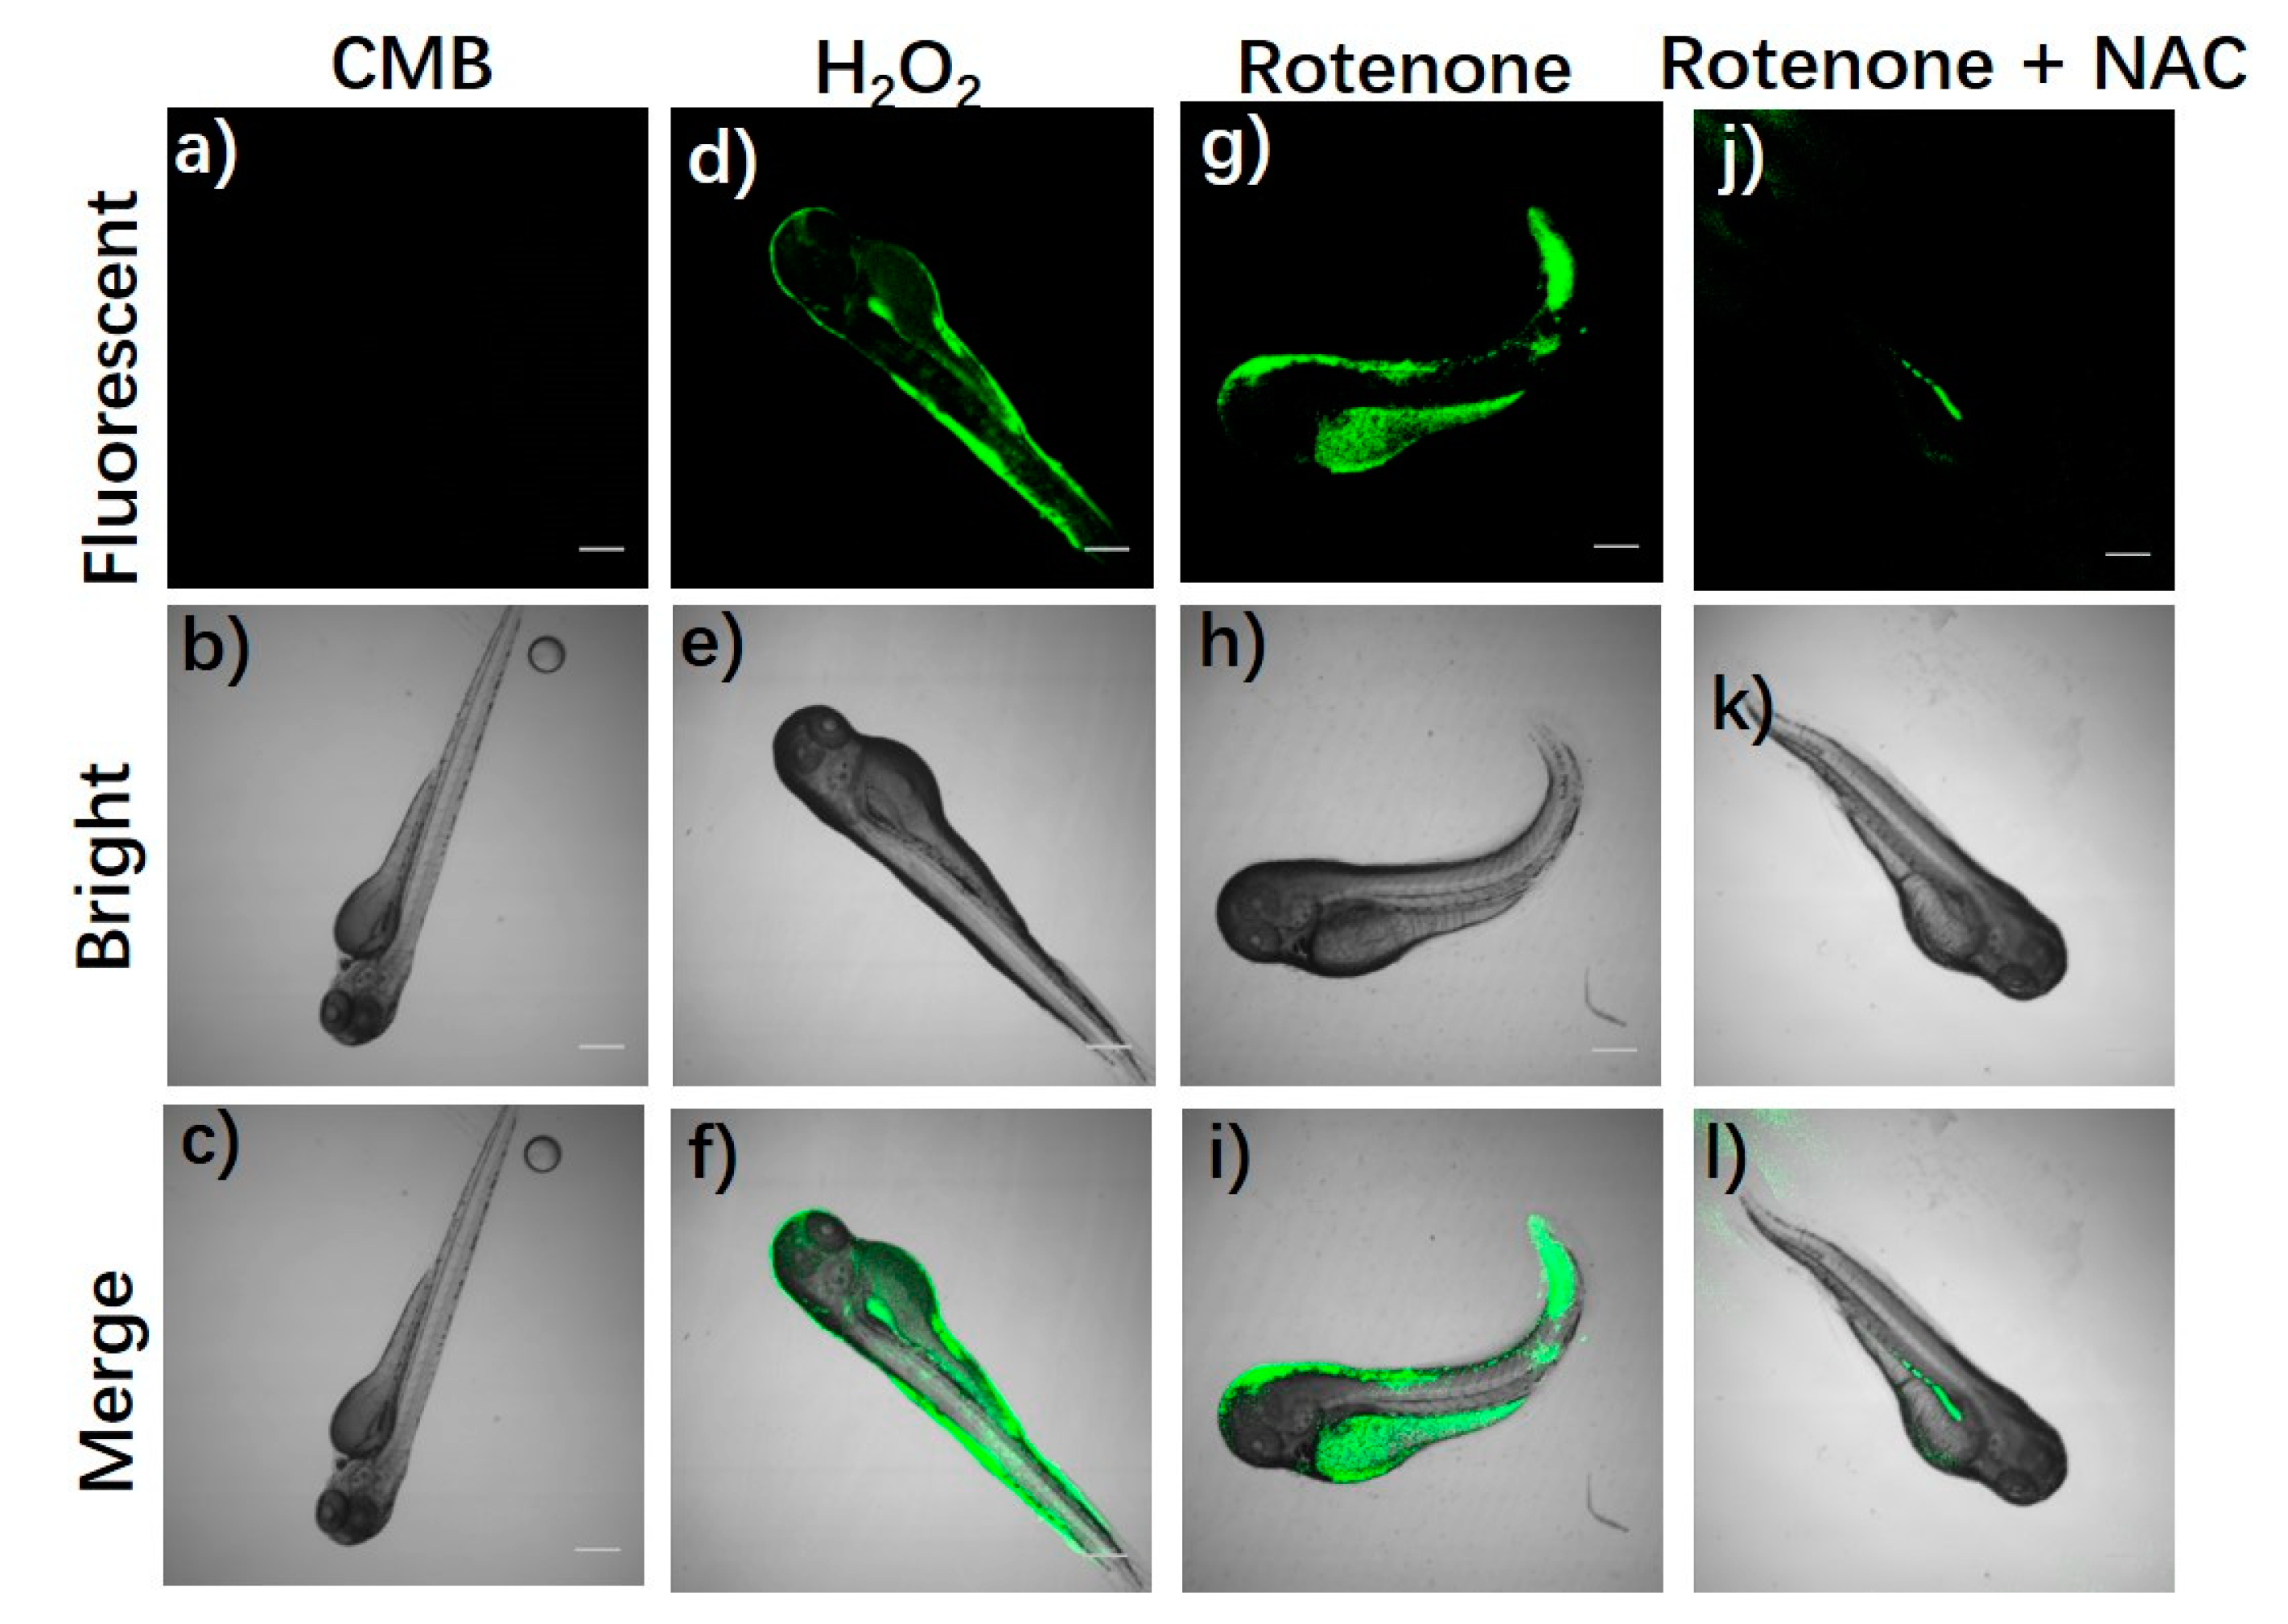
To further investigate the availability of the probe CMB in biological systems, a zebrafish imaging experiment was carried out to detect its fluorescence imaging performance. As shown in Figure 7, zebrafish incubated with H2O2 and then treated with CMB showed obvious fluorescence, while the control group treated only with CMB exhibited negligible fluorescence. Besides, the fluorescence intensity of zebrafish treated with rotenone also increased significantly, and after further treatment with NAC, its weak fluorescence was similar to that of the control group. In addition, the z-scan mode of the confocal microscope was used to record the fluorescence intensity at different depths in the body of the zebrafish to explore the penetration capability of the probe in tissue. As shown in Supplementary Figure S5, bright fluorescence was observed even at a depth of up to 180 μm, showing the probe CMB had tissue penetrating and staining capabilities. Thus, CMB has excellent penetration and exhibits good imaging feasibility for endogenous and exogenous H2O2 in zebrafish.
3. Conclusions
In summary, a novel fluorescence probe CMB based on coumarin was designed and developed successfully, that could interact with H2O2 and realize its detection by fluorescence. It can react with H2O2 selectively, thus producing an enhanced fluorescence signal. The probe CMB has low toxicity and good biocompatibility, and it can penetrate the cell membranes and zebrafish tissues to image endogenous and exogenous H2O2. The good penetration and staining ability further prove the feasibility of CMB to accurately monitor H2O2 in biological systems. It is expected that CMB will become a promising tool to detect the H2O2 and exhibits important potential applications in the diagnosis of H2O2-related diseases.
4. Materials and Methods
4.1. Materials and Instruments
All chemicals used were of reagent grade or purchased as high-grade commercial products and used without further purification. Solvents used were purified via standard methods. 1H NMR spectra were recorded on a Bruker AVANCE III 400 MHz spectrometer. Mass spectrometric data were performed on an LTQ Orbitrap XL spectrometer. The high-performance liquid chromatography (HPLC) experiment was recorded on an Agilent 1260 LC system (USA). Fluorescent spectra were achieved with an F7000 fluorescence spectrophotometer. The UV–vis spectra were recorded on a TU 1900 UV–vis spectrometer. The Dulbecco’s modified Eagle’s medium (DMEM) that was added with 10% fetal bovine serum (FBS), was used to culture all the cell lines. The OD values of the CCK8 assay were measured by BIO-RAD xMark microplate spectrophotometer. Confocal fluorescence imaging was performed on an OLYMPUS FV1000 confocal microscopy.
4.2. Synthesis of Compound 1
Compound 1 was synthesized according to a previously published article [41]. 2,4-dihydroxybenzaldehyde (1.38 g, 10.0 mmol) and diethyl malonate (1.92 g, 12.0 mmol) were dissolved in anhydrous EtOH, and then an appropriate amount of piperidine was added. The reaction mixture was refluxed for 12 h and then cooled. The precipitate was collected and washed with cold EtOH to obtain the yellow compound 1 (1.87 g) with a yield of 80%. 1H NMR (400 MHz, DMSO-d6) δ 11.07 (s, 1H), 8.65 (s, 1H), 7.73 (d, J = 8.6 Hz, 1H), 6.82 (dd, J = 8.6, 2.1 Hz, 1H), 6.70 (d, J = 1.9 Hz, 1H), 4.26 (q, J = 7.1 Hz, 2H), 1.30 (t, J = 7.1 Hz, 3H).
4.3. Synthesis of Compound CM
Compound 1 (0.41 g, 2.0 mmol) was dissolved in ethanol, then N-(2-methylamino)-morpholine (0.31 g, 2.4 mmol) and triethylamine (2.4 mmol) were added. The mixture was heated to reflux for 8 h and cooled after the reaction was complete. Then the precipitate was filtered, and the filtrate was extracted with dichloromethane and water. The organic layers were combined and dried over anhydrous sodium sulfate and column chromatography (CH2Cl2:CH3OH = 100:1) to obtain compound CM (0.417 g, yield 65.4%). 1H NMR (400 MHz, DMSO-d6) δ 11.03 (s, 1H), 8.85 (t, J = 5.3 Hz, 1H), 8.79 (s, 1H), 7.82 (d, J = 8.6 Hz, 1H), 6.88 (dd, J = 8.6, 2.2 Hz, 1H), 6.84–6.73 (m, 1H), 3.74–3.54 (m, 4H), 3.43 (q, J = 6.2 Hz, 2H), 2.48 (d, J = 6.4 Hz, 2H), 2.42 (s, 4H).
4.4. Synthesis of Compound CMB
CM (0.32 g, 1.0 mmol) and K2CO3 (0.42 g, 3.0 mmol) were dissolved in 5 mL CH3CN and then 2-(4-(bromomethyl)phenyl)-4,4,5,5-tetramethyl-1,3,2-dioxaborolane (0.42 g, 1.4 mmol) was also added to the mixture. The reaction mixture was heated at 80 °C for 24 h and cooled to room temperature. Then, the mixture was diluted with CH2Cl2 and water and the aqueous layer was extracted with CH2Cl2. The combined organic phase was washed with water and dried with anhydrous sodium sulfate, then purified by column chromatography (CH2Cl2:CH3OH = 100:1) to obtain a white solid (0.25 g) with the yield of 46.7%. 1H NMR (400 MHz, DMSO-d6) δ 8.85 (d, J = 3.8 Hz, 2H), 7.92 (d, J = 8.7 Hz, 1H), 7.72 (d, J = 7.8 Hz, 2H), 7.49 (d, J = 7.8 Hz, 2H), 7.18 (d, J = 2.1 Hz, 1H), 7.12 (dd, J = 8.7, 2.2 Hz, 1H), 5.32 (s, 2H), 3.59 (t, J = 4.6 Hz, 4H), 3.44 (q, J = 6.1 Hz, 2H), 2.47 (d, J = 6.4 Hz, 2H), 2.42 (s, 4H),, 1.30 (s, 12H).
4.5. Preparation of Related Species and Configuration of Solutions
Probe CMB was dissolved with DMSO to prepare stock solutions. Adding 4 μL probe stock solution into 2 mL acetonitrile/phosphate buffer (1:9 v/v, 10 mM, pH 7.4) with the final concentration of probe as 2 μM for fluorescent spectra test. H2O2, ClO−, TBHP, NO2−, and NO3− obtained from commercial sources were diluted or dissolved in water. Other reactive oxygen species are prepared according to the literature [42,43]. ONOO− was prepared by mixing pre-cooled 0.6 M NaNO2, 0.6 M HCl, and 0.7 M H2O2 into 1.5 M NaOH at 0 °C. Manganese dioxide was then added to the solution to eliminate the residual H2O2 and was removed by filtration. Its concentration was estimated by its extinction coefficient of 1670 M−1 cm−1 at 302 nm. A singlet oxygen solution was prepared by the reaction of H2O2 and sodium hypochlorite solution. Hydroxyl radical was generated by the Fenton reaction and can be acquired by adding Fe2+ to H2O2.
4.6. Measurement of Detection Limit
The detection limit was obtained from the fluorescence titration curve and was calculated according to the following equations [44]:
Detection limit = 3σ/k
Here σ represents the deviation of blank and k is the slope of the linear regression equation.
4.7. Cell Culture and Cytotoxicity Assay
The Michigan Cancer Foundation-7 (MCF-7) cells were allowed to culture for 24 h at 37 °C with medium supplemented with 10% fetal bovine serum (FBS) in a 5% CO2 humidified incubator. Cells were seeded in 96-well microplates for 24 h and then cultured in medium with 0, 1, 2, 5, 10, and 20 μM of probe CMB for 24 h. Cells in culture medium without probe were used as the control. The solution of CCK-8 reagent was added to each well and the plates were incubated for another 1 h. The medium was then removed carefully, and the absorbance of solutions was determined on a microplate reader at 450 nm.
4.8. Cell Imaging
The MCF-7 cells were treated with different concentrations of H2O2 (0 μM, 10 μM, 20 μM, 30 μM, 40 μM, 50 μM) and then incubated with CMB (2 μM) at 37 °C to detect exogenous H2O2. In addition, MCF-7 cells were stimulated with rotenone (2 µM) at 37 °C to produce endogenous H2O2, and then treated with CMB (2 µM). Then, another group of MCF-7 cells was first stimulated with rotenone (2 µM), incubated with NAC (1 mM) to eliminate the endogenous H2O2, and treated with CMB (2 µM) at 37 °C. The cells were washed three times with PBS after incubation, and then imaged on a confocal laser microscope with a 60× objective lens.
4.9. Zebrafish Imaging
Zebrafish embryos were maintained at 28.5 °C. First, the zebrafish were only incubated with CMB (2 μM) as the control group. Another group of zebrafish was stimulated with rotenone (2 µM), and then treated with CMB (2 µM). Then the last group of zebrafish was stimulated with rotenone (2 µM), incubated with NAC (1 mM) to eliminate the endogenous H2O2, and treated with CMB (2 µM). The zebrafish were washed three times with PBS after incubation and imaged on a confocal laser microscope with a 4× objective lens.
Supplementary Materials
The following are available online, Figure S1: The 1H NMR of compound 1 in DMSO-d6 solution, Figure S2: The 1H NMR of compound CM in DMSO-d6 solution, Figure S3: The 1H NMR of compound CMB in DMSO-d6 solution, Figure S4: The HRMS of compound CMB, Table S1: Properties of the previously developed fluorescent H2O2 probes and the probe CMB, Figure S5: The confocal z-scan images of zebrafish treated with probe and H2O2. Zebrafish were incubated with H2O2 and then stained with CMB (2 μM). The excitation wavelength was 405 nm and the emission was collected at 420 to 520 nm.
Author Contributions
Conceptualization, Y.J.; methodology, Y.J. and C.D.; formal analysis, Y.Z. and C.M.; writing—original draft, Y.Z. and Y.J.; writing—review and editing, Y.Z., Y.J., and C.D.; project administration, Y.J.; supervision, C.D. All authors have read and agreed to the published version of the manuscript.
Funding
This research was funded by the National Natural Science Foundation of China (21977015 and 21820102001), and the Fundamental Research Funds for the Central Universities (DUT20LK12).
Acknowledgments
We acknowledge Jiqiu Yin (from Dalian Medical University) for her assistance in cytotoxicity experiments.
Conflicts of Interest
The authors declare no conflict of interest.
Sample Availability
Samples of the compounds are not available from the authors.
References
- Schieber, M.; Chandel, N.S. ROS function in redox signaling and oxidative stress. Curr. Biol. 2014, 24, R453–R462. [Google Scholar] [CrossRef] [Green Version]
- Fang, Y.; Dehaen, W. Fluorescent Probes for Selective Recognition of Hypobromous Acid: Achievements and Future Perspectives. Molecules 2021, 26, 363. [Google Scholar] [CrossRef]
- Sena, L.A.; Chandel, N.S. Physiological roles of mitochondrial reactive oxygen species. Mol. Cell 2012, 48, 158–167. [Google Scholar] [CrossRef] [Green Version]
- Dixon, S.J.; Stockwell, B.R. The role of iron and reactive oxygen species in cell death. Nat. Chem. Biol. 2014, 10, 9–17. [Google Scholar] [CrossRef]
- Kwon, N.; Kim, D.; Swamy, K.M.K.; Yoon, J. Metal-coordinated fluorescent and luminescent probes for reactive oxygen species (ROS) and reactive nitrogen species (RNS). Coord. Chem. Rev. 2021, 427, 213581. [Google Scholar] [CrossRef]
- Ray, P.D.; Huang, B.-W.; Tsuji, Y. Reactive oxygen species (ROS) homeostasis and redox regulation in cellular signaling. Cell. Signal. 2012, 24, 981–990. [Google Scholar] [CrossRef] [Green Version]
- D’Autréaux, B.; Toledano, M.B. ROS as signalling molecules: Mechanisms that generate specificity in ROS homeostasis. Nat. Rev. Mol. Cell Biol. 2007, 8, 813–824. [Google Scholar] [CrossRef] [PubMed]
- Kamata, H.; Honda, S.; Maeda, S.; Chang, L.; Hirata, H.; Karin, M. Reactive oxygen species promote TNFalpha-induced death and sustained JNK activation by inhibiting MAP kinase phosphatases. Cell 2005, 120, 649–661. [Google Scholar] [CrossRef] [Green Version]
- Yan, K.C.; Sedgwick, A.C.; Zang, Y.; Chen, G.R.; He, X.P.; Li, J.; Yoon, J.; James, T.D. Sensors, Imaging Agents, and Theranostics to Help Understand and Treat Reactive Oxygen Species Related Diseases. Small Methods 2019, 3, 1900013. [Google Scholar] [CrossRef]
- Ye, S.; Hu, J.J.; Yang, D. Tandem Payne/Dakin Reaction: A New Strategy for Hydrogen Peroxide Detection and Molecular Imaging. Angew. Chem. Int. Ed. 2018, 57, 10173–10177. [Google Scholar] [CrossRef]
- Narayanaswamy, N.; Narra, S.; Nair, R.R.; Saini, D.K.; Kondaiah, P.; Govindaraju, T. Stimuli-responsive colorimetric and NIR fluorescence combination probe for selective reporting of cellular hydrogen peroxide. Chem. Sci. 2016, 7, 2832–2841. [Google Scholar] [CrossRef] [PubMed] [Green Version]
- Gorrini, C.; Harris, I.S.; Mak, T.W. Modulation of oxidative stress as an anticancer strategy. Nat. Rev. Drug. Discov. 2013, 12, 931–947. [Google Scholar] [CrossRef] [PubMed]
- Singh, A.; Kukreti, R.; Saso, L.; Kukreti, S. Oxidative Stress: A Key Modulator in Neurodegenerative Diseases. Molecules 2019, 24, 1583. [Google Scholar] [CrossRef] [Green Version]
- Miyata, Y.; Mukae, Y.; Harada, J.; Matsuda, T.; Mitsunari, K.; Matsuo, T.; Ohba, K.; Sakai, H. Pathological and Pharmacological Roles of Mitochondrial Reactive Oxygen Species in Malignant Neoplasms: Therapies Involving Chemical Compounds, Natural Products, and Photosensitizers. Molecules 2020, 25, 5252. [Google Scholar] [CrossRef]
- Zhang, Y.; Dai, M.; Yuan, Z. Methods for the detection of reactive oxygen species. Anal. Methods 2018, 10, 4625–4638. [Google Scholar] [CrossRef]
- Zhu, Y.; Ma, Y.; Liu, Y.; Liu, Z.; Ma, S.; Xing, M.; Cao, D.; Lin, W. Fluorescence response of a fluorescein derivative for hypochlorite ion and its application for biological imaging in wounded zebrafish and living mice. Sens. Actuators B Chem. 2021, 327, 128848. [Google Scholar] [CrossRef]
- Singh, H.; Tiwari, K.; Tiwari, R.; Pramanik, S.K.; Das, A. Small Molecule as Fluorescent Probes for Monitoring Intracellular Enzymatic Transformations. Chem. Rev. 2019, 119, 11718–11760. [Google Scholar] [CrossRef] [PubMed]
- Kim, S.J.; Yoon, J.W.; Yoon, S.A.; Lee, M.H. Ratiometric Fluorescence Assay for Nitroreductase Activity: Locked-Flavylium Fluorophore as a NTR-Sensitive Molecular Probe. Molecules 2021, 26, 1088. [Google Scholar] [CrossRef] [PubMed]
- Wu, L.; Qu, X. Cancer biomarker detection: Recent achievements and challenges. Chem. Soc. Rev. 2015, 44, 2963–2997. [Google Scholar] [CrossRef]
- Wei, X.; Hao, M.; Hu, X.; Song, Z.; Wang, Y.; Sun, R.; Zhang, J.; Yan, M.; Ding, B.; Yu, J. A near-infrared fluorescent probe with large stokes shift for accurate detection of β-glucuronidase in living cells and mouse models. Sens. Actuators B Chem. 2021, 326, 128849. [Google Scholar] [CrossRef]
- Obara, R.; Kamiya, M.; Tanaka, Y.; Abe, A.; Kojima, R.; Kawaguchi, T.; Sugawara, M.; Takahashi, A.; Noda, T.; Urano, Y. γ-Glutamyltranspeptidase (GGT)-Activatable Fluorescence Probe for Durable Tumor Imaging. Angew. Chem. Int. Ed. 2021, 60, 2125–2129. [Google Scholar] [CrossRef]
- Choi, N.E.; Lee, J.Y.; Park, E.C.; Lee, J.H.; Lee, J. Recent Advances in Organelle-Targeted Fluorescent Probes. Molecules 2021, 26, 217. [Google Scholar] [CrossRef]
- Zhou, Z.; Li, Y.; Su, W.; Gu, B.; Xu, H.; Wu, C.; Yin, P.; Li, H.; Zhang, Y. A dual-signal colorimetric and near-infrared fluorescence probe for the detection of exogenous and endogenous hydrogen peroxide in living cells. Sens. Actuators B Chem. 2019, 280, 120–128. [Google Scholar] [CrossRef]
- Dong, B.; Song, X.; Kong, X.; Wang, C.; Tang, Y.; Liu, Y.; Lin, W. Simultaneous Near-Infrared and Two-Photon In Vivo Imaging of H2O2 Using a Ratiometric Fluorescent Probe based on the Unique Oxidative Rearrangement of Oxonium. Adv. Mater. 2016, 28, 8755–8759. [Google Scholar] [CrossRef] [PubMed]
- Ren, M.; Deng, B.; Zhou, K.; Kong, X.; Wang, J.Y.; Lin, W. Single Fluorescent Probe for Dual-Imaging Viscosity and H2O2 in Mitochondria with Different Fluorescence Signals in Living Cells. Anal. Chem. 2017, 89, 552–555. [Google Scholar] [CrossRef] [PubMed]
- Li, N.; Huang, J.; Wang, Q.; Gu, Y.; Wang, P. A reaction based one- and two-photon fluorescent probe for selective imaging H2O2 in living cells and tissues. Sens. Actuators B Chem. 2018, 254, 411–416. [Google Scholar] [CrossRef]
- Song, X.; Bai, S.; He, N.; Wang, R.; Xing, Y.; Lv, C.; Yu, F. Real-Time Evaluation of Hydrogen Peroxide Injuries in Pulmonary Fibrosis Mice Models with a Mitochondria-Targeted Near-Infrared Fluorescent Probe. ACS Sens. 2021, 6, 1228–1239. [Google Scholar] [CrossRef] [PubMed]
- Lippert, A.R.; Bittner, G.C.V.; Chang, C.J. Boronate Oxidation as a Bioorthogonal Reaction Approach for Studying the Chemistry of Hydrogen Peroxide in Living Systems. Acc. Chem. Res. 2011, 44, 793–804. [Google Scholar] [CrossRef] [Green Version]
- Ni, Y.; Liu, H.; Dai, D.; Mu, X.; Xu, J.; Shao, S. Chromogenic, Fluorescent, and Redox Sensors for Multichannel Imaging and Detection of Hydrogen Peroxide in Living Cell Systems. Anal. Chem. 2018, 90, 10152–10158. [Google Scholar] [CrossRef]
- Liu, X.; He, L.; Yang, L.; Geng, Y.; Yang, L.; Song, X. Iminocoumarin-based fluorescence probe for intracellular H2O2 detection with a red emission and a large Stokes shift. Sens. Actuators B Chem. 2018, 259, 803–808. [Google Scholar] [CrossRef]
- Cao, D.; Liu, Z.; Verwilst, P.; Koo, S.; Jangjili, P.; Kim, J.S.; Lin, W. Coumarin-Based Small-Molecule Fluorescent Chemosensors. Chem. Rev. 2019, 119, 10403–10519. [Google Scholar] [CrossRef] [PubMed]
- Dsouza, R.N.; Pischel, U.; Nau, W.M. Fluorescent dyes and their supramolecular host/guest complexes with macrocycles in aqueous solution. Chem. Rev. 2011, 111, 7941–7980. [Google Scholar] [CrossRef] [PubMed]
- Liu, Y.; Jiao, C.; Lu, W.; Zhang, P.; Wang, Y. Research progress in the development of organic small molecule fluorescent probes for detecting H2O2. RSC Adv. 2019, 9, 18027–18041. [Google Scholar] [CrossRef] [Green Version]
- Zheng, D.-J.; Yang, Y.-S.; Zhu, H.-L. Recent progress in the development of small-molecule fluorescent probes for the detection of hydrogen peroxide. Trac Trends Anal. Chem. 2019, 118, 625–651. [Google Scholar] [CrossRef]
- Liu, J.; Liang, J.; Wu, C.; Zhao, Y. A Doubly-Quenched Fluorescent Probe for Low-Background Detection of Mitochondrial H2O2. Anal. Chem. 2019, 91, 6902–6909. [Google Scholar] [CrossRef] [PubMed]
- Kuang, Y.; Balakrishnan, K.; Gandhi, V.; Peng, X. Hydrogen peroxide inducible DNA cross-linking agents: Targeted anticancer prodrugs. J. Am. Chem. Soc. 2011, 133, 19278–19281. [Google Scholar] [CrossRef] [Green Version]
- Liu, X.; Feng, Q.; Bachhuka, A.; Vasilev, K. Surface modification by allylamine plasma polymerization promotes osteogenic differentiation of human adipose-derived stem cells. ACS Appl. Mater. Interfaces 2014, 6, 9733–9741. [Google Scholar] [CrossRef]
- Zhang, J.; Shi, L.; Li, Z.; Li, D.; Tian, X.; Zhang, C. Near-infrared fluorescence probe for hydrogen peroxide detection: Design, synthesis, and application in living systems. Analyst 2019, 144, 3643–3648. [Google Scholar] [CrossRef]
- Li, H.; Xin, C.; Zhang, G.; Han, X.; Qin, W.; Zhang, C.-W.; Yu, C.; Jing, S.; Li, L.; Huang, W. A mitochondria-targeted two-photon fluorogenic probe for the dual-imaging of viscosity and H2O2 levels in Parkinson’s disease models. J. Mater. Chem. B 2019, 7, 4243–4251. [Google Scholar] [CrossRef]
- Gong, Y.J.; Feng, D.D.; Liu, W.N.; Fang, J.K.; Feng, S. A self-immolative near-infrared probe based on hemi-benzothiazolecyanine for visualizing hydrogen peroxide in living cells and mice. Dye. Pigment. 2021, 186, 108954. [Google Scholar] [CrossRef]
- Li, H.; Wang, X.; Xu, G.; Zeng, L.; Cheng, K.; Gao, P.; Sun, Q.; Liao, W.; Zhang, J. Synthesis and biological evaluation of a novel class of coumarin derivatives. Bioorg Med Chem Lett 2014, 24, 5274–5278. [Google Scholar] [CrossRef] [PubMed]
- Li, X.; Tao, R.R.; Hong, L.J.; Cheng, J.; Jiang, Q.; Lu, Y.M.; Liao, M.H.; Ye, W.F.; Lu, N.N.; Han, F.; et al. Visualizing peroxynitrite fluxes in endothelial cells reveals the dynamic progression of brain vascular injury. J. Am. Chem. Soc. 2015, 137, 12296–12303. [Google Scholar] [CrossRef] [PubMed]
- Zhang, H.; Tian, D.; Zheng, Y.; Dai, F.; Zhou, B. Designing an ESIPT-based fluorescent probe for imaging of hydrogen peroxide during the ferroptosis process. Spectrochim. Acta Part A Mol. Biomol. Spectrosc. 2021, 248, 119264. [Google Scholar] [CrossRef] [PubMed]
- Li, H.; Yao, Q.; Fan, J.; Du, J.; Wang, J.; Peng, X. A two-photon NIR-to-NIR fluorescent probe for imaging hydrogen peroxide in living cells. Biosens. Bioelectron. 2017, 94, 536–543. [Google Scholar] [CrossRef]
Scheme 1.
The mechanism of CMB to detect H2O2.

Scheme 2.
The synthesis route of probe CMB.

Figure 1.
(a) UV-vis absorption and (b) fluorescence emission spectra of CMB before and after addition of H2O2. (c) Fluorescence responses of CMB (2 μM) to various concentrations of H2O2. (d) The linear correlation between the fluorescence intensity at 450 nm and H2O2 concentration.
Figure 1.
(a) UV-vis absorption and (b) fluorescence emission spectra of CMB before and after addition of H2O2. (c) Fluorescence responses of CMB (2 μM) to various concentrations of H2O2. (d) The linear correlation between the fluorescence intensity at 450 nm and H2O2 concentration.

Figure 2.
(a) The time response of the probe CMB. (b) Fluorescence response of CMB (2 μM) to various competing species (100 μM), including K+, Mg2+, Fe2+, Fe3+, Cl−, HCO3−, NO3−, cysteine (Cys), proline (Pro), hypochlorite (ClO−), tert-butyl hydroperoxide (TBHP), hydroxyl radical (•OH), peroxynitrite (ONOO−), singlet oxygen (1O2), nitrite (NO2−), H2O2 + catalase, β-D-glucose, β-D-glucose + glucose oxidase (GOD), and H2O2.

Figure 3.
(a) HRMS of CMB after adding H2O2. (b) Liquid chromatography of CMB, CMB treated with H2O2, and CM.
Figure 3.
(a) HRMS of CMB after adding H2O2. (b) Liquid chromatography of CMB, CMB treated with H2O2, and CM.

Figure 4.
Relative growth rate (%) of cells that were cultured in the presence of a 0 to 20 μM probe CMB for 24 h and estimated by the CCK8 assay.
Figure 4.
Relative growth rate (%) of cells that were cultured in the presence of a 0 to 20 μM probe CMB for 24 h and estimated by the CCK8 assay.

Figure 5.
Confocal images after the addition of exogenous H2O2 in MCF-7 cells. (a) Cells were stained with different concentrations of H2O2 and then incubated with CMB (2 μM). (b) Cells were pretreated with H2O2 (50 μM), and then incubated with CMB (2 μM) at different time points (0 to 70 min). The excitation wavelength was 405 nm and the emission was collected at 420 to 520 nm. Scale bar = 20 μm.

Figure 6.
Confocal images for exogenous and endogenous H2O2 in MCF-7 cells. (a–c) Cells were stained with CMB (2 μM). (d–f) Cells were incubated with H2O2 and then stained with CMB (2 μM). (g–i) Cells were incubated with rotenone and then stained with CMB (2 μM). (j–l) Cells were incubated with rotenone, treated with NAC, and then stained with CMB (2 μM). The excitation wavelength was 405 nm and the emission was collected at 420 to 520 nm. Scale bar = 20 μm.

Figure 7.
Confocal images for exogenous and endogenous H2O2 in zebrafish. (a–c) Zebrafish were stained with CMB (2 μM). (d–f) Zebrafish were incubated with H2O2 and then stained with CMB (2 μM). (g–i) Zebrafish were incubated with rotenone and then stained with CMB (2 μM). (j–l) Zebrafish were incubated with rotenone, treated with NAC, and then stained with CMB (2 μM). The excitation wavelength was 405 nm and the emission was collected at 420 to 520 nm. Scale bar = 300 μm.

Publisher’s Note: MDPI stays neutral with regard to jurisdictional claims in published maps and institutional affiliations. |
© 2021 by the authors. Licensee MDPI, Basel, Switzerland. This article is an open access article distributed under the terms and conditions of the Creative Commons Attribution (CC BY) license (https://creativecommons.org/licenses/by/4.0/).
Share and Cite
MDPI and ACS Style
Zuo, Y.; Jiao, Y.; Ma, C.; Duan, C. A Novel Fluorescent Probe for Hydrogen Peroxide and Its Application in Bio-Imaging. Molecules 2021, 26, 3352. https://doi.org/10.3390/molecules26113352
AMA Style
Zuo Y, Jiao Y, Ma C, Duan C. A Novel Fluorescent Probe for Hydrogen Peroxide and Its Application in Bio-Imaging. Molecules. 2021; 26(11):3352. https://doi.org/10.3390/molecules26113352
Chicago/Turabian StyleZuo, Yingying, Yang Jiao, Chunming Ma, and Chunying Duan. 2021. "A Novel Fluorescent Probe for Hydrogen Peroxide and Its Application in Bio-Imaging" Molecules 26, no. 11: 3352. https://doi.org/10.3390/molecules26113352