1. Introduction
Rapid, non-invasive breath screening is an attractive alternative test for diseases that commonly require lengthy diagnostic procedures, such as lung infections and certain cancers [
1]. In many cases, invasive procedures such as bronchoscopy, bronchoalveolar lavage or lung biopsy must be performed to obtain tissue samples for information. This is inherently challenging for certain patients as these procedures are invasive, may require sedation, are associated with significant morbidity, and in some cases even mortality. These procedures can also be extremely unpleasant, particularly for children and the elderly who must provide such samples. Alternatively, the diagnosis and/or monitoring of lung disease through breath analysis carries numerous benefits to a patient. Patients can produce breath samples in a simple manner and samples can be collected from children or patients who are unconscious [
1]. Breath collection can potentially be performed quickly and with minimal equipment for in situ healthcare offices or bedside monitoring. These implications could allow more frequent monitoring and potentially more rapid response to symptoms. Breath screening would also reduce the number of patients that must undergo more invasive procedures, alleviating certain pressures and backlog in the healthcare system [
2]. The concept of chemically profiling exhaled breath is not new but has certainly gained significant momentum [
3]. Research has also been performed regarding the application of breathomics during the current urgency for COVID-19 diagnosis and in differentiating the disease from other respiratory infections [
4].
The scientific foundation for breathprinting having potential in clinical practices varies between diseases. In many respiratory diseases, there is a shift in the cell metabolites associated with the condition that can be exploited to differentiate health and diseases in individuals, or in the case of pathogenic conditions, there is an exploitable metabolic profile of the foreign cells. The volatile organic compounds (VOCs) detected in the breath have been shown to vary between healthy individuals and those affected by conditions such as chronic obstructive pulmonary disorder (COPD), diabetes, and lung cancer [
5,
6]. These conditions represent significant health disparities in Hawaii and effective breathprinting tools could significantly contribute to the redressing of these discrepancies in health care, reducing considerable backlog in the medical system, and improving patient care. VOC targets in exhaled breath are largely comprised of a wide range of compounds such as hydrocarbons, alcohols, aldehydes, ketones, volatile fatty acids, and sulfur-containing compounds [
7].
While the idea of obtaining a breathprint to diagnose lung disease has been proposed in the past, several obstacles have prevented the rapid development of commercial biomarker sensors. Commercial sensors are well-developed [
8], yet they must be tuned for specific marker compounds at a known concentration range in order to provide accurate and reliable results. The analytical identification of disease breath biomarkers for the purposes of creating such sensors is, however, challenging due to their complex mixture and wide concentration range. Even in healthy individuals, little is known about the breath profile, which is often a major inherent obstacle preventing disease biomarker identification for low-cost bedside sensor development. Sex has been shown to affect the exhaled breath profile [
9], yet other factors that affect this profile remain largely uninvestigated. For example, emotional state is known to impact levels of chemicals emitted into the air from exhaled breath [
10]. Understanding the control population used in studies is crucial for advancing work in the area of exhaled breath analysis. This is even more important in regions where there is high population diversity, which could introduce variation in breath profiles within a healthy population. Without a fundamental understanding of exhaled VOCs across a wide range of populations, there will be challenges with the realistic implementation of exhaled breath diagnostics on a global scale.
One major ongoing shift in exhaled breath diagnostics is the introduction of comprehensive two-dimensional gas chromatography (GC×GC) as an analytical tool for research studies. The benefit of using GC×GC for exhaled breath diagnosis is that it increases peak capacity beyond that of traditional one-dimensional gas chromatography (GC) and therefore allows improved performance in comprehensively characterizing a sample. In exhaled breath studies, GC×GC has been used to better understand disease biomarkers for asthma, lung disease, and tuberculosis [
11,
12,
13] among others. These studies tend to be held in centralized locations with very different populations than those in Hawaii, and therefore, a key question is whether these complex VOC profiles and results of breath diagnostic research can be applied amongst more diverse populations outside of where the control groups were originally assessed.
The objective of this research was to establish a breathprint sampling method and conduct a pilot range-finding study to investigate the variance of breath compounds in a Hawaiian population using gas chromatographic techniques. The number of subjects was kept intentionally small for this first pilot study in an attempt to look at intra-individual differences over time, from data collection on three separate visits for each individual. The population used in the study were healthy adults that met strict criteria for inclusion in the study, as further elaborated in the methods section. In particular, there was an interest in examining the variation in the population in Hawaii as a premise for future large-scale studies. Because of high diversity, immigration, and tourism, the population in Hawaii may have high variance concerning the exhaled breath profile from healthy individuals. As GC×GC is currently emerging as a valuable tool for the complexity of exhaled breath samples, this was the instrumentation chosen for the analysis. On the instrument used for this particular study, GC×GC was able to be combined with dual detection using a flame ionization detector (FID) and quadrupole mass spectrometer (qMS). The dual detection approach enables molecule discovery and identification using the qMS detector and more accurate linear quantification using the FID. Prior studies outline the benefits and data workflows for GC×GC-qMS/FID for VOC analysis [
14,
15].
3. Discussion
The compounds that appear lower in
Table 3 appear to have higher intraindividual variation within the subjects monitored within this study. Increasing subject participants would help to improve the understanding of the extent of this variation. However, these compounds did not appear to be very stable in abundance in individuals from this small cohort studied. This would assert that caution should be used if attempting to use these particular compounds as disease markers when moving a research study conducted in one locale to another area. It suggests that an evaluation of healthy individuals within other regions, including Hawaii, may be necessary to understand whether biomarkers of disease developed in one region of the world can be realistically applied in another area. If these particular compounds were being monitored for upregulation or downregulation in disease diagnosis, and that concept is applied in a new region where there is naturally a higher variability in those compounds within healthy individuals, it could raise the risk of false positives in disease diagnosis. The data provided in this study allowed a starting assessment of the variance of a healthy population in Hawaii to be characterized as a pilot trial. Further data are needed with a larger subject cohort to make conclusions about certain breath markers being stable for use as disease markers within this population.
Acetic acid was a compound that was identified in every patient within this study and was found to be significantly different from room air using Fisher Ratio variance analysis. Acetic acid is a known marker monitored for gastrointestinal reflux disease (GERD) as well as for monitoring cystic fibrosis patients for potential lung infections [
21]. While the increase in this particular breath marker is important in indicating the difference between a healthy subject, a subject with GERD, and a subject with a lung infection, it has also been noted that the accurate quantification of this biomarker is essential in order to ensure that appropriate classification of health status can be achieved. This is largely because acetic acid is present in low levels (ppbv) in exhaled breath from subjects in many studies, and therefore knowing the background levels is important if applying this type of research to new populations of individuals [
22]. Acetic acid has been demonstrated as being taken up by human primary tracheobronchial epithelial (TBE) cell lines, as well as lung adenocarcinoma cell lines (A549, Lu7466), while being released by human epithelial cervical carcinoma (HeLa) cell lines [
23].
The compound dimethoxymethane (also known as methylal) was also consistently identified in breath samples within this study. Dimethoxymethane is a known breath compound in exhaled breath [
7]; however, it has recently been demonstrated that females release significantly lower amounts of dimethoxymethane in their breath samples compared to male subjects [
9]. It is possible that other genetic factors could contribute to differences in dimethoxymethane production in exhaled breath as well, though to our knowledge this has not yet been investigated. Interestingly, dimethoxymethane has only been identified in breath from human subjects and not in other bodily secretions [
7].
n-hexane is a compound found in all matrices collected from healthy human subjects including feces, urine, breath, skin, milk, blood, and saliva [
7].
n-hexane is known to be released by lung cancer cells (NCI-H2087) at a much higher level than found in baseline levels of healthy subjects. However, very few reports exist on what the actual baseline level of hexane is found to be in subjects, as studies most often report the results of significant difference between a control group and the group of samples with elevated levels. Therefore, further understanding of absolute concentration and variance amongst individuals within different populations would assist in ensuring that a test using this biomarker remains effective when deployed to subjects outside of a strict study control group. The importance of accurate quantification in breath studies for this particular reason has been highlighted previously [
22].
Benzoic acid methyl ester was consistently identified across subjects. Esters of benzoic acid are commonly found on the skin of healthy individuals [
7] including benzoic acid dodecyl ester, benzoic acid tridecyl ester, and benzoic acid tetradecyl ester [
7]. These are generally larger molecules that would be less volatile than benzoic acid methyl ester. Benzoic acid methyl ester is not a commonly cited VOC in exhaled breath [
7]. This compound may potentially be related to the subjects in this particular study, perhaps linked with factors such as environmental exposure. This compound is found as a floral aroma in many plants.
Benzaldehyde, benzene, benzofuran and acetophenone were also identified in a large majority of subjects (>70%). Benzaldehyde and benzene have been commonly identified in all matrices collected from healthy human subjects, including feces, urine, breath, skin, milk, blood and saliva [
23]. This is also true of acetophenone with the exception of milk [
23]. Benzofuran has been reported as a chemical in exhaled breath, skin, and milk from healthy subjects [
7]. It should also be noted that two prominent breath VOCs, acetone and isoprene, were not detected within this study. The sorbent-based collection methods used in this study may have impeded the ability to collect, focus, and inject these compounds onto the instrument and therefore may have contributed to their lack of detection. It is also possible that these compounds fell below the limit of detection within this study or that they were not present in the sample. This should be a focus of further investigation when moving towards studies incorporating a larger number of individuals.
Additionally, the authors note that specific absolute concentrations of compounds were not calculated in this study, and may be beneficial to include in future studies, especially for the core breath profile compounds that are detected. The current study focused on relative quantities of compounds to one another and on variance analysis rather than on calibration and performing absolute quantification. In relating this data to different diseases or disorders within the population, absolute quantification may be a more robust approach.
This is the first time an exhaled breath study has focused on profiling healthy subjects in Hawaii. Although the data only represent 7 subjects and therefore has limited ability to make broad inferences on the population, it is important to represent different and diverse populations to understand the implications of using exhaled breath as a diagnostic or health monitoring procedure in the future. Understanding the baseline breath profile of subjects across different populations will assist in developing breath tests that are more accurate and reliable and reduce the possibility of false negatives or false positives when tests can eventually be implemented. This work is a pilot study that assists in identifying consistencies and differences in a small group of individuals, and therefore has limited statistical significance compared to a study incorporating more individuals and data. The next phase of this work would involve scaling up the study to include a large number of individuals and tracking information like ancestry alongside the data for further clarity.
4. Materials and Methods
4.1. Human Subjects
Healthy volunteers were recruited from within the University community according to approved Institutional Review Board (IRB) procedures under IRB Protocol # CUH052. Individuals self-reported their qualifications for the study based on inclusion criteria and exclusion criteria. Inclusion criteria were defined for this initial cohort as lifetime non-smokers, male or female, adults (age 18–54), and within normal body mass index (BMI) range (18.5–25). Choosing criteria for BMI and smoking activity level served to reduce variation in metabolic rates between individuals in this initial cohort.
Additionally, exclusion criteria included the previous history of neonatal lung development complications/conditions, previous conditions that required the use of a medical ventilator, cold, flu, or respiratory tract infection symptoms exhibited at the time of breath sample collection or in the past two weeks. Vulnerable populations were also excluded from the study. After determining study qualifications based on the criteria, informed consent was obtained according to Protocol #CUH052.
4.2. Pre-Trial Tube Selection
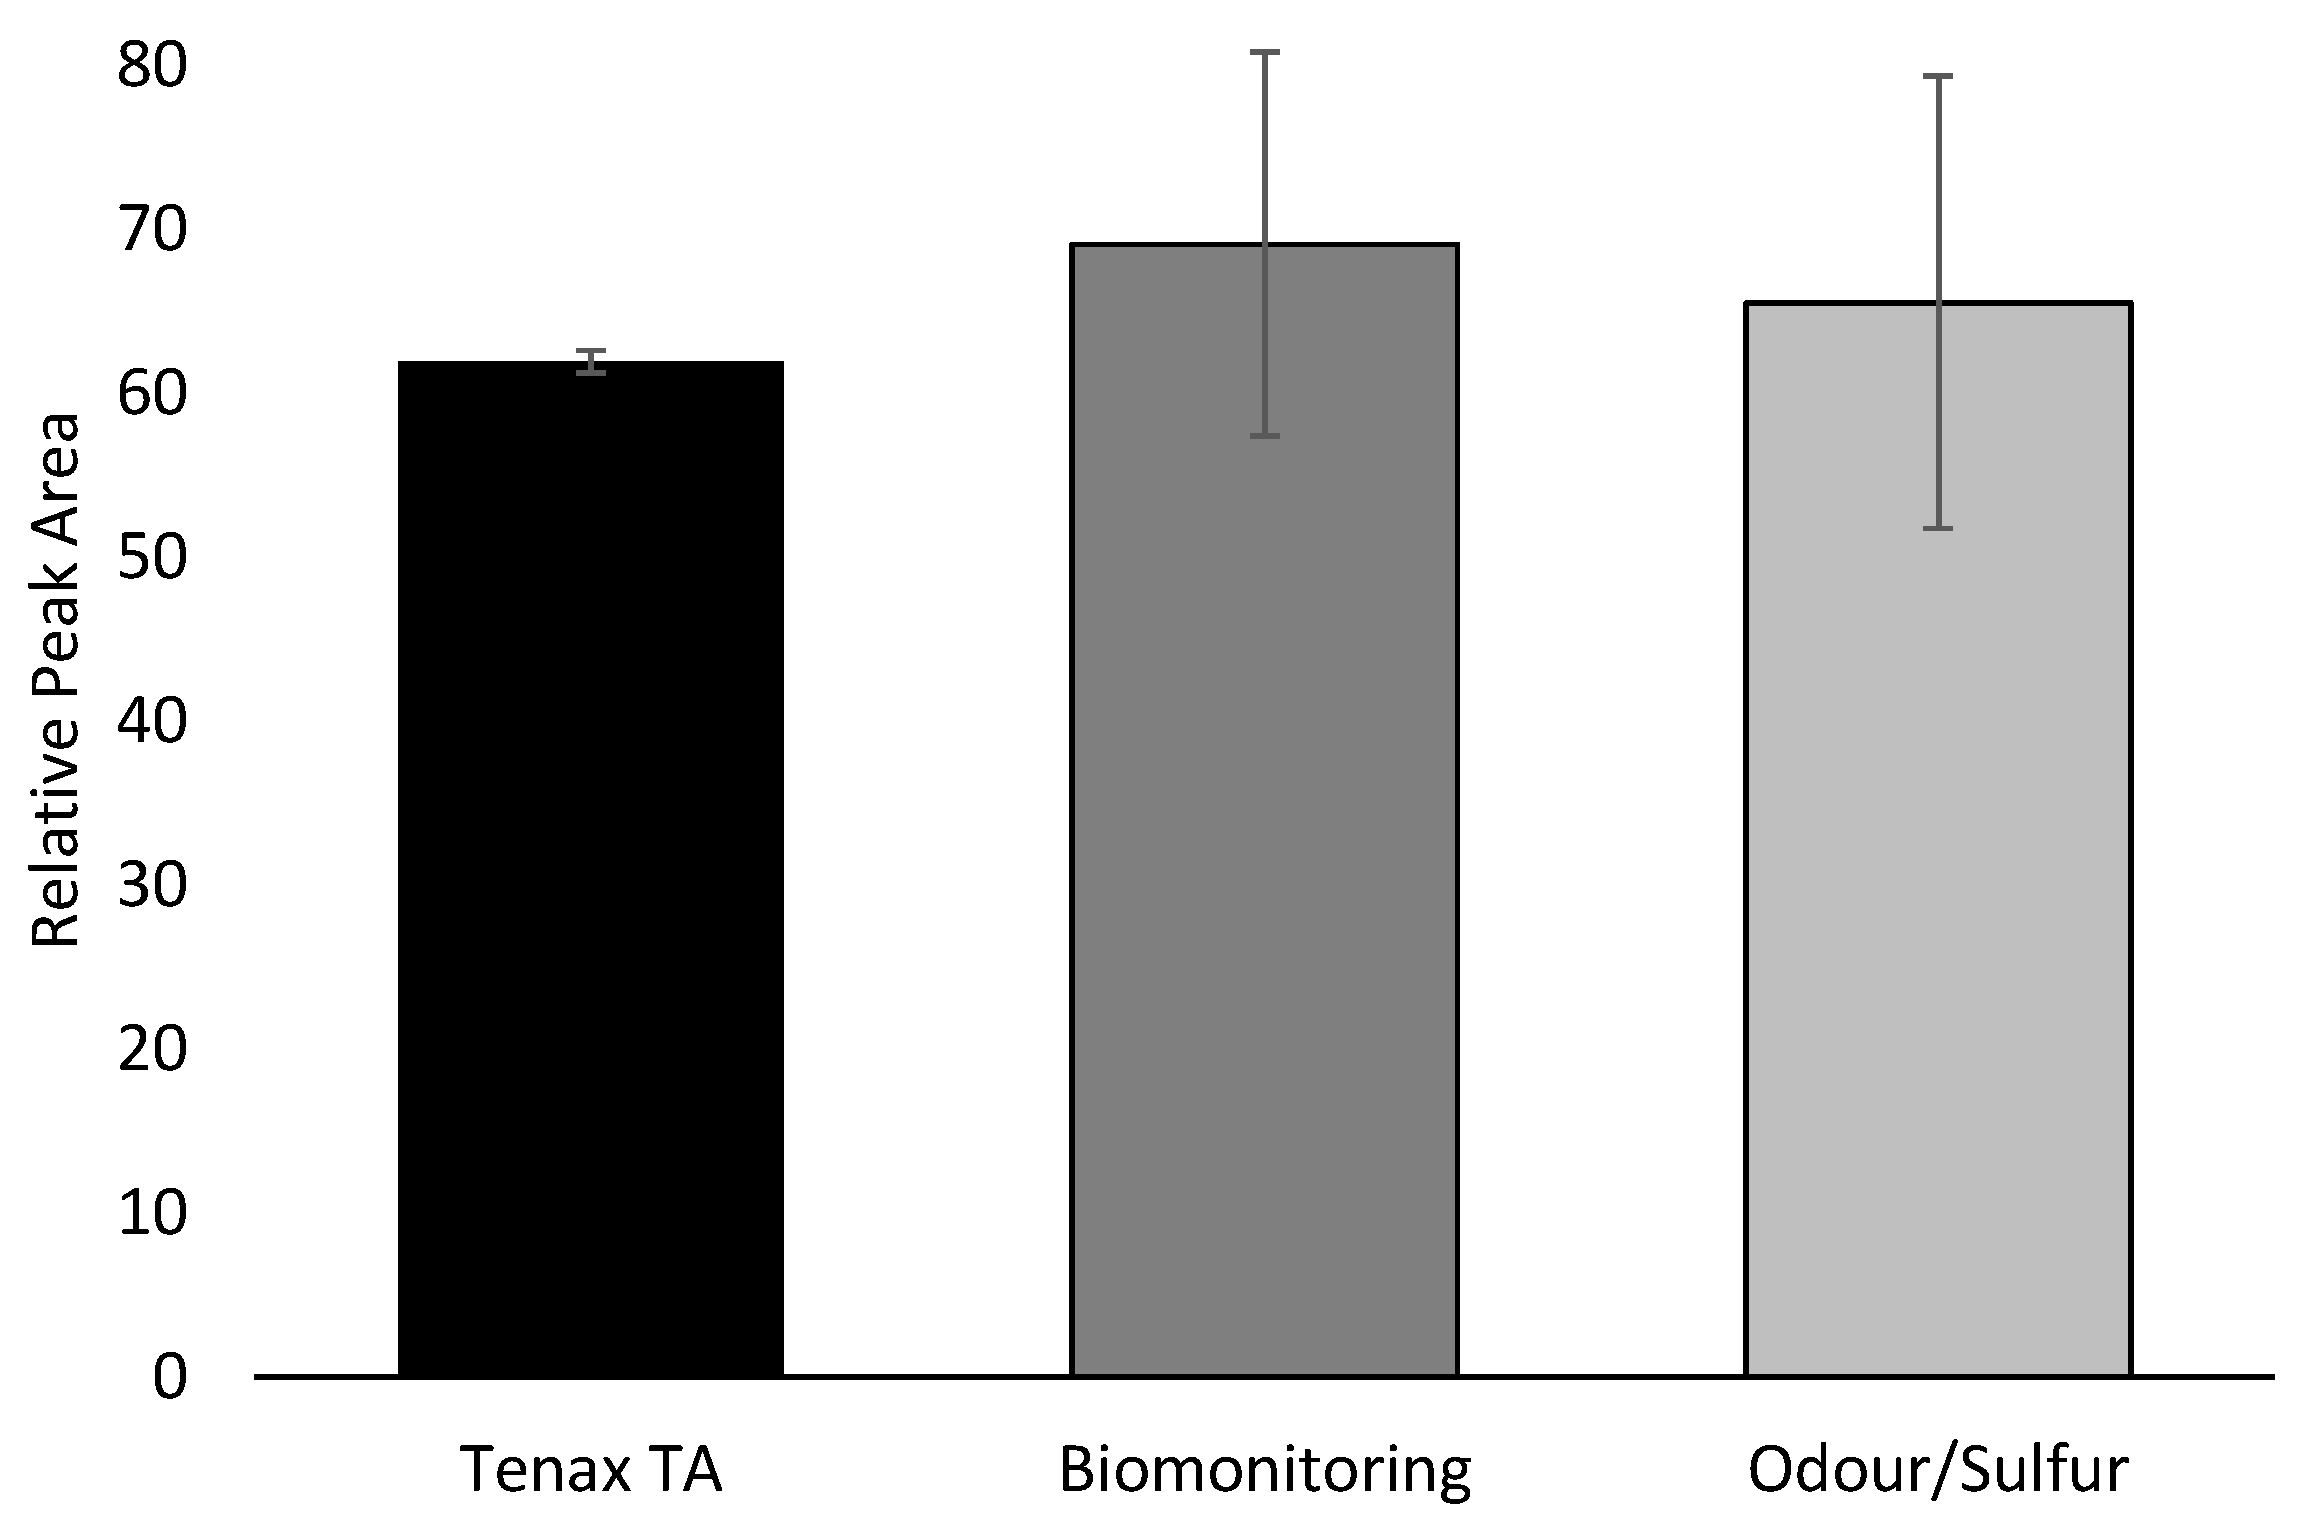
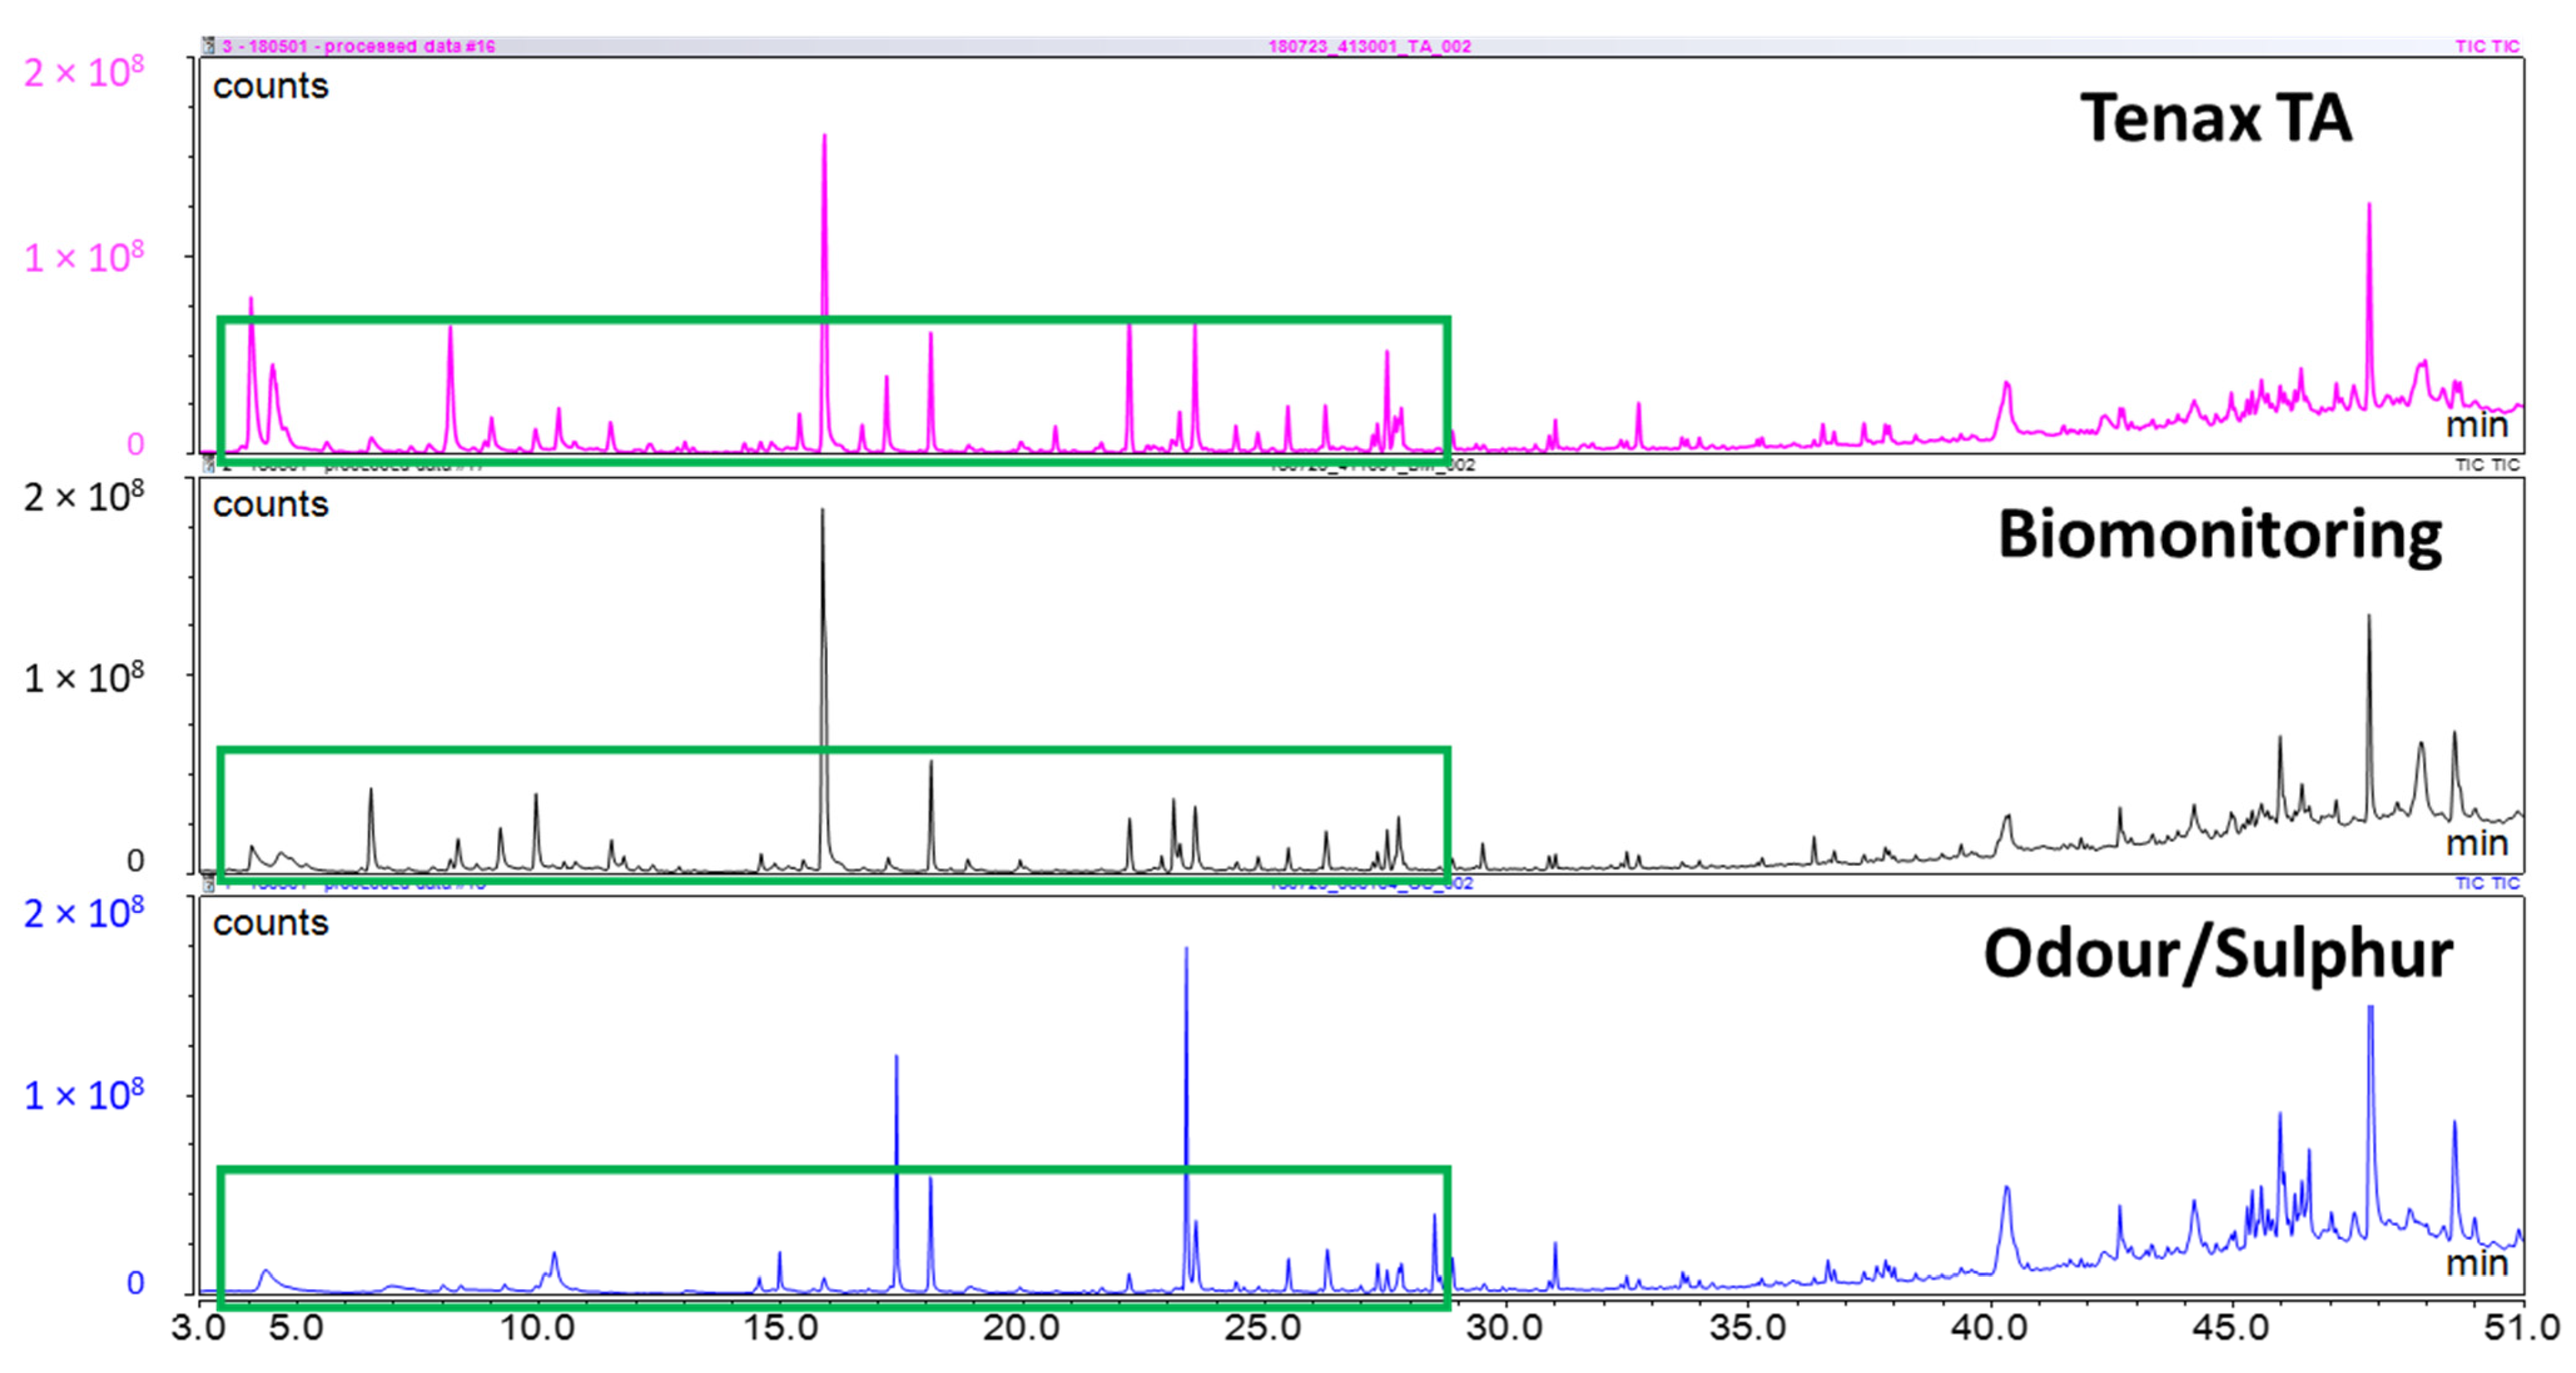
Investigating literature on breath analysis and on manufacturer’s recommendations, there were three sorbent tubes that would be suitable for breath collection: Tenax TA, Biomonitoring, and Odour/Sulphur (Markes International Ltd., Llantrisant, UK.). In order to determine which of the three tubes to use in-house for this study, a pre-trial study was conducted on a small range of samples to confirm a suitable choice. Two approaches were used for this confirmation. First, three of each sorbent tube were used with chemical standards that were representative of exhaled breath. A 10 ppm breath VOC standard was prepared by mixing two different custom mixes, one commercial mixed standard, and several individual standards. Custom Mix 1 contained 2-ethyl-1-hexanol, 1-propanol, 2-propanol, 2-butanone, cyclohexane, and 2-methylfuran in P&T methanol/water (GC Grade, Restek Corporation, Bellefonte, PA, USA). Custom Mix 2 contained styrene, 2-methylpentane, 3-methylpentane, 2,4-dimethylheptane, 2-methylhexane, naphthalene, and 1,2,3-trimethylbenzene in P&T methanol (GC grade, Restek Corporation). Commercial mix 1 contained benzene, toluene, ethylbenzene, m-xylene, o-xylene, and p-xylene in P&T methanol (certified reference mixture, Restek Corporation). Individual standards for hexanal, heptanal, and dimethyl trisulfide (DMTS) were also used (analytical standard grade, Sigma-Aldrich, St. Louis, MO, USA). These mixes were all combined at a concentration of 10 ppm to create the breath VOC mix. For each of the sorbent tubes, 1 µL of the breath VOC mix was injected onto the sorbent tube, with 1 µL of a 10 ppm saturated alkanes mix (C7–C30 in hexane, certified reference material grade, Supelco, Bellefonte, PA, USA), and 1 µL of 10 ppm d5-chlorobenzene (GC grade, Restek Corporation). Second, three human subjects contributed breath samples on one of each tube. Breath samples were collected as described below under the same IRB Protocol. Following the pre-trial tube selection, the Tenax TA sorbent tubes were used for all collected samples.
4.3. Breath Sample Collection
Each volunteer was advised to avoid consuming any food or beverages other than water at least 2 h before sample collection. Each participant was required to sit in place for at least 10 min in an isolated room, and to complete a lifestyle questionnaire prior to breath sample collection. The lifestyle questionnaire included questions about the participants’ activities in the preceding week (including recent food intake, sleep, activity level, exercise, prescription medication and alcohol consumption). This was repeated on three visits with each study participant, with a minimum of 48 h in-between visits.
All sample collection was completed within a 3-month period (precisely between early July and late October 2019). Participants submitted breath samples by breathing at a regular rate into a Bio-VOC sampler (Markes International Ltd.) following the recommended manufacturer’s procedures. Subjects were asked to exhale a single slow vital capacity breath into the Bio-VOC. The collected air was immediately transferred to a ¼ × 3½ stainless steel conditioned Tenax TA thermal desorption (TD) tube (Markes International Ltd.) following the direction of sampling to capture VOCs present in the trapped air. This process was repeated two more times in order to collect three single breaths as one sample, resulting in 525 mL of breath collected onto a single tube. For each set of breath samples collected from subjects, an equivalent sample of room air was collected at the same time as the subject’s visit. Room air was collected into the bio-VOC sampler by pumping the handle and expelling the room air onto a sorbent tube. The number of room air collections performed was matched to the breath sample, meaning that 3 full bio-VOC samplers of room air were expelled onto a single sorbent tube. These control samples were used to eliminate adsorbent artifacts and to characterize background compounds to reduce the reporting of compounds that were not relevant to the exhaled breath samples.
4.4. Pilot Trial of 7 Subjects (105 Subject Samples)
Additionally, a cohort of individuals was recruited to provide breath samples for the pilot study. A total of 7 subjects were used for this part of the research study. Each individual provided samples in three separate sessions. During each visit, the individual provided 5 breath samples, each including 3 individual breaths. This provided 15 sorbent tubes from each individual. Visits were a minimum of 48 h apart. Prior to breath collection, each TD tube was reconditioned for 30 min at 300 °C with a flow of ultra-high purity nitrogen (Airgas, Radnor, PA, USA) with a pressure of 20 psi, which equated to a flow rate of 60 mL/min. Tube reconditioning was always performed offline from the system on a TC-20 instrument (Markes International Ltd.) using a flow of ultra-high purity nitrogen (Airgas). Tubes were stored at room temperature with brass long-term storage caps in an airtight screw-capped container before breath collection. TD tubes with samples were coded (using tube number and date of data acquisition as DD/MM/YYYY) to minimize bias during data acquisition. The TD tubes were stored at 4 °C until data acquisition using a Unity-xr thermal desorption (TD) system (Markes International Ltd.) for sample introduction and comprehensive two-dimensional gas chromatography and dual-channel detection with quadrupole mass spectrometry and flame ionization (TD-GC×GC-qMS/FID) for analysis.
4.5. GC-MS Analysis
The pre-trial tube selection was performed on a one-dimensional gas chromatography system with quadrupole mass spectrometry (GC-MS). Sample analysis was carried out utilizing a Unity 2 series thermal desorber (Markes International Ltd.) and conducted on a Focus GC coupled with a Dual Stage Quadrupole II (DSQ II) Mass Selective Detector (MSD) (Thermo Scientific, Bellefonte, PA, USA).
Prior to desorption, a leak test was performed followed by a 1 min prepurge with a trap flow of 50 mL/min. Primary desorption of the sample took place at 300 °C for 5 min with a trap flow of 50 mL/min and a split-flow of 20 mL/min. The sample was recondensed at 10 °C on a general-purpose carbon cold trap for C4/5 to C30/32 (Markes International Ltd.). The cold trap was purged for 1 min with a flow of 50 mL/min, then heated at the maximum heating rate to 320 °C for 3 min. Following desorption, all tubes were reconditioned offline for 30 min at 330 °C on the TC-20 at 20 psi, and capped with brass long-term storage caps (Markes International) to prepare for re-use. The standby split-flow on the thermal desorber was set at 10 mL/min, and the flow path temperature at 150 °C. The GC cycle time was set for 30 min and the minimum carrier pressure at 5 psi. Analyte separation was accomplished using an Rxi-624Sil MS capillary column (Restek Corporation, 30 m × 0.25 mm ID × 1.4 µm film thickness) using ultra-high-purity helium as the carrier gas at a constant flow rate of 1.0 mL/min (Airgas). The GC oven program started at 35 °C where it was held for 5 min, followed by a temperature increase of 5 °C/min up to 240 °C, which was maintained for 5 min. The MS transfer line and ion source were set to 250 and 200 °C, respectively, and the MSD was operated in full electron ionization (EI) scan mode from 45 to 450 m/z at a scan rate of 5 scans/s.
4.6. GC×GC-qMS/FID Analysis
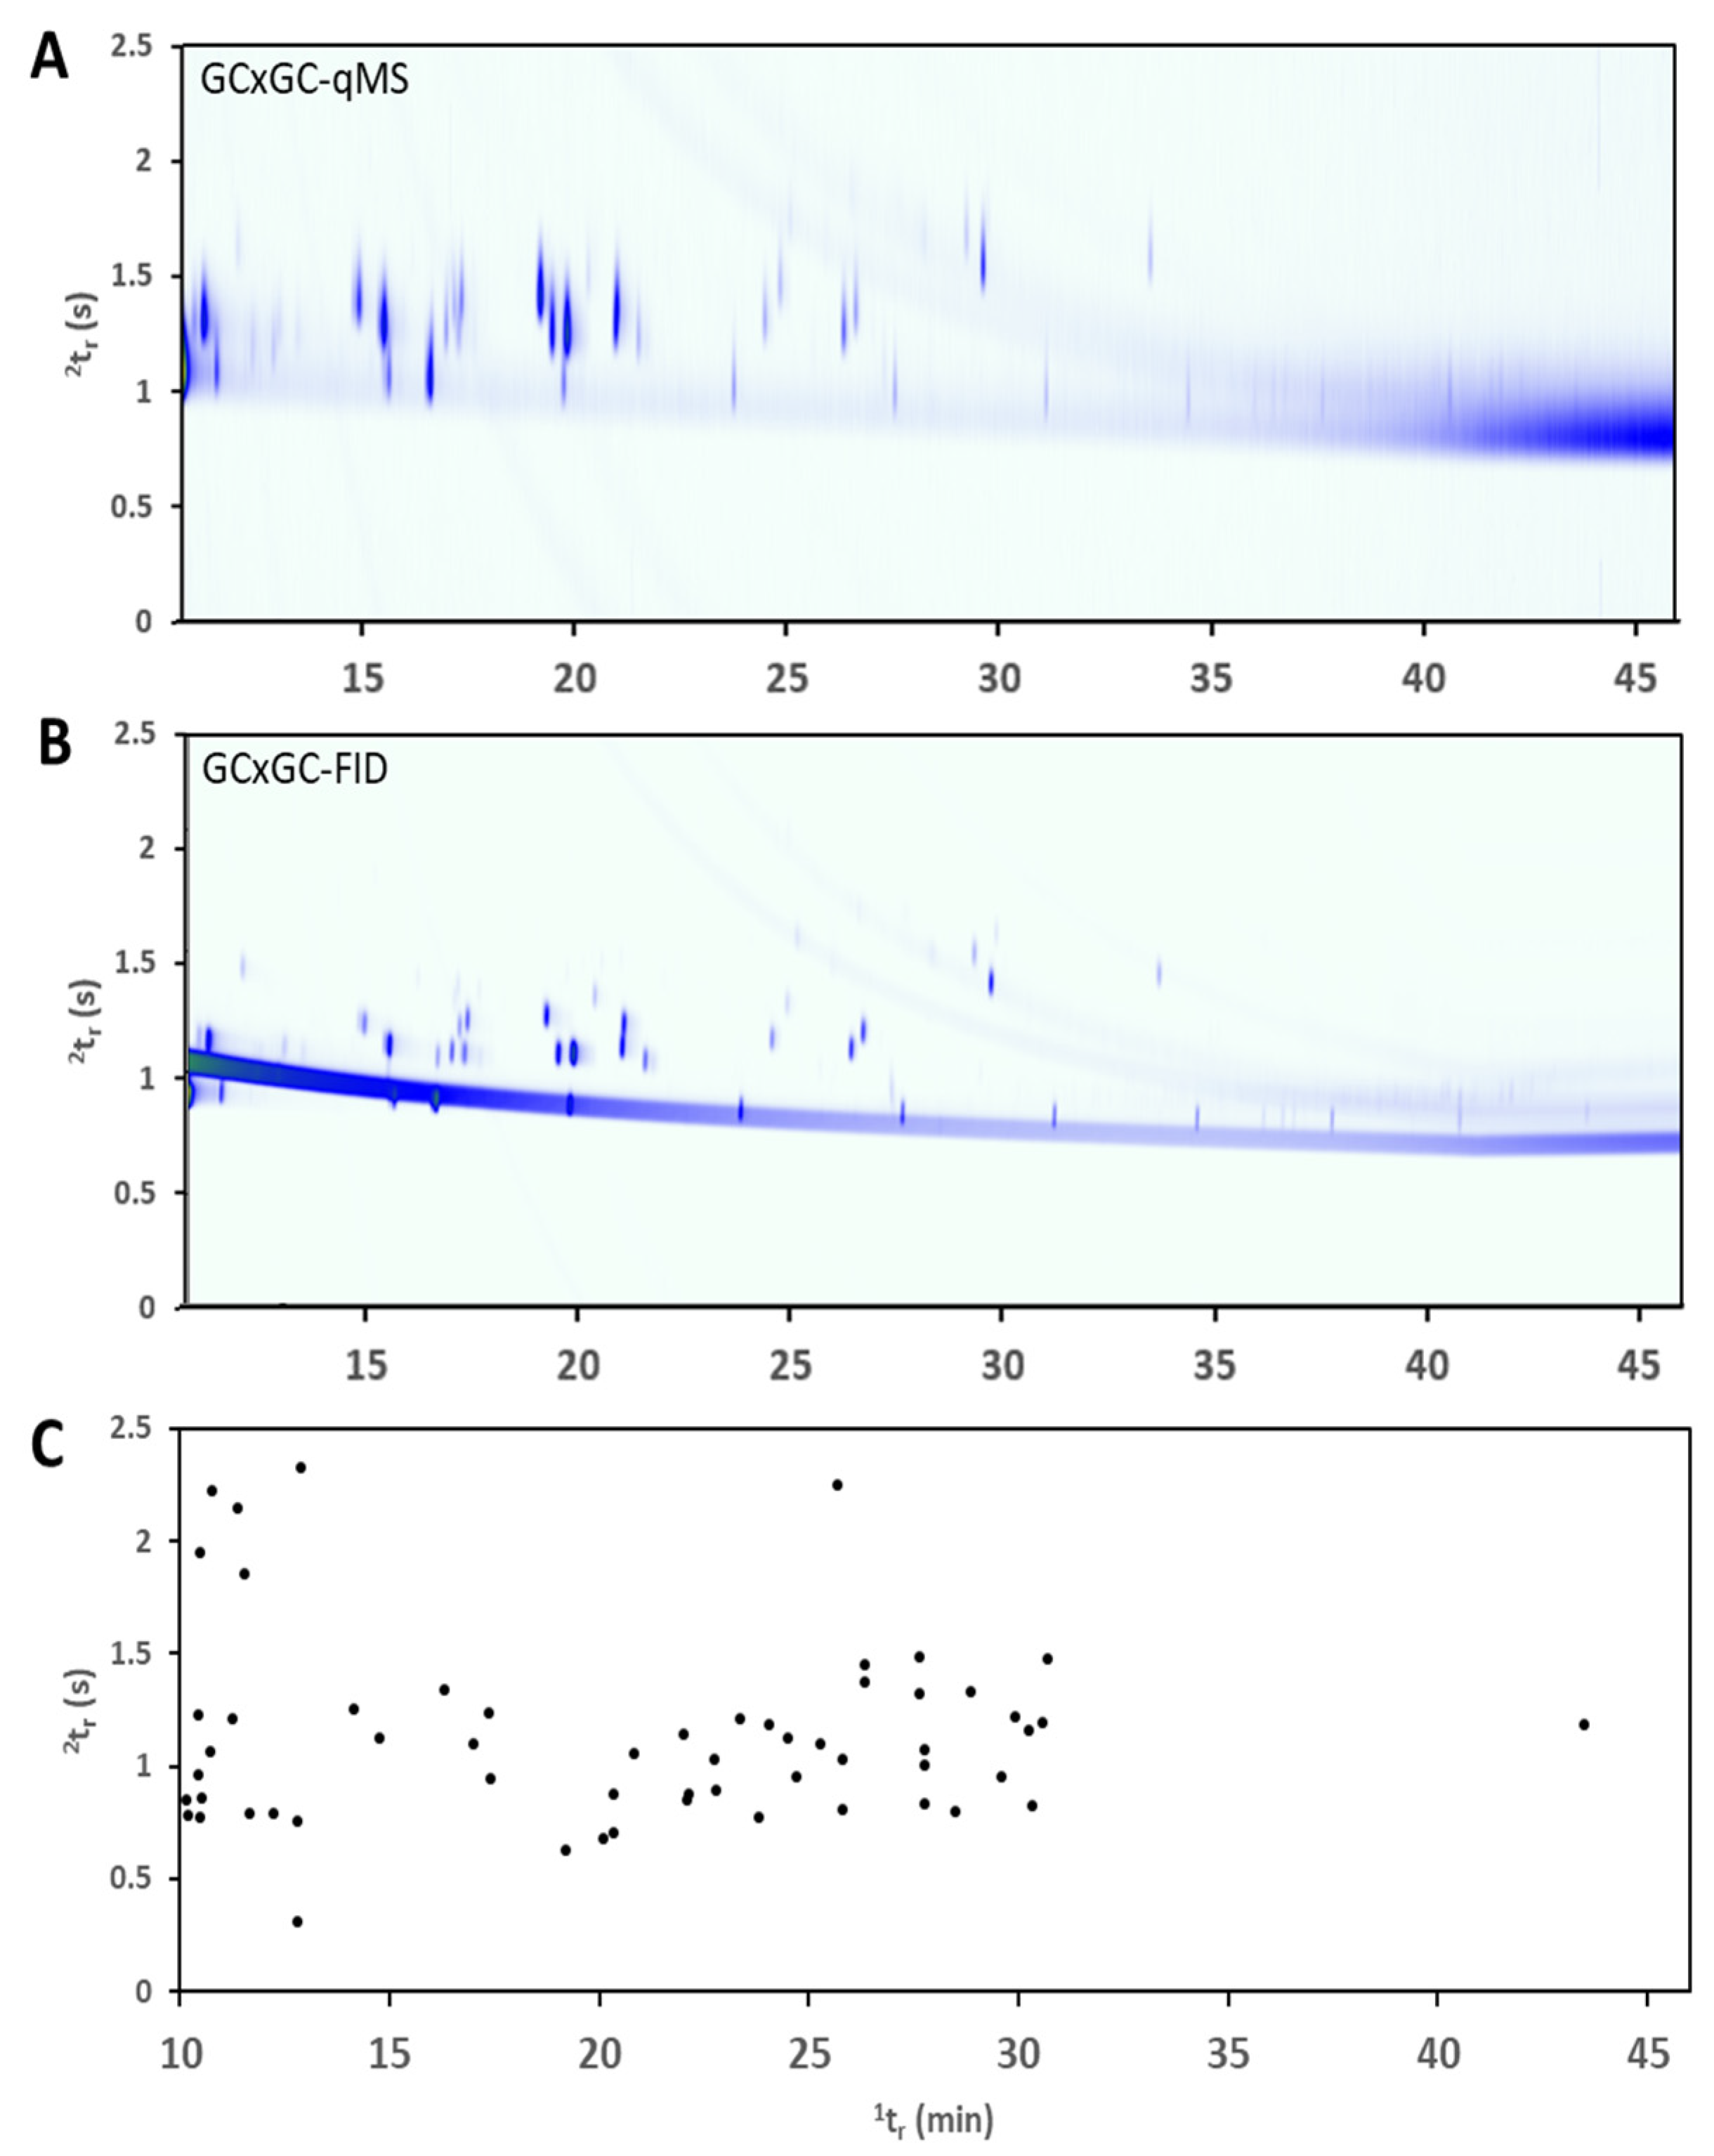
Sample analysis for the human subjects trial was conducted with a Thermo Scientific Trace 1300 gas chromatograph coupled to an ISQ 7000 single quadrupole mass spectrometer and Trace 1300 flame ionization detector (FID). The column junction was equipped with a reverse fill/flush (RFF) INSIGHT flow modulator (SepSolve Analytical Ltd., Peterborough, UK). An Rxi-624Sil MS column (30 m × 0.25 mm ID × 1.4 μm film thickness, Restek Corporation) was used in the first dimension. A Stabilwax column (5 m × 0.25 mm ID × 0.25 μm film thickness, Restek Corporation) was used in the second dimension. The flow rate in the first dimension column was 1.00 mL/min, the auxiliary gas flow was 20.00 mL/min, and the resulting calculated flow rate in the bleed line (5 m × 0.1 mm ID) was 1.00 mL/min. The loop dimensions were 0.53 mm ID × 1133 mm, resulting in a loop volume of 25 μL. The modulation period (PM) was 2.5 s, and the flush time was 100 ms, which was held constant throughout the full duration of the run. The calculated flow rate in the second dimension column was 17.9 mL/min. The carrier gas was ultra-high purity helium (Airgas). The flow was split with a ratio of 4.5:1 between the FID and qMS. The GC oven started at an initial temperature of 60 °C, held for 3 min, was increased to a final temperature 250 °C at a rate of 5 °C/min, and held for 5 min, resulting in a total run time of 46 min. The transfer line and the ion source temperature were held at 280 °C. The qMS, characterized by a maximum scan speed of 20,000 amu/s, was operated in electron ionization (EI) scan mode with a resulting data acquisition rate of ~41.5 Hz for the mass range of 40–300 m/z. The FID was set to 250 °C and was operated with an acquisition rate of 120 Hz. The flow rate for hydrogen (ultra-high purity, Airgas) was 35.0 mL/min. The flow rate for air (ultra-zero purity, Airgas) was 350 mL/min. The flow rate for the nitrogen makeup gas (ultra-high purity, Airgas) was 40 mL/min.
TD tubes containing participants’ breath samples were brought from 4 °C to ambient temperature (~22 °C) for at least 5–10 min, before analysis. Each tube was injected with 1 µL of 10 ppm d5-chlorobenzene (GC Grade, Restek Corporation) in HPLC grade methanol (GC Grade, Restek Corporation) using a micropipette. Helium was directed to the Unity-xr using a dynamic headspace adaptor and inert tubing and redirected through the roof of the GC oven in an insulated transfer line containing uncoated fused silica. Desorption of each sample in the TD tubes was carried out in the Unity-xr, which underwent two-step desorption; primary desorption of the sample took place with a trap flow of 50 mL/min and split flow of 20 mL/min at 300 °C for 5 min following a 1 min nitrogen dry purge. The sample was re-condensed at −10 °C on a general-purpose carbon cold trap for C4/5 to C30/32 (Markes International Ltd.). The cold trap was then rapidly heated for secondary desorption at 320 °C for 3 min following another 1 min nitrogen dry purge. Thermal desorption was controlled using Chromspace (v. 1.5.1.1, SepSolve Analytical Ltd.). The acquisition was controlled through Chromeleon software (version 7.2.9, Thermo Scientific, Waltham, MA, USA).
Data acquisition was performed for both datasets using Thermo Scientific Chromeleon V.7.2.9. GC-qMS data were processed with the same software. GC×GC-qMS *.raw files were exported, converted into *.cdf format, and imported into ChromSpace software V.1.5.1.1 (SepSolve Analytical Ltd.) for processing. GC×GC-FID files were exported as *.cdf and imported into ChromSpace software V.1.5.1.1 (SepSolve Analytical Ltd.) for processing. Data acquisition of collected samples was completed within 2 weeks of sample collection.
4.7. Data Treatment
GC-MS data were treated with the following procedure. MS detection was performed using the ICIS detection algorithm with an area noise factor of 5, a peak noise factor of 150, and a baseline window of 100. The noise method was repetitive. The minimum peak width was 3, multiplet resolution was 10, area tail extension was 5, and area scan window was 0. Peak widths were not constrained. Peak-dependent correction was used with a left region bunch width of 3 spectra, peak spectrum bunch width of 3 spectra, and right region bunch width of 3 spectra. Mass spectra were searched to the mainlib and replib from the National Institute of Standards and Technology (NIST) 2017 MS library. Components from the samples were added to a component table and MS quantitation peaks, confirming peaks (2) and peak detection parameters were manually verified for each compound. Aligned peak reports were exported as *.csv files for analysis in Microsoft Excel.
GC×GC-qMS data were treated with the following procedure. Baseline correction and peak detection of all acquired data files were carried out using Chromspace software (SepSolve Analytical). Dynamic baseline correction was performed on imported *.cdf files with a peak width of 0.4 s. Stencils for the peaks of interest were obtained by applying the curve-fitting algorithm for peak integration with a 3-point Gaussian smoothing function. The minimum peak area was 0.0, the minimum peak height was 600,000, and the minimum peak width was 0.000. Parameters for peak merging included a tolerance of 2%, overlap of 2%, intensity of 2%, and correlation of 0.5. Subpeak apex windows for fronting and tailing were set to 2% for both low and high PM. Compound identifications were supported by searching the National Institute of Standards and Technology (NIST) 2017 library, in combination with retention time matching with breath VOC standards when possible. The standards that were available to confirm compound identities included dimethyl trisulfide, dimethyl disulfide (DMDS), hexanal, heptanal, heptane, octane, nonane, decane, dodecane, tridecane, pentadecane, hexadecane, heptadecane, octadecane, nonadecane, eicosane, heneicosane, tricosane, tetracosane, pentacosane, hexacosane, heptacosane, octacosane, nonacosane, triacontane, benzene, ethylbenzene, toluene, m-xylene, o-xylene, p-xylene (inject 1 microliter in td tube with the run). GC×GC-qMS data were used to generate stencil patterns overtop peaks of interest for each subject after the stencil identification was performed as above.
GC×GC-FID data were treated with the following procedure. Top Hat baseline correction was used on imported *.cdf files using a peak width of 0.4 s. Stencils obtained from GC×GC-qMS data processing method were applied to FID files, and the stencil was transformed manually to align over FID peaks. Peak detection was performed using the local regions of interest produced by these stencils with a minimum peak height of 0.0, minimum peak height was 0.0, and minimum peak width was 0.000. This allowed for the detection of all peak areas within the stencil region. The peak height was used to calculate calibration curves. Parameters for peak merging included tolerance of 10%, overlap of 10%, intensity of 0.5%, correlation of 0.0%. Stencils were adjusted manually to ensure consistent integration for all concentration levels.
Due to the limited scan rate of the qMS detector, the approach on this type of instrumentation is to use the dual-detection system to obtain the best information from each detector. The qMS data stream is used to generate stencils where every peak is identified based on the processed mass spectrum and library search, in combination with a comparison of retention time and standard injection data. The stencils are then applied over the FID data to identify peaks in this single-channel detector. The peak integration is performed at this stage on the FID data where the acquisition rate is much higher and provides sharp and accurate peak shapes. This approach is outlined in previous publications including detector acquisition rates, number of acquisitions across a peak, and data processing workflows [
14,
15] and therefore are not described in detail here.
Exported peak areas were used to calculate Fisher Ratio for each compound for each subject comparison, treating day and control as individual groups (e.g., 1 subject’s samples and controls would generate 6 groups). All breath samples for each subject were grouped separately by the day they gave breath, and control samples from each day were grouped as one group. Fisher Ratio was calculated according to the formula below (equation 1). Fisher Ratios was utilized to discriminate control samples from subjects’ samples, thus Fisher Ratios that exceeded the critical F value (F
crit) were considered to be significant. The F
crit value is determined using the number of groups, number of samples within each group, and the significance level (α = 0.05). The purpose of using the Fisher Ratio to select features of importance is to assess the variance of the chemical markers across different groups of samples.


