Article

Analysis of Pathogenic Bacterial and Yeast Biofilms Using the Combination of Synchrotron ATR-FTIR Microspectroscopy and Chemometric Approaches

1
Nanobiotechnology Laboratory, School of Science, College of Science, Engineering and Health, RMIT University, Melbourne, VIC 3001, Australia
2
School of Science, College of Science, Engineering and Health, RMIT University, Melbourne, VIC 3001, Australia
3
School of Engineering, College of Science, Engineering and Health, RMIT University, Melbourne, VIC 3001, Australia
4
Infrared Microspectroscopy Beamline, ANSTO Australian Synchrotron, Clayton, VIC 3168, Australia
5
Centre for Nutrition and Food Sciences, Queensland Alliance for Agriculture and Food Innovation (QAAFI), The University of Queensland, Brisbane, QLD 4072, Australia
*
Authors to whom correspondence should be addressed.
S.C. and Z.L.S. contributed equally to this work.
Molecules 2021, 26(13), 3890; https://doi.org/10.3390/molecules26133890
Submission received: 25 May 2021 / Revised: 16 June 2021 / Accepted: 19 June 2021 / Published: 25 June 2021
(This article belongs to the Special Issue Autofluorescence Spectroscopy and Imaging II)

Abstract

:
Biofilms are assemblages of microbial cells, extracellular polymeric substances (EPS), and other components extracted from the environment in which they develop. Within biofilms, the spatial distribution of these components can vary. Here we present a fundamental characterization study to show differences between biofilms formed by Gram-positive methicillin-resistant Staphylococcus aureus (MRSA), Gram-negative Pseudomonas aeruginosa, and the yeast-type Candida albicans using synchrotron macro attenuated total reflectance-Fourier transform infrared (ATR-FTIR) microspectroscopy. We were able to characterise the pathogenic biofilms’ heterogeneous distribution, which is challenging to do using traditional techniques. Multivariate analyses revealed that the polysaccharides area (1200–950 cm−1) accounted for the most significant variance between biofilm samples, and other spectral regions corresponding to amides, lipids, and polysaccharides all contributed to sample variation. In general, this study will advance our understanding of microbial biofilms and serve as a model for future research on how to use synchrotron source ATR-FTIR microspectroscopy to analyse their variations and spatial arrangements.

1. Introduction

Numerous bacteria and fungi form biofilms to aid in their reproduction and proliferation. Biofilms are assemblages of microbial cells embedded within a matrix of extracellular polymeric substances (EPS) (such as polysaccharides, DNA, proteins, and lipids) and components obtained from the surrounding environment [1,2]. These biofilms can be found on a variety of biotic and abiotic substrate surfaces [3]. Microbial cells behave differently in biofilms than they do in the planktonic state, resulting in altered gene expression and cell proliferation [4]. Cells that form biofilms possess survival strategies tailored to the particular microbial species involved, such as increased virulence [3] and protection from antimicrobial agents [5,6], harsh environmental conditions [3], and the human immune system [7]. Quorum sensing is used by the microbial cells inside the biofilm to facilitate cell-to-cell communication and horizontal gene transfer, which increases the development of desirable traits, such as drug tolerance [8]. The proliferation of biofilms on surfaces is an issue known as biofouling. Biofouling manifests as enhanced rates of corrosion of metal structures [9], contamination of water systems [10,11], and increased risk of infection in food production [12,13] and healthcare [14], among other settings [9]. Notably, the accumulation of pathogenic biofilms on implanted medical devices results in substantial morbidity, death, and financial costs for both patients and healthcare systems [13,14]. Microbial biofilms present a greater treatment challenge than planktonic bacteria, necessitating the implementation of novel treatment strategies [15,16].
The biochemical composition of the biofilm matrix can vary significantly between different strains and growth conditions [17,18]. The spatial heterogeneity of microbial cells and other biofilm components has been identified as a critical property for biofilm function, resulting in microdomains with variable biochemical composition [19,20]. Being able to map these microdomains can lead to a greater understanding of the complex processes occurring within the biofilm [19]. Different techniques have been employed to map the biochemical spatial arrangement of biofilm components [9,21,22,23,24,25]. Some studies have focused on Fourier-transform infrared (FTIR) imaging [26,27,28], or near-infrared spectroscopy (NIR), which utilizes vibrational spectroscopy to exploit the absorption of light in the near-IR region, as the molecular resonant frequency varies with differences in electronegativity, size, orientations, and/or the molecular environments of the specific molecular species [29]. This technique allows the detection of certain functional groups which are indicative of specific chemical species. The main components of microbial biofilms are lipids, proteins, and polysaccharides, many of which have well-defined vibrational modes in the infrared range of the electromagnetic spectrum [30]. FTIR microspectroscopy can be used for the spatial mapping of samples through spectra acquisition at many points across the sample [26,31], while traditional benchtop FTIR instruments can get to resolutions of a few microns [32].
Additionally, the use of highly collimated synchrotron light for FTIR analysis enables sub-micron spatial mapping and can achieve higher signal-to-noise ratios, allowing for the identification of less prominent peaks in the spectrum associated with specific chemical species [29,33]. Synchrotron-sourced FTIR has been utilized to investigate the biological samples [26,29,33]. To our knowledge, this is the first research to analyze bacterial biofilms using synchrotron macro attenuated total reflectance (ATR)-FTIR microspectroscopic technique.
The chemical properties of monoculture biofilms produced by methicillin-resistant Staphylococcus aureus (MRSA), Pseudomonas aeruginosa, and Candida albicans are investigated in this work. These pathogens were selected as representative of Gram-positive and Gram-negative cells, and yeast, respectively. They are all human pathogens that infect at a high rate through biofilms [34,35,36]. Synchrotron macro ATR-FTIR microspectroscopy at the Australian Synchrotron was utilized to obtain high-resolution spectral maps of the three pathogenic microbial biofilms. These maps were fully analyzed using chemometric approaches such as multivariate statistical methods. This study adds to our understanding of microbial biofilms and demonstrates the utility of synchrotron macro ATR-FTIR microspectroscopy for biofilm analysis.

2. Results and Discussion

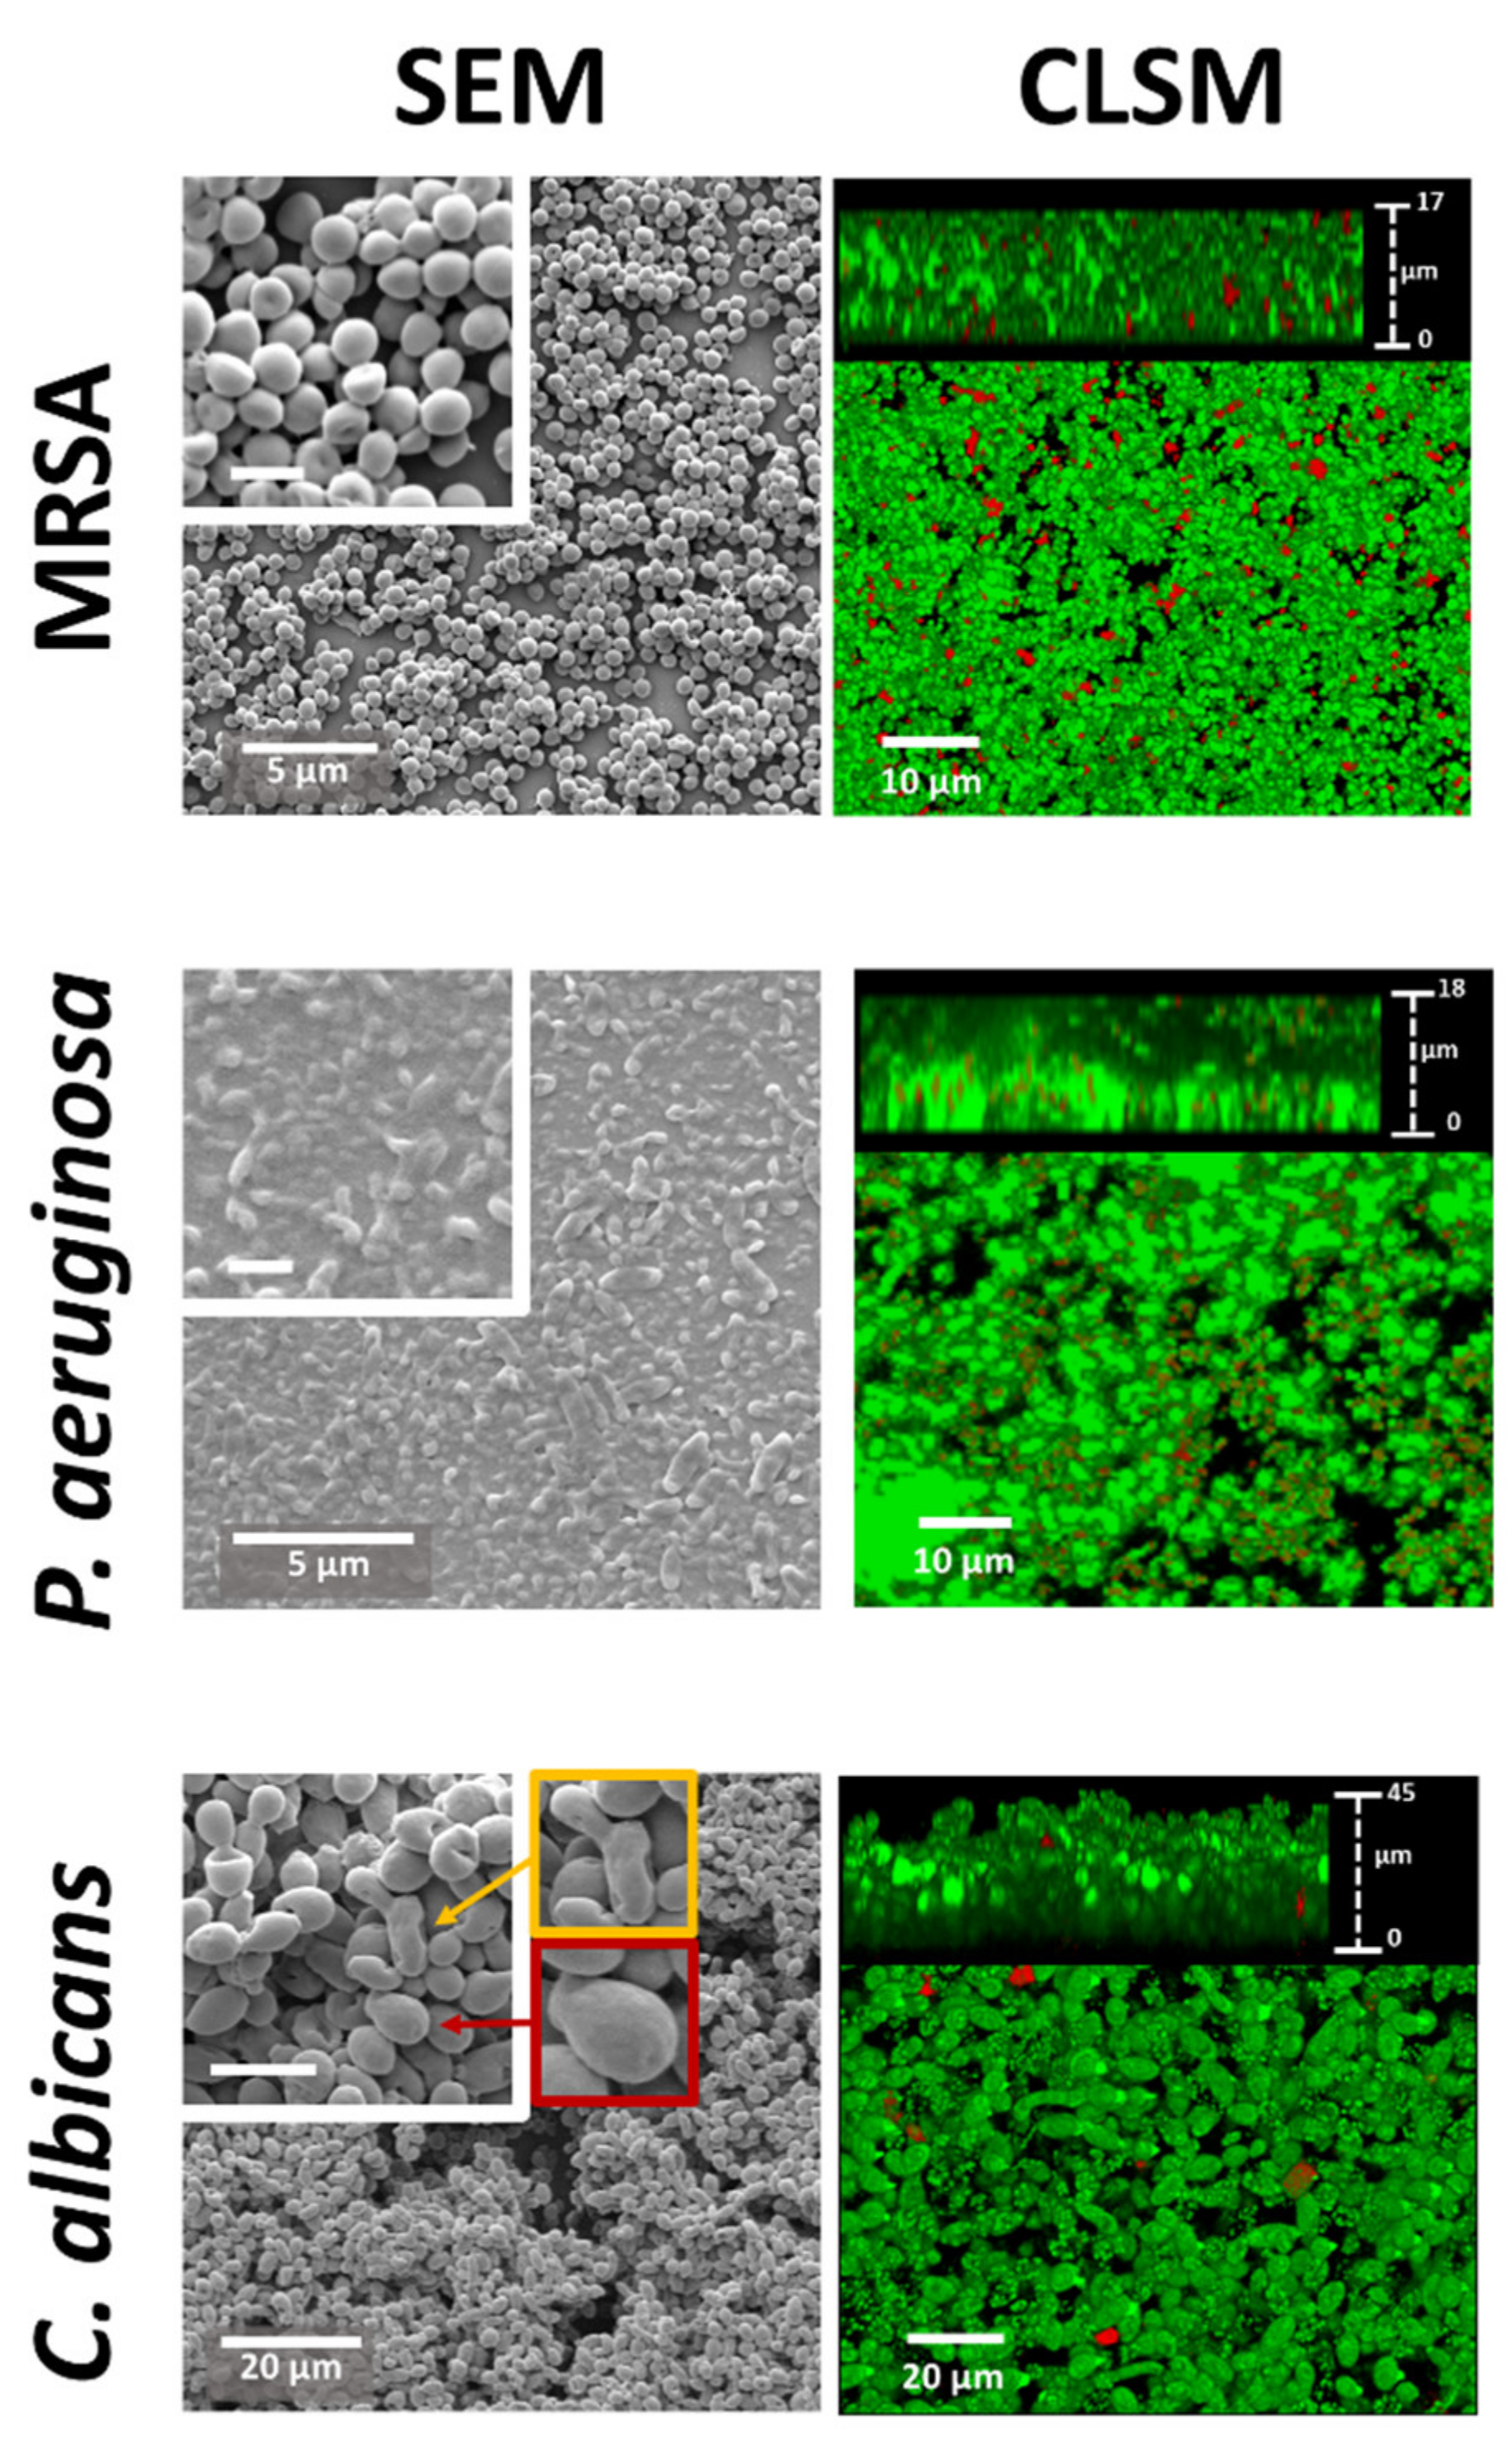
2.1. Biofilm Morphological Characterisation

MRSA, P. aeruginosa and C. albicans were used to prepare biofilms on glass surfaces. These pathogens specifically cause a significant number of biofilm-associated infections on biomedical devices [34,35,36]. The biofilms were visualised using scanning electron microscopy (SEM) and confocal laser scanning microscopy (CLSM) imaging (Figure 1). The SEM images show that all three pathogenic microorganisms formed thick biofilms. Excess non-cellular biomass, presumably composed of EPS, was observed binding individual cells in the P. aeruginosa biofilm, while this non-cellular biomass was less prevalent in the MRSA biofilm. The biofilm of C. albicans was dominated by yeast cells, but it also contained some elongated cells that may have been emerging pseudohyphal cells. Different cell morphologies within C. albicans biofilms have been previously examined [37,38]. This biofilm morphology represents an early-intermediate phase of biofilm formation for C. albicans before significant EPS production [39,40].
CLSM can be used to generate three-dimensional images and data of the biofilms (Figure 1). The biofilms were stained with fluorescent dyes, which allowed for the visualisation of cells with intact membranes (coloured green) and cells with membrane damage (coloured red). These biofilms were thick (>15 µm in all cases) and mostly consisted of green cells with intact membranes, with only a few red cells, suggesting an overall stable biofilm.

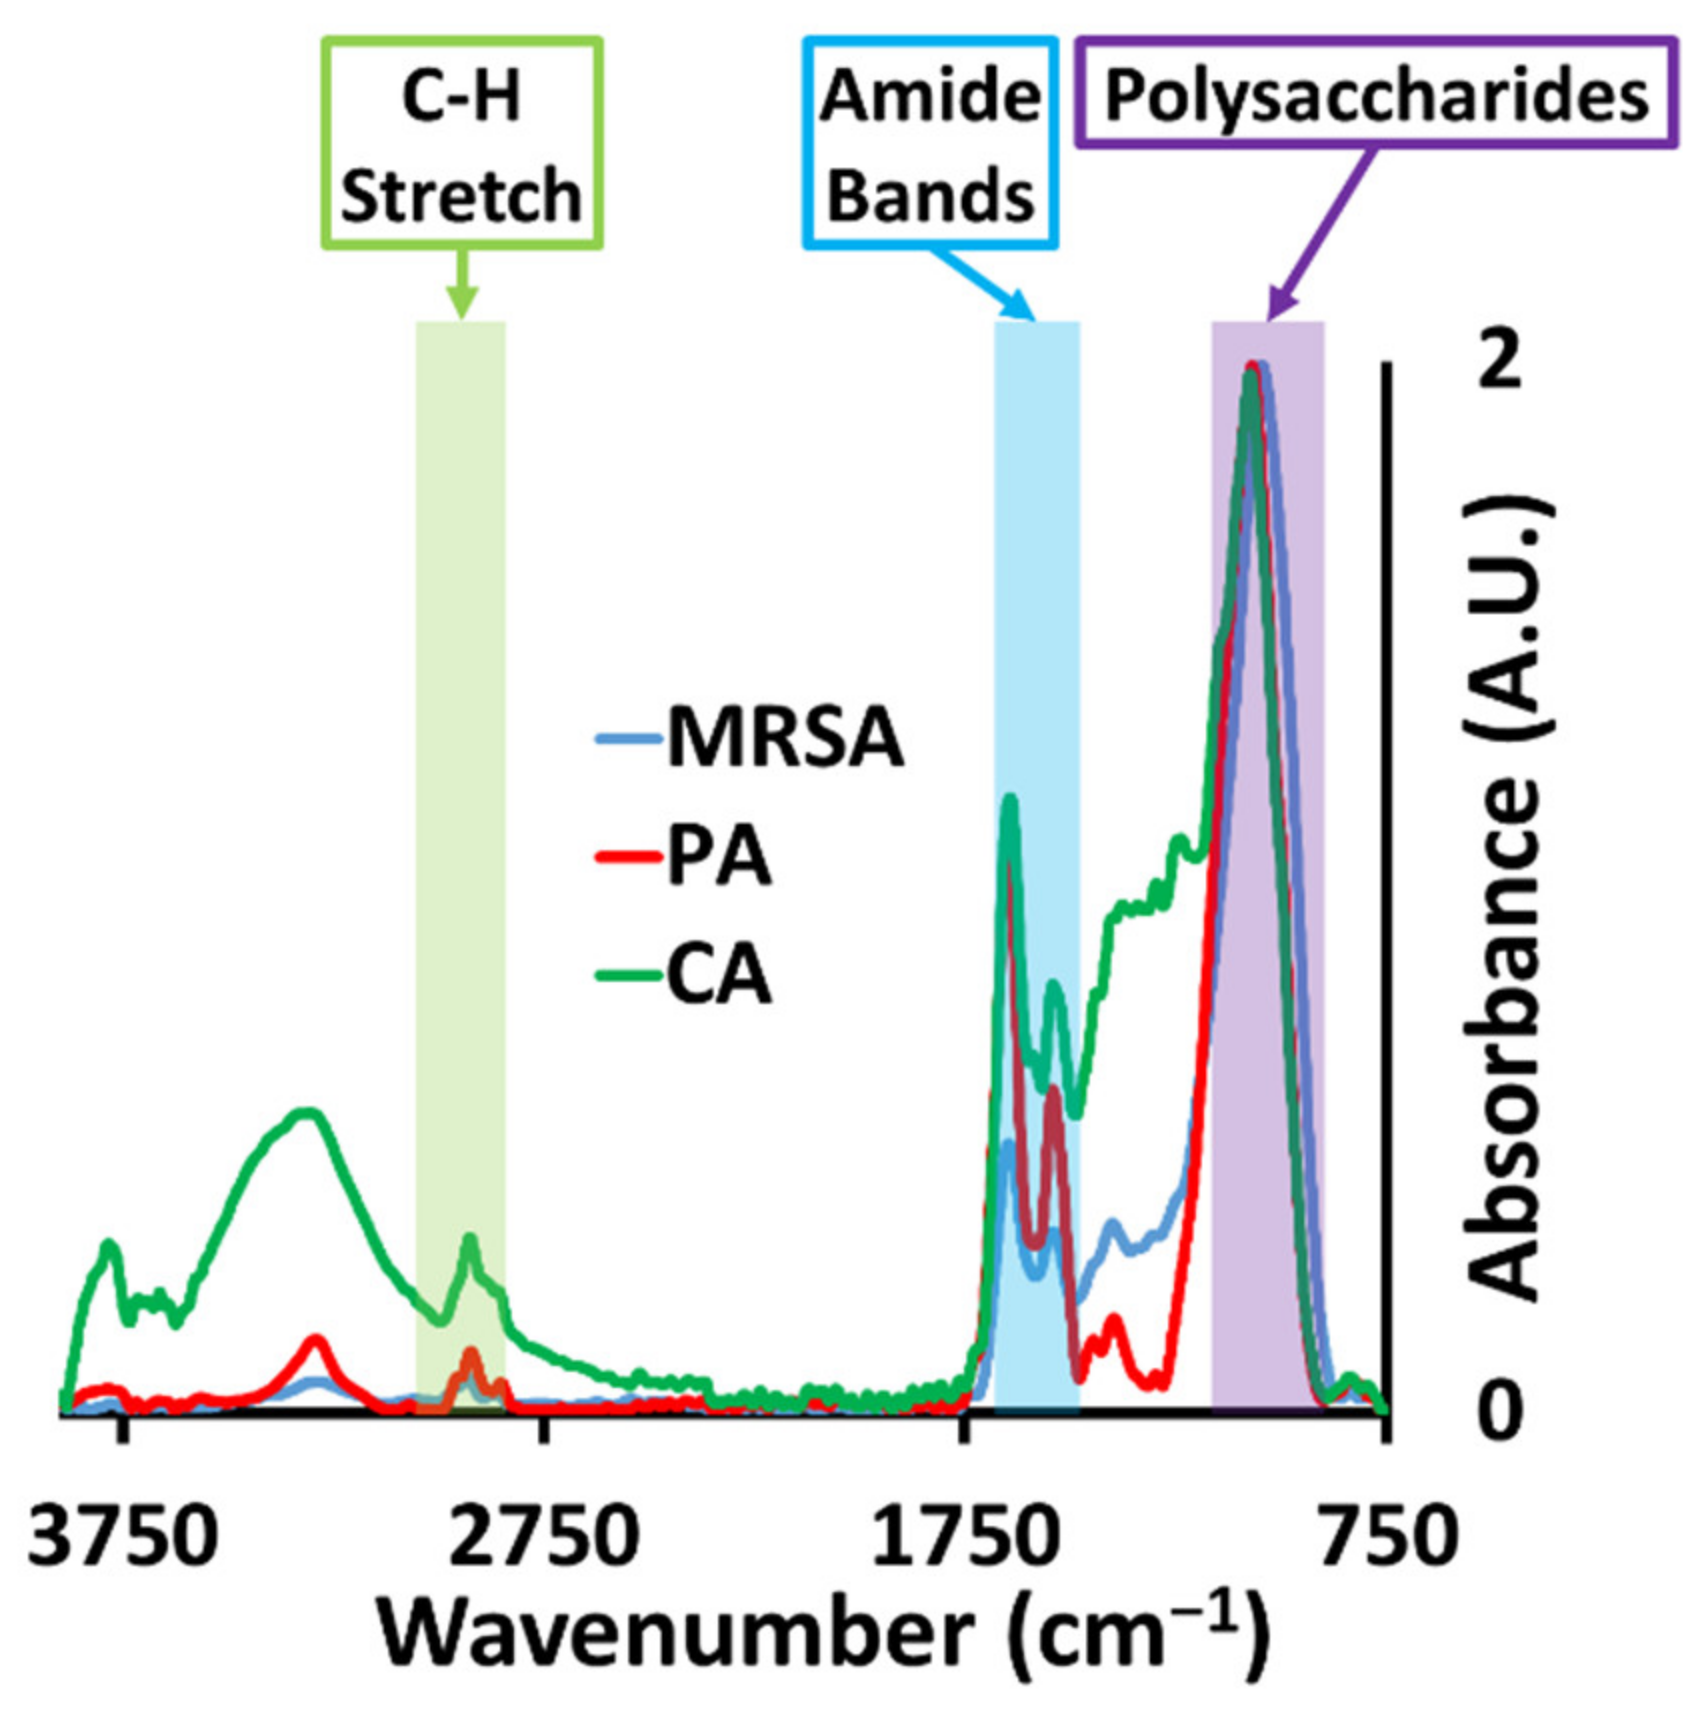
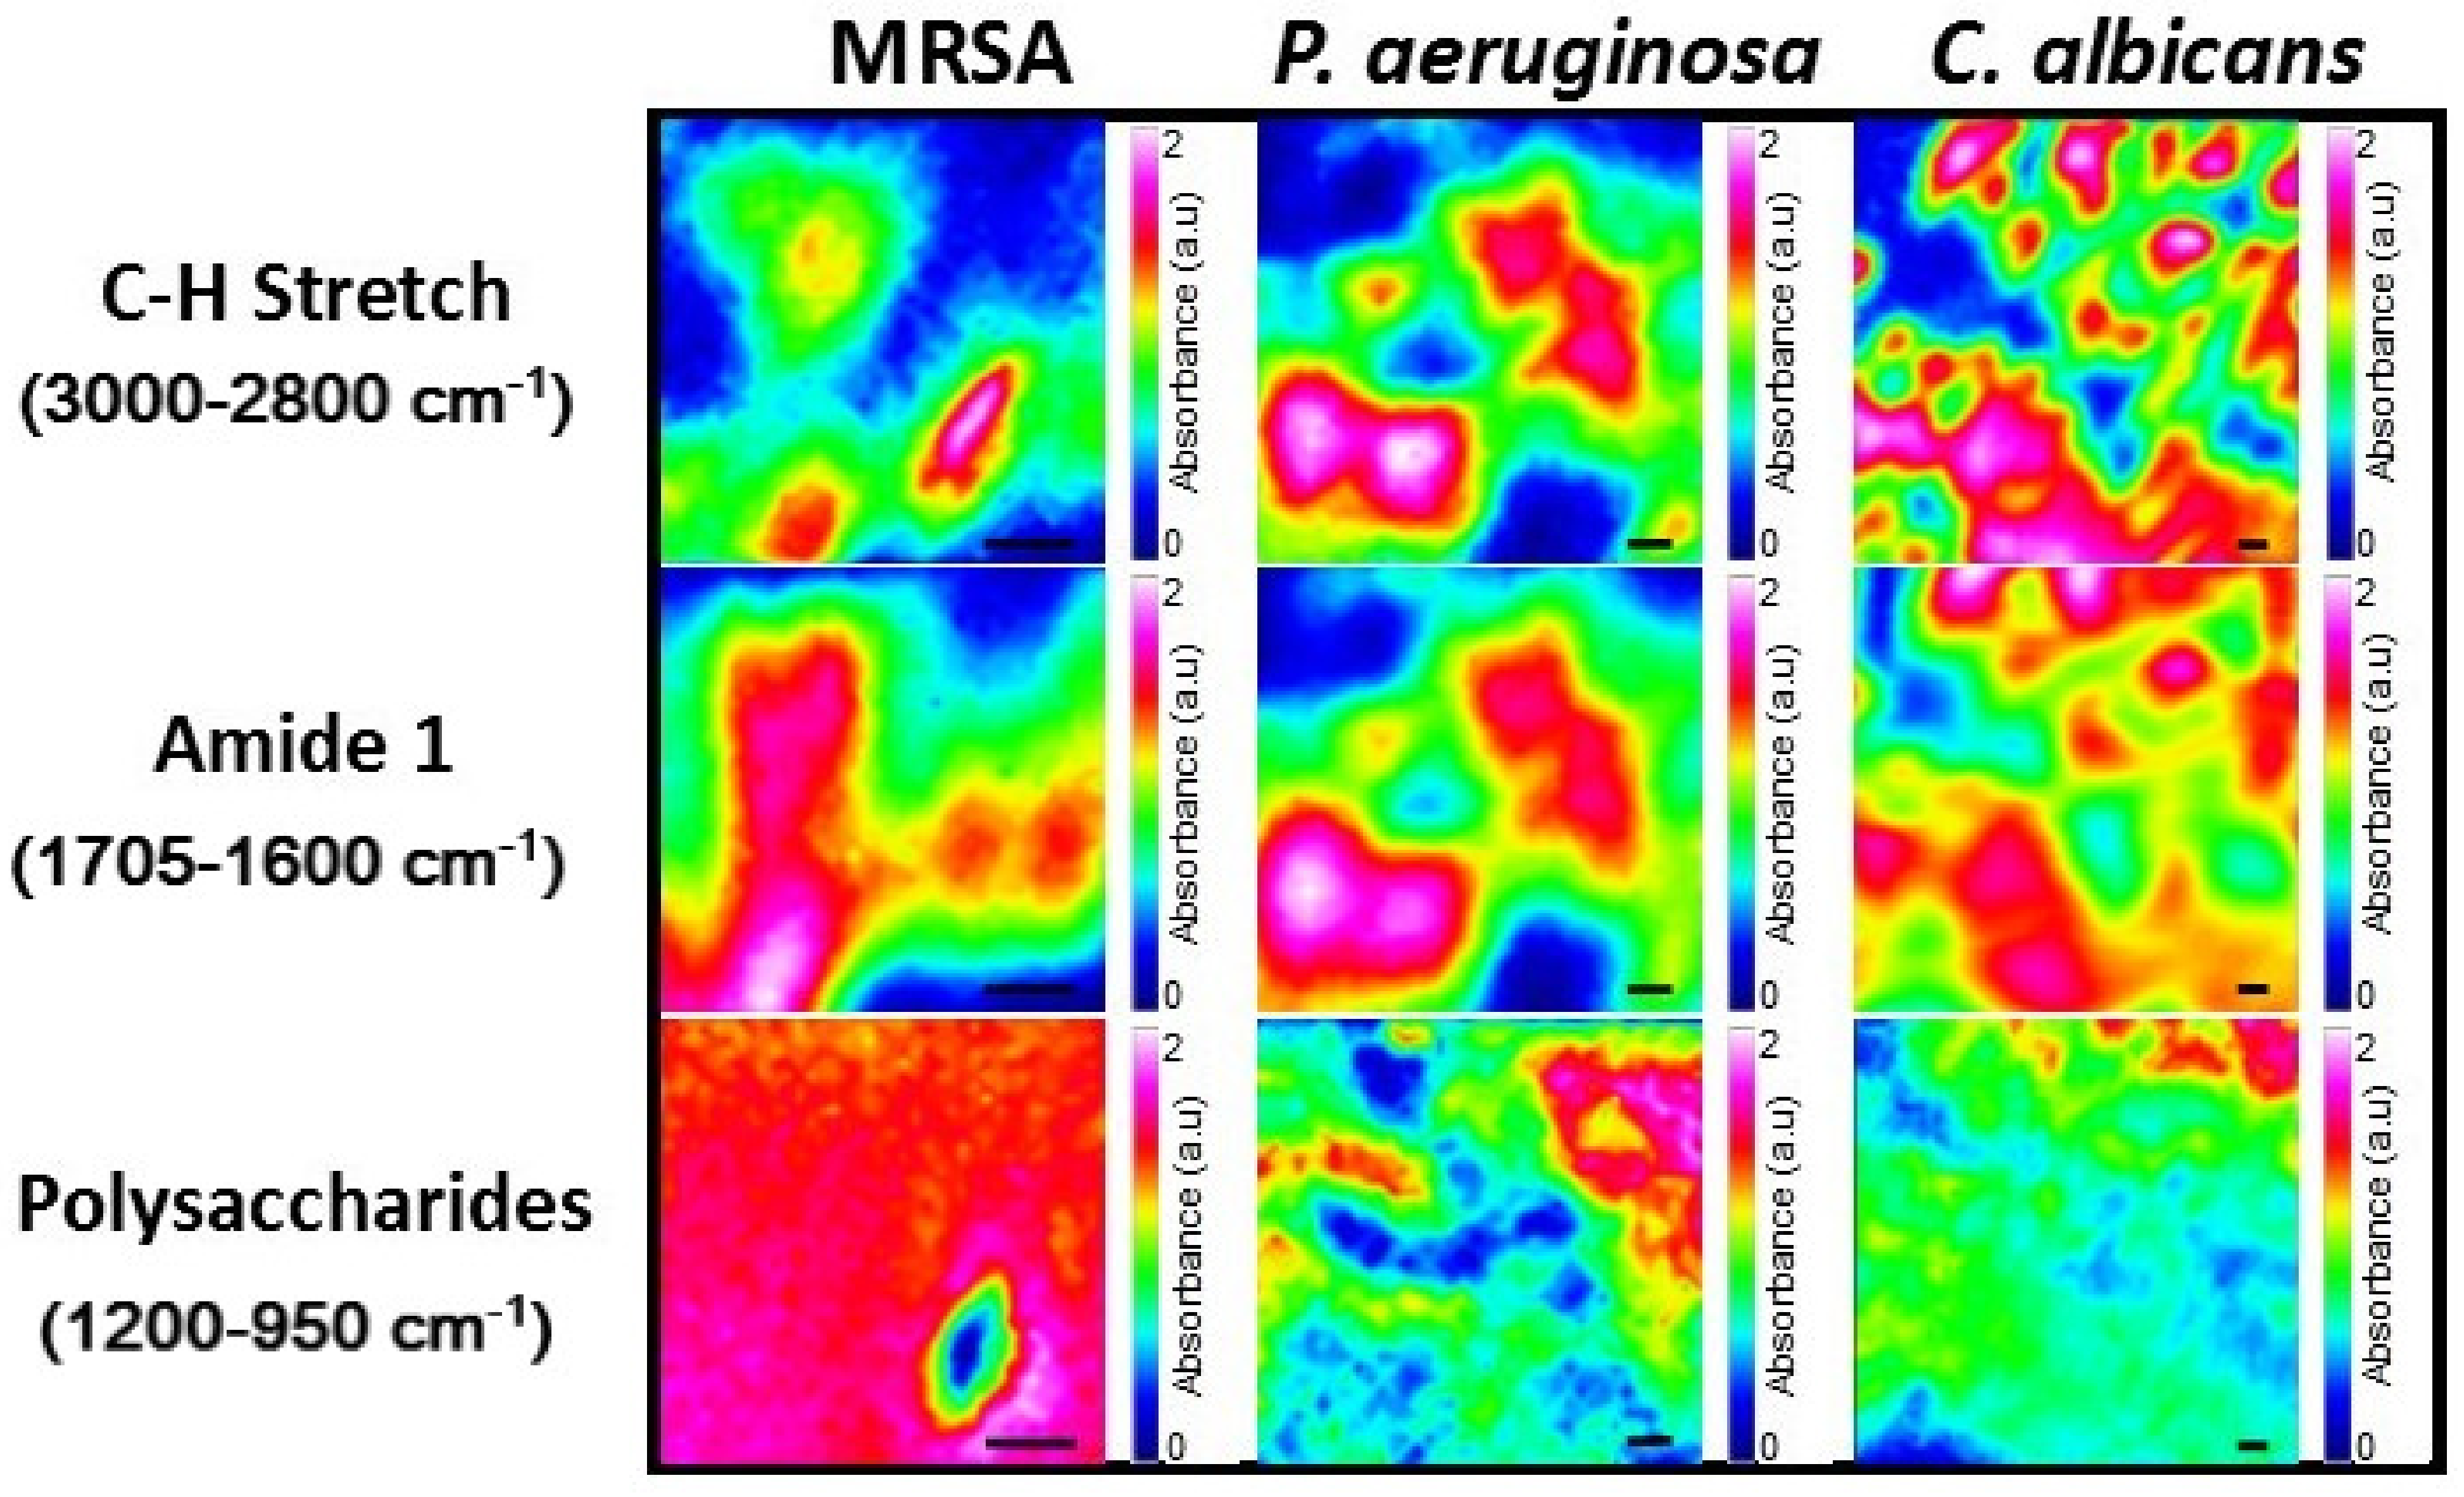
2.2. Analysis of Microbial Biofilms Using Synchrotron Macro ATR-FTIR Microspectroscopy

The microbial biofilms were analysed using macro ATR–FTIR microspectroscopy, generating high-resolution spectral-spatial maps. The spectral region ~3900–750 cm−1 was examined, which includes spectral regions where chemical species indicate the significant components of microbial biofilms, e.g., proteins, lipids and polysaccharides absorb light [30,41]. Table S1 lists the major lipids, proteins, and polysaccharides found in each biofilm used in this analysis. Prior to the analysis, the spectra were smoothed, baseline corrected, and normalized using the OPUS 8.0 program. Table 1 and Table S2 show the functional groups that were assigned to IR spectral regions.
The average macro ATR-FTIR spectra for the three biofilms are presented in Figure 2. These averages were derived from 1600 individual spectra for each of the bacterial species and 4200 spectra for C. albicans, reflective of the larger size of the yeast pathogen. The spectral regions containing characteristic absorption peaks of major chemical species are highlighted. All three biofilms exhibit strong absorptions in the regions assignable for lipids (3000–2800 cm−1), proteins (1705–1600 cm−1) and polysaccharides (1200–950 cm−1). The averaged sample spectra are distinct from each other. To the author’s knowledge, this is the first study to demonstrate the use of synchrotron sourced FTIR as a discriminating technique between microbial biofilms of different species.
Spectral maps of the microbial biofilms were generated by integrating the area under the absorption peaks within the specified regions (Figure 3 and Figure S1). The spectral maps display spatial variation within the biofilms for all spectral regions and microbial species, demonstrating the chemical heterogeneity exhibited within biofilms [2]. Interestingly, the C-H stretch and amide I regions were homologous primarily to each other, for each microbial species respectively. This relationship may be explained by the localization of high concentrations of cellular materials in those regions, which possess biomolecules containing these chemical groups and potentially represent a clustering of cells.

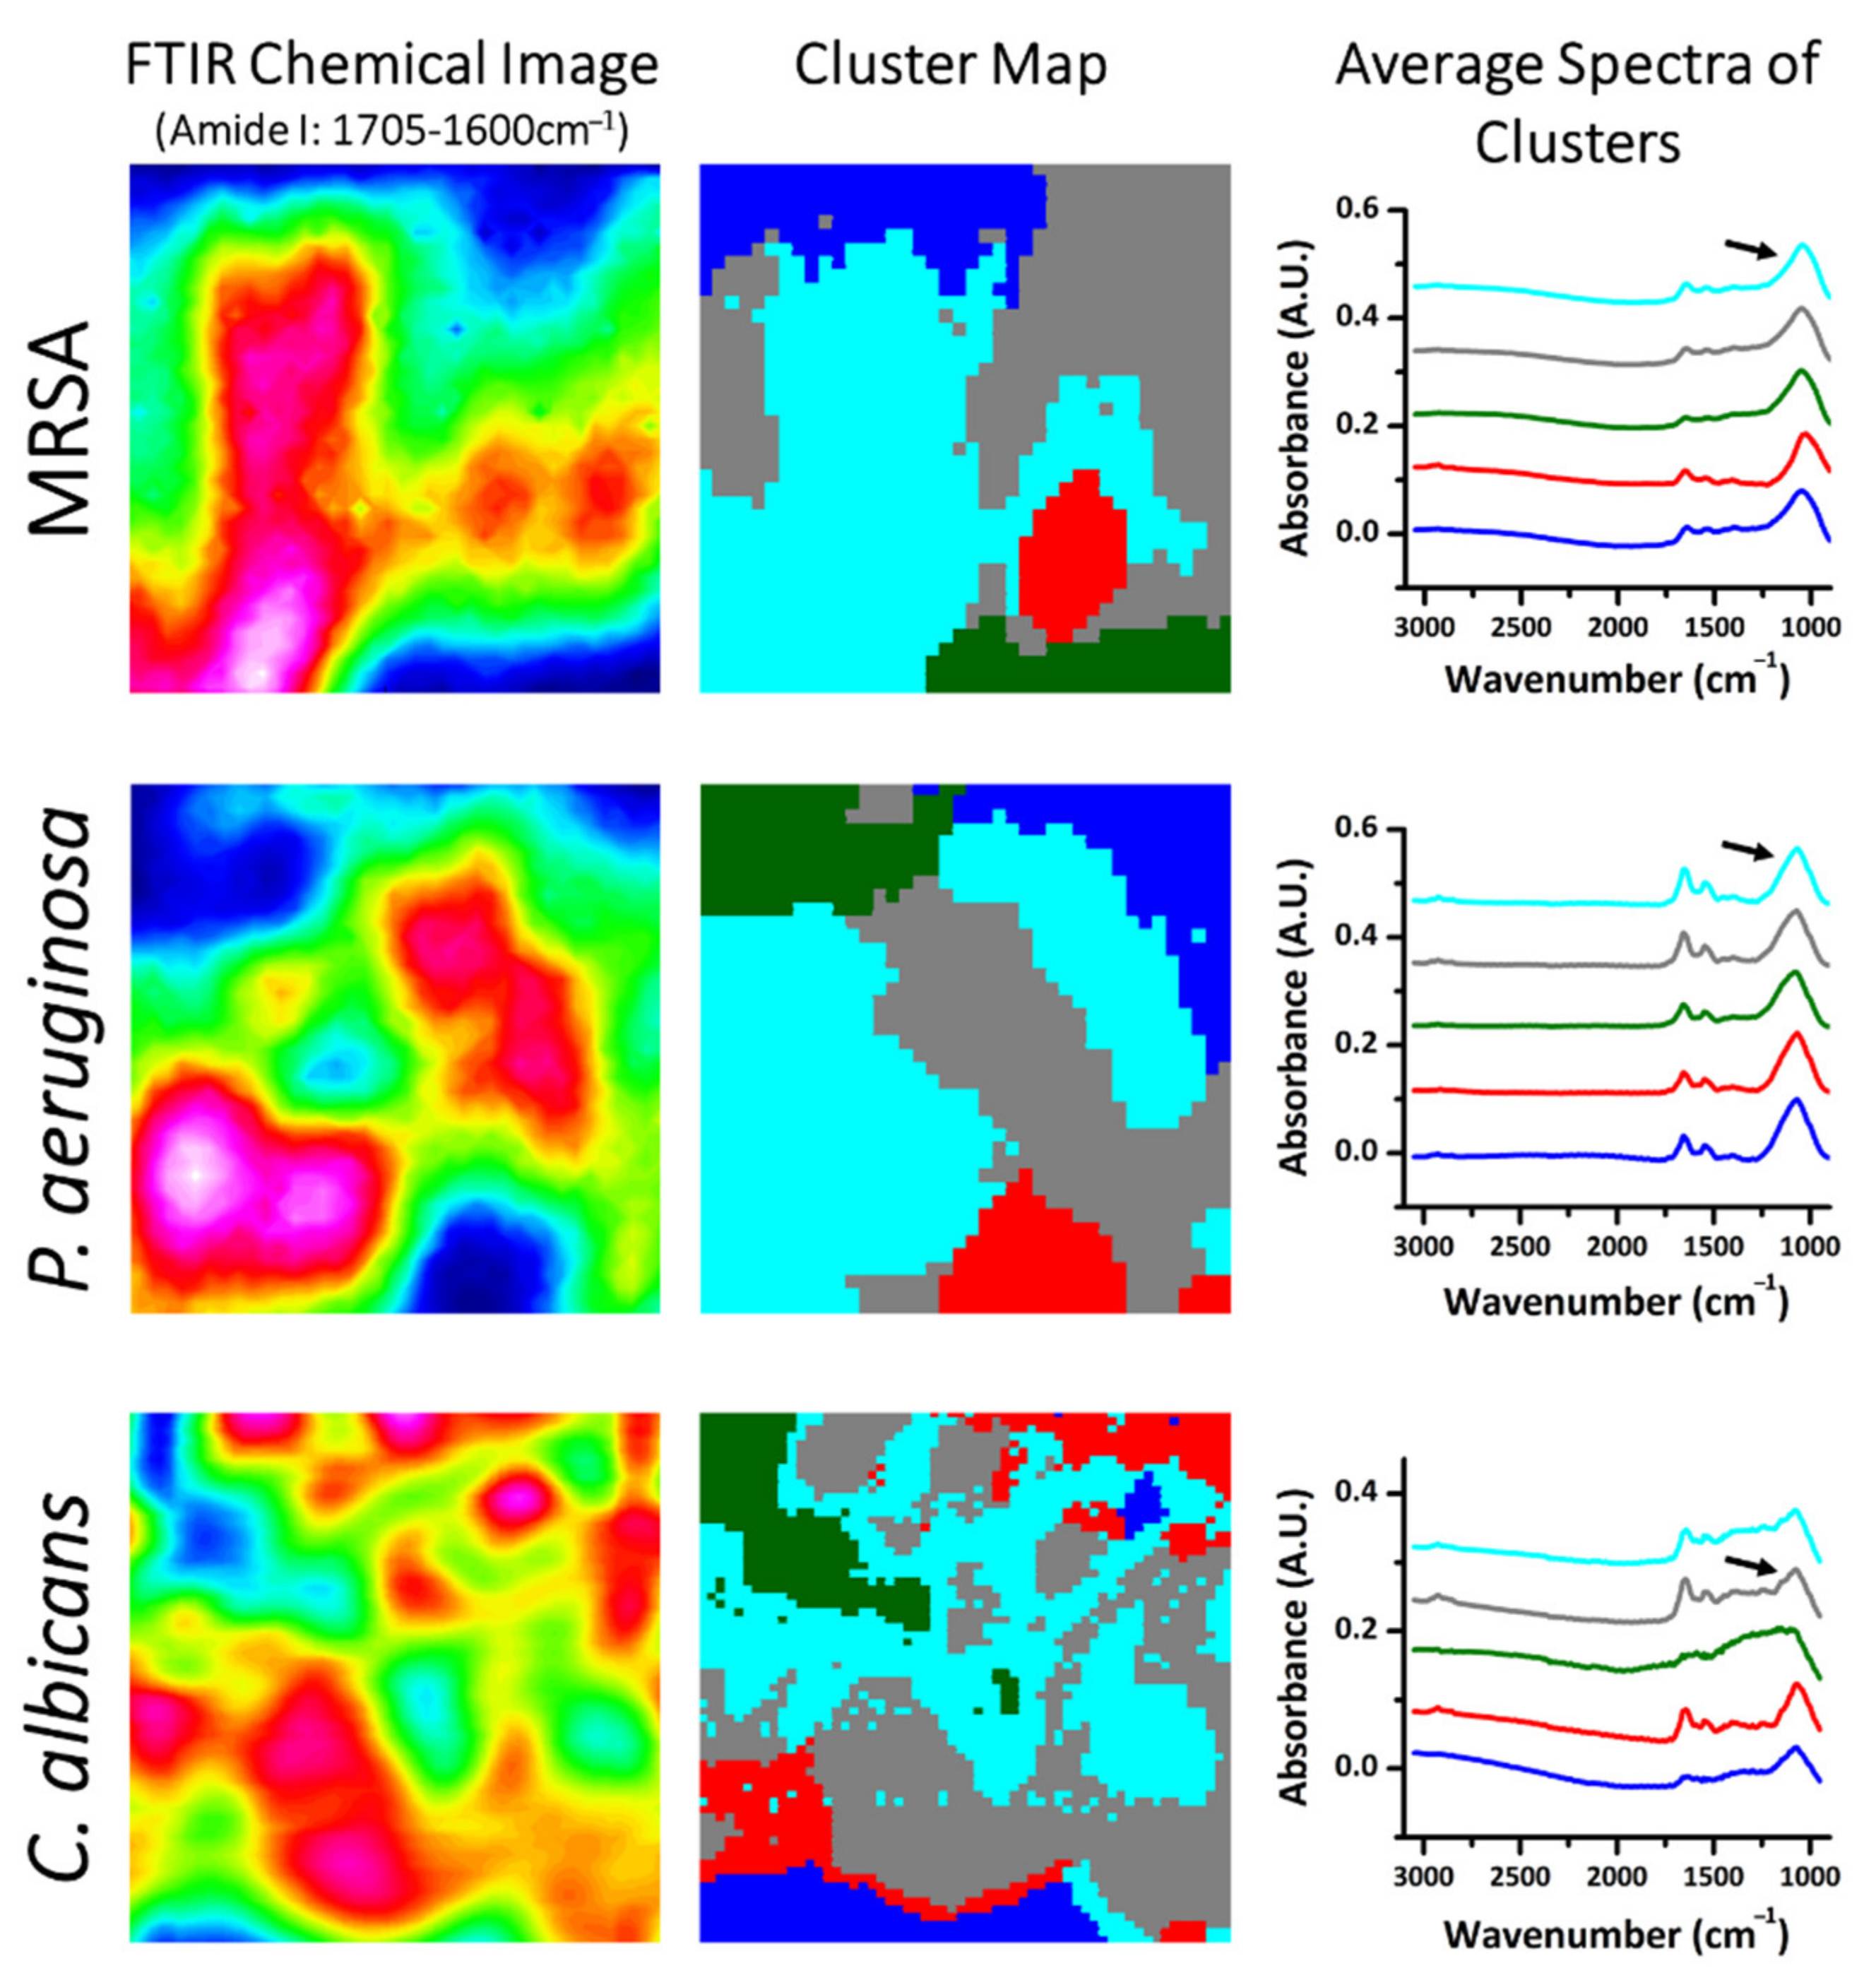
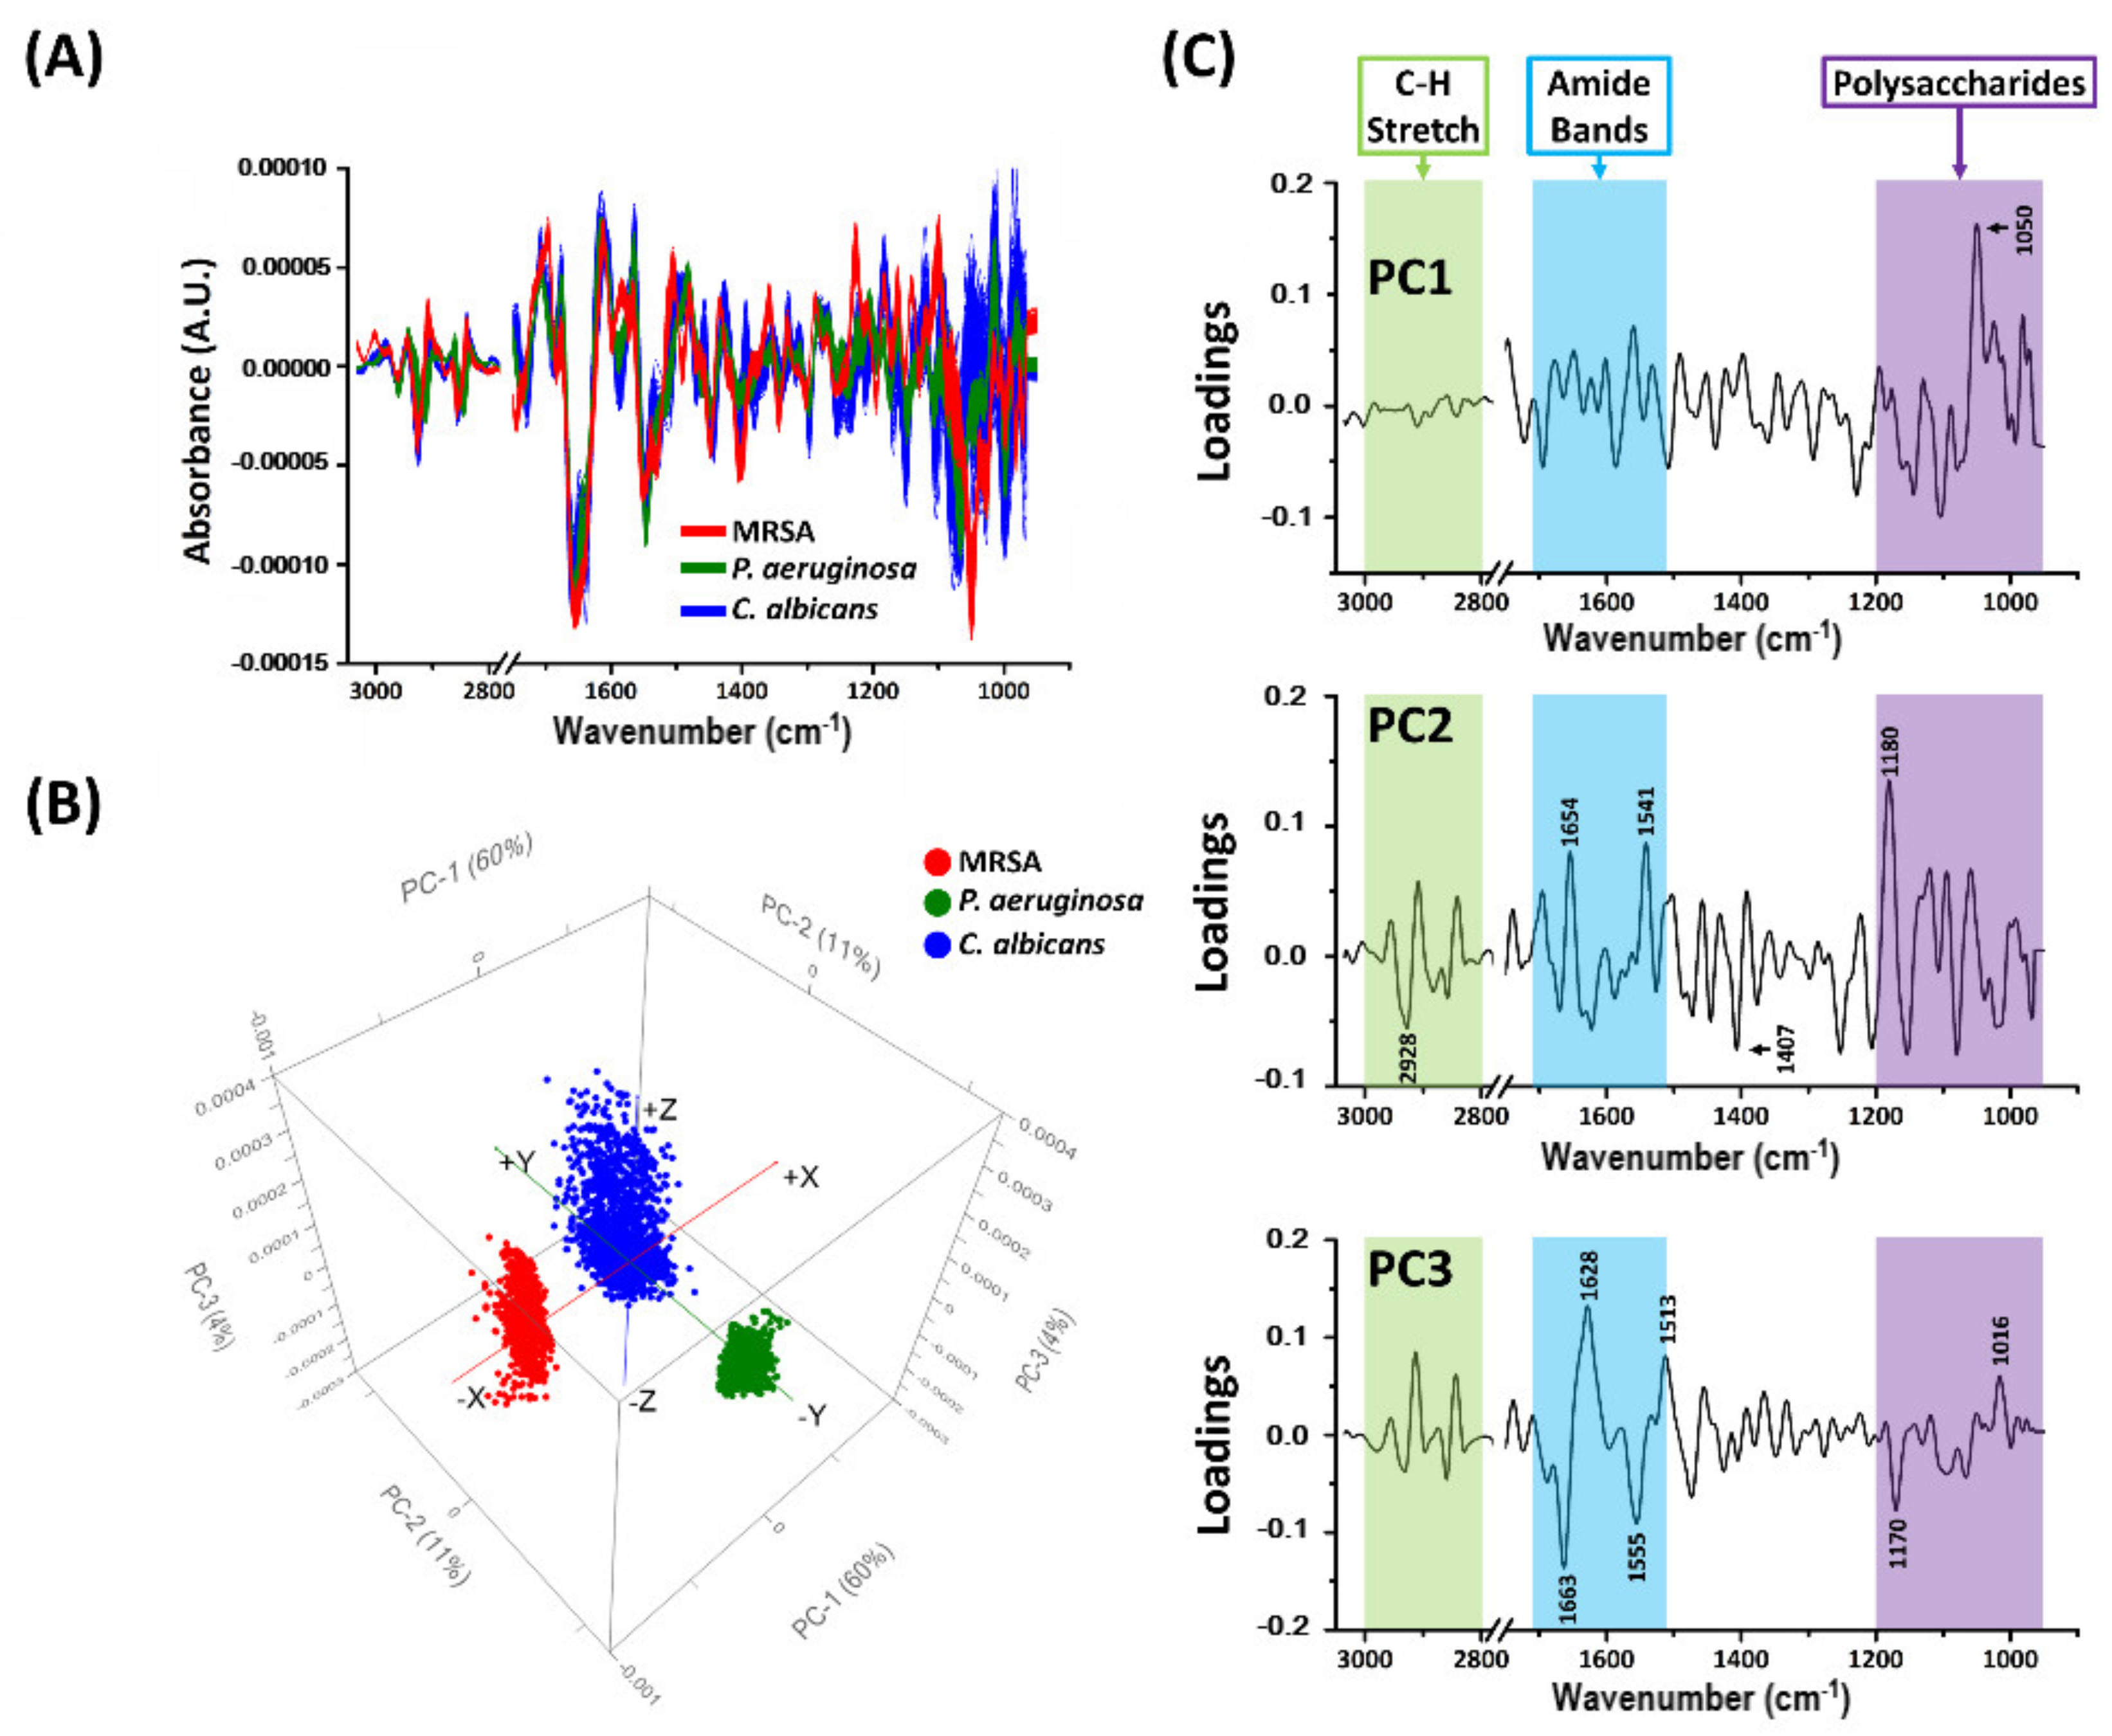
2.3. Comparison of Amide I-Rich Regions of Biofilms through Multivariate Data Analysis

The study of multivariate data revealed differences between microbial biofilm samples. Multivariate data analysis is useful for revealing information in complex data sets that would otherwise be missed by simpler analysis, particularly in natural systems, which are inherently multi-faceted [44,45]. The spectral data were pre-processed by cutting out the biological regions of interest, namely 1755–910 cm−1 and 3035–2780 cm−1, which were used for analysis. Cluster maps are presented in Figure 4 which show groupings of areas with different spectra. These maps were generated from hierarchical cluster analysis (HCA) using the 2nd derivative of the spectral data. The maps show distinct clusters of several micrometers in diameter. The HCA functioned as a quality control test, with HCA clusters chosen for further analysis based on two criteria: (1) low signal-to-noise ratio, and (2) prominent peaks in the amide I region (1705–1600 cm−1). These criteria were chosen as markers for cell-rich regions and represent good quality spectra, useful for further multivariate analysis.
The 2nd derivative of each spectrum within the cluster of interest for each biofilm (detailed in Figure 4) was processed using extended multiplicative scatter correction (EMSC). The results of the princiapl component analysis (PCA) are presented in Figure 5. The 2nd derivative spectra show dominant peaks (maxima) and troughs (minima) in the amide region for all three biofilms (1600–1705 cm−1; Figure 5A and Figure S2). The polysaccharides region, 950–1200 cm−1, also showed differences between the different species biofilm. The PCA score plot shows a clear separation between the three microbial samples (Figure 5B). Most of the variance between the three samples can be explained by the PC1 and PC2, while the PC3 separates individual spectra within each microbial sample.
The PC loading plots are presented in Figure 5C. The loading plot of PC1 shows a notable peak in the polysaccharide region (1050 cm−1). This peak is likely to refer to ν(C–O) coupled with δ(C–O) of C–OH groups of carbohydrates [46,47,48], and is the major contributor towards the observed differences between species in the PCA score plot (Figure 5B). The wavenumbers where notable peaks and troughs occur in the PCA loading plots were assigned with their likely functional group, derived from a literature search, and are presented in Table S3.
When these findings are combined, it is clear that there are discernible variations in the FTIR spectra of the biofilms produced by the three pathogenic microorganisms examined. These distinctions are due to the structural and chemical composition of the three biofilms. The variations between microbial biofilms can be better understood by using multivariate data analysis, which allows for a better understanding of the different biomolecular functional groups presented in various wavelengths that contribute to the differences between and within the different biofilms. The spectral range of polysaccharides was the most important contributor to the variations between the biofilm samples. These findings support the use of synchrotron macro ATR-FTIR microspectroscopy as a novel analysis technique for studying microbial biofilms, by enabling the chemical mapping measurements to be performed at sub-micron scale.

3. Materials and Methods

3.1. Strains, Growth Conditions, and Sample Preparation

Biofilms were grown from two strains of pathogenic bacteria, Staphylococcus aureus ATCC BAA-1680, Pseudomonas aeruginosa ATCC 27853, which were obtained from the American Type Culture Collection (ATCC, Manassas, VA, USA), and one strain of pathogenic yeast, Candida albicans clinical isolate 18-29511395, sourced from South Australia Pathology—Cellular Therapies Laboratory. These species were selected as representative of a Gram-positive and Gram-negative bacteria, and a representative yeast, respectively, all of which cause a significant number of biofilm-associated infections on biomedical devices [34,35,36]. Before each experiment, bacterial cultures were refreshed on lysogeny broth (LB) agar (B.D., U.S.A.) from stocks and grown for 24 h at 37 °C. Yeast cultures were refreshed on potato dextrose broth (PDB) agar at 25 °C for 48 h. Bacterial and yeast suspensions were adjusted to OD600 = 0.3. A total of 2 ml of microbial solution was used for all biofilm experiments. Biofilms were grown on individual glass-bottom cell culture dishes (World Precision Instruments, Sarasota, FL, USA) for CLSM and SEM experiments, and pathology grade glass slide substrates (Livingstone, Australia) for ATR-FTIR analysis at static conditions for 24 h at 37 °C. The glass slide substrates were immersed in the microbial solution to prevent the possibility of their drying out.

3.2. Scanning Electron Microscopy (SEM) Characterisation

Electron micrographs were obtained using a FEI Verios 460L SEM (FEI Company, Hillsboro, OR, USA), measuring secondary electrons and operated with an accelerating voltage of 2–5 kV. For cellular imaging, all samples were affixed using formaldehyde/glutaraldehyde 3% solution in 0.1 M sodium cacodylate buffer (pH~7.4) (ProSciTech, Thuringowa Central, Australia) rinsed, dehydrated using a series of 30%, 50%, 75%, 90%, and 100% ethanol solutions, and coated with a thin film of conductive gold or iridium before imaging.

3.3. Confocal Laser Scanning Microscopy (CLSM) Characterisation

Confocal laser scanning microscopy (CLSM) was performed on an Olympus Fluoview FV1200 inverted microscope and a ZEISS LSM 880 Airyscan upright microscope using a 63× immersion lens. Biofilms were washed gently three times with PBS to remove any planktonic or poorly attached cells. Cells were dyed using a LIVE/DEAD BacLight Bacterial Viability Kit (including SYTO 9 and propidium iodide). Bacterial biofilms were stained according to the manufacturer’s protocol [49]. Z-stack imaging was utilized to generate reconstructed three-dimensional images of the biofilms using the Zen Black software (Zeiss, Oberkochen, Germany).

3.4. Synchrotron Macro Attenuated Total Reflectance-Fourier Transform Infrared (ATR-FTIR) Microspectroscopy

Synchrotron macro ATR-FTIR microspectroscopic analysis of the microbial biofilms was performed at the Infrared Microspectroscopy (IRM) beamline at the Australian Synchrotron using a Bruker Hyperion 2000 FTIR microscope equipped with a liquid nitrogen-cooled narrow-band mercury cadmium telluride (MCT) detector, coupled to a VERTEX V80v FTIR spectrometer (Bruker Optik GmbH, Ettlingen, Germany).
The spatially resolved distribution of the chemical functional groups present in the MRSA, P. aeruginosa, and C. albicans biofilms was imaged in macro attenuated total reflection–Fourier transform infrared (ATR–FTIR) mapping mode, as previously described in [29]. An in-house developed macro ATR–FTIR device equipped with a 250 μm diameter facet germanium (Ge) ATR crystal (nGe = 4.0) and a 20× IR objective (NA = 0.60; Bruker Optik GmbH, Ettlingen, Germany) was used. The unique combination of the high refractive index of the Ge ATR crystal and the high NA objective used in this device, when coupled to the synchrotron-IR beam, allowed the surface characterization of the microbial biofilm samples to be performed at a high spatial resolution < 1 µm.
The biofilms were grown on pathology grade glass slide substrates (Livingstone, Australia) and were fixed with formaldehyde/glutaraldehyde 3% solution in 0.1 M sodium cacodylate buffer (pH~7.4) (ProSciTech, QLD, Australia) to preserve their structure, air-dried, and mounted on an aluminum disc. The aluminium disc was then placed into the sample stage of the macro ATR–FTIR unit. Subsequently, the Ge ATR crystal was brought to the focus of the synchrotron-IR beam, and a background spectrum was recorded in air using 4 cm−1 spectral resolution and 256 co-added scans. The microbial biofilm samples were then brought into contact with the sensing facet of the Ge ATR crystal, and a synchrotron macro ATR–FTIR chemical map was acquired. The penetration depth of this technique is <2 µm, resulting in spectra measured from the top of the biofilm. Every spectrum was collected with a beam defining aperture providing a nominal measurement area of 3.13 μm diameter per pixel, at 0.5 μm step intervals. For each pixel, the synchrotron macro ATR–FTIR spectrum was recorded within a spectral range of 3900–750 cm−1 using 4 cm−1 spectral resolution and 8 co-added scans. Blackman-Harris 3-Term apodisation, power-spectrum phase correction, and a zero-filling factor of 2 were set as the default acquisition parameters using the OPUS 8.0 software suite (Bruker), which was also used for the initial data analysis. Prior to analysis, the spectra were smoothed (25 points), the baseline was corrected using a concave rubberband correction (10 iterations and 64 baseline points), and the spectra were normalized using vector normalization. Chemical maps were generated from the embedded spectra by integrating the area under the relevant peaks using the OPUS 8.0 software.

3.5. Hierarchical Cluster Analysis (HCA) and Principal Component Analysis (PCA)

The multivariate data analysis including HCA and PCA was performed using CytoSpec v. 1.4.02 (Cytospec Inc., Boston, MA, USA) and the Unscrambler X 10.1 software package (CAMO Sofware AS, Oslo, Norway), respectively. The HCA functioned as a quality control test, with HCA clusters chosen for further analysis based on two criteria: (1) low signal-to-noise ratio, and (2) prominent peaks in the amide I region (1705–1600 cm−1). Spectral wavenumbers covering 1755–910 cm−1 and 3035–2780 cm−1 were chosen for analysis, as these regions contain the molecular information most relevant to the microbial biofilm samples [41]: in particular, the protein, lipid, and carbohydrate signals (as summarized in Table 1). HCA analysis was carried out with Ward’s algorithm, and cluster imaging was carried out with the processed 2nd derivative spectra by assigning five clusters to be generated.
Prior to PCA, 2nd derivative spectra were similarly generated using the 9 smoothing data points and a polynomial order of 3, by a Savitzky–Golay algorithm which removed the broad baseline offset and curvature [50]. In addition, the 2nd derivative spectra were further processed by extended multiplicative scatter correction (EMSC). In essence, the EMSC algorithm removes light-scattering artefacts and normalizes the spectra to account for pathlength differences [51]. This has been used previously for the FTIR analysis of microbial biofilms [52]. After EMSC, the PCA was performed using the Unscrambler X 10.1 software package.

4. Conclusions

In this study, three pathogenic microbial biofilms were analyzed using synchrotron macro ATR-FTIR microspectroscopy. The presence of the major groups of biomolecules was determined for each biofilm. Multivariate analysis was able to separate the three biofilms based on their spectra. The likely chemical functional groups contributing to the significant differences between and within each sample were also presented. This work contributes to a greater understanding of microbial biofilms and presents the use of synchrotron ATR-FTIR microspectroscopy as a useful analysis technique for microbial biofilms.

Supplementary Materials

The following are available online, Figure S1: Further spectral maps of the pathogenic biofilms, Figure S2: Average 2nd derivative spectra for each biofilm sample, Figure S3: Cross-validation of synchrotron-sourced IR spectra, Table S1: Relevant biomolecular components of the microbial biofilms, Table S2: Functional groups and their designation to IR spectral regions, Table S3: FTIR band assignments for functional groups found in the PCA loadings. [53,54,55,56,57,58,59,60,61,62,63,64,65,66,67,68] is cited in Supplementary Materials.

Author Contributions

Conceptualization, R.J.C., A.E., J.C. and V.K.T.; methodology, S.C., Z.L.S., J.V., K.J.B., S.G., J.C., A.E. and V.K.T.; formal analysis, S.C., Z.L.S., J.V., M.F.D., S.J.B., G.B., D.C., J.C., A.E. and V.K.T.; data curation, S.C., Z.L.S., J.V., S.G., J.C., A.E. and V.K.T.; writing—original draft preparation, S.C. and Z.L.S.; writing—review and editing, S.C., Z.L.S., R.J.C., S.J.B., G.B., D.C., J.C., A.E. and V.K.T. All authors have read and agreed to the published version of the manuscript.

Funding

This research received no external funding.

Data Availability Statement

Data is available upon reasonable request.

Acknowledgments

The authors acknowledge the support of RMIT Microscopic and Microanalysis Facilities (RMMF). This research was undertaken on the Infrared microspectroscopy (IRM) beamline at Australian Synchrotron (Victoria, Australia).

Conflicts of Interest

There is no conflict of interest.

References

  1. Costerton, J.W.; Lewandowski, Z.; Caldwell, D.E.; Korber, D.R.; Lappin-Scott, H.M. Microbial biofilms. Annu. Rev. Microbiol. 1995, 49, 711–745. [Google Scholar] [CrossRef]
  2. Flemming, H.-C.; Wingender, J. The biofilm matrix. Nat. Rev. Microbiol. 2010, 8, 623–633. [Google Scholar] [CrossRef] [PubMed]
  3. Hall-Stoodley, L.; Costerton, J.W.; Stoodley, P. Bacterial biofilms: From the natural environment to infectious diseases. Nat. Rev. Microbiol. 2004, 2, 95–108. [Google Scholar] [CrossRef] [PubMed]
  4. Flemming, H.-C.; Wingender, J.; Szewzyk, U.; Steinberg, P.; Rice, S.A.; Kjelleberg, S. Biofilms: An emergent form of bacterial life. Nat. Rev. Microbiol. 2016, 14, 563. [Google Scholar] [CrossRef]
  5. Stewart, P.S.; Costerton, J.W. Antibiotic resistance of bacteria in biofilms. Lancet 2001, 358, 135–138. [Google Scholar] [CrossRef]
  6. Høiby, N.; Bjarnsholt, T.; Givskov, M.; Molin, S.; Ciofu, O. Antibiotic resistance of bacterial biofilms. Int. J. Antimicrob. Agents 2010, 35, 322–332. [Google Scholar] [CrossRef] [Green Version]
  7. Arciola, C.R.; Campoccia, D.; Montanaro, L. Implant infections: Adhesion, biofilm formation and immune evasion. Nat. Rev. Microbiol. 2018, 16, 397–409. [Google Scholar] [CrossRef]
  8. Roberts, A.P.; Mullany, P. Oral biofilms: A reservoir of transferable, bacterial, antimicrobial resistance. Expert Rev. Anti Infect. Ther. 2010, 8, 1441–1450. [Google Scholar] [CrossRef] [PubMed]
  9. Lens, P.; O’Flaherty, V.; Moran, A.; Stoodley, P.; Mahony, T. Biofilms in Medicine, Industry and Environmental Biotechnology; IWA Publishing: London, UK, 2003. [Google Scholar]
  10. Coleman, D.C.; O’Donnell, M.J.; Shore, A.C.; Russell, R.J. Biofilm problems in dental unit water systems and its practical control. J. Appl. Microbiol. 2009, 106, 1424–1437. [Google Scholar] [CrossRef] [PubMed]
  11. Simões, L.C.; Simões, M. Biofilms in drinking water: Problems and solutions. RSC Adv. 2013, 3, 2520–2533. [Google Scholar] [CrossRef] [Green Version]
  12. Kumar, C.G.; Anand, S.K. Significance of microbial biofilms in food industry: A review. Int. J. Food Microbiol. 1998, 42, 9–27. [Google Scholar] [CrossRef]
  13. Brooks, J.D.; Flint, S.H. Biofilms in the food industry: Problems and potential solutions. Int. J. Food Sci. Technol. 2008, 43, 2163–2176. [Google Scholar] [CrossRef]
  14. Donlan, R.M. Biofilms and device-associated infections. Emerg. Infect. Dis. 2001, 7, 277–281. [Google Scholar] [CrossRef]
  15. Davies, D. Understanding biofilm resistance to antibacterial agents. Nat. Rev. Drug Discov. 2003, 2, 114–122. [Google Scholar] [CrossRef]
  16. Li, X.; Sun, L.; Zhang, P.; Wang, Y. Novel approaches to combat medical device-associated biofilms. Coatings 2021, 11, 294. [Google Scholar] [CrossRef]
  17. Dynes, J.J.; Lawrence, J.R.; Korber, D.R.; Swerhone, G.D.W.; Leppard, G.G.; Hitchcock, A.P. Morphological and biochemical changes in Pseudomonas fluorescens biofilms induced by sub-inhibitory exposure to antimicrobial agents. Can. J. Microbiol. 2009, 55, 163–178. [Google Scholar] [CrossRef]
  18. Andrews, J.S.; Rolfe, S.A.; Huang, W.E.; Scholes, J.D.; Banwart, S.A. Biofilm formation in environmental bacteria is influenced by different macromolecules depending on genus and species. Environ. Microbiol. 2010, 12, 2496–2507. [Google Scholar] [CrossRef] [PubMed]
  19. Wimpenny, J.; Manz, W.; Szewzyk, U. Heterogeneity in biofilms. FEMS Microbiol. Rev. 2000, 24, 661–671. [Google Scholar] [CrossRef]
  20. Nadell, C.D.; Drescher, K.; Foster, K.R. Spatial structure, cooperation and competition in biofilms. Nat. Rev. Microbiol. 2016, 14, 589–600. [Google Scholar] [CrossRef] [PubMed]
  21. Pan, M.; Zhu, L.; Chen, L.; Qiu, Y.; Wang, J. Detection techniques for extracellular polymeric substances in biofilms: A review. BioResources 2016, 11, 8092–8115. [Google Scholar] [CrossRef] [Green Version]
  22. Azeredo, J.; Azevedo, N.F.; Briandet, R.; Cerca, N.; Coenye, T.; Costa, A.R.; Desvaux, M.; Di Bonaventura, G.; Hébraud, M.; Jaglic, Z.; et al. Critical review on biofilm methods. Crit. Rev. Microbiol. 2017, 43, 313–351. [Google Scholar] [CrossRef] [Green Version]
  23. Costa, A.M.; Mergulhão, F.J.; Briandet, R.; Azevedo, N.F. It is all about location: How to pinpoint microorganisms and their functions in multispecies biofilms. Future Microbiol. 2017, 12, 987–999. [Google Scholar] [CrossRef]
  24. Dunham, S.J.B.; Ellis, J.F.; Li, B.; Sweedler, J.V. Mass spectrometry imaging of complex microbial communities. Acc. Chem. Res. 2017, 50, 96–104. [Google Scholar] [CrossRef] [PubMed]
  25. Zhang, P.; Chen, Y.-P.; Qiu, J.-H.; Dai, Y.-Z.; Feng, B. Imaging the microprocesses in biofilm matrices. Trends Biotechnol. 2019, 37, 214–226. [Google Scholar] [CrossRef] [PubMed]
  26. Holman, H.-Y.N.; Bechtel, H.A.; Hao, Z.; Martin, M.C. Synchrotron IR spectromicroscopy: Chemistry of living cells. Anal. Chem. 2010, 82, 8757–8765. [Google Scholar] [CrossRef] [PubMed]
  27. Holman, H.-Y.N.; Miles, R.; Hao, Z.; Wozei, E.; Anderson, L.M.; Yang, H. Real-time chemical imaging of bacterial activity in biofilms using open-channel microfluidics and synchrotron FTIR spectromicroscopy. Anal. Chem. 2009, 81, 8564–8570. [Google Scholar] [CrossRef]
  28. Probst, A.J.; Holman, H.-Y.N.; DeSantis, T.Z.; Andersen, G.L.; Birarda, G.; Bechtel, H.A.; Piceno, Y.M.; Sonnleitner, M.; Venkateswaran, K.; Moissl-Eichinger, C. Tackling the minority: Sulfate-reducing bacteria in an archaea-dominated subsurface biofilm. ISME J. 2013, 7, 635–651. [Google Scholar] [CrossRef] [Green Version]
  29. Cheeseman, S.; Truong, V.K.; Vongsvivut, J.; Tobin, M.J.; Crawford, R.; Ivanova, E.P. Applications of synchrotron-source IR spectroscopy for the investigation of insect wings. In Synchrotron Radiation; Intechopen: London, UK, 2019. [Google Scholar]
  30. Ojeda, J.J.; Dittrich, M. Fourier transform infrared spectroscopy for molecular analysis of microbial cells. In Microbial Systems Biology; Springer: Totowa, NJ, USA, 2012; pp. 187–211. [Google Scholar]
  31. Reuben, S.; Banas, K.; Banas, A.; Swarup, S. Combination of synchrotron radiation-based Fourier transforms infrared microspectroscopy and confocal laser scanning microscopy to understand spatial heterogeneity in aquatic multispecies biofilms. Water Res. 2014, 64, 123–133. [Google Scholar] [CrossRef]
  32. Kazarian, S.G.; Chan, K.L.A. Applications of ATR-FTIR spectroscopic imaging to biomedical samples. Biochim. Biophys. Acta Biomembr. 2006, 1758, 858–867. [Google Scholar] [CrossRef] [PubMed] [Green Version]
  33. Vongsvivut, J.; Pérez-Guaita, D.; Wood, B.R.; Heraud, P.; Khambatta, K.; Hartnell, D.; Hackett, M.J.; Tobin, M.J. Synchrotron macro ATR-FTIR microspectroscopy for high-resolution chemical mapping of single cells. Analyst 2019, 144, 3226–3238. [Google Scholar] [CrossRef] [PubMed]
  34. Ramage, G.; Martínez, J.P.; López-Ribot, J.L. Candida biofilms on implanted biomaterials: A clinically significant problem. FEMS Yeast Res. 2006, 6, 979–986. [Google Scholar] [CrossRef] [Green Version]
  35. Archer, N.K.; Mazaitis, M.J.; Costerton, J.W.; Leid, J.G.; Powers, M.E.; Shirtliff, M.E. Staphylococcus aureus biofilms. Virulence 2011, 2, 445–459. [Google Scholar] [CrossRef] [Green Version]
  36. Mulcahy, L.R.; Isabella, V.M.; Lewis, K. Pseudomonas aeruginosa biofilms in disease. Microb. Ecol. 2014, 68, 1–12. [Google Scholar] [CrossRef] [PubMed] [Green Version]
  37. Cavalheiro, M.; Teixeira, M.C. Candida biofilms: Threats, challenges, and promising strategies. Front. Med. 2018, 5, 28. [Google Scholar] [CrossRef] [PubMed] [Green Version]
  38. Lohse, M.B.; Gulati, M.; Johnson, A.D.; Nobile, C.J. Development and regulation of single- and multi-species Candida albicans biofilms. Nat. Rev. Microbiol. 2018, 16, 19–31. [Google Scholar] [CrossRef] [Green Version]
  39. Chandra, J.; Kuhn, D.M.; Mukherjee, P.K.; Hoyer, L.L.; McCormick, T.; Ghannoum, M.A. Biofilm formation by the fungal pathogen Candida albicans: Development, architecture, and drug resistance. J. Bacteriol. Res. 2001, 183, 5385–5394. [Google Scholar] [CrossRef] [Green Version]
  40. Seneviratne, C.; Jin, L.; Samaranayake, L. Biofilm lifestyle of Candida: A mini review. Oral Dis. 2008, 14, 582–590. [Google Scholar] [CrossRef]
  41. Mantsch, H.H.; Chapman, D. Infrared Spectroscopy of Biomolecules; Wiley-Liss: New York, NY, USA, 1996. [Google Scholar]
  42. Coates, J. Interpretation of infrared spectra, a practical approach. In Encyclopedia of Analytical Chemistry; John Wiley & Sons Ltd: Chichester, UK, 2000. [Google Scholar]
  43. Ali, M.H.M.; Rakib, F.; Abdelalim, E.M.; Limbeck, A.; Mall, R.; Ullah, E.; Mesaeli, N.; McNaughton, D.; Ahmed, T.; Al-Saad, K. Fourier-transform infrared imaging spectroscopy and laser ablation -ICPMS new vistas for biochemical analyses of ischemic stroke in rat brain. Front. Neurosci. 2018, 12, 647. [Google Scholar] [CrossRef]
  44. Jung, G.B.; Nam, S.W.; Choi, S.; Lee, G.-J.; Park, H.-K. Evaluation of antibiotic effects on Pseudomonas aeruginosa biofilm using Raman spectroscopy and multivariate analysis. Biomed. Opt. Express 2014, 5, 3238–3251. [Google Scholar] [CrossRef] [PubMed]
  45. Chapman, J.; Truong, V.K.; Elbourne, A.; Gangadoo, S.; Cheeseman, S.; Rajapaksha, P.; Latham, K.; Crawford, R.J.; Cozzolino, D. Combining chemometrics and sensors: Toward new applications in monitoring and environmental analysis. Chem. Rev. 2020, 120, 6048–6069. [Google Scholar] [CrossRef]
  46. Wong, P.T.; Wong, R.K.; Caputo, T.A.; Godwin, T.A.; Rigas, B. Infrared spectroscopy of exfoliated human cervical cells: Evidence of extensive structural changes during carcinogenesis. Proc. Natl. Acad. Sci. USA 1991, 88, 10988–10992. [Google Scholar] [CrossRef] [Green Version]
  47. Böcker, U.; Ofstad, R.; Wu, Z.; Bertram, H.C.; Sockalingum, G.D.; Manfait, M.; Egelandsdal, B.; Kohler, A. Revealing covariance structures in Fourier transform infrared and Raman microspectroscopy spectra: A study on pork muscle fiber tissue subjected to different processing parameters. Appl. Spectrosc. 2007, 61, 1032–1039. [Google Scholar] [CrossRef]
  48. Vongsvivut, J.; Heraud, P.; Gupta, A.; Puri, M.; McNaughton, D.; Barrow, C.J. FTIR microspectroscopy for rapid screening and monitoring of polyunsaturated fatty acid production in commercially valuable marine yeasts and protists. Analyst 2013, 138, 6016–6031. [Google Scholar] [CrossRef] [Green Version]
  49. Boulos, L.; Prévost, M.; Barbeau, B.; Coallier, J.; Desjardins, R. LIVE/DEAD® BacLight™: Application of a new rapid staining method for direct enumeration of viable and total bacteria in drinking water. J. Microbiol. Methods 1999, 37, 77–86. [Google Scholar] [CrossRef]
  50. Savitzky, A.; Golay, M.J.E. Smoothing and differentiation of data by simplified least squares procedures. Anal. Chem. 1964, 36, 1627–1639. [Google Scholar] [CrossRef]
  51. Kohler, A.; Kirschner, C.; Oust, A.; Martens, H. Extended multiplicative signal correction as a tool for separation and characterization of physical and chemical information in Fourier transform infrared microscopy images of cryo-sections of beef loin. Appl. Spectrosc. 2005, 59, 707–716. [Google Scholar] [CrossRef] [PubMed]
  52. Correa, E.; Sletta, H.; Ellis, D.I.; Hoel, S.; Ertesvåg, H.; Ellingsen, T.E.; Valla, S.; Goodacre, R. Rapid reagentless quantification of alginate biosynthesis in Pseudomonas fluorescens bacteria mutants using FT-IR spectroscopy coupled to multivariate partial least squares regression. Anal. Bioanal. Chem. 2012, 403, 2591–2599. [Google Scholar] [CrossRef]
  53. Lister, J.L.; Horswill, A.R. Staphylococcus aureus biofilms: Recent developments in biofilm dispersal. Front. Cell. Infect. Microbiol. 2014, 4, 178. [Google Scholar] [CrossRef] [Green Version]
  54. Götz, F. Staphylococcus and biofilms. Mol. Microbiol. 2002, 43, 1367–1378. [Google Scholar] [CrossRef] [PubMed]
  55. Neill, E.; Pozzi, C.; Houston, P.; Humphreys, H.; Robinson, D.A.; Loughman, A.; Foster, T.J.; Gara, J.P. A Novel Staphylococcus aureus; Biofilm phenotype mediated by the fibronectin-binding proteins, FnBPA and FnBPB. J. Bacteriol. 2008, 190, 3835–3850. [Google Scholar] [CrossRef] [PubMed] [Green Version]
  56. Dakheel, K.H.; Abdul Rahim, R.; Neela, V.K.; Al-Obaidi, J.R.; Hun, T.G.; Yusoff, K. Methicillin-Resistant Staphylococcus aureus Biofilms and Their Influence on Bacterial Adhesion and Cohesion. Biomed Res. Int. 2016, 2016, 4708425. [Google Scholar] [CrossRef] [PubMed] [Green Version]
  57. Schwartz, K.; Ganesan, M.; Payne, D.E.; Solomon, M.J.; Boles, B.R. Extracellular DNA facilitates the formation of functional amyloids in Staphylococcus aureus biofilms. Mol. Microbiol. 2016, 99, 123–134. [Google Scholar] [CrossRef] [Green Version]
  58. Mann, E.E.; Wozniak, D.J. Pseudomonas biofilm matrix composition and niche biology. FEMS Microbiol. Rev. 2012, 36, 893–916. [Google Scholar] [CrossRef] [Green Version]
  59. Maier, R.M.; Soberón-Chávez, G. Pseudomonas aeruginosa rhamnolipids: Biosynthesis and potential applications. Appl. Microbiol. Biotechnol. 2000, 54, 625–633. [Google Scholar] [CrossRef] [PubMed]
  60. Skariyachan, S.; Sridhar, V.S.; Packirisamy, S.; Kumargowda, S.T.; Challapilli, S.B. Recent perspectives on the molecular basis of biofilm formation by Pseudomonas aeruginosa and approaches for treatment and biofilm dispersal. Folia Microbiol. 2018, 63, 413–432. [Google Scholar] [CrossRef] [PubMed]
  61. Branda, S.S.; Vik, Å.; Friedman, L.; Kolter, R. Biofilms: The matrix revisited. Trends Microbiol. 2005, 13, 20–26. [Google Scholar] [CrossRef]
  62. Lattif, A.A.; Mukherjee, P.K.; Chandra, J.; Roth, M.R.; Welti, R.; Rouabhia, M.; Ghannoum, M.A. Lipidomics of Candida albicans biofilms reveals phase-dependent production of phospholipid molecular classes and role for lipid rafts in biofilm formation. Microbiology 2011, 157, 3232–3242. [Google Scholar] [CrossRef] [PubMed] [Green Version]
  63. Pierce, C.G.; Vila, T.; Romo, J.A.; Montelongo-Jauregui, D.; Wall, G.; Ramasubramanian, A.; Lopez-Ribot, J.L. The Candida albicans biofilm matrix: Composition, structure and function. J. Fungi 2017, 3, 14. [Google Scholar] [CrossRef] [Green Version]
  64. Bonhomme, J.; d’Enfert, C. Candida albicans biofilms: Building a heterogeneous, drug-tolerant environment. Curr. Opin. Microbiol. 2013, 16, 398–403. [Google Scholar] [CrossRef]
  65. Vediyappan, G.; Chaffin, W.L. Non-glucan attached proteins of Candida albicans biofilm formed on various surfaces. Mycopathologia 2006, 161, 3–10. [Google Scholar] [CrossRef] [Green Version]
  66. Socrates, G. Infrared and Raman Characteristic Group Frequencies: Tables and Charts; John Wiley & Sons: New York, NY, USA, 2004. [Google Scholar]
  67. Miyazawa, T.; Blout, E. The infrared spectra of polypeptides in various conformations: Amide I and II bands. J. Am. Chem. Soc. 1961, 83, 712–719. [Google Scholar] [CrossRef]
  68. Kalmodia, S.; Parameswaran, S.; Yang, W.; Barrow, C.J.; Krishnakumar, S. Attenuated total reflectance Fourier transform infrared spectroscopy: An analytical technique to understand therapeutic responses at the molecular level. Sci. Rep. 2015, 5, 16649. [Google Scholar] [CrossRef] [PubMed] [Green Version]
Figure 1. SEM and CLSM images showing the morphology of pathogenic biofilms formed by MRSA, P. aeruginosa and C. albicans. An example of an early pseudohyphal cell (yellow) and yeast cell (red) are highlighted in the C. albicans biofilm. Scale bars in the insets of the electron micrographs are 1 µm for the two bacterial species and 5 µm for C. albicans.
Molecules 26 03890 g001
Figure 2. Average macro ATR-FTIR spectra for the three biofilms. MRSA, PA (P. aeruginosa) and CA (C. albicans). Regions characteristic of chemical species of interest are highlighted.
Molecules 26 03890 g002
Figure 3. Synchrotron macro ATR-FTIR spectral maps of the biofilms formed by MRSA, P. aeruginosa and C. albicans. All scale bars are 2 µm.
Molecules 26 03890 g003
Figure 4. HCA maps of biofilm samples to identify and group regions high in amide I. The FTIR chemical image of the Amide I band (left), the HCA map of the 5 clusters (middle) and the average spectra of the clusters (right). The black arrows refer to the average spectrum, representative of the same colored cluster, which was chosen for further PCA analysis.
Molecules 26 03890 g004
Figure 5. PCA analysis of the 2nd derivative spectra for each biofilm sample. (A) Second derivative spectra for each biofilm sample. (B) PCA score plots showing projections against the first 3 PCs that explain the majority of the spectral variation. (C) PC loading plots for the first 3 PCs. The wavenumbers at which significant change occurs are designated.
Molecules 26 03890 g005
Table 1. Functional groups and their designation to IR spectral regions as used in this study [29,30,42,43].
Functional GroupSpectral Region (cm−1)
Fatty acids and lipids (C-H stretching vibrations—inclusive of CH2 and CH3 functional groups) *3000–2800
Amide I (C=O stretching of amides)1705–1600
Polysaccharides (vibrations of C–OH, C–O–C, C–C and PO2 stretching)1200–950
* C-H vibrations occur in additional biomolecules.
Publisher’s Note: MDPI stays neutral with regard to jurisdictional claims in published maps and institutional affiliations.

