
Theoretical Analysis on Absorption of Carbon Dioxide (CO2) into Solutions of Phenyl Glycidyl Ether (PGE) Using Nonlinear Autoregressive Exogenous Neural Networks

 ,
,  , and
, and
Abstract
:1. Introduction
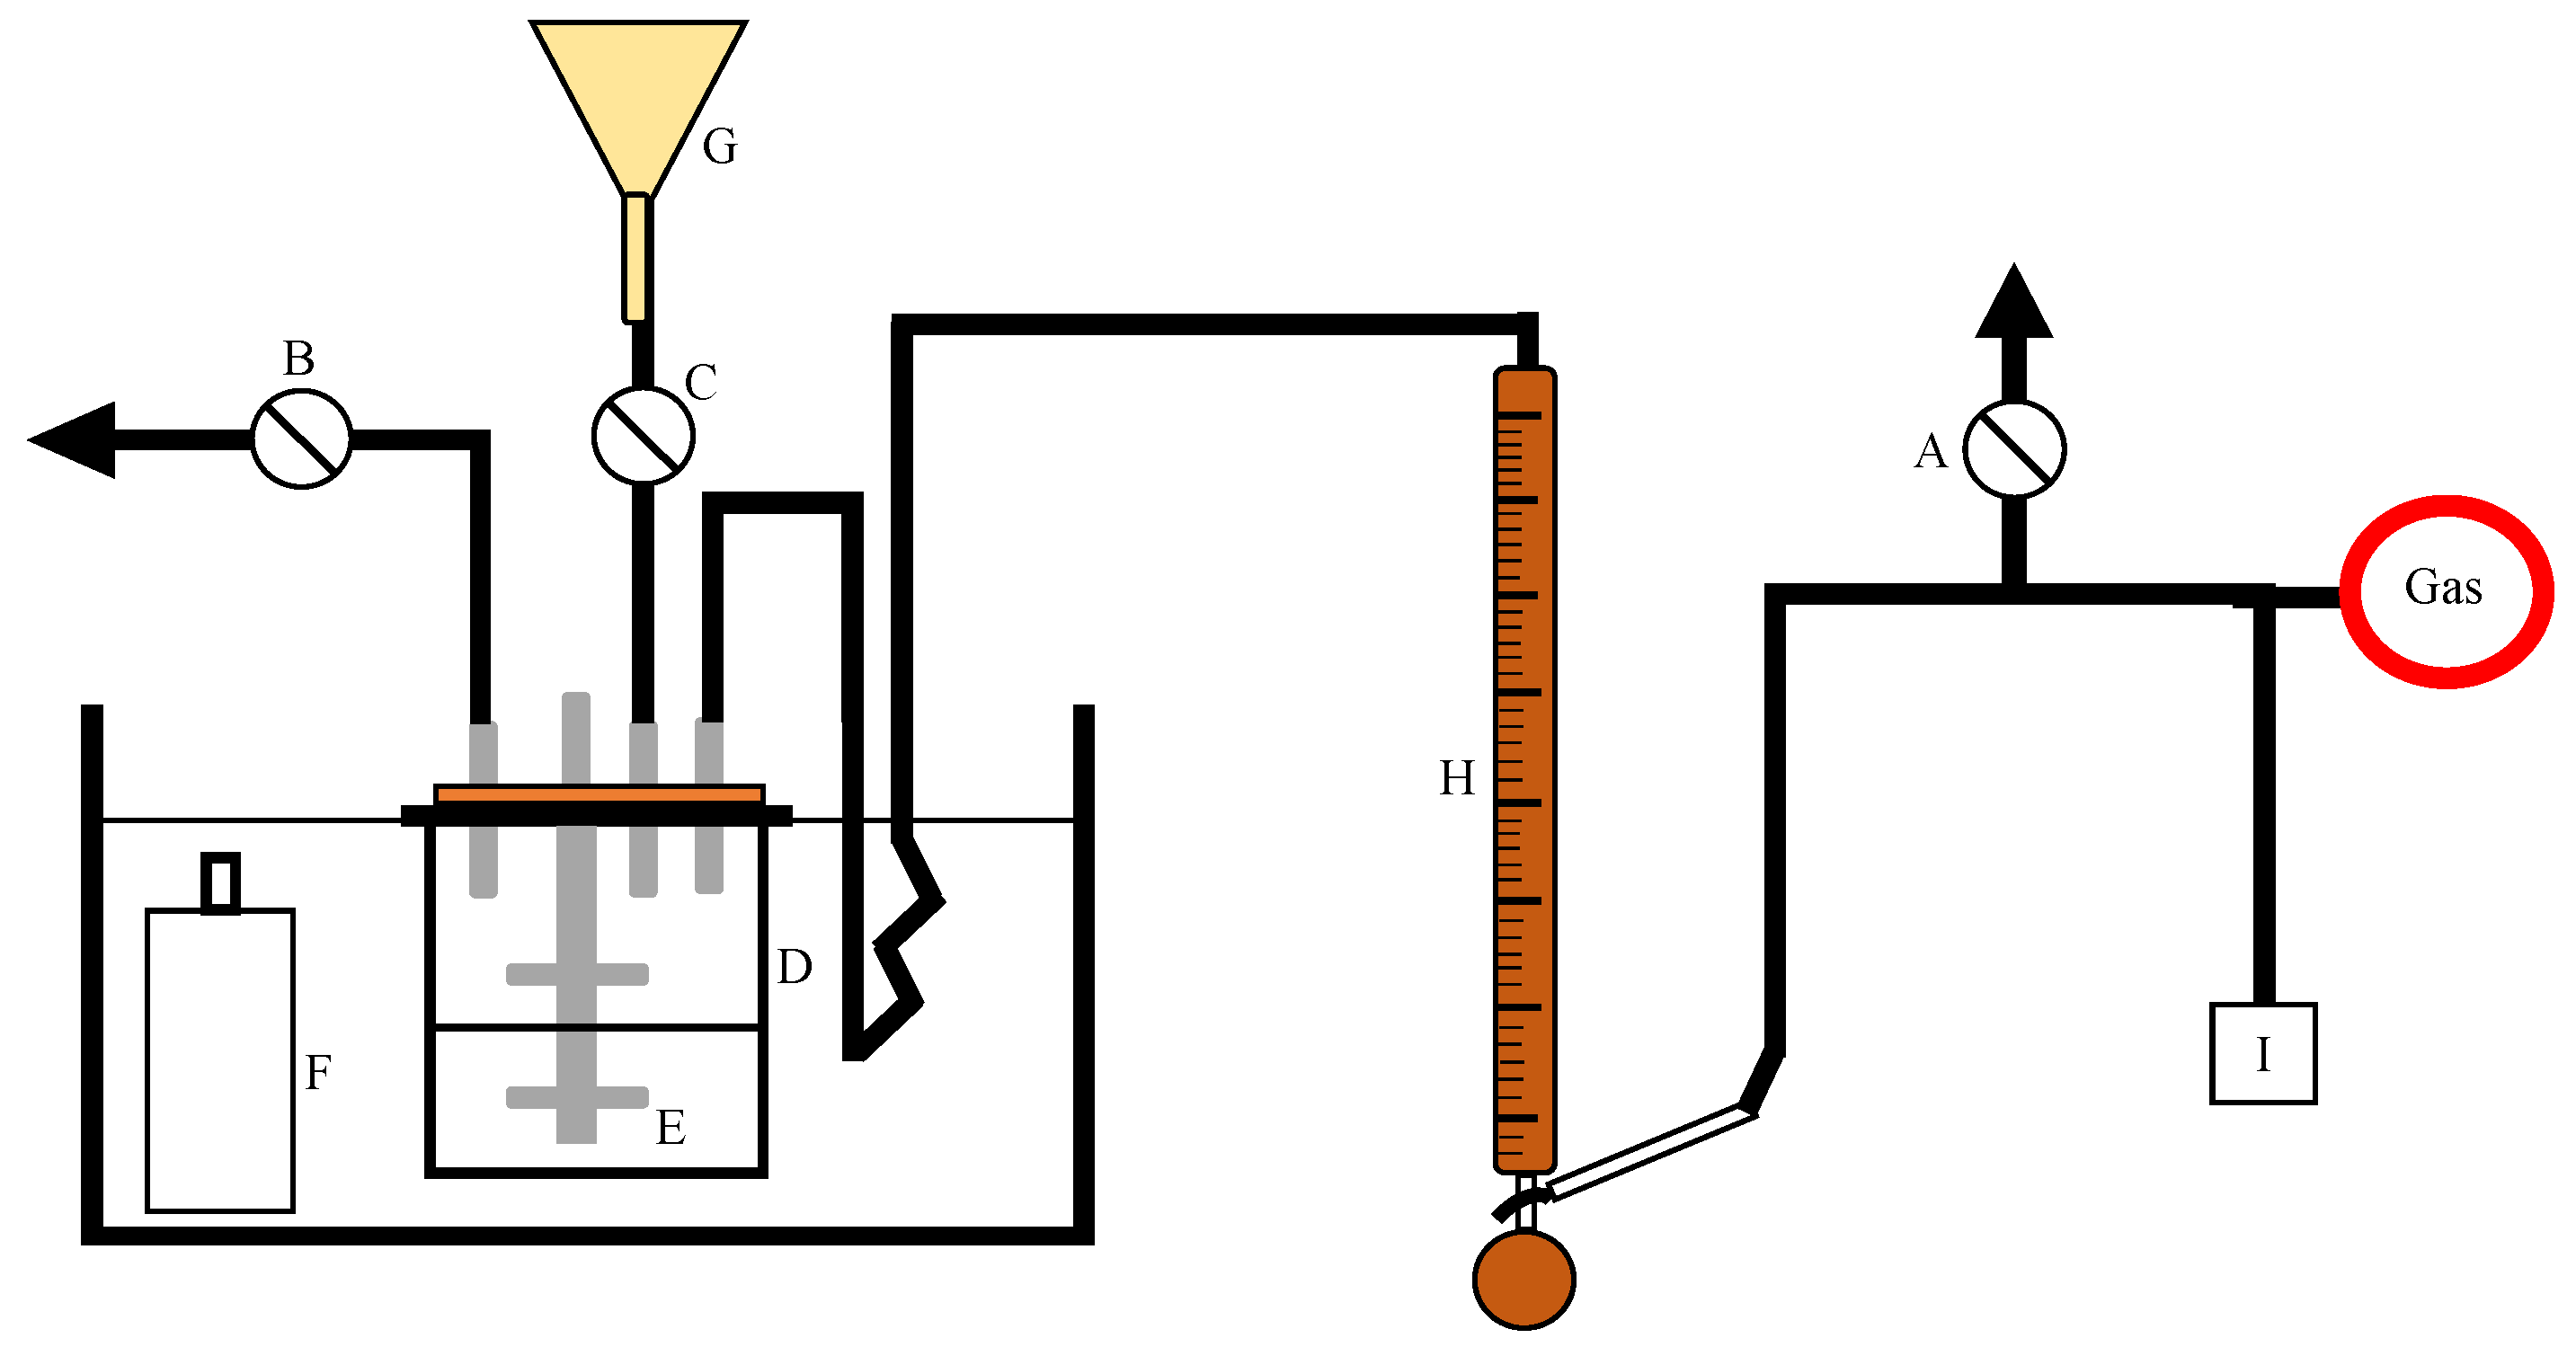
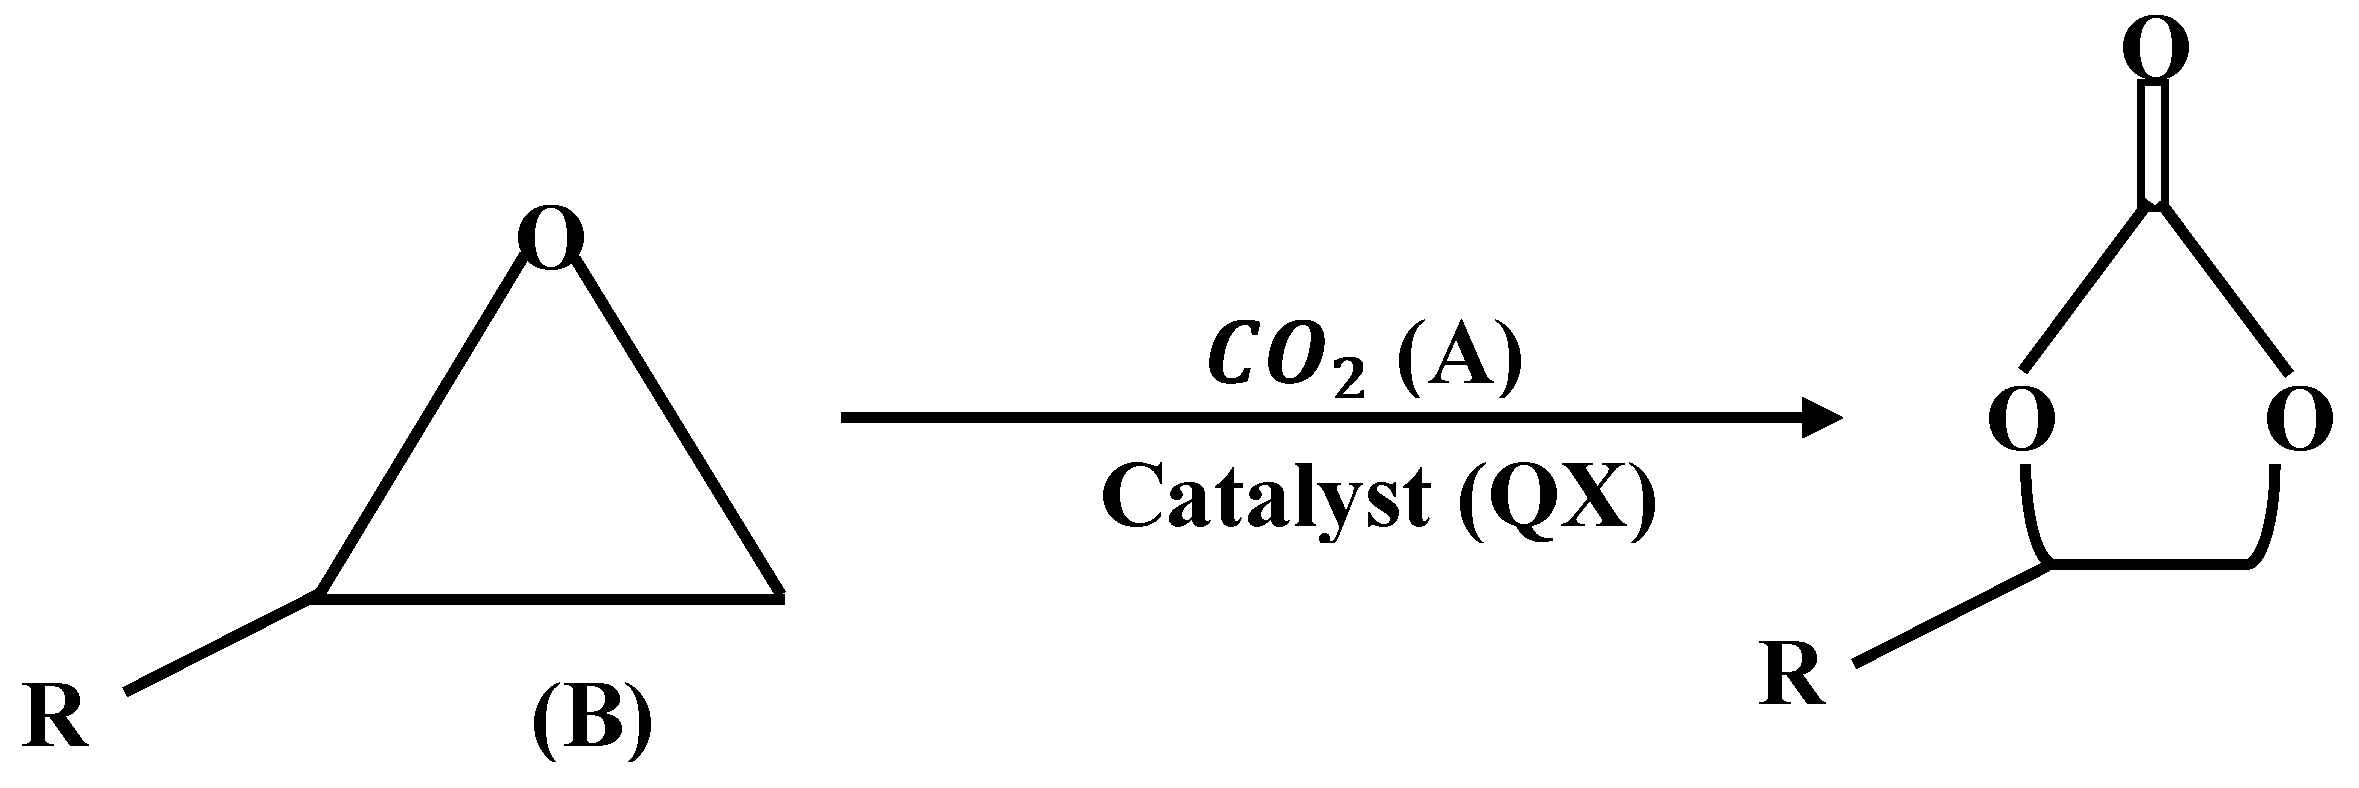
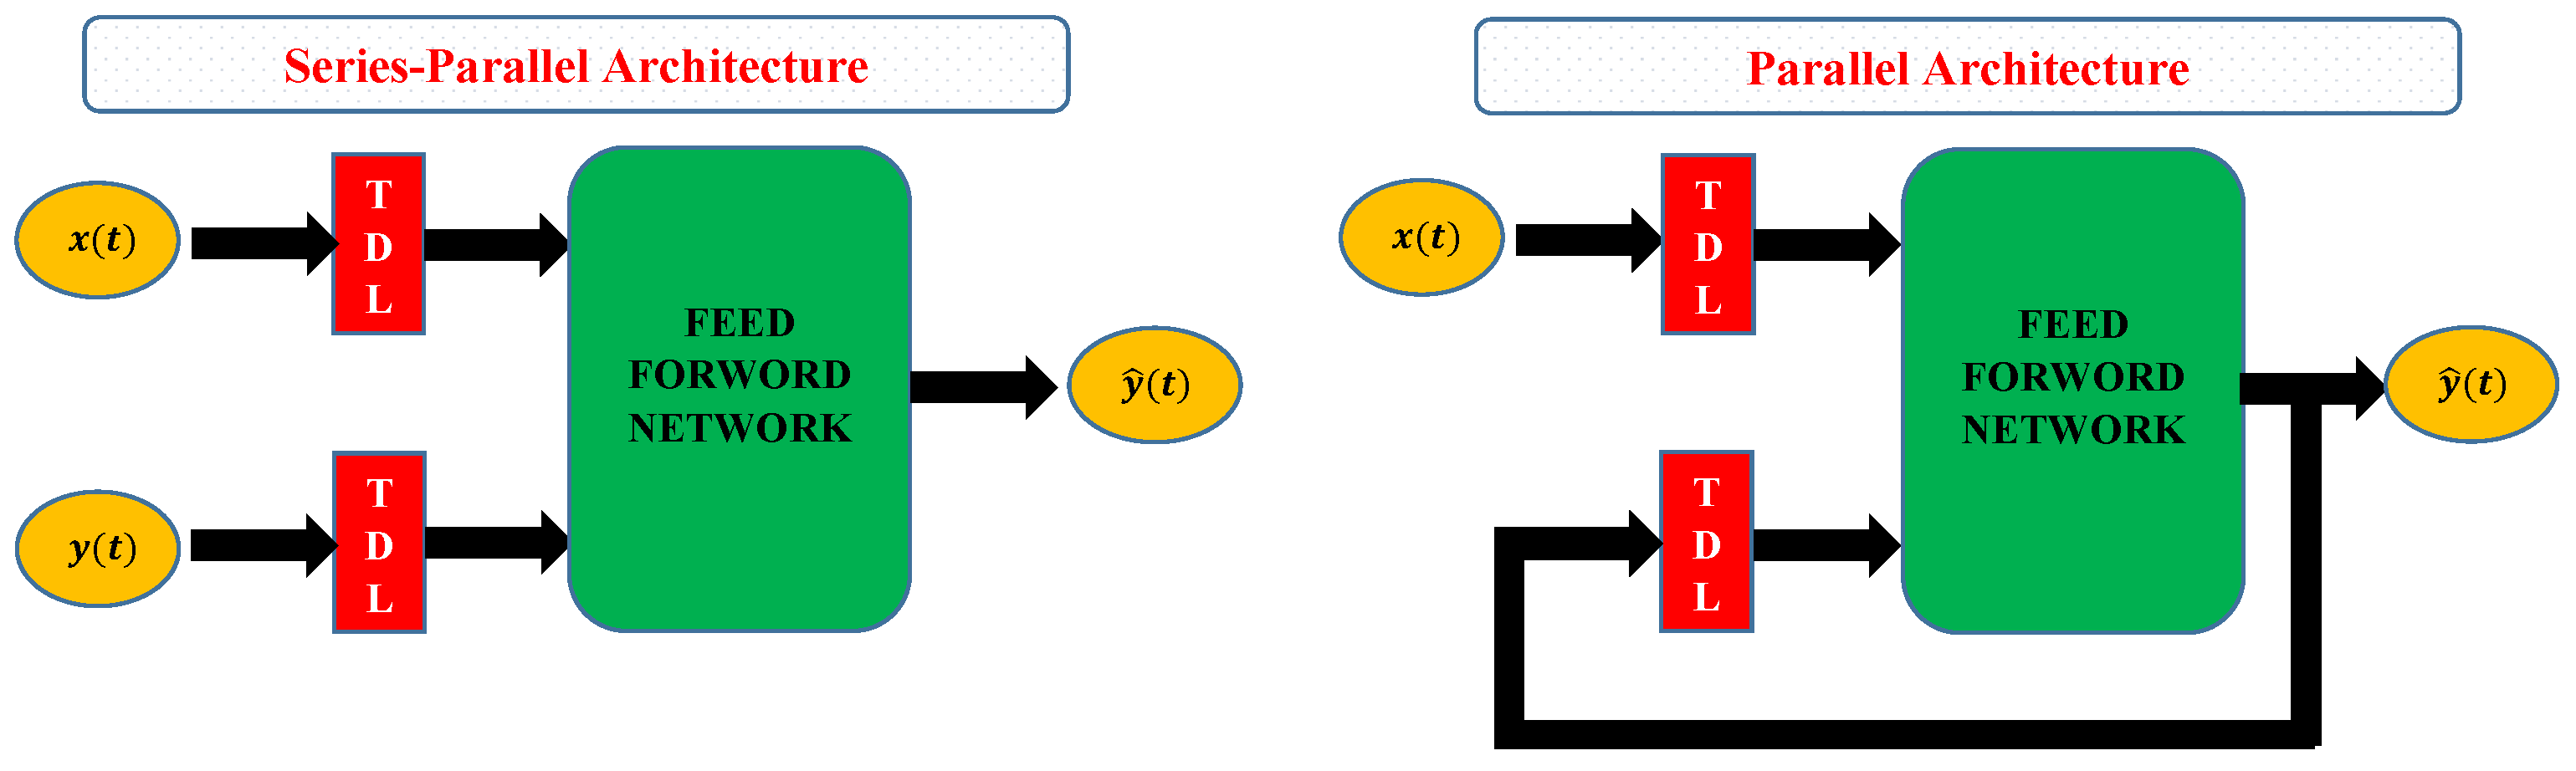
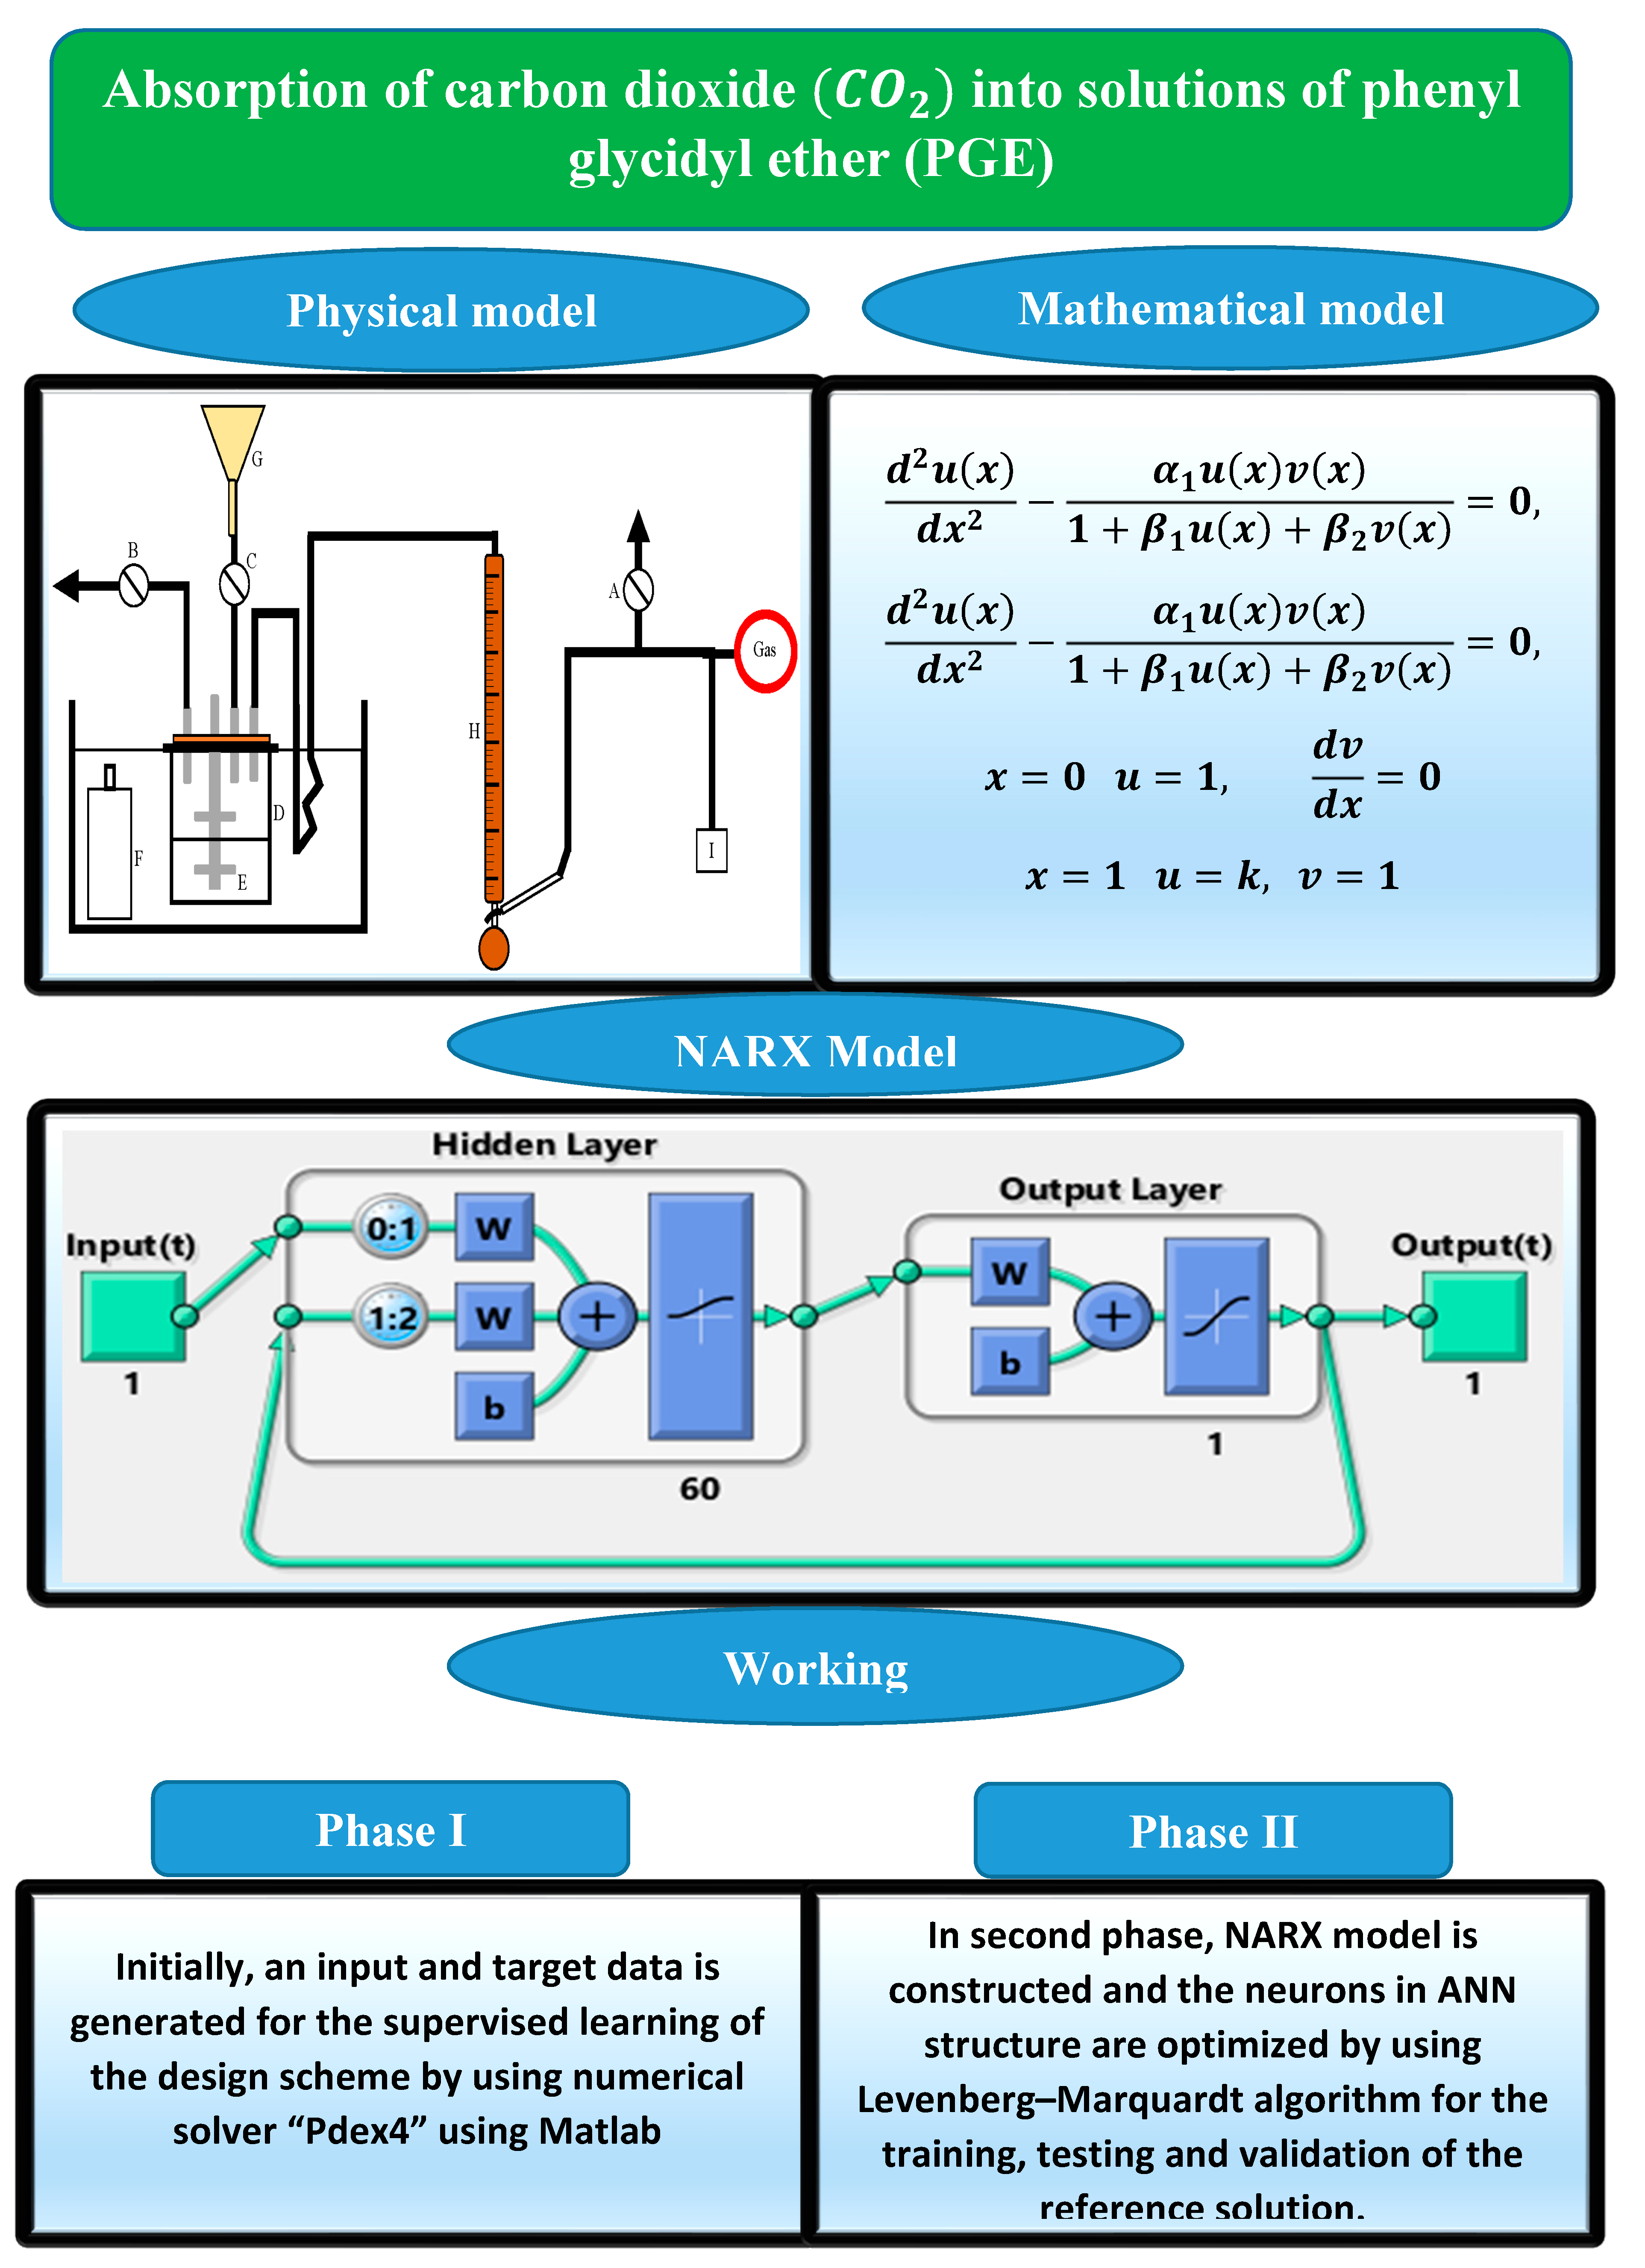
- A mathematical model for chemical analysis and absorption of carbon dioxide (CO) into phenyl glycidyl ether (PGE) solutions is presented. Furthermore, a novel stochastic technique based on nonlinear autoregressive exogenous (NARX) neural networks with the Levenberg–Marquardt algorithm is utilized to optimize the system of singular nonlinear differential equations for the normalized concentration of CO and PGE.
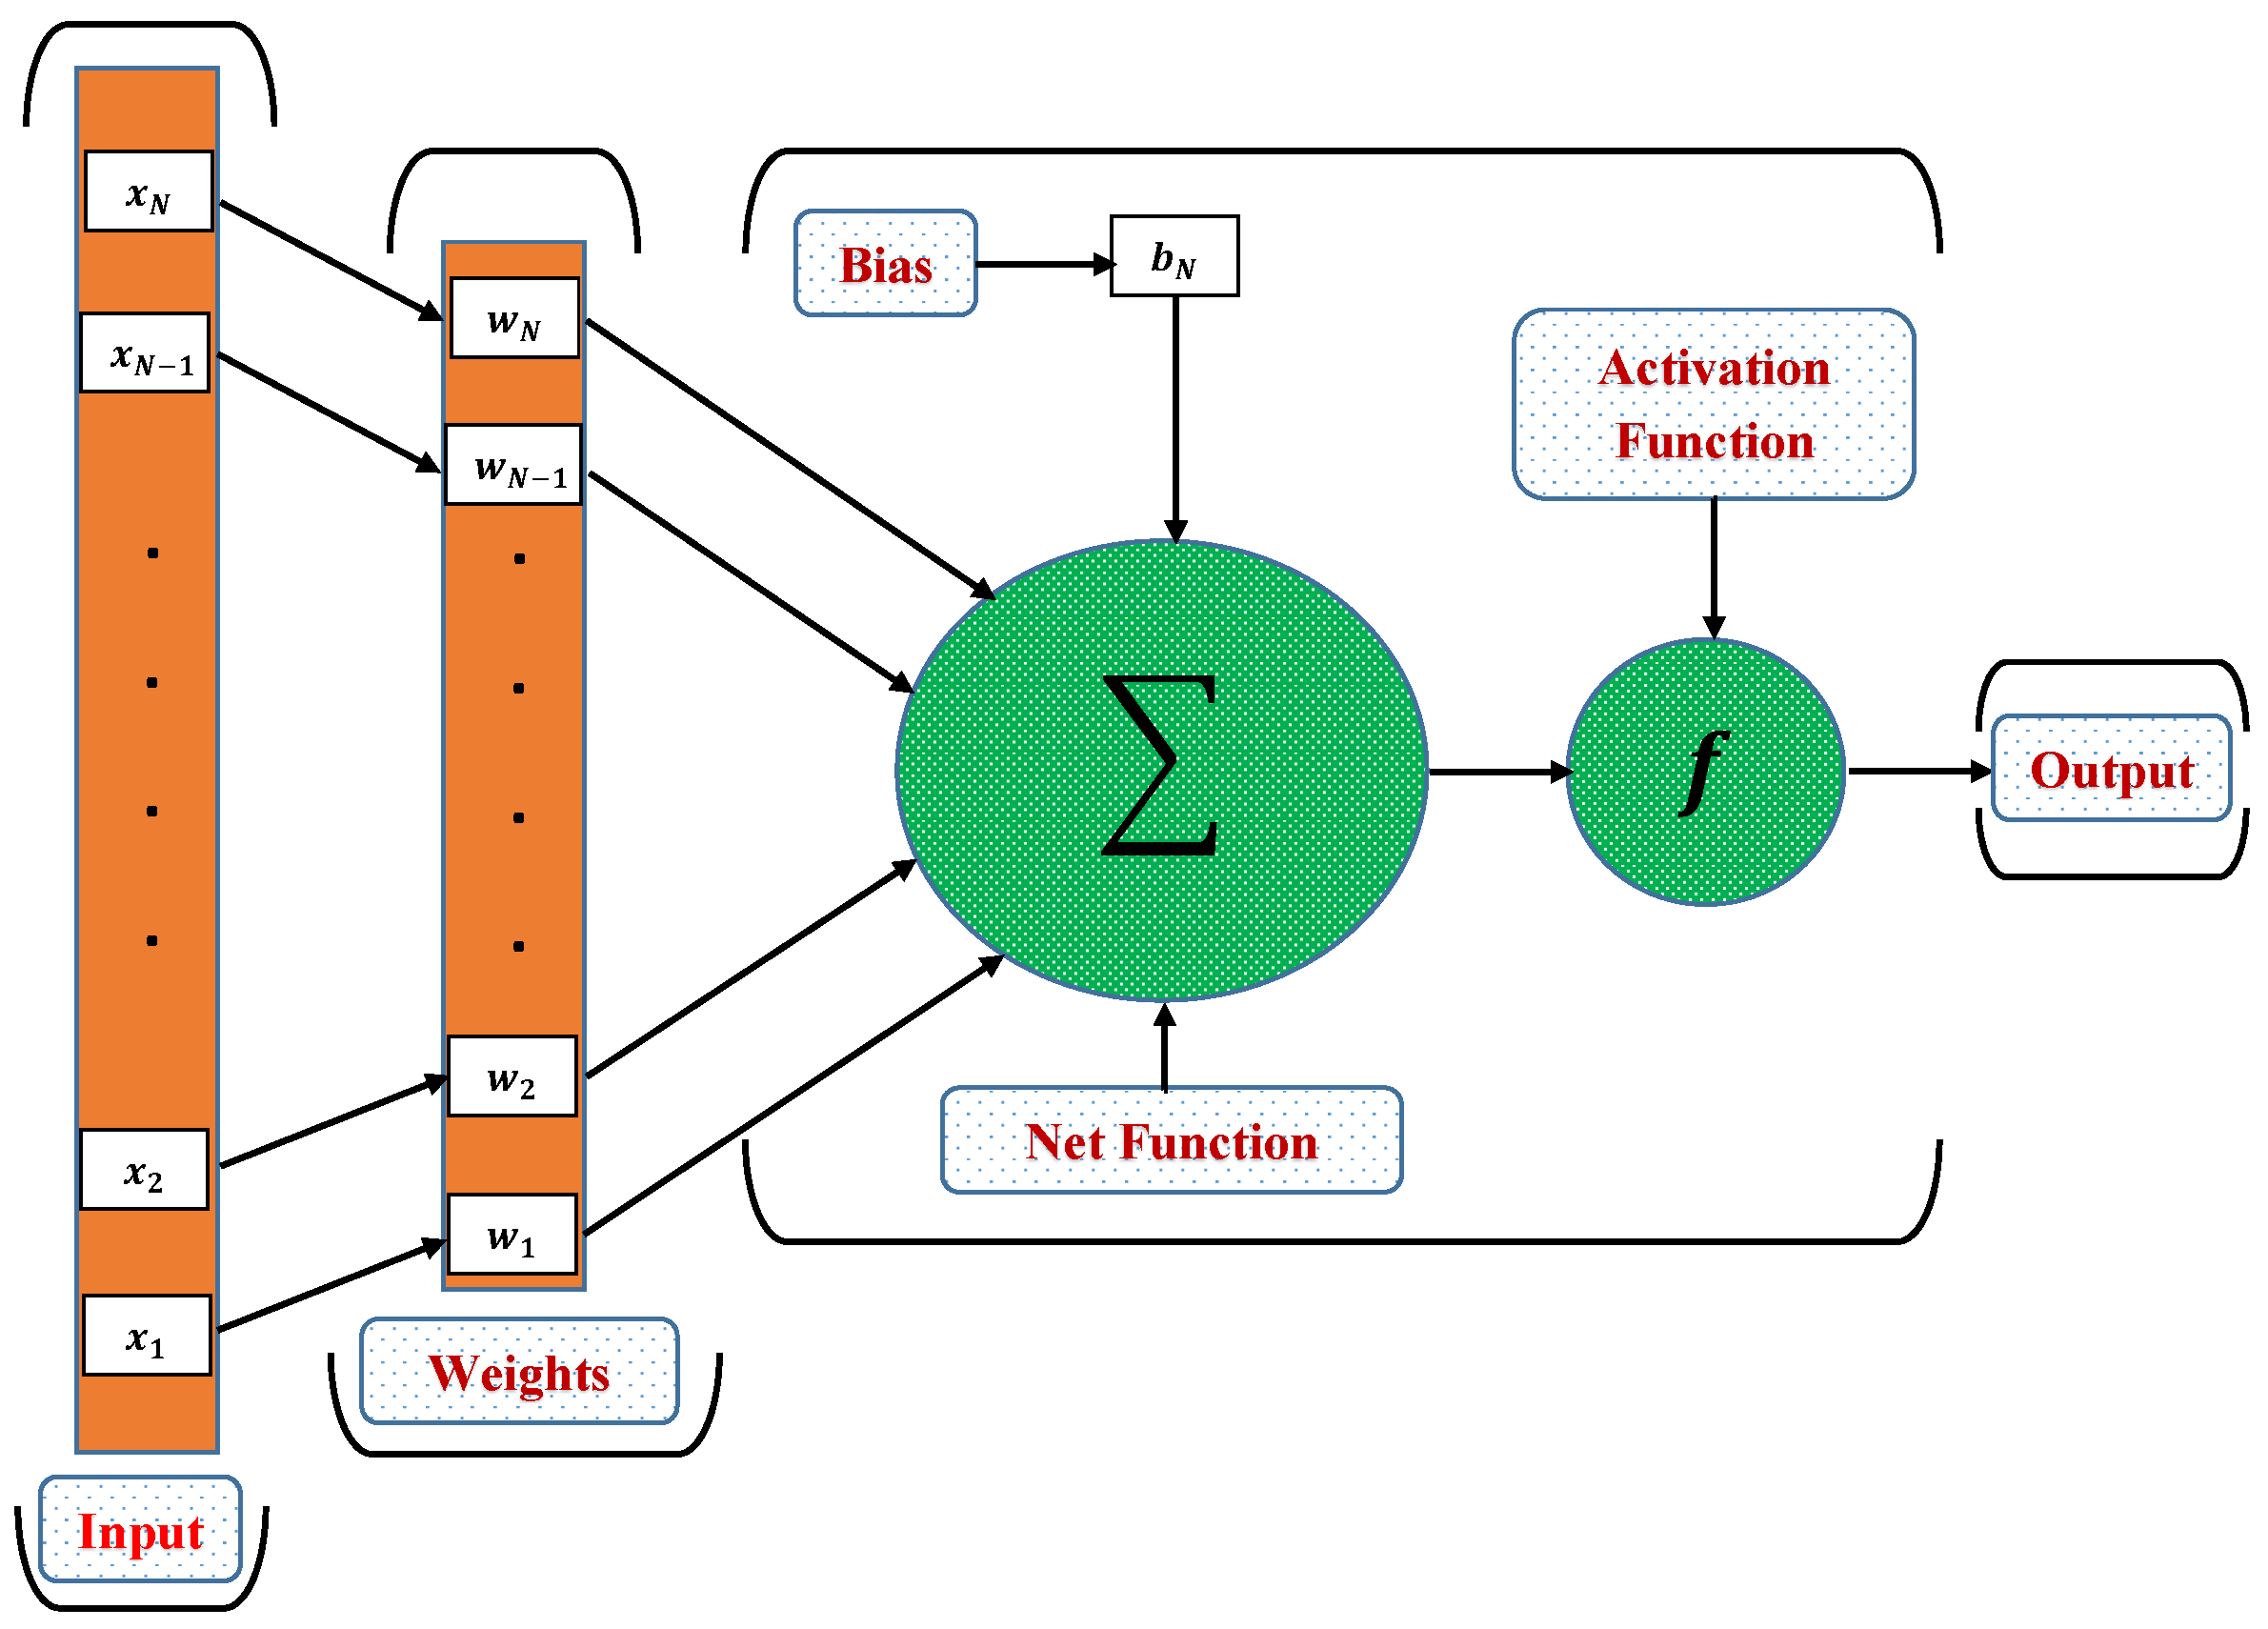
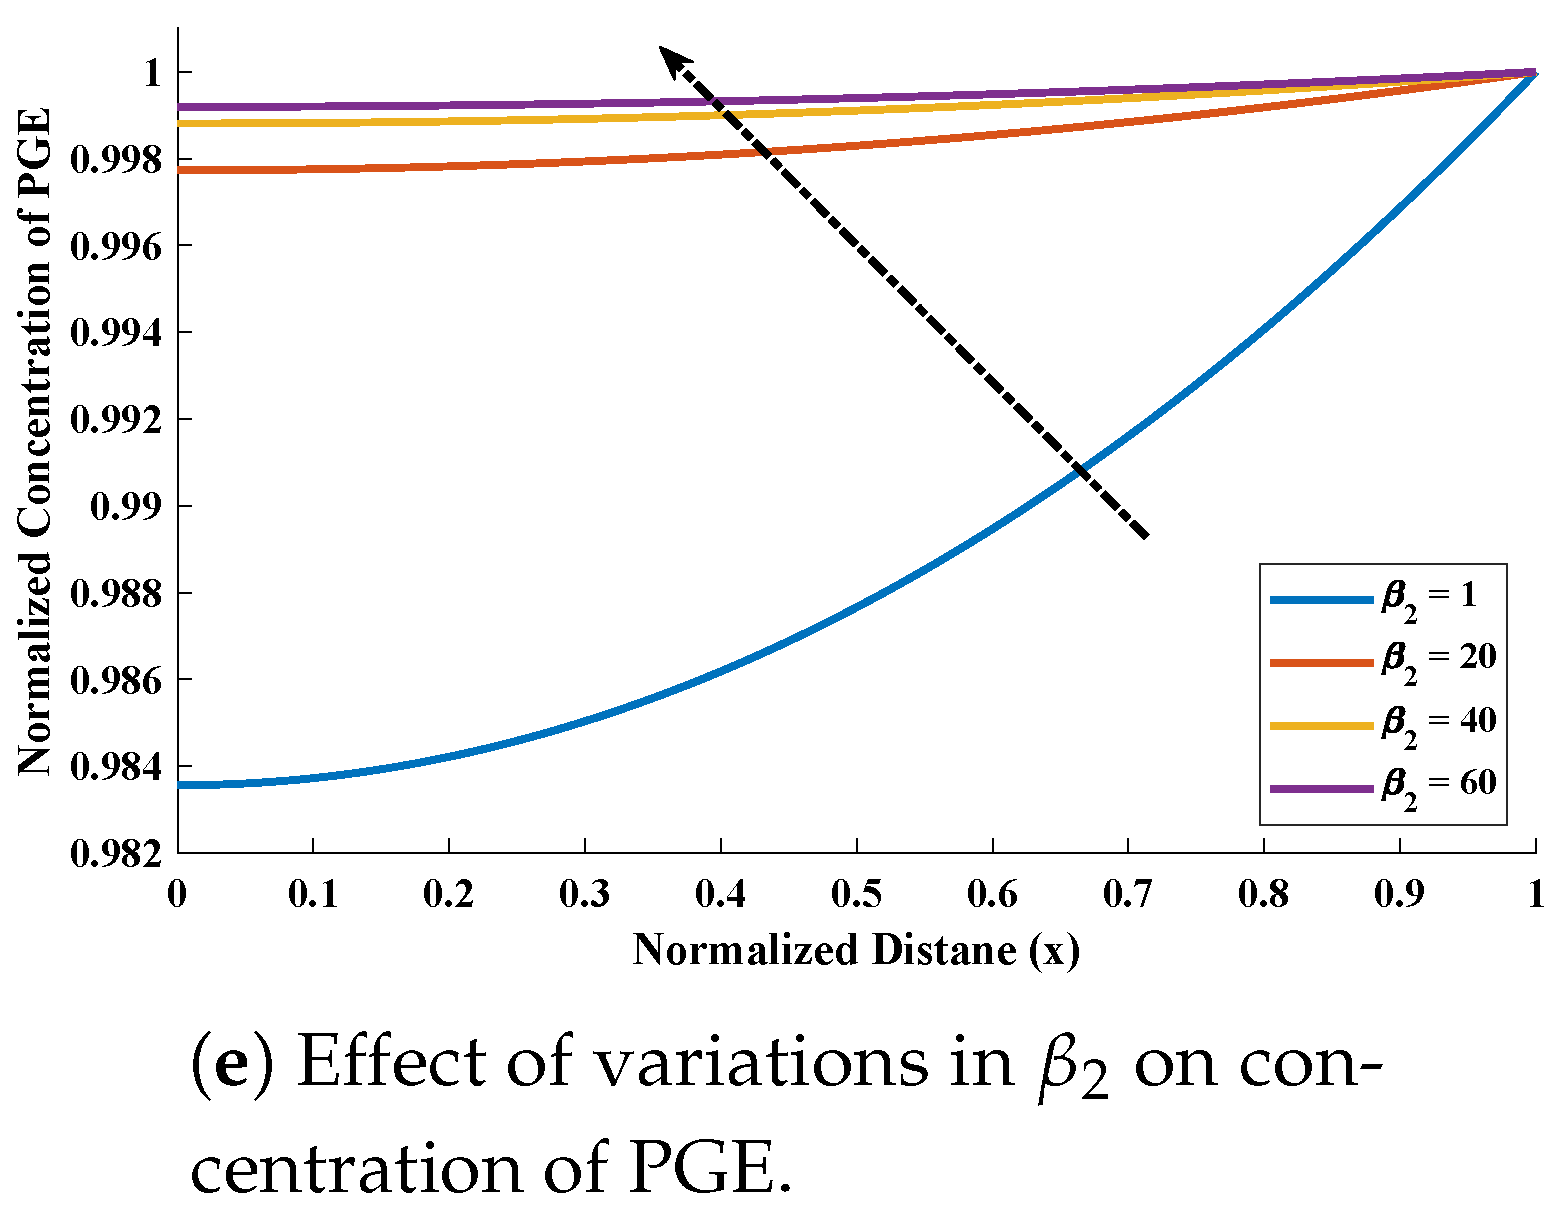
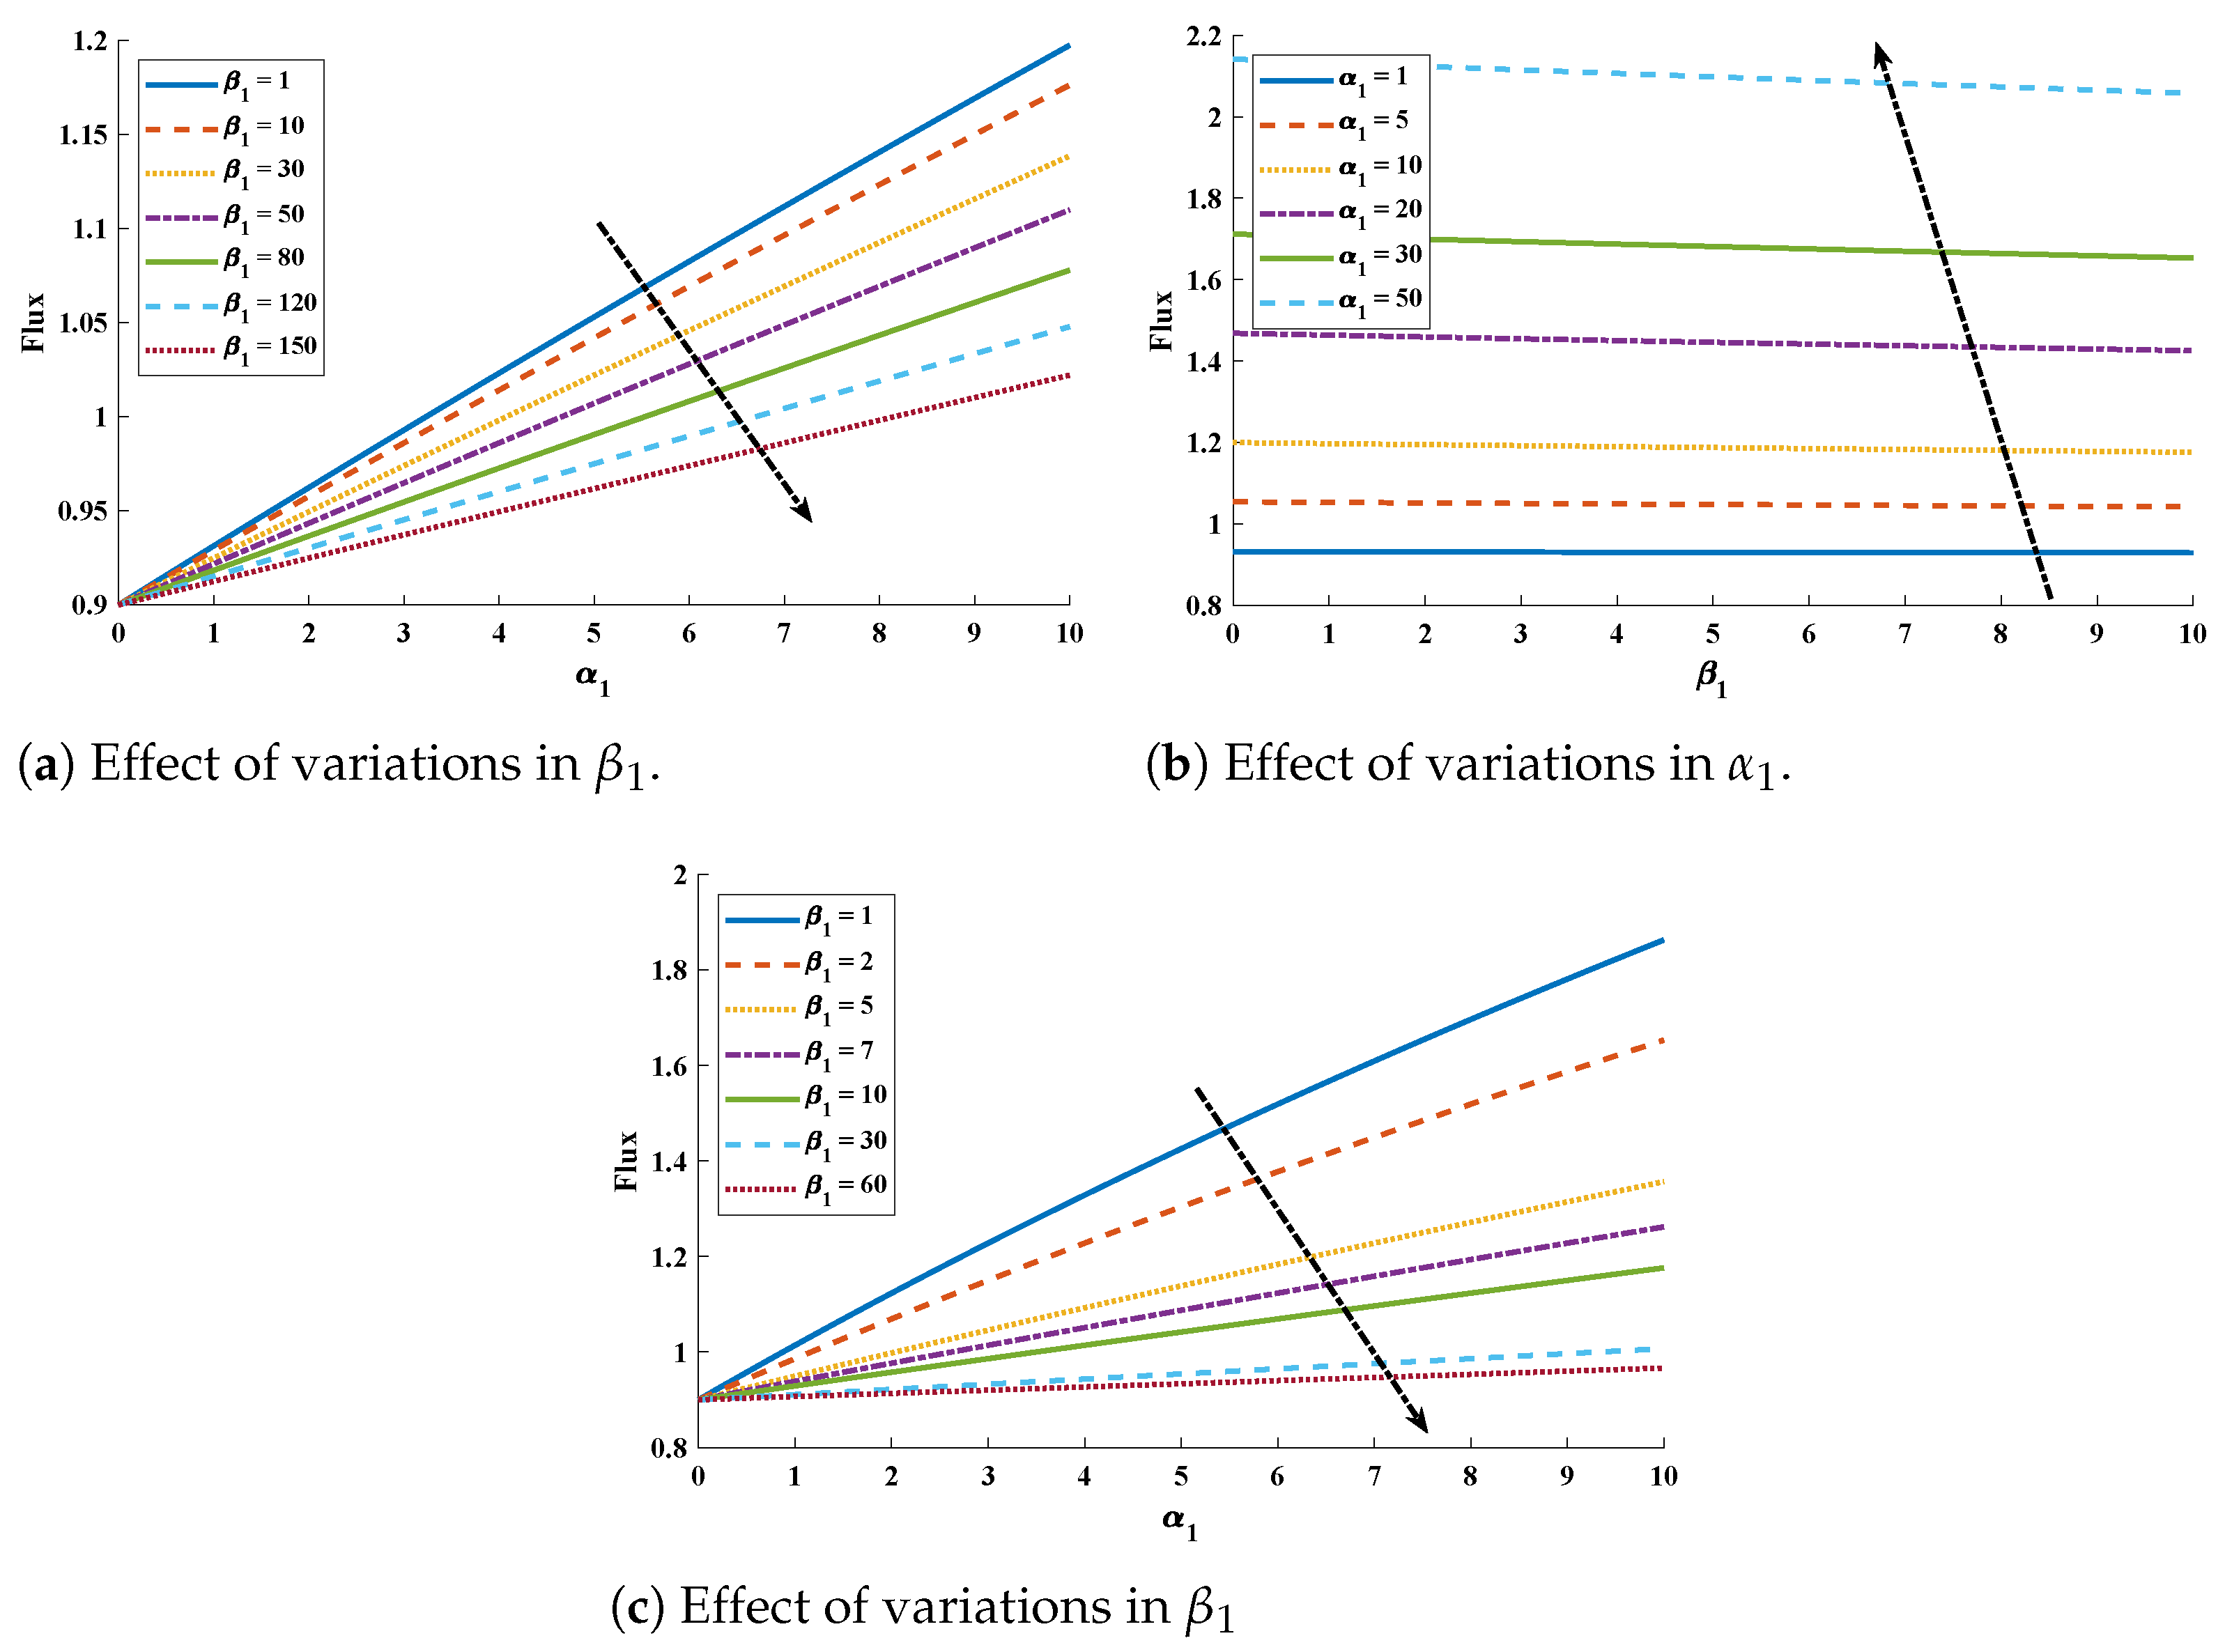
- The design scheme NARX-LM algorithm with two different activations function (Log-sigmoid and Hyperbolic tangent) is implemented to investigate the influence of variations in normalized parameters such , , and on concentration profiles of CO and PGE.
- To validate the accuracy of the design supervised learning mechanism, the results obtained are compared with the residual method, the Adomian decomposition method, machine learning algorithms, and numerical solution.
- Extensive graphical analysis based on absolute errors, fitting of numerical and approximate solutions, absolute errors, and performance graphs of mean square error are plotted to further validate the worth of the design scheme.
2. Problem Formulation
3. Design Methodology
3.1. Artificial Neural Networks and NARX Model
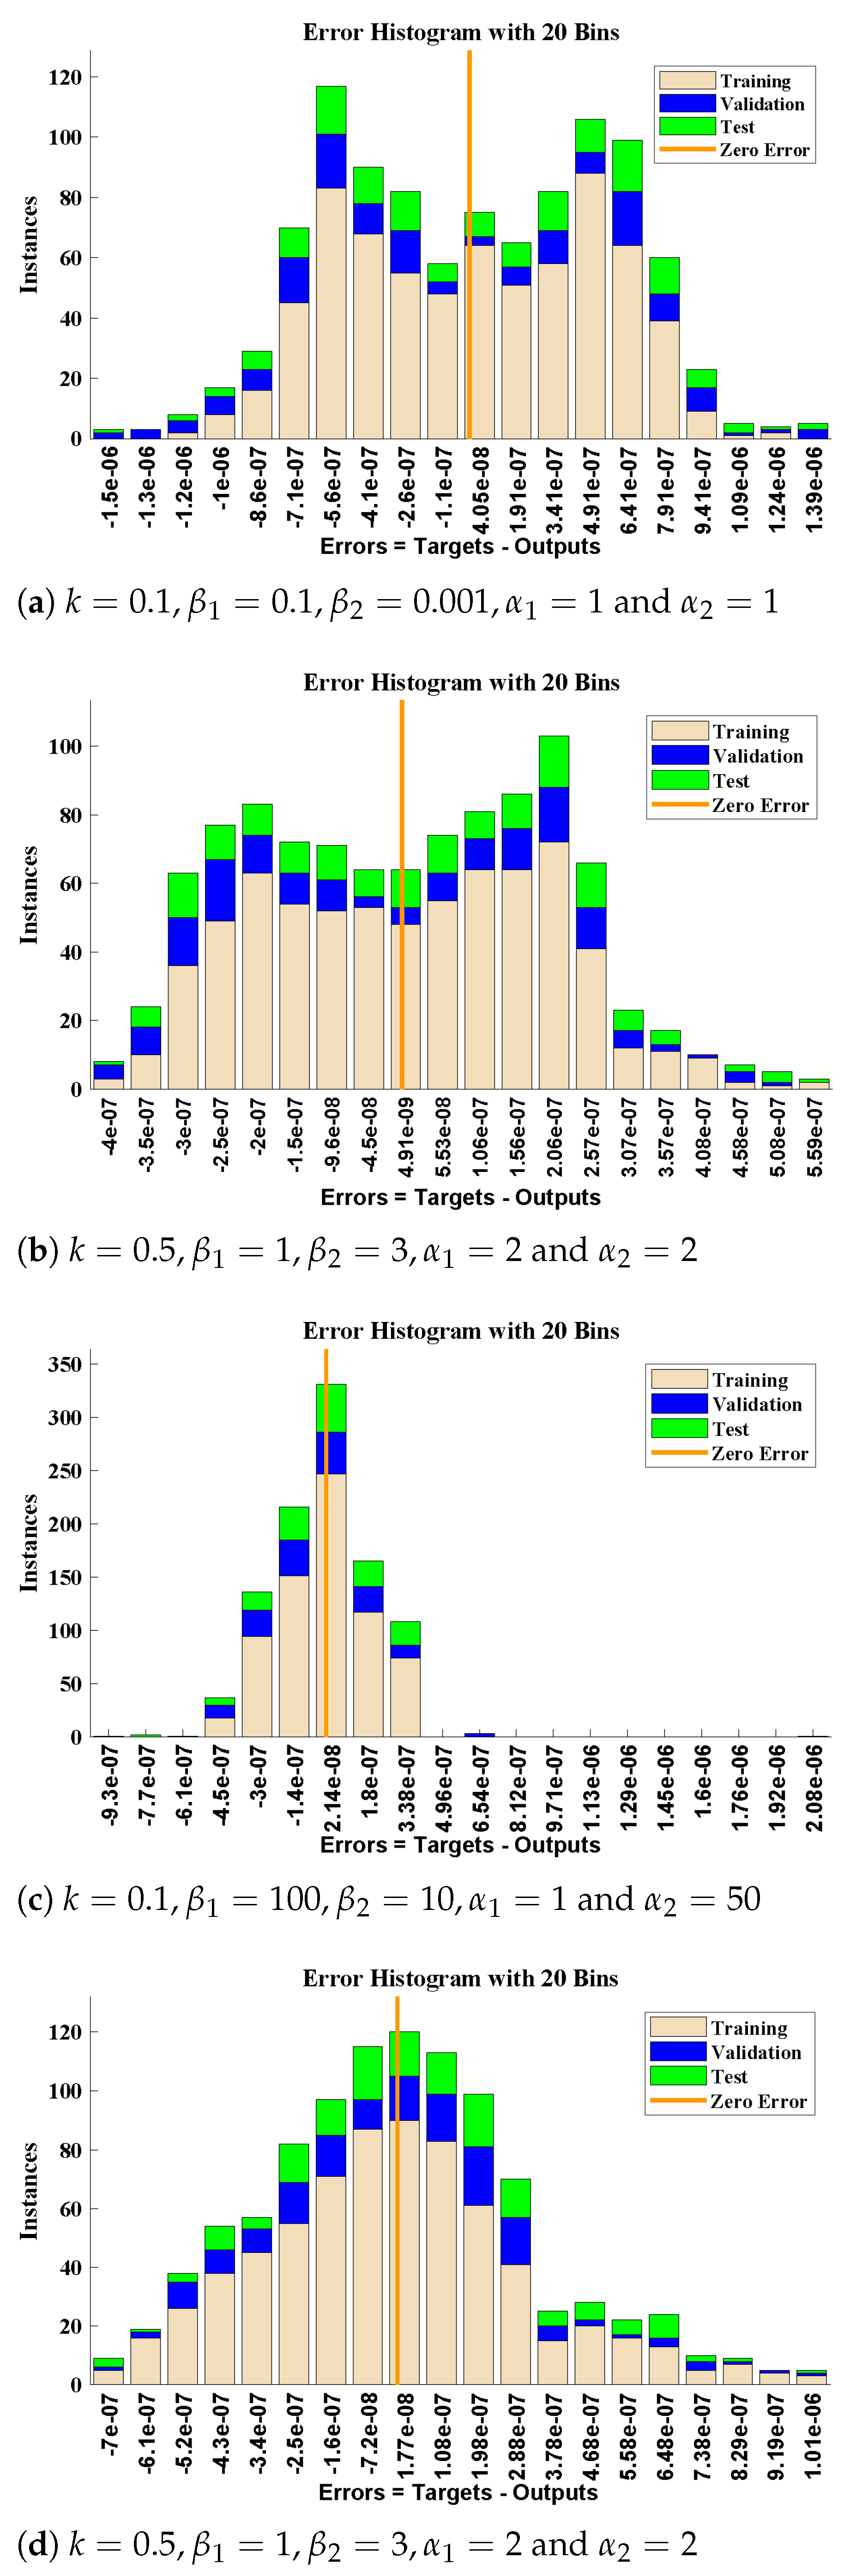
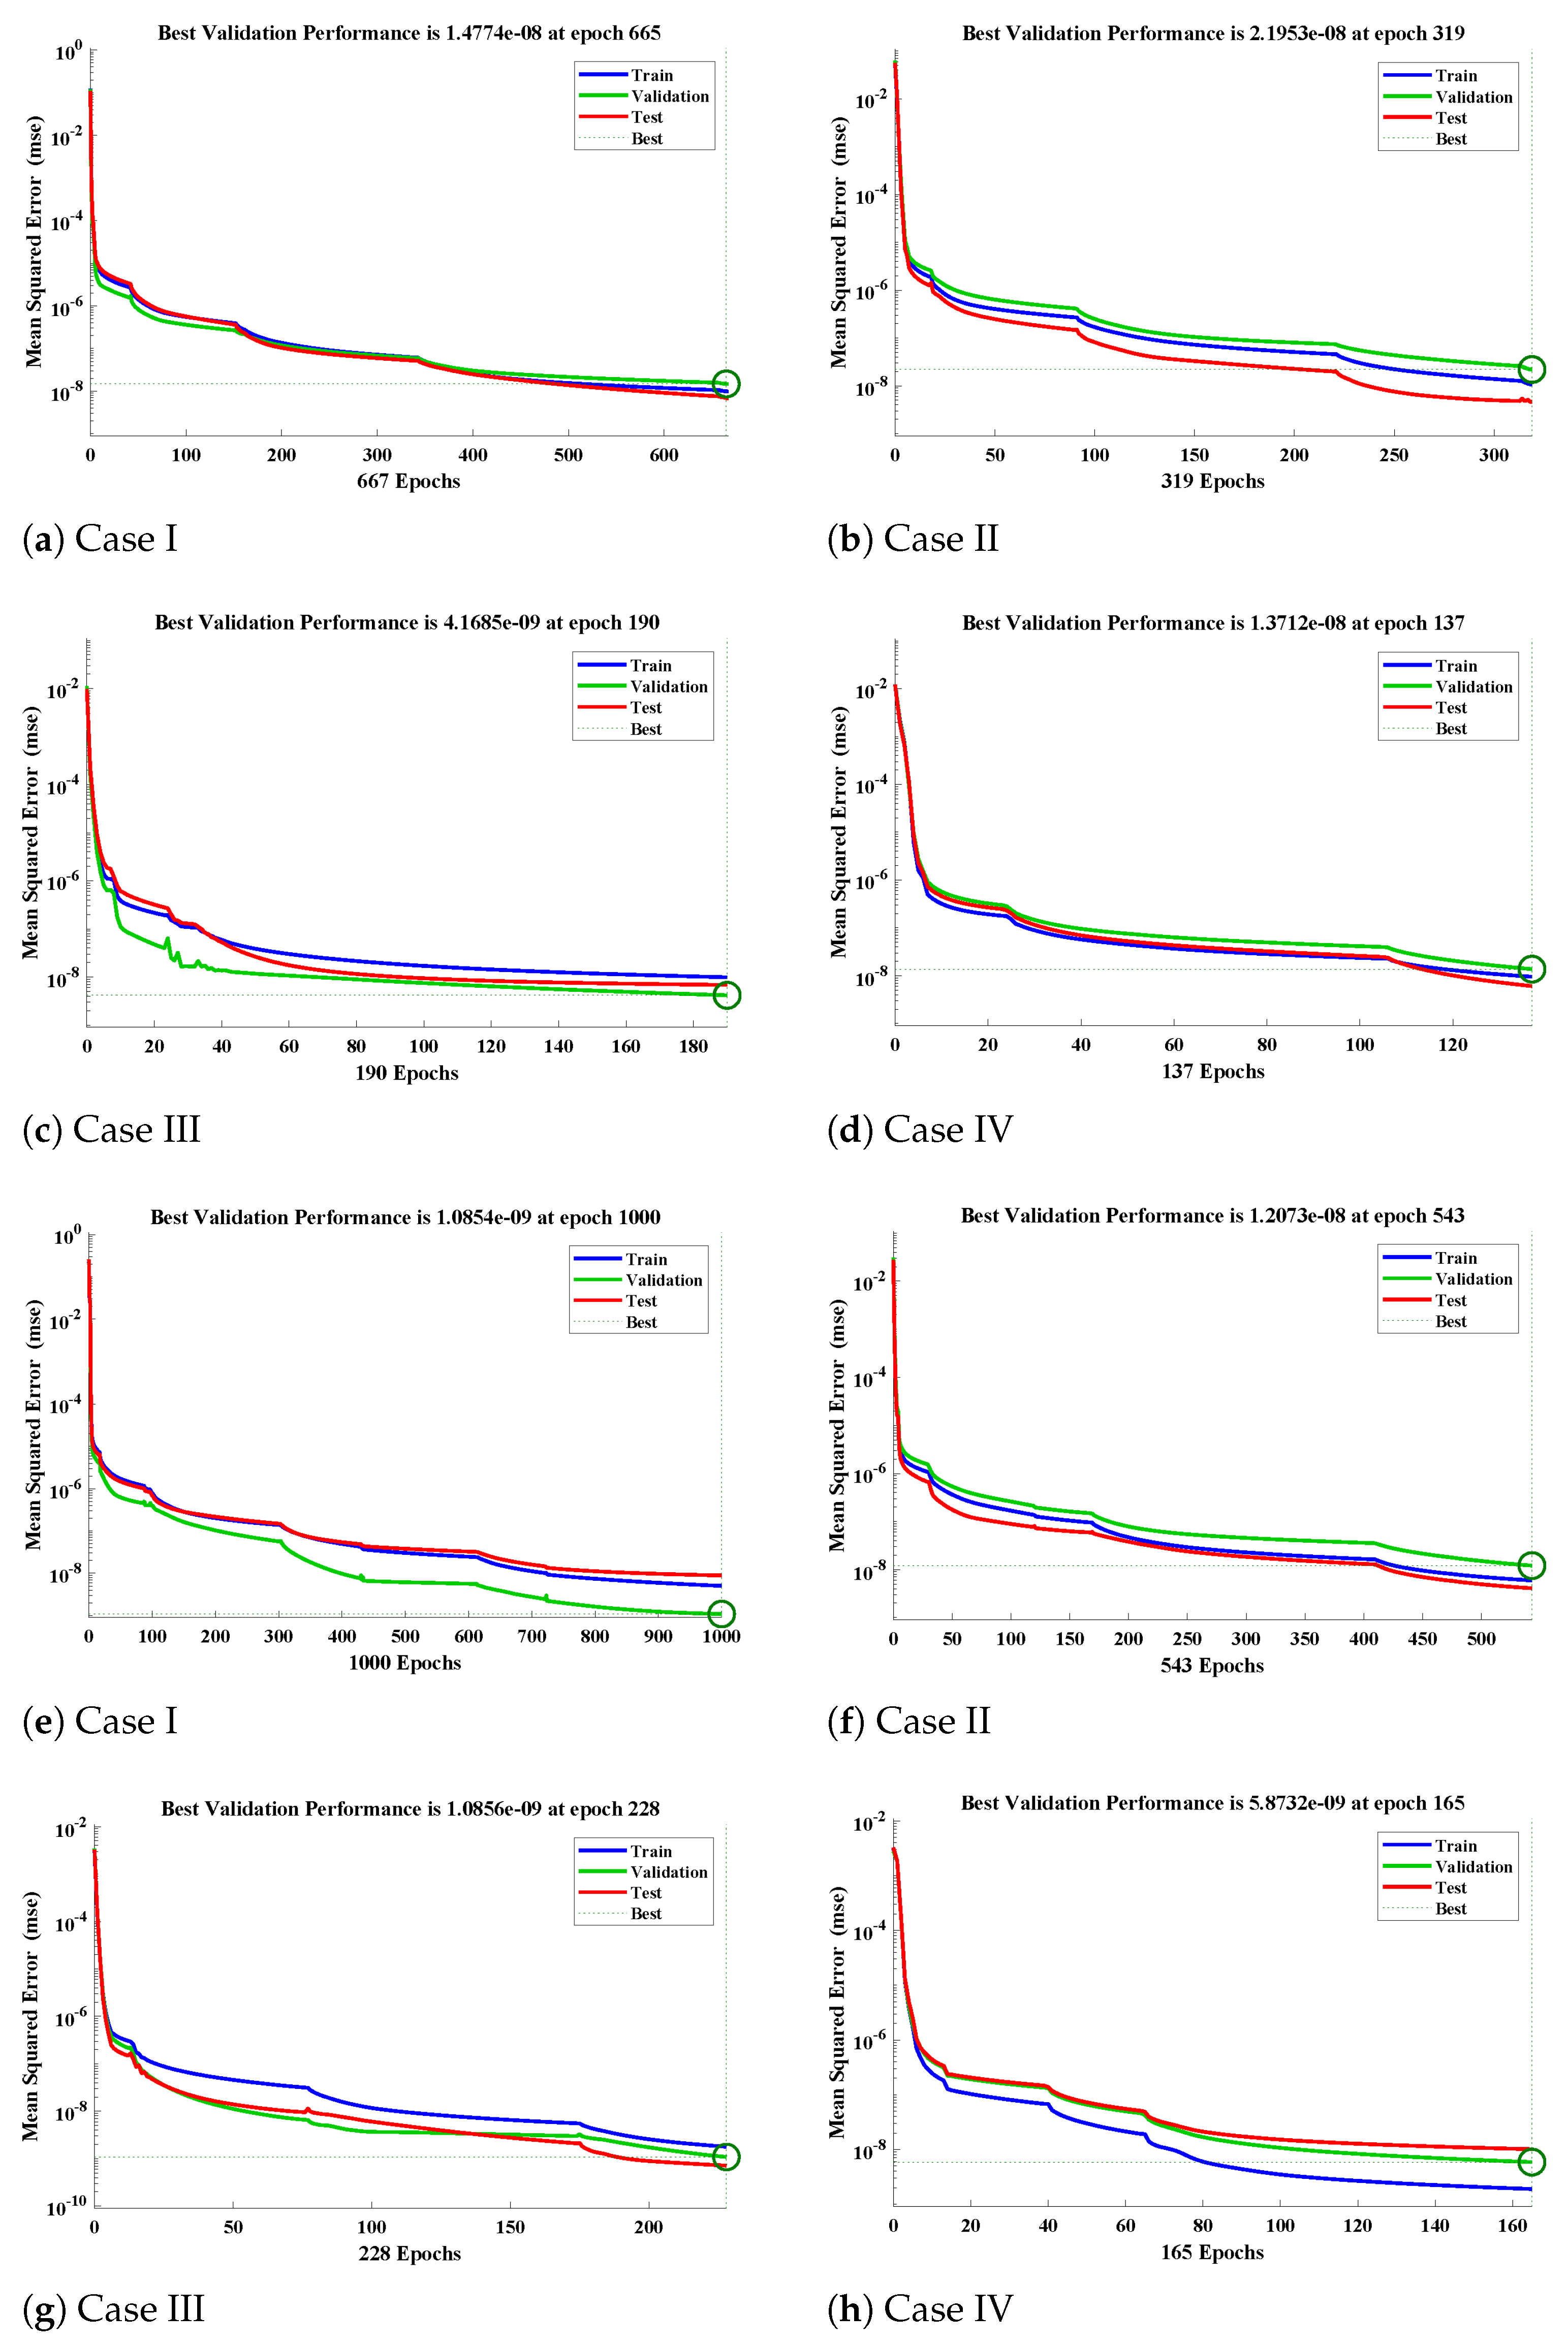
3.2. Learning Procedure and Performance Indicators
- (701 samples) are used for training.
- (150 samples) are used for validation.
- (150 samples) are used for testing.
4. Reference Solutions
5. Numerical Experimentation and Discussion
6. Conclusions
Author Contributions
Funding
Institutional Review Board Statement
Informed Consent Statement
Data Availability Statement
Acknowledgments
Conflicts of Interest
References
- Choe, Y.S.; Park, S.W.; Park, D.W.; Oh, K.J.; Kim, S.S. Reaction kinetics of carbon dioxide with phenyl glycidyl ether by TEA-CP-MS41 catalyst. J. Jpn. Pet. Inst. 2010, 53, 160–166. [Google Scholar] [CrossRef]
- Park, S.W.; Park, D.W.; Kim, T.Y.; Park, M.Y.; Oh, K.J. Chemical kinetics of the reaction between carbon dioxide and phenyl glycidyl ether using Aliquat 336 as a catalyst. Catal. Today 2004, 98, 493–498. [Google Scholar] [CrossRef]
- Inoue, S.; Yamazaki, N. Organic and Bio-Organic Chemistry of Carbon Dioxide; Halsted Press: Ultimo, Australia, 1982. [Google Scholar]
- Han, L.; Choi, H.J.; Kim, D.K.; Park, S.W.; Liu, B.; Park, D.W. Porous polymer bead-supported ionic liquids for the synthesis of cyclic carbonate from CO2 and epoxide. J. Mol. Catal. A Chem. 2011, 338, 58–64. [Google Scholar] [CrossRef]
- Sun, J.; Wang, J.; Cheng, W.; Zhang, J.; Li, X.; Zhang, S.; She, Y. Chitosan functionalized ionic liquid as a recyclable biopolymer-supported catalyst for cycloaddition of CO2. Green Chem. 2012, 14, 654–660. [Google Scholar] [CrossRef]
- Srivastava, R.; Srinivas, D.; Ratnasamy, P. Zeolite-based organic–inorganic hybrid catalysts for phosgene-free and solvent-free synthesis of cyclic carbonates and carbamates at mild conditions utilizing CO2. Appl. Catal. A Gen. 2005, 289, 128–134. [Google Scholar] [CrossRef]
- Aresta, M.; Dibenedetto, A.; Angelini, A. Catalysis for the valorization of exhaust carbon: From CO2 to chemicals, materials, and fuels. Technological use of CO2. Chem. Rev. 2014, 114, 1709–1742. [Google Scholar] [CrossRef]
- Choe, Y.S.; Oh, K.J.; Kim, M.C.; Park, S.W. Chemical absorption of carbon dioxide into phenyl glycidyl ether solution containing THA-CP-MS41 catalyst. Korean J. Chem. Eng. 2010, 27, 1868–1875. [Google Scholar] [CrossRef]
- Singha, R.; Wazwaz, A.M. Steady-state concentrations of carbon dioxide absorbed into phenyl glycidyl ether: An optimal homotopy analysis method. Match-Commun Math. Co 2019, 81, 800–812. [Google Scholar]
- Subramaniam, M.; Krishnaperumal, I.; Lakshmanan, R. Theoretical analysis of mass transfer with chemical reaction using absorption of carbon dioxide into phenyl glycidyl ether solution. Appl. Math. 2012, 3, 1179–1186. [Google Scholar] [CrossRef] [Green Version]
- Morales-Delgado, V.F.; Gómez-Aguilar, J.F.; Yépez-Martínez, H.; Baleanu, D.; Escobar-Jimenez, R.F.; Olivares-Peregrino, V.H. Laplace homotopy analysis method for solving linear partial differential equations using a fractional derivative with and without kernel singular. Adv. Differ. Equ. 2016, 2016, 1–17. [Google Scholar] [CrossRef] [Green Version]
- Gómez-Aguilar, J.; Yépez-Martínez, H.; Torres-Jiménez, J.; Córdova-Fraga, T.; Escobar-Jiménez, R.; Olivares-Peregrino, V. Homotopy perturbation transform method for nonlinear differential equations involving to fractional operator with exponential kernel. Adv. Differ. Equ. 2017, 2017, 1–18. [Google Scholar] [CrossRef] [Green Version]
- Singh, R. Optimal homotopy analysis method for the non-isothermal reaction–diffusion model equations in a spherical catalyst. J. Math. Chem. 2018, 56, 2579–2590. [Google Scholar] [CrossRef]
- Acan, O.; Baleanu, D. A new numerical technique for solving fractional partial differential equations. arXiv 2017, arXiv:1704.02575. [Google Scholar] [CrossRef]
- Kumar, R.; Kumar, S.; Singh, J.; Al-Zhour, Z. A comparative study for fractional chemical kinetics and carbon dioxide CO2 absorbed into phenyl glycidyl ether problems. AIMS Math 2020, 5, 3201–3222. [Google Scholar] [CrossRef]
- Sulaiman, M.; Samiullah, I.; Hamdi, A.; Hussain, Z. An improved whale optimization algorithm for solving multi-objective design optimization problem of PFHE. J. Intell. Fuzzy Syst. 2019, 37, 3815–3828. [Google Scholar] [CrossRef]
- Wu, X.; Shen, J.; Li, Y.; Lee, K.Y. Data-driven modeling and predictive control for boiler–turbine unit using fuzzy clustering and subspace methods. ISA Trans. 2014, 53, 699–708. [Google Scholar] [CrossRef] [PubMed]
- Ahmad, S.; Sulaiman, M.; Kumam, P.; Hussain, Z.; Asif Jan, M.; Mashwani, W.K.; Ullah, M. A novel population initialization strategy for accelerating levy flights based multi-verse optimizer. J. Intell. Fuzzy Syst. 2020, 39, 1–17. [Google Scholar] [CrossRef]
- Khan, N.A.; Sulaiman, M.; Aljohani, A.J.; Kumam, P.; Alrabaiah, H. Analysis of multi-phase flow through porous media for imbibition phenomena by using the LeNN-WOA-NM algorithm. IEEE Access 2020, 8, 196425–196458. [Google Scholar] [CrossRef]
- Wu, X.; Shen, J.; Wang, M.; Lee, K.Y. Intelligent predictive control of large-scale solvent-based CO2 capture plant using artificial neural network and particle swarm optimization. Energy 2020, 196, 117070. [Google Scholar] [CrossRef]
- Xi, H.; Wu, X.; Chen, X.; Sha, P. Artificial intelligent based energy scheduling of steel mill gas utilization system towards carbon neutrality. Appl. Energy 2021, 295, 117069. [Google Scholar] [CrossRef]
- Chen, X.; Wu, X.; Lee, K.Y. The mutual benefits of renewables and carbon capture: Achieved by an artificial intelligent scheduling strategy. Energy Convers. Manag. 2021, 233, 113856. [Google Scholar] [CrossRef]
- Khan, N.A.; Sulaiman, M.; Kumam, P.; Aljohani, A.J. A new soft computing approach for studying the wire coating dynamics with Oldroyd 8-constant fluid. Phys. Fluids 2021, 33, 036117. [Google Scholar] [CrossRef]
- Waseem, W.; Sulaiman, M.; Alhindi, A.; Alhakami, H. A soft computing approach based on fractional order DPSO algorithm designed to solve the corneal model for eye surgery. IEEE Access 2020, 8, 61576–61592. [Google Scholar] [CrossRef]
- Khan, A.; Sulaiman, M.; Alhakami, H.; Alhindi, A. Analysis of oscillatory behavior of heart by using a novel neuroevolutionary approach. IEEE Access 2020, 8, 86674–86695. [Google Scholar] [CrossRef]
- Huang, W.; Jiang, T.; Zhang, X.; Khan, N.A.; Sulaiman, M. Analysis of beam-column designs by varying axial load with internal forces and bending rigidity using a new soft computing technique. Complexity 2021, 2021, 6639032. [Google Scholar] [CrossRef]
- Zhang, Y.; Lin, J.; Hu, Z.; Khan, N.A.; Sulaiman, M. Analysis of Third-Order Nonlinear Multi-Singular Emden–Fowler Equation by Using the LeNN-WOA-NM Algorithm. IEEE Access 2021, 9, 72111–72138. [Google Scholar] [CrossRef]
- Wu, X.; Wang, M.; Shen, J.; Li, Y.; Lawal, A.; Lee, K.Y. Reinforced coordinated control of coal-fired power plant retrofitted with solvent based CO2 capture using model predictive controls. Appl. Energy 2019, 238, 495–515. [Google Scholar] [CrossRef] [Green Version]
- Khan, N.A.; Khalaf, O.I.; Romero, C.A.T.; Sulaiman, M.; Bakar, M.A. Application of Euler Neural Networks with Soft Computing Paradigm to Solve Nonlinear Problems Arising in Heat Transfer. Entropy 2021, 23, 1053. [Google Scholar] [CrossRef]
- Waseem, W.; Sulaiman, M.; Kumam, P.; Shoaib, M.; Raja, M.A.Z.; Islam, S. Investigation of singular ordinary differential equations by a neuroevolutionary approach. PLoS ONE 2020, 15, e0235829. [Google Scholar] [CrossRef]
- Ahmad, A.; Sulaiman, M.; Alhindi, A.; Aljohani, A.J. Analysis of temperature profiles in longitudinal fin designs by a novel neuroevolutionary approach. IEEE Access 2020, 8, 113285–113308. [Google Scholar] [CrossRef]
- Araújo, R.d.A.; Oliveira, A.L.; Meira, S. A morphological neural network for binary classification problems. Eng. Appl. Artif. Intell. 2017, 65, 12–28. [Google Scholar] [CrossRef]
- Gong, T.; Fan, T.; Guo, J.; Cai, Z. GPU-based parallel optimization of immune convolutional neural network and embedded system. Eng. Appl. Artif. Intell. 2017, 62, 384–395. [Google Scholar] [CrossRef]
- Yu, S.; Zhu, K.; Zhang, X. Energy demand projection of China using a path-coefficient analysis and PSO–GA approach. Energy Convers. Manag. 2012, 53, 142–153. [Google Scholar] [CrossRef]
- Rabin, R.; Stewart, V. Dual response regulators (NarL and NarP) interact with dual sensors (NarX and NarQ) to control nitrate-and nitrite-regulated gene expression in Escherichia coli K-12. J. Bacteriol. 1993, 175, 3259–3268. [Google Scholar] [CrossRef] [PubMed] [Green Version]
- Ardalani-Farsa, M.; Zolfaghari, S. Chaotic time series prediction with residual analysis method using hybrid Elman–NARX neural networks. Neurocomputing 2010, 73, 2540–2553. [Google Scholar] [CrossRef]
- Boussaada, Z.; Curea, O.; Remaci, A.; Camblong, H.; Mrabet Bellaaj, N. A nonlinear autoregressive exogenous (NARX) neural network model for the prediction of the daily direct solar radiation. Energies 2018, 11, 620. [Google Scholar] [CrossRef] [Green Version]
- Menezes, J.M.P., Jr.; Barreto, G.A. Long-term time series prediction with the NARX network: An empirical evaluation. Neurocomputing 2008, 71, 3335–3343. [Google Scholar] [CrossRef]
- Kodogiannis, V.; Lisboa, P.J.; Lucas, J. Neural network modelling and control for underwater vehicles. Artif. Intell. Eng. 1996, 10, 203–212. [Google Scholar] [CrossRef]
- De Giorgi, M.G.; Ficarella, A.; Quarta, M. Dynamic performance simulation and control of an aeroengine by using NARX models. In MATEC Web of Conferences; EDP Sciences: Les Ulis, France, 2019; Volume 304, p. 03005. [Google Scholar]
- Duan, J.S.; Rach, R.; Wazwaz, A.M. Steady-state concentrations of carbon dioxide absorbed into phenyl glycidyl ether solutions by the Adomian decomposition method. J. Math. Chem. 2015, 53, 1054–1067. [Google Scholar] [CrossRef]
- Al-Jawary, M.; Raham, R.; Radhi, G. An iterative method for calculating carbon dioxide absorbed into phenyl glycidyl ether. J. Math. Comput. Sci. 2016, 6, 620–632. [Google Scholar]
- Saranya, K.; Mohan, V.; Rajendran, L. Steady-state concentrations of carbon dioxide absorbed into phenyl glycidyl ether solutions by residual method. J. Math. Chem. 2020, 58, 1230–1246. [Google Scholar] [CrossRef]


| and | and | |||||||||
|---|---|---|---|---|---|---|---|---|---|---|
| x | ADM & DRM | ADM | RM | Numerical | NARX-LM | ADM & DRM | ADM | RM | Numerical | NARX-LM |
| 0 | 1 | 1 | 1 | 1 | 1 | 1 | 1 | 1 | 1 | 1 |
| 0.2 | 0.7721 | 0.7722 | 0.7733 | 0.7754 | 0.7754 | 8734 | 8734 | 8730 | 8740 | 8740 |
| 0.4 | 0.5746 | 0.5746 | 0.5773 | 0.5797 | 0.5797 | 7614 | 7614 | 7610 | 7620 | 7620 |
| 0.6 | 0.401 | 0.4011 | 0.4042 | 0.4061 | 0.4061 | 6629 | 6629 | 6626 | 6629 | 6629 |
| 0.8 | 0.2451 | 0.2451 | 0.2472 | 0.2482 | 0.2482 | 5762 | 5762 | 5761 | 5758 | 5758 |
| 1.0 | 0.1 | 0.1 | 0.1 | 0.1 | 0.1 | 0.5 | 0.5 | 0.5 | 0.5 | 0.5 |
| and | and | |||||||||
|---|---|---|---|---|---|---|---|---|---|---|
| x | ADM & DRM | ADM | RM | Numerical | NARX-LM | ADM & DRM | ADM | RM | Numerical | NARX-LM |
| 0 | 0.8199 | 0.8098 | 0.8199 | 0.8173 | 0.8173 | 0.8426 | 0.842 | 0.8426 | 0.842 | 0.842 |
| 0.2 | 0.827 | 0.8188 | 0.827 | 0.826 | 0.826 | 0.8497 | 0.8491 | 0.8497 | 0.8489 | 0.8489 |
| 0.4 | 0.8483 | 0.8459 | 0.8483 | 0.8478 | 0.8478 | 0.8701 | 0.8698 | 0.8701 | 0.8688 | 0.8688 |
| 0.6 | 0.8839 | 0.881 | 0.8839 | 0.8849 | 0.8849 | 0.9026 | 0.9021 | 0.9026 | 0.9023 | 0.9023 |
| 0.8 | 0.9342 | 0.9331 | 0.9342 | 0.9345 | 0.9345 | 0.9462 | 0.9459 | 0.9462 | 0.9471 | 0.9471 |
| 1.0 | 1 | 1 | 1 | 1 | 1 | 1 | 1 | 1 | 1 | 1 |
| Case I | Case II | |||||
|---|---|---|---|---|---|---|
| x | FF-NN | LR-NN | NARX-LM | FF-NN | LR-NN | NARX-LM |
| 0.0 | 7.567414 | 1.976408 | 3.664701 | 1.853876 | 1.611739 | 1.594322 |
| 0.1 | 2.294808 | 3.465679 | 2.856463 | 4.781680 | 2.421558 | 1.214353 |
| 0.2 | 8.805666 | 3.535741 | 1.233261 | 8.706504 | 3.312607 | 3.532873 |
| 0.3 | 5.146110 | 2.495271 | 8.119822 | 1.454172 | 1.755399 | 4.475227 |
| 0.4 | 2.780715 | 2.560681 | 7.753534 | 4.615430 | 1.804920 | 2.842042 |
| 0.5 | 1.359414 | 2.127227 | 5.663649 | 4.426592 | 1.888973 | 2.552623 |
| 0.6 | 9.394572 | 1.570394 | 5.437249 | 9.599460 | 1.659002 | 1.624006 |
| 0.7 | 4.026649 | 9.583692 | 3.555038 | 8.586999 | 1.037132 | 1.193209 |
| 0.8 | 9.554468 | 1.991985 | 1.297162 | 1.651644 | 1.402911 | 3.752629 |
| 0.9 | 6.361145 | 5.625482 | 1.278474 | 4.498823 | 7.522469 | 9.783728 |
| 1.0 | 1.073576 | 1.483420 | 3.995772 | 9.093789 | 1.069798 | 2.023171 |
| Case III | Case IV | |||||
|---|---|---|---|---|---|---|
| x | FF-NN | LR-NN | NARX-LM | FF-NN | LR-NN | NARX-LM |
| 0.0 | 5.662392 | 1.282375 | 2.454875 | 9.311650 | 2.660996 | 8.705075 |
| 0.1 | 7.540143 | 3.653438 | 1.241626 | 5.827090 | 9.107916 | 8.132946 |
| 0.2 | 2.002106 | 2.879628 | 5.167114 | 3.032041 | 1.850514 | 6.939629 |
| 0.3 | 3.071841 | 4.926253 | 9.863673 | 5.746880 | 3.007176 | 5.252565 |
| 0.4 | 1.557625 | 5.678588 | 6.458083 | 4.507465 | 1.119539 | 5.121962 |
| 0.5 | 2.451808 | 4.759676 | 7.378733 | 1.396936 | 6.004553 | 4.057286 |
| 0.6 | 7.209635 | 2.690070 | 6.402087 | 5.687769 | 1.139300 | 7.379871 |
| 0.7 | 2.222096 | 1.090769 | 4.285971 | 5.169435 | 1.277712 | 2.756274 |
| 0.8 | 1.854701 | 2.853953 | 1.863085 | 7.419310 | 3.113386 | 5.949529 |
| 0.9 | 4.618550 | 1.901168 | 5.167832 | 3.146698 | 1.796623 | 3.940062 |
| 1.0 | 1.150652 | 1.836329 | 7.934356 | 1.193031 | 2.681365 | 2.036388 |
Publisher’s Note: MDPI stays neutral with regard to jurisdictional claims in published maps and institutional affiliations. |
© 2021 by the authors. Licensee MDPI, Basel, Switzerland. This article is an open access article distributed under the terms and conditions of the Creative Commons Attribution (CC BY) license (https://creativecommons.org/licenses/by/4.0/).
Share and Cite
Khan, N.A.; Sulaiman, M.; Tavera Romero, C.A.; Alarfaj, F.K. Theoretical Analysis on Absorption of Carbon Dioxide (CO2) into Solutions of Phenyl Glycidyl Ether (PGE) Using Nonlinear Autoregressive Exogenous Neural Networks. Molecules 2021, 26, 6041. https://doi.org/10.3390/molecules26196041
Khan NA, Sulaiman M, Tavera Romero CA, Alarfaj FK. Theoretical Analysis on Absorption of Carbon Dioxide (CO2) into Solutions of Phenyl Glycidyl Ether (PGE) Using Nonlinear Autoregressive Exogenous Neural Networks. Molecules. 2021; 26(19):6041. https://doi.org/10.3390/molecules26196041
Chicago/Turabian StyleKhan, Naveed Ahmad, Muhammad Sulaiman, Carlos Andrés Tavera Romero, and Fawaz Khaled Alarfaj. 2021. "Theoretical Analysis on Absorption of Carbon Dioxide (CO2) into Solutions of Phenyl Glycidyl Ether (PGE) Using Nonlinear Autoregressive Exogenous Neural Networks" Molecules 26, no. 19: 6041. https://doi.org/10.3390/molecules26196041