Article

The Formation of Mn-Ce Oxide Catalysts for CO Oxidation by Oxalate Route: The Role of Manganese Content

by
Olga A. Bulavchenko
1,*,
Tatyana N. Afonasenko
2,
Alexey R. Osipov
2,
Alena A. Pochtar’
1,
Andrey A. Saraev
1,
Zahar S. Vinokurov
1,
Evgeny Yu. Gerasimov
1 and
Sergey V. Tsybulya
1
1
Boreskov Institute of Catalysis SB RAS, Lavrentiev Ave. 5, 630090 Novosibirsk, Russia
2
Center of New Chemical Technologies BIC, Boreskov Institute of Catalysis, Neftezavodskaya 54, 644040 Omsk, Russia
*
Author to whom correspondence should be addressed.
Nanomaterials 2021, 11(4), 988; https://doi.org/10.3390/nano11040988
Submission received: 15 March 2021 / Revised: 2 April 2021 / Accepted: 7 April 2021 / Published: 12 April 2021
(This article belongs to the Special Issue Synthesis of Nanocomposites and Catalysis Applications)

Abstract

:
The Mn-Ce oxide catalysts active in the oxidation of CO were studied by X-ray diffraction (XRD), X-ray photoelectron spectroscopy (XPS), temperature-programmed reduction (TPR), transition electron microscopy (TEM), energy dispersive X-Ray (EDX), and a differential dissolution technique. The Mn-Ce catalysts were prepared by thermal decomposition of oxalates by varying the Mn:Ce ratio. The nanocrystalline oxides with a fluorite structure and particle sizes of 4–6 nm were formed. The introduction of manganese led to a reduction of the oxide particle size, a decrease in the surface area, and the formation of a MnyCe1−yO2−δ solid solution. An increase in the manganese content resulted in the formation of manganese oxides such as Mn2O3, Mn3O4, and Mn5O8. The catalytic activity as a function of the manganese content had a volcano-like shape. The best catalytic performance was exhibited by the catalyst containing ca. 50 at.% Mn due to the high specific surface area, the formation of the solid solution, and the maximum content of the solid solution.

Graphical Abstract

1. Introduction

The combustion of fossil fuels in power plants, motor vehicles, and other industries emits different toxic pollutants such as CO, NOx, and volatile organic compounds (VOCs), which are very dangerous for the environment and human health. In particular, emissions of carbon monoxide pose a serious threat to human health and ecology. The elimination of CO via catalytic oxidation is one of the most effective methods for the purification of exhaust gases from automobiles and industry [1,2]. For these purposes, manganese-containing catalysts have received considerable attention [3,4]. They are an alternative to noble metal catalysts because, along with their low cost, they have thermal stability and resistance to sulfur poisoning [5]. The catalytic activity in oxidation reactions on manganese oxides is associated with their structural flexibility and variability of the oxidation state of manganese [3].
Ceria (CeO2) has inferior activity in the oxidation reactions of CO, but it has been widely applied as a catalyst support or a surface modifier [6]. For example, CeO2 is well known as an irreplaceable component in three-way catalysts [7,8] and low-temperature selective catalytic reduction of NOx [9]. The incredible performance of ceria has been traditionally associated with the excellent ability of these oxides to shuttle between Ce(III) and Ce(IV) states, their oxygen storage capacity, and abundant oxygen vacancies [6].
The introduction of a redox-active cation into ceria to form a solid solution or a strong metal−support interaction changes the properties of materials. The cooperation of manganese and cerium oxides enhances oxygen mobility and redox ability [10,11,12]. The Mn-Ce oxides show excellent catalytic performance in the oxidation of hydrocarbons, volatile organic compounds, CO [10,11,12,13,14,15,16,17,18,19,20] and selective catalytic oxidation of NOx with NH3 [5,21]. Recently, the number of works devoted to Mn-Ce oxide catalysts has sharply increased [12,15,16,17,22,23,24,25,26,27]; special attention is paid to improving the synthesis methods leading to the formation of active, highly dispersed and nanostructured compounds. For the preparation of MnOx-CeO2 catalysts, methods such as combustion [11], coprecipitation [19,28,29], sol–gel [19,25], and template synthesis [14] are used. Saker et al. [30] employed the impregnation of a MnOx-CeO2 catalyst on Al2O3. Delimas et al. [11] used urea combustion to prepare a Mn0.5Ce0.5O2 catalyst. Du et al. [12] applied hydrothermal synthesis combined with redox deposition.
Three kinds of active states existed in the MnOx-CeO2 catalysts: (i) Mn cations in the fluorite structure, (ii) active dispersed MnOx surface particles strongly interacting with CeO2 oxide, and (iii) relatively large MnOx aggregates on the surface of the support [31]. Depending on the preparation conditions, one of these states prevails.
The controlled thermal decomposition of manganese or cerium oxalates separately has been extensively studied, and the formation of highly dispersed oxides with a high surface area has been shown [32,33,34,35,36,37]. Much less attention is paid to the formation of double Mn-Ce oxides. Li et al. [38] studied the effect of the calcination temperature of oxalates on the properties of Mn-Ce oxide catalysts supported on SiO2. For such systems, the low synthesis temperature leads to low crystallinity. The oxalate route is commonly used to prepare oxide catalysts, since this method is simple, provides the ability to control the properties of the product by varying the decomposition conditions, has a relatively low decomposition temperature and the ability to obtain a product with a high specific surface area.
Previously, we studied the influence of the annealing conditions on the catalytic, structural, microstructural and redox properties of the Mn-Ce oxide catalysts obtained by thermal decomposition of oxalate precursors [39]. The goal of the current study is to determine the effect of Mn content in Mn-Ce oxide catalysts on the catalyst properties. For this, a series of MnxCe1−x oxides were synthesized by varying the x content from 0 to 1 and studied by a complex of physicochemical methods, including ex situ and in situ X-ray diffraction (XRD), high-resolution transmission electron microscopy (TEM) with energy dispersive X-ray analysis (EDX), temperature-programmed reduction (TPR-H2), X-ray photoelectron spectroscopy (XPS), and a differential dissolution (DD) technique; the catalytic activity was tested in the reaction of CO oxidation.

2. Materials and Methods

2.1. Catalysts Preparation

Precipitation was carried out with vigorous stirring of a mixed Mn(NO3)2 and Ce(NO3)3 solution by the dropwise addition of a (NH4)2C2O4 solution. The deposition time was 1 h. After adding the entire volume of precipitant, stirring of the solution with the precipitate formed continued for 1 h. The resulting precipitate was filtered off and washed with water (~2 L) on a filter. Then, it was dried at 60 °C for 20 h and calcined at 400 °C for 4 h. The resulting catalysts were designated as MnxCe1−x, where x is the molar fraction of manganese.

2.2. Catalyst Characterization

The elemental composition of samples was determined using an X-ray fluorescence spectrometer ARL Advant’X 2247 (Thermo Fisher Scientific, Waltham, MA, USA) equipped with Rh anode as an X-ray source. The mass percentage of elements was estimated using QuantAS software.
The phase composition was determined by XRD using a Bruker D8 Advance (Germany) diffractometer equipped with a Lynxeye linear detector. The diffraction patterns were obtained in the 2θ range from 15 to 85° with a step of 0.05° using monochromatic Cu Kα radiation (λ = 1.5418 Å). Rietveld refinement for quantitative analysis was carried out using the software package Topas V.4.2. The instrumental broadening was described with metallic silicon as reference material. The size of the coherent scattering domain was calculated using LVol-IB values (LVol-IB—the volume-weighted mean column height based on integral breadth). In situ XRD experiments were performed at the Precision Diffractometry-2 station at the Siberian Synchrotron and Terahertz Radiation Centre (Institute of Nuclear Physics SB RAS, Novosibirsk). The station was equipped with a single-coordinate position-sensitive detector OD-3M (Institute of Nuclear Physics SB RAS); a high-temperature X-ray chamber-reactor XRK 900 (Anton Paar GmbH, Graz, Austria), and a gas mixture feed system equipped with a digital mass flow controllers SEC-Z500 (Horiba Ltd., Kyoto, Japan). The radiation wavelength of 0.17238 nm was set by a single reflection of the incoming white synchrotron radiation beam from a Ge (111) crystal. High-temperature in situ XRD measurements for the Mn0.45Ce0.55 sample were carried out in a flow mode with a gas mixture of 10% H2 + He and a gas flow rate of 100 sccm. The sample treatment included subsequent heating from 30 to 600 °C with a rate of 5 °C/min and cooling down to 30 °C with a rate of 30 °C/min.
The specific surface area was calculated with the Brunauer–Emmett–Teller (BET) method using nitrogen adsorption isotherms measured at liquid nitrogen temperatures on an automatic Micromeritics ASAP 2400 sorptometer (Micromeritics Instrument. Corp., Norcross, GA, USA).
The differential dissolution method was used to determine the cationic composition of the various phases of the oxides. Differential dissolution was carried out in a dynamic mode using a stoichiograph equipped with an inductively coupled plasma atomic emission spectrometer (BAIRD). The fraction with the average particle size ≤ 40 μm was analyzed. A ca. 3 mg weighed portion of the sample was supported homogeneously onto an expendable tape made of a polymer film with an adhesive surface. The tape was then placed in the flow microreactor of the stoichiograph. Using the stoichiographic titration mode [40], dissolution was started with an aqueous solution of HCl (1.2 M) and then successively proceeded to HCl (3 M) and HF (3.8 M) solutions. The complete dissolution of the sample occurred in the HF (3.8 M) solution. The composition of the samples was determined using spectral lines of the elements: 413.6 nm for Ce and 293.3 nm for Mn with a 5% accuracy of measurements at a sensitivity of 10−3 μg mL−1. Since oxygen cannot be determined by this method, stoichiometric formulas of the corresponding phases are presented in their fragmentary form without oxygen. The calculation method of DD data is given in Supporting Information.
The morphology and microstructure of the catalysts were studied by transmission electron microscopy. TEM images were obtained using a JEM-2010 (JEOL, Tokyo, Japan) and ThemisZ microscope (Thermo Fisher Scientific, Eindhoven, Netherlands) with a resolution of 1.4 Å and 0.7 Å, respectively. Point EDX analysis was carried out using energy dispersive spectrometer XFlash Bruker with an energy resolution of 128 eV. Elemental maps were obtained using energy dispersive spectrometer SuperX Thermo Fisher Scientific. Samples for research were fixed on standard copper grids using ultrasonic dispersion of the catalysts in ethanol.
The temperature-programmed reduction in hydrogen (TPR-H2) was performed with 40–60 mg of sample in a quartz reactor using a flow setup with a thermal conductivity detector. The reducing mixture (10 vol. % of H2 in Ar) was fed at 40 mL/min. The rate of heating from room temperature to 700 °C was 10 °C/min. The TPR curves were normalized per catalyst mass.
The XPS measurements were performed on a photoelectron spectrometer (SPECS Surface Nano Analysis GmbH, Berlin, Germany) equipped with a PHOIBOS-150 hemispherical electron energy analyzer and an XR-50 X-ray source with a double Al/Mg anode. The core-level spectra were obtained using AlKα radiation (hν = 1486.6 eV) under ultrahigh vacuum conditions. The binding energy (Eb) of photoemission peaks was corrected for the Ce3d3/2-U’’’ peak (Eb = 916.7 eV) of cerium oxide. The curve fitting was done by the CasaXPS software [41]. The line shape used in the fit was the sum of Lorentzian and Gaussian functions. A Shirley-type background was subtracted from each spectrum [42]. Relative element concentrations were determined from the integral intensities of the core-level spectra using the theoretical photoionization cross-sections according to Scofield [43].

2.3. Catalytic Tests

Catalytic tests in the reaction of CO oxidation were performed in a flow regime in a glass reactor having 170 mm in length and 10 mm in the inner diameter. The initial gas mixture composition was 1 vol.% CO in air. All the samples were investigated in the temperature range of 50–400 °C. The contact time was 0.06 s. A catalyst fraction of 0.4–1.0 mm was used, a catalyst mass was 0.5 g. To avoid overheating during the exothermic reaction, the catalyst was mixed with a quartz powder of the same particle size. The reactant mixture before and after the reactor was analyzed by a gas chromatograph equipped with a zeolite CaA column and a thermal conductivity detector.
The catalytic activity was calculated from the formula:
R(CO) = C0 X·V/mcat, [cm3(CO)/g∙s]
X = (P0 − Pcur)/P0
where P0 is the peak area corresponding to the initial concentration of CO in the reactant mixture; Pcur is the peak area corresponding to the current concentration of CO at the reactor outlet; X is the degree of CO conversion; C0 is the initial concentration of CO in the mixture (C0 = 1 vol.%); V is the feed rate of the reactant mixture, mL/min; and mcat is the mass of the catalyst, g.

3. Results

3.1. Structural Properties

Figure 1 shows the diffraction patterns of the MnxCe1−x catalysts with x varying from 0 to 1.
The XRD patterns contain wide peaks located at 2θ = 32.8, 47.4, 56.4, 59.6, 69.5, 76.9, 79.1° and correspond to reflections of CeO2 with the fluorite-type structure, space group Fm3m [JCPDS No. 431002]. An increase in the Mn content to x = 0.15–0.45 leads to the appearance of additional reflections located at 2θ = 18.2, 21.6, 36.2, 38.4, 64.8, 66.0º. These peaks belong to manganese oxides Mn3O4 [JCPDS No. 240734], Mn2O3 [JCPDS No. 411442], and Mn5O8 [JCPDS No. 200718]. The intensity of reflections of manganese oxides grows with increasing Mn content. The phase content was estimated by the Rietveld refinement and summarized in Table 1. From x = 0.25 to 0.9, the fraction of simple Mn oxides rises from 4 to 80 wt.%. The Mn1Ce0 catalyst contains only Mn oxides in different modifications: 28 wt.% Mn2O3, 34 wt.% Mn3O4, and 38 wt.% Mn5O8. Such a variety of valence states of manganese after calcination at 400 °C is probably due to the exothermic effect during the calcination of manganese oxalate in the air.
The evolution of the lattice parameter and crystallite size of ceria is presented in Figure 2. In the case of pure ceria for Mn0Ce1, the lattice parameter is 5.412 Å, whereas for MnxCe1−x, the value varies in the range of 5.412–5.402 Å (Figure 2, Table 1). For x = 0–0.25, the crystallite size and lattice parameter hardly change. A further increase in the Mn content to x = 0.45–0.7 results in a decrease in the crystallite size and lattice parameter. For x = 0.8–0.9, it is difficult to correctly estimate the structural characteristics of ceria due to low intensities of their diffraction lines and overlap with reflections of manganese oxide. The surface area of the oxides does not change significantly with varying the chemical composition from x = 0 to 0.45 and is about 99–110 m2/g; then the surface area gradually decreases to 32 m2/g for x = 1 (Table 1).
It is noteworthy that structural features of ceria in the Mn0.45Ce0.55-Mn0.7Ce0.3 catalysts are different from other samples in the series (Figure 2). Additionally, a slight shift of the lattice parameters of ceria gives us a hint that the formation of a MnyCe1−yO2−δ solid solution occurs. The incorporation of a smaller size Mn ion structure (Mn2+—0.097 nm, Mn3+—0.065 nm, Mn4+—0.053 nm, Ce4+—0.097 nm, Ce3+—0.114 nm) into the oxide results in a decrease in the lattice parameter. To confirm the distribution of cations over the oxide, we analyzed the structural and microstructural characteristics of Mn0.45Ce0.55 in comparison with Mn0.15Ce0.85 (Mn0.1Ce0.9) using such methods as DD and TEM with EDX microanalysis. DD gives information about the joint or separate dissolution of Mn and Ce cations by changing the dissolution conditions. TEM shows the microstructural characteristics of oxides and cation distribution.
The catalysts were studied by high-resolution transmission electron microscopy coupled with energy dispersive X-ray analysis. The results for the Mn0.15Ce0.85 catalyst are presented in Figure 3. The large plate aggregates with sizes of ca. 1000 nm are observed (Figure 3a). They consist of primary disordered particles with sizes of 5–8 nm (Figure 3b,c). The interplanar distance is 3.18Å (Figure 3c), which corresponds to the (111) plane of fluorite. EDX analysis in this area shows only Ce (Figure 3d). In addition, particles differing in morphology (separately located) are observed, for which the distance is 4.88 Å, which corresponds to the (101) plane of Mn3O4 or (200) plane of Mn5O8 (Figure 3e). EDX analysis showed that in these areas, along with manganese atoms, 3–5 at.% Ce is present (Figure 3f); however, this signal can be observed from single CeO2 crystallites located on the surface of massive manganese oxide particles.
In the case of catalysts with higher manganese content, Mn0.45Ce0.55, there are two types of particles (Figure 4a,b). Particles of the first type have rounded shapes and sizes of 10–50 nm (Figure 4c). According to EDX analysis, there is the Mn-rich area; the Mn:Ce ratio is about 98:2 (Figure 4d). The interplanar distances of 4.85 Å are observed, which correspond to the (101) plane of Mn3O4 or (200) plane of Mn5O8. The second type of particles are elongated, have a uniform shape (Figure 4a), and consist of dispersed crystallites 2–4 nm in size (Figure 4e). The interplanar distance of 3.12 Å corresponds to the (111) plane of fluorite. According to the EDX analysis, these areas contain about 17 and 83 at. % of Mn and Ce cations, respectively (Figure 4f). To confirm the distribution of elements, we applied EDS mapping (Figure 4g,h). EDS mapping from this area shows a uniform distribution of manganese and cerium cations over the particle with a cation ratio of Mn:Ce is about 20:80.
In contrast to XRD and TEM methods, which reveal only structural and microstructural changes, the differential dissolution method is able to determine the cationic composition of phases. This method determines the stoichiometry of the elemental composition of successively dissolving phases. The propagation of the dissolution reaction front from the surface to the center of the particles is accompanied by continuous recording of the ratio between all elements.
For the Mn0.45Ce0.55 catalyst, Figure 5 shows the dissolution curves for manganese and cerium depending on time, as well as the Mn:Ce ratio. Within the first 32 min, manganese is predominantly dissolved, then (32–38 min) mostly the cerium dissolution is observed (Figure 5a), and from 43 to 46 min, the manganese is dissolved again. In the middle region (32–38 min), changes in the concentration of manganese and cerium during dissolution occur simultaneously. To illustrate this phenomenon, Figures S1 and S2 display the dissolution curves of Mn and Ce normalized per the maximum dissolution rate. In the diapasons of 0–32 and 38–46 min, the Mn:Ce ratio varies from 0 to 8; especially large fluctuations are observed at the beginning of dissolution due to a very low concentration of Ce. From 32 to 38 min of dissolution, the temporal profile of the stoichiogram contains a close to linear segment; the Mn:Ce molar ratios change in the range of 0.24–0.5 (Figure 5a). The fragment of the stoichiogram can indicate the formation of concentration-inhomogeneous solid solutions or simultaneous dissolution of mixed oxide and another phase. From the stoichiogram, one can assume the phase composition with the minimum manganese content of Mn0.24Ce1 (without oxygen, because oxygen is not detected by DD). The first phase is dissolved within 5–40 min, its content being 77.9 wt.% (Figure 5b). After subtraction of the Mn0.24Ce1 phases from kinetic curves of Ce and Mn dissolution, the second and third phases are distinguished. The second phase contains only Mn in the amount of 21.9 wt.%, while the third phase contains Ce (0.2 wt.%) (Figure 5b). The dissolution of the Mn phase is observed in three regions: 0–32, 32–35 and 42–46 min (Figure 5b), which indicate the formation of different Mn oxides; this is in good agreement with XRD data (Table 1).
For the Mn0.1Ce0.9 and Mn0.15Ce0.85 catalysts, Figures S3 and S4 display the dissolution curves of manganese and cerium as well as the stoichiograms of Mn:Ce versus time. The differential dissolution data also show the presence of a mixed Mn-Ce compound with the ratio Mn:Ce = 0.03:1 ÷ 0.06:1, which is much lower than that for Mn0.45Ce0.55 (Mn:Ce = 0.24:1). The DD results show that Mn0.1Ce0.9 contains 92.9 wt.% Mn0.03Ce1, 6.9 wt.% Mn1, and 0.2 wt%Ce1. For Mn0.15Ce0.85, 91.7 wt.% Mn0.06Ce1, 8.1 wt.% Mn1, and 0.2 wt.%Ce1 are observed. The DD results show that an increase in the manganese content in the catalyst leads to a growth in the content of free manganese (Mn1), which is associated with simple manganese oxides, and to an increase in the amount of manganese incorporated into the solid solution. From x = 0.1 to x = 0.45, the content of Mn oxides increases from 6.9 to 21.9 wt.%, while the substitution of Ce by Mn ions in the fluorite structure increases from Mn0.03Ce0.97O2+δ to Mn0.2Ce0.8O2+δ.
For the Mn0.45Ce0.55 catalyst, the DD, TEM and XRD data indicate that the thermal decomposition of oxalate precursors leads to the formation of a Mn-Ce solid solution. According to XRD, the lattice parameter and crystallite size differ from pure ceria. TEM shows agglomerates with the 2–4 nm nanoparticles containing Mn and Ce elements. EDS mapping indicates a uniform distribution of Mn and Ce cations over the particles. The DD data illustrate the joint dissolution of Mn and Ce atoms.
Thus, the introduction of manganese into cerium oxide results in (i) a decrease in the crystalline size of ceria, (ii) a decrease in the surface area of the catalyst for x > 0.45; (iii) an increase in the content of simple oxides; and (iv) starting from x = 0.1–0.15, a solid solution MnyCe1−yO2 begins to form, which can be inhomogeneous. In the case of oxalate route, the formation of a solid solution may be determined by kinetic factors. At low x, there is a small number of contacts between oxalate precursors. Therefore, with a low content of manganese, a solid solution is either absent or formed in an insignificant amount, while at a higher concentration of Mn, a solid solution is formed.

3.2. Redox Properties

To understand the reducibility of the MnxCe1−x catalysts, TPR-H2 experiments were performed; all normalized results are shown in Figure 6. For the Mn1Ce0 oxide, the TPR profile exhibits three reduction peaks with the maxima at 230, 320, and 430 °C. According to XRD, Mn1Ce0 is a mixture of simple oxides such as Mn5O8, Mn2O3, and Mn3O4. The reduction of manganese oxides can be described by the successive processes Mn5O8 → Mn2O3 → Mn3O4 → MnO [44,45,46,47]. The pure CeO2 shows a single broad peak in a range of 300–560 °C, which can be attributed to the reduction of surface oxygen of ceria [48,49]. Modification with manganese cations influences the reducibility of ceria. The introduction of Mn into ceria results in shifting the TPR peak to low temperatures. As the manganese content increases to x = 0.25, the high-temperature peak shifts to Tmax = 460 °C. For x > 0.25, apparently, there is an overlap of the reduction peaks of ceria and manganese oxides.
For x = 0.1–0.15, intensive peaks with the maxima at ca. 410 °C and some hydrogen consumption at 270–320 °C appear, which are attributed to the reduction of manganese oxide. According to XRD data for the MnxCe1−x catalysts with x = 0.1–0.15, crystalline manganese oxides were not observed. However, DD shows a separate Mn-containing phase, which is in good agreement with the TPR data indicating hydrogen consumption due to the presence of highly dispersed manganese oxides. For x = 0.25, the TPR profile contains peaks with the maxima at 230, 270, 310, 410, and 460 °C. With increasing manganese content, the intensity of the peaks with the maxima at ca. 310–320 and 410–430 °C increases, which is associated with an increase in the content of simple manganese oxides. In addition, for x = 0.25–0.7, the reduction peak at 270 °C occurs. Zhang et al. [50] reported that hydrogen consumption in this area is attributed to the reduction of the Mn-Ce solid solution. However, according to other reports [26,38], two TPR peaks during the reduction of the Mn-Ce solid solution are also observed due to several reduction steps. In addition, the presence of amorphous manganese oxides makes it difficult to interpret the TPR data. For x = 0.7–0.8, an additional high-temperature peak with a maximum at 470 °C appears. It can be assumed that two high-temperature peaks (at 410 and 470 °C) correspond to the reduction of Mn3O4 to MnO, but from different precursors. This hypothesis is supported by the change in the intensity of these peaks with an increase in the manganese concentration. (For x = 0.6, hydrogen consumption during the peak at 410 °C is 1.65 mmol H2/g; for x = 0.7, the sum of intensities for peaks at 410 and 470 °C is 1.77 mmol H2/g; for x = 0.8, 2.00 mmol H2/g; and for x = 0.9, the intensity of peak at 415 °C is 2.66 mmol H2/g.) The separation of the reduction steps can be associated with the kinetics of the process and the influence of cerium on the reduction of manganese oxides. For x > 0.8, these two peaks overlap, and a broad peak located in the temperature range of 350–500 °C appears. With the addition of Mn from x = 0 to x = 1, a gradual increase in the amount of absorbed hydrogen from 0.44 to 5.7 mmol H2/g is observed.
However, from TPR it is difficult to unambiguously ascribe the peaks of hydrogen consumption to the reduction steps of manganese and cerium cations, since the position of the peaks depends on many parameters such as dispersity, defectiveness, and presence of the second oxide. In the case of a multiphase system, the peaks often overlap. To study the reducibility of the Mn0.45Ce0.55 catalyst, we have performed in situ XRD experiments.

3.3. In Situ XRD

The evolution of the phase composition of Mn0.45Ce0.55 catalyst during heating under hydrogen flow is shown in Figure 7a (the corresponding XRD patterns are shown in Supplementary Information, Figure S5). According to in situ XRD data, the as-prepared catalyst contains not only ceria but also both the Mn2O3 and Mn3O4 phases. In the case of the in situ XRD experiment, the most intense diffraction lines of Mn5O8 were not observed due to the limited detector area for the in situ experiment and the phase was excluded from the calculation. All the phase transitions for manganese phases occur in the temperature range from 250 to 400 °C. At first, Mn2O3 is reduced to Mn3O4 starting from 260 °C and then Mn3O4 is further reduced to MnO starting from 320 °C. According to XRD data, the ceria content decreases from 86 to 62 wt.% in the same temperature region where the transformation of Mn oxides occurs. The observed behavior of the ceria content curve gives us a hint that manganese cations leave the fluorite structure with the formation of crystalline phases of manganese oxides at 250–400 °C.
XRD data (Figure S5) show that a progressive decrease in the peak width of ceria due to thermal annealing is observed. In addition, no drastic crystallographic changes in ceria are observed, indicating that the rhombohedral Ce7O12, trigonal Ce11O20 or bixbyite phases reported by Bekheet [51] are not formed after treatment at 600 °C. Changes in the fluorite lattice upon treatment under H2 up to 600 °C are shown in Figure 7b. There are three regions of changes in the ceria lattice parameter. Up to 250 °C, the change in the lattice parameter is negligible; further heating leads to a rapid increase in the ceria lattice parameter in the temperature range of 250–400 °C. From 400 to 600 °C, the ceria lattice parameter rises almost linearly. The second region is noteworthy (from 250 to 400 °C), where the major changes in the lattice parameter (Figure 7b) and a decrease in the ceria content (Figure 7a) are observed. Chemical lattice expansion of ceria is mostly induced by the change in oxygen vacancy concentrations and the concomitant change of Ce3+ concentrations (for charge compensation) [51,52,53] or the reduction of Mn cations, although the segregation of the MnCe solid solution [53] and hydrogen incorporation into the lattice in the hydroxyl form [54,55] cannot be completely ruled out. In the case of the Mn0.45Ce0.55 catalyst, the lattice parameter of a fluorite phase during the reduction increases from 5.402 Å at RT to 5.441 Å at 600 °C. During further cooling, a close-to-linear dependence was observed for the fluorite lattice parameter (Figure 7b). After the reduction, the lattice parameter does not return to the initial value and becomes 5.411 Å, which is close to that for pure ceria. Such a change in the lattice parameter simultaneously with a decrease in the ceria content indicates that during the reduction at 250–400 °C, the Mn cations leave the structure of the MnyCe1−yO2−δ solid solution.
Interestingly, in situ XRD data shows that the reduction of Mn in the composition of the solid solution occurs within the same temperature ranges as the reduction of crystalline manganese oxides. Unfortunately, it was not possible to unambiguously attribute specific TPR peaks to the phase transformation observed by in situ XRD. According to in situ XRD, at 250–400 °C all Mn states are reduced to MnO. Whereas, according to TPR, the process is more extended in time and the reduction occurs up to 450 °C (Figure 6). Probably, differences in the temperature intervals of reduction are connected with different experimental conditions of in situ XRD and TPR method. For Mn0.45Ce0.55, in the temperature interval of 250–450 °C, there are only three TPR peaks with the maxima at 270, 320, and 410 °C. An increase in the Mn content from x = 0.45 to x = 0.7 leads to an increase in the content of crystalline manganese oxides and a decrease in the concentration of the solid solution (Table 1, Figure 6). At the same time, according to TPR, we observe a decrease in the peak at 270 °C and an increase in the intensity of the TPR peak at 320 °C (Figure 6). From this correlation, we can to some extent suppose that the TPR peak with a maximum at 270 °C corresponds to the reduction of solid solution, whereas the peak at 320 °C is attributed to the reduction of crystalline Mn2O3.

3.4. Surface Properties

To study the chemical states and relative concentrations of elements in the (sub)surface layers of catalysts, X-ray photoelectron spectroscopy (XPS) was used. Figure 8a shows the Ce3d core-level spectra of the catalysts. The shape of Ce3d spectra and the binding energy indicate that ceria in the catalysts exists in the Ce3+ and Ce4+ states. It is well known that the Ce3d core-level spectra of cerium oxide demonstrate the complex peak structure due to the presence of Ce3+ and Ce4+ states. Indeed, as a result of the spin-orbit interaction, the Ce3d core-level spectrum splits into two sublevels Ce3d5/2 and Ce3d3/2, which leads to the appearance of a doublet in the XPS spectrum. Moreover, each component of the doublet, in turn, splits into three peaks in the case of CeO2 (v/u, v″/u″, v″′/u″′) or into two peaks in the case of Ce2O3 (v′/u′, v0/u0) [56,57]. According to the analysis of peak areas, the concentrations of Ce3+ cations for all the catalysts were calculated and the relevant data are presented in Table 2.
Figure 8b shows the Mn2p core-level spectra of the catalysts. The Mn2p spectra are described by three Mn2p3/2–Mn2p1/2 doublets assigned to manganese in the Mn2+, Mn3+ and Mn4+ states and by the corresponding shake-up satellites located at a distance of 7.8, 10.2 and 11.7 eV from the main peaks. In other words, manganese in the systems under consideration is in three states, Mn2+, Mn3+ and Mn4+. The Mn2p3/2 peak assigned to manganese in the Mn2+ state lies at 640.0–640.5 eV; in the Mn3+ state, at 640.6–641.2 eV, and that of manganese in the Mn4+ state, at 641.2–642.2 eV. In the literature, for manganese in MnO, Mn2O3 and MnO2 oxides, the binding energies Mn2p3/2 are given in the ranges of 640.4–641.7, 641.5–641.9, and 642.2–642.6 eV, respectively [58,59,60,61,62,63,64,65,66,67,68,69,70,71]. With an increase in the manganese content in the sample, the [Mn]/[Mn + Ce] atomic ratio and the amount of Mn in a higher oxidation state (Mn2+ and Mn4+) grow (Table 2).

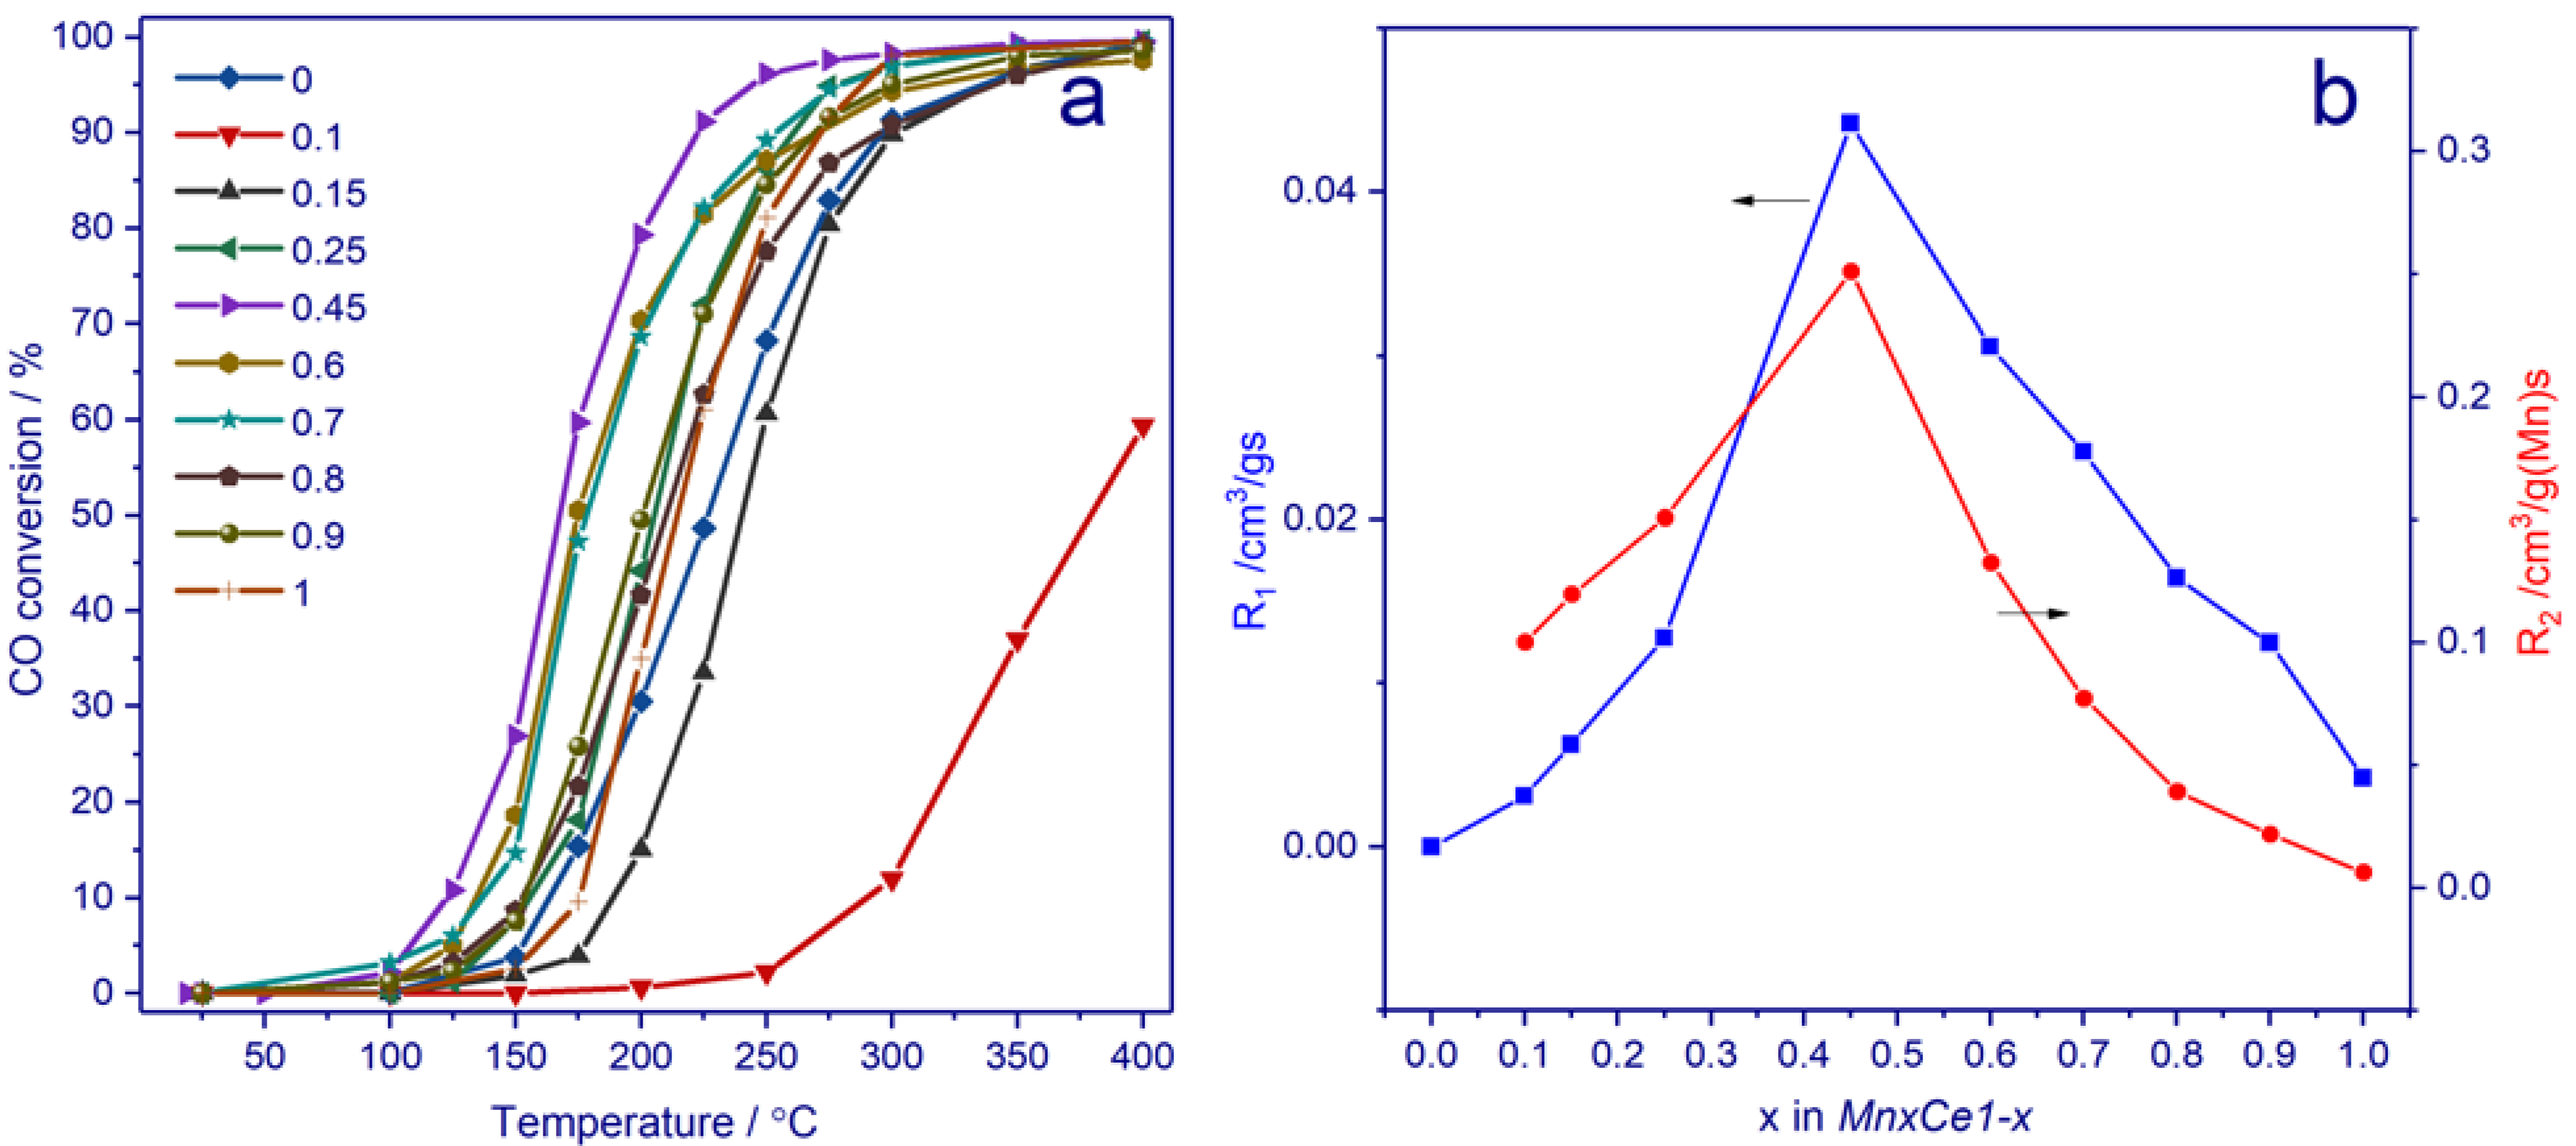
3.5. Catalytic Activity in CO Oxidation

Figure 9a shows the evolution of CO conversion as a function of temperature for MnxCe1−x catalysts. Pure CeO2 shows the lowest activity; the temperature of 50% CO conversion is 379 °C. The introduction of Mn results in a shift of the light-off curves toward low temperatures. An increase in the Mn content to x = 0.45 leads to a decline in the temperature of 50% CO conversion from 379 to 168 °C. A further increase in the manganese content leads to the opposite effect; the temperature of 50% conversion gradually grows up to 201 °C for Mn0.9Ce0.1. The rates of CO oxidation normalized per mass (R1) at 150 °C are presented in Figure 9b. One can see that the dependence of R1 versus x has a volcano shape and the Mn0.45Ce0.55 catalyst exhibits the best activity. To elucidate the role of the amount of Mn ions, the rate of CO oxidation was normalized per the Mn content (R2 = R1/m(Mn)). From x = 0.1 to x = 0.25, the activity per the Mn content varies between 0.10 and 0.15 cm3/g(Mn)·s. For x = 0.45, R2 drastically rises up to 0.25 cm3/g(Mn)·s, and from x = 0.45 to x = 1 R2 decreases. Such a performance indicates that there is no linear dependence between activity and Mn content and that the origin of active sites changes depending on the composition. Similar dependencies for the catalysts were also found by other synthesis methods [50,72]. Figure S6 shows the evolution of CO conversion with time over the Mn0.45Ce0.55 catalyst.

4. Discussion

Next, we will discuss the results of catalyst characterization and catalytic tests with the purpose of identifying factors affecting the activity in CO oxidation reaction. When considering the surface area that determines active sites, one would expect that the activity will be governed by the surface area of the catalysts. Therefore, samples with the highest surface area should be the most active ones. However, although the MnxCe1−x catalyst with x = 0.1–0.45 possesses the highest surface area of ca. 100 m2/g (Table 1), its activity varies from 0.003 to 0.044 cm3/gs for R1 and from 0.10 to 0.25 cm3/g(Mn)s for R2. In the case of MnxCe1−x catalysts with x = 0.1–0.15, only the reflections of fluorite appear on the XRD patterns. TEM, DD, and TPR methods do not indicate a strong interaction between MnOx and CeO2 with the formation of a solid solution. The addition of Mn ions (x = 0.1–0.15) does not lead to a drop in the surface area despite a decrease in the ceria amount. This indicates that MnOx is in a highly dispersed amorphous state, but its activity is not high. With continuously increasing the Mn content, crystalline manganese oxides such as Mn2O3, Mn3O4, and Mn5O8 are formed and Mn ions incorporate into the structure of ceria. For x > 0.45, a decrease in the surface area is observed due to a growth in the content of crystalline Mn oxides. The R1 activity normalized per unit surface area increases from 4.4 10−4 to 5.7 10−4 cm3/m2s when x increases from 0.45 to 0.7, and then a decrease to 1.7 10−4 cm3/m2s is observed for x = 1.
As our MnxCe1−x samples are composed of different phases, we also tried to find a correlation between a certain phase and catalytic activity. According to XRD, Mn-Ce catalysts contain crystalline oxides such as Mn2O3, Mn5O8, and Mn3O4 and ceria (the Mn-Ce oxide solid solution). An increase in the content of Mn oxides results in a decrease in the catalytic activity (Figure 9, Table 1). Figure S7 shows the dependence of the ceria content estimated from XRD data on the manganese content (x). Up to x = 0.25, only ceria is observed; with an increase in the manganese content, its proportion gradually decreases. Simultaneously, the intensity of the surface content of Ce3+ decreases from 27% for x = 0–0.25 to 12–22% for x = 0.45–0.9. The generation of Ce3+ implies the creation of oxygen vacancy, based on the electroneutrality principle, which is thought to enhance the adsorption capacity of reactive oxygen species on the catalyst surface [12]. On the other hand, the incorporation of Mn2+ and Mn3+ also generates oxygen vacancies and could decrease the amount of Ce3+. The amount of oxygen vacancies depends on the degree of interaction between Mn and Ce oxides. Most authors [13,14,15,16,17,19,22,50,72] suppose that the formation of a solid solution is the key factor determining the activity of Mn-Ce catalysts. Our previous study [39] is in line with this; however, it was shown that, along with the formation of a solid solution, the transformations in manganese oxide nanoparticles could significantly improve the catalytic behavior. Herein, we did not observe such a tendency. According to the results of XPS, TEM, DD and the change in the structural characteristics of ceria, we speculate that a Ce1−yMnyO2 solid solution begins to form starting from x = 0.25. Thus, the most active catalyst from the series of catalysts with varying manganese content is characterized by a balance of the following characteristics: the high specific surface area, the formation of a solid solution, and the maximum content of the solid solution.

5. Conclusions

A series of the MnxCe1−x oxide catalysts with a varying x from 0 to 1 has been prepared by an oxalate route with further calcination at 400 °C in air. Their catalytic performance was tested in CO oxidation. The structure, microstructure, redox and surface properties were studied by X-ray diffraction, high-resolution transmission electron microscopy with energy dispersive X-ray analysis, temperature-programmed reduction, X-ray photoelectron spectroscopy and the differential dissolution technique. The nanocrystalline oxides with a fluorite structure and particle sizes of 4–6 nm were formed. The introduction of manganese led to a reduction of the particle size of ceria and the formation of a Mn-Ce oxide solid solution based on the fluorite structure. An increase in the manganese content resulted in the formation of crystalline manganese oxides such as Mn2O3, Mn3O4, and Mn5O8. The catalytic activity of the Mn-Ce oxides in CO oxidation as a function of manganese content has a volcano-like shape, with the origin of active sites depending on the composition. At a low manganese content, MnOx was in a highly dispersed amorphous state and provided the catalytic performance. The most active catalyst from the series of catalysts with varying manganese content is characterized by a balance of the following characteristics: the high specific surface area, the formation of a solid solution, and the maximum content of the solid solution. During a further increase in the manganese content, crystalline manganese oxides start to prevail, which leads to a drop in catalytic activity.

Supplementary Materials

The following are available online at https://www.mdpi.com/article/10.3390/nano11040988/s1, Figure S1: The dissolution curves of Mn and Ce normalized per the maximum dissolution rate (R/Rmax) depending on the degree of dissolution Mn and Ce cations for Mn0.5Ce0.5. Figure S2. The dissolution curves of Mn and Ce normalized per the maximum dissolution rate (R/Rmax) depending on time for Mn0.5Ce0.5. Figure S3. The dissolution curves for manganese and cerium depending on time, the Mn/Ce ratio of the Mn0.1Ce0.9 catalyst (a). The dissolution curves for Mn1, Ce1 and Mn0.03Ce1 phases (b). Figure S4. The dissolution curves for manganese and cerium depending on time, the Mn/Ce ratio of the Mn0.15Ce0.85 catalyst (a). The dissolution curves for Mn1 and Mn0.06Ce1 phases (b). Figure S5. XRD patterns of Mn0.45Ce0.55 catalyst during in situ reduction treatment under hydrogen. Shown below are the model patterns of manganese and cerium oxides. The wavelength of 0.17238 nm. Figure S6. The evolution of CO conversion with time over the Mn0.45Ce0.55 catalyst. Figure S7. The relation between physicochemical characteristics: the surface area (blue circles), the content of ceria based on XRD calculations in wt% (magenta squares), and the surface content of Ce3+/Ce3+ + Ce4+ in % based on XPS results (cyan triangles).

Author Contributions

Conceptualization, O.A.B.; Formal analysis, T.N.A., A.A.P., A.A.S., Z.S.V.; Investigation, O.A.B.; T.N.A., A.R.O., A.A.P., A.A.S., Z.S.V., E.Y.G.; Writing—original draft preparation, O.A.B.; Writing—review and editing, S.V.T.; Visualization, O.A.B. All authors have read and agreed to the published version of the manuscript.

Funding

This work was supported by the Russian Science Foundation, project 19-73-00097.

Acknowledgments

The studies were carried out using facilities of the shared research center “National center of investigation of catalysts” at Boreskov Institute of Catalysis. The synchrotron XRD experiments were performed at the shared research center SSTRC on the basis of the Novosibirsk VEPP-3 complex at BINP SB RAS using equipment supported by project RFMEFI62119X0022.

Conflicts of Interest

The authors declare no conflict of interest.

References

  1. Chen, M.S.; Cai, Y.; Yan, Z.; Gath, K.K.; Axnanda, S.; Goodman, D.W. Highly active surfaces for CO oxidation on Rh, Pd, and Pt. Surf. Sci. 2007, 601, 5326–5331. [Google Scholar] [CrossRef]
  2. Freund, H.-J.; Meijer, G.; Scheffler, M.; Schlögl, R.; Wolf, M. CO Oxidation as a Prototypical Reaction for Heterogeneous Processes. Angew. Chem. Int. Ed. 2011, 50, 10064–10094. [Google Scholar] [CrossRef]
  3. Xu, H.; Yan, N.; Qu, Z.; Liu, W.; Mei, J.; Huang, W.; Zhao, S. Gaseous Heterogeneous Catalytic Reactions over Mn-Based Oxides for Environmental Applications: A Critical Review. Environ. Sci. Technol. 2017, 51, 8879–8892. [Google Scholar] [CrossRef] [PubMed]
  4. Yashnik, S.A.; Ushakov, V.V.; Leonov, N.L.; Ismagilov, Z.R. High-performance Mn-Al-O catalyst on reticulated foam materials for environmentally friendly catalytic combustion. Eurasian Chem. Technol. J. 2015, 17, 145–158. [Google Scholar] [CrossRef] [Green Version]
  5. Chen, J.; Fu, P.; Lv, D.; Chen, Y.; Fan, M.; Wu, J.; Meshram, A.; Mu, B.; Li, X.; Xia, Q. Unusual positive effect of SO2 on Mn-Ce mixed-oxide catalyst for the SCR reaction of NOx with NH3. Chem. Eng. J. 2021, 407, 127071. [Google Scholar] [CrossRef]
  6. Montini, T.; Melchionna, M.; Monai, M.; Fornasiero, P. Fundamentals and Catalytic Applications of CeO2-Based Materials. Chem. Rev. 2016, 116, 5987–6041. [Google Scholar] [CrossRef] [PubMed]
  7. Summers, J.C.; Ausen, S.A. Interaction of cerium oxide with noble metals. J. Catal. 1979, 58, 131–143. [Google Scholar] [CrossRef]
  8. Kašpar, J.; Fornasiero, P.; Graziani, M. Use of CeO2-based oxides in the three-way catalysis. Catal. Today 1999, 50, 285–298. [Google Scholar] [CrossRef]
  9. Gao, F.; Tang, X.; Yi, H.; Zhao, S.; Li, C.; Li, J.; Shi, Y.; Meng, X. A Review on Selective Catalytic Reduction of NOx by NH3 over Mn–Based Catalysts at Low Temperatures: Catalysts, Mechanisms, Kinetics and DFT Calculations. Catalysts 2017, 7, 199. [Google Scholar] [CrossRef]
  10. Colman-Lerner, E.; Peluso, M.A.; Sambeth, J.; Thomas, H. Cerium, manganese and cerium/manganese ceramic monolithic catalysts. Study of VOCs and PM removal. J. Rare Earths 2016, 34, 675–682. [Google Scholar] [CrossRef]
  11. Delimaris, D.; Ioannides, T. VOC oxidation over MnOx–CeO2 catalysts prepared by a combustion method. Appl. Catal. B Environ. 2008, 84, 303–312. [Google Scholar] [CrossRef]
  12. Du, J.; Qu, Z.; Dong, C.; Song, L.; Qin, Y.; Huang, N. Low-temperature abatement of toluene over Mn-Ce oxides catalysts synthesized by a modified hydrothermal approach. Appl. Surf. Sci. 2018, 433, 1025–1035. [Google Scholar] [CrossRef]
  13. Chen, J.; Chen, X.; Chen, X.; Xu, W.; Xu, Z.; Jia, H.; Chen, J. Homogeneous introduction of CeOy into MnOx-based catalyst for oxidation of aromatic VOCs. Appl. Catal. B Environ. 2018, 224, 825–835. [Google Scholar] [CrossRef]
  14. Hu, F.; Chen, J.; Zhao, S.; Li, K.; Si, W.; Song, H.; Li, J. Toluene catalytic combustion over copper modified Mn0.5Ce0.5Ox solid solution sponge-like structures. Appl. Catal. A Gen. 2017, 540, 57–67. [Google Scholar] [CrossRef]
  15. Arena, F.; Di Chio, R.; Fazio, B.; Espro, C.; Spiccia, L.; Palella, A.; Spadaro, L. Probing the functionality of nanostructured MnCeOx catalysts in the carbon monoxide oxidation: Part I. Influence of cerium addition on structure and CO oxidation activity. Appl. Catal. B Environ. 2017, 210, 14–22. [Google Scholar] [CrossRef]
  16. Zhang, P.; Lu, H.; Zhou, Y.; Zhang, L.; Wu, Z.; Yang, S.; Shi, H.; Zhu, Q.; Chen, Y.; Dai, S. Mesoporous MnCeOx solid solutions for low temperature and selective oxidation of hydrocarbons. Nat. Commun. 2015, 6. [Google Scholar] [CrossRef]
  17. Venkataswamy, P.; Rao, K.N.; Jampaiah, D.; Reddy, B.M. Nanostructured manganese doped ceria solid solutions for CO oxidation at lower temperatures. Appl. Catal. B Environ. 2015, 162, 122–132. [Google Scholar] [CrossRef]
  18. Yu, D.; Liu, Y.; Wu, Z. Low-temperature catalytic oxidation of toluene over mesoporous MnOx–CeO2/TiO2 prepared by sol–gel method. Catal. Commun. 2010, 11, 788–791. [Google Scholar] [CrossRef]
  19. Liu, X.; Lu, J.; Qian, K.; Huang, W.; Luo, M. A comparative study of formaldehyde and carbon monoxide complete oxidation on MnOx-CeO2 catalysts. J. Rare Earths 2009, 27, 418–424. [Google Scholar] [CrossRef]
  20. Geng, L.; Chen, B.; Yang, J.; Shui, C.; Ye, S.; Fu, J.; Zhang, N.; Xie, J.; Chen, B. Synergistic effect between Mn and Ce for active and stable catalytic wet air oxidation of phenol over MnCeOx. Appl. Catal. A Gen. 2020, 604, 117774. [Google Scholar] [CrossRef]
  21. Geng, Y.; Shan, W.; Liu, F.; Yang, S. Adjustment of operation temperature window of Mn-Ce oxide catalyst for the selective catalytic reduction of NOx with NH3. J. Hazard. Mater. 2021, 405, 124223. [Google Scholar] [CrossRef]
  22. Narayana, B.L.; Mukri, B.D.; Ghosal, P.; Subrahmanyam, C. Mn Ion substituted CeO2 Nano spheres for Low Temperature CO Oxidation: The Promoting Effect of Mn Ions. ChemistrySelect 2016, 1, 3150–3158. [Google Scholar] [CrossRef]
  23. Delimaris, D.; Ioannides, T. Intrinsic Activity of MnOx-CeO2 Catalysts in Ethanol Oxidation. Catalysts 2017, 7, 339. [Google Scholar] [CrossRef] [Green Version]
  24. Zhang, Q.; Jiang, Y.; Gao, J.; Fu, M.; Zou, S.; Li, Y.; Ye, D. Interfaces in MOF-Derived CeO2–MnOX Composites as High-Activity Catalysts for Toluene Oxidation: Monolayer Dispersion Threshold. Catalysts 2020, 10, 681. [Google Scholar] [CrossRef]
  25. Zhang, X.; Zhao, J.; Song, Z.; Liu, W.; Zhao, H.; Zhao, M.; Xing, Y.; Ma, Z.A.; Du, H. The catalytic oxidation performance of toluene over the Ce-Mn-Ox catalysts: Effect of synthetic routes. J. Colloid Interface Sci. 2020, 562, 170–181. [Google Scholar] [CrossRef]
  26. Pankin, I.A.; Kravtsova, A.N.; Polozhentsev, O.E.; Budnyk, A.P.; Tsaturyan, A.A.; Bugaev, A.L.; Trigub, A.L.; Soldatov, A.V. X-ray spectroscopic diagnostics of the structure of quantum dots based on zinc and manganese sulfides and oxides. J. Struct. Chem. 2017, 58, 1633–1640. [Google Scholar] [CrossRef]
  27. Ni, S.; Tang, X.; Yi, H.; Gao, F.; Wang, C.; Shi, Y.; Zhang, R.; Zhu, W. Novel Mn-Ce bi-oxides loaded on 3D monolithic nickel foam for low-temperature NH3-SCR de-NOx: Preparation optimization and reaction mechanism. J. Rare Earths 2020. [Google Scholar] [CrossRef]
  28. Tang, X.; Li, Y.; Huang, X.; Xu, Y.; Zhu, H.; Wang, J.; Shen, W. MnOx-CeO2 mixed oxide catalysts for complete oxidation of formaldehyde: Effect of preparation method and calcination temperature. Appl. Catal. B Environ. 2006, 62, 265–273. [Google Scholar] [CrossRef]
  29. Picasso, G.; Gutiérrez, M.; Pina, M.P.; Herguido, J. Preparation and characterization of Ce-Zr and Ce-Mn based oxides for n-hexane combustion: Application to catalytic membrane reactors. Chem. Eng. J. 2007, 126, 119–130. [Google Scholar] [CrossRef]
  30. Lin, J.; Guo, Y.; Chen, X.; Li, C.; Lu, S.; Liew, K.M. CO Oxidation over Nanostructured Ceria Supported Bimetallic Cu–Mn Oxides Catalysts: Effect of Cu/Mn Ratio and Calcination Temperature. Catal. Lett. 2018, 148, 181–193. [Google Scholar] [CrossRef]
  31. Qi, G.; Yang, R.T. Characterization and FTIR Studies of MnOx−CeO2 Catalyst for Low-Temperature Selective Catalytic Reduction of NO with NH3. J. Phys. Chem. B 2004, 108, 15738–15747. [Google Scholar] [CrossRef]
  32. Gao, X.; Dollimore, D. The thermal decomposition of oxalates. Part 26. A kinetic study of the thermal decomposition of manganese(II) oxalate dihydrate. Thermochim. Acta 1993, 215, 47–63. [Google Scholar] [CrossRef]
  33. Liu, S.; Sun, B.; Zhang, Y.; Li, J.; Resasco, D.E.; Nie, L.; Wang, L. The role of intermediate CoxMn1−xO (x = 0.6–0.85) nanocrystals in the formation of active species for the direct production of lower olefins from syngas. Chem. Commun. 2019, 55, 6595–6598. [Google Scholar] [CrossRef] [PubMed]
  34. Zhong, L.; Yu, F.; An, Y.; Zhao, Y.; Sun, Y.; Li, Z.; Lin, T.; Lin, Y.; Qi, X.; Dai, Y.; et al. Cobalt carbide nanoprisms for direct production of lower olefins from syngas. Nature 2016, 538, 84–87. [Google Scholar] [CrossRef]
  35. Dinse, A.; Aigner, M.; Ulbrich, M.; Johnson, G.R.; Bell, A.T. Effects of Mn promotion on the activity and selectivity of Co/SiO2 for Fischer–Tropsch Synthesis. J. Catal. 2012, 288, 104–114. [Google Scholar] [CrossRef]
  36. Paterson, J.; Peacock, M.; Purves, R.; Partington, R.; Sullivan, K.; Sunley, G.; Wilson, J. Manipulation of Fischer-Tropsch Synthesis for Production of Higher Alcohols Using Manganese Promoters. ChemCatChem 2018, 10, 5154–5163. [Google Scholar] [CrossRef]
  37. Paterson, J.; Partington, R.; Peacock, M.; Sullivan, K.; Wilson, J.; Xu, Z. Elucidating the Role of Bifunctional Cobalt-Manganese Catalyst Interactions for Higher Alcohol Synthesis. Eur. J. Inorg. Chem. 2020, 2020, 2312–2324. [Google Scholar] [CrossRef]
  38. Li, W.; Liu, H.; Ma, X.; Mo, S.; Li, S.; Chen, Y. Fabrication of silica supported Mn-Ce benzene oxidation catalyst by a simple and environment-friendly oxalate approach. J. Porous Mater. 2018, 25, 107–117. [Google Scholar] [CrossRef]
  39. Bulavchenko, O.A.; Afonasenko, T.N.; Osipov, A.R.; Pochtar, A.A.; Saraev, A.A.; Gerasimov, E.Y. The Formation of Mn-Ce Oxide Catalysts for CO Oxidation by Oxalate Route: The Role of Annealing Conditions. Catal. Lett. 2021. [Google Scholar] [CrossRef]
  40. Malakhov, V.V.; Vasilyeva, I.G. Stoichiography and chemical methods of phase analysis of multielement multiphase substances and materials. Russian Chem. Rev. 2008, 77, 351–372. [Google Scholar] [CrossRef]
  41. CasaXPS: Processing Software for XPS, AES, SIMS and More. Available online: http://www.casaxps.com/ (accessed on 8 January 2020).
  42. Shirley, D.A. High-resolution X-ray photoemission spectrum of the valence bands of gold. Phys. Rev. B 1972, 5, 4709–4714. [Google Scholar] [CrossRef] [Green Version]
  43. Scofield, J.H. Hartree-Slater subshell photoionization cross-sections at 1254 and 1487 eV. J. Electron Spectrosc. Relat. Phenom. 1976, 8, 129–137. [Google Scholar] [CrossRef]
  44. Stobbe, E.R.; De Boer, B.A.; Geus, J.W. The reduction and oxidation behaviour of manganese oxides. Catal. Today 1999, 47, 161–167. [Google Scholar] [CrossRef]
  45. Bulavchenko, O.A.; Gerasimov, E.Y.; Afonasenko, T.N. Reduction of double manganese-cobalt oxides: In situ XRD and TPR study. Dalton Trans. 2018, 47, 17153–17159. [Google Scholar] [CrossRef] [PubMed]
  46. Christel, L.; Pierre, A.; Abel, D.A.M.R. Temperature programmed reduction studies of nickel manganite spinels. Thermochim. Acta 1997, 306, 51–59. [Google Scholar] [CrossRef]
  47. Tang, W.; Wu, X.; Li, D.; Wang, Z.; Liu, G.; Liu, H.; Chen, Y. Oxalate route for promoting activity of manganese oxide catalysts in total VOCs’ oxidation: Effect of calcination temperature and preparation method. J. Mater. Chem. A 2014, 2, 2544–2554. [Google Scholar] [CrossRef]
  48. Mock, S.A.; Sharp, S.E.; Stoner, T.R.; Radetic, M.J.; Zell, E.T.; Wang, R. CeO2 nanorods-supported transition metal catalysts for CO oxidation. J. Colloid Interface Sci. 2016, 466, 261–267. [Google Scholar] [CrossRef] [PubMed] [Green Version]
  49. Trovarelli, A. Catalytic properties of ceria and CeO2-Containing materials. Catal. Rev. Sci. Eng. 1996, 38, 439–520. [Google Scholar] [CrossRef]
  50. Zhang, X.-M.; Deng, Y.-Q.; Tian, P.; Shang, H.-H.; Xu, J.; Han, Y.-F. Dynamic active sites over binary oxide catalysts: In situ/operando spectroscopic study of low-temperature CO oxidation over MnOx-CeO2 catalysts. Appl. Catal. B Environ. 2016, 191, 179–191. [Google Scholar] [CrossRef] [Green Version]
  51. Bekheet, M.F.; Grünbacher, M.; Schlicker, L.; Gili, A.; Doran, A.; Epping, J.D.; Gurlo, A.; Klötzer, B.; Penner, S. On the structural stability of crystalline ceria phases in undoped and acceptor-doped ceria materials under in situ reduction conditions. CrystEngComm 2019, 21, 145–154. [Google Scholar] [CrossRef] [PubMed] [Green Version]
  52. Kwon, O.-S.; Kim, M.-S.; Kim, K.-B. A study on the effect of lithium insertion–extraction on the local structure of lithium manganese oxides using X-ray absorption spectroscopy. J. Power Sources 1999, 81–82, 510–516. [Google Scholar] [CrossRef]
  53. Lima, F.H.B.; Calegaro, M.L.; Ticianelli, E.A. Investigations of the catalytic properties of manganese oxides for the oxygen reduction reaction in alkaline media. J. Electroanal. Chem. 2006, 590, 152–160. [Google Scholar] [CrossRef]
  54. Ressler, T.; Wong, J.; Roos, J.; Smith, I.L. Quantitative Speciation of Mn-Bearing Particulates Emitted from Autos Burning (Methylcyclopentadienyl)manganese Tricarbonyl-Added Gasolines Using XANES Spectroscopy. Environ. Sci. Technol. 2000, 34, 950–958. [Google Scholar] [CrossRef] [Green Version]
  55. Li, C.; Han, X.; Cheng, F.; Hu, Y.; Chen, C.; Chen, J. Phase and composition controllable synthesis of cobalt manganese spinel nanoparticles towards efficient oxygen electrocatalysis. Nat. Commun. 2015, 6, 7345. [Google Scholar] [CrossRef] [PubMed] [Green Version]
  56. Borchert, H.; Frolova, Y.V.; Kaichev, V.V.; Prosvirin, I.P.; Alikina, G.M.; Lukashevich, A.I.; Zaikovskii, V.I.; Moroz, E.M.; Trukhan, S.N.; Ivanov, V.P.; et al. Electronic and chemical properties of nanostructured cerium dioxide doped with praseodymium. J. Phys. Chem. B 2005, 109, 5728–5738. [Google Scholar] [CrossRef]
  57. Christoua, S.Y.; Álvarez-Galvánb, M.C.; Fierrob, J.L.G.; Efstathioua, A.M. Suppression of the oxygen storage and release kinetics in Ce0. 5Zr0. 5O2 induced by P, Ca and Zn chemical poisoning. Appl. Catal. B 2011, 106, 103–113. [Google Scholar]
  58. Regan, E.; Groutso, T.; Metson, J.B.; Steiner, R.; Ammundsen, B.; Hassell, D.; Pickering, P. Surface and bulk composition of lithium manganese oxides. Surf. Interface Anal. 1999, 27, 1064–1068. [Google Scholar]
  59. Oku, M.; Hirokawa, K.; Ikeda, S. X-ray photoelectron spectroscopy of manganese—oxygen systems. J. Electron Spectrosc. Relat. Phenom. 1975, 7, 465–473. [Google Scholar] [CrossRef]
  60. Castro, V.D.; Polzonetti, G. XPS study of MnO oxidation. J. Electron Spectrosc. Relat. Phenom. 1989, 48, 117–123. [Google Scholar] [CrossRef]
  61. Bondi, J.F.; Oyler, K.D.; Ke, X.; Schiffer, P.; Schaak, R.E. Chemical Synthesis of Air-Stable Manganese Nanoparticles. J. Am. Chem. Soc. 2008, 131, 9144–9145.0445. [Google Scholar] [CrossRef]
  62. Han, Y.-F.; Chen, F.; Zhong, Z.; Ramesh, K.; Chen, L.; Widjaja, E. Controlled Synthesis, Characterization, and Catalytic Properties of Mn2O3 and Mn3O4 Nanoparticles Supported on Mesoporous Silica SBA-15. J. Phys. Chem. B 2006, 110, 24450–24456. [Google Scholar] [CrossRef]
  63. Han, Y.-F.; Chen, L.; Ramesh, K.; Zhong, Z.; Chen, F.; Chin, J.; Mook, H. Coral-like nanostructured a-Mn2O3 nanaocrystals for catalytic combustion of methane Part I. Preparation and characterization. Catal. Today 2008, 131, 35–41. [Google Scholar] [CrossRef]
  64. Yang, X.; Wang, X.; Zhang, G.; Zheng, J.; Wang, T.; Liu, X.; Shu, C.; Jiang, L.; Wang, C. Enhanced electrocatalytic performance for methanol oxidation of Pt nanoparticles on Mn3O4-modified multi-walled carbon nanotubes. Int. J. Hydrogen Energy 2012, 37, 11167–11175. [Google Scholar] [CrossRef]
  65. Ramesh, K.; Chen, L.; Chen, F.; Liu, Y.; Wang, Z.; Han, Y.-F. Re-investigating the CO oxidation mechanism over unsupported MnO, Mn2O3 and MnO2 catalysts. Catal. Today 2008, 131, 477–482. [Google Scholar] [CrossRef]
  66. Liu, Y.; Li, J.; Li, W.; Li, Y.; Chen, Q.; Zhan, F. Nitrogen-doped graphene aerogel-supported spinel CoMn2O4 nanoparticles as an efficient catalyst for oxygen reduction reaction. J. Power Sources 2015, 299, 492–500. [Google Scholar] [CrossRef]
  67. Kong, W.; Gao, B.; Jiang, C.; Chang, A. Influence of the oxygen pressure on the preferred orientation and optical properties of the pulsed-laser deposited Mn1.56Co0.96Ni0.48O4±δ thin films. J. Alloys Compd. 2015, 650, 305–310. [Google Scholar] [CrossRef]
  68. Zhang, L.; Tang, Z.; Wang, S.; Ding, D.; Chen, M.; Wan, H. Growth and vibrational properties of MnOx thin films on Rh(111). Surf. Sci. 2012, 606, 1507–1511. [Google Scholar] [CrossRef]
  69. Jadhav, P.R.; Suryawanshi, M.P.; Dalavi, D.S.; Patil, D.S.; Jo, E.A.; Kolekar, S.S.; Wali, A.A.; Karanjkar, M.M.; Kim, J.-H.; Patil, P.S. Design and electro-synthesis of 3-D nanofibers of MnO2 thin films and their application in high performance supercapacitor. Electrochim. Acta 2015, 176, 523–532. [Google Scholar] [CrossRef]
  70. Kostowskyj, M.A.; Kirk, D.W.; Thorpe, S.J. Ag and Ag–Mn nanowire catalysts for alkaline fuel cells. Int. J. Hydrogen Energy 2010, 35, 5666–5672. [Google Scholar] [CrossRef]
  71. Hishida, T.; Ohbayashi, K.; Saitoh, T. Hidden relationship between the electrical conductivity and the Mn 2p core-level photoemission spectra in La1−xSrxMnO3. J. Appl. Phys. 2013, 113, 043710. [Google Scholar] [CrossRef] [Green Version]
  72. Zou, Z.-Q.; Meng, M.; Zha, Y.-Q. Surfactant-Assisted Synthesis, Characterizations, and Catalytic Oxidation Mechanisms of the Mesoporous MnOx−CeO2 and Pd/MnOx−CeO2 Catalysts Used for CO and C3H8 Oxidation. J. Phys. Chem. C 2010, 114, 468–477. [Google Scholar] [CrossRef]
Figure 1. XRD patterns of MnxCe1−x (x = 0–1). The bar chart indicates the positions of CeO2 reflections, V–Mn5O8, o–Mn2O3, + –Mn3O4.
Nanomaterials 11 00988 g001
Figure 2. The lattice parameter and crystallite size and its dependence on the Mn content (x) in MnxCe1−x.
Nanomaterials 11 00988 g002
Figure 3. TEM images of Mn0.15Ce0.85 (ac,e) and EDX spectra of Ce-rich (d) and Mn-rich (f) regions.
Nanomaterials 11 00988 g003
Figure 4. TEM images of Mn0.45Ce0.55 (ac,e), EDX spectra of Ce-rich (f) and Mn-rich (e) regions, EDS mapping (g,h).
Nanomaterials 11 00988 g004
Figure 5. The dissolution curves for manganese and cerium, depending on time, the Mn/Ce ratio of the Mn0.45Ce0.55 catalyst (a). The dissolution curves for Mn1 and Mn0.24Ce1 phases (b).
Nanomaterials 11 00988 g005
Figure 6. TPR-H2 profiles of MnxCe1−x catalysts.
Nanomaterials 11 00988 g006
Figure 7. Changes in the fluorite cell parameter (a) and phase composition (b) during in situ reduction treatment under hydrogen for Mn0.45Ce0.55 catalyst. The cell parameter a (blue diamond) for the as-prepared Mn0Ce1 catalyst and its changes with temperature (blue dash line) considering TEC (α = 11.3 10−6 K−1 [41] is shown for comparison purposes).
Nanomaterials 11 00988 g007
Figure 8. Ce3d (a) and Mn2p (b) core-level spectra of the catalysts under study. The spectra are normalized to the total intensity of the corresponding Ce3d and Mn2p core-level spectra.
Nanomaterials 11 00988 g008
Figure 9. CO oxidation conversion (a) and CO oxidation rate at 150 °C normalized per gram (R1, blue dots) and Mn content (R2, red dots) (b) for MnxCe1−x catalysts.
Nanomaterials 11 00988 g009
Table 1. Structural and microstructural characteristics of the MnxCe1−x catalysts.
CatalystPhase Composition, wt.% Crystallite Size, nmLattice Parameter of Ceria, ÅBET Area, m2/g
Mn0Ce1100% CeO26.0(1)5.412(1)110
Mn0.1Ce0.9100% CeO25.9(2)5.411(1)99
Mn0.15Ce0.85100% CeO25.5(2)5.411(1)99
Mn0.25Ce0.7596% CeO25.5(2)5.412(1)100
4% Mn3O425(3)
Mn0.45Ce0.5583% CeO23.5(1)5.402(2)102
2% Mn2O3-
7% Mn3O425(4)
8% Mn5O810(1)
Mn0.6Ce0.472% CeO24.0(3)5.402(1)60
4% Mn2O322(2)
17% Mn3O425(2)
7% Mn5O813(1)
Mn0.7Ce0.862% CeO24.1(5)5.406(1)42
8% Mn2O320(1)
12% Mn3O425(1)
18% Mn5O814(1)
Mn0.8Ce0.945% CeO25.2(2)-31
14% Mn2O320(1)
16% Mn3O425(1)
25% Mn5O813(1)
Mn0.9Ce0.145% CeO25.2(2)-45
14% Mn2O320(1)
16% Mn3O425(1)
25% Mn5O813(1)
Mn1Ce028% Mn2O317(1)-32
34% Mn3O425(1)
38% Mn5O813(1)
Table 2. Relative atomic concentrations of Mn and Ce cations in the near-surface layer of the studied catalysts.
CatalystMn2p3/2[Mn]/[Mn + Ce][Ce3+]/[Ce3++Ce4+], %
Mn2+
639.9 eV
Mn3+
640.7 eV
Mn4+
641.4 eV
Mn0.1Ce0.92818540.0827
Mn0.15Ce0.852815570.1428
Mn0.25Ce0.752616580.1927
Mn0.45Ce0.551827550.4121
Mn0.6Ce0.41627570.4622
Mn0.7Ce0.81122670.5912
Mn0.8Ce0.91916650.6119
Mn0.9Ce0.11839430.9417
Mn1Ce01343441.00
Publisher’s Note: MDPI stays neutral with regard to jurisdictional claims in published maps and institutional affiliations.

