Impact of Formate Supplementation on Body Weight and Plasma Amino Acids

 , , and
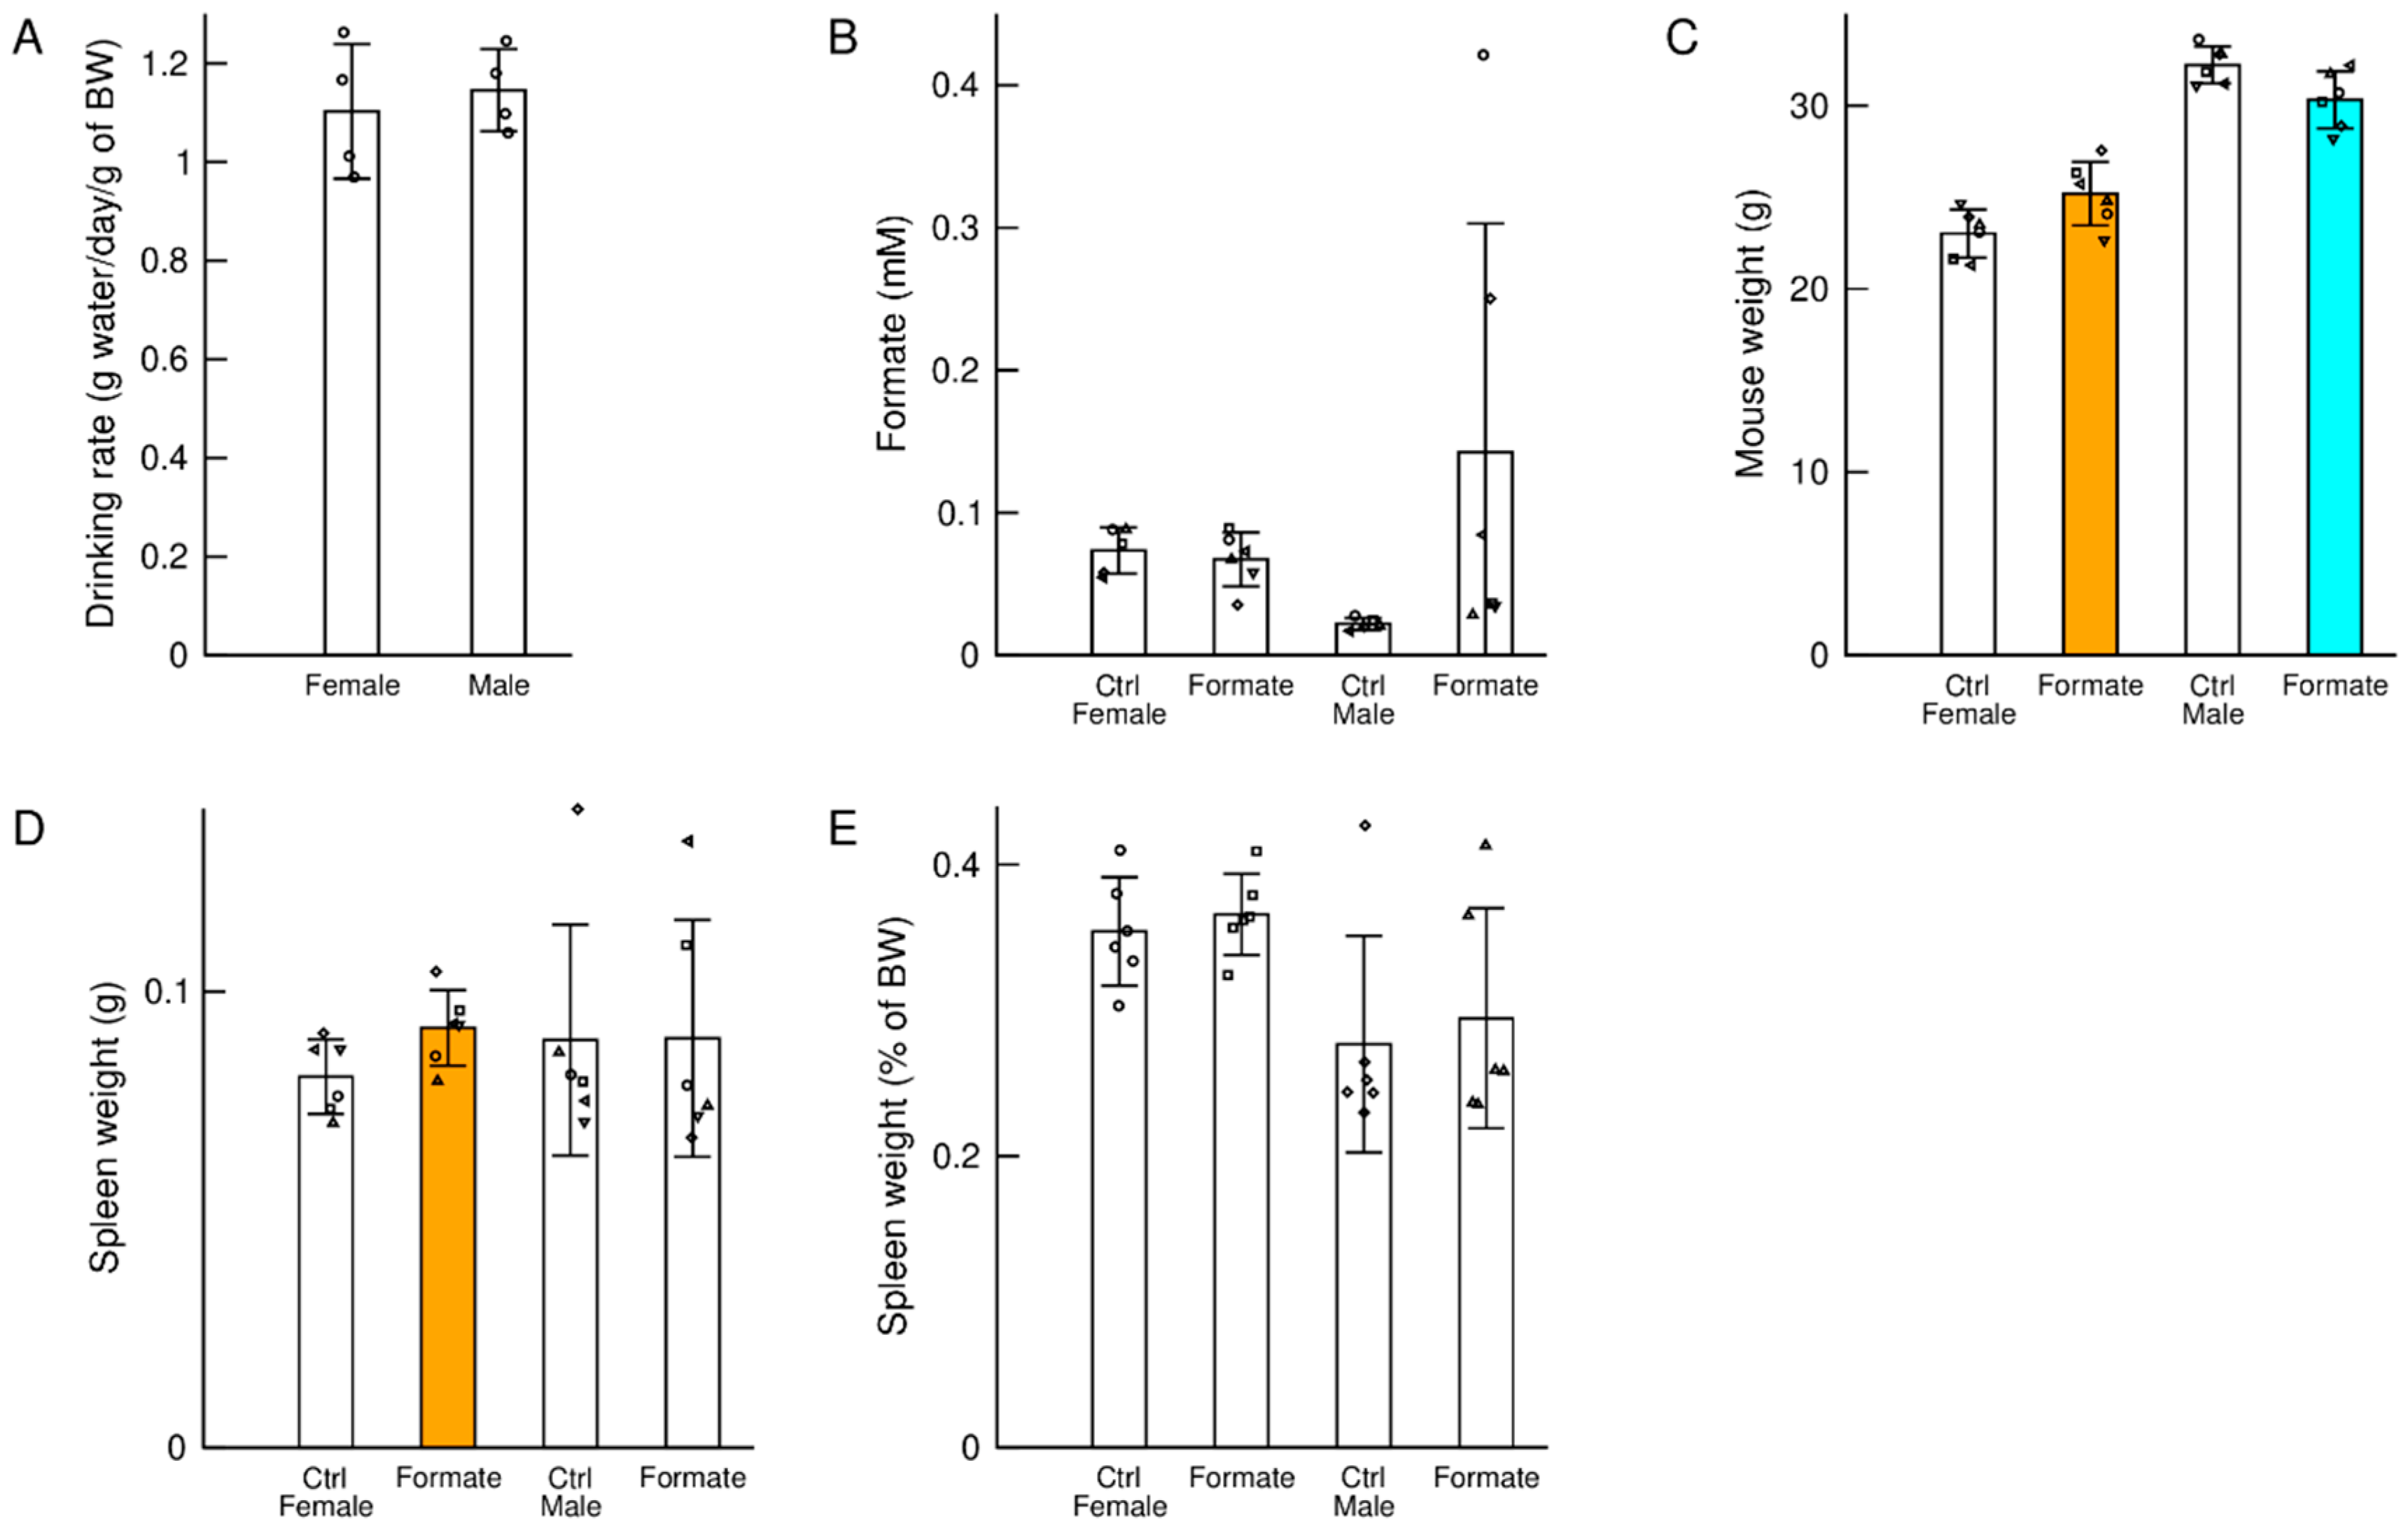
Abstract
:1. Introduction
2. Experimental Methods
2.1. Ethical Statement
2.2. Study Design
2.3. Experimental Procedures
2.4. Experimental Animals
2.5. Housing and Husbandry
2.6. Sample Size
2.7. Allocating Animals to Experimental Groups
2.8. Experimental Outcomes
2.9. Statistical Methods
3. Results
3.1. Drinking Rate
3.2. Plasma Formate
3.3. Body Weight
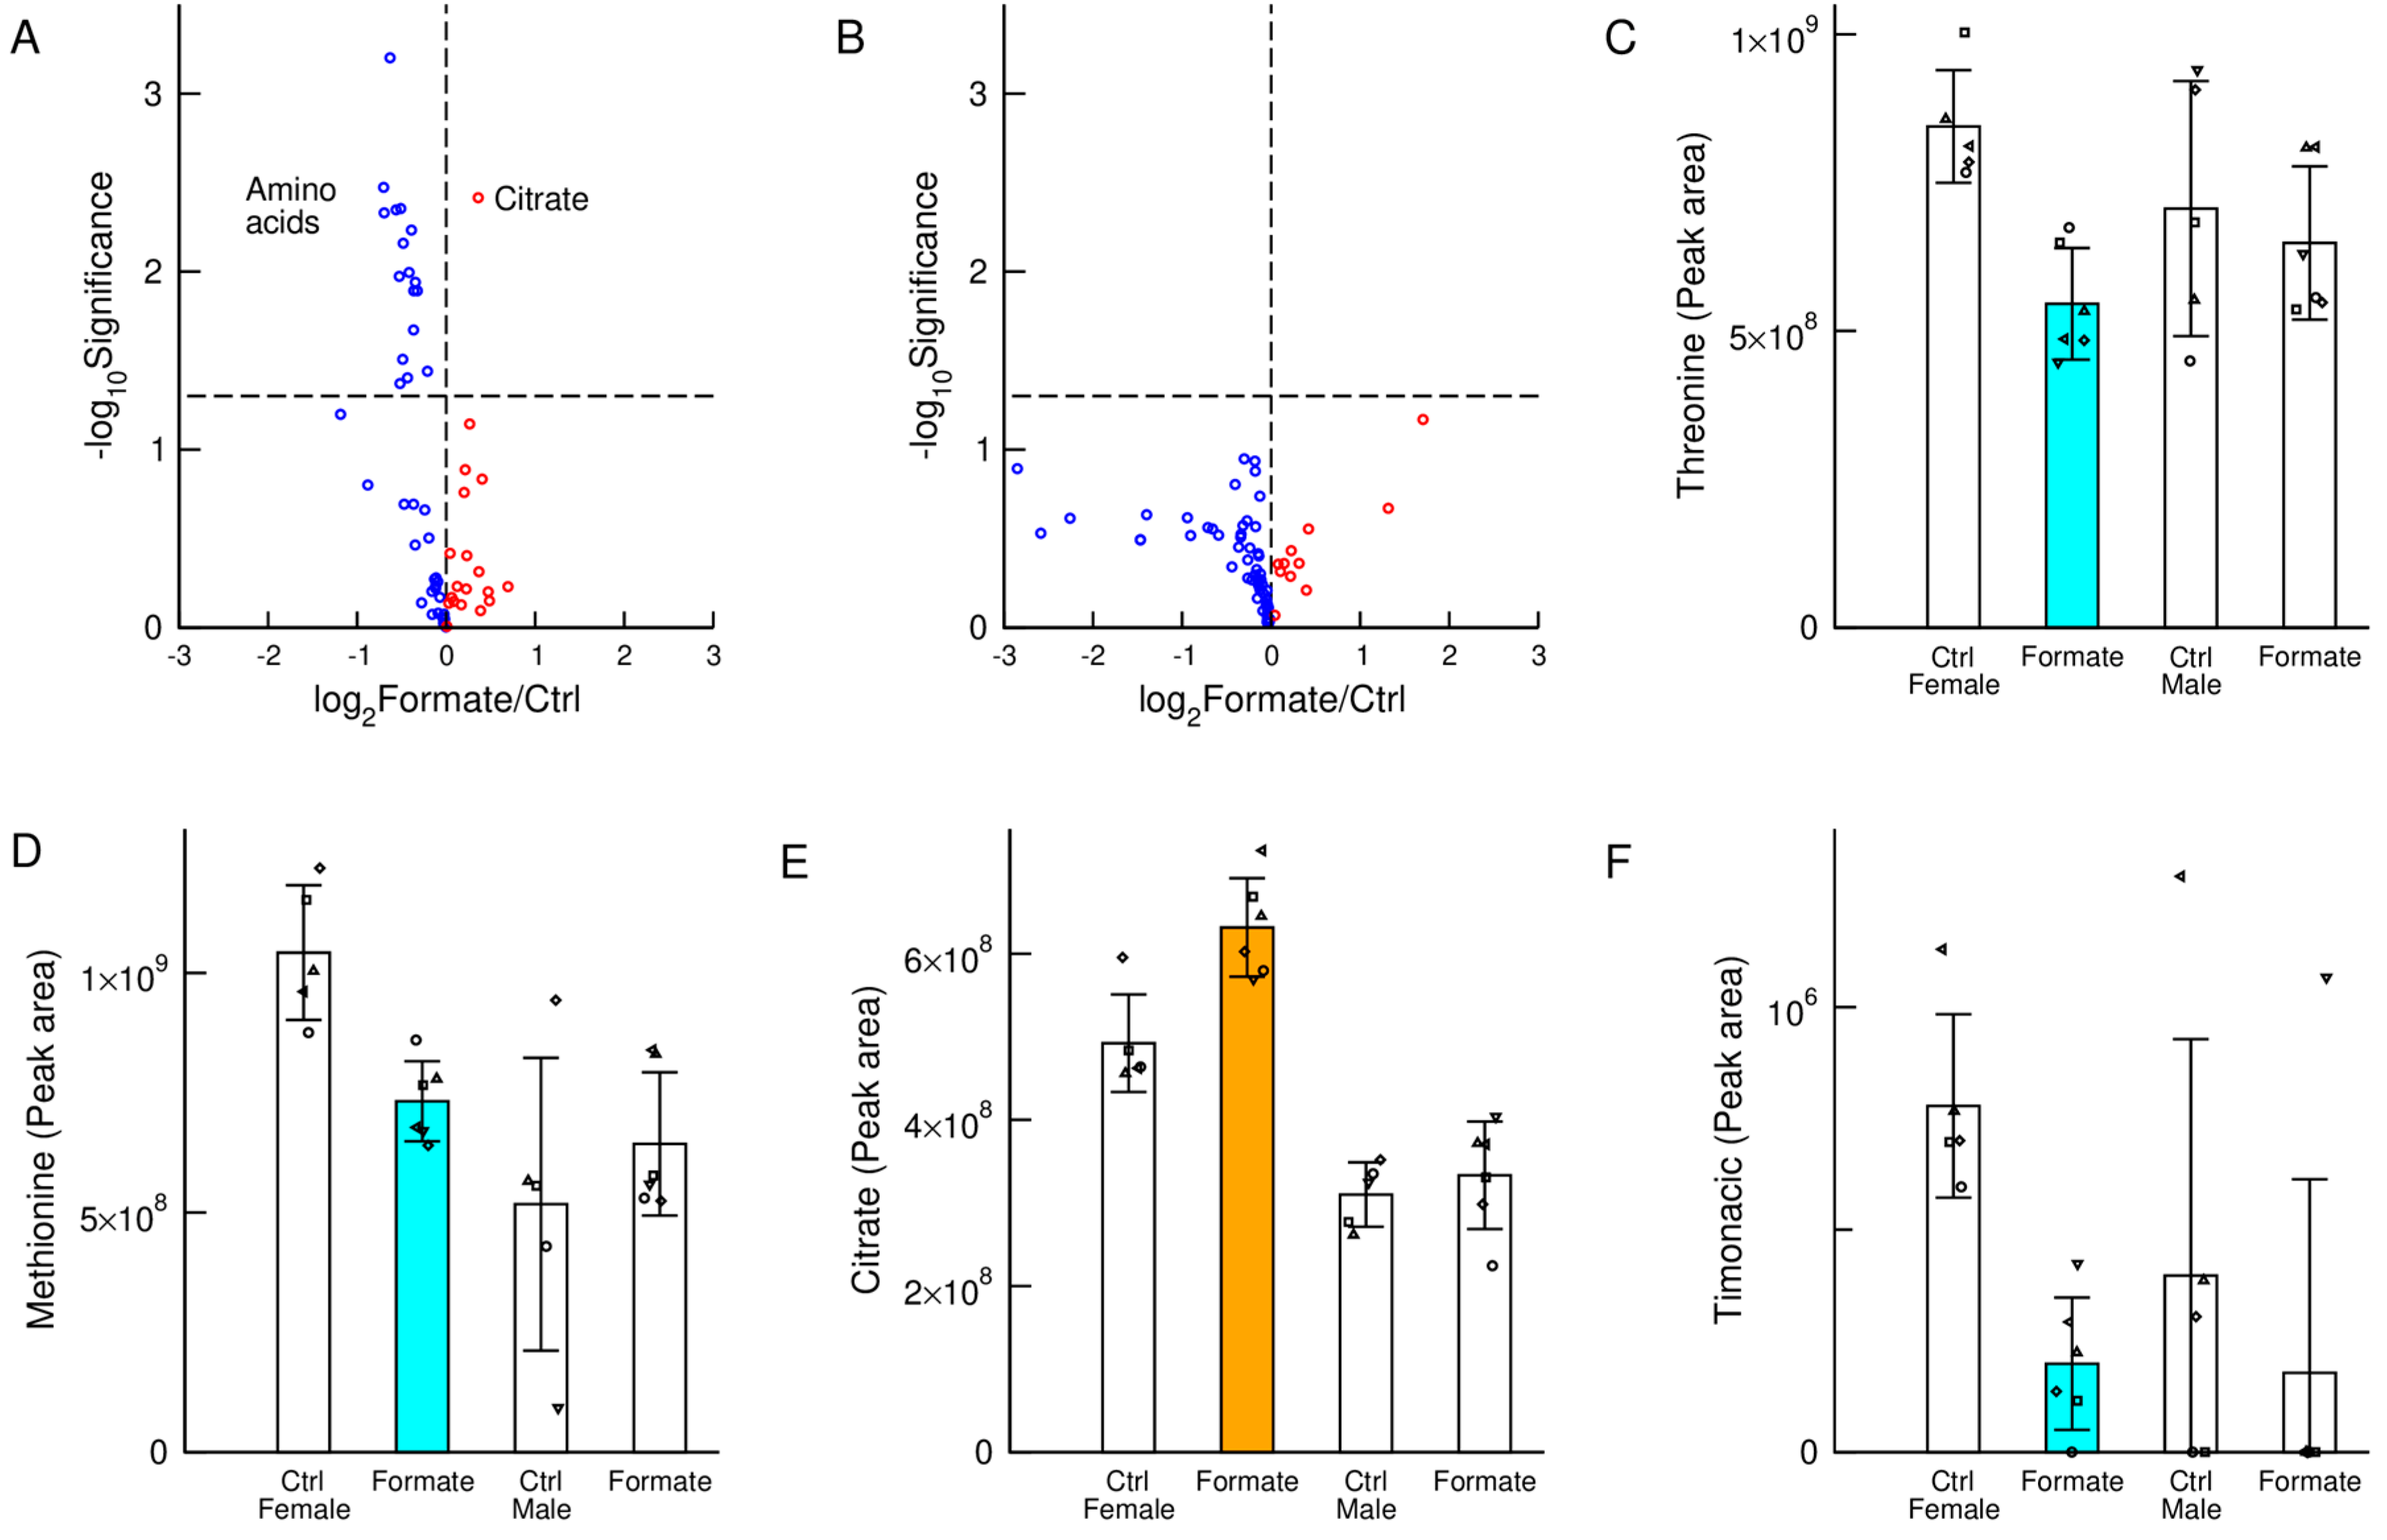
3.4. Plasma Metabolites
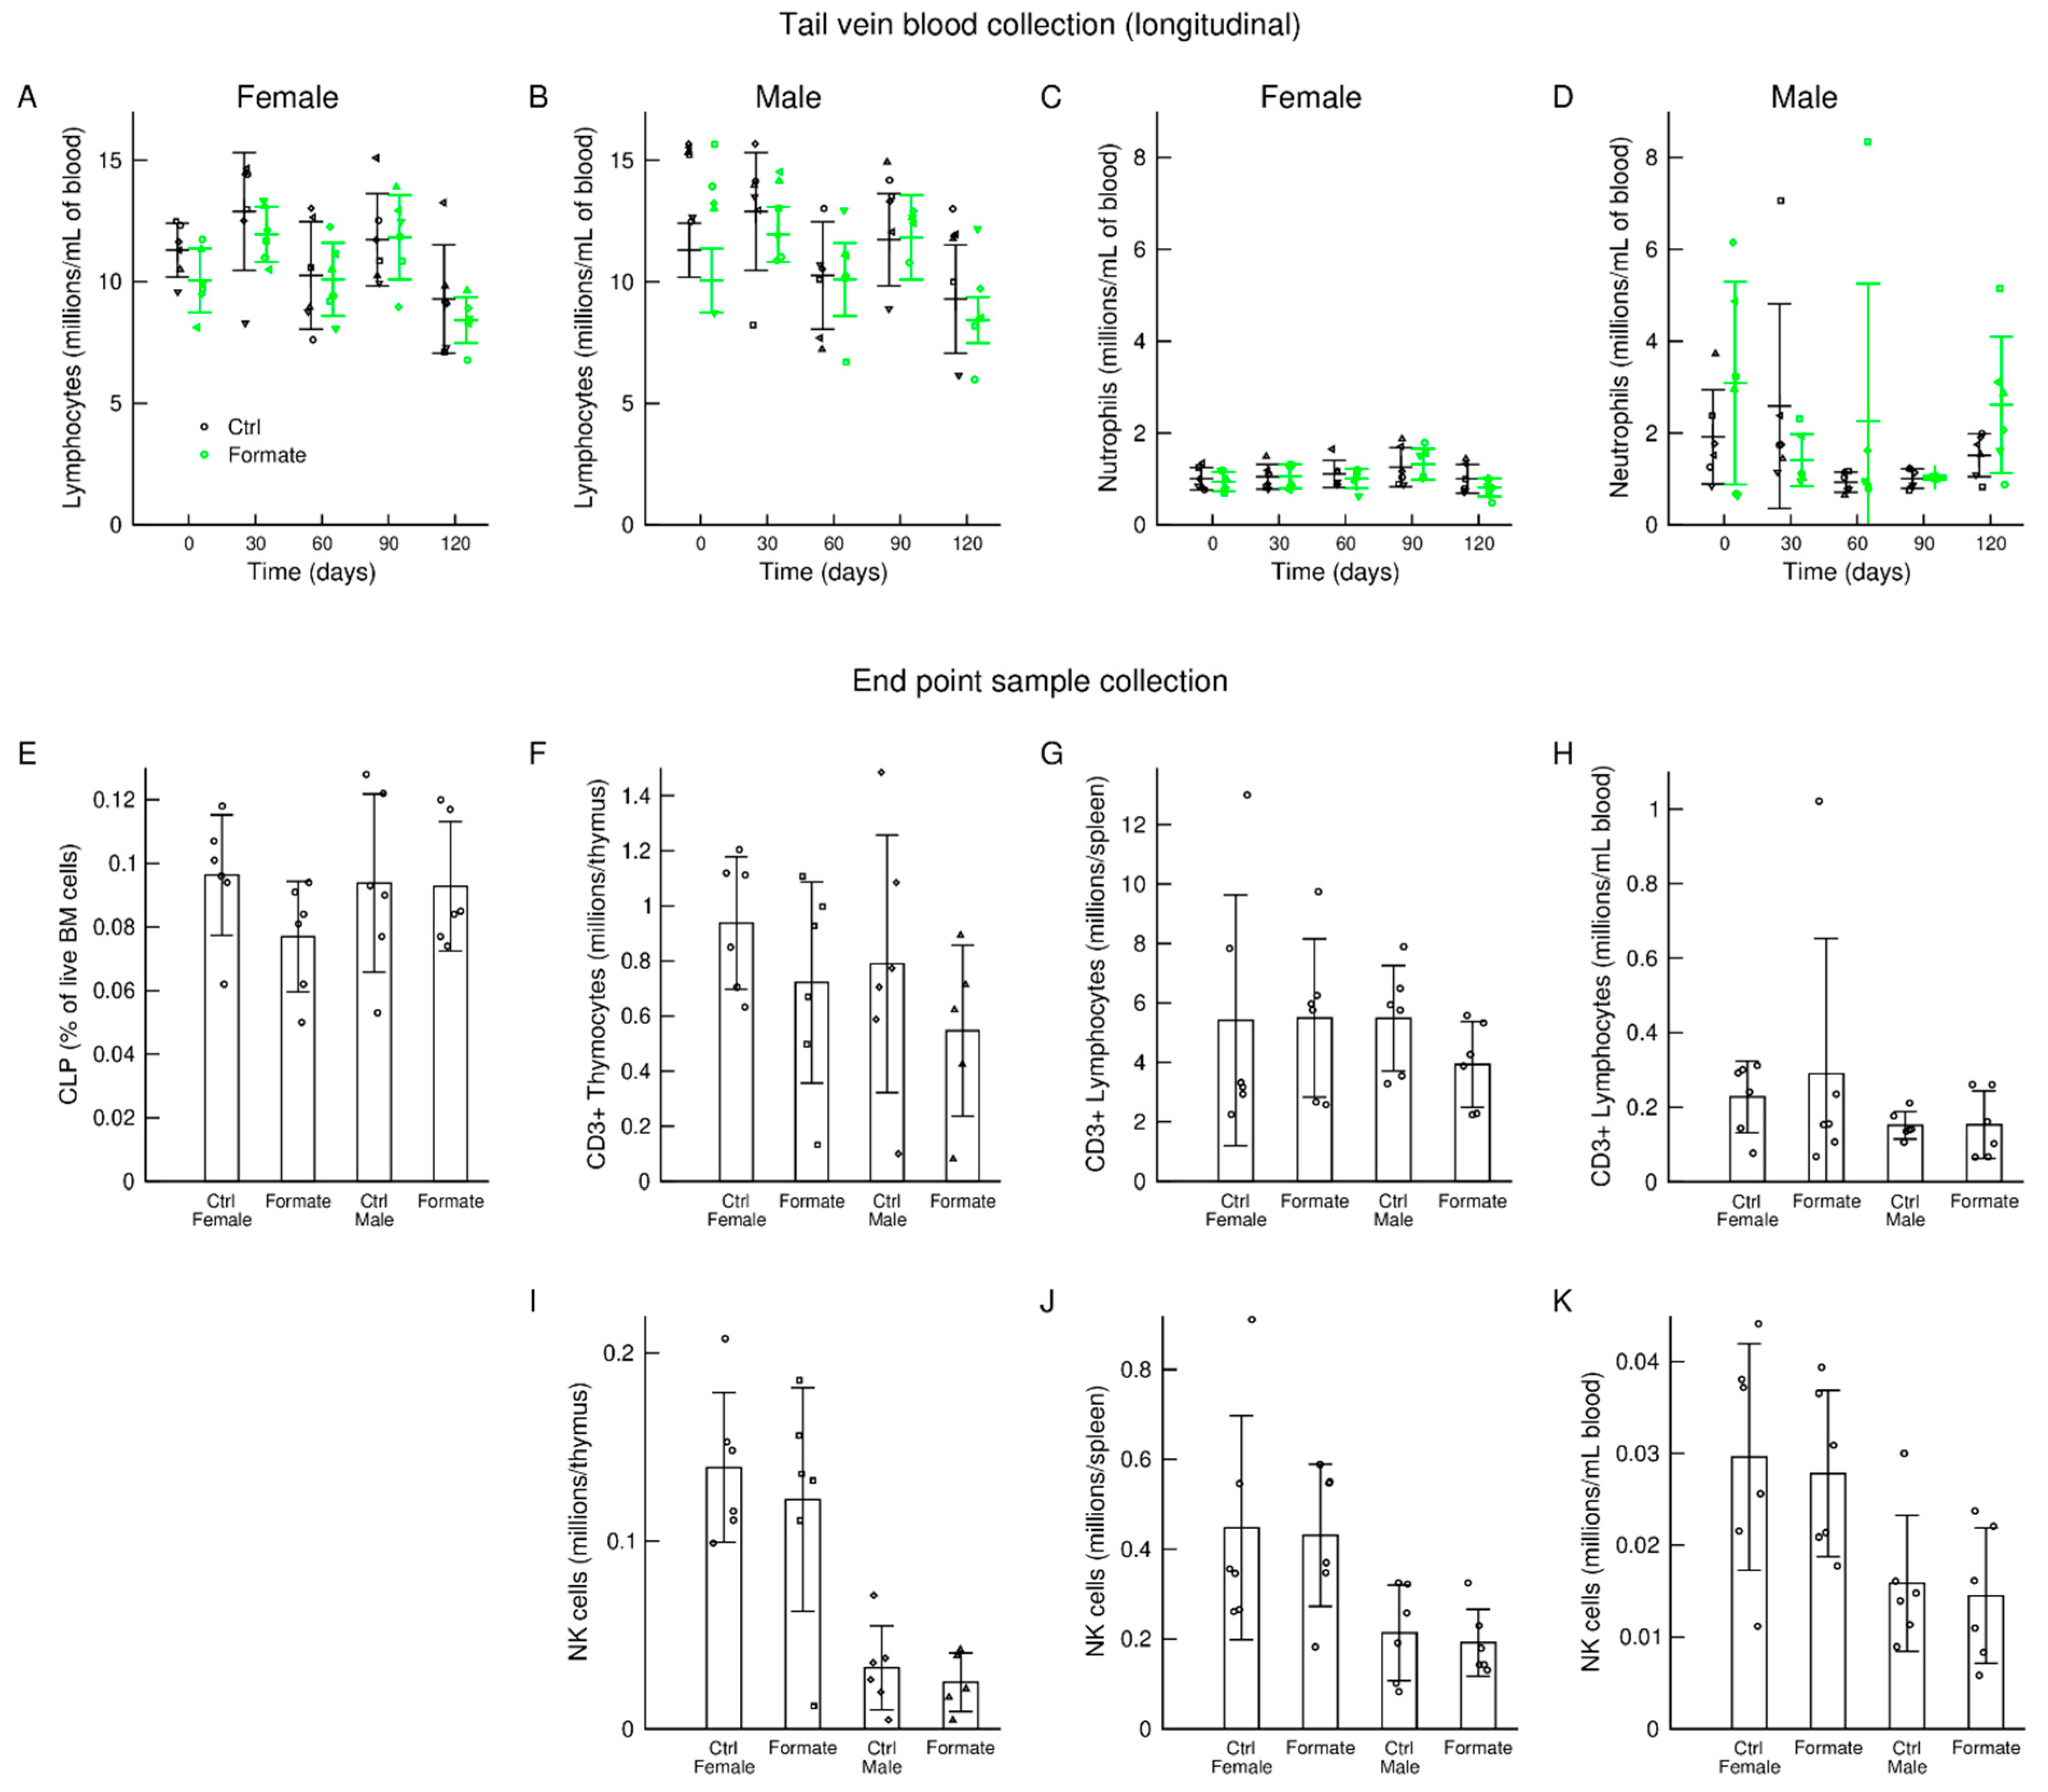
3.5. Immune System
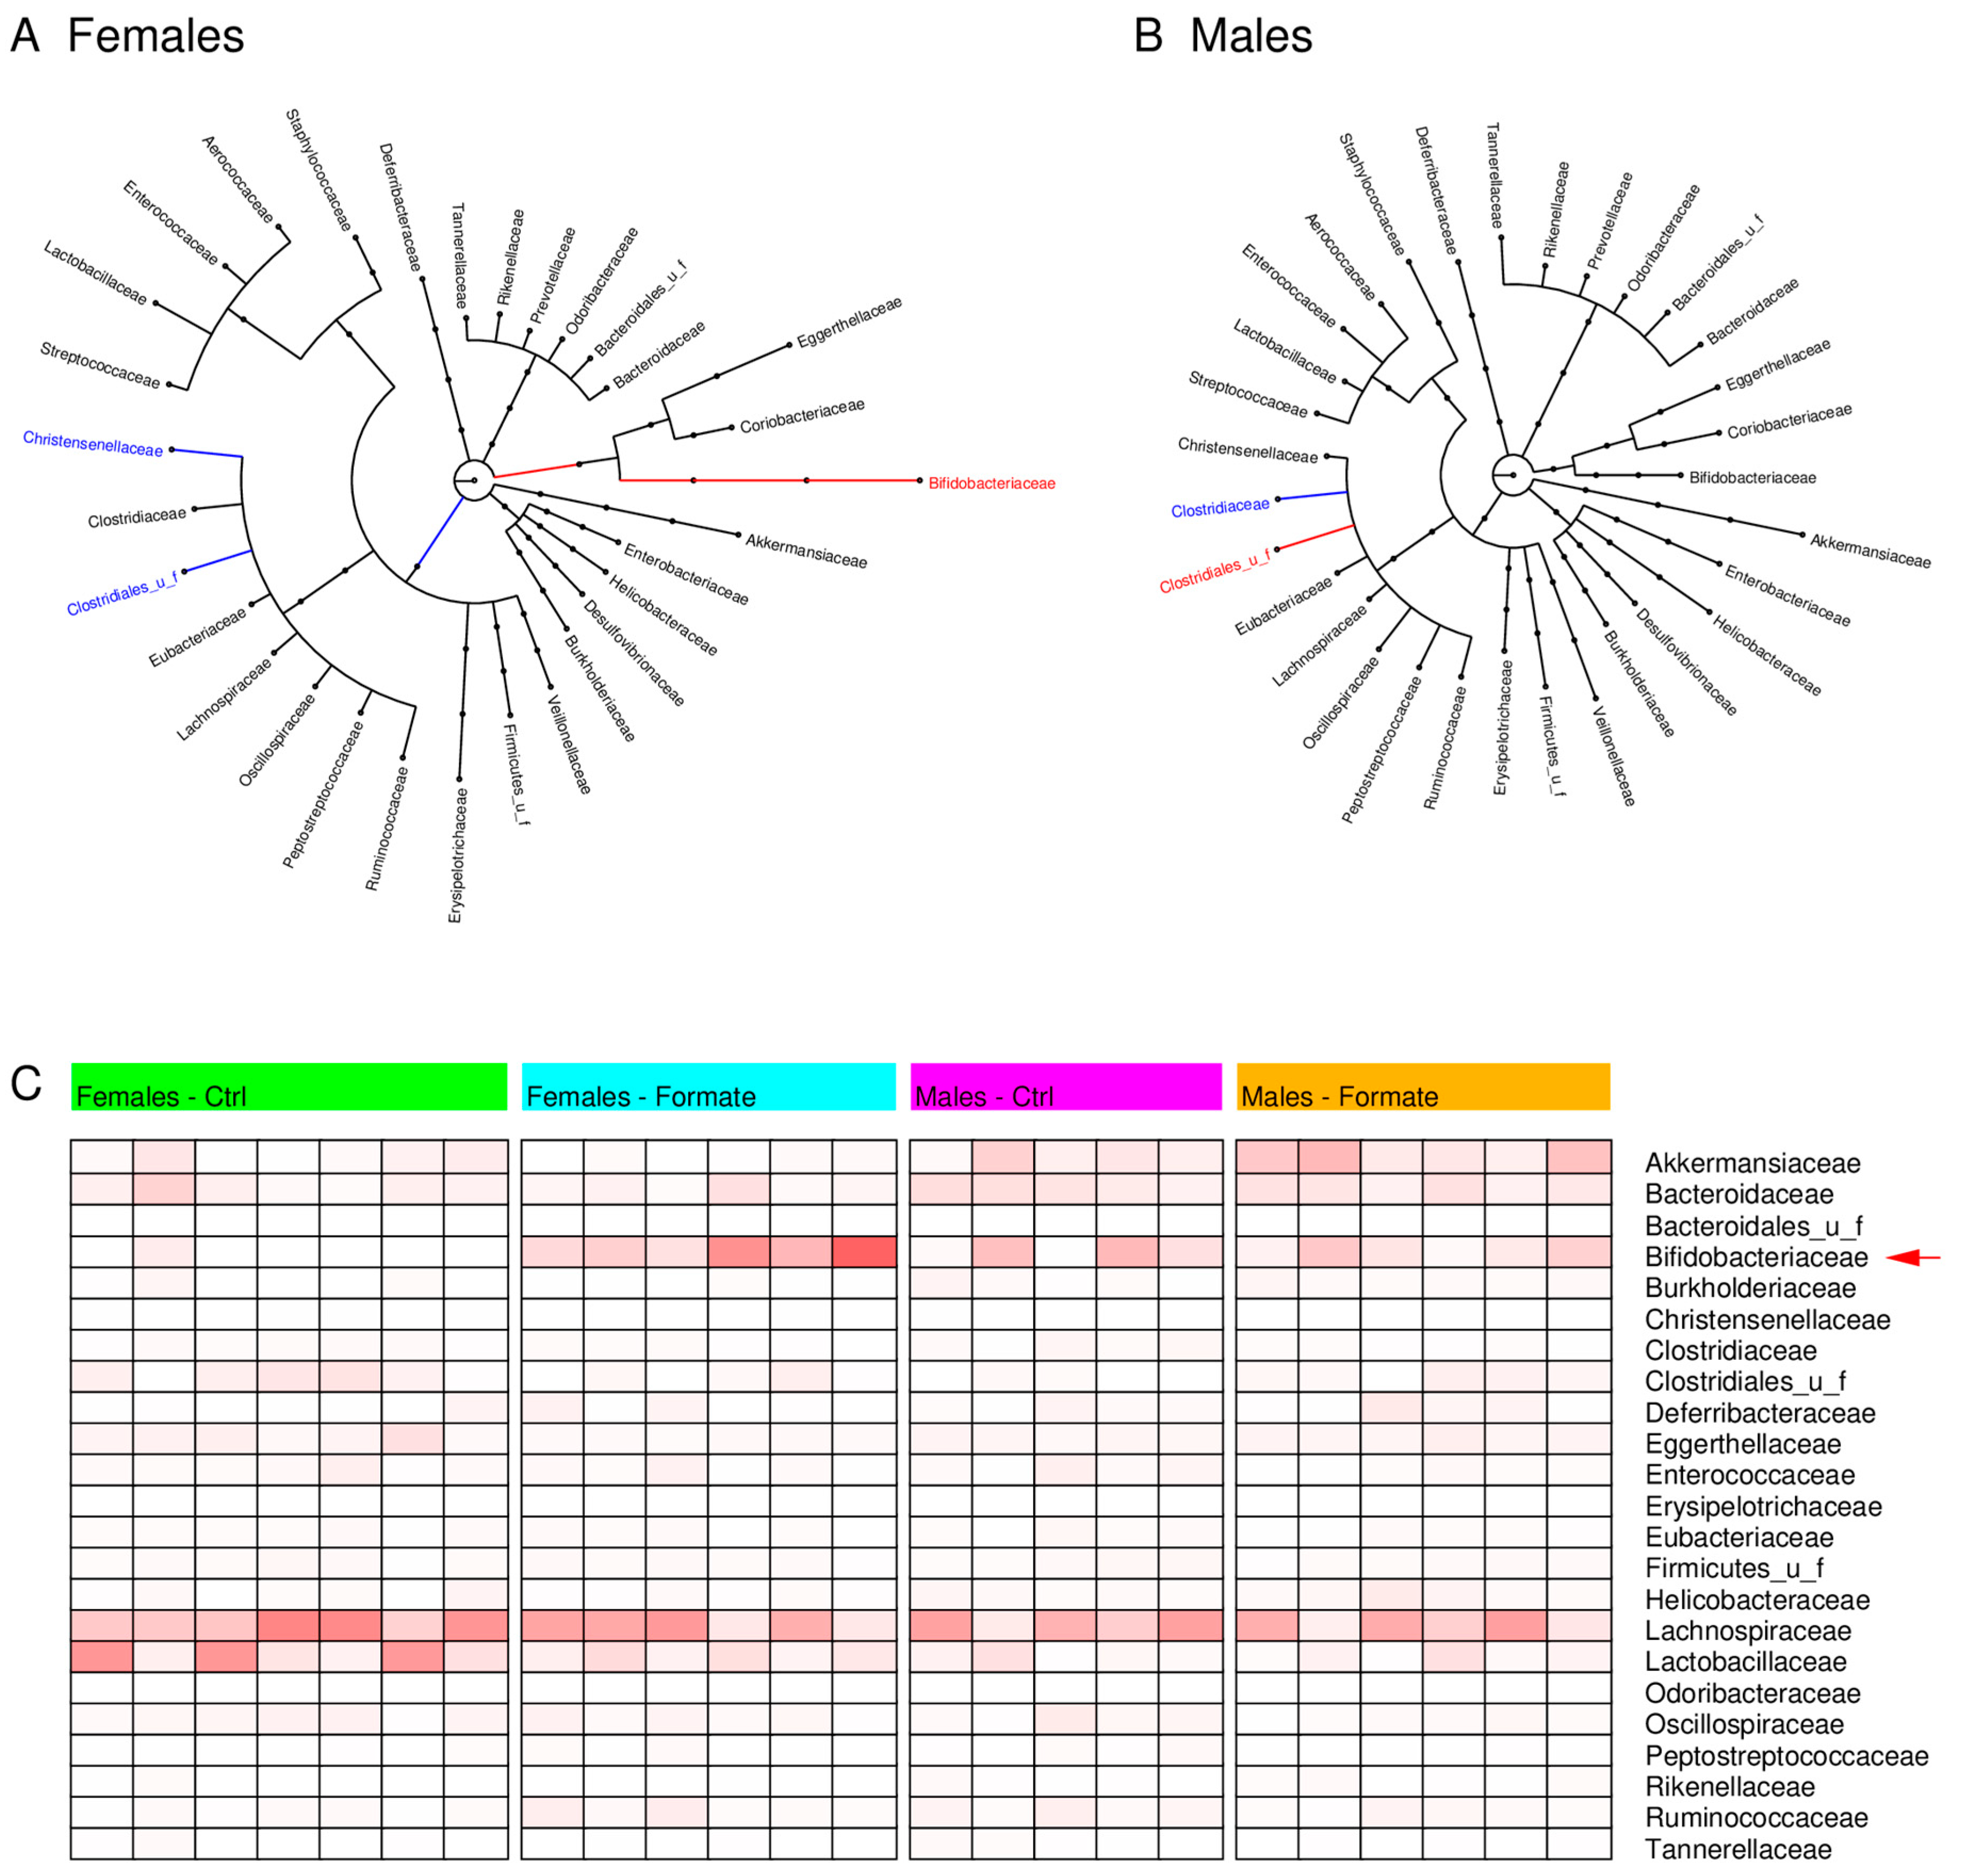
3.6. Microbiome
4. Discussion
5. Conclusions
Supplementary Materials
Author Contributions
Funding
Acknowledgments
Conflicts of Interest
References
- Tibbetts, A.S.; Appling, D.R. Compartmentalization of Mammalian folate-mediated one-carbon metabolism. Annu. Rev. Nutr. 2010, 30, 57–81. [Google Scholar] [CrossRef] [PubMed]
- Naderi, N.; House, J.D. Recent Developments in Folate Nutrition. Adv. Food Nutr. Res. 2018, 83, 195–213. [Google Scholar] [PubMed]
- Reynolds EH Folic acid, ageing, depression, and dementia. BMJ 2002, 324, 1512–1515. [CrossRef] [PubMed] [Green Version]
- Brosnan, M.E.; Brosnan, J.T. Formate: The Neglected Member of One-Carbon Metabolism. Annu. Rev. Nutr. 2016, 36, 369–388. [Google Scholar] [CrossRef] [PubMed]
- Pietzke, M.; Meiser, J.; Vazquez, A. Formate metabolism in health and disease. Mol. Metab. 2020, 33, 23–37. [Google Scholar] [CrossRef]
- Pietzke, M.; Fernandez-Arroyo, S.; Sumpton, D.; Mackay, G.M.; Martin-Castillo, B.; Camps, J.; Joven, J.; Menendez, J.A.; Vazquez, A. Stratification of cancer and diabetes based on circulating levels of formate and glucose. Cancer Metab. 2019, 7, 3. [Google Scholar] [CrossRef] [Green Version]
- Vazquez, A. The Spice of Life; Self-published; 2020. [Google Scholar]
- Wu, X.; Wakamiya, M.; Vaishnav, S.; Geske, R.; Montgomery, C., Jr.; Jones, P.; Bradley, A.; Caskey, C.T. Hyperuricemia and urate nephropathy in urate oxidase-deficient mice. Proc. Natl. Acad. Sci. USA 1994, 91, 742–746. [Google Scholar] [CrossRef] [Green Version]
- Stechman, M.J.; Ahmad, B.N.; Loh, N.Y.; Reed, A.A.; Stewart, M.; Wells, S.; Hough, T.; Bentley, L.; Cox, R.D.; Brown, S.D.; et al. Establishing normal plasma and 24-hour urinary biochemistry ranges in C3H, BALB/c and C57BL/6J mice following acclimatization in metabolic cages. Lab. Anim. 2010, 44, 218–225. [Google Scholar] [CrossRef]
- Meiser, J.; Tumanov, S.; Maddocks, O.; Labuschagne, C.F.; Athineos, D.; Van Den Broek, N.; Mackay, G.M.; Gottlieb, E.; Blyth, K.; Vousden, K.; et al. Serine one-carbon catabolism with formate overflow. Sci. Adv. 2016, 2, e1601273. [Google Scholar] [CrossRef] [Green Version]
- Mackay, G.M.; Zheng, L.; van den Broek, N.J.; Gottlieb, E. Analysis of Cell Metabolism Using LC-MS and Isotope Tracers. Methods Enzymol. 2015, 561, 171–196. [Google Scholar]
- Smith, E.N.; Taylor, R.T. Acute toxicity of methanol in the folate-deficient acatalasemic mouse. Toxicology 1982, 25, 271–287. [Google Scholar] [CrossRef]
- Kamps, J.J.A.G.; Hopkinson, R.J.; Schofield, C.J.; Claridge, T.D.W. How formaldehyde reacts with amino acids. Commun. Chem. 2019, 2, 126. [Google Scholar] [CrossRef] [Green Version]
- Pietzke, M.; Burgos-Barragan, G.; Wit, N.; Tait-Mulder, J.; Sumpton, D.; Mackay, G.M.; Patel, K.J.; Vazquez, A. Amino acid dependent formaldehyde metabolism in mammals. Commun. Chem. 2020, 3, 78. [Google Scholar] [CrossRef]
- IARC Working Group on the Evaluation of Carcinogenic Risks to Humans Formaldehyde, 2-butoxyethanol and 1-tert-butoxypropan-2-ol. Iarc Monogr. Eval. Carcinog. Risks Hum. 2006, 88, 1–478.
- Ron-Harel, N.; Notarangelo, G.; Ghergurovich, J.M.; Paulo, J.A.; Sage, P.T.; Santos, D.; Satterstrom, F.K.; Gygi, S.P.; Rabinowitz, J.D.; Sharpe, A.H.; et al. Defective respiration and one-carbon metabolism contribute to impaired naive T cell activation in aged mice. Proc. Natl. Acad. Sci. USA 2018, 115, 13347–13352. [Google Scholar] [CrossRef] [PubMed] [Green Version]
- Ozcan, E.; Sun, J.; Rowley, D.C.; Sela, D.A. A human gut commensal ferments cranberry carbohydrates to produce formate. Appl. Environ. Microbiol. 2017, 83, e0109–e0117. [Google Scholar] [CrossRef] [Green Version]
- Hughes, E.R.; Winter, M.G.; Duerkop, B.A.; Spiga, L.; Furtado de Carvalho, T.; Zhu, W.; Gillis, C.C.; Buttner, L.; Smoot, M.P.; Behrendt, C.L.; et al. Microbial Respiration and Formate Oxidation as Metabolic Signatures of Inflammation-Associated Dysbiosis. Cell Host Microbe 2017, 21, 208–219. [Google Scholar] [CrossRef] [Green Version]
- Oizel, K.; Tait-Mulder, J.; Fernandez-de-Cossio-Diaz, J.; Pietzke, M.; Brunton, H.; Lilla, S.; Dhayade, S.; Athineos, D.; Blanco, G.R.; Sumpton, D.; et al. Formate induces a metabolic switch in nucleotide and energy metabolism. Cell Death Dis. 2020, 11, 310. [Google Scholar] [CrossRef]
- Washburn, S.E.; Caudill, M.A.; Malysheva, O.; MacFarlane, A.J.; Behan, N.A.; Harnett, B.; MacMillan, L.; Pongnopparat, T.; Brosnan, J.T.; Brosnan, M.E. Formate metabolism in fetal and neonatal sheep. Am. J. Physiol. Endocrinol. Metab. 2015, 308, E921–E927. [Google Scholar] [CrossRef]
- Brosnan, J.T.; Plumptre, L.; Brosnan, M.E.; Pongnopparat, T.; Masih, S.P.; Visentin, C.E.; Berger, H.; Lamers, Y.; Caudill, M.A.; Malysheva, O.V.; et al. Formate concentrations in maternal plasma during pregnancy and in cord blood in a cohort of pregnant Canadian women: Relations to genetic polymorphisms and plasma metabolites. Am. J. Clin. Nutr. 2019, 110, 1131–1137. [Google Scholar] [CrossRef]
- Vazquez, A. Dietary and pharmacological induction of serine synthesis genes. bioRxiv 2020. [Google Scholar] [CrossRef]
- Komatsu, W.; Mawatari, K.; Miura, Y.; Yagasaki, K. Restoration by dietary glutamine of reduced tumor necrosis factor production in a low-protein-diet-fed rat model. Biosci. Biotechnol. Biochem. 2007, 71, 352–357. [Google Scholar] [CrossRef] [PubMed]
- Wahl, D.; Solon-Biet, S.M.; Wang, Q.P.; Wali, J.A.; Pulpitel, T.; Clark, X.; Raubenheimer, D.; Senior, A.M.; Sinclair, D.A.; Cooney, G.J.; et al. Comparing the Effects of Low-Protein and High-Carbohydrate Diets and Caloric Restriction on Brain Aging in Mice. Cell Rep. 2018, 25, 2234–2243. [Google Scholar] [CrossRef] [PubMed] [Green Version]
- Liesivuori, J.; Savolainen, H. Methanol and formic acid toxicity: Biochemical mechanisms. Pharm. Toxicol. 1991, 69, 157–163. [Google Scholar] [CrossRef] [PubMed]
- Clary, J.J. The Toxicology of Methanol; Wiley: Hoboken, NJ, USA, 2013. [Google Scholar]
- Dorokhov, Y.L.; Shindyapina, A.V.; Sheshukova, E.V.; Komarova, T.V. Metabolic methanol: Molecular pathways and physiological roles. Physiol. Rev. 2015, 95, 603–644. [Google Scholar] [CrossRef] [PubMed]
- Altaweel, M.M.; Hanzlik, R.P.; Ver Hoeve, J.N.; Eells, J.; Zhang, B. Ocular and systemic safety evaluation of calcium formate as a dietary supplement. J. Ocul. Pharmacol. Ther. Off. J. Assoc. Ocul. Pharmacol. Ther. 2009, 25, 223–230. [Google Scholar] [CrossRef] [PubMed]


© 2020 by the authors. Licensee MDPI, Basel, Switzerland. This article is an open access article distributed under the terms and conditions of the Creative Commons Attribution (CC BY) license (http://creativecommons.org/licenses/by/4.0/).
Share and Cite
Dhayade, S.; Pietzke, M.; Wiesheu, R.; Tait-Mulder, J.; Athineos, D.; Sumpton, D.; Coffelt, S.; Blyth, K.; Vazquez, A. Impact of Formate Supplementation on Body Weight and Plasma Amino Acids. Nutrients 2020, 12, 2181. https://doi.org/10.3390/nu12082181
Dhayade S, Pietzke M, Wiesheu R, Tait-Mulder J, Athineos D, Sumpton D, Coffelt S, Blyth K, Vazquez A. Impact of Formate Supplementation on Body Weight and Plasma Amino Acids. Nutrients. 2020; 12(8):2181. https://doi.org/10.3390/nu12082181
Chicago/Turabian StyleDhayade, Sandeep, Matthias Pietzke, Robert Wiesheu, Jacqueline Tait-Mulder, Dimitris Athineos, David Sumpton, Seth Coffelt, Karen Blyth, and Alexei Vazquez. 2020. "Impact of Formate Supplementation on Body Weight and Plasma Amino Acids" Nutrients 12, no. 8: 2181. https://doi.org/10.3390/nu12082181