
Socioeconomic Characteristics and Trends in the Consumption of Ultra-Processed Foods in Korea from 2010 to 2018


1
Department of Preventive Medicine, Yonsei University College of Medicine, Seoul 03722, Korea
2
Department of Public Health, Graduate School, Yonsei University, Seoul 03722, Korea
3
Department of Preventive Medicine and Public Health, Ajou University School of Medicine, Suwon 16499, Korea
*
Author to whom correspondence should be addressed.
Nutrients 2021, 13(4), 1120; https://doi.org/10.3390/nu13041120
Submission received: 3 February 2021
/
Revised: 26 March 2021
/
Accepted: 26 March 2021
/
Published: 29 March 2021
Abstract
:There is growing evidence for a global transition to a more highly processed diet. While the dietary share of ultra-processed foods depends on a country’s economic status, food choice and consumption are also influenced by the socioeconomic situation of individuals. This study investigated whether ultra-processed food consumption differed across socioeconomic subgroups and over time (2010–2018) in Korea. Cross-sectional data from the Korea National Health and Nutrition Examination Survey 2010–2018 were analyzed. Food and beverages reported in a one-day 24 h recall were classified according to the NOVA food classification criteria. The dietary energy contribution of ultra-processed foods was high among men and urban residents, and increased with education and income level; additionally, it reached its peak in adolescents and thereafter decreased with increasing age. After adjusting the socioeconomic variables, such associations remained significant, except for income level. The overall contribution of ultra-processed foods increased from 23.1% (2010–2012) to 26.1% (2016–2018), and the same trend over time was observed in all age groups and socioeconomic strata. In the Korean population, ultra-processed food consumption differed by individual socioeconomic characteristics, but gradually increased over time, and this trend was consistently found in all socioeconomic subgroups. Future strategies to promote healthy food choices are needed for the Korean population.
1. Introduction
Ultra-processed foods are products manufactured industrially with substances extracted or refined from natural foods and chemical additives [1]. These foods include breakfast cereals, sugared drinks, confectionary, meat and fish products (e.g., chicken nuggets), and various types of convenience foods. Ultra-processed foods have poor nutrient profiles, such as having high energy density, being high in sugar, sodium, and fat, and being low in protein, fiber, minerals, and vitamins [2,3,4]. They are also cheap, highly palatable, conveniently consumed with minimal (or no) preparation anywhere and anytime, and having less satiety due to their own physical characteristics, often leading to overconsumption [5,6,7,8]. Additionally, the consumption of ultra-processed foods is associated with low dietary quality, as well as unhealthy lifestyle-related behavior such as physical inactivity and smoking [4,9,10,11]. Recently, there has been growing evidence of adverse health impacts of the consumption of ultra-processed foods [9,12,13,14,15].
The dietary energy contribution of ultra-processed foods has been reported to be generally high in high-income countries such as the United States (58.8%) [16], the United Kingdom (56.8%) [17], and Canada (47.7%) [3], and relatively low in relatively low-income countries such as Brazil (20.4%) [4], Mexico (29.8%) [18], and Columbia (15.9%) [19]. However, ultra-processed food product sales worldwide are on an upward trend [20,21], and ultra-processed food purchases also have a noticeable increasing tendency in several household food expenditure surveys [22,23,24]. Changes in demographic and sociocultural characteristics (i.e., increased income, urbanization, changing labor market, and an increase in the number of women working outside the home) that are brought along with economic growth basically drive the demand for ultra-processed foods [21,25]. With improvements in innovative food technologies for processing and packaging, more diverse types of ultra-processed foods have been produced [26]. All of the supply chains involved in the production of raw foods, manufacturing, marketing, and consumption are controlled by a small number of transnational food and beverage manufacturers and by a strong power of transnational grocery retailers and fast-food companies, resulting in such market power which is potentially instigating a global transition to ultra-processed food [21]. In addition, although a policy intervention to minimize the negative impact of an unhealthy diet is needed, political and regulatory actions for these supply-side sectors of the food system are still weak [21]. Ultra-processed foods seem to penetrate deeply into society and to rapidly replace freshly prepared meals [20,22,24,27,28,29]. While socioeconomic status is known to be a major determinant of the consumption of these foods, human diet is influenced by many other factors other (e.g., culture) and thus, the vulnerable groups (i.e., those more likely to consume ultra-processed foods) differ from country to country [3,9,16,30,31,32].
Thus far, little is known about ultra-processed food consumption in the Korean population. According to one of the few recently conducted studies by the authors of the current study [33], the proportion of ultra-processed foods in the diet of Korean adults accounts for 25.1% of total energy intake. High consumption of ultra-processed foods is associated with poor nutrient intake, as well as poor dietary quality. Along with economic growth, like other countries, the Korean diet has changed consistently over time, but still has several unique characteristics (i.e., relatively high vegetable intake and low fat intake) [34,35]. The sales of the ultra-processed foods and beverages of Korea are outstandingly low among high-income countries [21], and the mean consumption of sugar-sweetened beverages, a major type of ultra-processed food, has been reported to be relatively low compared to other high-income countries [36]. However, Korea is still under the influence of a global transition.
Thus, this study aimed to evaluate whether the ultra-processed food consumption of Koreans differed in terms of socioeconomic characteristics and whether there were time trends in ultra-processed food consumption from 2010 to 2018 in Korea.
2. Materials and Methods
2.1. Data Source and Study Population
We used data from three cycles of the Korea National Health and Nutrition Examination Survey (KNHANES): 2010–2012, 2013–2015, and 2016–2018. KNHANES is a continuous, nationwide, cross-sectional survey to assess the health and nutritional status of Koreans. KNHANES comprises health interviews, health examinations, and nutrition surveys. KNHANES sampling follows a multistage stratified clustered probability design. Each year, 192 primary sampling units were selected from about 200,000 small geographical areas covering the whole country. Using systematic sampling, 20–23 target households were sampled for each primary sampling unit consisting of 60 households. Within the selected households, all individuals aged one year or older were invited to KNHNAES. Thus, in each of the studied years, approximately 10,000 non-institutionalized Koreans aged one year or older were recruited as representative samples. The participation rate was approximately 75% and more details are available elsewhere [37,38].
The nutrition survey was carried out approximately one week after the health interviews and health examination surveys. Trained dietitians visited the participants’ homes and collected information concerning dietary habits and intakes in an in-person interview. Dietary intake was assessed by a one-day 24 h recall. During the recall, the respondents were requested to report details on the foods and beverages they consumed over the previous 24 h (e.g., food description, quantity, and time and place of eating). The quantity of the food and beverages consumed was required to be reported in terms of volume on the basis of various measuring tools (e.g., standard measuring cups, spoons, a ruler, and two-dimensional drawings of measuring guides). If single food items were consumed, more specific information on the food (e.g., food status and brand name) with generic food names were collected. In the case of homemade dishes, the unique home recipe was collected from the person in charge of cooking. The multiple-pass method designed for complete and accurate collection of dietary data such as each respondent’s food consumption and home recipes was applied throughout the interview. For children or those who had difficulty in reporting their diet, the interview was completed with the help of others (e.g., mother or caregiver). The dietary data from the completed one-day 24 h recall were coded and edited using the software developed for the KNHANES. After data entry, multi-ingredient foods through culinary preparation were disaggregated into their raw ingredients. In this process, for homemade foods, each household’s unique recipe collected from the person in charge of cooking was applied and, for foods prepared at school or work cafeterias or restaurants, the standard recipes developed for the data processing of the KNHANES were applied. The amount of food consumed was converted into weight (g) using the database for volume and weight of foods [38,39]. The dietary energy and nutrient intake from each food item was calculated using Korean food composition data, updated regularly by the National Institute of Agricultural Sciences and the Korea Centers for Disease Control and Prevention (KCDC) [40,41]. All survey protocols and procedures were approved by the Institutional Review Board (IRB) of the KCDC and informed consent was obtained from each participant before the survey. The raw data file and documentation of this survey were released by KCDC (https://knhanes.cdc.go.kr, accessed on 20 February 2020). More details of the rationale, design, and methods have been described elsewhere [37,38,39,41].
A total of 72,751 individuals participated in at least one among three component surveys of KNHANES from 2010 to 2018. We excluded those who did not participate in a one-day 24 h recall (n = 7878), pregnant and breastfeeding women (n = 768), and those with missing information, including education and household income (n = 6682). Thus, 57,423 individuals aged one year or older were analyzed in this study (n = 20,461 in 2010–2012; n = 17,746 in 2013–2015; n = 19,216 in 2016–2018).
2.2. Food Classification According to the NOVA Classification Criteria
All reported food and beverage items were classified according to NOVA, the most widely used food classification method [1,8]. This classification system categorizes foods into four groups on a basis of the nature, extent, and purpose of industrial food processing: Unprocessed or minimally processed foods (n = 10 food subgroups); processed culinary ingredients (n = five food subgroups); processed food (n = seven food subgroups); and ultra-processed foods (n = 12 food subgroups).
In brief, NOVA group 1 includes original foods obtained from nature (unprocessed) or natural food after minimal processing, such as removing inedible parts, washing, chilling, refrigeration, freezing, crushing, grinding, filtering, drying, roasting, boiling, placing in containers, or vacuum-packaging. NOVA group 2 is of processed culinary ingredients used in the seasoning of raw foods (e.g., salt, sugar, honey, oils, and fats). They are usually obtained from group 1 foods through industrial processes such as extracting, mining, pressing, or centrifuging. NOVA group 3 comprises processed foods that are made by adding group 2 foods to group 1 foods, aiming to preserve natural foods longer or to enhance their palatability. They include salted, sugared, pickled, canned, or bottled foods, and processed cheese. Such processed products are recognized as new versions of original foods because they retain most of the basic characteristics of the original foods. Finally, NOVA group 4 consists of ultra-processed foods of a main concern in this study. They include breakfast cereals, breads and cakes, cookies, sweet or salty snacks, candies, chocolates, desserts, ice cream, sugary milk and fruit and vegetable drinks, soft drinks, sugared teas and coffee, distilled alcoholic beverages, meat and fish products (e.g., chicken nuggets), instant sauces and spreads, sweeteners, instant formulas and baby products, and diverse sorts of ready-to-eat or ready-to-heat foods (e.g., instant rice, noodles, soups, dumplings, or pizza). These foods are durable, hyper-palatable, and highly profitable food products that are manufactured mostly (or entirely) of cheap industrial substances extracted or derived from foods and additives through a highly complicated process, with little or no whole food content. The rationale and details on each NOVA food group have been described elsewhere [1,8].
In the data of KNHANES from 2010 to 2018, a total of 4927 food items were reported to be consumed as food itself or as ingredients. Three investigators classified each food item according to the NOVA classification criteria, and for some items with discrepant classification, they were resolved by discussion. Thus, all food items were mutually exclusively categorized into one of the four NOVA food groups and the subgroups within each of these NOVA groups.
2.3. Sociodemographic Variables
This study included sex, age, residence area, education status, and income as sociodemographic variables. Such information was provided by adult respondents aged 19 years or older from a sample household during the health interview survey. For income, to take into account the difference in a household size, we utilized the equivalized household income, calculated by dividing the annual household income by the square root of the number of household members. The sociodemographic variables were categorized as follows: Sex (male and female), age (1–12 years, 13–19 years, 20–49 years, 50–64 years, and 65 years or older), residence area (urban and rural), education status (middle school or less, high school, and college or higher), and income (low: quartile 1, middle: quartile 2–3, and high: quartile 4).
2.4. Statistical Analysis
The consumption of NOVA food groups and subgroups was assessed as dietary energy intake from ultra-processed foods (kcal) and the contribution of ultra-processed foods to total daily energy intake (%). The consumption of the NOVA food groups and subgroups of the total population (KNHANES from 2010 to 2018) was presented as means and standard errors.
We evaluated whether the dietary contribution of ultra-processed foods varied across sex, age, residence, education, and household income status using univariate and multiple regression analyses. In the multiple regression models, all of the covariates of the study were adjusted. Tests of linear trend were performed to assess the effect of sex, age, residence, education, and household income. We also evaluated whether the ultra-processed food consumption changed over time, as well as whether the time trends varied across socioeconomic strata, using linear regression analyses. The mean dietary contribution of ultra-processed foods across the three survey cycles (2010–2012, 2013–2015, and 2016–2018) were estimated in both the total population and each sociodemographic stratum. Tests of linear trend across the entire study period were performed. In addition, to help understand the change of ultra-processed food consumption by age groups, we estimated the dietary energy contribution of ultra-processed food subgroups over time by age groups. For this analysis, we regrouped a total of 12 ultra-processed food subgroups into six, as follows: Cereals, breads, cakes, and sandwiches; sugar-sweetened drinks (including coffee and tea with added sugar, sweetened milk and its products, and soft drinks, fruit and vegetable drinks); distilled alcoholic beverages; instant foods (including instant noodles and dumplings, fish and meat processed foods, instant cooked rice, soup, and other dishes); cookies, chips, snacks, and confectionary; and sauces and others (including traditional sauces and others). The mean dietary contribution of the ultra-processed food subgroups across the survey cycle was estimated and the adjusted linear trend was tested.
Given the clustered sampling design of KNHANES and the sample weights, we used the PROC SURVEYMEANS and PROC SURVEYREG procedures to explore the association between sociodemographic characteristics and the dietary contribution of ultra-processed foods, as well as the time trends in the ultra-processed food consumption, from 2010 to 2018. The data were analyzed using SAS 9.4 software (SAS institute, Cary, NC, USA). A p-value < 0.05 was considered statistically significant.
3. Results
3.1. Dietary Energy Intake according to the NOVA Food Groups
The mean energy intake of Koreans from 2010 to 2018 was 2024.9 kcal. Nearly two-thirds of the daily energy intake came from unprocessed or minimally processed foods (61.5%) and processed culinary ingredients (4.1%). Processed foods contributed 9.4% of the total energy intake, and the consumption of ultra-processed foods accounted for 24.9% (Table S1).
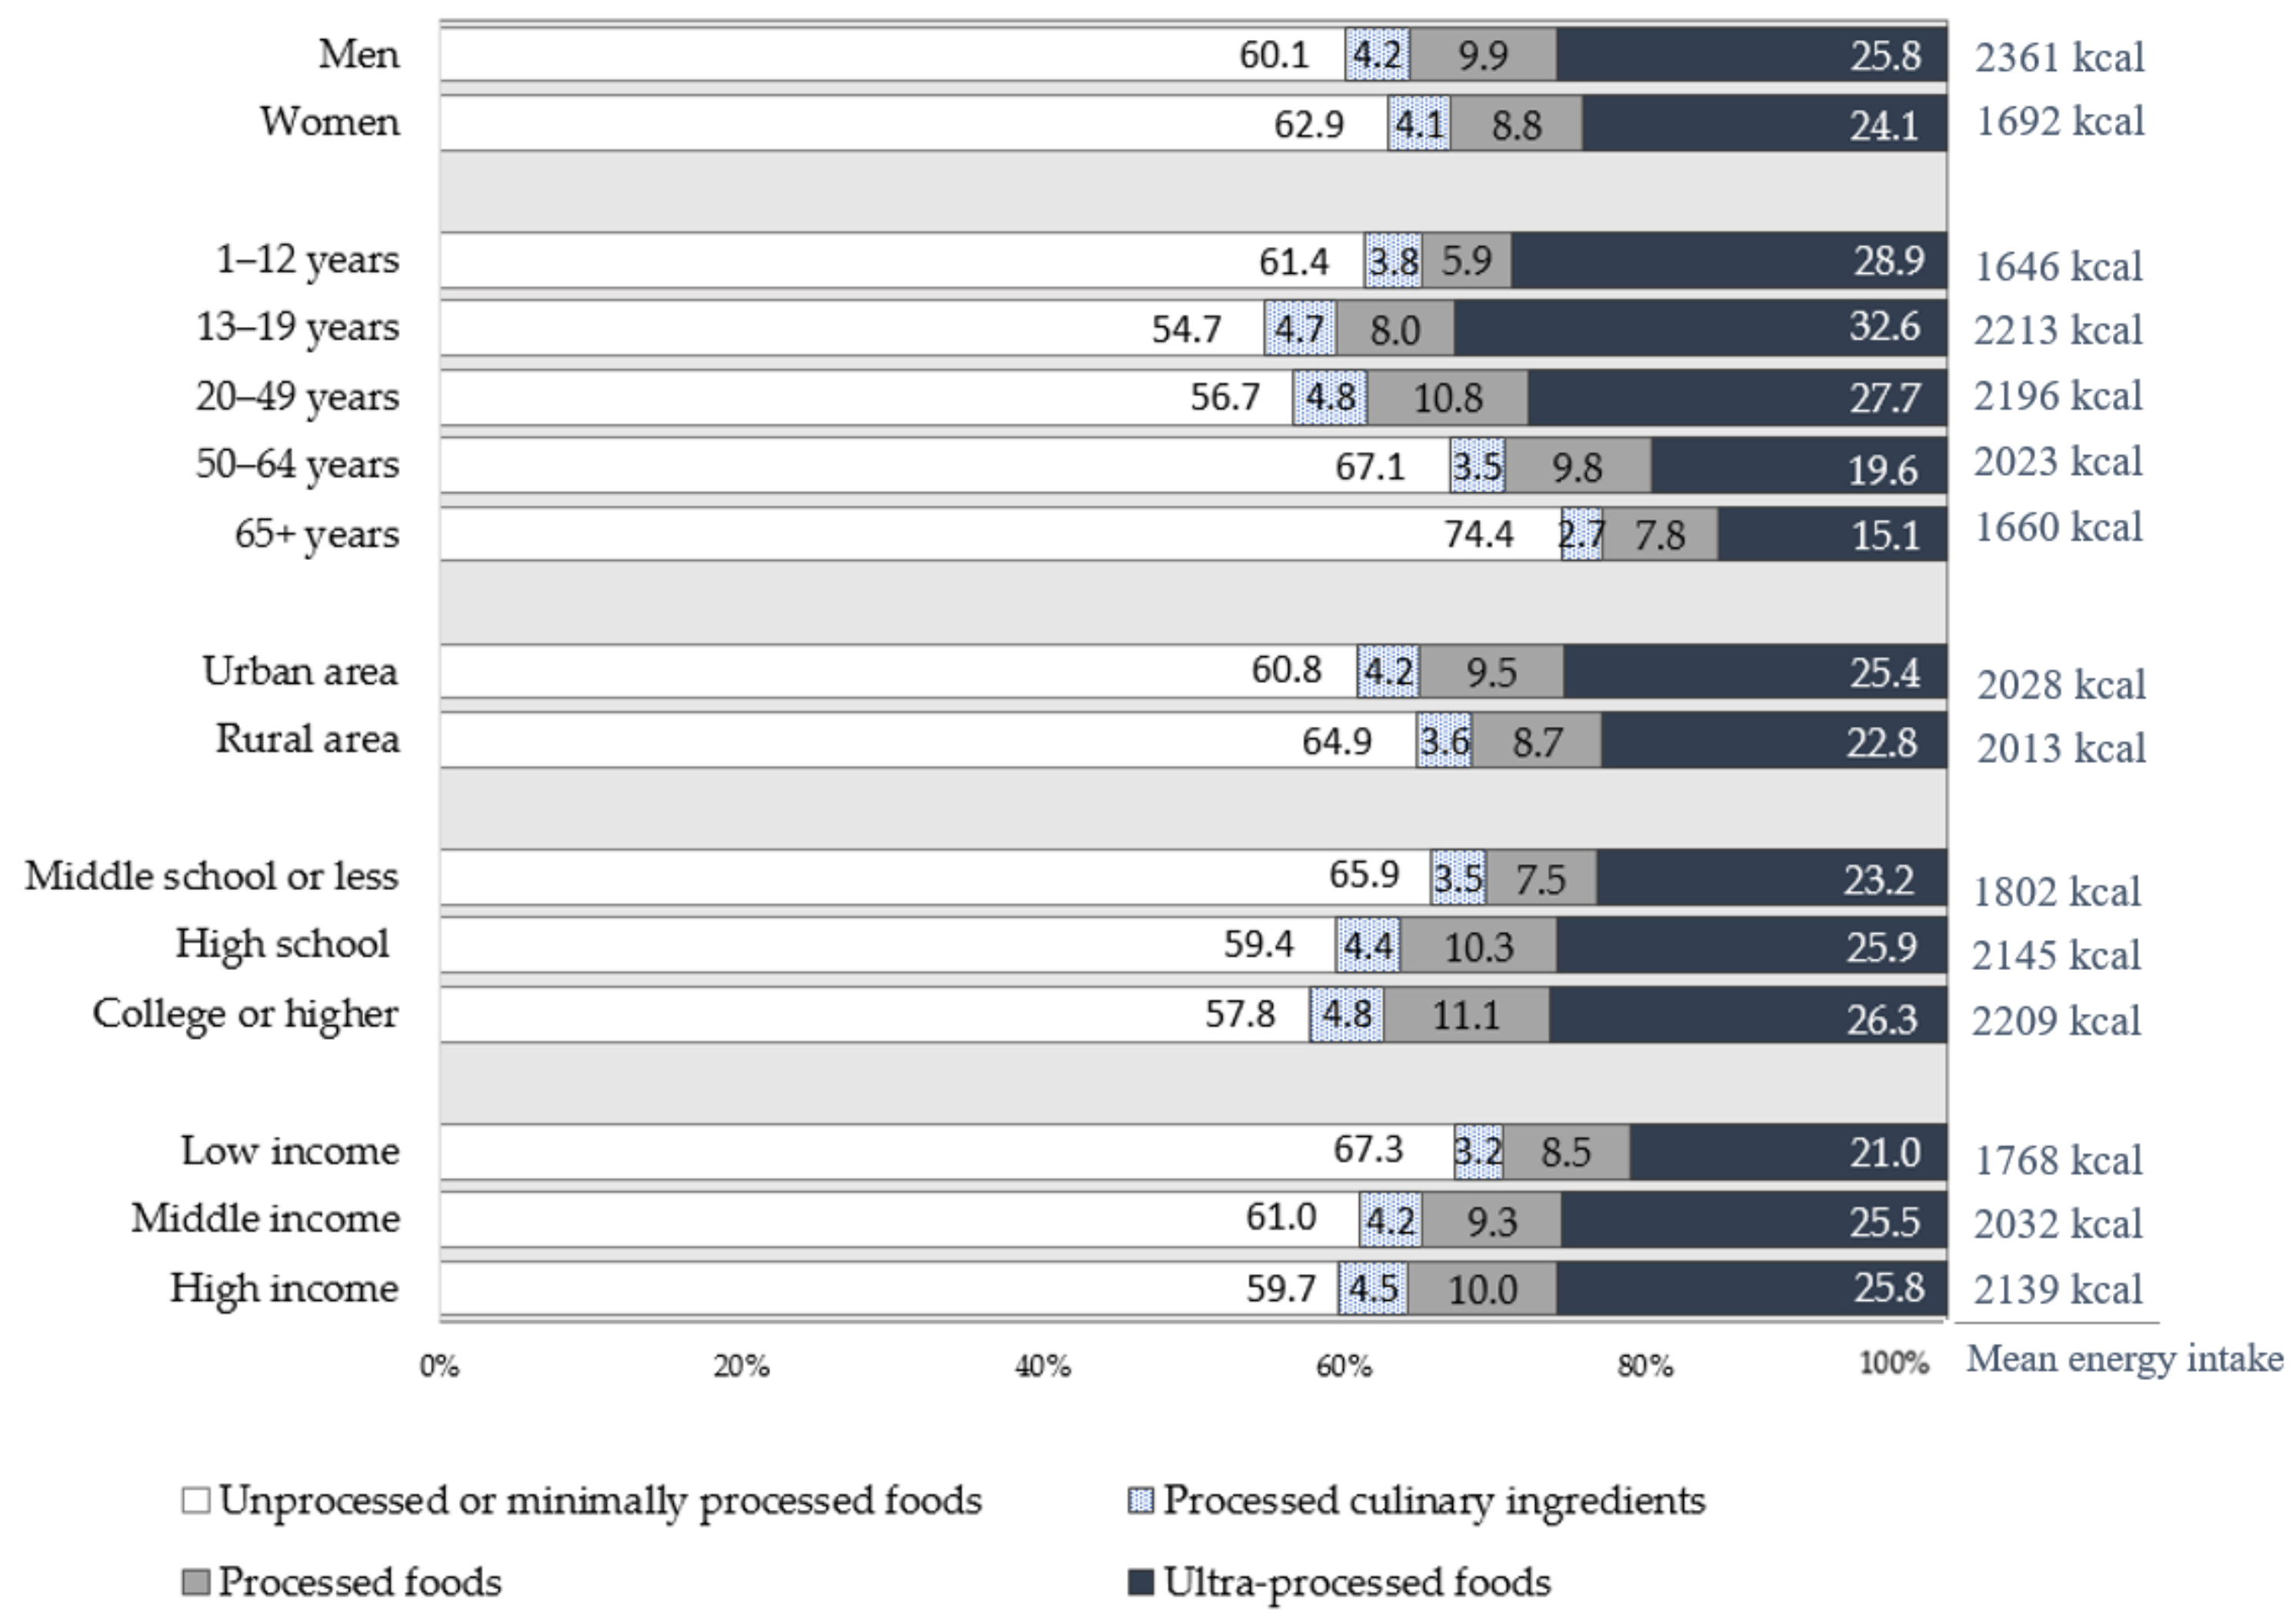
The dietary energy intake and energy contribution of the four NOVA food groups according to socioeconomic characteristics is shown in Figure 1. In all socioeconomic subgroups, more than half of the total energy intake came from unprocessed or minimally processed foods, followed by ultra-processed foods, processed foods, and processed culinary foods. Although there were differences in degrees, such a tendency was found consistently in all groups.
3.2. Association between Socioeconomic Characteristics and the Dietary Contribution of Ultra-Processed Foods
The associations between socioeconomic characteristics and the dietary contribution of ultra-processed foods are presented in Table 1. On the whole, the crude mean contribution of ultra-processed foods was high among men and urban residents, and increased with education and income level; additionally, it reached its peak in adolescents (32.6%, 734.9 kcal) and thereafter decreased with increasing age (15.1%, 262.2 kcal in elderly aged 65 years or older). The linear trends in all socioeconomic characteristics were statistically significant (p < 0.0001). After adjustment for these socioeconomic variables, the adjusted mean contribution of the ultra-processed foods was still significantly higher in men (p < 0.0001), urban residents (p = 0.004), older people (p < 0.0001), and people with higher education (p < 0.0001), but a statistical difference across household income level was not found (p = 0.174).
3.3. Time Trends in the Dietary Contribution of Ultra-Processed Foods
The changes in the consumption of ultra-processed foods over time (2010–2018) are presented in Table 2. The overall contribution of ultra-processed foods increased gradually from 23.1% in 2010–2012 to 25.5% in 2013–2015 and 26.1% in 2016–2018 (+1.52% per cycle, p < 0.0001). Although there were slight differences in the extent of the increase in the dietary contribution of ultra-processed foods according to socioeconomic subgroups, significantly increasing trends were found in all sociodemographic strata. By age groups, adults aged 20–49 years had the largest change over time from 24.8% (564.1 kcal, data not shown) in 2010–2012 to 29.8% (668.7 kcal, data not shown) in 2016–2018 (+2.47% per cycle, p < 0.0001) compared to other age groups. Although the change over time was the smallest (+0.82% per cycle, p = 0.036), even among those with low household income, the consumption of ultra-processed foods increased consistently from 20.3% in 2010–2012 to 22.0% in 2016–2018. These increasing trends remained unchanged after adjustment for the socioeconomic variables (data not shown).
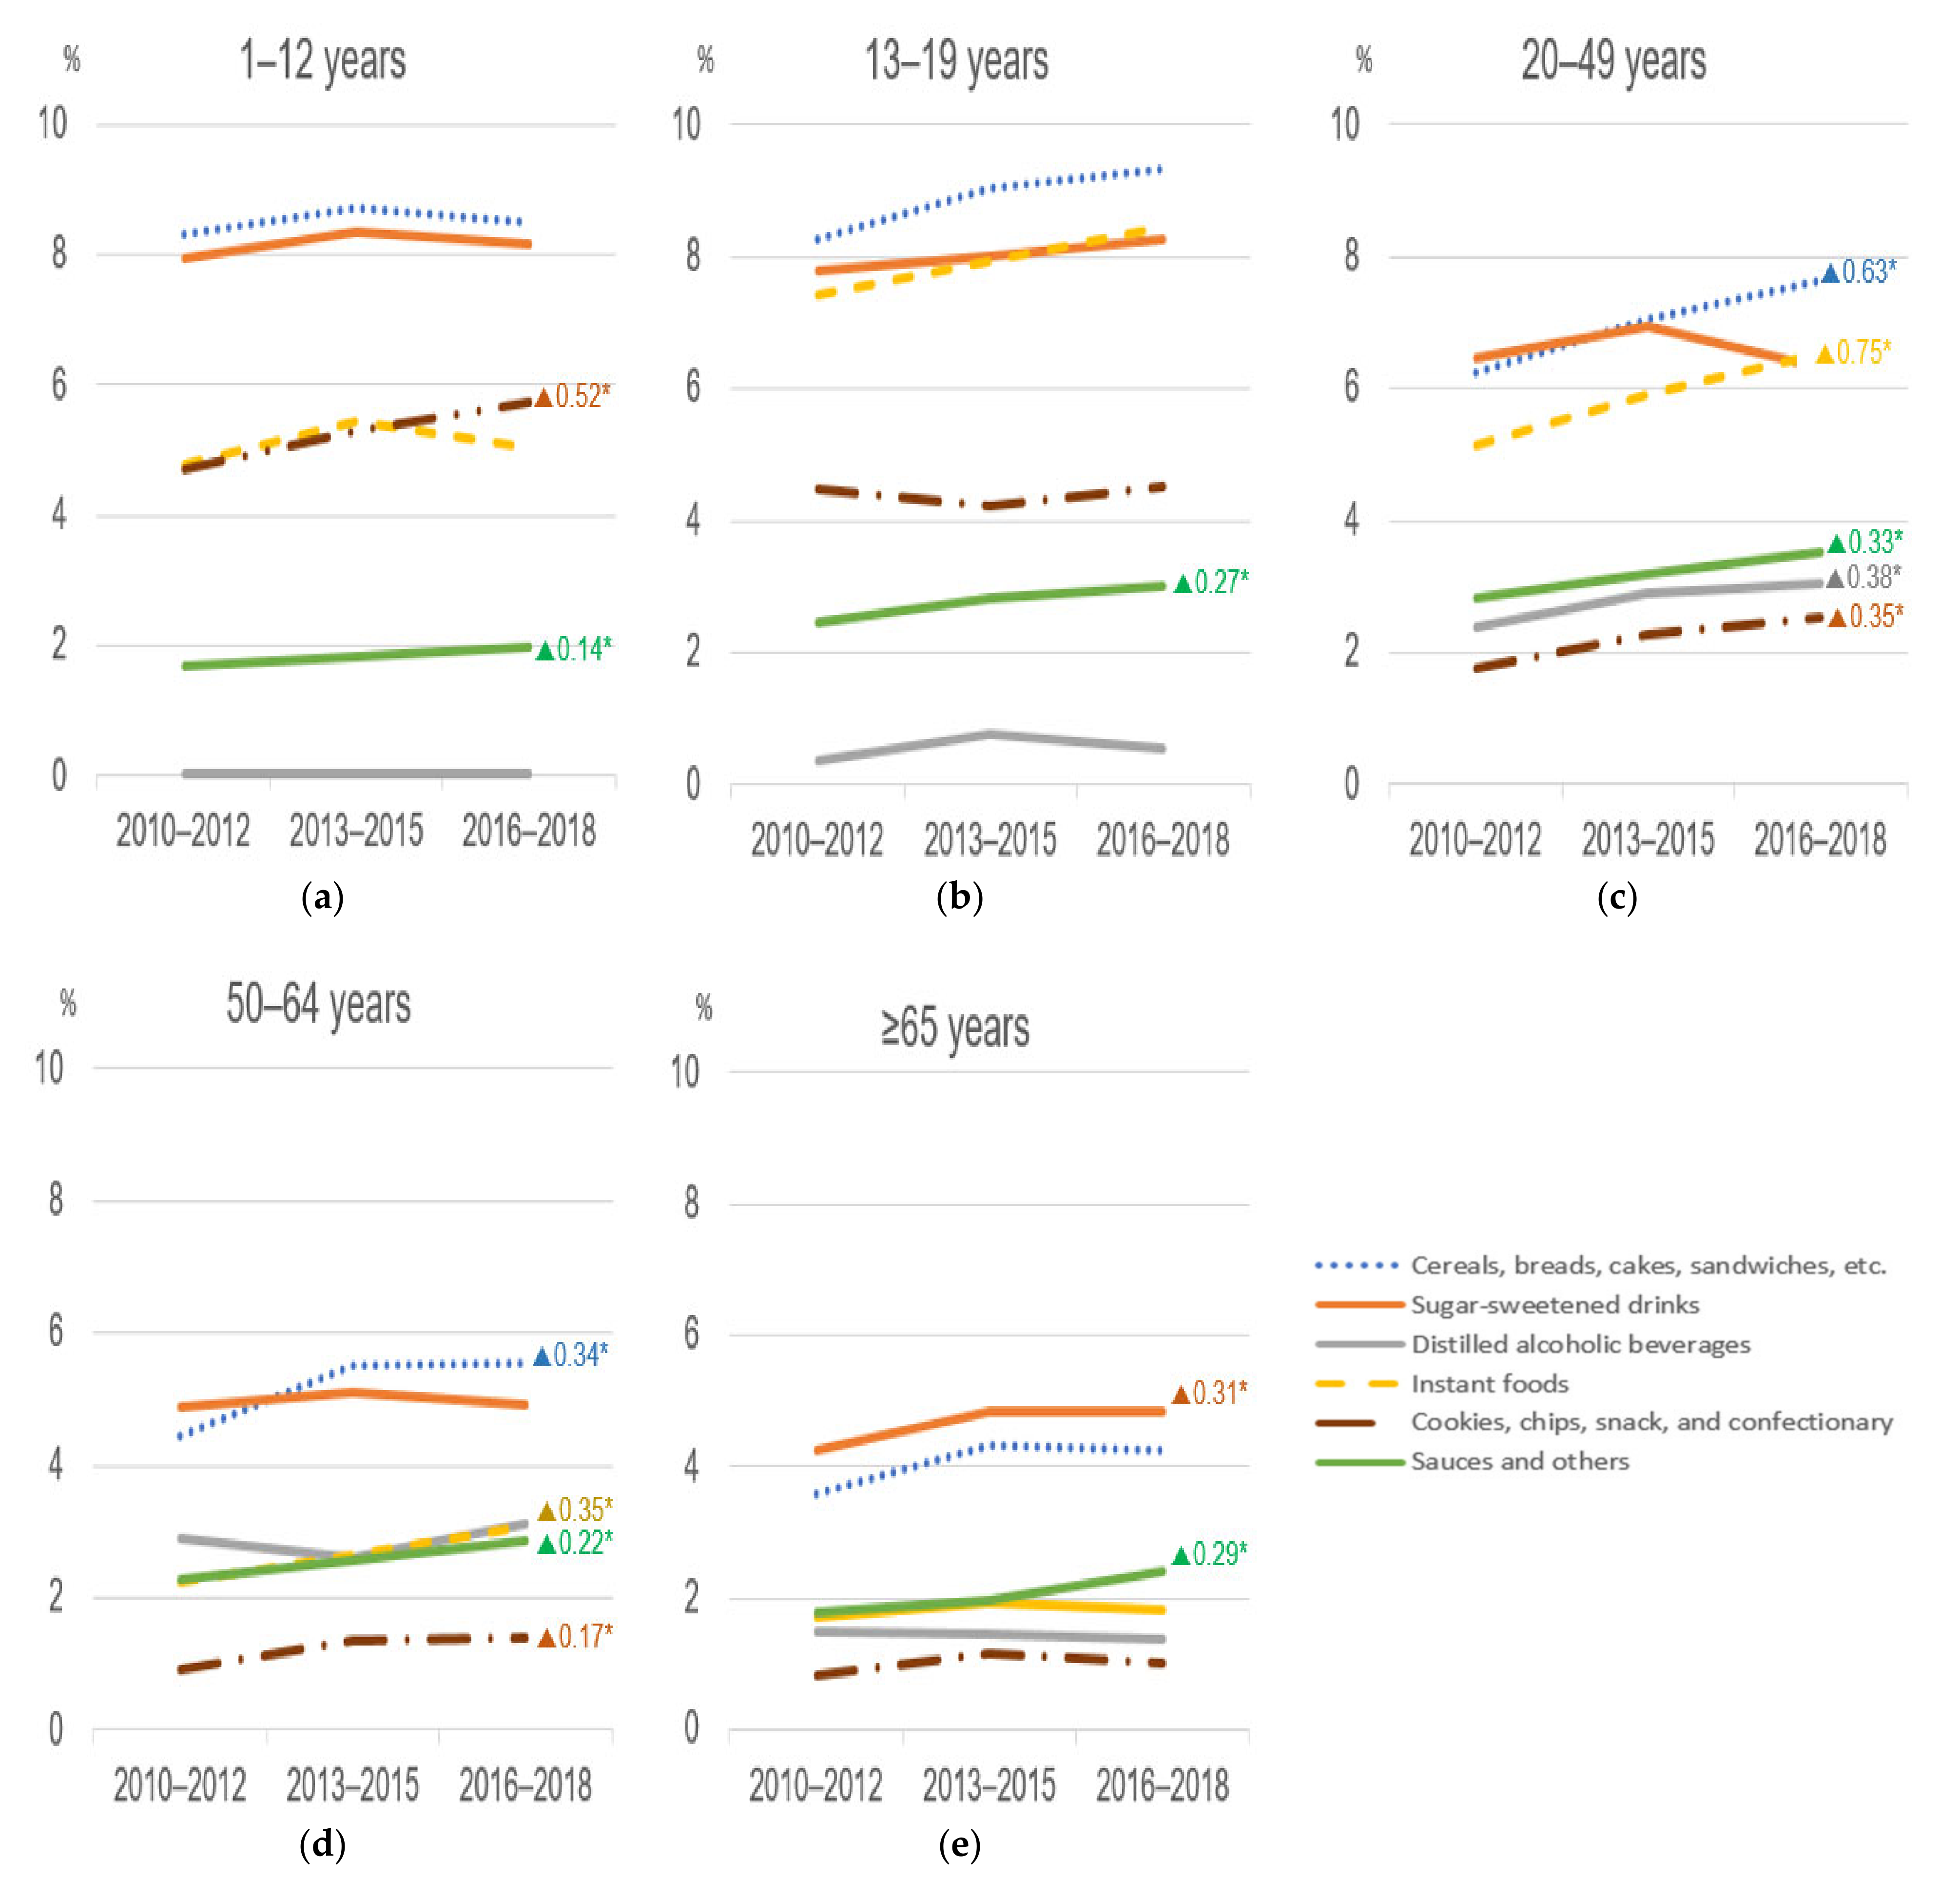
We also assessed the time changes in the dietary energy contribution of the subgroups within the ultra-processed foods group over time by age groups (Figure 2). In all age groups, a considerable portion of the dietary energy contribution of ultra-processed foods during the study period came from cereals, breads, cakes, sandwiches, and sugar-sweetened drinks, followed by instant foods. For children, a statistically significant increasing trend was found in the consumption of cookies, chips, snacks, and confectionary (+0.52% per cycle, p = 0.0003) and sauces and others (+0.14% per cycle, p = 0.001). For adolescents, the same significant trend was observed in the consumption of sauces and others (+0.27% per cycle, p = 0.001). Adults aged 20–49 years who showed the largest change during the study period over time had noticeably increasing trends in almost all ultra-processed food subgroups, ranging from +0.33% per cycle (in sauces and others, 2.8% in 2010–2012 to 3.5% in 2016–2018, p = 0.0001) to +0.75% per cycle (in instant foods, 5.1% in 2010–2012 to 6.6% in 2016–2018, p < 0.0001), except sugar-sweetened drinks. A similar linear trend (except sugar-sweetened drinks and distilled alcoholic beverages) was found for adults aged 50–64 years. Elderly people aged 65 years or older, although consuming less ultra-processed foods compared to the other age groups, showed a slight but significant increasing change in some subgroups, including sugar-sweetened drinks and sauces and others. For sugar-sweetened drinks, the consumption pattern differed slightly by age group (Table S2). Children and adolescents received more energy from sweetened milk and its products, soft drinks, and fruit and vegetable drinks, while adults and elderly people consumed more energy from coffee and tea with added sugar.
4. Discussion
This study investigated the association between socioeconomic characteristics and ultra-processed food consumption, and evaluated the change of the consumption of these foods in the past decade in Korea using the representative data from the KNHANES (2010–2018). The consumption of ultra-processed foods in Korea was higher among men, those living in urban areas, highly educated individuals, those with a high income, and younger individuals. Such associations remained significant even after adjustment for the other variables, but not in the case of income level. The contribution of ultra-processed foods to total energy intake gradually increased from 23.1% (2010–2012) to 26.1% (2016–2018), with +1.52% per cycle (p < 0.0001). The increasing trend over time was significantly found in all socioeconomic strata. A noticeable increasing trend was observed in adults aged 20–49 years, and foods with increased intake slightly differed by age groups.
In our study, men consumed more energy from ultra-processed foods than women, which is consistent with previous studies [3,10,25,42]. This seems to be because of differences between men and women in eating habits, nutritional behaviors, and health convictions [43]. However, in some studies conducted in Mexico [31], Chile [32], and Columbia [19], no significant difference in ultra-processed food consumption between sexes was found. Perhaps, the degree and pattern of sexual disparity in dietary consumption is likely to be different between high-income and low- or middle-income countries.
A notable negative association between age and ultra-processed food consumption has been consistently found in almost all previous studies [3,10,16,19,25,31,32,42,44,45]. Interestingly, the magnitude of the gap of ultra-processed food consumption between age groups seems to vary slightly by the country’s income level. In high-income countries such as the United States [16] and Canada [3], the energy contribution of the ultra-processed food consumption of children and adolescents was approximately one-third higher than older people (United States: 66.8% in adolescents and 52.8% in adults aged ≥60; Canada: 55.1% children and adolescents and 42.6% in adults aged ≥65 years), whereas the ultra-processed food consumption of children and adolescents of Chile [32] and Columbia [19] was almost twice as high as that of older people (Chile: 37.6% in children and adolescents and 17.4% in adults aged ≥65 years; Columbia: 18.5% in adolescents and 11.8% in adults aged ≥50 years). In our study, the dietary energy contribution of ultra-processed food was the highest in adolescents (32.6%, 734.9 kcal) and their consumption of ultra-processed food was two times more (in contribution of total energy intake, nearly three times in calories) than that of elderly people aged ≥65 years (15.1%, 262.2 kcal). Generally, younger people, including children and adolescents, are vulnerable to ultra-processed food consumption. There are several possible explanations for this [45,46]: Younger people prefer these foods and they pursue new food products and a new lifestyle. They also seem to respond more sensitively to food marketing and advertising. The relatively lower time, energy, and skill required for the preparation of meals may lead to the consumption of ultra-processed foods.
Socioeconomic status and residence area have also been shown to be significant factors associated with ultra-processed food consumption. According to previous studies, even the tendency of these associations varies by a country’s income level. In high-income countries [3,9,16,25], rural residents, less educated individuals, and those with low income consumed more ultra-processed foods than their counterparts. Contrary to this, in middle- and low-income countries [19,31,32,45,47,48], living in an urban area and high socioeconomic status (i.e., high education and high income) was strongly associated with higher consumption of ultra-processed foods. This can be attributed to differences in food price, affordability, and accessibility to those foods between countries [20,21,49]. Ultra-processed foods are relatively cheap in high-income countries, thus those foods seem appealing to poor individuals in those countries. However, in middle- or low-income countries, ultra-processed foods still cost more than natural foods, and the poor continue to choose to prepare their meals with relatively low-priced natural foods [49]. In addition, modern grocery retailers such as supermarkets, hypermarkets, and convenience stores, which have a considerable market share of ultra-processed foods, generally tend to spread from major cities to small localities, targeting wealthier individuals at first, and then poorer urban and rural residents [21]. In the rural areas of middle- or low-income countries, modern grocery retail channels are not prevalent yet, and thus rural residents may have less exposure to ultra-processed foods.
On the whole, Korea seems to exhibit unique characteristics regarding the consumption of ultra-processed foods and associations with socioeconomic status. Korea is a high income country, but the dietary energy contribution of ultra-processed foods is relatively low, close to that of middle- or low-income countries [3,10,16,17,18,19,31,32,45,50]. Our study showed that urban residents and highly educated individuals consume more ultra-processed foods. However, Korean society has been changing at a rapid speed (i.e., increases in single-person households and women working outside the home) [51]. Along with this, individual food preferences have changed toward the pursuit of taste and convenience, with household expenditures on fresh foods steadily decreasing and the convenience food industry expanding rapidly [52]. Moreover, Korea is also facing the considerable market power of transnational food and beverage corporations targeting Asian markets, which may result in a nutrition transition [20]. Similar to the findings observed in other countries [22,23,24,27], the current study found an increasing trend in the consumption of ultra-processed foods in Korea over the past decade (2010–2018), and this trend was significant across all socioeconomic strata [49].
Growing evidence has accumulated that the consumption of ultra-processed foods has positive associations with metabolic health [7,13,53,54,55,56,57,58,59] such as obesity, hypertension, dyslipidemia, and diabetes, cardiovascular diseases [12,14], cancer [60,61], and mortality [9,62,63]. The adverse impacts of ultra-processed foods on human health have been explained by the poor nutrient profile of these foods [3,17], the low dietary quality [3,4,11,33] associated with the consumption of these foods, and the addictive eating behaviors induced by these foods, which may lead to overconsumption [7,64]. The consumption of ultra-processed foods has also been found to have positive relationships with an unhealthy lifestyle [4,7,9,10,11]. Moreover, ultra-processed foods contain various types of food constituents that are created in the process of producing, processing, and packaging food: cosmetic additives (such as preservatives, emulsifiers, sweeteners, etc.); contaminants neoformed in processing (such as acrylamide and acrolein); trace chemicals from food packaging materials (such as Bisphenol A and phthalates) [65,66,67,68]. Recently, evidence has emerged that these food constituents can reduce the diversity of the gut microbiota, alter the interactions of the host microbiota, and thus contribute to the development of metabolic syndrome and inflammatory diseases [65,66,69] which require consistent attention.
To the best of our knowledge, this is the first study to evaluate the time trends in the ultra-processed food consumption of Koreans and to investigate the association with socioeconomic characteristics. We used the data from KNHANES, which is a nationally representative survey. This survey is conducted throughout the year and the diet recall days are distributed from Monday to Sunday; thus, unbiased statistics of a specific season or day can be obtained. Generally, the food purchase records collected from a household’s food expenditure survey do not include food consumed outside the home or food wastage in the home, and therefore cannot reflect accurate dietary intake [22,23,55]. The dietary data we analyzed were the most up-to-date, as the dietary consumption data were collected at the individual level [37]. Thus, we were able to evaluate the findings on the consumption of each individual. Raw dietary data included information on the composition of ingredients of dishes and the amount consumed per each ingredients [41]. Thus, we were able to use the disaggregated food information of freshly prepared meals. In addition, the NOVA food classification system we utilized for the identification of ultra-processed foods is widely used for classifying foods based on the nature, extent, and purpose of industrial food processing [1,70].
Despite these strengths, there are limitations that should be considered. First, the dietary data used in the study were assessed by a one-day 24 h recall, which was not able to reflect the usual intake of the population. However, one-day recall is sufficiently acceptable when used for estimating the average intake of a population, rather than for individuals’ usual intake [71]. Second, although dietary assessment was performed according to a predefined standardized protocol [37,39], 24 h recalls are subjective to measurement errors, especially with distorted self-reports of dietary intake [72]. On the whole, unhealthy foods are more likely to be underreported due to social desirability bias [73], leading to an underestimation of ultra-processed food consumption. Third, KNHANES has collected a considerable amount of information (such as information for dishes prepared at or outside the home, detailed composition of ingredients, and more specific descriptions of each ingredient), which the Food and Agriculture Organization of the United Nations provides guidance for in terms of collecting information on food processing through food consumption surveys [74]. However, KNHANES was not designed to assess food consumption classified by degree of food processing, and thus some of the descriptions were not sufficient to categorize foods according to the NOVA system. Moreover, some convenient foods (i.e., ready-to-eat soybean paste stew) could have been classified as dishes (prepared at home or outside the home), likely underestimating consumption of ultra-processed foods in Koreans.
5. Conclusions
This study showed that ultra-processed food consumption in Korea in the period of 2010–2018 was higher among men, younger individuals, urban residents, and more educated people, and gradually increased during the last decade. Although the contribution of ultra-processed food consumption varies by socioeconomic characteristics, an increasing trend was consistently found in all sociodemographic strata. Food consumption is influenced by food supply chains, food environments, policy and regulatory frameworks, in addition to individuals’ behavior [21]. Our results suggest that strategies to decrease the consumption of ultra-processed foods and to promote a healthy diet among the Korean population should be sought. Given the consistently increasing consumption of ultra-processed foods in all socioeconomic groups, strategies for the entire population are required. Furthermore, given the differences across socioeconomic subgroups, different approaches for vulnerable groups are necessary. As such, further studies are needed to identify the drivers that induce the purchase and consumption of ultra-processed food, and to help us understand the barriers preventing us from controlling the consumption of these foods.
Supplementary Materials
The following are available online at https://www.mdpi.com/article/10.3390/nu13041120/s1, Table S1, Dietary energy intake according to the NOVA food groups (Korea National Health and Nutrition Examination Survey (KNHANES) from 2010 to 2018), Table S2: Consumption of ultra-processed foods and subgroups by age groups (KNHANES from 2010 to 2018).
Author Contributions
Conceptualization, J.-S.S. and H.C.K.; methodology, J.-S.S., S.-Y.S. and H.-J.C.; data analysis and interpretation, J.-S.S. and J.K.; writing—original draft preparation, J.-S.S.; writing—review and editing, J.-S.S., J.K. and H.C.K.; supervision, J.-S.S.; project administration, J.-S.S.; funding acquisition. All authors have read and agreed to the published version of the manuscript.
Funding
This work was supported by the National Research Foundation of Korea (NRF-2020R1I1A1A01064904).
Institutional Review Board Statement
This study was approved by the Institutional Review Board of Yonsei University Health System (IRB No. 2020-1484-002 and 2 July 2020).
Informed Consent Statement
Informed consent was obtained from all subjects involved in the study.
Data Availability Statement
Data were obtained from the Korea National Health and Nutrition Examination Survey (KNHANES) and are available online at the KNHANES website (https://knhanes.cdc.go.kr, accessed on 20 February 2020).
Conflicts of Interest
The authors declare no conflict of interest.
References
- Monteiro, C.A.; Cannon, G.; Levy, R.B.; Moubarac, J.C.; Louzada, M.L.; Rauber, F.; Khandpur, N.; Cediel, G.; Neri, D.; Martinez-Steele, E.; et al. Ultra-processed foods: What they are and how to identify them. Public Health Nutr. 2019, 22, 936–941. [Google Scholar] [CrossRef]
- Moodie, R.; Stuckler, D.; Monteiro, C.; Sheron, N.; Neal, B.; Thamarangsi, T.; Lincoln, P.; Casswell, S. Profits and pandemics: Prevention of harmful effects of tobacco, alcohol, and ultra-processed food and drink industries. Lancet 2013, 381, 670–679. [Google Scholar] [CrossRef]
- Moubarac, J.C.; Batal, M.; Louzada, M.L.; Martinez Steele, E.; Monteiro, C.A. Consumption of ultra-processed foods predicts diet quality in Canada. Appetite 2017, 108, 512–520. [Google Scholar] [CrossRef]
- Louzada, M.; Ricardo, C.Z.; Steele, E.M.; Levy, R.B.; Cannon, G.; Monteiro, C.A. The share of ultra-processed foods determines the overall nutritional quality of diets in Brazil. Public Health Nutr. 2018, 21, 94–102. [Google Scholar] [CrossRef] [PubMed] [Green Version]
- Fardet, A. Minimally processed foods are more satiating and less hyperglycemic than ultra-processed foods: A preliminary study with 98 ready-to-eat foods. Food Funct. 2016, 7, 2338–2346. [Google Scholar] [CrossRef] [PubMed]
- Laster, J.; Frame, L.A. Beyond the Calories-Is the Problem in the Processing? Curr. Treat. Options Gastroenterol. 2019, 17, 577–586. [Google Scholar] [CrossRef]
- Poti, J.M.; Braga, B.; Qin, B. Ultra-processed Food Intake and Obesity: What Really Matters for Health-Processing or Nutrient Content? Curr. Obes. Rep. 2017, 6, 420–431. [Google Scholar] [CrossRef]
- Monteiro, C.A.; Cannon, G.; Moubarac, J.C.; Levy, R.B.; Louzada, M.L.C.; Jaime, P.C. The UN Decade of Nutrition, the NOVA food classification and the trouble with ultra-processing. Public Health Nutr. 2018, 21, 5–17. [Google Scholar] [CrossRef] [Green Version]
- Schnabel, L.; Kesse-Guyot, E.; Alles, B.; Touvier, M.; Srour, B.; Hercberg, S.; Buscail, C.; Julia, C. Association Between Ultraprocessed Food Consumption and Risk of Mortality Among Middle-aged Adults in France. JAMA Intern. Med. 2019, 179, 490–498. [Google Scholar] [CrossRef]
- Julia, C.; Martinez, L.; Allès, B.; Touvier, M.; Hercberg, S.; Méjean, C.; Kesse-Guyot, E. Contribution of ultra-processed foods in the diet of adults from the French NutriNet-Santé study. Public Health Nutr. 2018, 21, 27–37. [Google Scholar] [CrossRef] [PubMed] [Green Version]
- Martínez Steele, E.; Popkin, B.M.; Swinburn, B.; Monteiro, C.A. The share of ultra-processed foods and the overall nutritional quality of diets in the US: Evidence from a nationally representative cross-sectional study. Popul. Health Metr. 2017, 15, 6. [Google Scholar] [CrossRef] [Green Version]
- Elizabeth, L.; Machado, P.; Zinöcker, M.; Baker, P.; Lawrence, M. Ultra-Processed Foods and Health Outcomes: A Narrative Review. Nutrients 2020, 12, 1955. [Google Scholar] [CrossRef]
- Srour, B.; Fezeu, L.K.; Kesse-Guyot, E.; Alles, B.; Debras, C.; Druesne-Pecollo, N.; Chazelas, E.; Deschasaux, M.; Hercberg, S.; Galan, P.; et al. Ultraprocessed Food Consumption and Risk of Type 2 Diabetes Among Participants of the NutriNet-Sante Prospective Cohort. JAMA Intern. Med. 2019, 180, 283–291. [Google Scholar] [CrossRef]
- Srour, B.; Fezeu, L.K.; Kesse-Guyot, E.; Allès, B.; Méjean, C.; Andrianasolo, R.M.; Chazelas, E.; Deschasaux, M.; Hercberg, S.; Galan, P.; et al. Ultra-processed food intake and risk of cardiovascular disease: Prospective cohort study (NutriNet-Santé). BMJ 2019, 365, l1451. [Google Scholar] [CrossRef] [Green Version]
- Vandevijvere, S.; Jaacks, L.M.; Monteiro, C.A.; Moubarac, J.C.; Girling-Butcher, M.; Lee, A.C.; Pan, A.; Bentham, J.; Swinburn, B. Global trends in ultraprocessed food and drink product sales and their association with adult body mass index trajectories. Obes. Rev. 2019, 20 (Suppl. S2), 10–19. [Google Scholar] [CrossRef]
- Baraldi, L.G.; Martinez Steele, E.; Canella, D.S.; Monteiro, C.A. Consumption of ultra-processed foods and associated sociodemographic factors in the USA between 2007 and 2012: Evidence from a nationally representative cross-sectional study. BMJ Open 2018, 8, e020574. [Google Scholar] [CrossRef] [Green Version]
- Rauber, F.; da Costa Louzada, M.L.; Steele, E.M.; Millett, C.; Monteiro, C.A.; Levy, R.B. Ultra-Processed Food Consumption and Chronic Non-Communicable Diseases-Related Dietary Nutrient Profile in the UK (2008–2014). Nutrients 2018, 10, 587. [Google Scholar] [CrossRef] [PubMed] [Green Version]
- Marrón-Ponce, J.A.; Flores, M.; Cediel, G.; Monteiro, C.A.; Batis, C. Associations between Consumption of Ultra-Processed Foods and Intake of Nutrients Related to Chronic Non-Communicable Diseases in Mexico. J. Acad. Nutr. Diet. 2019, 119, 1852–1865. [Google Scholar] [CrossRef] [PubMed]
- Khandpur, N.; Cediel, G.; Obando, D.A.; Jaime, P.C.; Parra, D.C. Sociodemographic factors associated with the consumption of ultra-processed foods in Colombia. Rev. Saude Publica 2020, 54, 19. [Google Scholar] [CrossRef] [PubMed] [Green Version]
- Baker, P.; Friel, S. Food systems transformations, ultra-processed food markets and the nutrition transition in Asia. Glob. Health 2016, 12, 80. [Google Scholar] [CrossRef] [Green Version]
- Baker, P.; Machado, P.; Santos, T.; Sievert, K.; Backholer, K.; Hadjikakou, M.; Russell, C.; Huse, O.; Bell, C.; Scrinis, G.; et al. Ultra-processed foods and the nutrition transition: Global, regional and national trends, food systems transformations and political economy drivers. Obes. Rev. 2020, 21, e13126. [Google Scholar] [CrossRef]
- Marrón-Ponce, J.A.; Tolentino-Mayo, L.; Hernández, F.M.; Batis, C. Trends in Ultra-Processed Food Purchases from 1984 to 2016 in Mexican Households. Nutrients 2018, 11, 45. [Google Scholar] [CrossRef] [Green Version]
- Moubarac, J.C.; Batal, M.; Martins, A.P.; Claro, R.; Levy, R.B.; Cannon, G.; Monteiro, C. Processed and ultra-processed food products: Consumption trends in Canada from 1938 to 2011. Can. J. Diet. Pract. Res. 2014, 75, 15–21. [Google Scholar] [CrossRef] [PubMed]
- Latasa, P.; Louzada, M.; Martinez Steele, E.; Monteiro, C.A. Added sugars and ultra-processed foods in Spanish households (1990–2010). Eur. J. Clin. Nutr. 2018, 72, 1404–1412. [Google Scholar] [CrossRef] [PubMed] [Green Version]
- Djupegot, I.L.; Nenseth, C.B.; Bere, E.; Bjørnarå, H.B.T.; Helland, S.H.; Øverby, N.C.; Torstveit, M.K.; Stea, T.H. The association between time scarcity, sociodemographic correlates and consumption of ultra-processed foods among parents in Norway: A cross-sectional study. BMC Public Health 2017, 17, 447. [Google Scholar] [CrossRef]
- Monteiro, C.A.; Moubarac, J.C.; Cannon, G.; Ng, S.W.; Popkin, B. Ultra-processed products are becoming dominant in the global food system. Obes. Rev. 2013, 14 (Suppl. S2), 21–28. [Google Scholar] [CrossRef]
- Martins, A.P.; Levy, R.B.; Claro, R.M.; Moubarac, J.C.; Monteiro, C.A. Increased contribution of ultra-processed food products in the Brazilian diet (1987–2009). Rev. Saude Publica 2013, 47, 656–665. [Google Scholar] [CrossRef]
- James, P.; Seward, M.W.; O’Malley, A.J.; Subramanian, S.V.; Block, J.P. Changes in the food environment over time: Examining 40 years of data in the Framingham Heart Study. Int. J. Behav. Nutr. Phys. Act. 2017, 14, 84. [Google Scholar] [CrossRef] [PubMed] [Green Version]
- Larson, N.I.; Neumark-Sztainer, D.R.; Story, M.T.; Wall, M.M.; Harnack, L.J.; Eisenberg, M.E. Fast food intake: Longitudinal trends during the transition to young adulthood and correlates of intake. J. Adolesc. Health 2008, 43, 79–86. [Google Scholar] [CrossRef]
- Deshmukh-Taskar, P.; Nicklas, T.A.; Yang, S.J.; Berenson, G.S. Does food group consumption vary by differences in socioeconomic, demographic, and lifestyle factors in young adults? The Bogalusa Heart Study. J. Am. Diet. Assoc. 2007, 107, 223–234. [Google Scholar] [CrossRef] [Green Version]
- Marrón-Ponce, J.A.; Sánchez-Pimienta, T.G.; Louzada, M.; Batis, C. Energy contribution of NOVA food groups and sociodemographic determinants of ultra-processed food consumption in the Mexican population. Public Health Nutr. 2018, 21, 87–93. [Google Scholar] [CrossRef] [Green Version]
- Cediel, G.; Reyes, M.; da Costa Louzada, M.L.; Martinez Steele, E.; Monteiro, C.A.; Corvalán, C.; Uauy, R. Ultra-processed foods and added sugars in the Chilean diet (2010). Public Health Nutr. 2018, 21, 125–133. [Google Scholar] [CrossRef] [Green Version]
- Shim, J.S.; Shim, S.Y.; Cha, H.J.; Kim, J.; Kim, H.C. Association between Ultra-Processed Food Consumption and Dietary Intake and Diet Quality in Korean Adults. J. Acad. Nutr. Diet. 2021. (Article is under review). [Google Scholar]
- Lee, H.S.; Duffey, K.J.; Popkin, B.M. South Korea’s entry to the global food economy: Shifts in consumption of food between 1998 and 2009. Asia Pac. J. Clin. Nutr. 2012, 21, 618–629. [Google Scholar] [PubMed]
- Kim, S.; Moon, S.; Popkin, B.M. The nutrition transition in South Korea. Am. J. Clin. Nutr. 2000, 71, 44–53. [Google Scholar] [CrossRef] [PubMed] [Green Version]
- Singh, G.M.; Micha, R.; Khatibzadeh, S.; Lim, S.; Ezzati, M.; Mozaffarian, D. Estimated Global, Regional, and National Disease Burdens Related to Sugar-Sweetened Beverage Consumption in 2010. Circulation 2015, 132, 639–666. [Google Scholar] [CrossRef] [Green Version]
- Kweon, S.; Kim, Y.; Jang, M.J.; Kim, Y.; Kim, K.; Choi, S.; Chun, C.; Khang, Y.H.; Oh, K. Data resource profile: The Korea National Health and Nutrition Examination Survey (KNHANES). Int. J. Epidemiol. 2014, 43, 69–77. [Google Scholar] [CrossRef] [PubMed] [Green Version]
- Korea Centers for Disease Control and Prevention. Korea Health Statistics 2018: Korea National Health and Nutrition Examination Survey (KNHANES-VII-3); Korea Centers for Disease Control and Prevention: Chungju City, Korea, 2019.
- Ministry of Health and Welfare; Korea Centers for Disease Control and Prevention. Guidelines for Nutrition Survey: Korea National Health and Nutrition Examination Survey 6th (2013–2015); Ministry of Health and Welfare: Sejong, Korea; Korea Centers for Disease Control and Prevention: Chungju City, Korea, 2015.
- National Institute of Agricultural Sciences. Korean Food Composition Table (Version 9.1); National Institute of Agricultural Sciences: Wanju-gun, Korea, 2019. [Google Scholar]
- Korea Centers for Disease Control and Prevention. 2016–2018 Guidelbook for Using the Data from Korea National Health and Nutrition Examination Survey; Korea Centers for Disease Control and Prevention: Chungju City, Korea, 2020.
- Adams, J.; White, M. Characterisation of UK diets according to degree of food processing and associations with socio-demographics and obesity: Cross-sectional analysis of UK National Diet and Nutrition Survey (2008–2012). Int. J. Behav. Nutr. Phys. Act. 2015, 12, 160. [Google Scholar] [CrossRef] [Green Version]
- Grzymisławska, M.; Puch, E.A.; Zawada, A.; Grzymisławski, M. Do nutritional behaviors depend on biological sex and cultural gender? Adv. Clin. Exp. Med. 2020, 29, 165–172. [Google Scholar] [CrossRef] [Green Version]
- Setyowati, D.; Andarwulan, N.; Giriwono, P.E. Processed and ultraprocessed food consumption pattern in the Jakarta Individual Food Consumption Survey 2014. Asia Pac. J. Clin. Nutr. 2018, 27, 840–847. [Google Scholar] [CrossRef]
- Ozcariz, S.G.I.; Pudla, K.J.; Martins, A.P.B.; Peres, M.A.; González-Chica, D.A. Sociodemographic disparities in the consumption of ultra-processed food and drink products in Southern Brazil: A population-based study. J. Public Health 2019, 27, 649–658. [Google Scholar] [CrossRef]
- Sadeghirad, B.; Duhaney, T.; Motaghipisheh, S.; Campbell, N.R.; Johnston, B.C. Influence of unhealthy food and beverage marketing on children’s dietary intake and preference: A systematic review and meta-analysis of randomized trials. Obes. Rev. 2016, 17, 945–959. [Google Scholar] [CrossRef]
- Silva, M.A.; Milagres, L.C.; Castro, A.P.P.; Filgueiras, M.S.; Rocha, N.P.; Hermsdorff, H.H.M.; Longo, G.Z.; Novaes, J.F. The consumption of ultra-processed products is associated with the best socioeconomic level of the children’s families. Cien. Saude Colet. 2019, 24, 4053–4060. [Google Scholar] [CrossRef] [PubMed] [Green Version]
- Simões, B.D.S.; Barreto, S.M.; Molina, M.; Luft, V.C.; Duncan, B.B.; Schmidt, M.I.; Benseñor, I.J.M.; Cardoso, L.O.; Levy, R.B.; Giatti, L. Consumption of ultra-processed foods and socioeconomic position: A cross-sectional analysis of the Brazilian Longitudinal Study of Adult Health (ELSA-Brasil). Cad. Saude Publica 2018, 34, e00019717. [Google Scholar] [CrossRef] [Green Version]
- Zagorsky, J.L.; Smith, P.K. The association between socioeconomic status and adult fast-food consumption in the U.S. Econ. Hum. Biol. 2017, 27, 12–25. [Google Scholar] [CrossRef]
- Machado, P.P.; Steele, E.M.; Levy, R.B.; Sui, Z.; Rangan, A.; Woods, J.; Gill, T.; Scrinis, G.; Monteiro, C.A. Ultra-processed foods and recommended intake levels of nutrients linked to non-communicable diseases in Australia: Evidence from a nationally representative cross-sectional study. BMJ Open 2019, 9, e029544. [Google Scholar] [CrossRef] [Green Version]
- Statistics Korea. Statics by Theme. Available online: https://kosis.kr/eng/ (accessed on 28 January 2021).
- Kim, S. Changes in Food Consumption in Korea; Food and Fertilizer Technology Center: Taipei, Taiwan, 2018. [Google Scholar]
- Mendonça, R.D.; Lopes, A.C.; Pimenta, A.M.; Gea, A.; Martinez-Gonzalez, M.A.; Bes-Rastrollo, M. Ultra-Processed Food Consumption and the Incidence of Hypertension in a Mediterranean Cohort: The Seguimiento Universidad de Navarra Project. Am. J. Hypertens. 2017, 30, 358–366. [Google Scholar] [CrossRef] [PubMed] [Green Version]
- Juul, F.; Martinez-Steele, E.; Parekh, N.; Monteiro, C.A.; Chang, V.W. Ultra-processed food consumption and excess weight among US adults. Br. J. Nutr. 2018, 120, 90–100. [Google Scholar] [CrossRef] [PubMed] [Green Version]
- Monteiro, C.A.; Moubarac, J.C.; Levy, R.B.; Canella, D.S.; Louzada, M.; Cannon, G. Household availability of ultra-processed foods and obesity in nineteen European countries. Public Health Nutr. 2018, 21, 18–26. [Google Scholar] [CrossRef] [PubMed] [Green Version]
- Nardocci, M.; Polsky, J.Y.; Moubarac, J.C. Consumption of ultra-processed foods is associated with obesity, diabetes and hypertension in Canadian adults. Can. J. Public Health 2020, 1–9. [Google Scholar] [CrossRef]
- Sandoval-Insausti, H.; Jiménez-Onsurbe, M.; Donat-Vargas, C.; Rey-García, J.; Banegas, J.R.; Rodríguez-Artalejo, F.; Guallar-Castillón, P. Ultra-Processed Food Consumption Is Associated with Abdominal Obesity: A Prospective Cohort Study in Older Adults. Nutrients 2020, 12, 2368. [Google Scholar] [CrossRef]
- Costa de Miranda, R.; Rauber, F.; Levy, R.B. Impact of ultra-processed food consumption on metabolic health. Curr. Opin. Lipidol. 2021, 32, 24–37. [Google Scholar] [CrossRef]
- Scaranni, P.; Cardoso, L.O.; Chor, D.; Melo, E.C.P.; Matos, S.M.A.; Giatti, L.; Barreto, S.M.; Fonseca, M. Ultra-processed foods, changes in blood pressure, and incidence of hypertension: Results of Brazilian Longitudinal Study of Adult Health (ELSA-Brasil). Public Health Nutr. 2021, 1–22. [Google Scholar] [CrossRef]
- Fiolet, T.; Srour, B.; Sellem, L.; Kesse-Guyot, E.; Allès, B.; Méjean, C.; Deschasaux, M.; Fassier, P.; Latino-Martel, P.; Beslay, M.; et al. Consumption of ultra-processed foods and cancer risk: Results from NutriNet-Santé prospective cohort. BMJ 2018, 360, k322. [Google Scholar] [CrossRef] [PubMed] [Green Version]
- Gourd, E. Ultra-processed foods might increase cancer risk. Lancet Oncol. 2018, 19, e186. [Google Scholar] [CrossRef]
- Bonaccio, M.; Di Castelnuovo, A.; Costanzo, S.; De Curtis, A.; Persichillo, M.; Sofi, F.; Cerletti, C.; Donati, M.B.; de Gaetano, G.; Iacoviello, L. Ultra-processed food consumption is associated with increased risk of all-cause and cardiovascular mortality in the Moli-sani Study. Am. J. Clin. Nutr. 2021, 113, 446–455. [Google Scholar] [CrossRef]
- Zhong, G.C.; Gu, H.T.; Peng, Y.; Wang, K.; Wu, Y.Q.; Hu, T.Y.; Jing, F.C.; Hao, F.B. Association of ultra-processed food consumption with cardiovascular mortality in the US population: Long-term results from a large prospective multicenter study. Int. J. Behav. Nutr. Phys. Act. 2021, 18, 21. [Google Scholar] [CrossRef]
- Schulte, E.M.; Avena, N.M.; Gearhardt, A.N. Which foods may be addictive? The roles of processing, fat content, and glycemic load. PLoS ONE 2015, 10, e0117959. [Google Scholar] [CrossRef] [PubMed]
- Partridge, D.; Lloyd, K.A.; Rhodes, J.M.; Walker, A.W.; Johnstone, A.M.; Campbell, B.J. Food additives: Assessing the impact of exposure to permitted emulsifiers on bowel and metabolic health-introducing the FADiets study. Nutr. Bull. 2019, 44, 329–349. [Google Scholar] [CrossRef] [Green Version]
- Roca-Saavedra, P.; Mendez-Vilabrille, V.; Miranda, J.M.; Nebot, C.; Cardelle-Cobas, A.; Franco, C.M.; Cepeda, A. Food additives, contaminants and other minor components: Effects on human gut microbiota-a review. J. Physiol. Biochem. 2018, 74, 69–83. [Google Scholar] [CrossRef] [PubMed]
- Martínez Steele, E.; Khandpur, N.; da Costa Louzada, M.L.; Monteiro, C.A. Association between dietary contribution of ultra-processed foods and urinary concentrations of phthalates and bisphenol in a nationally representative sample of the US population aged 6 years and older. PLoS ONE 2020, 15, e0236738. [Google Scholar] [CrossRef] [PubMed]
- Winkler, H.C.; Suter, M.; Naegeli, H. Critical review of the safety assessment of nano-structured silica additives in food. J. Nanobiotechnol. 2016, 14, 44. [Google Scholar] [CrossRef] [PubMed] [Green Version]
- Paula Neto, H.A.; Ausina, P.; Gomez, L.S.; Leandro, J.G.B.; Zancan, P.; Sola-Penna, M. Effects of Food Additives on Immune Cells As Contributors to Body Weight Gain and Immune-Mediated Metabolic Dysregulation. Front. Immunol. 2017, 8, 1478. [Google Scholar] [CrossRef] [PubMed] [Green Version]
- Food and Agriculture Organization. Ultra-Processed Foods, Diet Quality, and Health Using the NOVA Classification System; Food and Agriculture Organization: Rome, Italy, 2019. [Google Scholar]
- Shim, J.S.; Oh, K.; Kim, H.C. Dietary assessment methods in epidemiologic studies. Epidemiol. Health 2014, 36, e2014009. [Google Scholar] [CrossRef] [PubMed]
- Hébert, J.R. Social Desirability Trait: Biaser or Driver of Self-Reported Dietary Intake? J. Acad. Nutr. Diet. 2016, 116, 1895–1898. [Google Scholar] [CrossRef] [PubMed]
- Lafay, L.; Mennen, L.; Basdevant, A.; Charles, M.A.; Borys, J.M.; Eschwège, E.; Romon, M. Does energy intake underreporting involve all kinds of food or only specific food items? Results from the Fleurbaix Laventie Ville Santé (FLVS) study. Int. J. Obes. Relat. Metab. Disord. 2000, 24, 1500–1506. [Google Scholar] [CrossRef] [PubMed] [Green Version]
- Food and Agriculture Organization. Guidelines on the Collection of Information on Food Processing through Food Consumption Surveys; Food and Agriculture Organization: Rome, Italy, 2015. [Google Scholar]
Figure 1.
Dietary energy intake and energy contribution of the NOVA food groups by sociodemographic characteristics (KNHANES (Korea National Health and Nutrition Examination Survey) from 2010 to 2018).
Figure 1.
Dietary energy intake and energy contribution of the NOVA food groups by sociodemographic characteristics (KNHANES (Korea National Health and Nutrition Examination Survey) from 2010 to 2018).

Figure 2.
Time trends in the dietary energy contribution of ultra-processed foods’ subgroups by age group (KNHANES from 2010 to 2018. (a) Children aged 1–12 years, (b) adolescents aged 13–19 years, (c) adults aged 20–49 years, (d) adults aged 50–64 years, and (e) elders aged 65 years or older. “▲number*” means a statistically significant increasing change per cycle at p < 0.05 for adjusted linear trend tests. In the analyses, sex, residence area, education, and household income level were adjusted.


Table 1.
Dietary energy contribution of ultra-processed foods according to sociodemographic characteristics (KNHANES from 2010 to 2018).
Table 1.
Dietary energy contribution of ultra-processed foods according to sociodemographic characteristics (KNHANES from 2010 to 2018).
| Dietary Contribution of Ultra-Processed Foods to Total Energy Intake (%) | ||||
|---|---|---|---|---|
| Variables | Crude Mean (95% CI) | Adjusted Mean (95% CI) 1 | ||
| Sex | ||||
| Male | 25.7 | (25.5–26.1) | 25.8 | (25.5–26.1) |
| Female | 24.1 | (23.8–24.4) * | 25.0 | (24.4–25.6) * |
| Age (years) | ||||
| 1–12 | 28.9 | (28.5–29.4) | 30.7 | (30.0–31.3) |
| 13–19 | 32.6 | (31.9–33.4) | 33.8 | (32.9–34.6) |
| 20–49 | 27.7 | (27.3–28.0) | 26.6 | (26.1–27.0) |
| 50–64 | 19.6 | (19.2–19.9) | 19.7 | (19.3–20.1) |
| ≥65 | 15.1 | (14.8–15.8) * | 16.3 | (15.8–16.7) * |
| Residence | ||||
| Urban | 25.4 | (25.1–25.6) | 25.8 | (25.5–26.1) |
| Rural | 22.8 | (22.1–23.4) * | 25.0 | (24.4–25.6) * |
| Education | ||||
| Middle school or less | 23.2 | (22.8–23.5) | 23.4 | (23.0–23.8) |
| High school | 25.9 | (25.5–26.3) | 26.4 | (25.9–26.9) |
| College or higher | 26.3 | (26.0–26.7) * | 26.3 | (25.8–26.9) * |
| Household income | ||||
| Low (Q1) | 21.0 | (20.4–21.6) | 25.5 | (24.9–26.1) |
| Middle (Q2–Q3) | 25.5 | (25.2–25.8) | 25.4 | (25.0–25.8) |
| High (Q4) | 25.8 | (25.4–26.2) * | 25.3 | (24.8–25.7) |
Korean population aged one year or older (KNHANES from 2010 to 2018). 1 Adjusted for all of the other variables presented in the table. * p for linear trend <0.05.
Table 2.
Time trends in the dietary contribution of ultra-processed foods according to sociodemographic characteristics (KNHANES from 2010 and 2018).
Table 2.
Time trends in the dietary contribution of ultra-processed foods according to sociodemographic characteristics (KNHANES from 2010 and 2018).
| Dietary Contribution of Ultra-Processed Foods to Total Energy Intake (%) | Changes per Cycle | p for Trend | |||
|---|---|---|---|---|---|
| Variables | 2010–2012 | 2013–2015 | 2016–2018 | ||
| Total | 23.1 (22.7–23.5) | 25.5 (25.1–25.9) | 26.1 (25.7–26.5) | 1.52 | <0.0001 |
| Sex | |||||
| Male | 23.7 (23.2–24.2) | 26.5 (25.9–27.0) | 27.1 (26.6–27.6) | 1.72 | <0.0001 |
| Female | 22.5 (22.0–23.0) | 24.6 (24.2–25.1) | 25.2 (24.6–25.7) | 1.32 | <0.0001 |
| Age (years) | |||||
| 1–12 | 27.5 (26.7–28.3) | 29.8 (29.9–30.6) | 29.6 (28.9–30.4) | 1.06 | 0.0002 |
| 13–19 | 30.9 (29.7–32.1) | 32.9 (31.7–34.2) | 34.4 (33.1–35.6) | 1.74 | 0.0001 |
| 20–49 | 24.8 (24.3–25.4) | 28.4 (27.8–29.0) | 29.8 (29.2–30.4) | 2.47 | <0.0001 |
| 50–64 | 17.6 (17.0–18.2) | 19.8 (19.2–20.4) | 20.9 (20.3–21.5) | 1.64 | <0.0001 |
| ≥65 | 13.7 (13.1–14.3) | 15.7 (15.1–16.2) | 15.8 (15.2–16.4) | 0.98 | <0.0001 |
| Residence | |||||
| Urban | 23.7 (23.2–24.1) | 25.8 (25.4–26.3) | 26.5 (26.1–26.9) | 1.40 | <0.0001 |
| Rural | 20.7 (19.6–21.7) | 24.1 (23.1–25.2) | 24.0 (22.8–25.2) | 1.72 | <0.0001 |
| Education | |||||
| Middle school or less | 21.7 (21.2–22.2) | 24.0 (23.4–24.6) | 24.0 (23.4–24.6) | 1.18 | <0.0001 |
| High school | 24.0 (23.3–24.7) | 26.5 (25.8–27.3) | 27.3 (26.6–28.0) | 1.67 | <0.0001 |
| College or higher | 24.4 (23.8–25.1) | 26.6 (26.0–27.3) | 27.4 (26.8–28.0) | 1.45 | <0.0001 |
| Household income | |||||
| Low (Q1) | 20.3 (19.2–21.4) | 20.7 (19.8–21.6) | 22.0 (20.9–23.1) | 0.82 | 0.0361 |
| Middle (Q2–Q3) | 23.4 (22.9–23.9) | 26.5 (26.0–27.1) | 26.7 (26.1–27.2) | 1.62 | <0.0001 |
| High (Q4) | 23.9 (23.3–24.6) | 26.0 (25.3–26.6) | 27.2 (26.5–27.8) | 1.60 | <0.0001 |
Korean population aged one year or older (KNHANES from 2010 to 2018).
Publisher’s Note: MDPI stays neutral with regard to jurisdictional claims in published maps and institutional affiliations. |
© 2021 by the authors. Licensee MDPI, Basel, Switzerland. This article is an open access article distributed under the terms and conditions of the Creative Commons Attribution (CC BY) license (http://creativecommons.org/licenses/by/4.0/).
Share and Cite
MDPI and ACS Style
Shim, J.-S.; Shim, S.-Y.; Cha, H.-J.; Kim, J.; Kim, H.C. Socioeconomic Characteristics and Trends in the Consumption of Ultra-Processed Foods in Korea from 2010 to 2018. Nutrients 2021, 13, 1120. https://doi.org/10.3390/nu13041120
AMA Style
Shim J-S, Shim S-Y, Cha H-J, Kim J, Kim HC. Socioeconomic Characteristics and Trends in the Consumption of Ultra-Processed Foods in Korea from 2010 to 2018. Nutrients. 2021; 13(4):1120. https://doi.org/10.3390/nu13041120
Chicago/Turabian StyleShim, Jee-Seon, Sun-Young Shim, Hee-Jeung Cha, Jinhee Kim, and Hyeon Chang Kim. 2021. "Socioeconomic Characteristics and Trends in the Consumption of Ultra-Processed Foods in Korea from 2010 to 2018" Nutrients 13, no. 4: 1120. https://doi.org/10.3390/nu13041120
Note that from the first issue of 2016, this journal uses article numbers instead of page numbers. See further details here.