
The Role of Plant-Based Protein Functional Food in Preventing Acute Respiratory Disease: A Case Study

 ,
, 
Abstract
:1. Introduction
2. Materials and Methods
2.1. Preparation of the Functional Food Product
2.2. The Composition of the Functional Product
2.3. The Selection of Groups of Students and Methods of Blood Sample Analysis
3. Results
3.1. Analysis of the Micronutrient Content in the Functional Product
3.2. Analysis of Blood Samples
3.3. Morbidity Pattern Analysis
4. Discussion
5. Conclusions
Author Contributions
Funding
Institutional Review Board Statement
Informed Consent Statement
Conflicts of Interest
References
- Heinen, I.; Bullinger, M.; Kocalevent, R.D. Perceived stress in first year medical students-associations with personal resources and emotional distress. BMC Med. Educ. 2017, 17, 4. [Google Scholar] [CrossRef] [Green Version]
- Labrague, L.J.; McEnroe-Petitte, D.M.; Gloe, D.; Thomas, L.; Papathanasiou, I.V.; Tsaras, K. A literature review on stress and coping strategies in nursing students. J. Ment. Health 2017, 26, 471–480. [Google Scholar] [CrossRef] [PubMed]
- Quek, T.T.; Tam, W.W.; Tran, B.X.; Zhang, M.; Zhang, Z.; Ho, C.S.; Ho, R.C. The Global Prevalence of Anxiety among Medical Students: A Meta-Analysis. Int. J. Environ. Res. Public Health 2019, 16, 2735. [Google Scholar] [CrossRef] [PubMed] [Green Version]
- Saxena, S.K.; Mani, R.N.; Dwivedi, A.K.; Ryali, V.; Timothy, A. Association of educational stress with depression, anxiety, and substance use among medical and engineering undergraduates in India. Ind. Psychiatry J. 2019, 28, 160–169. [Google Scholar] [CrossRef] [PubMed]
- Matsui, K.; Komada, Y.; Nishimura, K.; Kuriyama, K.; Inoue, Y. Prevalence and Associated Factors of Nocturnal Eating Behavior and Sleep-Related Eating Disorder-Like Behavior in Japanese Young Adults: Results of an Internet Survey Using Munich Parasomnia Screening. J. Clin. Med. 2020, 9, 1243. [Google Scholar] [CrossRef]
- Seun-Fadipe, C.T.; Mosaku, K.S. Sleep quality and psychological distress among undergraduate students of a Nigerian university. Sleep Health J. Natl. Sleep Found. 2017, 3, 190–194. [Google Scholar] [CrossRef]
- Zhai, K.; Gao, X.; Wang, G. The Role of Sleep Quality in the Psychological Well-Being of Final Year UndergraduateStudents in China. Int. J. Environ. Res. Public Health 2018, 15, 2881. [Google Scholar] [CrossRef] [PubMed] [Green Version]
- Alhazmi, A.; Aziz, F. Dietary assessment and its awareness in female students from different Health Departments: Unhealthy diet with normal BMI. J. Public Health Res. 2020, 9, 1799. [Google Scholar] [CrossRef]
- El Ansari, W.; Berg-Beckhoff, G. Association of Health Status and Health Behaviors with Weight Satisfaction vs. Body Image Concern: Analysis of 5888 Undergraduates in Egypt, Palestine, and Finland. Nutrients 2019, 11, 2860. [Google Scholar] [CrossRef] [Green Version]
- Hoare, E.; Milton, K.; Foster, C.; Allender, S. The associations between sedentary behaviour and mental health among adolescents: A systematic review. Int. J. Behav. Nutr. Phys. Act. 2016, 13, 108. [Google Scholar] [CrossRef] [Green Version]
- Iorga, M.; Manole, I.; Pop, L.; Muraru, I.D.; Petrariu, F.D. Eating Disorders in Relationship with Dietary Habits among Pharmacy Students in Romania. Pharmacy 2018, 6, 97. [Google Scholar] [CrossRef] [Green Version]
- Niba, L.L.; Atanga, M.B.; Navti, L.K. A cross sectional analysis of eating habits and weight status of university students in urban Cameroon. BMC Nutr. 2017, 3, 55. [Google Scholar] [CrossRef] [Green Version]
- Syed, N.K.; Syed, M.H.; Meraya, A.M.; Albarraq, A.A.; Al-Kasim, M.A.; Alqahtani, S.; Makeen, H.A.; Yasmeen, A.; Banji, O.J.; Elnaem, M.H. The association of dietary behaviors and practices with overweight and obesity parameters among Saudi university students. PLoS ONE 2020, 15, e0238458. [Google Scholar] [CrossRef]
- Habib, S.R.; Alghofaily, S.; Alshamrani, H.; Alhammad, A.; Awan, K.H. Relationship of Body Mass Index with Diet, Physical Activities, and Lifestyles of Dental Students. J. Contemp. Dent. Pract. 2017, 18, 899–904. [Google Scholar] [CrossRef]
- Musaiger, A.O.; Awadhalla, M.S.; Al-Mannai, M.; AlSawad, M.; Asokan, G.V. Dietary habits and sedentary behaviors among health science university students in Bahrain. Int. J. Adolesc. Med. Health 2017, 29. [Google Scholar] [CrossRef] [PubMed]
- Yahia, N.; Wang, D.; Rapley, M.; Dey, R. Assessment of weight status, dietary habits and beliefs, physical activity, and nutritional knowledge among university students. Perspect. Public Health 2016, 136, 231–244. [Google Scholar] [CrossRef]
- Zhao, F.; Sun, S.; Xiong, J.; Zheng, G. The effect of Baduanjin exercise on health-related physical fitness of college students: Study protocol for a randomized controlled trial. Trials 2019, 20, 569. [Google Scholar] [CrossRef] [PubMed]
- Al-Sejari, M. Sociocultural Characteristic, Lifestyle, and Metabolic Risk Factors among a Sample of Kuwaiti Male University Students. Am. J. Men’s Health 2017, 11, 308–317. [Google Scholar] [CrossRef] [Green Version]
- El Ansari, W.; Berg-Beckhoff, G. Country and Gender-Specific Achievement of Healthy Nutrition and Physical Activity Guidelines: Latent Class Analysis of 6266 University Students in Egypt, Libya, and Palestine. Nutrients 2017, 9, 738. [Google Scholar] [CrossRef] [PubMed]
- Snedden, T.R.; Scerpella, J.; Kliethermes, S.A.; Norman, R.S.; Blyholder, L.; Sanfilippo, J.; McGuine, T.A.; Heiderscheit, B. Sport and Physical Activity Level Impacts Health-Related Quality of Life Among Collegiate Students. Am. J. Health Promot. 2018, 33, 675–682. [Google Scholar] [CrossRef]
- Song, Y.; Luo, D.M.; Hu, P.J.; Yan, X.J.; Zhang, J.S.; Lei, Y.T.; Zhang, B.; Ma, J. Trends of prevalence of excellent health status and physical fitness among Chinese Han students aged 13 to 18 years from 1985 to 2014. Beijing da xue xue bao. Yi xue ban J. Peking Univ. Health Sci. 2020, 52, 317–322. [Google Scholar] [CrossRef]
- Byrne, E.; Brugha, R.; McGarvey, A. ‘A melting pot of cultures’ -challenges in social adaptation and interactions amongst international medical students. BMC Med. Educ. 2019, 19, 86. [Google Scholar] [CrossRef] [Green Version]
- Fond, G.; Bourbon, A.; Boucekine, M.; Messiaen, M.; Barrow, V.; Auquier, P.; Lançon, C.; Boyer, L. First-year French medical students consume antidepressants and anxiolytics while second-years consume non-medical drugs. J. Affect. Disord. 2020, 265, 71–76. [Google Scholar] [CrossRef]
- McGarvey, A.; Brugha, R.; Conroy, R.M.; Clarke, E.; Byrne, E. International students’ experience of a western medical school: A mixed methods study exploring the early years in the context of cultural and social adjustment compared to students from the host country. BMC Med. Educ. 2015, 15, 111. [Google Scholar] [CrossRef] [Green Version]
- Tang, W.; Dai, Q. Depressive symptoms among first-year Chinese undergraduates: The roles of socio-demographics, coping style, and social support. Psychiatry Res. 2018, 270, 89–96. [Google Scholar] [CrossRef] [PubMed]
- Mishra, S.R.; Neupane, D.; Shakya, A.; Adhikari, S.; Kallestrup, P. Modifiable Risk Factors for Major Non-communicable Diseases Among Medical Students in Nepal. J. Community Health 2015, 40, 863–868. [Google Scholar] [CrossRef]
- Morales, G.; Guillen-Grima, F.; Muñoz, S.; Belmar, C.; Schifferli, I.; Muñoz, A.; Soto, A. Factores de riesgo cardiovascular en universitarios de primer y tercer año [Cardiovascular risk factors among first and third year university students]. Rev. Med. Chile 2017, 145, 299–308. [Google Scholar] [CrossRef] [PubMed] [Green Version]
- Tarasov, A.V.; Koldunov, I.N.; Rakhmanov, R.S. On the issue of optimization of adaptation process to new environment taking into consideration climate and weather conditions. Gig. Sanit. 2014, 58–60. (In Russian) [Google Scholar]
- Tarasov, A.V.; Rakhmanov, R.S.; Bogomolova, E.S.; Piskarev, Y.G. Assessment of the Baltic Sea Climate Change Impact on Health. Pure Appl. Geophys. 2021. [Google Scholar] [CrossRef]
- Legislative support of the state policy in the field of production of functional and specialized food products in the Russian Federation. In Proceedings of the Round Table of the Federation Council of the Federal Assembly of the Russian Federation, Moscow, Russia, 25 January 2018.
- Mattioli, A.V.; Sciomer, S.; Cocchi, C.; Maffei, S.; Gallina, S. Quarantine during COVID-19 outbreak: Changes in diet and physical activity increase the risk of cardiovascular disease. Nutr. Metab. Cardiovasc. Dis. NMCD 2020, 30, 1409–1417. [Google Scholar] [CrossRef] [PubMed]
- Suardi, C.; Cazzaniga, E.; Graci, S.; Dongo, D.; Palestini, P. Link between Viral Infections, Immune System, Inflammation and Diet. Int. J. Environ. Res. Public Health 2021, 18, 2455. [Google Scholar] [CrossRef]
- Kim, H.; Rebholz, C.M.; Hegde, S.; LaFiura, C.; Raghavan, M.; Lloyd, J.F.; Cheng, S.; Seidelmann, S.B. Plant-based diets, pescatarian diets and COVID-19 severity: A population-based case–control study in six countries. BMJ Nutr. Prev. Health 2021, bmjnph–2021. [Google Scholar] [CrossRef]
- Baevsky, R.M.; Kaznacheev, V.P. Pre-nosological diagnosis. BME 1978, 7, 253–255. [Google Scholar]
- Baevskii, R.M.; Chernikova, A.G. Assessment of Adaptation Risk in an Individual Prenosological Monitoring System. Neurosci. Behav. Physi. 2016, 46, 437–445. [Google Scholar] [CrossRef]
- Chen, S.; Binns, C.W.; Maycock, B.; Liu, Y.; Zhang, Y. Prevalence of dietary supplement use in healthy pre-school Chinese children in Australia and China. Nutrients 2014, 6, 815–828. [Google Scholar] [CrossRef] [PubMed] [Green Version]
- El Khoury, D.; Hansen, J.; Tabakos, M.; Spriet, L.L.; Brauer, P. Dietary Supplement Use among Non-athlete Students at a Canadian University: A Pilot-Survey. Nutrients 2020, 12, 2284. [Google Scholar] [CrossRef] [PubMed]
- Joseph, N.; Kumar, A.; Singh, H.; Shaheen, M.; Das, K.; Shrivastava, A. Nutritional Supplement and Functional Food Use Among Medical Students in India. J. Diet. Suppl. 2018, 15, 951–964. [Google Scholar] [CrossRef]
- Kobayashi, E.; Sato, Y.; Umegaki, K.; Chiba, T. The Prevalence of Dietary Supplement Use among College Students: A Nationwide Survey in Japan. Nutrients 2017, 9, 1250. [Google Scholar] [CrossRef] [PubMed] [Green Version]
- Liu, H.; Zhang, S.; Zou, H.; Pan, Y.; Yang, Q.; Ouyang, Y.; Luo, J.; Lin, Q. Dietary Supplement Use Among Chinese Primary School Students: A Cross-Sectional Study in Hunan Province. Int. J. Environ. Res. Public Health 2019, 16, 374. [Google Scholar] [CrossRef] [Green Version]
- Wiltgren, A.R.; Booth, A.O.; Kaur, G.; Cicerale, S.; Lacy, K.E.; Thorpe, M.G.; Keast, R.S.; Riddell, L.J. Micronutrient supplement use and diet quality in university students. Nutrients 2015, 7, 1094–1107. [Google Scholar] [CrossRef]
- Ohama, H.; Ikeda, H.; Moriyama, H. Health foods and foods with health claims in Japan. Toxicology 2006, 221, 95–111. [Google Scholar] [CrossRef]
- Hasler, C.M.; Bloch, A.S.; Thomson, C.A.; Enrione, E.; Manning, C. Position of the American Dietetic Association: Functional Foods. J. Am. Diet. Assoc. 2004, 104, 814–826. [Google Scholar] [PubMed]
- GOST R 52349-2005 Functional Food Products. Terms and Definitions; Moscow Standartinform: Moscow, Russia, 2006.
- Fundamentals of the State Policy in the Field of Health Nutrition for the Period up to 2020: Order of the Government of the Russian Federation of October 25, 2010 No. 1873-r. Available online: https://rg.ru/2010/11/03/pravila-dok.html (accessed on 19 June 2021).
- Rakhmanov, R.S.; Gruzdeva, A.M.; Filippova, O.N.; Potekhina, N.N.; Averkin, D.A.; Potapova, I.A. Natural vitamin-minor-mineral complexes in managing vitamin and mineral deficiency in humans. Public Health Environ. 2016, 3, S34–S37. [Google Scholar]
- Gruzdeva, A.E. Method of Obtaining Biocorrectors from Natural Raw Materials. Russian Federation Patent 2399296; IPC A23L1/00, A23L1/30, 23 March 2009. [Google Scholar]
- Rakhmanov, R.S.; Narutdinov, D.A.; Umnyagina, I.A.; Istomin, A.V.; Gruzdeva, A.E. Directional products are an effective way to prevent diseases of the population. Public Health Environ. 2014, 11, 7–11. [Google Scholar]
- Filippova, O.N.; Istomin, A.V.; Rahmanov, R.S.; Gruzdeva, A.E. Prospects for providing food for workers and military personnel in extreme conditions with cryogenic products. Zdorov’e Naseleniya i Sreda Obitaniya 2014, 11, 1114, (In Russian, English abstract). [Google Scholar]
- Gruzdeva, A.E. The effectiveness of “Biofit” technology for “Spring of health”. In Proceedings of the Nutrition and health—Problems and solutions: Products “Biofit”—10 years on the Russian market, Novgorod, Russia, 2 March 2004; pp. 24–27. [Google Scholar]
- Karyakin, N.V. Comprehensive Research into the Development and Use of Technologies for Obtaining Highly Effective Biologically Active Food Supplements for Health Improvement and Rehabilitation of Children and Adolescents; Nizhny Novgorod State Medical Academy: Novgorod, Russia, 2003; pp. 47–55. [Google Scholar]
- Martinchik, A.N.; Maev, I.V.; Yanushevich, O.O. (Eds.) General Nutrition: Textbook; MED Press: Moscow, Russia, 2005; 392p, ISBN 5-98322-075-6. [Google Scholar]
- Rakhmanov, R.S.; Belousko, N.I.; Gruzdeva, A.E. The Composition of the Sports Nutrition Product. Patent No. 2533002, 16 June 2013. [Google Scholar]
- Monosova, O.Y.; Sharapova, K.G. Vitamins, micro- and macronutrients and their effect on the immune system. Eff. Pharmacother. Pediatr. 2010, 2, 6–11. [Google Scholar]
- Hallquist, N.A.; Sherman, A.R. Effect of iron deficiency on the stimulation of natural killer cells by macrophage-produced interferon. Nutr. Res. 1989, 9, 283–292. [Google Scholar] [CrossRef]
- Declaration of Conformity to the Requirements of the Eurasian Economic Union technical regulations EAEU N RU D-RU.АА95.В.03849. Available online: https://reestrinform.ru/reestr-declaratcii-sootvetstviia/id19-reg_number-%D0%95%D0%90%D0%AD%D0%A1_N_RU_%D0%94-RU.%D0%90%D0%9095.%D0%92.03849.html (accessed on 19 June 2021).
- Rakhmanov, V.S.; Bogomolova, E.S.; Tarasov, A.V.; Ashina, A.V. Reaktisya organizma kursnatov voenno-uchebnogo zavedeniya na nachalnom etape adaptatsii k uslovya, obuchemiya [Reactions in students of a military educational institution during adaptation to training conditions]. Voenno-Meditsinskiy Zhurnal [J. Mil. Med.] 2020, 341, 76–81. [Google Scholar]
- Halliwell, B. Oxidative stress, nutrition and health. Experimental strategies for optimization of nutritional antioxidant intake in humans. Free Rad. Res. 1996, 25, 57–74. [Google Scholar] [CrossRef]
- Miller, N.J.; Rice-Evans, C.; Davies, M.J.; Gopinathan, V.; Milner, A. A novel method for measuring antioxidant capacity and its application to monitoring the antioxidant status in premature neonates. Clin. Sci. 1993, 84, 407–412. [Google Scholar] [CrossRef] [Green Version]
- Schimke, I.; Müller, J.; Priem, F.; Kruse, I.; Schön, B.; Stein, J.; Kunze, R.; Wallukat, G.; Hetzer, R. Decreased oxidative stress in patients with idiopathic dilated cardiomyopathy one year after immunoglobulin adsorption. J. Am. Coll. Cardiol. 2001, 38, 178–183. [Google Scholar] [CrossRef] [Green Version]
- Doumas, B.T. Standards for Total Serum Protein Assays—A Collaborative Study. Clin. Chem. 1975, 21, 1159–1166. [Google Scholar] [CrossRef]
- Andrianova, M.Y.; Bugrova, O.V.; Goncharov, N.P. Clinical Laboratory Research Techniques. Reference Manual. Clinical and Biochemical Research. Immunological Research; a reference manual in 3 volumes; Labora: Moscow, Russia, 2009; 304p, ISBN 9785903284030. [Google Scholar]
- Menshikov, V.V. (Ed.) Ensuring the Quality of Laboratory Research. Preanalytical Stage; Labinform: Moscow, Russia, 1999; pp. 138–139. [Google Scholar]
- Makino, T.; Kiyonaga, M.; Kina, K. A sensitive, direct colorimetric assay of serum iron using the chromogen, nitro-PAPS. Clinica chimica acta. Int. J. Clin. Chem. 1988, 171, 19–27. [Google Scholar] [CrossRef]
- Mann, C.K.; Yoe, J.H. Spectrophotometric Determination of Magnesium with Sodium 1-Azo-2-hydroxy-3-(2,4-dimethylcarboxanilido)-naphthalene-1′-(2-hydroxybenzene-5-sulfonate). Anal. Chem. 1956, 28, 202–205. [Google Scholar] [CrossRef]
- Hillmann, G.; Beyer, G. Schnellbestimung von Serum-Kalium durch Trübungsmessung mit Kalignost nach Eiweissfällung [Rapid determination of serum potassium by turbidity measurement with kalignost after protein precipitation]. Zeitschrift fur klinische Chemie und klinische Biochemie 1967, 5, 93–94. [Google Scholar] [PubMed]
- Barnett, R.N.; Skodon, S.B.; Goldberg, M.H. Performance of "kits" used for clinical chemical analysis of calcium in serum. Am. J. Clin. Pathol. 1973, 59, 836–845. [Google Scholar] [CrossRef]
- Нenry, R.J. Clinical Chemistry, Principles and Techniques, 2nd ed.; Harper and Rou: Hagerstown, MD, USA, 1974; p. 525. [Google Scholar]
- Weissman, N.; Pilegg, V.J. IN Clinical Chemistry—Principle and Technics, 2nd ed.; Guder, W.; NormalbereicheRlin. Chem., 1982; Henry, R.J., Ed.; Harper & Row: New York, NY, USA, 1974; pp. 642–643. [Google Scholar]
- Fried, R.; Hoefimayr JVelosy, G. A new highly sensitive method for the determination of chloride in body fluids without protein precipitation. Z. Klin. Chem. Klin. Biochem. 1972, 10, 280. [Google Scholar] [PubMed]
- Methodology of Measuring the Concentration of Vitamin A in Blood Serum Using the Analyzer “Fluorat-02-ABLF”. Method M 07-02-2001.- SPb. 2001. Available online: https://www.lumex.ru/catalog/flyuorat-02-ablf-t.php (accessed on 19 June 2021).
- Antonov, B.I. (Ed.) Laboratory Research in Veterinary Medicine; Agropromizdat: Moscow, Russia, 1991; p. 287. [Google Scholar]
- Karpishchenko, A.I. (Ed.) Medical Laboratory Technologies; Intermedica: St. Petersburg, Russia, 2002; Volume 2, 254p. [Google Scholar]
- Baceviciene, M.; Jankauskiene, R.; Balciuniene, V. The Role of Body Image, Disordered Eating and Lifestyle on the Quality of Life in Lithuanian University Students. Int. J. Environ. Res. Public Health 2020, 17, 1593. [Google Scholar] [CrossRef] [Green Version]
- Gallè, F.; Sabella, E.A.; Da Molin, G.; Liguori, G.; Montagna, M.T.; Orsi, G.B.; Valerio, G.; Napoli, C. A cross-sectional study investigating lifestyle and weight perception of undergraduate students in southern Italy. BMC Public Health 2019, 19, 1316. [Google Scholar] [CrossRef]
- Rangel Caballero, L.G.; Gamboa Delgado, E.M.; Murillo López, A.L. Prevalencia de factores de riesgo comportamentales modificables asociados a enfermedades no transmisibles en estudiantes universitarios latinoamericanos: Una revisión sistemática [Prevalence of modifiable behavioral risk factors associated to non-communicable diseases in Latin American college students: A systematic review]. Nutr. Hosp. 2017, 34, 1185–1197. [Google Scholar] [CrossRef]
- Son, C.; Hegde, S.; Smith, A.; Wang, X.; Sasangohar, F. Effects of COVID-19 on College Students’ Mental Health in the United States: Interview Survey Study. J. Med. Internet Res. 2020, 22, e21279. [Google Scholar] [CrossRef]
- Rakhmanov, R.S.; Potehina, N.N.; Tarasov, A.V.; Koldunov, I.N. Risk assessment for incidence with community-acquired pneumonia in organized communities among thier members adapting to training and acclimatization. Health Risk Anal. 2019, 154–160. [Google Scholar] [CrossRef]
- Charlot, K.; Faure, C.; Antoine-Jonville, S. Influence of Hot and Cold Environments on the Regulation of Energy Balance Following a Single Exercise Session: A Mini-Review. Nutrients 2017, 9, 592. [Google Scholar] [CrossRef] [PubMed] [Green Version]
- Pagnotta, K.D.; Mazerolle, S.M.; Pitney, W.A.; Burton, L.J.; Casa, D.J. Implementing Health and Safety Policy Changes at the High School Level from a Leadership Perspective. J. Athl. Train. 2016, 51, 291–302. [Google Scholar] [CrossRef] [Green Version]
- Velusami, D.; Dongre, A.R.; Kagne, R.N. Evaluation of one-month foundation course for the first year undergraduate students at a Medical College in Puducherry, India. J. Adv. Med. Educ. Prof. 2020, 8, 165–171. [Google Scholar] [CrossRef] [PubMed]
- Cay, M.; Ucar, C.; Senol, D.; Cevirgen, F.; Ozbag, D.; Altay, Z.; Yildiz, S. Effect of increase in cortisol level due to stress in healthy young individuals on dynamic and static balance scores. North. Clin. Istanb. 2018, 5, 295–301. [Google Scholar] [CrossRef]
- Maduka, I.C.; Neboh, E.E.; Ufelle, S.A. The relationship between serum cortisol, adrenaline, blood glucose and lipid profile of undergraduate students under examination stress. Afr. Health Sci. 2015, 15, 131–136. [Google Scholar] [CrossRef] [Green Version]
- Inoue, K.; Hashioka, S.; Takeshita, H.; Kamura, M.; Fujita, Y. High Serum Cortisol Levels as a Potential Indicator for Changes in Well-Regulated Daily Life among Junior High School Students. Tohoku J. Exp. Med. 2019, 249, 143–146. [Google Scholar] [CrossRef]
- Dauvermann, M.R.; Donohoe, G. Cortisol stress response in psychosis from the high-risk to the chronic stage: A systematic review. Ir. J. Psychol. Med. 2019, 36, 305–315. [Google Scholar] [CrossRef] [PubMed]
- Planche, K.; Chan, J.F.; Di Nota, P.M.; Beston, B.; Boychuk, E.; Collins, P.I.; Andersen, J.P. Diurnal Cortisol Variation According to High-Risk Occupational Specialty within Police: Comparisons between Frontline, Tactical Officers, and the General Population. J. Occup. Environ. Med. 2019, 61, e260–e265. [Google Scholar] [CrossRef]
- Bardaquim, V.A.; Santos, S.; Dias, E.G.; Dalri, R.; Mendes, A.; Gallani, M.C.; Robazzi, M. Stress and cortisol levels among members of the nursing team. Rev. Bras. Enferm. 2020, 73 (Suppl. 1), e20180953. [Google Scholar] [CrossRef]
- Faresjö, T.; Strömberg, S.; Jones, M.; Stomby, A.; Karlsson, J.E.; Östgren, C.J.; Faresjö, Å.; Theodorsson, E. Elevated levels of cortisol in hair precede acute myocardial infarction. Sci. Rep. 2020, 10, 22456. [Google Scholar] [CrossRef]
- Jutla, S.K.; Yuyun, M.F.; Quinn, P.A.; Ng, L.L. Plasma cortisol and prognosis of patients with acute myocardial infarction. J. Cardiovasc. Med. 2014, 15, 33–41. [Google Scholar] [CrossRef]
- Cadegiani, F.A.; Kater, C.E. Basal Hormones and Biochemical Markers as Predictors of Overtraining Syndrome in Male Athletes: The EROS-BASAL Study. J. Athl. Train. 2019, 54, 906–914. [Google Scholar] [CrossRef] [Green Version]
- Kubasov, R.V. Hormonal changes as a response to extreme environmental factors. Bull. Russ. Acad. Med Sci. 2014, 69, 102–109. [Google Scholar]
- Miller, G.D.; Beharry, A.; Teramoto, M.; Lai, A.; Willick, S.E.; Eichner, D. Hematological changes following an Ironman triathlon: An antidoping perspective. Drug Test. Anal. 2019, 11, 1747–1754. [Google Scholar] [CrossRef]
- Miller, G.D.; Teramoto, M.; Smeal, S.J.; Cushman, D.; Eichner, D. Assessing serum albumin concentration following exercise-induced fluid shifts in the context of the athlete biological passport. Drug Test. Anal. 2019, 11, 782–791. [Google Scholar] [CrossRef]
- Nielsen, F.H. Dietary Magnesium and Chronic Disease. Adv. Chronic Kidney Dis. 2018, 25, 230–235. [Google Scholar] [CrossRef]
- Nielsen, F.H. Magnesium deficiency and increased inflammation: Current perspectives. J. Inflamm. Res. 2018, 11, 25–34. [Google Scholar] [CrossRef] [Green Version]
- Kim, L.B. The impact of the period of exposure to severe Arctic climate on the oxygen transport function in northerners of different ages. Arct. North 2014, 17, 150–162. [Google Scholar]
- Morris, G.; Stubbs, B.; Köhler, C.A.; Walder, K.; Slyepchenko, A.; Berk, M.; Carvalho, A.F. The putative role of oxidative stress and inflammation in the pathophysiology of sleep dysfunction across neuropsychiatric disorders: Focus on chronic fatigue syndrome, bipolar disorder and multiple sclerosis. Sleep Med. Rev. 2018, 41, 255–265. [Google Scholar] [CrossRef] [Green Version]
- Galmés, S.; Serra, F.; Palou, A. Current State of Evidence: Influence of Nutritional and Nutrigenetic Factors on Immunity in the COVID-19 Pandemic Framework. Nutrients 2020, 12, 2738. [Google Scholar] [CrossRef]
- Jovic, T.H.; Ali, S.R.; Ibrahim, N.; Jessop, Z.M.; Tarassoli, S.P.; Dobbs, T.D.; Holford, P.; Thornton, C.A.; Whitaker, I.S. Could Vitamins Help in the Fight Against COVID-19? Nutrients 2020, 12, 2550. [Google Scholar] [CrossRef]
- Zabetakis, I.; Lordan, R.; Norton, C.; Tsoupras, A. COVID-19: The Inflammation Link and the Role of Nutrition in Potential Mitigation. Nutrients 2020, 12, 1466. [Google Scholar] [CrossRef]


| Minerals | Vitamins | ||||||||
|---|---|---|---|---|---|---|---|---|---|
| Cu | Zn | Fe | Мn | Cr | A | E | В2 | K | C |
| 0.58 | 9.86 | 71.00 | 2.85 | 0.16 | 0.03 | 3.69 | 0.30 | 0.51 | 89.91 |
| Parameter (Reference Values) | Observation Period, М ± m | ||
|---|---|---|---|
| Start (21 Day) | End (37 Day) | 45 Days Later (67 Day) | |
| Minerals | |||
| Copper, μg/mL (0.7–1.55): | |||
| treatment | 0.85 ± 0.03 | 0.82 ± 0.06 (−3.6%) | 0.82 ± 0.03 (−3.6%) |
| control | 0.81 ± 0.09 | 0.73 ± 0.05 (−9.9%) | 0.76 ± 0.04 (−6.2%) |
| Zinc, μg/mL (0.5–1.5): | |||
| treatment | 1.27 ± 0.10 | 1.20 ± 0.07 (−5.5%) | 1.30 ± 0.05 (+2.3%) |
| control | 1.0 ± 0.08 | 0.97 ± 0.08 (−3.0%) | 1.13 ± 0.08 (+13.0%) |
| Iron, mM/L (11.6–31.3): | |||
| treatment | 13.60 ± 0.73 | 15.67 ± 1.0 (+15.2%) | 16.43 ± 1.0 (+20.8%) |
| control | 14.20 ± 1.15 | 16.84 ± 0.86 (+18.5%) | 16.65 ± 0.93 (+17.2%) |
| Magnesium, mM/L (0.66–1.07): | |||
| treatment | 0.63 ± 0.01 | 0.67 ± 0.01 (+6.3%) | 0.85 ± 0.01 (+34.2%) |
| control | 0.99 ± 0.02 | 0.77 ± 0.01 (−22.6%) | 0.86 ± 0.01 (−13.6%) |
| Phosphorus, mM/L (0.87–1.45): | |||
| treatment | 1.12 ± 0.03 | 1.29 ± 0.03 (+16.1%) | 1.35 ± 0.03 (+21.2%) |
| control | 1.26 ± 0.03 | 1.13 ± 0.03 (−10.1%) | 1.30 ± 0.03 (+3.4%) |
| Calcium, mM/L (2,15–2,57): | |||
| treatment | 2.61 ± 0.02 | 2.59 ± 0.01 (−0.8%) | 2.58 ± 0.02 (−1.1%) |
| control | 2.56 ± 0.02 | 2.51 ± 0.02 (−1.9%) | 2.54 ± 0.20 (−0.8%) |
| Potassium, mM/L (3,6–5,5): | |||
| treatment | 5.19 ± 0.12 | 5.04 ± 0.10 (−2.9%) | 5.25 ± 0.11(+1.1%) |
| control | 5.31 ± 0.15 | 5.10 ± 0.08 (−4.0%) | 5.17 ± 0.09 (−2.7%) |
| Sodium, mM/L (135–150): | |||
| treatment | 145.60 ± 2.31 | 149.60 ± 0.35 (+2.7%) | 150.50 ± 0.48 (+3.3%) |
| control | 149.80 ± 0.57 | 147.60 ± 0.36 (−1.5%) | 150.0 ± 0.38 (+0.1%) |
| Chlorine, mM/L (97–108): | |||
| treatment | 100.20 ± 1.11 | 100.30 ± 0.40 (+0.1%) | 104.30 ± 0.40 (+4.1%) |
| control | 102.10 ± 0.47 | 103.40 ± 0.48 (+1.3%) | 102.80 ± 0.41 (−0.9%) |
| Parameter (Reference Values) | Observation Period, М ± m | ||
|---|---|---|---|
| Start (21 Day) | End (37 Day) | 45 Days Later (67 Day) | |
| Vitamins | |||
| A, μg/mL (0.3–0.6): | |||
| treatment | 0.89 ± 0.04 | 1.08 ± 0.04 (+21.3%) | 1.1 ± 0.03 (+23.6%) |
| control | 0.83 ± 0.05 | 0.91 ± 0.05 (+9.6%) | 0.91 ± 0.04 (+9.6%) |
| E, μg/mL (8–18): | |||
| treatment | 7.86 ± 0.34 | 8.7 ± 0.54 (+10.7%) | 9.19 ± 0.41 (+16.9%) |
| control | 7.75 ± 0.43 | 6.78 ± 0.39 (−12.5%) | 6.78 ± 0.53 (−12.5%) |
| В1, μg/mL (7–14): | |||
| treatment | 21.4 ± 0.9 | 20.6 ± 1.0 (−3.8%) | 20.63 ± 1.0 (−3.6%) |
| control | 19.7 ± 1.3 | 16.36 ± 0.85 (−17.0%) | 17.6 ± 1.0 (−10.7%) |
| B2, μg/% (10–50): | |||
| treatment | 6.1 ± 0.03 | 6.9 ± 0.41 (+13.5%) | 7.83 ± 0.2 (+28.3%) |
| control | 5.91 ± 0.4 | 5.85 ± 0.3 (−0.9%) | 6.08 ± 0.3 (+2.8%) |
| Parameter (Reference Values) | Observation Period, М ± m | ||
|---|---|---|---|
| Start (21 Day) | End (37 Day) | 45 Days Later (67 Day) | |
| Protein metabolism | |||
| Total protein, g/L (64–83): | |||
| treatment | 74.15 ± 0.68 | 75.9 ± 1.0 (+2.3%) | 74.6 ± 0.8 (+0.6%) |
| control | 73.2 ± 0.60 | 71.8 ± 0.7 (−1.9%) | 74.8 ± 0.9 (+2.1%) |
| Albumin,% (46.9–61.4): | |||
| treatment | 55.71 ± 0.7 | 54.29 ± 0.64 (−2.6%) | 55.44 ± 0.88 (−0.5%) |
| control | 51.95 ± 1.0 | 56.23 ± 0.8 (+8.2%) | 57.91 ± 0.74 (+11.5%) |
| Alpha−1 globulins,% (2.2–4.2): | |||
| treatment | 4.37 ± 0.17 | 3.83 ± 0.1 (−12,4%) | 3.73 ± 0.14 (−14.6%) |
| control | 4.21 ± 0.13 | 4.05 ± 0.2 (−3,8%) | 4.24 ± 0.71 (+0.7%) |
| Alpha−2 globulins,% (7.9–10.9): | |||
| treatment | 10.2 ± 0.23 | 9.66 ± 0.25 (−5.3%) | 10.02 ± 0.49 (−1.8%) |
| control | 11.68 ± 0.44 | 10.06 ± 0.3 (−13.9%) | 9.91 ± 0.54 (−15.5%) |
| Beta globulins,% (10.2–18.3): | |||
| treatment | 11.4 ± 0.26 | 12.31 ± 0.23 (+8.0%) | 11.61 ± 0.42 (+1.8%) |
| control | 11.79 ± 0.29 | 12.13 ± 0.18 (+2.8%) | 11.3 ± 0.52 (−4.2%) |
| Gamma globulins,% (17.6–25.4): | |||
| treatment | 18.28 ± 0.53 | 19.85 ± 0.58 (+8.6%) | 19.19 ± 0.85 (+4.9%) |
| control | 20.54 ± 0.8 | 16.69 ± 0.73 (−18.7%) | 16.63 ± 0.59 (−19.0%) |
| Parameter (Reference Values) | Observation Period, М ± m | ||
|---|---|---|---|
| Start (21 Day) | End (37 Day) | 45 Days Later (67 Day) | |
| Hormones, (nmol/L) | |||
| Testosterone, 8.72–38.17: | |||
| treatment | 24.73 ± 1.98 | 25.53 ± 1.65 (+3.2%) | 21.19 ± 1.77 (−14.3%) |
| control | 26.18 ± 1.17 | 18.43 ± 1.8 (−29.6%) | 17.59 ± 0.9 (−32.8%) |
| Cortisol, 200.0–700.0: | |||
| treatment | 636.8 ± 31.8 | 673.3 ± 29.6 (+5.8%) | 672.0 ± 35.0 (+5.5%) |
| control | 750.6 ± 47.9 | 761.0 ± 38.4 (+1.4%) | 685.6 ± 28.5 (−8.7%) |
| Parameter (Reference Values) | Observation Period, М ± m | ||
|---|---|---|---|
| Start (21 Day) | End (37 Day) | 45 Days Later (67 Day) | |
| Average erythrocyte volume, 80–95 fl: | |||
| treatment | 87.1 ± 0.49 | 87.5 ± 0.47 (+0.5%) | 88.3 ± 0.54 (+1.3%) |
| control | 85.1 ± 0.9 | 86.0 ± 0.99 (+1.1%) | 86.2 ± 0.9 (+1.3%) |
| Average content of HGB in erythrocyte, 25–35 pg: | |||
| treatment | 30.30 ± 0.17 | 30.35 ± 0.17 (+0.1%) | 30.49 ± 0.17 (+0.6%) |
| control | 30.35 ± 0.39 | 30.0 ± 0.37 (−1.2%) | 30.1 ± 0.23 (−0.8%) |
| Average concentration of HGB in erythrocyte, 30.0–38.0 g/L: | |||
| treatment | 34.79 ± 0.08 | 34.67 ± 0.14 (+0.4%) | 34.61 ± 0.20 (−0.5%) |
| control | 35.6 ± 0.3 | 34.9 ± 0.19 (−2.0%) | 34.6 ± 0.24 (−2.8%) |
| Relative RDW, standard deviation, | |||
| 39–46 fl.: | |||
| treatment | 41.45 ± 0.33 | 42.5 ± 0.43 (+2.5%) | 42.48 ± 0.35 (+2.5%) |
| control | 42.07 ± 0.5 | 42.39 ± 0.68 (+0.6%) | 42.5 ± 0.69 (+1.0%) |
| Relative RDW, coefficient of variation, | |||
| 11.8–15.6%: | |||
| treatment | 13.28 ± 0.10 | 13.54 ± 0.12 (+2.0%) | 13.59 ± 0.10 (2.3%) |
| control | 13.2 ± 0.09 | 13.2 ± 0.10 (0%) | 13.1 ± 0.13 (−0.8%) |
| Parameter (Reference Values) | Observation Period, М ± m | ||
|---|---|---|---|
| Start (21 Day) | End (37 Day) | 45 Days Later (67 Day) | |
| Leukocytes, 4.2–9 × 10⁹ cells/L: | |||
| treatment | 6.96 ± 0.22 | 7.86 ± 0.30 (+12.0%) | 7.69 ± 0.21 (+10.4%) |
| control | 6.57 ± 0.48 | 6.31 ± 0.34 (−3.9%) | 7.95 ± 0.35 (+24.9%) |
| Lymphocytes, 1.5–4.0 × 10⁹ L: | |||
| treatment | 2.33 ± 0.07 | 2.55 ± 0.09 (+9.4%) | 2.53 ± 0.10 (+8.6%) |
| control | 2.17 ± 0.16 | 2.23 ± 0.18 (+2.7%) | 2.71 ± 0.17(+24.9%) |
| Monocytes, 0.1–0.8 × 10⁹ L: | |||
| treatment | 0.69 ± 0.03 | 0.79 ± 0.04(+14.5%) | 0.84 ± 0.03(+21.7%) |
| control | 0.6 ± 0.023 | 0.62 ± 0.03 (+3.3%) | 0.63 ± 0.03 (+5.0%) |
| Relative content of monocytes, 2–11%: | |||
| treatment | 9.87±0.31 | 9.94±0.30 (+0.7%) | 11.0±0.46 (+11.4%) |
| control | 9.1±0.23 | 9.16±0.3 (+0.6%) | 9.2±0.33 (1.0%) |
| Neutrophils, 2.0–7.7 × 10⁹ L: | |||
| treatment | 3.58 ± 0.19 | 4.2 ± 0.26 (+17.3%) | 4.0 ± 0.19 (+11.7%) |
| control | 4.24 ± 0.34 | 3.80 ± 0.22 (−10.4%) | 4.11 ± 0.34 (−3.1%) |
| The relative content of neutrophils, 42–72%: | |||
| treatment | 50.7 ± 1.2 | 51.47 ± 1.4 (+1.5%) | 51.63 ± 1.54 (+1.8%) |
| control | 54.5 ± 1.86 | 53.2 ± 2.3 (−4.3%) | 52.67 ± 1.9 (−3.4%) |
| Basophil content, 0.02–0.1 × 10⁹ L: | |||
| treatment | 0.02 ± 0.001 | 0.024 ± 0.002 (+21.7%) | 0.026 ± 0.001 (+30.0%) |
| control | 0.02 ± 0.001 | 0.021 ± 0.001 (+5.0%) | 0.02 ± 0.001 (0%) |
| Parameter (Reference Values) | Observation Period, М ± m | ||
|---|---|---|---|
| Start (21 Day) | End (37 Day) | 45 Days Later (67 Day) | |
| Platelets, 180–400 × 109 cells/L: | |||
| treatment | 231.8 ± 6.53 | 242.97 ± 6.9 (+4.8%) | 243.9 ± 8.5 (+5.6%) |
| control | 221.1 ± 11.2 | 229.8 ± 9.35 (+3.9%) | 240.2 ± 11.4 (+8.6%) |
| Relative PDW, 15–17%: | |||
| treatment | 13.55 ± 0.26 | 13.05 ± 0.25 (−3.7%) | 12.84 ± 0.23 (−5.3%) |
| control | 13.97 ± 0.7 | 13.78 ± 0.8 (−1.4%) | 14.35 ± 0.9 (+2.7%) |
| P−LCR, 13–43%: | |||
| treatment | 34.29 ± 1.02 | 32.49 ± 1.05 (−5.3%) | 32.12 ± 1.00 (−6.3%) |
| control | 32.15 ± 3.0 | 29.99 ± 3.1 (−6.8%) | 29.94 ± 2.9 (−6.9%) |
| Parameter (Reference Values) | Observation Period, М ± m | ||
|---|---|---|---|
| Start (21 Day) | End (37 Day) | 45 Days Later (67 Day) | |
| Antioxidant protection system, μmol/L | |||
| Peroxides, ˂180.0: | |||
| treatment | 542.3 ± 65.8 | 359.3 ± 58.5 (−33.7%) | 201.7 ± 49.8 (−62.8%) |
| control | 535.4 ± 49.8 | 519.5 ± 70.3 (−3.0%) | 485.4 ± 59.8 (−9.4%) |
| Serum antioxidant activity, 280 ± 20.5: | |||
| treatment | 313.9 ± 9.8 | 313.5 ± 13.3 (−0.1%) | 392.2 ± 11.3 (+24.9%) |
| control | 311.5 ± 11.3 | 276.7 ± 9.5 (−11.2%) | 235.4 ± 8.5 (−24.4%) |
| Serum immunoglobulins (g/L) | |||
| IgA, 0.9–4.5: | |||
| treatment | 0.938 ± 0.1 | 1.034 ± 0.12 (+10.2%) | 0.902 ± 0.11 (−3.9%) |
| control | 0.685 ± 0.09 | 0.74 ± 0.09 (+8.0%) | 0.428 ± 0.03 (−37.5%) |
| IgM, 0.6–3.7: | |||
| treatment | 1.258 ± 0.14 | 1.176 ± 0.14 (−6.6%) | 1.803 ± 0.11 (+43.3%) |
| control | 0.87 ± 0.07 | 1.57 ± 0.36 (+80.4%) | 1.34 ± 0.16 (+54.0%) |
| IgG, 8–17: | |||
| treatment | 10.82 ± 1.19 | 11.98 ± 1.28 (+10.7%) | 15.54 ± 1.39 (+43.6%) |
| control | 15.92 ± 1.02 | 15.46 ± 1.39 (−3.1%) | 11.49 ± 1.8 (−27.8%) |
| Disease Class | Morbidity Pattern | |||
|---|---|---|---|---|
| Treatment | Control | |||
| % | Rank | % | Rank | |
| VI. Diseases of the nervous system | 1.3 | 4 | 1.0 | 4 |
| X. Respiratory diseases | 88.5 | 1 | 88.3 | 1 |
| XI. Diseases of the digestive system | 0.7 | 6 | 0.7 | 6 |
| XII. Diseases of the skin and subcutaneous tissue | 6.3 | 2 | 6.3 | 2 |
| ХIII. Diseases of the musculoskeletal system and connective tissue | 1.0 | 5 | 1.0 | 5 |
| XIX. Injury, poisoning and some other consequences of exposure to external causes | 2.2 | 3 | 2.2 | 3 |
| Disease Class | Disease Distribution, М ± m | |
|---|---|---|
| Treatment | Control | |
| VI. Diseases of the nervous system | 22.2 ± 21.9 | 15.7 ± 7.8 |
| X. Respiratory diseases | 22.2 ± 21.9 | 15.7 ± 7.8 |
| XI. Diseases of the digestive system | 1066.6 ± 39.7 | 1788.4 ± 74.4 |
| XII. Diseases of the skin and subcutaneous tissue | 22.2 ± 21.9 | 125.9 ± 20.8 |
| ХIII. Diseases of the musculoskeletal system and connective tissue | 22.2 ± 21.9 | 15.7 ± 7.8 |
| XIX. Injury, poisoning and some other consequences of exposure to external causes | 66.6 ± 37.2 | 74.8 ± 16.5 |
| Total | 1222.2 ± 77.7 | 2062.9 ± 92.9 |
| Disease Class | Morbidity, ‰ | |
|---|---|---|
| Treatment | Control | |
| Acute sinusitis | 44.4 ± 30.7 | 78.7 ± 16.9 |
| Acute tonsillitis | 177.7 ± 56.9 | 141.7 ± 21.8 |
| Acute viral respiratory infection of the upper respiratory tract, flu | 822.2 ± 56.9 | 1468.5 ± 52.0 |
| Community-acquired pneumonia | 0.0 | 55.1 |
| Acute viral respiratory infection of the lower respiratory tract | 22.2 ± 21.9 | 35.4 ± 11.6 |
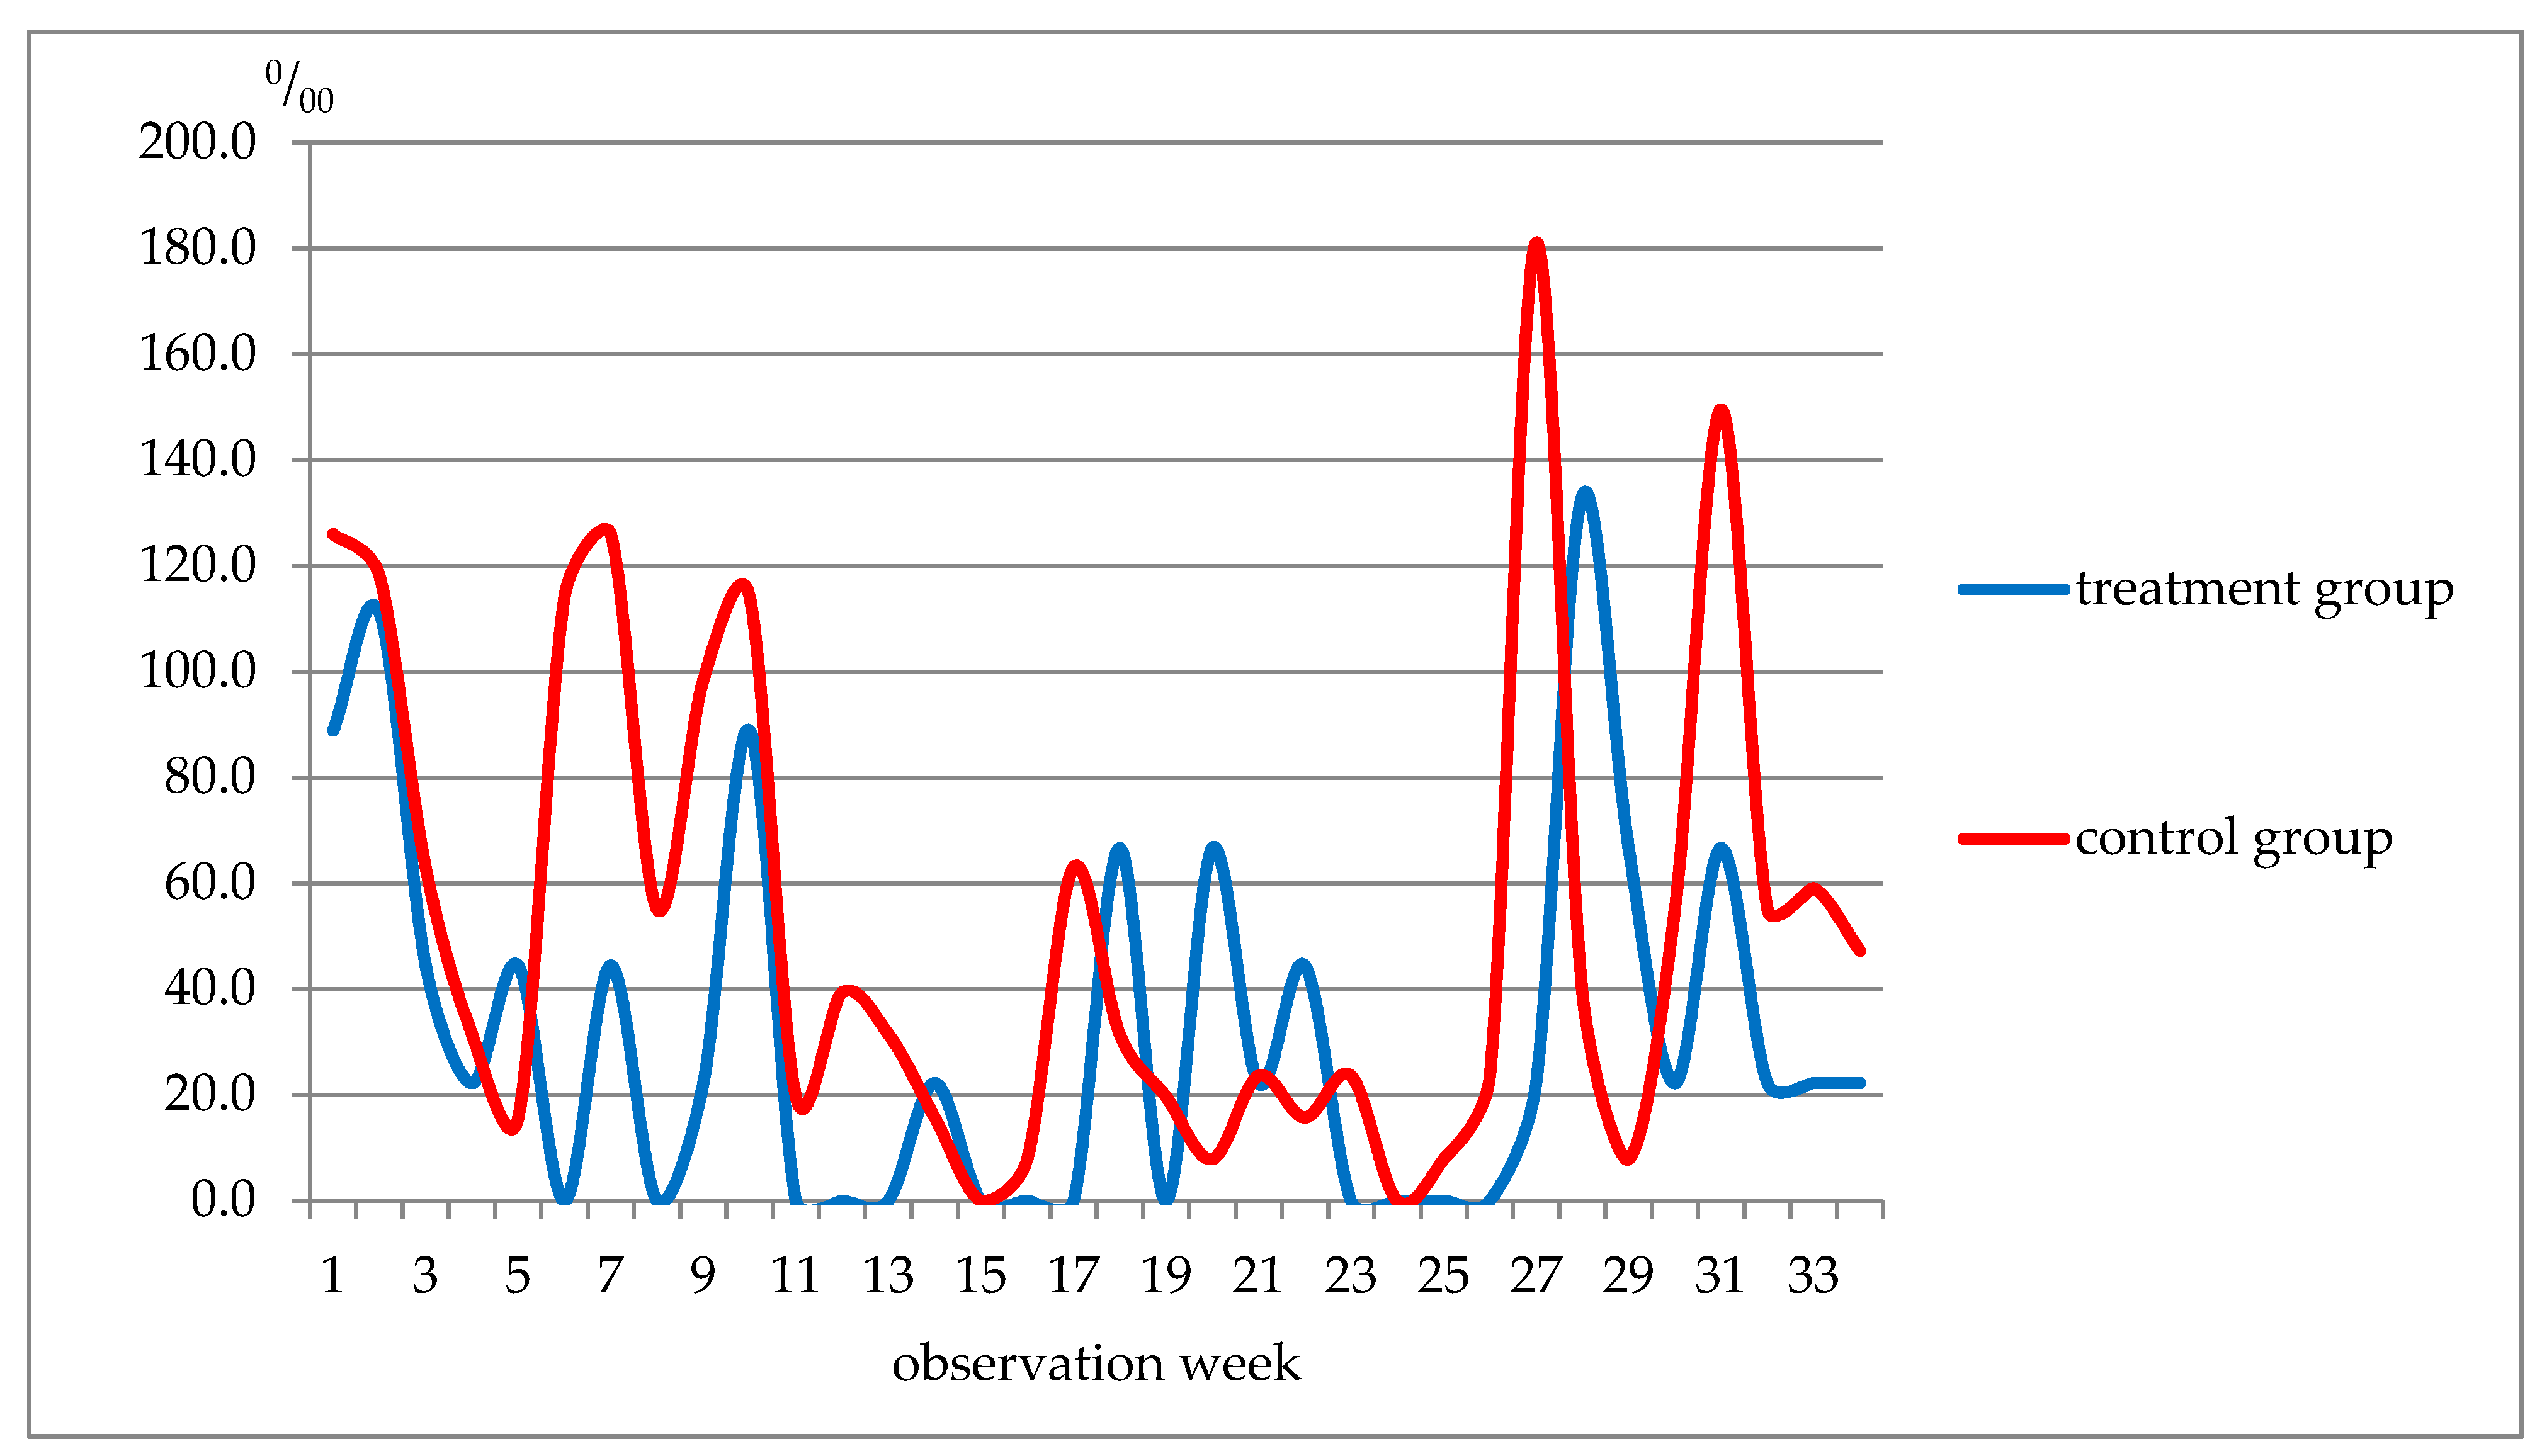
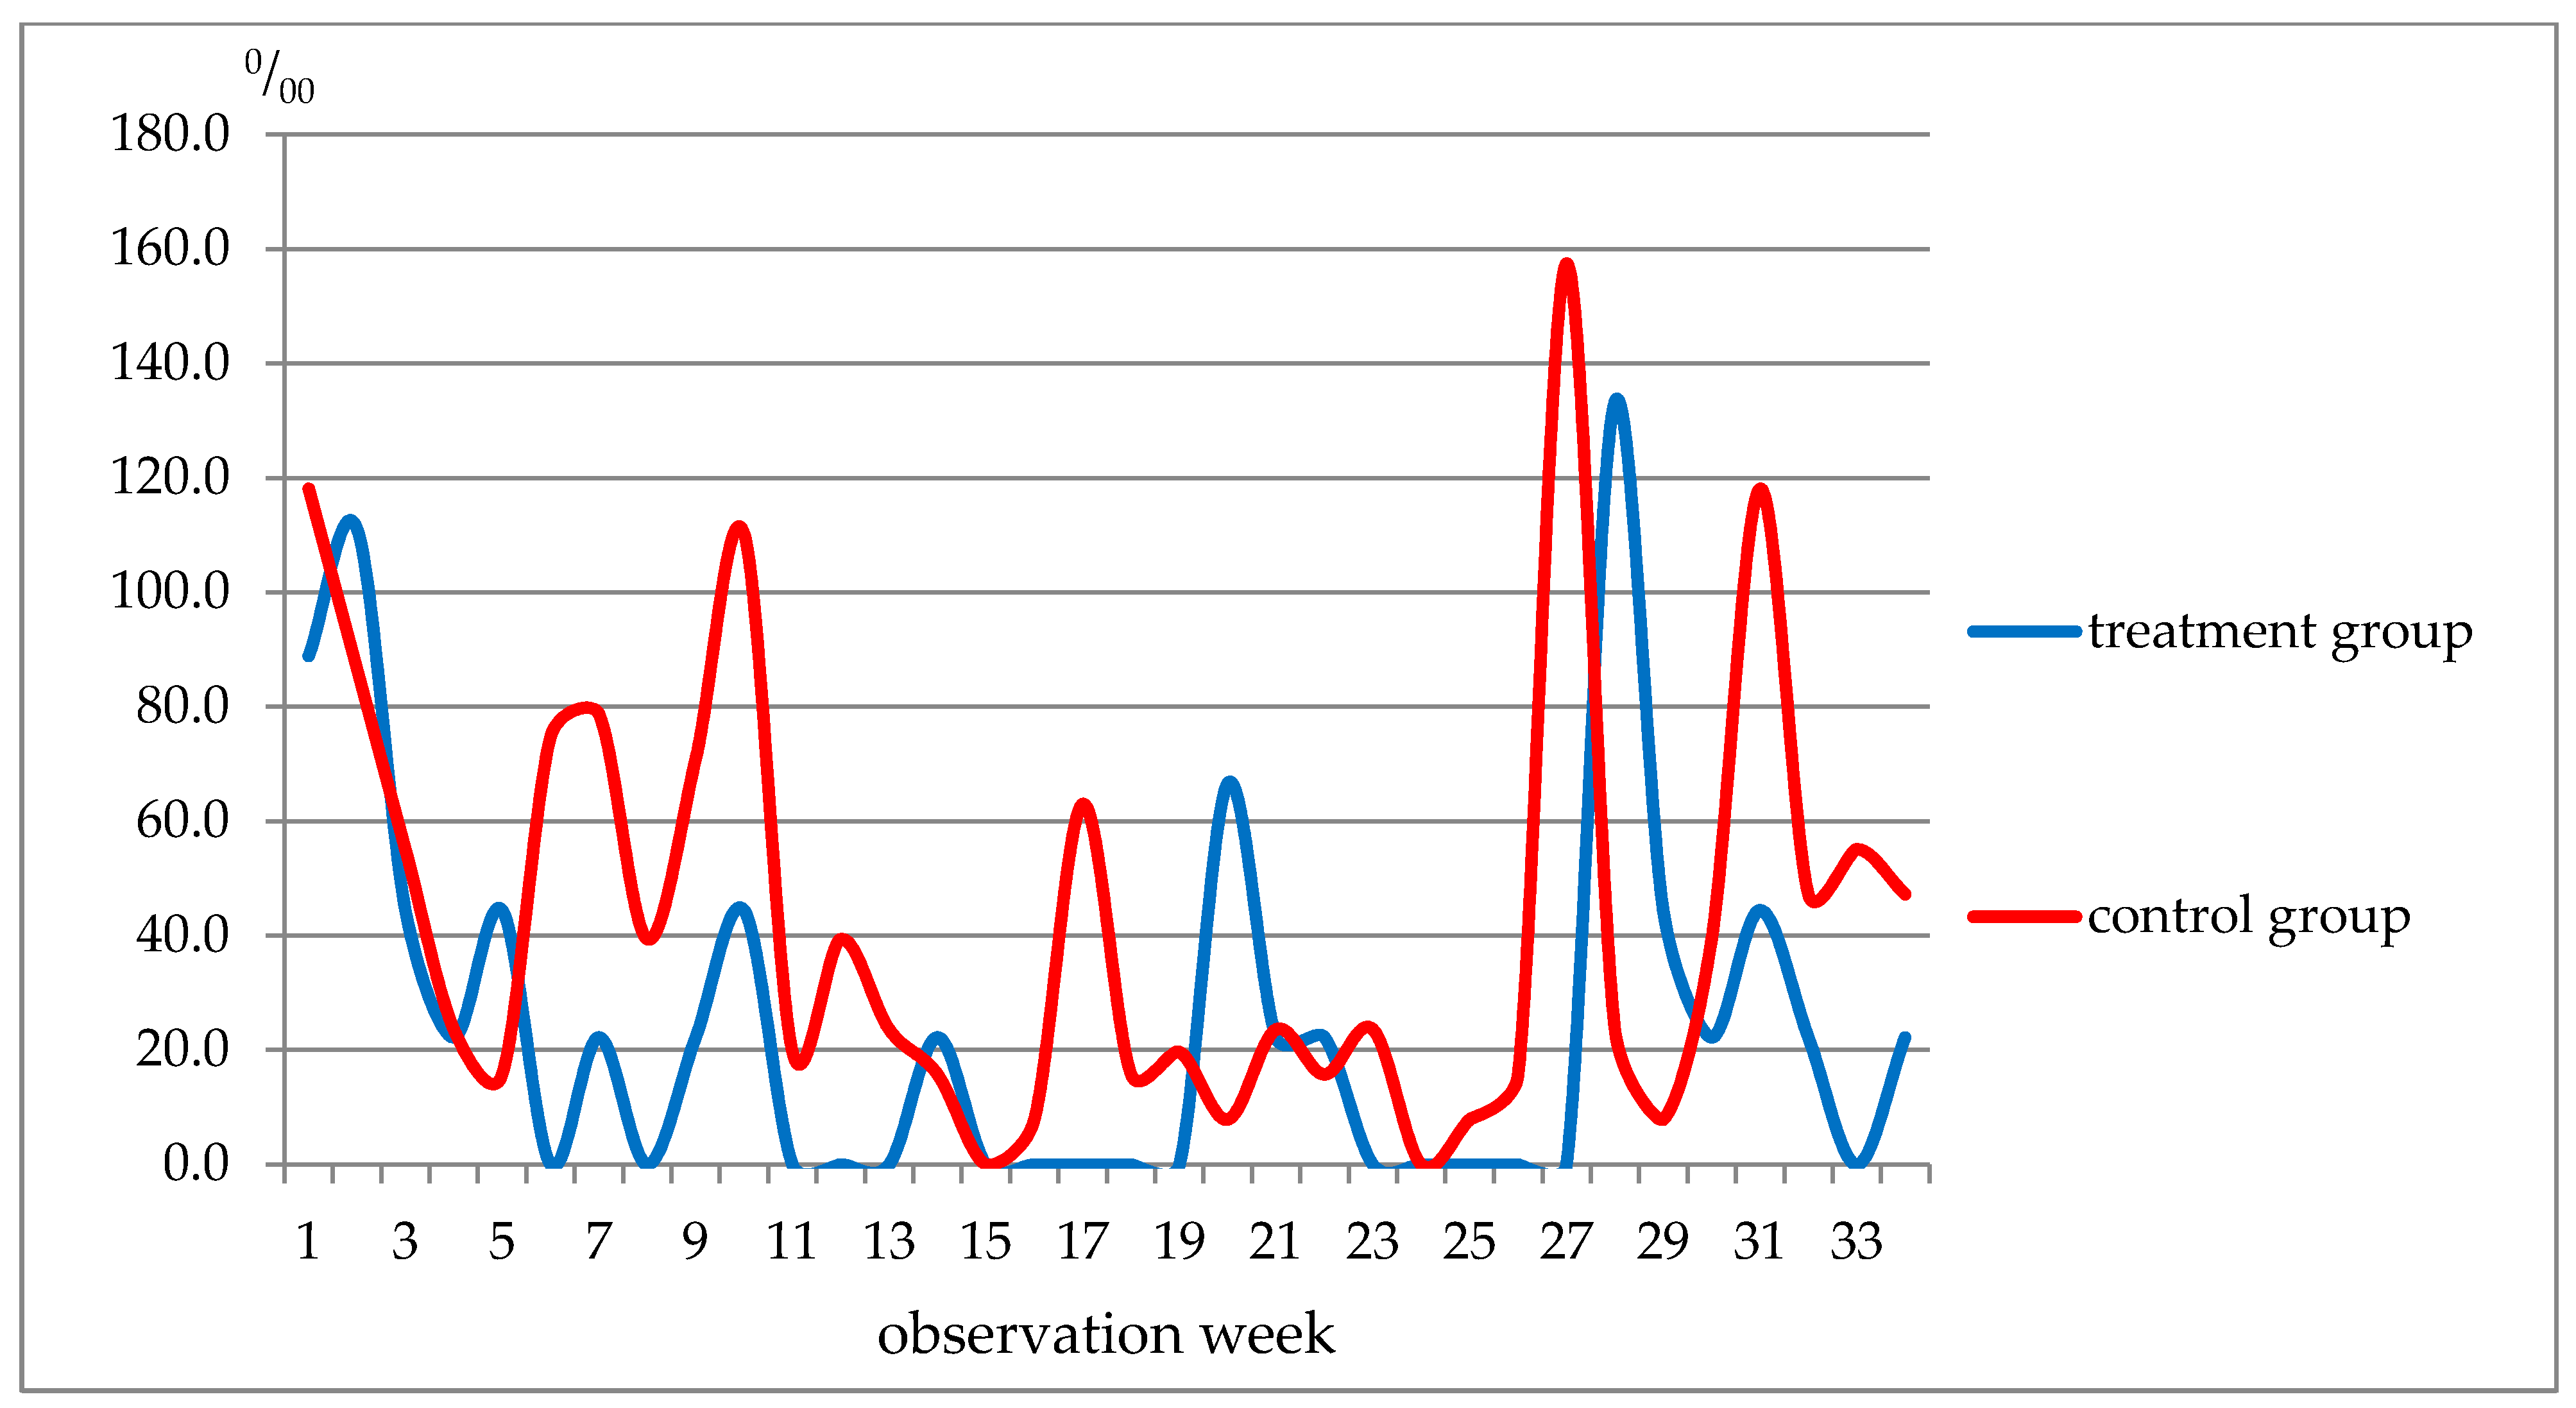
| Week of Observation | Respiratory Diseases, Total | ARI of URT and Flu Included | ||
|---|---|---|---|---|
| Treatment | Control | Treatment | Control | |
| 1–5 | 311.0 | 354.3 | 314.0 | 299.1 |
| 6–10 | 155.5 | 507.9 | 66.7 | 374.0 |
| 11–19 | 88.9 | 228.4 | 0 | 204.7 |
| 20–22 | 66.7 | 47.1 | 66.7 | 47.2 |
| 23–27 | 22.2 | 235.6 | 0 | 204.7 |
| 28–34 | 288.7 | 413.4 | 288.7 | 339.5 |
Publisher’s Note: MDPI stays neutral with regard to jurisdictional claims in published maps and institutional affiliations. |
© 2021 by the authors. Licensee MDPI, Basel, Switzerland. This article is an open access article distributed under the terms and conditions of the Creative Commons Attribution (CC BY) license (https://creativecommons.org/licenses/by/4.0/).
Share and Cite
Tarasov, A.V.; Rakhmanov, R.S.; Bogomolova, E.S.; Perminova, L.A.; Malakhova, Z.L. The Role of Plant-Based Protein Functional Food in Preventing Acute Respiratory Disease: A Case Study. Nutrients 2021, 13, 2116. https://doi.org/10.3390/nu13062116
Tarasov AV, Rakhmanov RS, Bogomolova ES, Perminova LA, Malakhova ZL. The Role of Plant-Based Protein Functional Food in Preventing Acute Respiratory Disease: A Case Study. Nutrients. 2021; 13(6):2116. https://doi.org/10.3390/nu13062116
Chicago/Turabian StyleTarasov, Andrei V., Rofail S. Rakhmanov, Elena S. Bogomolova, Ludmila A. Perminova, and Zhanna L. Malakhova. 2021. "The Role of Plant-Based Protein Functional Food in Preventing Acute Respiratory Disease: A Case Study" Nutrients 13, no. 6: 2116. https://doi.org/10.3390/nu13062116