Article

Eating Habits during the COVID-19 Lockdown in Italy: The Nutritional and Lifestyle Side Effects of the Pandemic

CREA Council for Agricultural Research and Economics—Research Centre for Food and Nutrition, Via Ardeatina 546, 00178 Rome, Italy
*
Authors to whom correspondence should be addressed.
Nutrients 2021, 13(7), 2279; https://doi.org/10.3390/nu13072279
Submission received: 21 May 2021 / Revised: 22 June 2021 / Accepted: 28 June 2021 / Published: 30 June 2021
(This article belongs to the Section Nutrition and Public Health)

Abstract

:
To limit the spread of coronavirus SARS-CoV-2, a nationwide lockdown started in Italy in March 2020. In this unpredictable situation, a cross-sectional study using an online questionnaire was carried out by the Observatory on Food Surplus, Recovery and Waste of CREA Food and Nutrition Centre. The aim of this work was to evaluate how Italian habits changed during this period, the determinants of changes, and the effect on food waste prevention. In a sample of 2678 respondents, 62% showed low Adherence to the Mediterranean Diet (AMD). During lockdown many of participants improved the quality of their diet, increasing their consumption of fruit (24.4%), vegetables (28.5%), legumes (22.1%), nuts (12%), and fish or shellfish (14%). Unfavorable changes were observed with the excessive consumption of sweets or pastries (36.9%) and comfort foods (22.7%), and a lack of physical activity (37.2%). The main novelty of this study was the examination of dietary changes identified by a cluster analysis. Respondents with generally high AMD improved their eating habits, while the habits of the respondents with generally low AMD remained unchanged. In addition, nearly 80% of respondents were sensitive to food waste. The study provides a useful contribution to the debate on nutritional recommendations in case of further lockdown.

Graphical Abstract

1. Introduction

In December 2019, the new coronavirus SARS-CoV-2 broke out in China and spread rapidly around the world, leading the WHO to declare it a pandemic in March 2020. As a response, several governments established measures of physical restrictions to contain the virus; in Italy, an emergency law imposing a complete lockdown in the whole country from 8 March 2020 was passed (Legislative Decree 06/2020). Under this law, people were not allowed to leave their homes except for essential activities such as buying food and medicines or for medical reasons. People were encouraged to work from home whenever possible limiting out-of-home activities to essentials. Such a situation had never occurred in Italy as well as in the rest of the world, where similar lockdowns were imposed.
The lockdown period has had significant socio-economic and psychological impacts. In fact, it has been reported that many people suffered from anxiety, depression, and insomnia [1,2]. At the same time, changes in food habits occurred with an increased consumption of unhealthy food [3,4,5] and more time dedicated to cooking [6]. Public health nutrition experts started to emphasize the importance of eating a balanced diet and maintaining an active lifestyle in order to promote adequate dietary habits during the lockdown [7,8,9]. The Mediterranean Diet (MD) principles were recommended [10] given its effectiveness in protecting health [11,12,13,14,15] and promoting an appropriate performance of the immune system [16,17]. Recommendations also included physical exercise, an important determinant of health [18]. Considering the strong connection between nutrition and the immune system, the recommendations stressed the importance of avoiding either malnutrition or overeating since both have a negative impact on the immune response [19,20,21].
In this complex and completely new situation in Italy, the agri-food sector had an important role since consumers immediately reacted by increasing their food stocks. In fact, during the week of 9–15 March 2020, large-scale distribution sales were 30% higher than the same week in 2019. The types of foods purchased during the restriction period resulted in a strong increase in “emergency products” such as long-life milk, flour, eggs, frozen vegetables, and canned meat [22,23]. This situation was also pointed out by the media, which reported a general modification to Italians’ dietary patterns caused by the restrictive measures.
With the purpose of measuring the ongoing phenomena, the research group of the Observatory on Food Surplus, Recycling and Waste of CREA Food and Nutrition Centre [24] conducted a survey on the Italian adult population to investigate eating habits and lifestyle changes, after the containment measures adopted to limit the impact of coronavirus SARS-CoV-2 spreading. When analyzing the results, consideration was also given to whether institutional guidelines [7,8,25] on health, food, and nutrition were properly followed during this period. As innovative aspect, we focused the assessment on the prevention of food waste, an important issue related the pandemic period in Italy [26]. All these aspects are globally aimed to contribute to the debate on the achievement of Sustainable Development Goals [27].

2. Materials and Methods

2.1. Survey Methodology

A cross-sectional study was carried out on Italian adults (18 years old and above). Participation in the survey was entirely voluntary and anonymous. The study was conducted in agreement with the Declaration of Helsinki [28], and all data were collected and recorded according to the Italian Data Protection Law (Legislative Decree 101/2018) in line with European Commission General Data Protection Regulation (679/2016). The assessment did not involve any invasive procedure nor induced any changes in the participants’ dietary patterns. Therefore, the present web-survey study did not require approval by an ethics committee. Participants were informed about the objective of the research, and they were asked for permission to use and publish the data from the study before starting the data collection. No exclusion criteria were applied.
The questionnaire was distributed through CREA Food and Nutrition Centre institutional website (https://www.crea.gov.it/en/-/emergenza-per-covid-19-on-line-questionario-nazionale-sui-cambiamenti-delle-abitudini-alimentari, accessed on 20 May 2021), social media (e.g., Facebook and Twitter), instant messaging apps (e.g., WhatsApp), and by mailing personal contacts. Google Form® was used for data collection mask creation to a self-reported compilation. This simple non-probabilistic approach to recruit respondents online, by inviting them to follow a link to a survey placed on a web page, email, or other similar means, is defined “river” sampling by [29]. The data collection was opened between the 22 April and 10 May 2020, which was the final period of the confinement in Italy. This timing permitted to have a recent recall of respondents’ behaviors during the days of restriction.

2.2. The Questionnaire

The online questionnaire consisted of 63 items (Supplementary Table S1) and was developed in order to evaluate eating habits and lifestyle changes during the Italian lockdown following the 2020 spring phase of the coronavirus Sars-CoV2 pandemic. The questionnaire was designed by a multidisciplinary group that included nutritionists, public health specialists, and statisticians using literature information and considering different on-going assessments in order to avoid overlapping with other Italian surveys. The questionnaire covered three fields of interest, namely (i) usual adherence to the Mediterranean Diet before the lockdown; (ii) the assessment of dietary pattern changes during the lockdown; (iii) the assessment of lifestyle changes during the lockdown.
The first part of the survey covered sociodemographic information (gender, age, region of residence, education) and self-reported weight and height. After this, the 17-item questionnaire by the PREDIMED PLUS study [30,31,32] was used to investigate the respondents’ usual adherence to the Mediterranean Diet. This module was integrated with a specific question on water consumption. The questionnaire asked for the frequency of traditional Mediterranean food consumption (daily or weekly) defining the portion or asking for the use of food with “yes or no” options or the preference between different food options. With respect to the original PREDIMED PLUS questionnaire [32], the portion sizes were modified according to those defined by Italian nutritional recommendations, using the country specific Food-Based Dietary Guidelines [33]; the portion sizes used in this assessment are reported in Table S1. No other changes were introduced in terms of food groups, scoring, and the calculation of adherence to the Mediterranean Diet. To evaluate changes in food consumption during the lockdown, the respondents were asked to consider whether there had been any variations in the items listed (an increase, a decrease or same as before). In addition, changes in general eating habits and lifestyle were analyzed using the Likert scale with five levels (1 Strongly disagree, 2 Disagree, 3 Neither agree nor disagree, 4 Agree, 5 Strongly agree) [34]. Specific questions were addressed on food purchases, management of leftovers (food waste prevention), meals habits (conviviality), physical activity, perceived body weight increase, and on opinions regarding vulnerable population groups, i.e., children and adolescents, if present in the family, and the elderly.

2.3. Statistical Analysis

Respondents transmitted the completed questionnaire to the Google platform and the final data base was downloaded as a Microsoft Excel sheet. The “river sampling” technique used in this study does not ensure that the population structure is captured in the sample composition, so a weight system based on the Italian population statistics [35] was adopted for gender, age class, and region of residence. The magnitude of the educational level bias was too big to be weighted without creating further errors. Descriptive statistics were carried out on categorial and continuous variables.
Based on the PREDIMED PLUS scoring, adherence to the Mediterranean Diet (AMD) was categorized into four categories: low (score 0–6), low to moderate (score 7–8), moderate to high (score 9–10), and high (score 11–17) [32]. To quantify changes in AMD during lockdown, the methodology of Molina-Montes et al. [36] was adapted to the data of the present assessment. Specifically, 1 point was assigned to changes in line with Mediterranean Diet recommendations, and 0 points were assigned to changes not in line with Mediterranean Diet recommendations, and 0 points were assigned for food intake that did not change. This means that 1 point was given when respondents reported an increase in the consumption of foods that contribute positively to AMD, such as olive oil, vegetables, fruit, whole grain cereals, legumes, fish and shellfish, nuts, white meat, and sofrito. Similarly, 1 point was given when a decrease was reported in the consumption of foods not characterizing the AMD (i.e., white bread, red meat, butter and margarine, sugary drinks, sweets and pastries, beverages with sugar added, non-whole wheat pasta and rice, and wine. Points were added up and based on quartiles distributions, 4 changing classes were defined: no changes (score 0), small changes (score 1–2), medium changes (score 3–4) and large changes (score > 4).
A contingency analysis was performed to respond to the research question of evaluations of potential connections between the different variables, e.g., to have the possibility to evaluate changes in food consumptions during the lockdown, analyzing various quantitative and qualitative variables at the same time, with possibility of identifying the changes with the greatest influence. This common statistical approach is based on processing double-entry tables and the assessment of chi-squared statistics.
A multivariate data analysis was carried out to identify dietary change patterns. Specifically, the analysis was conducted in two steps. In the first step, the dimensions of the consumption changes were identified by applying the Nonlinear Principal Component Analysis (NL-PCA) [37,38,39] to the 18 ordinal variables of food group consumption variations during the lockdown, categorized at three levels, labelled as 1 = decreased consumption, 2 = same consumption as before, 3 = increased consumption, respect to usual dietary patterns in the period prior to the lockdown. The relevant dimensions were selected following Kaiser’ s rule [39]. Subsequently, individuals were classified in respect to the dimensions identified by performing a two-stage cluster analysis [39]. In the first stage, the hierarchical Ward method was adopted to identify the optimal number of groups; in the second stage, the non-hierarchical k-means algorithm was applied to define clusters [40]. Finally, the cluster profiles were arranged in tables reporting percentage in the cluster of main important items. Specifically, a chi-squared test was performed to check significant differences (p < 0.05) between the percentage in the cluster and the percentage in the rest of the sample.
A statistical analysis was performed using the IBM SPSS Statistics, version 25.
The overall number of people who participated in the online survey was 2878. The final sample consisted of 2768 participants. Hence, after the data cleaning, the percentage of valid questionnaires was 96%. The 110 subjects not included in the sample did not provide their consent on personal data processing and, even with the completion of the questionnaire, were excluded from the analysis.

3. Results

3.1. Sociodemographic Variables

The participants came from all regions of Italy, with a prevalence of respondents from Northern regions (46.1%). Men and women were equally distributed (48.2% and 51.8% respectively), with ages mainly ranging from 30 to 69 (65.1%), and with high educational level (69%). The details of the sociodemographic characteristics of the sample are reported in Table S2.

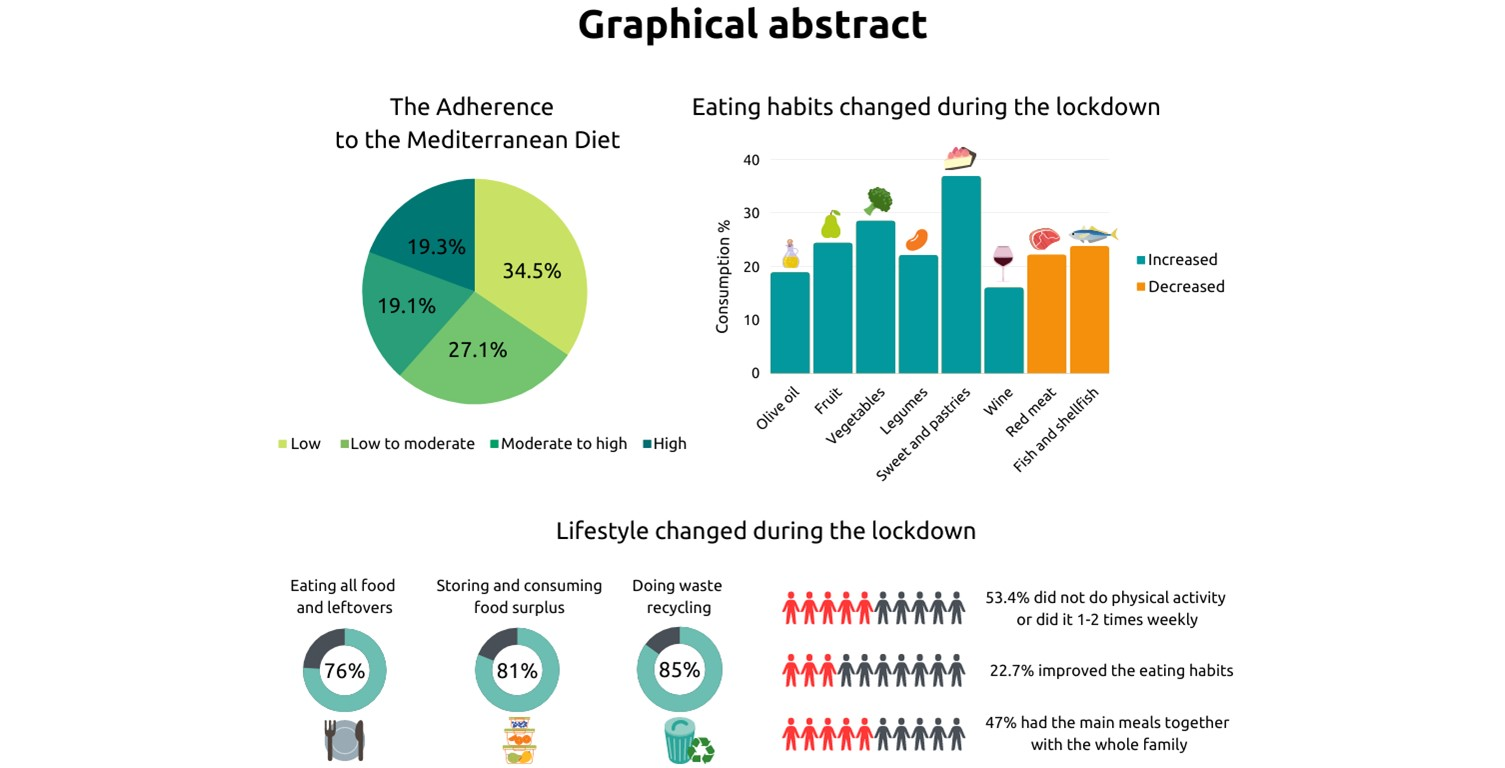
3.2. Adherence to the Mediterranean Diet (AMD) before the Lockdown

More than half of the sample (62%) showed lower AMD (low 34.5%; low to moderate 27.1%). Moderate to high AMD (19.1%) and high AMD (19.3%) were reported by the rest of respondents with the same proportion.
In our sample, dietary habits in line with the Mediterranean Diet recommendations were frequently observed, as far as concerning the frequency of the consumption of vegetables and nuts, whole grain cereals (i.e., bread, pasta, rice), and legumes. Sugary drink consumption was reported by one fourth of respondents, and most participants declared not using butter and margarine as added fat, preferring to use olive oil. The consumption of wine in this sample was generally very low. Eating habits different from Mediterranean Diet recommendations were reported by nearly half of the sample, who consumed red meat more than once a week and did not follow the correct consumption of whole grain cereals. In addition, adding sugar to drinks was a common habit and eating sweets and pastries was frequently reported, three or more times per week (Table S3).

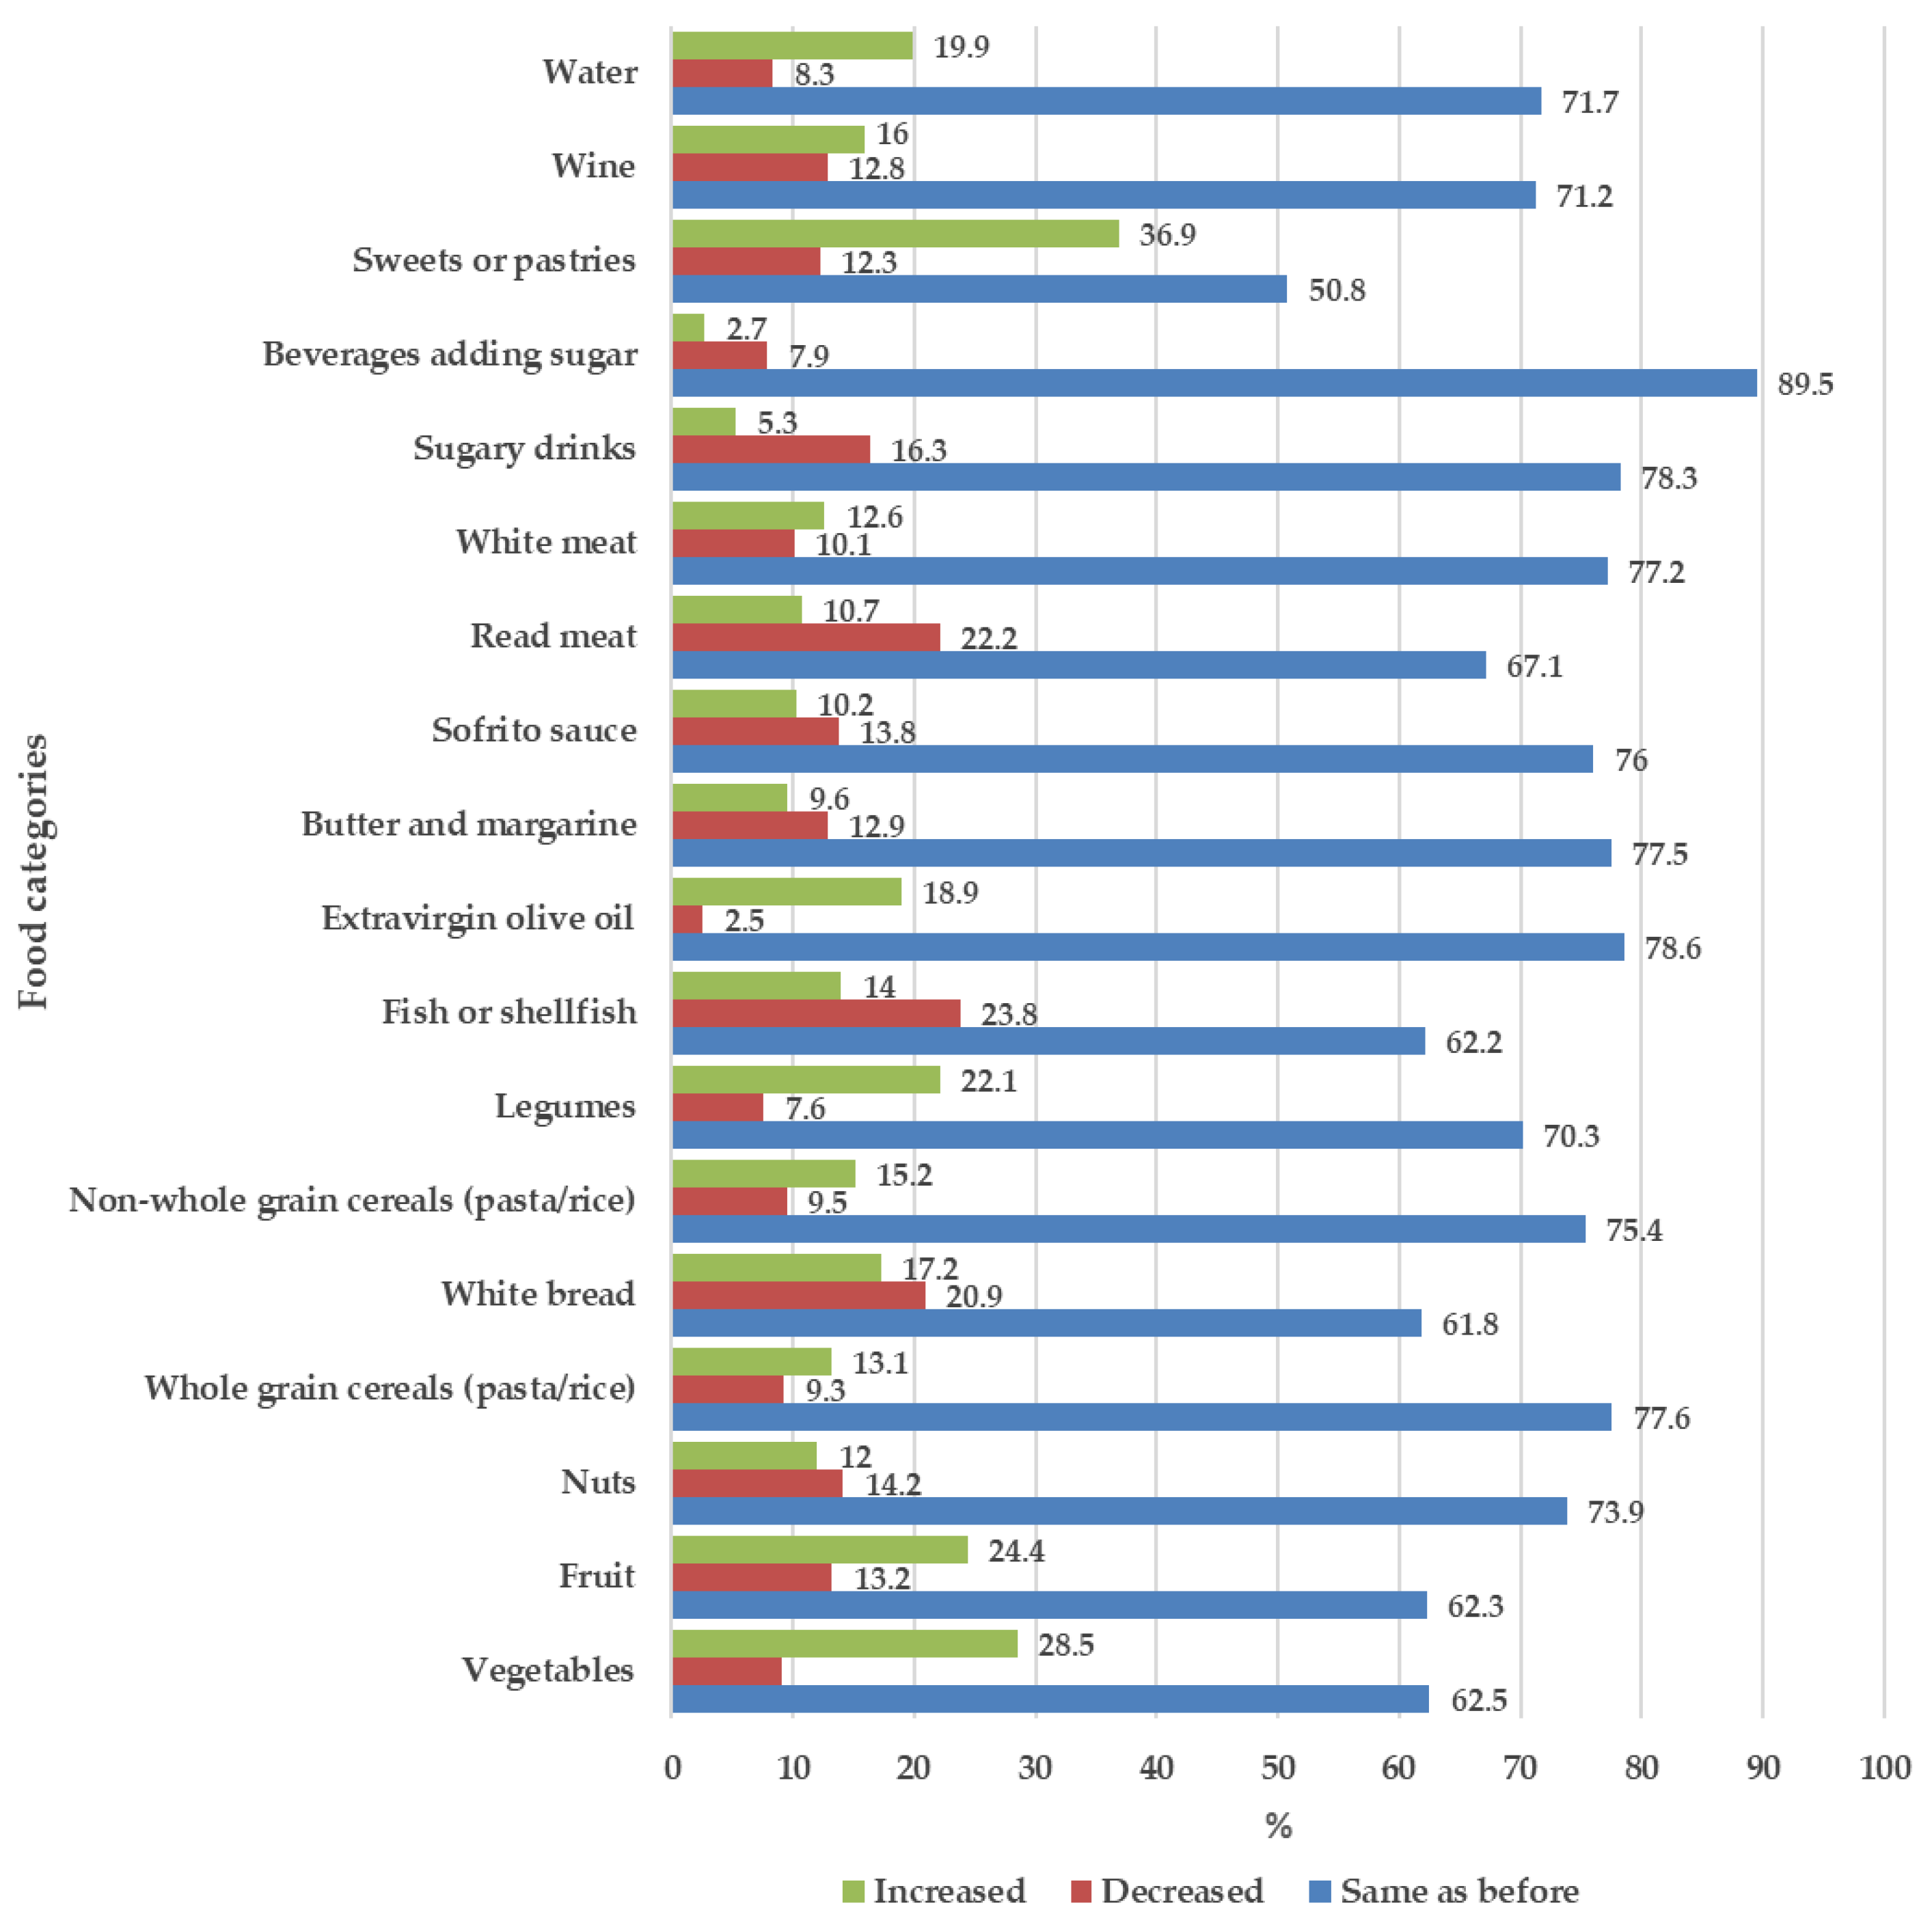
3.3. Changes in Eating Habits and Lifestyle during the Lockdown

To evaluate the effect of the lockdown on Italian food habits, changes in the consumption of typical Mediterranean Diet food were asked, and the results were reported in Figure 1. For several items, the dietary changes during the confinement led to a consumption pattern more in line with the Mediterranean Diet principles, given the increase in the consumption of vegetables (28.5%), fruit (24.4%), water (19.9%), legumes (22.1%), olive oil (18.9%), nuts (12%), whole grain cereals (13.1%), and fish or shellfish (14%). Other elements in line with the Mediterranean Diet principles were the reduction in consumption of red meat (22.2%), sugary drinks (16.3%), and butter and margarine (12.9%). The confinement period was also characterized by changes in consumption patterns that worsened the dietary profile of the respondents. In fact, the intake of sweets and pastries (36.9%) and wine (16%) increased. In addition, although a small percentage of respondents increased their fish and shellfish consumption, almost a quarter (23.8%) reduced the intake of these foods.
In Table 1, the results of a set of questions aimed to describe the behavioral changes during the restriction period are reported. Regarding food purchasing and cooking, 28.8% of the sample paid attention to food prices and around 50% of respondents did not change their usual cooking habits. However, for approximately one third of them, the lockdown led to an improvement in their cooking abilities and their willingness to try new foods. In this sample, an awareness of food surplus and waste was reported by nearly 80% of participants who claimed to consume all the food they cooked and reported to have had the capacity to store surplus and consume the leftovers. In terms of the perceived quality of the diet, 45.5% of respondents did not report an improvement in their eating habits, with 22.6% of people increasing their consumption of comfort food, 19.2% that increased the consumption of snacks, and 35.3% reporting the need to go on a diet to lose weight. A very high proportion of the sample (85%) did not find any difficulties in doing a separate collection of waste. Finally, 66% of the participants believed that the elderly experienced problems in buying food and suffered from isolation.
Physical activity levels and perceived body weight changes are reported in Figure 2. A sedentary lifestyle was very common with most of respondents that did not perform exercises as recommended (64.5%) (Figure 2a). This reflects the perception of an increased body weight reported by more than 30% of participants at different levels Figure 2b. This result is line with Q12 of Table 1 in which around one third of respondents declared the need to go on a diet to lose weight.
As a conviviality indicator and considering the changes in household practices because of the lockdown, breakfast habits and children’s involvement in cooking activities were specifically investigated. A large proportion of respondents did not change the breakfast habits, while 12.1% of them declared to have had more time for breakfast with whole family (Figure 3a). One third of the families reported an increased involvement of children in the kitchen activities with a specific interest in learning new things on food and nutrition (Figure 3b). These results are paired with the answers of Q15 of Table 1 in which 47% of respondents reported having increased the occasion of conviviality during the lockdown.

3.4. Effects of Lockdown on the Relationship between Adherence to the Mediterranean Diet (AMD) and Eating Habits and Lifestyle Changes

Firstly, to evaluate the magnitude of food habit changes during the lockdown in relation to the usual AMD, an estimation was made summing up the number of changes in line with Mediterranean Diet recommendations. The higher the score of classes of changing, the higher the improvement in the usual dietary habits, measured with AMD. The results are shown Table 2 (Total column). For 26.4% of participants the lockdown had no impact on dietary habits (no changes, score 0), 30.6% experienced small changes (score 1–2), while 20.7% and 22.4% showed a progressive improvement in dietary habits in line with the Mediterranean Diet (moderate-score 3–4 and large changes-score > 4, respectively). Secondly, the usual AMD was compared with the dietary pattern changes during the lockdown, showing that the “no changes” group had a significantly higher proportion of low AMD (32.7%), while in the “large changes” group there was a preponderance of high AMD (30.1%) (Table 2).
A further analysis showed how the AMD groups changed food consumption (Table 3) and lifestyle (Table 4).
Statistically significant differences among high and low AMD groups were observed for the consumption of some foods either in term of intake increasing or decreasing. As reported in detail in Table 3, respondents with high AMD reported an increase in the consumption of nuts, whole grain cereals, fish or shellfish, and legumes and a considerable reduction in consumption of red meat, sweets and pastries, and sugar added to beverages, while sugary drinks intake remained unchanged. In addition, during the assessed period, the group with high AMD respect to that with low AMD, followed closely the recommendations drinking more water than usually and reducing the intake of wine with statistically significant differences. On the other hand, respondents who have a low AMD did not change consumption of whole grain cereals, and legumes, and 7.9% of them reduced the consumption of vegetables compared to respondents with the highest index. Moreover, the low AMD respondents increased the consumption of pasta and rice, and white bread, red meat, butter and margarine, sweet and pastries, and sugary drinks more than high AMD category. In addition to this, people with low AMD decreased wine consumption less than the others.
As shown in Table 4, respondents with high AMD (moderate to high, and high) improved their eating habits more than those with low AMD who also reported an increased consumption of comfort food and that they needed to go on a diet to lose weight more than respondents with high AMD.

3.5. Ponderal Status (BMI) and Changes in Eating Habits

Most of the assessed respondents had a BMI corresponding to normal weight (57.1%), whereas 29.1% were overweight and 10.3% obese. A very small proportion of the sample had BMI values corresponding to underweight (3.5%). Normal BMI values were frequently reported by respondents who have higher AMD (64% moderate to high and 60% high). On the other hand, low AMD resulted most common in respondents with BMI corresponding to underweight (5%), overweight (33%), and obese (15%). These data are not shown in the tables below.
The relationship between BMI classes and dietary changes during the lockdown period showed that underweight people generally maintained the same eating habits. Details of the food group consumption changes are reported in Table 5. In general, this group did not change the consumption of 14 items (olive oil, fruit and vegetables, legumes, fish and shellfish, nuts, sofrito sauce, wine, water, beverages with added sugar, white bread, red meat, butter and margarine, sugary drinks). A similar trend was seen for normal weight respondents, with 9 items (olive oil, fruit and vegetables, white bread, legumes, beverages with added sugar, sofrito sauce, non-whole pasta and rice, and water) remaining unchanged. On the other hand, overweight and obese respondents reported significant modifications in their consumption of different types of food. It was observed that overweight and obese respondents declared to have increased the use of olive oil more than underweight and normal weight respondents. Almost all underweight and normal weight respondents did not change their habits related to olive oil use and fruit and vegetables consumption. All groups reported an increase in consumption of vegetables with higher differences only for the group of obese respondents who also increased their intake of legumes and fish or shellfish. Considering foods that were less consumed, obese respondents decreased the intake of sugary drinks and wine and avoided adding sugar to beverages more than the other categories. Finally, although sweet and pastries consumption increased in all categories, there was a percentage of obese respondents which reduced the consumption of these food more than the other categories.

3.6. Dietary Change Patterns Clusters during the Lockdown

The results of the NL-PCA led to consider the first 4 components as synthetic indicators of food consumption changes, explaining 47% of variance (data not shown). Cluster analysis applied to the 4 considered components led to identifying 4 groups of individuals (Table 6; Table S4). Group 1, the “healthy eaters” and group 4, the “more eaters” included respondents who increased food consumption of all food categories (group 4) and mainly of healthy foods (except for sweets and pastries) (group 1). Group 2, the “less eaters” included respondents who decreased overall food consumption and group 3, the “usual eaters” who included those that did not change their food consumption pattern.
The 4 groups were profiled according to the socio-demographics, AMD, BMI, body weight changes, and physical activity (Table 7), and to lifestyle and eating habits (Table S5). These groups can be further characterized. All results were statistically significant. The “healthy eaters” were mainly women and elderly, had high AMD and reported an improvement in eating habits. A large proportion of them shared their meals with the whole family (49.4%) and reported difficulties in finding food they needed. Even with predominantly favorable dietary changes, these respondents declared that they had eaten more comfort food, gained weight (3–5 kg), and had been sedentary.
The “less eaters” group included mainly men (66.3%), and respondents with polarized age, including young (18–29 years) (21.5%), and old people (50–69 years) (47.7%). The “less eaters” had low to moderate AMD (41.9%) and reduced physical activity (16.6%, less frequent). Moreover, most of this group respondents found difficulties in finding food that they needed (34.9%) and paid attention to prices (35.7%). A positive characteristic of the “less eaters” group is having shared the meal with the whole family (52.9%).
In the “usual eaters” group a high prevalence of women (54.9%) and elderly (26.2%) was observed. The AMD of the “usual eaters” was lower (38.6%) with respect to the other groups. The respondents included in this group declared that they did not need to go on a diet (50%), and a high prevalence of them were sedentary (39.1%). The attitude of not changing the dietary intake of the “usual eaters” was coupled with the similar trend in their habits resulting in not having cooked better (29.4%), not having improved their diet (52.8%), and having always had the same cooking habits (53.6%).
In the “more eaters” group there was a preponderance of women (53.1%) and people aged 18–29 (20.3%) and 30–49 years (44.2%). These respondents increased their intake of comfort food (25.7%) and snacks (24.6%) and reported the intention to go on a diet (44.6%), having declared to performing physical activity at an insufficient level (less than 1 or 2 times per week) (14.8%). In addition, even though these respondents found difficulties in finding food (30.5%), they claimed to have improved their cooking (46.9%), to have tried new foods (51.7%), and changed their cooking (33.9%). The “more eaters” claimed to have improved their general eating habits (36%) and reported sharing the meal with the rest of the family more than the others (63%).
Respondent behaviors concerning food waste was similar in all groups. No differences were found in the assessment related to the ability to store food correctly, and to perform separate collection of food waste, both practices were shared by around 80% of each group respondents. In addition, most of them (around 70%) declared to have consumed all food stored included the leftovers, however, the “healthy eaters” were more keen than other groups in adopting these practices (83.1%).

4. Discussion

This paper describes the changes in eating habits and lifestyle that occurred during the period of the containment measures which were adopted to limit the impact of the spread of coronavirus Sars-Cov-2 in Italy during spring 2020. The objective of the assessment was to provide a picture of a unique situation, and to evaluate if, and to what extent, consumers, were following the dietary recommendations that experts and institutions provided. This goal was largely accomplished, considering that the present paper has aspects of similarity with other assessments carried out in the same period but also provides new and complementary information on the topic since the lockdown started. In fact, the findings resulting from the data analysis and pooled variables presented here provided additional information and an original vision of the effect of the lockdown on dietary behaviors and lifestyle changes.
An important finding that comes from this assessment is that a large prevalence of the participants, during the lockdown period, seems to have followed the dietary recommendations, increasing their consumption of healthy foods such as legumes, fruit and vegetables and whole grain cereals. Thus, the present data do not confirm the worsening of the dietary profile as stated by Ammar et al. [41] in a survey covering Europe, North-Africa, Western Asia, and the Americas carried out during the isolation period. In fact, in Italy, the scenario was different considering that other studies reported an increased adherence to the Mediterranean Diet and a highest intake of healthy foods during the confinement [3] as well as most sustainable food choices with increased consumption of organic and locally grown food [42]. It is interesting to point out that another Mediterranean country, Spain [43], also reported the adoption of healthier dietary habits and increased adherence to the Mediterranean Diet during the confinement period.
Commonly, when dietary changes occur, improvements in the quality of the diet can be counteracted by unhealthy eating behaviors. As observed in other studies [41,44], in our sample, an increase in consumption of sweets, pastries, comfort food, and red meat was observed, alongside with a decrease in the consumption of fish and shellfish, as modifications of dietary habits not coherent with the recommendations. The changes observed in the present sample reflected the national trend of food purchasing reported by the Service Institute for the Agri-Food Market (ISMEA) study carried out in Italy during March 2020 showing that, during the first period of the lockdown, there was an increased demand for canned goods, comfort food, and a decrease in the sale of fresh products [22]. On the other hand, the improved eating habits and cooking skills together with the willingness to try new foods and recipes reported by many of our respondents correspond to another research carried out by the same institution that continued to monitor the agri-food purchases system during the pandemic outbreak. In this further study carried out in April 2020, ISMEA highlighted that after an initial period in which consumers bought long-life products, they then changed their purchasing habits mainly towards ingredients for cooking, such as flour, yeast, sugar, eggs, and butter [23]. These results confirmed that consumers became more careful about the quality of food they were cooking, also reducing the purchasing of ready-to-use foods. The fact that our results are in line with these findings represents a methodological reinforcement of the outcomes we obtained, given that, despite using a non-probabilistic sample, we observed the same tendencies showed by a national representative assessment.
In brief, we observed an improvement in the quality of the diet considering the reported increased consumption of healthy foods and the reduction in consumption of some foods not in line with the Mediterranean Diet. However, the increase of the frequency of consumption of certain food categories (e.g., olive oil) and the increased consumption of sweets, pastries, and comfort foods coupled with physical activity reduction, could be claimed to be responsible for the perceived increased body weight. The sedentary lifestyle and the weight gain reported in this study are confirmed by others similar studies performed in Italy [3,42,45]. In addition to these, our work is in line with the conclusions of a recent scoping review carried out by Bennett et al. [46] which reported that the lockdown had both positive and negative impact on dietary practices across Europe and worldwide, and negative eating habits were associated with other lifestyle outcomes as weight gain and a reduced physical activity. Moreover, findings on physical activity, weight gain, and some dietary changes (sweets, vegetables and fish) are in line with the results of a study carried out in Austria, Poland, and the United Kingdom by Skotnicka et al. [47].
More than a half of respondents of this survey has low adherence to Mediterranean Diet. In other surveys carried out in Italy or in other Mediterranean countries during the pandemic, the Mediterranean Index was used mainly to evaluate the changes related to lockdown, hence it is difficult to make comparison. However, the proportion of respondents of our sample with low adherence to Mediterranean Diet deserves attention. These results need to be confirmed by other assessments with a sampling that allows a generalization of the outcome. However, in Bonaccio et al.’s [48] study that surveyed a Southern Italy large cohort (113.262 subjects), higher income and education were independently associated with a greater adherence to Mediterranean Diet. Among our sample subjects, the high educational level was overrepresented, so we could speculate that in a comprehensive sample including a greater proportion of low educational level, the low adherence to Mediterranean Diet could be higher than that observed in the present study.
A further novelty of this assessment with respect to others published on the same topic, was the cluster analysis that provides an overview on the effects of lockdown on subjects studied and how food consumption changes were related with other variables. The confinement polarized behaviors, with people who already had a high AMD increased their consumption of healthy food (the “healthy eaters”). Consumers with good eating habits were also the keenest to follow the recommendations during the lockdown. On the contrary, respondents that did not change their consumption pattern, the “usual eaters” were those having usual low adherence to the Mediterranean Diet. For this category the lockdown exacerbated a situation that was already unfavorable [44]. However, an increase in the consumption of comfort foods was observed in all groups as a possible compensation for the negative emotions caused by ongoing emergency and the bad news coming from the media or, simply, as consequence of the boredom of staying at home [49,50].
As mentioned, we observed an increase in body weight and sedentary lifestyle. These findings could be interpreted in the light of the results from the cluster analysis showing that low levels of physical activity were reported frequently by all groups regardless of their consumption patterns. Moreover, the cluster analysis also highlighted many of socio-economic aspects of the lockdown that deserve comments. The “less eaters” group paid attention to food prices and found difficulties in buying food. These results may be a consequence of the lack and/or loss of job that impacted on the youngest [51,52], and the isolation which affected the oldest [53,54], considering the high prevalence of these population groups among the “less eaters”. Related to this, the results concerning the elderly showed that even though there was a percentage of this population group that followed MD recommendations, they had also the attitude to not change their eating habits and not improve their food consumption, confirming the fact that this population group often needs nutritional intervention to improve the quality of their diet. Children were to some extent involved in the kitchen and food preparation activities during lockdown. Targeting this population group in educational campaigns in this period was an important initiative [55] also considering the high level of childhood obesity in Italy [56] and the worsening of this situation globally due to the pandemic [45,57].
To conclude the analysis, two other aspects of lifestyle should be noted. Firstly, the habit of eating together increased positively among most of the respondents (groups 1 “healthy eaters”, group 3 “usual eaters” and group 4 “more eaters”). Secondly, all the participants to this study were, without relevant differences between the 4 groups, very sensitive to the problem of food waste. These findings are promising since they may be a signal of the increased attention of Italian consumers towards the negative consequences of throwing away food. Other studies confirmed the attention of Italian consumers to food waste both during the lockdown [58,59] and before the pandemic [60].
In addition to consumers’ behavior changes, the coronavirus crisis is causing many problems and is worsening pre-existing conditions. Many people around the world have lost their jobs and inequalities related to wealth, income level and social protection have exacerbated [61,62,63]. Moreover, food insecurity [64] increased among who have already suffered from poverty in developing countries [65] but disparities came out also in developed countries [66,67]. The suggestion that comes from this study is that the food system in Italy at the household level during the first lockdown was an important element to maintain a daily acceptable routine for the whole family in a pandemic situation which had relevant socio-economic impacts. This situation should be the starting point to reorganize the system during the recovery and to be more aware of how to handle a possible similar future crisis.
A limitation of this work is related to the bias of the “river sampling”, as far as possible limited using weighted data that corrected the sociodemographic structure of the sample since Italian population statistics [35]. The “river sampling” has advantages and disadvantages. The facility to reach a large number of participants at limited costs widespread the application of this method, especially during the lockdown period. This tendency is increasing independently from the restrictions of the pandemic. In fact, despite limitations, non-probabilistic online surveys are now frequently used to make claims about the general population in social science and policy research. According to Lehdonvirta et al. [29], this kind of sampling can be used to describe certain phenomena and their safest use is in examining members of the sample itself. In addition, this sampling could be used to make tentative inferences, but the effect sizes would not be accurate, and could be affected by the selection biases. We perform the analysis of the data in light of these methodological inputs treating the sample as is and considering possible bias. For example, the high educational level of the participants of this survey, could partially explain the increased quality of the dietary patterns observed in our and other opportunistic samples selected with similar methodology. This is a limitation of the studies carried out during the lockdown, but it is also true that to accomplish the objective of providing a picture of that specific moment no more other options were possible, considering the restrictions and, above all, the need to perform the data collection without the appropriate planning. Other limits of this study consist of the self-reported answering that could affect the reliability of the responses and the fact that eating habits were based on participants’ perception of food intake that may not reflect true intake during lockdown. However, the large sample size and the confirmation of our results with other similar survey support the quality of the data collected.

5. Conclusions

The results of this study together with the other assessments carried out in the same period and in different population groups, showed that the lockdown in Italy improved the quality of diet but had negative effects both on the quantity of food consumed and on the levels of physical activity. This situation led to a general increase in body weight and to an exacerbation of sedentary lifestyle that was already common in Italy. These conditions should be carefully considered as detrimental changes with potential significant impact across the population groups, in particular, for the most vulnerable, such as the elderly. Nevertheless, the involvement of children in kitchen activities, the increased occasions of conviviality, and the attention on the issue of food waste should be considered important positive habits to highlight.
This survey should be considered an important element that allows to consider nutritional aspects in the framework of the pandemic approach, given that the pandemic is still on-going and because also in 2021 people experienced different levels of confinements that exposed them to the same detrimental conditions. An additional value of this assessment is the timing. Having distributed the survey until nearly the end of the first lockdown period, the data collection provided a comprehensive overview about how consumers adapted their habits to this unpredictable situation.
Even though the acute phases of Coronavirus disease 2019 are increasingly under control thanks to the ongoing vaccination campaigns that is reducing deaths and severe cases, the overall consequences of the pandemic period would significantly impact on people nutritional status as shown in this paper and at larger extent on the health system. The increase in unhealthy dietary habits and deterioration of nutritional status found in this study may contribute to a general decline of health among population groups, considering that being overweight and obese makes individuals more susceptible to chronic health conditions and diseases.
Future public health actions should consider the worsening of people’s nutritional status one among other long-term health consequence of the pandemic.

Supplementary Materials

The following are available online at https://www.mdpi.com/article/10.3390/nu13072279/s1, Table S1: The Questionnaire; Table S2: The sample–sociodemographic variables; Table S3: Food categories consumption before lockdown: frequency or typology; Table S4: Cluster analysis: food consumption patterns, 4 groups; Table S5: Cluster analysis, the relation between the 4 groups and eating habits and lifestyle changes.

Author Contributions

The authors’ responsibilities were as follows—The research questions, conceptualization, and design of the study were carried out by L.R., U.S. and M.L.S.; the methodology was revised by M.L.S. and A.T.; database compilation was carried out by U.S.; data were analyzed by M.L.S. and A.T.; data interpretation was undertaken by F.G., L.R., M.L.S., U.S. and A.T.; writing and original draft preparation was carried out by L.R. and F.G.; writing, review, and editing were carried out by L.R., F.G., U.S., M.L.S. and A.T. All authors have read and agreed to the published version of the manuscript.

Funding

The publication of this research was possible thanks to the funds of the project FAOWASTE: “Food waste in Italy: international policies and measurements” (No. 23278-27.12.2019) granted by the Italian Ministry of Ecological Transition.

Institutional Review Board Statement

The investigations were carried out following the rules of the 1975 Declaration of Helsinki (https://www.wma.net/what-we-do/medical-ethics/declaration-of-helsinki/, accessed on 22 February 2021), revised in 2013. Ethical review and approval were waived for this study because it did not involve any invasive procedure (e.g., fecal samples, voided urine, etc.) or laboratory assessment or induced lifestyle changes or dietary intake modifications.

Informed Consent Statement

Before starting the data collection, participants were informed about the objective of the research and the consequent statistical analysis. They were free to decide to be involved in the survey and were asked to fill in the self-reported questionnaire in anonymity. Informed consent for participation and for personal data management was obtained asking participants to tick on a dedicated item before starting the questionnaire.

Data Availability Statement

The archived data and all the elaboration and analysis generated and used for presentation of results in this study are fully available on request from the corresponding author.

Acknowledgments

The authors thank the respondents that so numerous participated to the survey and permitted the production of interesting results.

Conflicts of Interest

The authors declare no conflict of interest.

References

  1. Di Renzo, L.; Gualtieri, P.; Cinelli, G.; Bigioni, G.; Soldati, L.; Attinà, A.; Bianco, F.F.; Caparello, G.; Camodeca, V.; Carrano, E.; et al. Psychological Aspects and Eating Habits during COVID-19 Home Confinement: Results of EHLC-COVID-19 Italian Online Survey. Nutrients 2020, 12, 2152. [Google Scholar] [CrossRef]
  2. Moccia, L.; Janiri, D.; Pepe, M.; Dattoli, L.; Molinaro, M.; De Martin, V.; Chieffo, D.; Janiri, L.; Fiorillo, A.; Sani, G.; et al. Affective Temperament, Attachment Style, and the Psychological Impact of the COVID-19 Outbreak: An Early Report on the Italian General Population. Brain. Behav. Immun. 2020, 87, 75–79. [Google Scholar] [CrossRef] [PubMed]
  3. Di Renzo, L.; Gualtieri, P.; Pivari, F.; Soldati, L.; Attinà, A.; Cinelli, G.; Leggeri, C.; Caparello, G.; Barrea, L.; Scerbo, F.; et al. Eating Habits and Lifestyle Changes during COVID-19 Lockdown: An Italian Survey. J. Transl. Med. 2020, 18, 229. [Google Scholar] [CrossRef]
  4. Pellegrini, M.; Ponzo, V.; Rosato, R.; Scumaci, E.; Goitre, I.; Benso, A.; Belcastro, S.; Crespi, C.; De Michieli, F.; Ghigo, E.; et al. Changes in Weight and Nutritional Habits in Adults with Obesity during the “Lockdown” Period Caused by the COVID-19 Virus Emergency. Nutrients 2020, 12, 2016. [Google Scholar] [CrossRef] [PubMed]
  5. Scarmozzino, F.; Visioli, F. Covid-19 and the Subsequent Lockdown Modified Dietary Habits of Almost Half the Population in an Italian Sample. Foods 2020, 9, 675. [Google Scholar] [CrossRef] [PubMed]
  6. Romeo-Arroyo, E.; Mora, M.; Vázquez-Araújo, L. Consumer Behavior in Confinement Times: Food Choice and Cooking Attitudes in Spain. Int. J. Gastron. Food Sci. 2020, 21, 100226. [Google Scholar] [CrossRef]
  7. Epicentro ISS. #Let’s Stay Active, Also at Home! Available online: https://www.Epicentro.Iss.It/En/Coronavirus/Sars-Cov-2-Healthy-Lifestyles-Physical-Activity (accessed on 20 February 2021).
  8. Epicentro ISS. Nutrition during the COVID-19 Emergency. Available online: https://www.Epicentro.Iss.It/En/Coronavirus/Sars-Cov-2-Healthy-Lifestyles-Nutrition (accessed on 19 February 2021).
  9. World Health Organization. Nutrition Advice for Adults during the COVID-19 Outbreak. Available online: http://www.Emro.Who.Int/Nutrition/Nutrition-Infocus/Nutrition-Advice-for-Adults-during-the-Covid-19-Outbreak.Html#:~:Text=Eat%20fresh%20and%20unprocessed%20foods%20every%20day&text=Daily%2C%20eat%3A%202%20cups%20of,%E2%88%923%20times%20per%20week) (accessed on 19 February 2021).
  10. Angelidi, A.M.; Kokkinos, A.; Katechaki, E.; Ros, E.; Mantzoros, C.S. Mediterranean Diet as a Nutritional Approach for COVID-19. Metabolism 2021, 114, 154407. [Google Scholar] [CrossRef]
  11. Lopez-Garcia, E.; Rodriguez-Artalejo, F.; Li, T.Y.; Fung, T.T.; Li, S.; Willett, W.C.; Rimm, E.B.; Hu, F.B. The Mediterranean-Style Dietary Pattern and Mortality among Men and Women with Cardiovascular Disease. Am. J. Clin. Nutr. 2014, 99, 172–180. [Google Scholar] [CrossRef] [Green Version]
  12. Martínez-González, M.Á.; de la Fuente-Arrillaga, C.; Nunez-Cordoba, J.M.; Basterra-Gortari, F.J.; Beunza, J.J.; Vazquez, Z.; Benito, S.; Tortosa, A.; Bes-Rastrollo, M. Adherence to Mediterranean Diet and Risk of Developing Diabetes: Prospective Cohort Study. BMJ 2008, 336, 1348–1351. [Google Scholar] [CrossRef] [Green Version]
  13. Schröder, H.; Marrugat, J.; Vila, J.; Covas, M.I.; Elosua, R. Adherence to the Traditional Mediterranean Diet Is Inversely Associated with Body Mass Index and Obesity in a Spanish Population. J. Nutr. 2004, 134, 3355–3361. [Google Scholar] [CrossRef]
  14. Tosti, V.; Bertozzi, B.; Fontana, L. Health Benefits of the Mediterranean Diet: Metabolic and Molecular Mechanisms. J. Gerontol. A Biol. Sci. Med. Sci. 2018, 73, 318–326. [Google Scholar] [CrossRef] [PubMed] [Green Version]
  15. Trichopoulou, A.; Lagiou, P.; Kuper, H.; Trichopoulos, D. Cancer and Mediterranean Dietary Traditions. Cancer Epidemiol. Biomark. 2000, 9, 869–873. [Google Scholar]
  16. Sofi, F.; Macchi, C.; Abbate, R.; Gensini, G.F.; Casini, A. Mediterranean Diet and Health Status: An Updated Meta-Analysis and a Proposal for a Literature-Based Adherence Score. Public Health Nutr. 2014, 17, 2769–2782. [Google Scholar] [CrossRef] [PubMed] [Green Version]
  17. Widmer, R.J.; Flammer, A.J.; Lerman, L.O.; Lerman, A. The Mediterranean Diet, Its Components, and Cardiovascular Disease. Am. J. Med. 2015, 128, 229–238. [Google Scholar] [CrossRef] [PubMed] [Green Version]
  18. Warburton, D.E.R. Health Benefits of Physical Activity: The Evidence. Can. Med. Assoc. J. 2006, 174, 801–809. [Google Scholar] [CrossRef] [PubMed] [Green Version]
  19. Beisel, W.R. Nutrition and Immune Function: Overview. J. Nutr. 1996, 126, 2611S–2615S. [Google Scholar] [CrossRef] [Green Version]
  20. Calder, P.C.; Jackson, A.A. Undernutrition, Infection and Immune Function. Nutr. Res. Rev. 2000, 13, 3–29. [Google Scholar] [CrossRef] [PubMed]
  21. Samartín, S.; Chandra, R.K. Obesity, Overnutrition and the Immune System. Nutr. Res. 2001, 21, 243–262. [Google Scholar] [CrossRef]
  22. ISMEA. Emergenza COVID–19 Rapporto Sulla Domanda e l’offerta Dei Prodotti Alimentari Nelle Prime Settimane Di Diffusione Del Virus. Available online: http://www.Ismea.It/Flex/Cm/Pages/ServeBLOB.Php/L/IT/IDPagina/10990 (accessed on 26 February 2021).
  23. ISMEA. Emergenza COVID–19 2° Rapporto Sulla Domanda e l’offerta Dei Prodotti Alimentari Nell’emergenza Covid-19. Available online: http://www.Ismea.It/Flex/Cm/Pages/ServeBLOB.Php/L/IT/IDPagina/11016 (accessed on 26 February 2021).
  24. Available online: https://www.Crea.Gov.It/En/Web/Alimenti-e-Nutrizione/-/Osservatorio-Sugli-Sprechi-Alimentari (accessed on 19 May 2021).
  25. Linee Guida per Una Sana Alimentazione Revisione 2018. ISBN 9788833850375. Available online: https://www.Crea.Gov.It/En/Web/Alimenti-e-Nutrizione/-/Linee-Guida-per-Una-Sana-Alimentazione-2018 (accessed on 21 May 2021).
  26. Pappalardo, G.; Cerroni, S.; Nayga, R.M.; Yang, W. Impact of Covid-19 on Household Food Waste: The Case of Italy. Front. Nutr. 2020, 7, 585090. [Google Scholar] [CrossRef]
  27. United Nations. Department of Economic and Social Affairs Sustainable Development. The 17 Goals. Available online: https://Sdgs.Un.Org/Goals (accessed on 15 May 2021).
  28. World Medical Association. Wma Declaration of Helsinki—Ethical Principles for Medical Research Involving Human Subjects. 2018. Available online: https://www.Wma.Net/Policies-Post/Wma-Declaration-of-Helsinki-Ethical-Principles-for-Medical-Research-Involving-Human-Subjects/ (accessed on 19 February 2021).
  29. Lehdonvirta, V.; Oksanen, A.; Räsänen, P.; Blank, G. Social Media, Web, and Panel Surveys: Using Non-Probability Samples in Social and Policy Research. Policy Internet 2021, 13, 134–155. [Google Scholar] [CrossRef]
  30. Álvarez-Álvarez, I.; Martínez-González, M.Á.; Sánchez-Tainta, A.; Corella, D.; Díaz-López, A.; Fitó, M.; Vioque, J.; Romaguera, D.; Martínez, J.A.; Wärnberg, J.; et al. Adherence to an Energy-Restricted Mediterranean Diet Score and Prevalence of Cardiovascular Risk Factors in the PREDIMED-Plus: A Cross-Sectional Study. Rev. Esp. Cardiol. Engl. Ed. 2019, 72, 925–934. [Google Scholar] [CrossRef] [PubMed]
  31. Martinez-Gonzalez, M.A.; Corella, D.; Salas-Salvado, J.; Ros, E.; Covas, M.I.; Fiol, M.; Warnberg, J.; Aros, F.; Ruiz-Gutierrez, V.; Lamuela-Raventos, R.M.; et al. Cohort Profile: Design and Methods of the PREDIMED Study. Int. J. Epidemiol. 2012, 41, 377–385. [Google Scholar] [CrossRef] [PubMed] [Green Version]
  32. Galilea-Zabalza, I.; Buil-Cosiales, P.; Salas-Salvadó, J.; Toledo, E.; Ortega-Azorín, C.; Díez-Espino, J.; Vázquez-Ruiz, Z.; Zomeño, M.D.; Vioque, J.; Martínez, J.A.; et al. Mediterranean Diet and Quality of Life: Baseline Cross-Sectional Analysis of the PREDIMED-PLUS Trial. PLoS ONE 2018, 13, e0198974. [Google Scholar] [CrossRef] [PubMed] [Green Version]
  33. FAO. Food-Based Dietary Guidelines. Available online: http://www.Fao.Org/Nutrition/Education/Food-Dietary-Guidelines/En/#:~:Text=Food%2Dbased%20dietary%20guidelines%20(Also,Healthy%20eating%20habits%20and%20lifestyles (accessed on 20 June 2021).
  34. Harpe, S.E. How to Analyze Likert and Other Rating Scale Data. Curr. Pharm. Teach. Learn. 2015, 7, 836–850. [Google Scholar] [CrossRef]
  35. ISTAT, Italian Population Statistics. Available online: http://Dati.Istat.It/.Accessed (accessed on 19 May 2021).
  36. Molina-Montes, E.; Uzhova, I.; Verardo, V.; Artacho, R.; García-Villanova, B.; Jesús Guerra-Hernández, E.; Kapsokefalou, M.; Malisova, O.; Vlassopoulos, A.; Katidi, A.; et al. Impact of COVID-19 Confinement on Eating Behaviours across 16 European Countries: The COVIDiet Cross-National Study. Food Qual. Prefer. 2021, 93, 104231. [Google Scholar] [CrossRef]
  37. Linting, M.; Meulman, J.J.; Groenen, P.J.F.; van der Koojj, A.J. Nonlinear Principal Components Analysis: Introduction and Application. Psychol. Methods 2007, 12, 336–358. [Google Scholar] [CrossRef] [Green Version]
  38. Linting, M.; van der Kooij, A. Nonlinear Principal Components Analysis with CATPCA: A Tutorial. J. Pers. Assess. 2012, 94, 12–25. [Google Scholar] [CrossRef] [PubMed]
  39. Mazzocchi, M. Statistics for Marketing and Consumer Research, 1st ed.; Sage: London, UK, 2008. [Google Scholar]
  40. Hair, J.F.; Black, W.C.; Babin, B.J.; Anderson, R.E. Multivariate Data Analysis: A Global Perspective, 7th ed.; Pearson: London, UK, 2010. [Google Scholar]
  41. Ammar, A.; Brach, M.; Trabelsi, K.; Chtourou, H.; Boukhris, O.; Masmoudi, L.; Bouaziz, B.; Bentlage, E.; How, D.; Ahmed, M.; et al. Effects of COVID-19 Home Confinement on Eating Behaviour and Physical Activity: Results of the ECLB-COVID19 International Online Survey. Nutrients 2020, 12, 1583. [Google Scholar] [CrossRef]
  42. Ruggiero, E.; Mignogna, C.; Costanzo, S.; Persichillo, M.; Di Castelnuovo, A.; Esposito, S.; Cerletti, C.; Donati, M.B.; de Gaetano, G.; Iacoviello, L.; et al. Changes in the Consumption of Foods Characterising the Mediterranean Dietary Pattern and Major Correlates during the COVID-19 Confinement in Italy: Results from Two Cohort Studies. Int. J. Food Sci. Nutr. 2021, 1–13. [Google Scholar] [CrossRef]
  43. Rodríguez-Pérez, C.; Molina-Montes, E.; Verardo, V.; Artacho, R.; García-Villanova, B.; Guerra-Hernández, E.J.; Ruíz-López, M.D. Changes in Dietary Behaviours during the COVID-19 Outbreak Confinement in the Spanish COVIDiet Study. Nutrients 2020, 12, 1730. [Google Scholar] [CrossRef]
  44. Sidor, A.; Rzymski, P. Dietary Choices and Habits during COVID-19 Lockdown: Experience from Poland. Nutrients 2020, 12, 1657. [Google Scholar] [CrossRef] [PubMed]
  45. Pietrobelli, A.; Pecoraro, L.; Ferruzzi, A.; Heo, M.; Faith, M.; Zoller, T.; Antoniazzi, F.; Piacentini, G.; Fearnbach, S.N.; Heymsfield, S.B. Effects of COVID-19 Lockdown on Lifestyle Behaviors in Children with Obesity Living in Verona, Italy: A Longitudinal Study. Obesity 2020, 28, 1382–1385. [Google Scholar] [CrossRef] [PubMed]
  46. Bennett, G.; Young, E.; Butler, I.; Coe, S. The Impact of Lockdown During the COVID-19 Outbreak on Dietary Habits in Various Population Groups: A Scoping Review. Front. Nutr. 2021, 8, 626432. [Google Scholar] [CrossRef]
  47. Skotnicka, M.; Karwowska, K.; Kłobukowski, F.; Wasilewska, E.; Małgorzewicz, S. Dietary Habits before and during the COVID-19 Epidemic in Selected European Countries. Nutrients 2021, 13, 1690. [Google Scholar] [CrossRef]
  48. Bonaccio, M.; Bonanni, A.E.; Di Castelnuovo, A.; De Lucia, F.; Donati, M.B.; de Gaetano, G.; Iacoviello, L.; on behalf of the Moli-sani Project. Investigators Low Income Is Associated with Poor Adherence to a Mediterranean Diet and a Higher Prevalence of Obesity: Cross-Sectional Results from the Moli-Sani Study. BMJ Open 2012, 2, e001685. [Google Scholar] [CrossRef] [Green Version]
  49. Cecchetto, C.; Aiello, M.; Gentili, C.; Ionta, S.; Osimo, S.A. Increased Emotional Eating during COVID-19 Associated with Lockdown, Psychological and Social Distress. Appetite 2021, 160, 105122. [Google Scholar] [CrossRef]
  50. Ingram, J.; Maciejewski, G.; Hand, C.J. Changes in Diet, Sleep, and Physical Activity Are Associated With Differences in Negative Mood During COVID-19 Lockdown. Front. Psychol. 2020, 11, 588604. [Google Scholar] [CrossRef]
  51. Aucejo, E.M.; French, J.; Ugalde Araya, M.P.; Zafar, B. The Impact of COVID-19 on Student Experiences and Expectations: Evidence from a Survey. J. Public Econ. 2020, 191, 104271. [Google Scholar] [CrossRef]
  52. Kartseva, M.A.; Kuznetsova, P.O. The Economic Consequences of the Coronavirus Pandemic: Which Groups Will Suffer More in Terms of Loss of Employment and Income? Popul. Econ. 2020, 4, 26–33. [Google Scholar] [CrossRef] [Green Version]
  53. Armitage, R.; Nellums, L.B. COVID-19 and the Consequences of Isolating the Elderly. Lancet Public Health 2020, 5, e256. [Google Scholar] [CrossRef] [Green Version]
  54. Brooke, J.; Jackson, D. Older People and COVID-19: Isolation, Risk and Ageism. J. Clin. Nurs. 2020, 29, 2044–2046. [Google Scholar] [CrossRef] [PubMed]
  55. Epicentro. Alimentazione Dei Bambini e Ragazzi Durante L’emergenza COVID-19. Available online: https://www.Epicentro.Iss.It/Coronavirus/Sars-Cov-2-Stili-Vita-Alimentazione-Bambini-e-Ragazzi (accessed on 17 May 2021).
  56. Okkio Alla Salute. Available online: https://www.Salute.Gov.It/Portale/Temi/P2_6.Jsp?Lingua=italiano&id=2952&area=stiliVita&menu=sorveglianza (accessed on 17 May 2021).
  57. Browne, N.T.; Snethen, J.A.; Greenberg, C.S.; Frenn, M.; Kilanowski, J.F.; Gance-Cleveland, B.; Burke, P.J.; Lewandowski, L. When Pandemics Collide: The Impact of COVID-19 on Childhood Obesity. J. Pediatr. Nurs. 2021, 56, 90–98. [Google Scholar] [CrossRef] [PubMed]
  58. Principato, L.; Secondi, L.; Cicatiello, C.; Mattia, G. Caring More about Food: The Unexpected Positive Effect of the Covid-19 Lockdown on Household Food Management and Waste. Socioecon. Plann. Sci. 2020, 100953. [Google Scholar] [CrossRef]
  59. Spreco Zero. Available online: https://www.Sprecozero.It/Wp-Content/Uploads/2021/01/MAGGIO-IORESTOACASA-E-RIDUCO-LO-SPRECO-SURVEY-WASTE-WATCHER-Copia.Pdf (accessed on 26 February 2021).
  60. Scalvedi, M.L.; Rossi, L. Comprehensive Measurement of Italian Domestic Food Waste in a European Framework. Sustainability 2021, 13, 1492. [Google Scholar] [CrossRef]
  61. Bisoffi, S.; Ahrné, L.; Aschemann-Witzel, J.; Báldi, A.; Cuhls, K.; DeClerck, F.; Duncan, J.; Hansen, H.O.; Hudson, R.L.; Kohl, J.; et al. COVID-19 and Sustainable Food Systems: What Should We Learn Before the Next Emergency. Front. Sustain. Food Syst. 2021, 5, 650987. [Google Scholar] [CrossRef]
  62. Mishra, V.; Seyedzenouzi, G.; Almohtadi, A.; Chowdhury, T.; Khashkhusha, A.; Axiaq, A.; Wong, W.Y.E.; Harky, A. Health Inequalities During COVID-19 and Their Effects on Morbidity and Mortality. J. Healthc. Leadersh. 2021, 13, 19–26. [Google Scholar] [CrossRef]
  63. Sachs, J.D.; Abdool Karim, S.; Aknin, L.; Allen, J.; Brosbøl, K.; Cuevas Barron, G.; Daszak, P.; Espinosa, M.F.; Gaspar, V.; Gaviria, A.; et al. Lancet COVID-19 Commission Statement on the Occasion of the 75th Session of the UN General Assembly. Lancet 2020, 396, 1102–1124. [Google Scholar] [CrossRef]
  64. Pinstrup-Andersen, P. Food Security: Definition and Measurement. Food Secur. 2009, 1, 5–7. [Google Scholar] [CrossRef]
  65. Pereira, M.; Oliveira, A.M. Poverty and Food Insecurity May Increase as the Threat of COVID-19 Spreads. Public Health Nutr. 2020, 23, 3236–3240. [Google Scholar] [CrossRef]
  66. Marí-Dell’Olmo, M.; Gotsens, M.; Pasarín, M.I.; Rodríguez-Sanz, M.; Artazcoz, L.; Garcia de Olalla, P.; Rius, C.; Borrell, C. Socioeconomic Inequalities in COVID-19 in a European Urban Area: Two Waves, Two Patterns. Int. J. Environ. Res. Public. Health 2021, 18, 1256. [Google Scholar] [CrossRef] [PubMed]
  67. Power, M.; Doherty, B.; Pybus, K.; Pickett, K. How Covid-19 Has Exposed Inequalities in the UK Food System: The Case of UK Food and Poverty. Emerald Open Res. 2020, 2, 11. [Google Scholar] [CrossRef] [Green Version]
Figure 1. Food consumption changes during the lockdown.
Nutrients 13 02279 g001
Figure 2. The effect of lockdown on body weight: (a) Physical activity; (b) Perceived weight changes.
Nutrients 13 02279 g002
Figure 3. Domestic practices during lockdown: (a) Breakfast habits; (b) Children and adolescent involvement in kitchen activities.
Nutrients 13 02279 g003
Table 1. Respondents’ eating habits and lifestyle changes during the lockdown.
Eating Habits and Lifestyle ChangesStrongly
Disagree
(%)
Disagree
(%)
Neither Agree Nor Disagree
(%)
Agree
(%)
Strongly Agree
(%)
Q1. I need to pay attention to my spending,
and I should limit my purchases of expensive foods
25.415.430.419.49.4
Q2. My cooking habits did not change,
I continued to cook as before
11.71525.322.925.2
Q3. I feel I am better at cooking17.49.637.422.113.4
Q4. I have purchased and tried new foods
that I never tasted before
24.915.226.723.59.7
Q5. I cannot always find the foods
I would like to eat
33.620.617.6217.3
Q6 I ate all food I had cooked, including leftovers7.15.111.426.150.3
Q7. I do not know how to store and consume all foods that I bought621911.65.51.9
Q8. Separate collection of waste is very difficult,
I cannot do it
70158.13.53.6
Q9. I eat more comfort food than before (i.e., prosecco, snacks, sweets, etc)48.817.311.314.58.1
Q10. I eat a lot of snacks during the day42.122.116.613.35.9
Q11. I have improved my eating habits26.618.931.814.68.1
Q12. I need to go on a diet to lose weight27.218.119.31817.3
Q14. I have the perception that the elderly have difficulties with shopping and suffer from social isolation8.38.417.227.338.7
Q15. I eat the main meals together with the rest of my family more frequently than before18.7727.316.430.6
Table 2. Relation between food habits’ changes quartiles during the lockdown and AMD classes before the lockdown (percentage).
Changes of Food Habits during
Lockdown
(Classes–Quartiles)
TotalAMD Classes before Lockdown
LowLow
to Moderate
Moderate
to High
High
No Changes26.432.7 a22.924.821.6
Small Changes (1–2)30.627.233.828.334.2 b
Medium Changes (3–4)20.723.2 c19.325 d14.1
Large Changes > 422.41724 e21.9 f30.1 g
Total100100100100100
Significance test results based on pairwise tests: a Low vs. Low to moderate, p = 0.000; Low vs. Moderate to high p = 0.009; Low vs. High p = 0.000; b High vs. Low, p = 0.25; c Low vs. High, p = 0.000; d Moderate to high vs. High, p = 0.000; e Low to moderate vs. Low, p = 0.002; f Moderate to high vs. Low, p = 0.019; g High vs. Low, p = 0.000; High vs. Moderate to High, p = 0.014.
Table 3. Food categories consumption during the lockdown by the AMD before the lockdown (percentage). Nutrients 13 02279 i001 or Nutrients 13 02279 i002 describes favourable food consumption changes, = describes unchanged food consumption, Nutrients 13 02279 i003 and Nutrients 13 02279 i004 describes unfavourable food consumption changes; * p < 0.05.
Food CategoriesFood ConsumptionTotalAMD
LowLow to ModerateModerate to HighHigh
NutsIncreased127.8* 13.6* 14.5( Nutrients 13 02279 i001) * 14.6
Decreased14.215.115.517.17.7
Same as before72.877.170.968.477.7
LegumesIncreased22.117.1* 22.5* 26.3( Nutrients 13 02279 i001) * 26.6
Decreased7.67.88.37.36.5
Same as before70.3(=) * 75.169.266.466.9
Whole cerealsIncreased13.19.211.4* 15.6( Nutrients 13 02279 i001) * 20.1
Decreased9.37.610.610.39.5
Same as before77.6(=) * 83.27874.270.4
VegetablesIncreased28.528.128.927.229.7
Decreased9( Nutrients 13 02279 i004) * 7.9* 14.3* 9.53
Same as before62.56456.863.367.3
Fish and shellfishIncreased1412.911* 15.5( Nutrients 13 02279 i001) * 18.7
Decreased23.822.428.926.516.7
Same as before62.264.760.15864.6
White breadIncreased17.2( Nutrients 13 02279 i003) * 20.3* 21.4* 15.28
Decreased20.916.219.718.433.6
Same as before61.963.55966.458.4
Non-whole pasta and riceIncreased15.2( Nutrients 13 02279 i003) * 17.3* 16* 178.4
Decreased8.55.89.110.6* 15.3
Same as before76.376.974.872.476.3
Red meatIncreased10.7( Nutrients 13 02279 i003) 13.79.2* 12.35.9
Decreased22.21919.319.8( Nutrients 13 02279 i002) * 34.1
Same as before67.1* 67.3* 71.6* 67.959.9
Butter and margarineIncreased5.3( Nutrients 13 02279 i003) * 12.79.88.44.8
Decreased16.312.213.711.114.5
Same as before78.475.176.480.580.7
Sweet and pastriesIncreased36.9( Nutrients 13 02279 i003) * 43.534.6* 4223.3
Decreased12.36.6* 15.5* 12.9( Nutrients 13 02279 i002) * 17.3
Same as before50.849.949.945.1* 59.4
Drinking beverages adding sugarIncreased2.73.33.12.51.1
Decreased7.9* 5.3* 11.35.3( Nutrients 13 02279 i002) * 10.1
Same as before89.4* 91.485.5* 92.388.8
Sugary drinksIncreased5.3( Nutrients 13 02279 i003) * 8.84.43.82
Decreased16.314.7* 21.913.914
Same as before78.476.573.8* 82.3(=) * 83.9
WineIncreased1616.51519.812.6
Decreased12.8( Nutrients 13 02279 i002) * 8* 16* 14.5( Nutrients 13 02279 i002) * 15.2
Same as before71.275.56965.672.2
WaterIncreased19.91720.219.5( Nutrients 13 02279 i001) * 25.3
Decreased8.38.27.610.17.8
Same as before71.7* 74.872.270.566.9
Total 100100100100100
Table 4. Eating habits and lifestyle during the lockdown by the AMD before the lockdown (percentage). Nutrients 13 02279 i001 describes favourable food consumption changes, Nutrients 13 02279 i003 and Nutrients 13 02279 i004 describe unfavourable food consumption changes; * p < 0.05.
Eating Habits and Lifestyle TotalAMD
LowLow
to Moderate
Moderate
to High
High
I have improved my eating habitsLow45.5( Nutrients 13 02279 i004) * 54.2* 40.6* 44.138.5
Medium31.827.736.731.133.1
High21.718.122.8* 24.7( Nutrients 13 02279 i001) * 28.4
I eat more comfort food than beforeLow66.15371.769.1* 78.5
Medium11.3* 17.19.67.96.9
High22.6( Nutrients 13 02279 i003) * 29.918.72314.6
I need to go on a diet to lose weightLow45.379.677.6* 85.6* 83.5
Medium19.318.92017.321
High35.4( Nutrients 13 02279 i003) * 38.1* 36.7* 36.827.1
Total 100100100100100
Table 5. Food categories consumption during the lockdown by BMI class before the lockdown (percentage). Nutrients 13 02279 i001 or Nutrients 13 02279 i002 describe favourable food consumption changes, = describes food consumption unchanged; * p < 0.05.
Food CategoriesFood ConsumptionTotalBMI Class
Underweight
3.5
Normal Weight
57.1
Overweight
29.1
Obese
10.3
Extra virgin
olive oil
Increased1910.616.1( Nutrients 13 02279 i001) * 23.5( Nutrients 13 02279 i001) * 25
Decreased2.50.62.62.91.2
Same as before78.5* 88.881.373.673.8
FruitIncreased24.519.723.427.324.5
Decreased13.34.69.6* 17.6* 24.7
Same as before62.2(=) * 75.7(=) * 67.155.150.7
VegetablesIncreased28.620.927.928.1( Nutrients 13 02279 i001) * 36.3
Decreased947.511.911
Same as before62.4(=) * 75(=) * 64.66052.7
LegumesIncreased22.216.622.319.5( Nutrients 13 02279 i001) * 31
Decreased7.63.886.310.4
Same as before58.6* 79.5* 69.7* 74.258.6
Fish and shellfishIncreased14.15.814.411.2( Nutrients 13 02279 i001) * 23.1
Decreased23.912.123.727.419.5
Same as before62* 82.261.961.557.3
NutsIncreased125.412.211.813.3
Decreased14.28.815.512.712.9
Same as before73.8* 85.872.375.473.8
Butter and
margarine
Increased9.63.710.38.211.8
Decreased12.94.311.6* 15.8* 14.9
Same as before77.5* 92787673.3
Red meatIncreased10.74.81012.810.6
Decreased22.212.323.420.125
Same as before67.1* 82.966.667.164.4
SofritoIncreased10.25.99.810.613.4
Decreased13.95.710.1* 16.6* 29.9
Same as before75.9* 88.4* 80.172.856.7
Sugary drinksIncreased5.415.34.98.1
Decreased6.46.7312.819.3( Nutrients 13 02279 i002) * 31.4
Same as before78.2* 92.3* 81.975.760.55
Sweets and
pastries
Increased37* 54.337.735.631.28
Decreased12.37.710.613.4( Nutrients 13 02279 i002) * 20.02
Same as before50.73851.75148.7
Drinking
beverages adding sugar
Increased2.74.52.22.16.2
Decreased7.96.86.74.9( Nutrients 13 02279 i002) * 22.9
Same as before89.488.891.192.970.8
WaterIncreased19.910.720.215.832.8
Decreased8.43.99.28.16.2
Same as before71.8* 85.470.6* 76.161.1
WineIncreased166.416.917.410.6
Decreased12.85.711.412.4( Nutrients 13 02279 i002) * 24.2
Same as before71.287.971.770.265.2
Total 100100100100100
Table 6. Dietary change patterns during the lockdown: groups distribution and characterization (percentage).
Groups%Food Consumption Pattern
Group 1-
”healthy eaters”
26.8increased consumption of legumes, whole grain cereals and non-whole pasta and rice, nuts, sweets and pastries
Group 2-
“less eaters”
7.5decreased consumption of olive oil, fish and shellfish, nuts, legumes, white meat, whole grain cereals and non-whole pasta and rice, vegetables, red meat, butter and margarine, sugary drinks, sweets and pastries and sofrito sauce
Group 3-
“usual eaters”
51.4unchanged consumption
Group 4-
”more eaters”
41.4increased consumption of almost all categories (coexist an increased and a decreased consumption of olive oil, whole grain cereals and adding sugar to beverages)
Table 7. Cluster analysis: the relation between the 4 groups and sociodemographic variables, AMD, BMI class, body weight changes, and physical activity; * p < 0.05.
Sociodemographic VariablesTotalGroup 1Group 2Group 3Group 4
Healthy EatersLess
Eaters
Usual
Eaters
More
Eaters
GenderMan48.249.6* 66.345.146.9
Woman51.8* 50.433.7* 54.9* 53.1
Age18–2914.613* 21.512.8* 20.3
30–4932.228.728.831.2* 44.2
50–6932.933.3* 47.729.935.5
≥7020.3* 252* 26.20
AMDTotalGroup 1Group 2Group 3Group 4
Low34.530.225* 38.633
Low to moderate27.122.3*41.927.227.5
Moderate to high19.117.518.619.122.1
High19.3* 29.914.515.117.3
BMI classTotalGroup 1Group 2Group 3Group 4
Underweight3.51.81.7* 4.82.7
Normal weight57.257.153.456.960.4
Overweight29.13025.529.527.5
Obese10.311.2* 19.48.79.4
Body weight changesTotalGroup 1Group 2Group 3Group 4
I do not know11.210.1* 18.710.611.6
My weight did not increase52.351.346.7* 55.844.3
1–2 kg25.325.823.524.129.5
3–5 kg10.1* 12.19.78.512.3
More than 5 kg1.10.81.50.92.3
Physical activityTotalGroup 1Group 2Group 3Group 4
I did not do physical activity37.2* 41.126.139.129
Less frequently11.110.9* 16.69.5* 14.8
1–2 times per week16.217.220.814.119.4
3–4 times per week18.317.518.217.921.6
5 and more times per week17.213.418.3* 19.515.3
Publisher’s Note: MDPI stays neutral with regard to jurisdictional claims in published maps and institutional affiliations.

