A Bio-Compatible Fiber Optic pH Sensor Based on a Thin Core Interferometric Technique
by
 , , , and
Magnus Engholm
1,* ,
,
Krister Hammarling
1,
Henrik Andersson
1,
Mats Sandberg
1,2 and
Hans-Erik Nilsson
1 1
Department of Electronics, Mid Sweden University, 851 70 Sundsvall, Sweden
2
RISE Acreo AB, 601 17 Norrköping, Sweden
*
Author to whom correspondence should be addressed.
Photonics 2019, 6(1), 11; https://doi.org/10.3390/photonics6010011
Submission received: 21 December 2018
/
Revised: 25 January 2019
/
Accepted: 27 January 2019
/
Published: 30 January 2019
(This article belongs to the Special Issue Advanced Optical Materials and Devices)
Abstract
:There is an increasing demand for compact, reliable and versatile sensor concepts for pH-level monitoring within several industrial, chemical as well as bio-medical applications. Many pH sensors concepts have been proposed, however, there is still a need for improved sensor solutions with respect to reliability, durability and miniaturization but also for multiparameter sensing. Here we present a conceptual verification, which includes theoretical simulations as well as experimental evaluation of a fiber optic pH-sensor based on a bio-compatible pH sensitive material not previously used in this context. The fiber optic sensor is based on a Mach-Zehnder interferometric technique, where the pH sensitive material is coated on a short, typically 20-25 mm thin core fiber spliced between two standard single mode fibers. The working principle of the sensor is simulated by using COMSOL Multiphysics. The simulations are used as a guideline for the construction of the sensors that have been experimentally evaluated in different liquids with pH ranging from 1.95 to 11.89. The results are promising, showing the potential for the development of bio-compatible fiber optic pH sensor with short response time, high sensitivity and broad measurement range. The developed sensor concept can find future use in many medical- or bio-chemical applications as well as in environmental monitoring of large areas. Challenges encountered during the sensor development due to variation in the design parameters are discussed.
1. Introduction
The demand for compact, reliable and versatile sensor concepts for pH-level monitoring is continuously growing. Many chemical processes within the manufacturing industry require accurate, real time monitoring of the pH-level. There is also an increasing interest in sensor systems with the ability to monitor several physical parameters in parallel and in a variety of environments. Within the bio-chemical and bio-medical area, there is a particular need to measure pH on small volumes [1]. In this case, a pH sensor based on fiber optic technology can be a preferable choice due to its small size, accurate measurement, immunity to electromagnetic disturbance and durability to harsh environments [2]. So far, several fiber optic based pH sensors have been reported with different sensing techniques such as interferometric [3,4,5], change of the refractive index [6,7,8] or fluorometric [9,10].
A commonly used technique involves coating of the fiber cladding with a pH sensitive material, which can alter the refractive index (RI). This RI change can be measured with high accuracy, by using a fiber based RI sensor [2]. There are a number of known techniques that can be implemented in order to make an optical fiber susceptible to the surrounding RI. Some of the reported techniques are by the use of Fiber Bragg gratings (FBG) [11], long period gratings (LPG) [12], tapered fibers [13], etched fibers [14] and different types of single mode-multi mode-single mode (SMS) fiber structures [14,15,16]. Despite the many fiber optic based pH sensor designs presented so far, there is still a need for improved pH-level sensor solutions, both with respect to sensitivity and the measurable range. There is also an increasing need for pH-sensors with improved durability for long term monitoring and without (or with less frequent) calibration.
In this work, we present a conceptual verification of a fiber optic pH sensor, based on a Mach-Zehnder interferometric (MZI) technique [17] with a pH-sensitive polymer coated on the optical fiber. The pH-sensitive polymer is bio-compatible and non-toxic and can therefore be particularly interesting for use in many bio-medical applications. The sensor concept is evaluated by simulations using COMSOL Multiphysics and experimentally verified by the development and evaluation of sensor performance in liquids with pH ranging from 1.95 to 11.89. The findings are promising, although a large variation in design parameters is observed. More work will be required to improve the manufacturing process with respect to repeatability and to ensure a reliable, long-term functionality.
2. Theory and Simulations
2.1. Sensor Concept
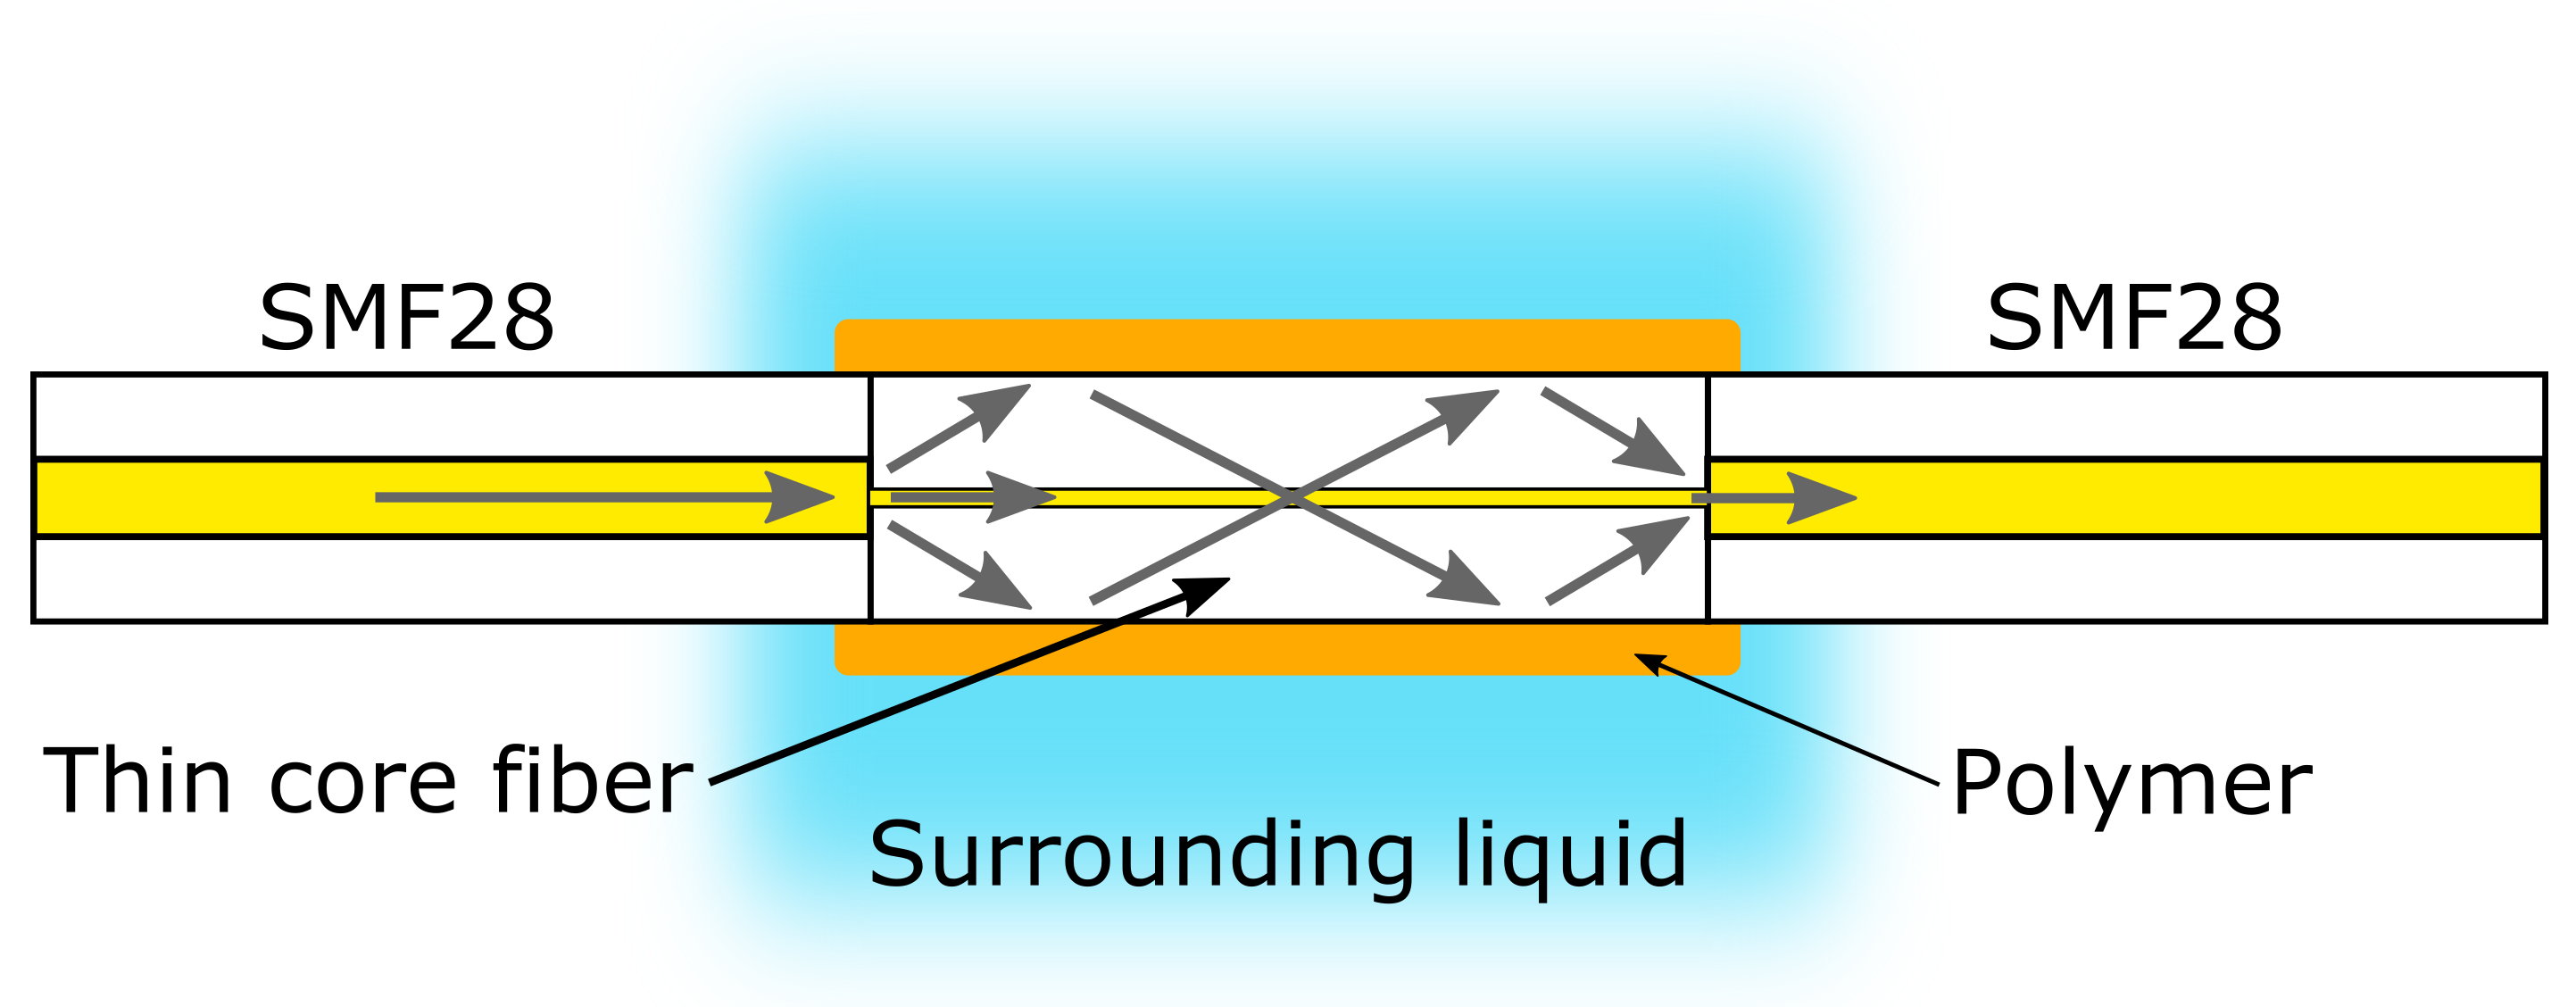
There are several ways to construct a fiber optic sensor that is sensitive to different physical parameters. The principle chosen here is based on a Mach-Zehnder interferometric technique [17]. One way to construct a Mach-Zehnder based fiber optic interferometer is by splicing a short piece of a thin core fiber (TCF) in between two single mode fibers as shown in Figure 1.
When light from the core of the SMF28 fiber enters the TCF, higher order cladding modes will be excited and propagate in the cladding of the TCF, provided that the RI outside the cladding is lower than the RI of silica glass (1.436). Due to the optical path difference for the different modes, constructive or destructive interference occurs at different positions along the TCF. Depending on the length of the TCF and wavelength of the light, a number of transmission maxima and minima will be observed at specific wavelengths for the transmitted light. For different RI outside the TCF, the position of the constructive and destructive interference will change along the fiber. This will result in a wavelength shift of the transmission maxima and minima, which can be measured with an optical spectrum analyzer (OSA).
In order to make the inline sensor sensitive to changes in pH, a thin, typically 0.1–2 m layer of a pH sensitive polymer can be coated on the outside of the TCF. The measured RI of the polymer used in this work is 1.4845, which is higher than the silica glass and thus would result in non-guiding properties. However, when the sensor is immersed in a water-based solution (RI 1.33), the effective RI will be lower than the silica glass cladding and therefore will allow guiding of the light. For the case presented here we have evaluated two different, but closely related types of bio-compatible polymers as a coating material on the TCF. The polymer is a bio-compatible poly -amino ester, a hydrogel based on various amounts of 1.4- or 1.3-Butanediol Diacrylate (BDDA) and Piperazine (PIP) as base ingredients [8,18]. This hydrogel will expand (by binding of water) or contract (by release of water) depending on the pH of the surrounding liquid. As a consequence, the effective RI of the hydrogel will change depending on the amount of water bound in the hydrogel. This change in RI can be correlated to a specific pH level and thereby allow the change in pH level to be measured.
2.2. Simulation of the Inline Sensor
To get a better understanding of the working principle of the sensor, the inline sensor concept has been simulated and evaluated by using COMSOL Multiphysics. A few simplifications were made before the simulation. First, the simulation is performed in two dimensions, which can be justified because of the cylindrical shape of an optical fiber. Secondly, the simulation was not performed on a full-scale fiber due to limited computational power as the memory of the computer would be exceeded. The reason is that the recommended mesh size in COMSOL, is 10 times smaller than the shortest wavelength used in the simulation [19]. For a full scale fiber, this would result in an extremely large number of computational mesh points and a total simulation time in the order of months. Nevertheless, the working principle of the inline sensor can still be visualized and evaluated even if the simulated structure is not in full scale.
For the simulation presented here a fiber diameter of 64 m was used, which is half of the full scale fiber diameter. The length of the inline fiber was 2155 m, which is typically 10 % of the full scale fiber length used in the experiments. A coreless glass fiber is used in the simulation, although a TCF is used for all experiments. The reason is that the core of the TCF used in the experiments has a diameter of only 2.5 m (Nufern 460 HP) and for the wavelengths considered here (>1400 nm) this fiber can be considered coreless as no mode will be guided in the core; see explanation in Section 3.1.
2.3. Simulation Results
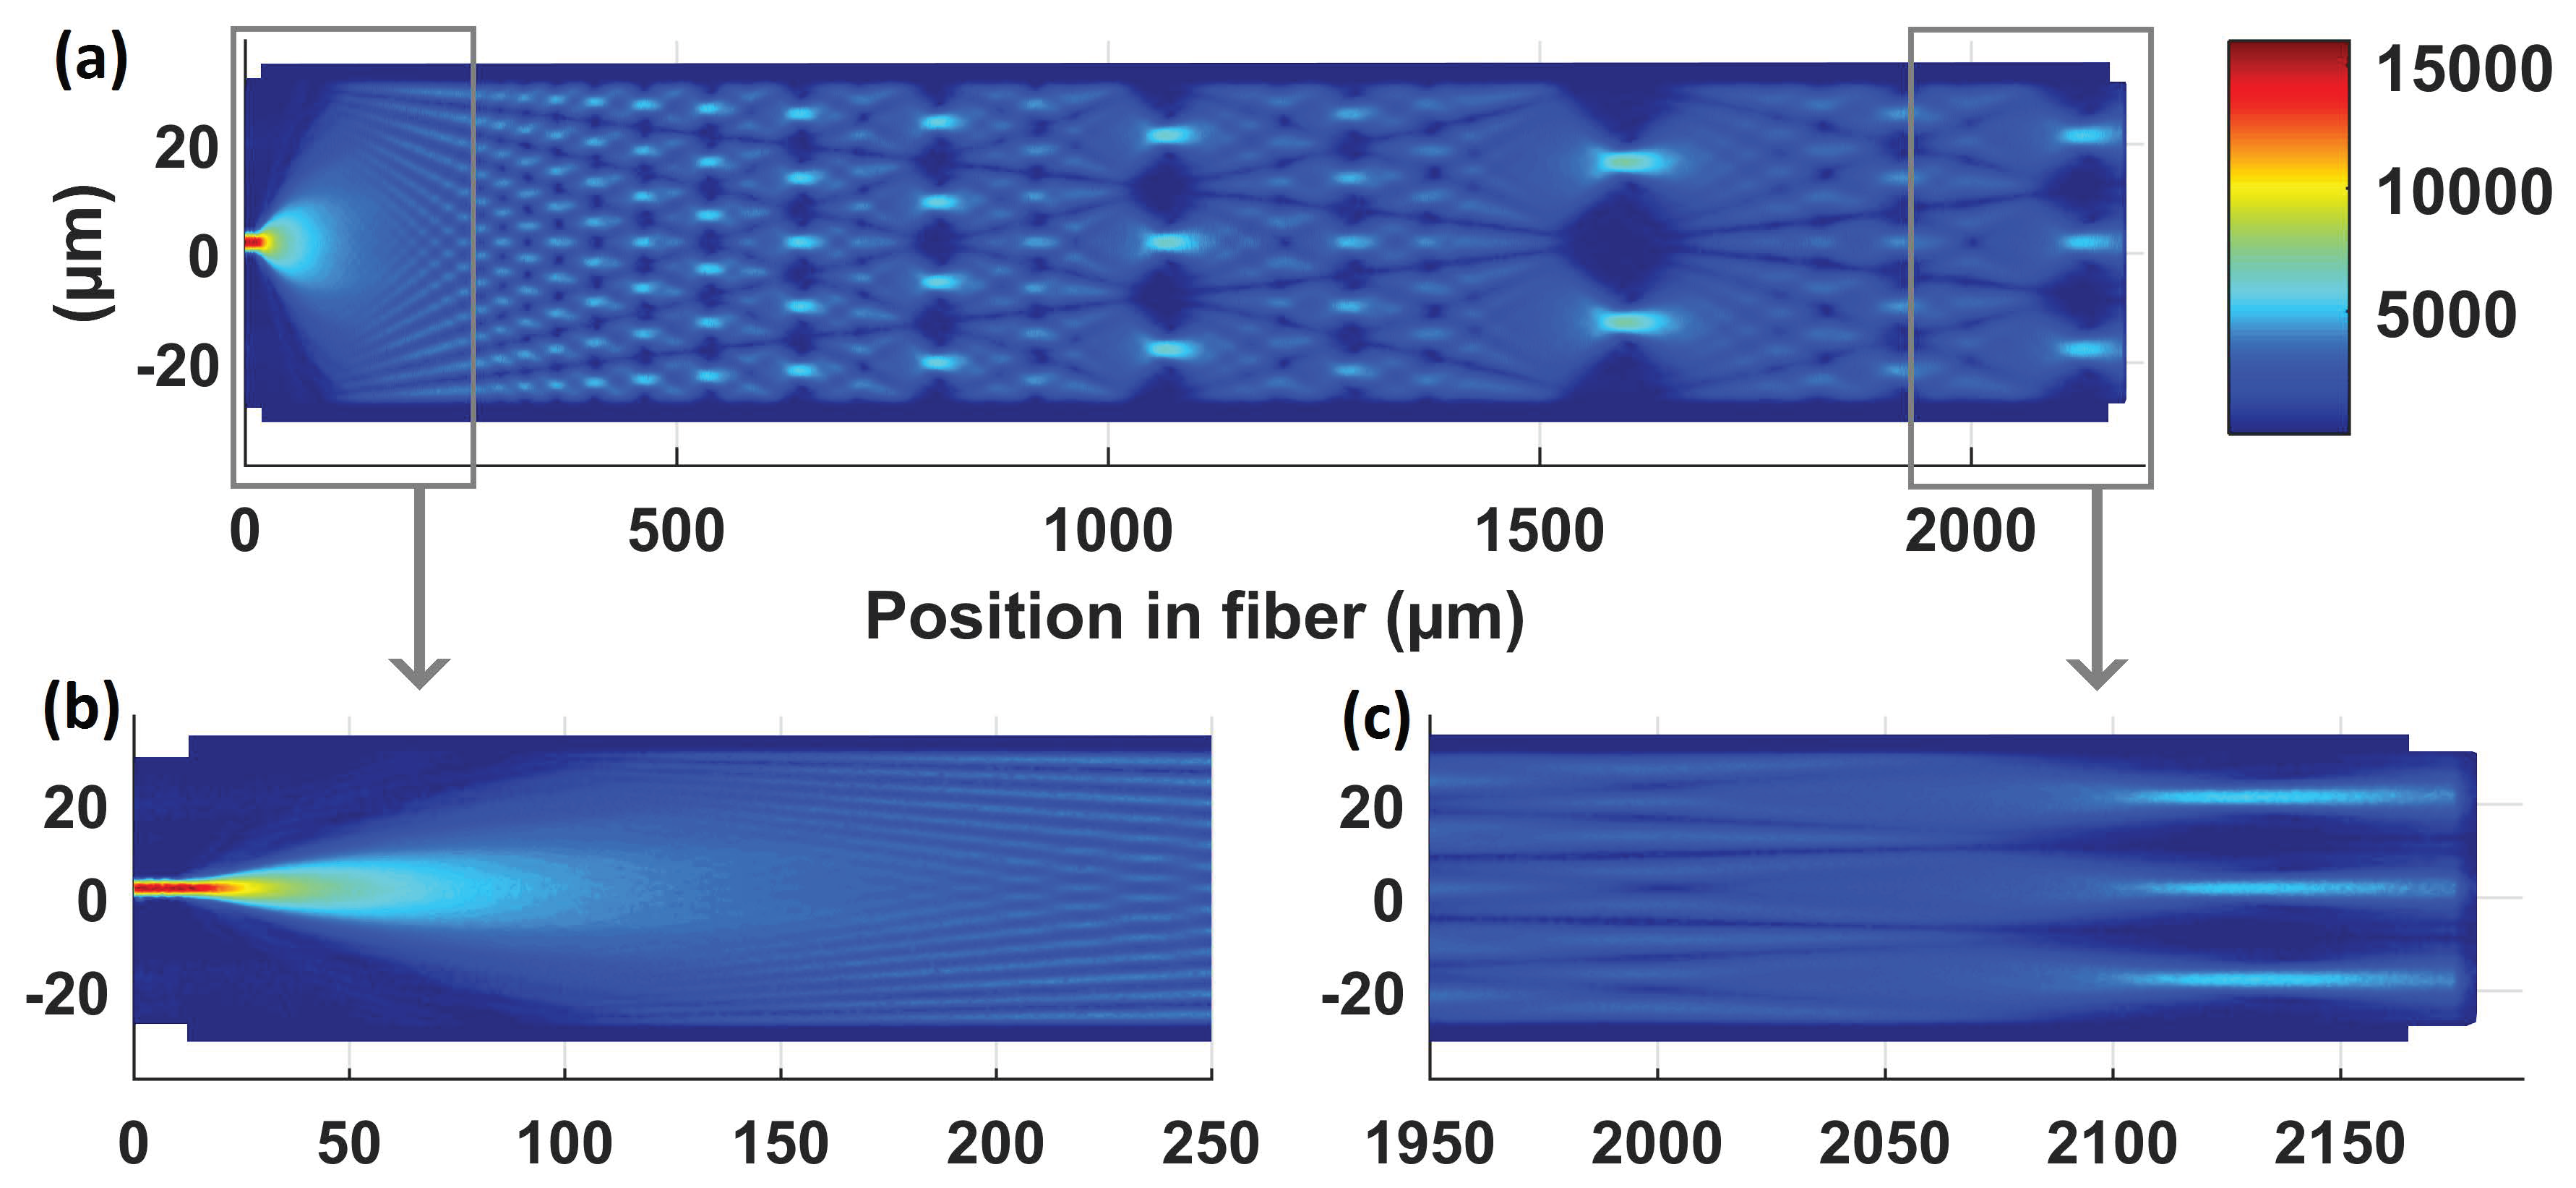
Figure 2a shows a simulation for the electric field distribution along the TCF at a wavelength of 1550 nm where the thin core inline fiber is 2155 m long. The fiber glass RI is 1.436 and the outer, surrounding RI is 1.33. As observed, an interference pattern with several maxima and minima are formed along the fiber. This is more easily observed in the two insets (b) and (c) showing the interference pattern at the input- and output of the TCF respectively. In (b) it is seen how the light transforms from single mode (SM) propagation in the SMF28 fiber to multimode (MM) propagation in the TCF. Similarly, in the inset (c) it is clearly seen that only certain modes will re-couple into the core of the right SMF28 fiber. Another interesting observation is that the number of interference maxima and minima becomes lower and appears more pronounced for an increasing length of the TCF.
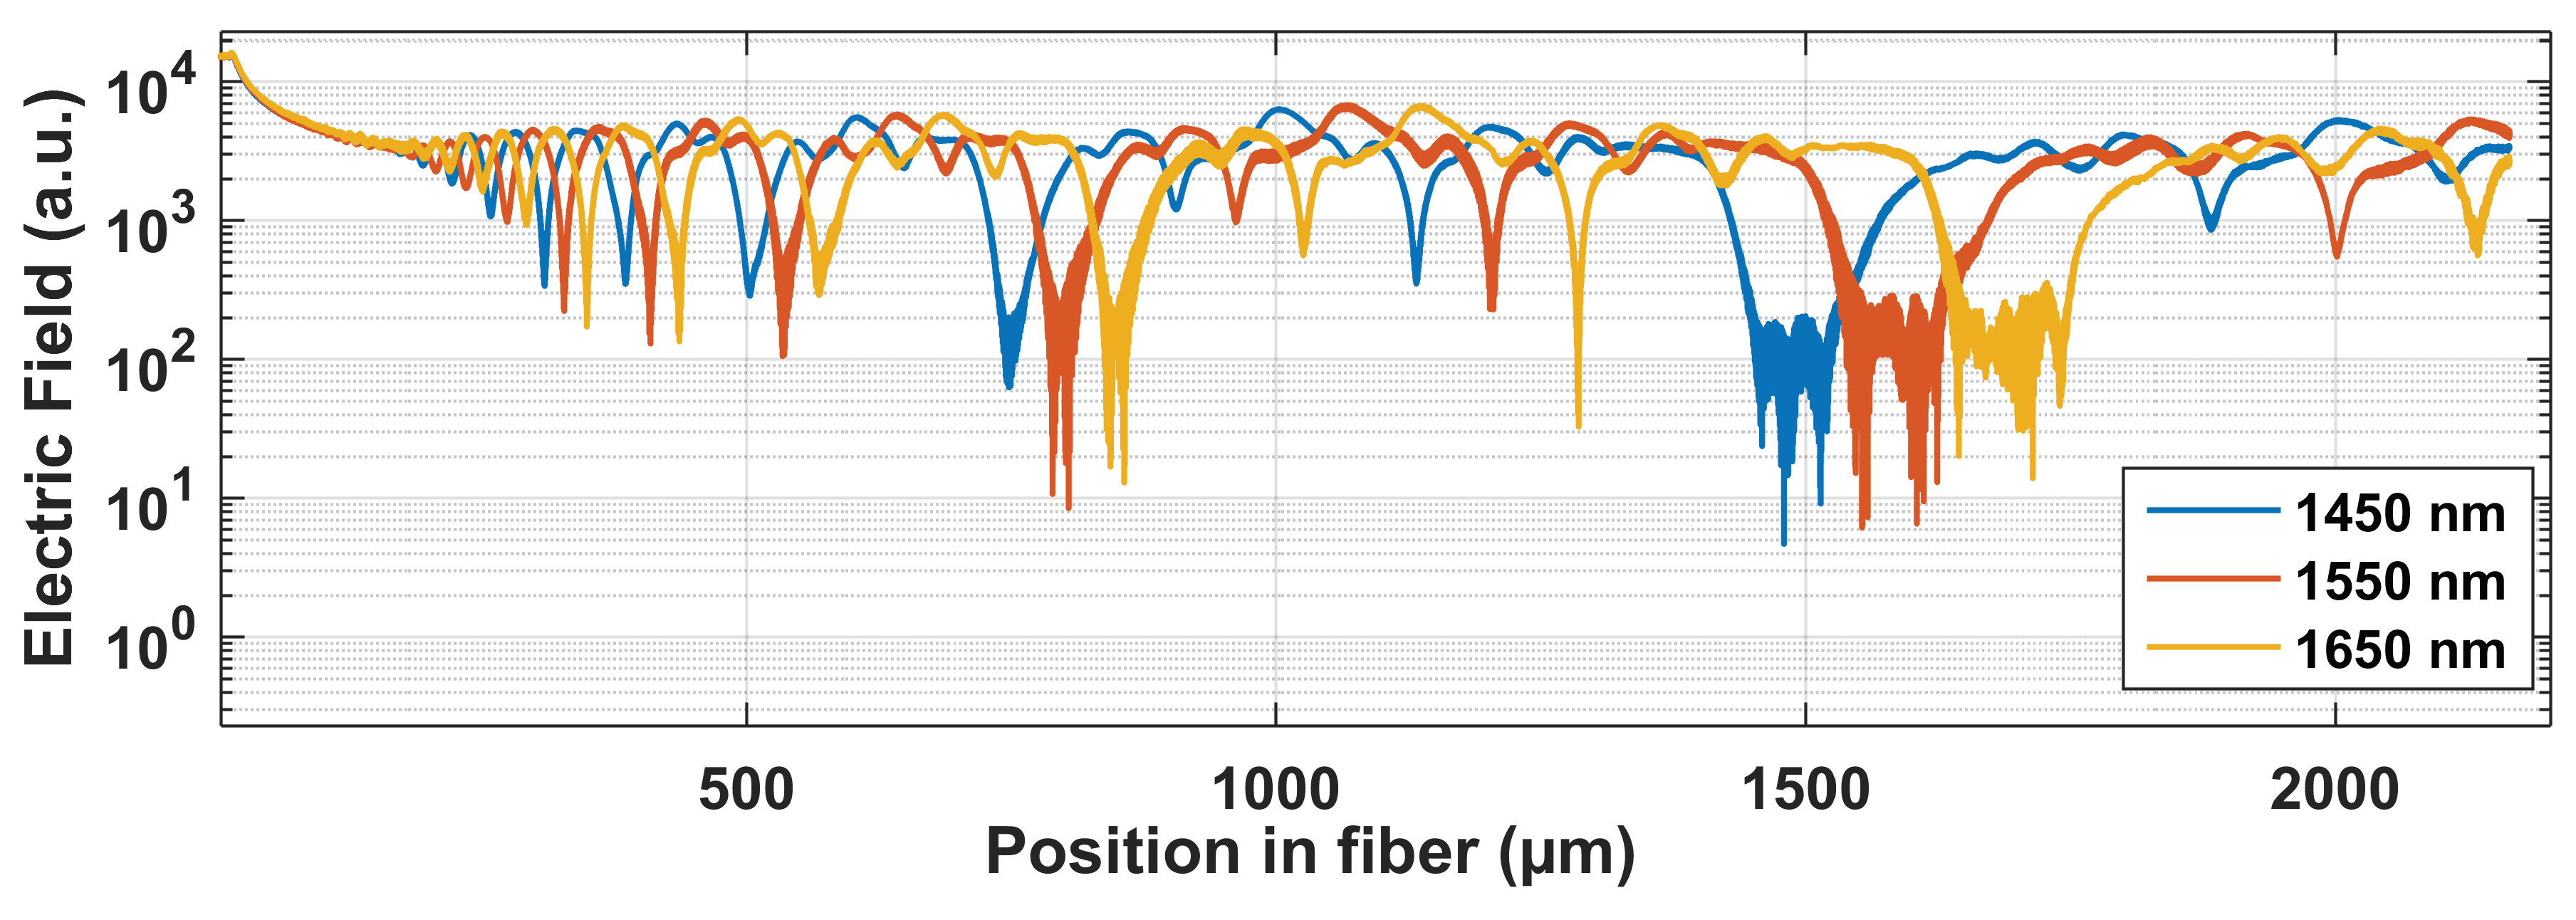
Figure 3 shows the electric field distribution along the center in the x-direction of the TCF for three different wavelengths, 1450, 1550 and 1650 nm respectively. A first observation is that the points of destructive interference are more pronounced and stretch over several orders of magnitudes. This suggests that a design of the TCF sensor to measure the transmission minima (instead of maxima) is preferred as a larger dynamical range will offer a higher sensitivity. As can be expected, the position for the electric field minima changes for different wavelengths. In addition, the spacing between the consecutive minima for a specific wavelength appears to change in a periodic behavior along the length of the TCF. This implies that the spectral width of the different transmission minima (in wavelength) will also change in a periodic manner.
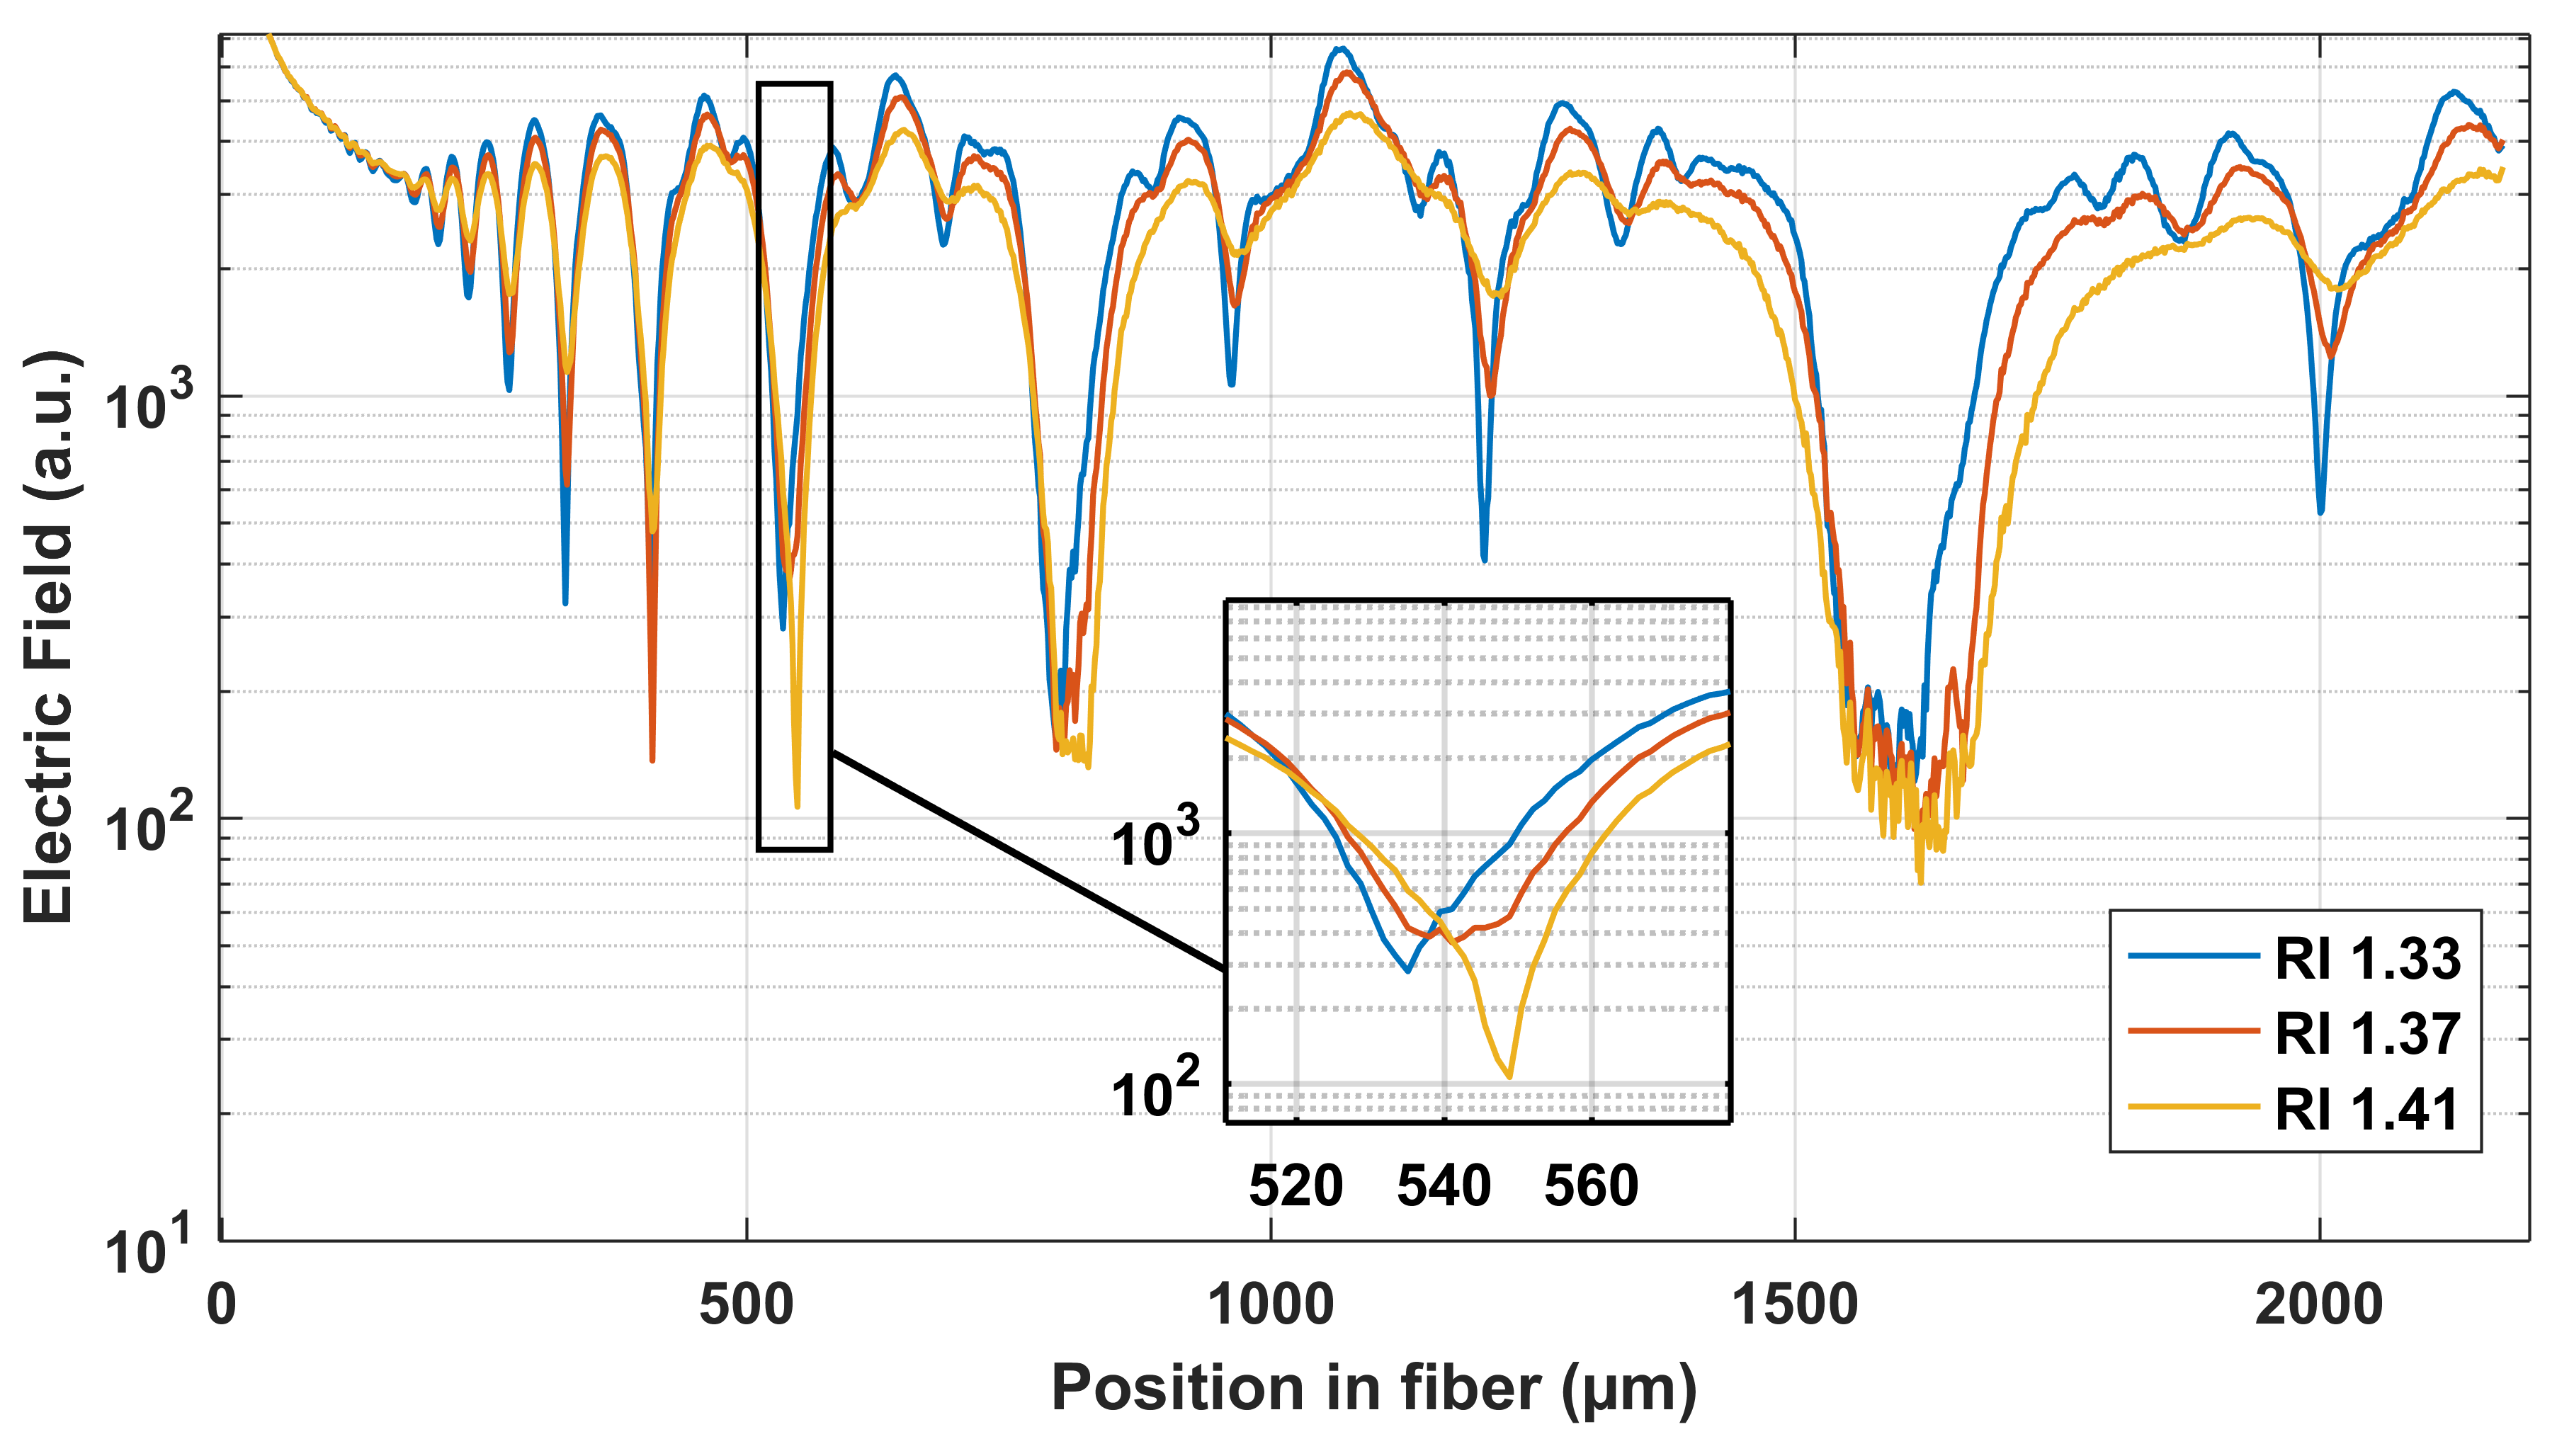
In Figure 4 the wavelength is held constant at 1550 nm and the surrounding RI is changed between three different values, 1.33, 1.37 and 1.41 respectively. The selected RI values are chosen to be between the RI of water and silica glass. The inset in Figure 4 shows the change of the electric field for a selected destructive interference when the surrounding RI increases from 1.33 to 1.41. A small shift in position is observed for the electric field minima due to the change in RI. This shift in position will also result in a small spectral shift of a transmission minima.
3. Results and Experimental Verification of Sensor Concept
3.1. Sensor Design and Construction
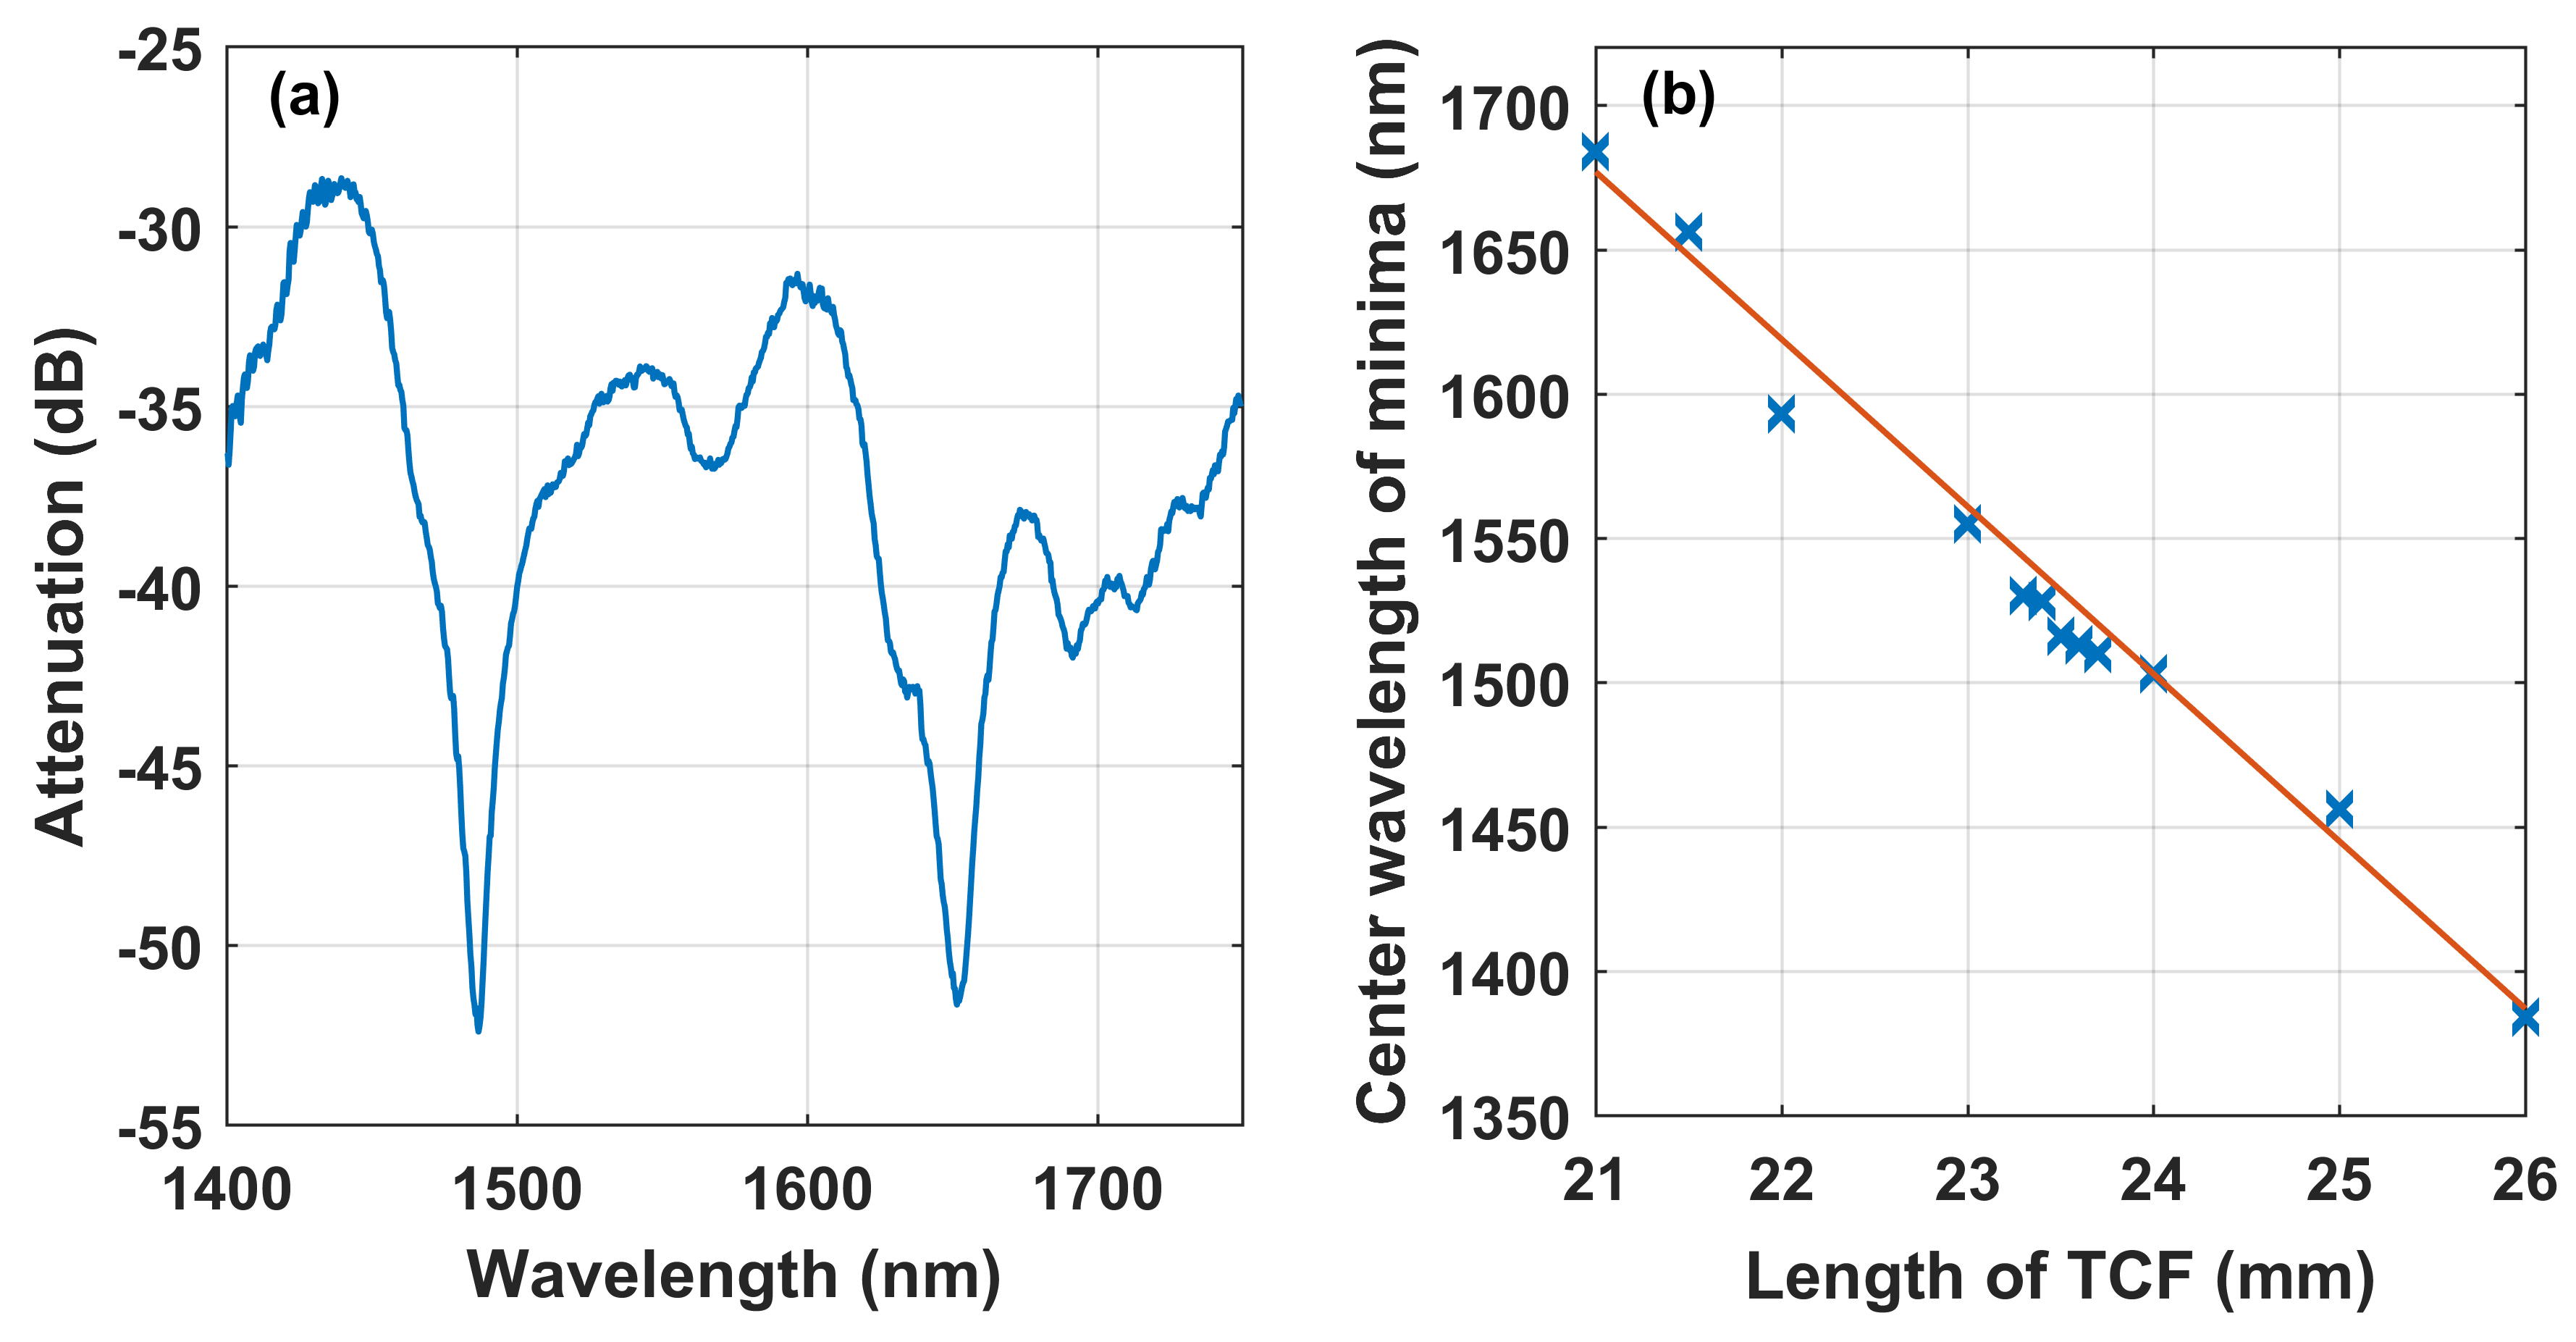
Based on observations from the simulation, the separation between consecutive minima (and maxima) change in a periodic behavior along the length of the TCF. By choosing a relatively long TCF (>40 mm), the construction of a sensor is easier considering the repeatability of cleaving the TCF to a specific length. On the other hand, a longer TCF will be more sensitive to external influences such as small bends, etc. Small bends can easily affect the interference pattern inside the TCF and cause an incorrect spectral shift of the transmission minima. Several different lengths of the TCF (Nufern 460 HP) between 5 and 50 mm was spliced between two standard single mode fibers (SMF28) and experimentally evaluated. A length of the TCF in the range 20–24 mm was found to provide a good trade-off between manufacturing repeatability and resistance to external influences, taking into account a design wavelength range close to the common telecom window around 1550 nm. A motorized translation stage was used for the fiber cleaving. In this way the repeatability in length could be held within ±0.1 mm, which corresponds to a change in central wavelength for the minima around 10 nm. Figure 5a shows a typical transmission spectrum from a non-polymer coated TCF sensor with 24.2 mm length held in air. The position of the transmission minima shifts to shorter wavelengths (blue shift) for a longer TCF as can be seen in Figure 5b. Most of the observed minima actually consists of several superimposed minima with origin from the complex interference pattern inside the TCF. A few of the minima appear to have a narrower FWHM; these minima also have the highest signal to noise ratio (SNR), see e.g., the minima at 1485 and 1650 nm in Figure 5a.
According to the literature [20,21,22], the phase condition for a specific transmission minima of a inline fiber optic sensor can be described by:
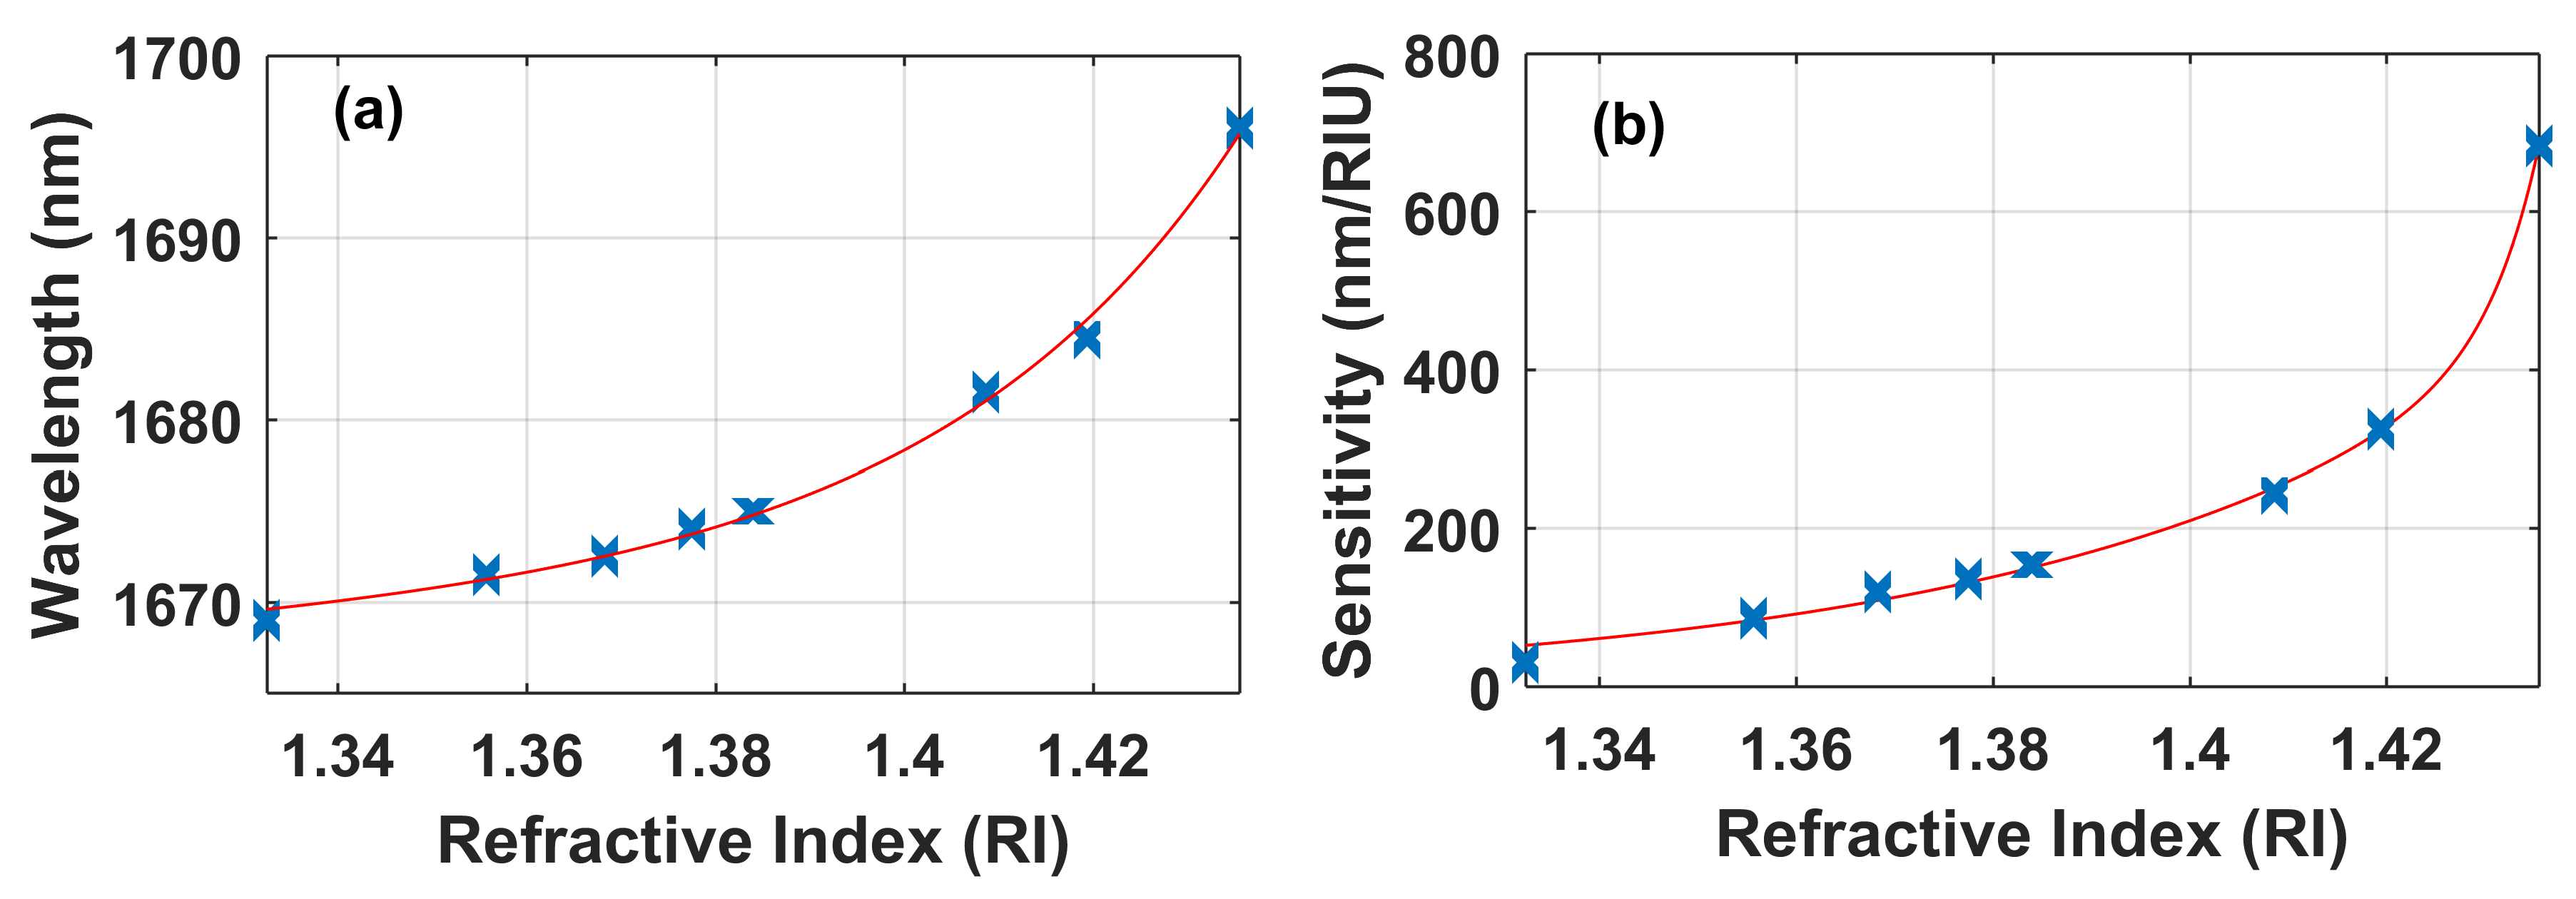
where is the effective refractive index (RI) of the core, is the effective RI of the j-th order cladding mode, is the RI of the surrounding medium, L is the length of the inserted TCF, is the wavelength of the transmission minima and k is an integer. From Equation (1) it is observed that the central wavelength of the transmission minima, is dependent on and will change linearly as a function of the outer refractive index. By carefully selecting the length L of the inline fiber, it is possible to construct a sensor to have a response within a specific wavelength range. However, Equation (1) is a simplified equation based on a TCF where the core in the TCF guides a mode. If the core diameter is small enough (or for the use of a coreless fiber) it is possible that the V parameter is smaller than 1 . For this situation there will be no guided mode within the core of the TCF. This is actually the case for the inline sensors presented in this work and a more correct model for this situation has been made by Wu et al. [23]. A Nufern HP460 fiber with 2.5 m core diameter and NA = 0.13 is used, which gives a V number ∼ 0.66 at a wavelength of 1550 nm. Figure 6a shows the response from a 20 mm long inline thin core interferometer submersed in liquids with different RI. A clear non-linear behavior is observed as also predicted by Wu et al. [23]. The sensitivity, as a function RI is calculated from Figure 6a and shown in Figure 6b.
3.2. Polymer Preparation and Coating Procedure
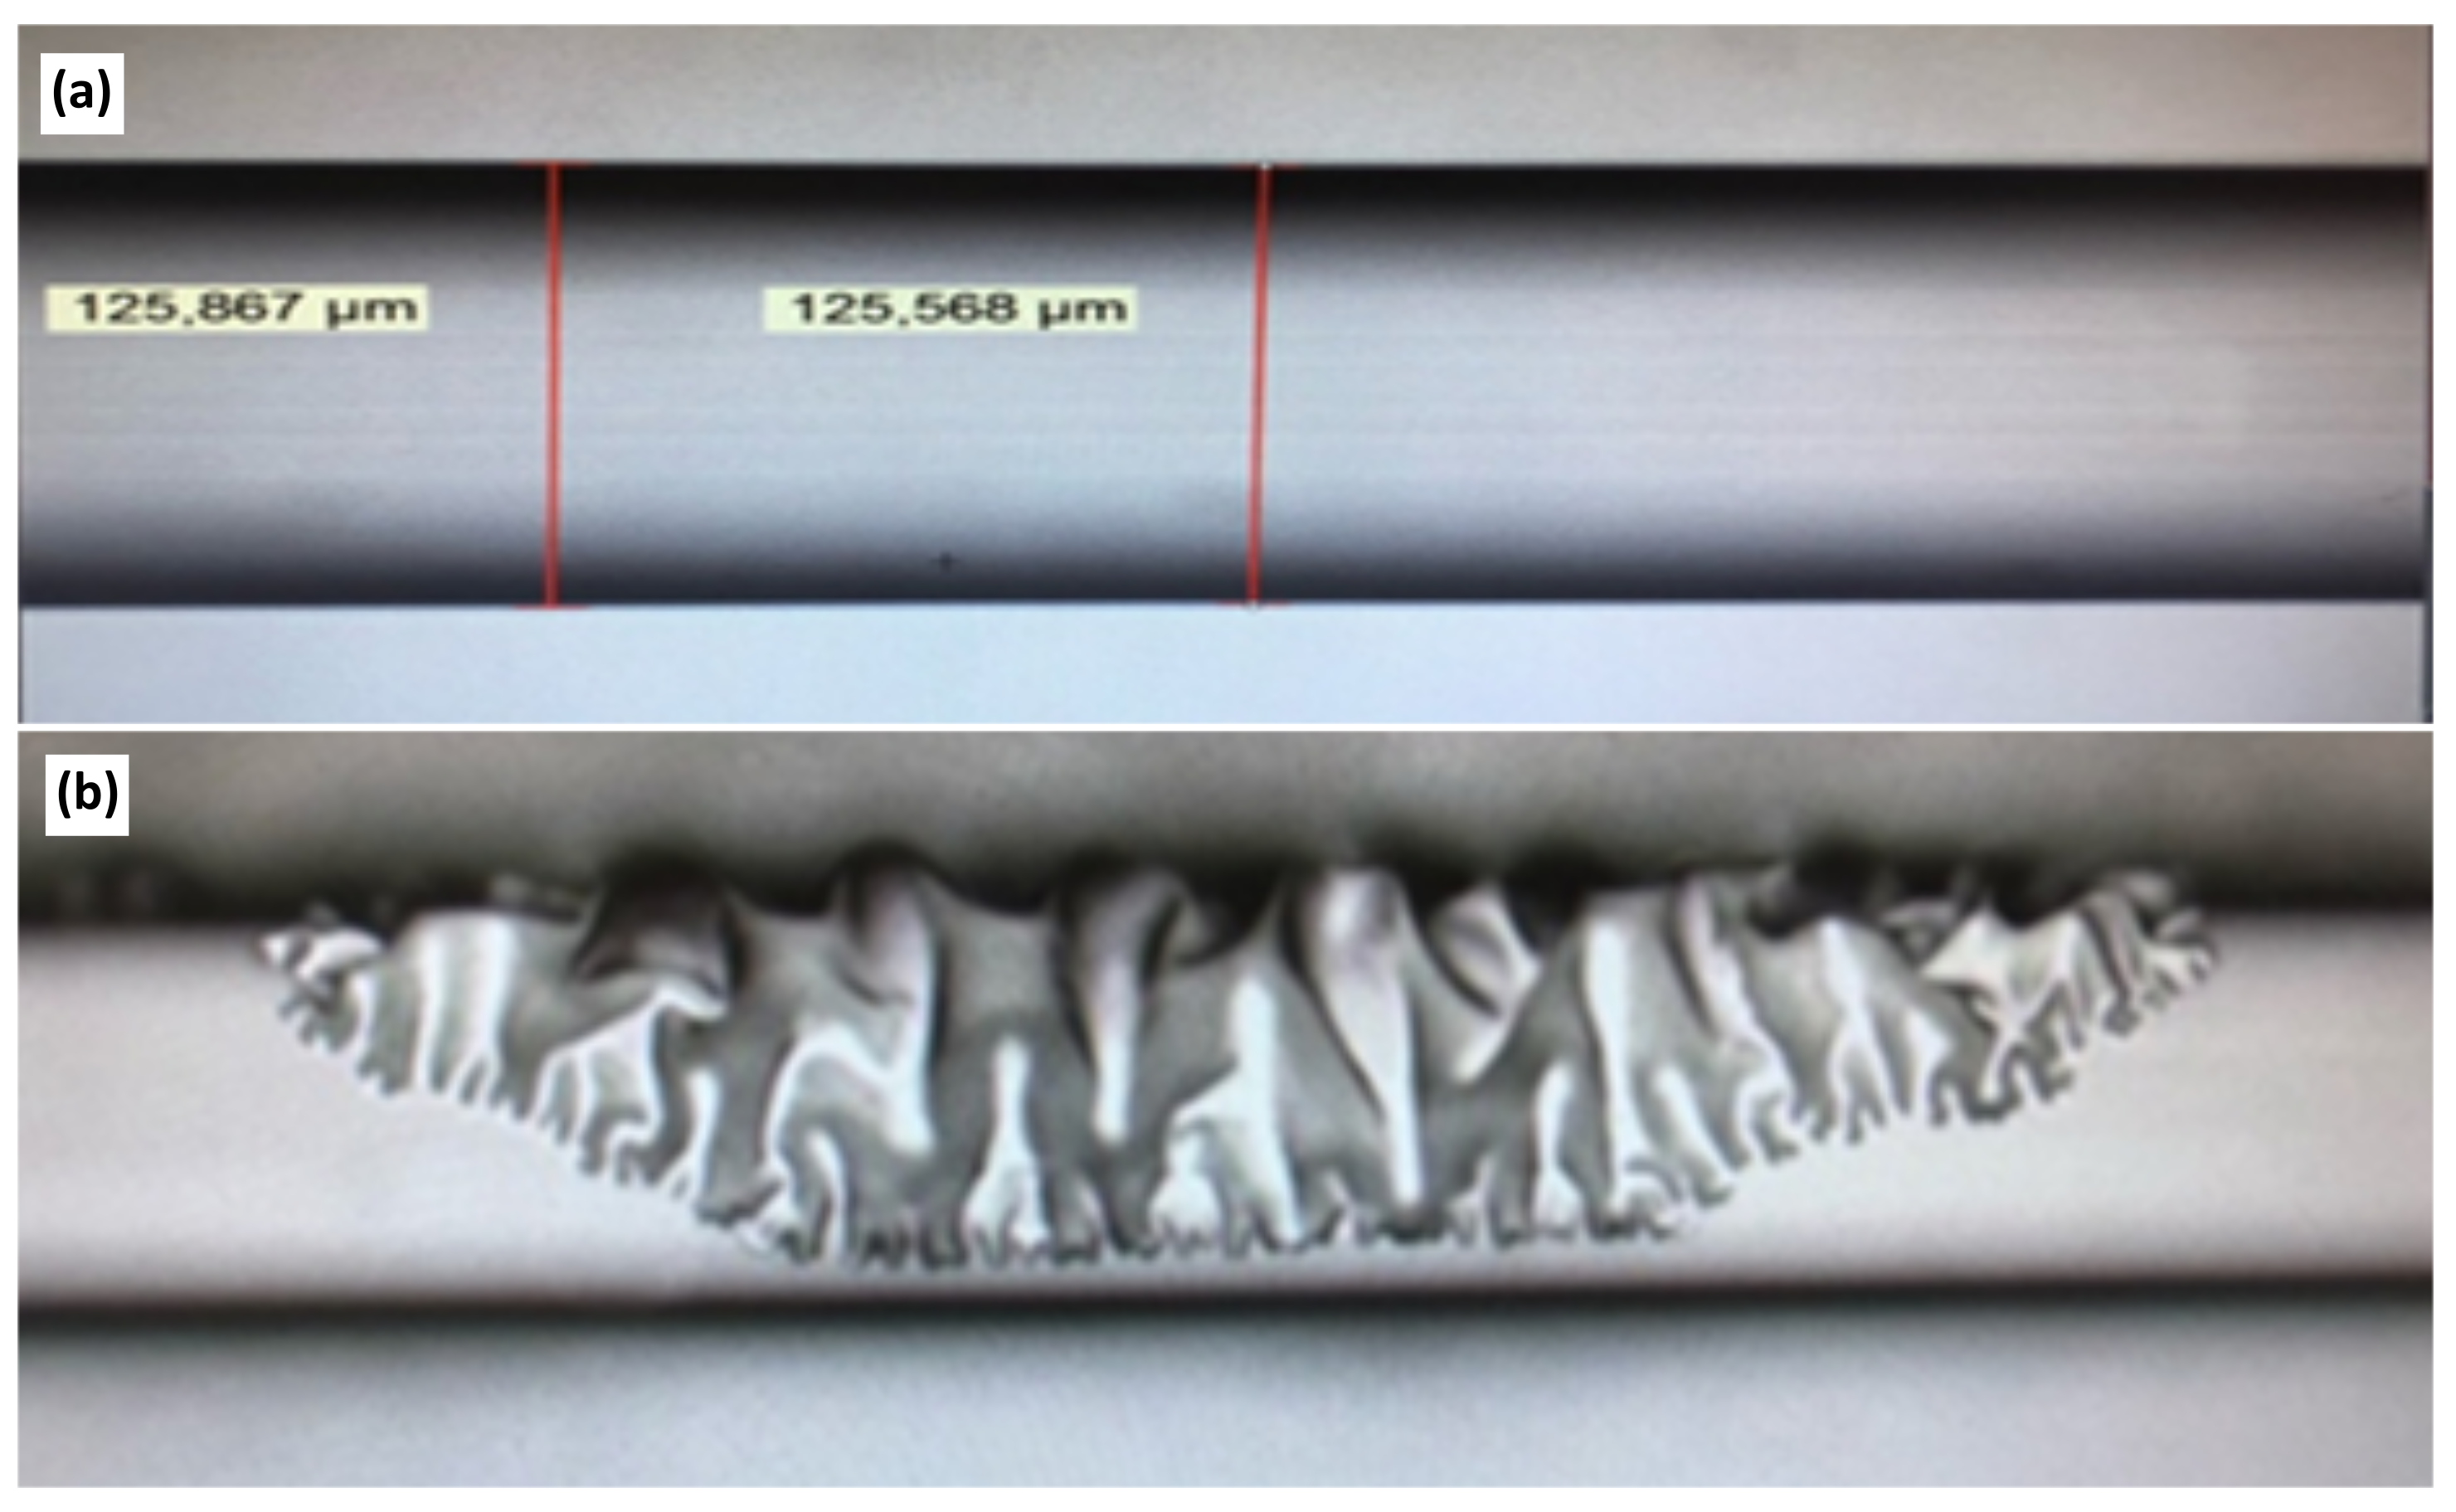
Two types of the bio-compatible hydrogel have been considered as a pH sensitive coating material on the inline TCF sensor. The preparation of the hydrogel and the curing procedure are described in detail elsewhere [18]. The main ingredients of the hydrogel are either 1.3- or 1.4-Butanediol Diacrylate (1.3- or 1.4 BDDA) and Piperazine (PIP). A small amount, typically 2.5 wt% of Diphenyl(2.4.6-Trimetylbenzoyl)phosphine oxide (Photo-initiator) is also added to the mixture for UV curing of the hydrogel. An ideal chemical molar ratio between BDDA and PIP is 2:1, see Hammarling et al. [18]. However, during the experiments it was observed that this molar ratio in most cases results in too large volume expansion when the cured hydrogel is submerged in a liquid. This leads to a severe problem with adhesion of the hydrogel to the glass fiber that will limit the usable pH range, see Figure 7. Therefore, a variety of molar ratios ranging from 2:1 to 4:1 have been tested as a higher molar ratio will reduce the volume expansion.
Coating of the TCF part is performed by vertical fixation of the fiber in a clamp connected to a motorized translation stage. The fiber is allowed to pass in a glass tube through a small U-shaped holder where a small amount (typically the size of a drop) of the hydrogel is placed. The thickness of the hydrogel layer can be controlled by adjusting the speed of the translation stage. Typical drawing speeds are from 0.1–0.5 mm/s, which resulted in a coating thickness up to 3 m. Curing of the hydrogel is made with a 365 nm LED (M365F1 from Thorlabs) placed directly above the U-shaped holder. The coating and curing are performed in a low-oxygen atmosphere (<1%) by using a flow of nitrogen gas through the glass tube.
3.3. Experimental Evaluation of the pH Sensors
Several inline TCF sensors have been constructed and evaluated according to the methods described in Section 3.1 and Section 3.2. As there are many parameters that influence the sensor performance such as length of the TCF, coating thickness, viscosity, adhesion and curing of the hydrogel etc., it was found difficult to obtain appropriate parameters for a fully functional pH sensor considering all aspects. For this reason, only a limited number of sensors could be tested and evaluated in pH-level cycling experiments. Although many challenges were identified during the manufacturing process of the sensors, the concept of using the bio-compatible polymer as a pH-sensitive coating material on an inline fiber optic sensor could still be experimentally verified. Unfortunately, no fully functional sensor could be made with the polymer based on the 1.3-BDDA due to poor adhesion during volume expansion, see Figure 7. This will be further discussed in Section 4. For this reason, results from the experimental sensor evaluation will only be presented for a TCF sensor coated with the 1.4-BDDA based polymer.
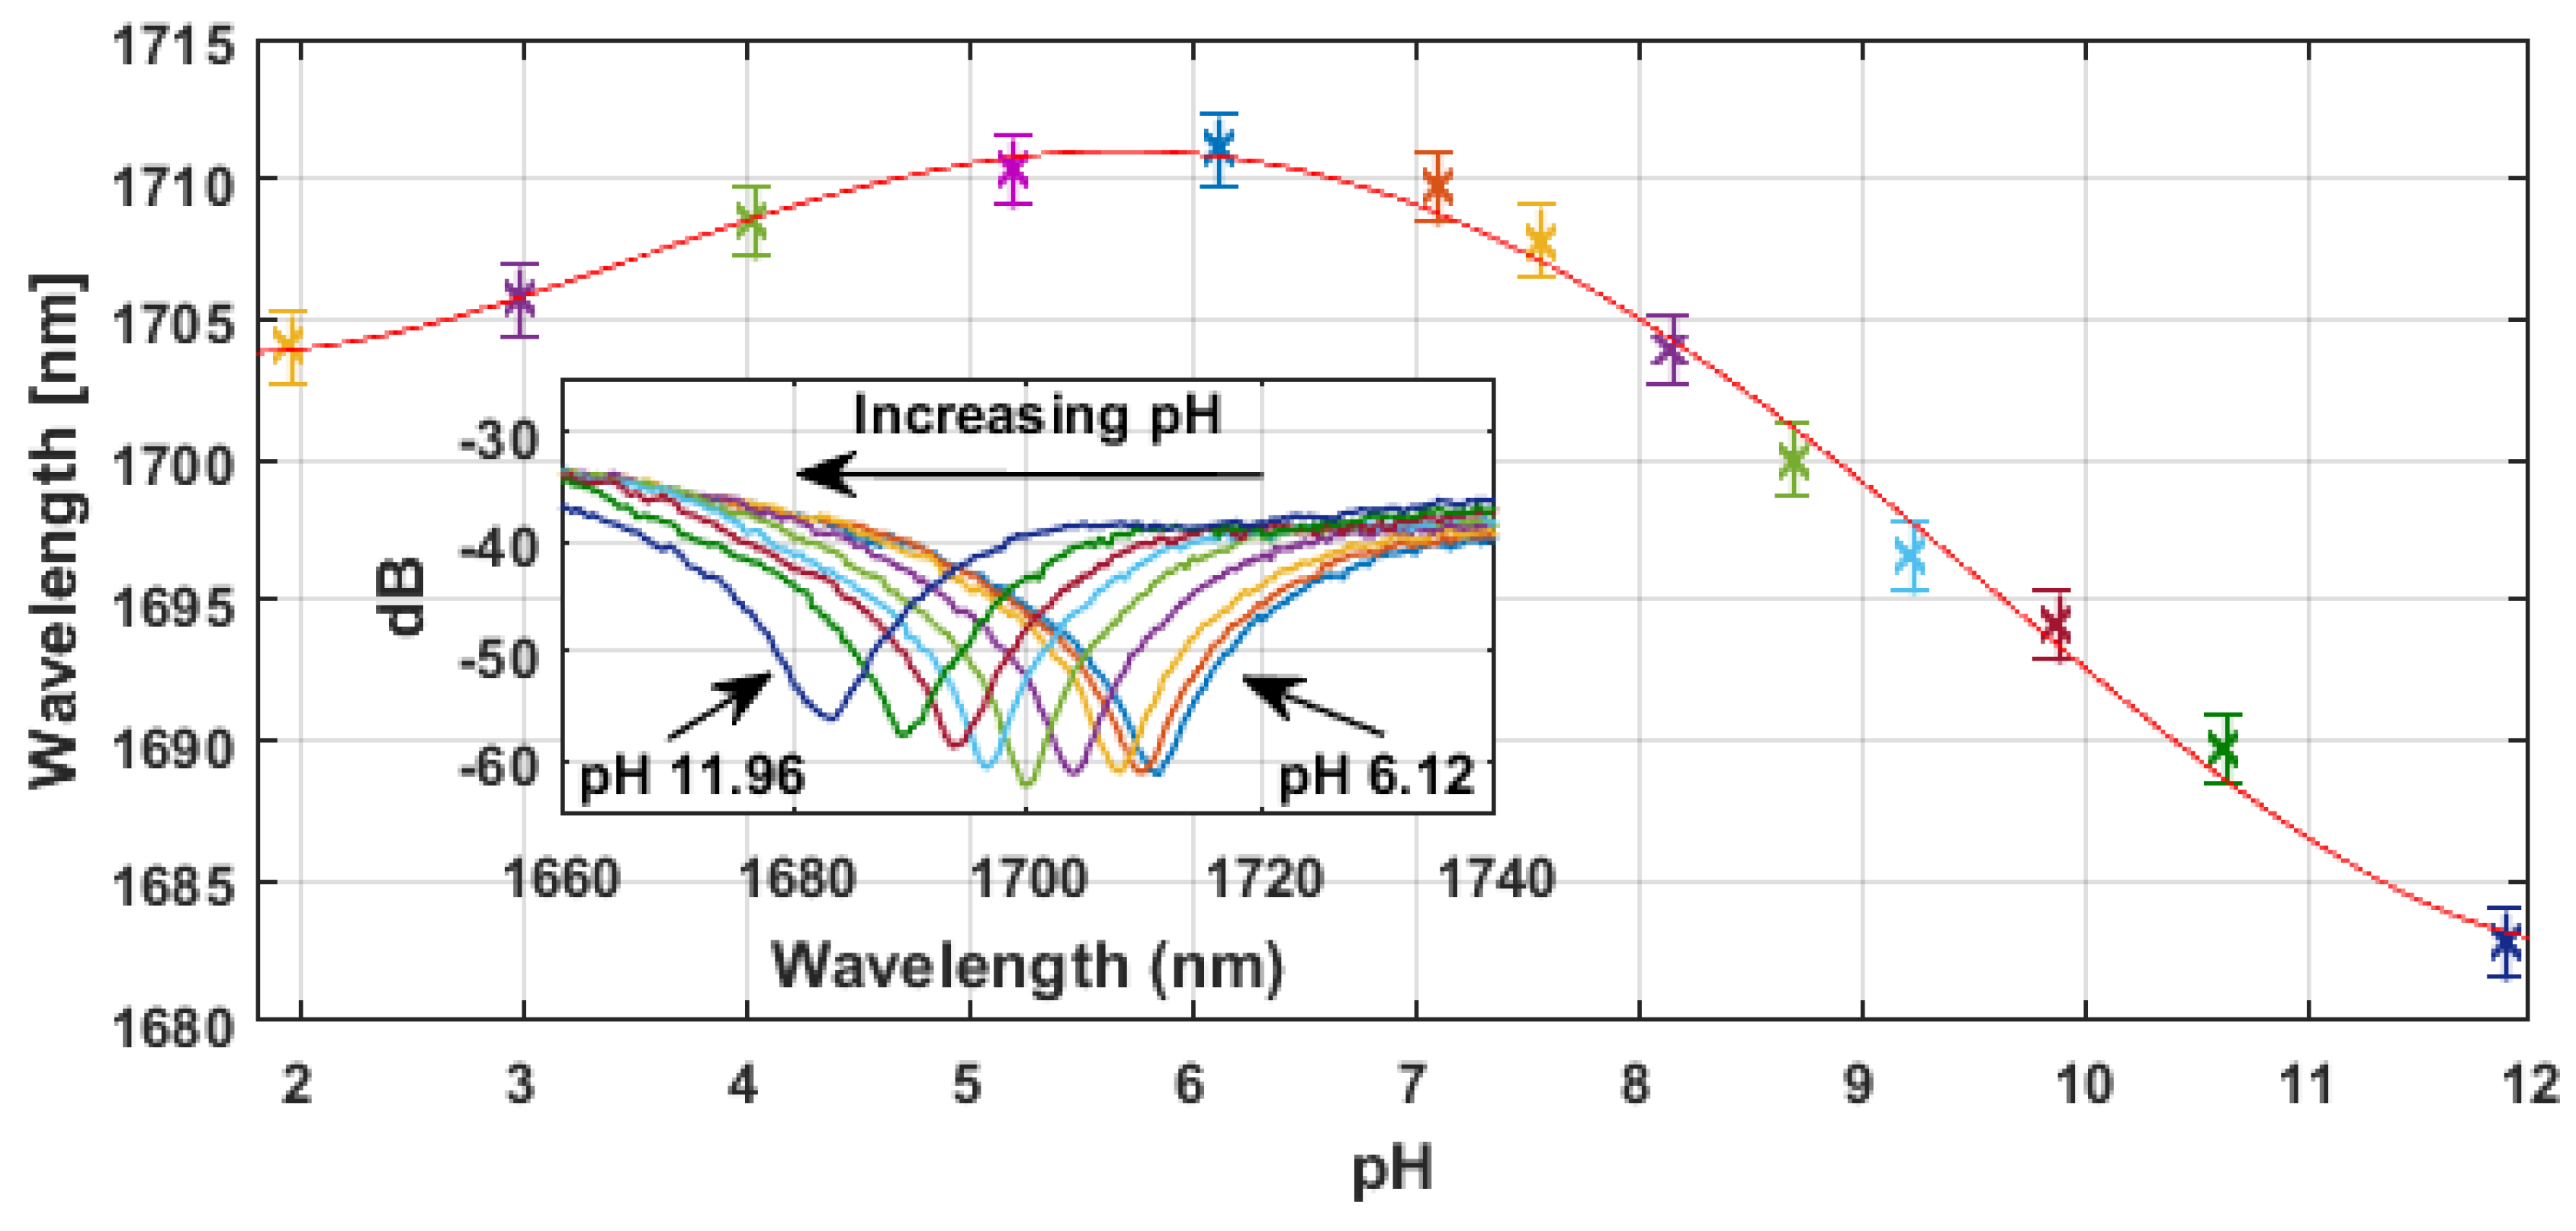
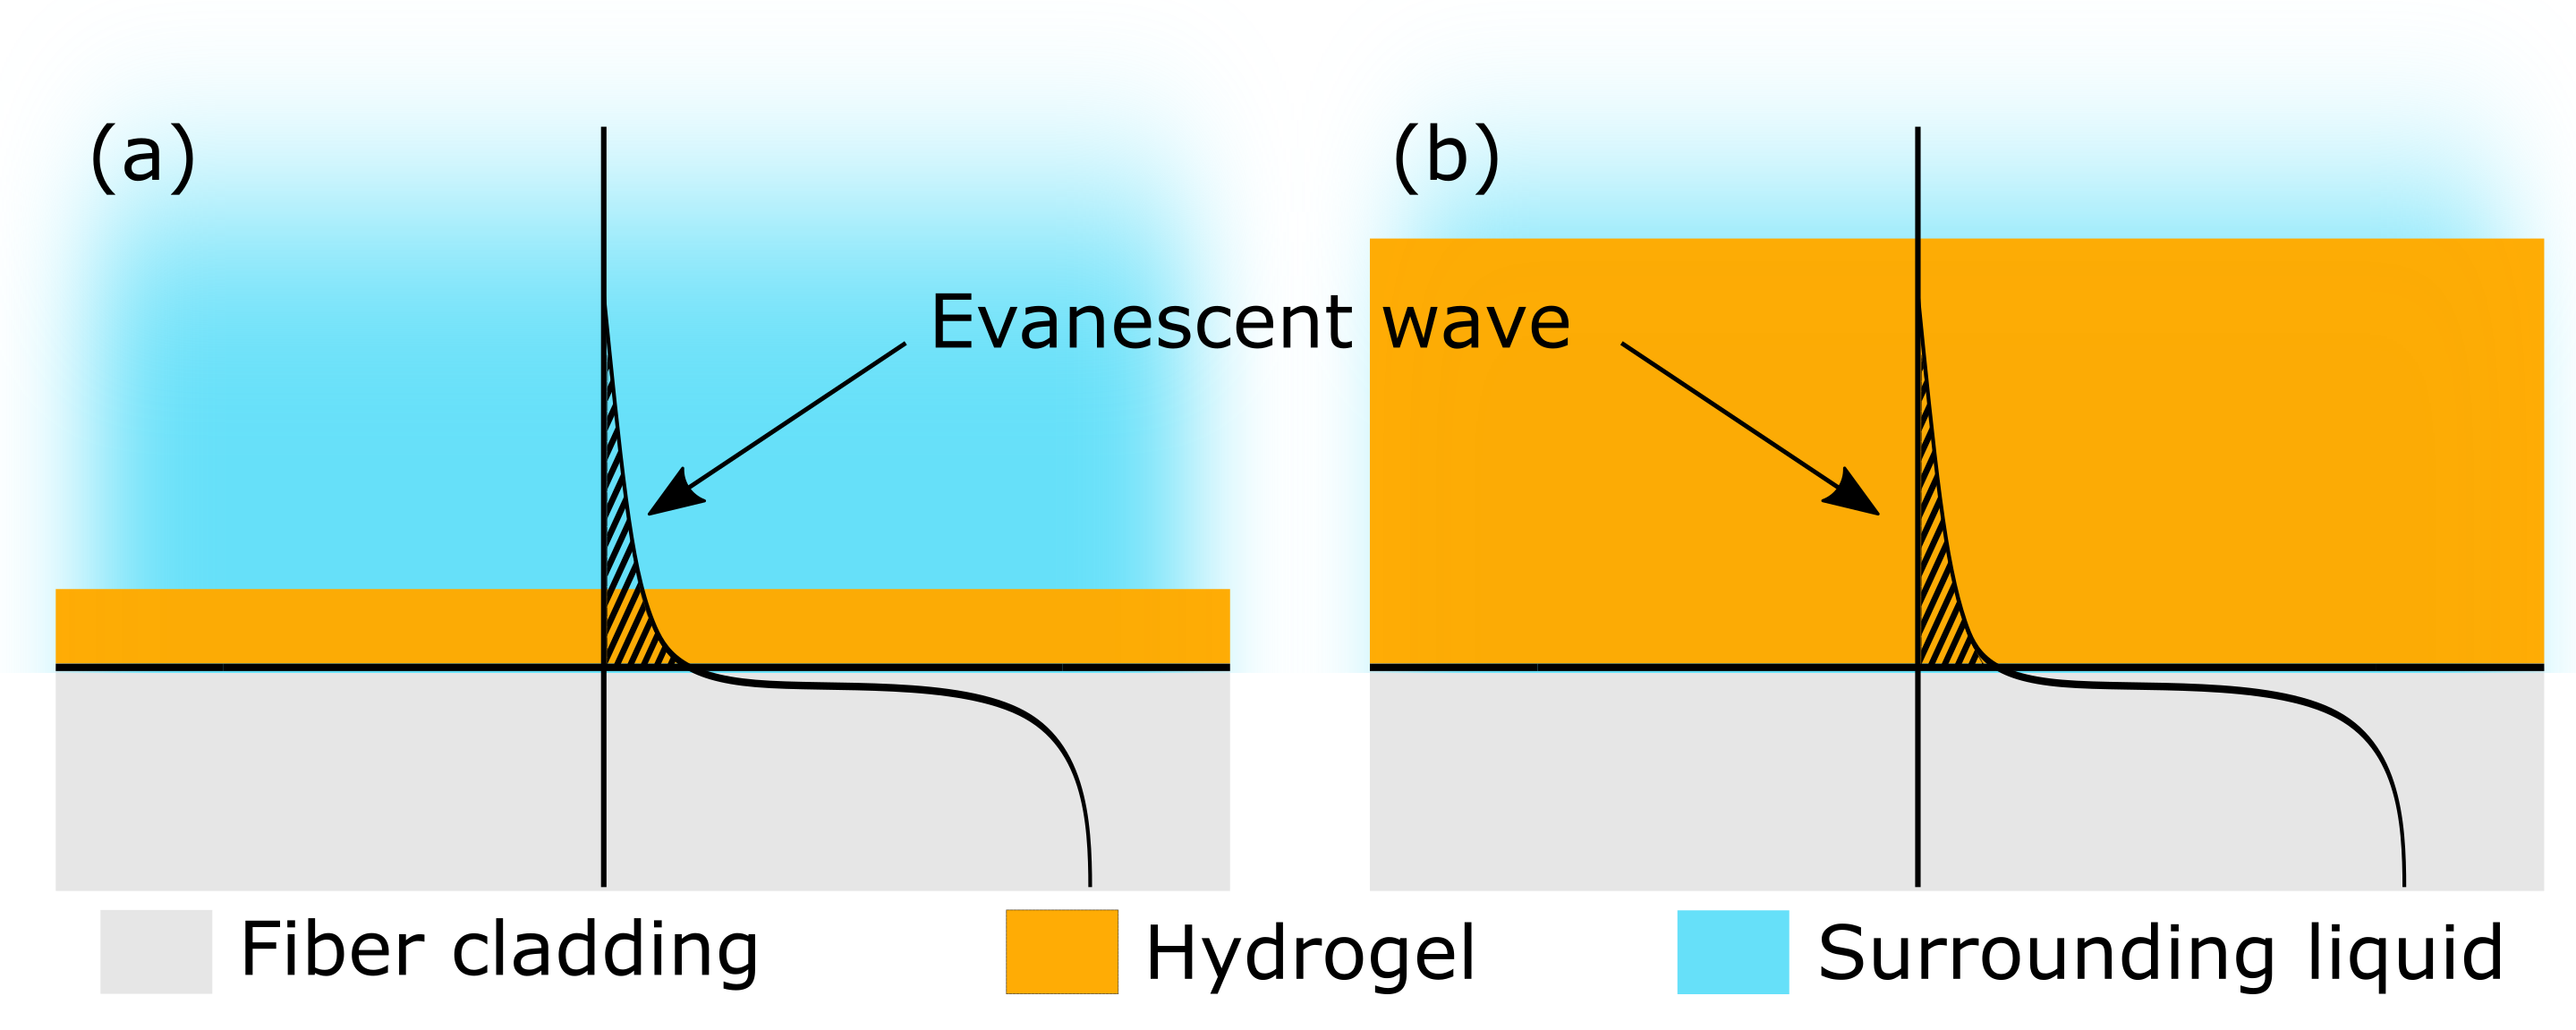
Figure 8 shows the spectral response for one of the fully functioning inline sensors coated with the hydrogel based on the 1.4-BDDA and using a molar ratio of 11:3 between 1.4-BDDA and PIP. This particular pH sensor has a 20.0 mm long TCF and the position of the transmission minima is around 1700 nm. The inline sensor is submerged in different liquids with pH-levels ranging from 1.95 to 11.89. The spectral response of this sensor shows several interesting features. Especially, the transmission minima, with a typical signal to noise ratio (SNR) of >25 dB is observed to blue shift to shorter wavelengths for an increasing pH-level going from pH 6.12 to 11.89, see inset in Figure 8. Interestingly, this is opposite to what is expected as an increasing pH-level will result in a lower effective RI for the hydrogel due to the release of water (compare with the situation in Figure 6a in Section 3.1). The only possible explanation for this observed result is that the coated polymer layer is so thin that the evanescent wave stretches outside the coating layer reaching the surrounding liquid, see Figure 9a. In this way, the effective RI will be lower compared to the case where the evanescent wave is completely within the coated layer, see Figure 9b.
For pH levels between 1.95 and 6.12, the situation is different as the minima is seen to red shift with a turning point around pH level 6. This can be explained by the increasing volume of the hydrogel for lower pH-levels that will allow for the evanescent wave to stay within the coated polymer layer, see Figure 9b. Hence, the effective RI will be higher due to less influence from the surrounding liquid. It is therefore important to be careful during the design of the sensor as the position of a central minima can, for this specific layer thickness, represent two different pH-values. The propagation of the evanescent wave into the hydrogel layer is typically in the order of the wavelength [24].
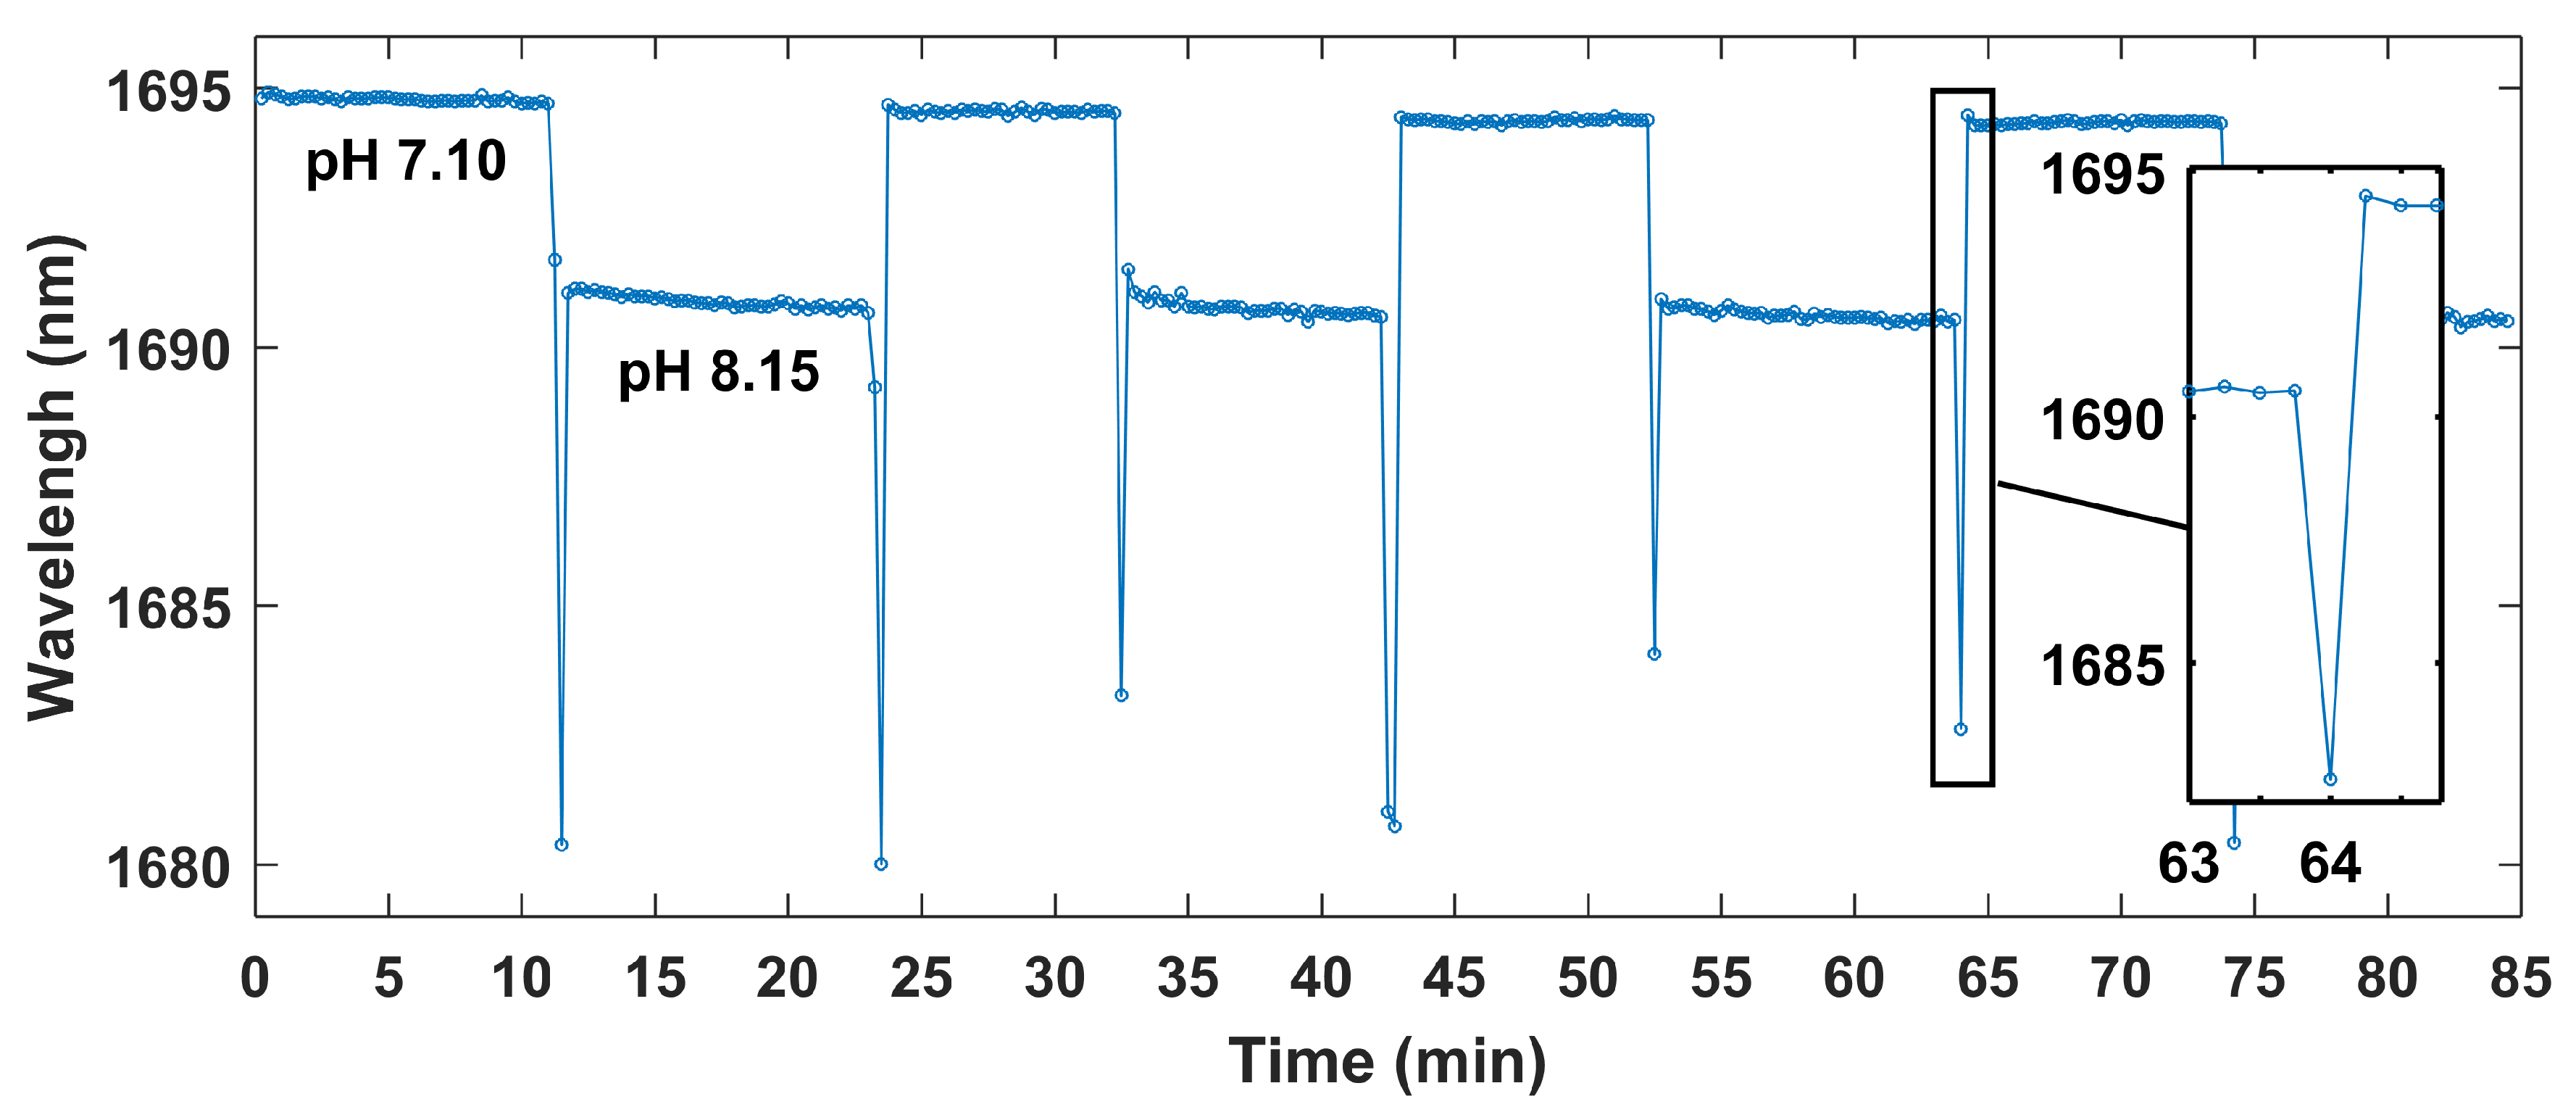
A typical result from a pH-level cycling measurement is shown in Figure 10, where the sensor is repeatedly submerged into liquids with pH-level 7.10 and 8.15. The response time of the sensor is less than 15 s, which is the highest acquisition rate of the optical spectrum analyzer (OSA). The sharp dips between the different pH-levels originates from the short time (less than 20 s) the sensor is held in air, due to changing of the pH-liquid. The short response time is due to the relatively thin coating layer on this sensor. Sensors with thicker coating layers, i.e., >1 m typically have response times in the order of minutes (not shown). For this reason, a thin (<1 m) coating layer is clearly an advantage.
4. Discussion
Only a limited number of the developed sensors could be experimentally tested and evaluated due to a very large variation in parameters. Still, the concept of using this new type of bio-compatible pH-sensitive material coated and cured on an interferometric fiber based sensor could be verified. Many challenges were handled during the development process of the sensors such as repeatability in cleaving of the TCF to a specific length. Another challenge was identifying an appropriate volume expansion of the hydrogel without causing problems with adhesion. The most challenging part of the development process was coating the TCF with a hydrogel having an appropriate viscosity (which is molar ratio dependent) to obtain a layer that is thin enough. The thickness of the coated hydrogel layer is of particular importance due to the large volume expansion when the sensor is submerged in a liquid. If the coated layer becomes too thick (typically > 1 m), severe problems were in most cases observed with adhesion, which resulted in detachment of the hydrogel from the glass surface. Therefore, only the sensors with a relatively thin polymer layer, i.e., less than 1 m, were found to respond to pH as intended.
An important observation during the evaluation process was that the evanescent wave of the different modes in the TCF stretches outside the coated layer, reaching the surrounding liquid. As seen in Figure 8 there is a point where the wavelength of the central minima changes direction (between pH-level 5–6) going from lower to higher pH-values. The only plausible explanation is that the effective RI is increasing (i.e., the volume of hydrogel decreases) until pH-level 5–6 where the volume of the hydrogel reach a point such that the evanescent wave of the modes is more influenced by the RI from the surrounding liquid, see Figure 9. Hence, it is therefore of special importance to take this into account when designing the sensor such that operation is within the intended pH-range.
Out of the two types of polymers considered as a pH-sensitive coating material in this work, sensors coated with the 1.4-BDDA and with a molar ratio of 11:3 are the only ones experimentally verified here. Other molar ratios were also evaluated such as 2:1 and 5:4, however, the viscosity was observed to become too high, resulting in relatively thick layers (>1 m) leading to problems with adhesion. The sensors coated with a hydrogel based on the 1.3-BDDA all turned out to have too thick layers, resulting in adhesion problems as displayed in Figure 7. More work is needed to identify appropriate molar ratios, viscosity and coating thicknesses using the 1.3-BDDA based hydrogel. The 1.3- and 1.4 BDDA are very similar, although an important difference is that the 1.3-BDDA is less susceptible to crystallization at room temperature in the preparation stage due to its unsymmetrical structure [18]. For this reason, the 1.3-BDDA may be a better choice in future evaluations.
The sensor was evaluated in liquids of different pH-levels ranging from 1.89 to 11.89 where the largest sensitivity was observed in the pH range 7–10. The sensitivity for a specific pH range can be adjusted by selecting an appropriate thickness of the hydrogel layer. Care must also be taken to ensure that the measured pH falls within the intended wavelength range. Otherwise, the central wavelength of the transmission minima can represent two different pH values as seen in Figure 8.
Finally, a few comments related to the measurement system that is used for evaluation of the fiber optic pH sensor. Measuring the central wavelength of the transmission minima as presented here requires an optical spectrum analyzer (OSA). This is a relatively expensive instrument (typically >$20,000), which can prevent the use of this type of sensor in many applications. However, by designing the fiber optic sensor for wavelengths within the telecom window around 1550 nm, where fiber optic components are relatively inexpensive, the presented sensor concept could be useful in many application areas. In addition, for this wavelength range the OSA can also be replaced with a so-called DWDM-filter, as has been demonstrated earlier [25,26]. The cost for a DWDM-filter is typically less than $200, which can make the total pH-sensor solution more cost effective and attractive for many application areas.
5. Conclusions
To summarize, simulations and experimental verification have been made on a fiber optic inline sensor coated with a bio-compatible pH sensitive polymer not previously used in this context. The simulations provided guidelines for the experimental development of the sensors. The sensors were developed by considering a large degree of variation in design parameters. A conceptual verification could be made with a sensor coated with the hydrogel based on 1.4-BDDA and PIP using a molar ratio of 11:3. The results are promising, showing the potential for the development of a reliable bio-compatible fiber optic pH sensor with short response time, high sensitivity and broad measurement range. Future work should focus on the challenges in finding appropriate design parameters for molar ratio, viscosity and coating thickness.
Author Contributions
Formal analysis, M.E. and K.H.; Funding acquisition, H.-E.N.; Investigation, M.E., K.H. and H.A.; Methodology, M.E., K.H. and H.A.; Software, K.H.; Supervision, M.E., H.A. and H.-E.N.; Validation, M.E., K.H., H.A. and M.S.; Visualization, K.H.; Writing—original draft, M.E.; Writing—review & editing, K.H., H.A., M.S. and H.-E.N.
Funding
The Knowledge Foundation (KKS), the Interreg Sweden-Norway Program and Fiber Optic Valley are gratefully acknowledged for the financial support.
Acknowledgments
We greatfully acknowledge and thanks our founders for the financial support. The work of Mats Sandberg was financed by The Swedish Foundation for Strategic Environmental Research (Mistra) in the research program Mistra TerraClean.
Conflicts of Interest
The authors declare no conflict of interest.
References
- Gu, B.; Yin, M.; Zhang, A.P.; Qian, J.; He, S. Biocompatible fiber-optic pH sensor based on optical fiber modal interferometer self-assembled with sodium alginate/polyethylenimine coating. IEEE Sens. J. 2012, 12, 1477–1482. [Google Scholar] [CrossRef]
- Lee, D.; Yang, M.; Qi, C.; Dai, J.; Wen, X.; Xie, W. An in-line optical fiber refractometer with porous thin film coating. Sens. Actuat. B Chem. 2015, 209, 602–605. [Google Scholar] [CrossRef]
- Lei, M.; Zhang, Y.N.; Han, B.; Zhao, Q.; Zhanga, A.; Fu, D. In-line Mach-Zehnder interferometer and FBG with smart hydrogel for simultaneous pH and temperature detection. IEEE Sens. J. 2018, 18, 7499–7504. [Google Scholar] [CrossRef]
- Gu, B.; Yin, M.J.; Zhang, A.P.; Qian, J.W.; He, S. Low-cost high-performance fiber-optic pH sensor based on thin-core fiber modal interferometer. Opt. Express 2009, 17, 22296–22302. [Google Scholar] [CrossRef] [PubMed]
- Zheng, Y.; Chen, L.H.; Dong, X.; Yang, J.; Long, H.Y.; So, P.L.; Chan, C.C. Miniature pH optical fiber sensor based on Fabry–Perot interferometer. IEEE J. Sel. Top. Quantum Electron. 2016, 22, 331–335. [Google Scholar] [CrossRef]
- Pathak, A.; Bhardwaj, V.; Gangwar, R.; De, M.; Singh, V. Fabrication and characterization of TiO2 coated cone shaped nano-fiber pH sensor. Opt. Commun. 2017, 386, 43–48. [Google Scholar] [CrossRef]
- Pathak, A.K.; Singh, V.K. A wide range and highly sensitive optical fiber pH sensor using polyacrylamide hydrogel. Opt. Fiber Technol. 2017, 39, 43–48. [Google Scholar] [CrossRef]
- Hammarling, K.; Hilborn, J.; Nilsson, H.E.; Manuilskiy, A. Blood pH optrode based on evanescent waves and refractive index change. In Proceedings of the Optical Fibers and Sensors for Medical Diagnostics and Treatment Applications XIV, San Francisco, CA, USA, 1–6 February 2014; Volume 8938, p. 89381F. [Google Scholar]
- Gotor, R.; Ashokkumar, P.; Hecht, M.; Keil, K.; Rurack, K. Optical pH sensor covering the range from pH 0–14 compatible with mobile-device readout and based on a set of rationally designed indicator dyes. Anal. Chem. 2017, 89, 8437–8444. [Google Scholar] [CrossRef]
- Wang, X.; Boschetti, C.; Ruedas-Rama, M.J.; Tunnacliffe, A.; Hall, E.A. Ratiometric pH-dot ANSors. Analyst 2010, 135, 1585–1591. [Google Scholar] [CrossRef]
- Hibino, Y. Cladding-mode-recoupling-based tilted fiber Bragg grating sensor with a core-diameter-mismatched fiber section. IEEE Photonics J. 2010, 2, 152–157. [Google Scholar] [CrossRef]
- Zhang, Y.; Yan, G.; Zhou, B.; Lee, E.H.; He, S. Reflective Optical Fiber Refractometer Based on Long-Period Grating Tailored Active Bragg Grating. IEEE Photonics Technol. Lett. 2015, 27, 1173–1176. [Google Scholar] [CrossRef]
- Lu, P.; Men, L.; Sooley, K.; Chen, Q. Tapered fiber Mach-Zehnder interferometer for simultaneous measurement of refractive index and temperature. Appl. Phys. Lett. 2009, 94, 131110. [Google Scholar] [CrossRef]
- Wu, Q.; Semenova, Y.; Wang, P.; Farrell, G. High sensitivity SMS fiber structure based refractometer— Analysis and experiment. Opt. Express 2011, 19, 7937–7944. [Google Scholar] [CrossRef] [PubMed]
- Ma, Y.; Qiao, X.; Guo, T.; Wang, R.; Zhang, J.; Weng, Y.; Rong, Q.; Hu, M.; Feng, Z. Mach-Zehnder interferometer based on a sandwich fiber structure for refractive index measurement. IEEE Sens. J. 2012, 12, 2081–2085. [Google Scholar] [CrossRef]
- Jung, Y.; Kim, S.; Lee, D.; Oh, K. Compact three segmented multimode fibre modal interferometer for high sensitivity refractive-index measurement. Meas. Sci. Technol. 2006, 17, 1129. [Google Scholar] [CrossRef]
- Lee, B.H.; Kim, Y.H.; Park, K.S.; Eom, J.B.; Kim, M.J.; Rho, B.S.; Choi, H.Y. Interferometric fiber optic sensors. Sensors 2012, 12, 2467–2486. [Google Scholar] [CrossRef] [PubMed]
- Hammarling, K.; Sandberg, M.; Engholm, M.; Andersson, H.; Nilsson, H.E. Synthesis, Curing Behavior and Swell Tests of pH-Responsive Coatings from Acryl-Terminated Oligo (β-Amino Esters). Chemosensors 2018, 6, 10. [Google Scholar] [CrossRef]
- Comsol, A.B. RF Module User’s Guide, 2012. Available online: https://is.muni.cz/el/1431/podzim2013/F7061/um/RFMod\uleUsersGuide.pdf (accessed on 24 October 2018).
- Huang, G.; Zhou, B.; Chen, Z.; Jiang, H.; Xing, X. Magnetic-field sensor utilizing the ferrofluid and thin-core fiber modal interferometer. IEEE Sens. J. 2015, 15, 333–336. [Google Scholar] [CrossRef]
- Wu, J.; Miao, Y.; Song, B.; Lin, W.; Zhang, K.; Zhang, H.; Liu, B.; Yao, J. Simultaneous measurement of displacement and temperature based on thin-core fiber modal interferometer. Opt. Commun. 2015, 340, 136–140. [Google Scholar] [CrossRef]
- Haiwei, F.; Na, Z.; Min, S.; Huidong, L.; Hong, G.; Qinpeng, L.; Zhen, Y.; Yinggang, L.; Xueguang, Q. High-sensitivity Mach-Zehnder interferometric curvature fiber sensor based on thin-core fiber. IEEE Sens. J. 2015, 15, 520–525. [Google Scholar] [CrossRef]
- Wu, Q.; Semenova, Y.; Wang, P.; Farrell, G. A comprehensive analysis verified by experiment of a refractometer based on an SMF28—Small-core singlemode fiber (SCSMF)—SMF28 fiber structure. J. Opt. 2011, 13, 125401. [Google Scholar] [CrossRef]
- Ahmad, M.; Hench, L.L. Effect of taper geometries and launch angle on evanescent wave penetration depth in optical fibers. Biosens. Bioelectron. 2005, 20, 1312–1319. [Google Scholar] [CrossRef] [PubMed]
- Fiorini, B. Sensore di pH Basato su Interferometro Modale in Fibra Thin-Core. Master’s Thesis, UNIMORE University, Modena, Italy, 2016. [Google Scholar]
- Hammarling, K.; Beatrice, F.; Magnus, E. Fiber Optic pH-Sensor with Fast Response Time, Broad Operating Range and Simple Readout System. Optical Fibers and Sensors for Medical Diagnostics and Treatment Applications XVI. 2016, Volume 9702. Available online: https://spie.org/PW16B/conferencedetails/opticalfibers-and-sensors-medical-diagnostics (accessed on 24 October 2018).
Figure 1.
Principle of a single mode-multi mode-single mode (SMS) thin core Mach-Zehnder interferometer. Light from the core of the left SMF28 fiber is coupled to cladding modes in the short (TCF), which can interact with the surrounding liquid depending on the liquid refractive index. For a broadband light source, a constructive or destructive interference pattern is created at the right (TCF)/SMF28 interface, which is guided in the core of the right SMF28 fiber.

Figure 2.
A COMSOL multiphysics simulation of an inline interferometer at the wavelength 1550 nm and an external RI 1.33. Inset (a) shows the whole simulated structure, whereas the insets (b,c) show the input and output part of the thin core fiber (TCF) respectively.
Figure 2.
A COMSOL multiphysics simulation of an inline interferometer at the wavelength 1550 nm and an external RI 1.33. Inset (a) shows the whole simulated structure, whereas the insets (b,c) show the input and output part of the thin core fiber (TCF) respectively.

Figure 3.
Electric field along a center line running through the fiber.

Figure 4.
Electric field in the center of fiber, at wavelength 1550 nm and different surrounding refractive indexes, RI 1.33, 1.37 and 1.41. The inset shows an enlargement of the destructive interference around 540 um where a small shift is observed for increasing RI.
Figure 4.
Electric field in the center of fiber, at wavelength 1550 nm and different surrounding refractive indexes, RI 1.33, 1.37 and 1.41. The inset shows an enlargement of the destructive interference around 540 um where a small shift is observed for increasing RI.

Figure 5.
Typical transmission spectrum measured on a TCF inline sensor with a length of 24.2 mm held in air (a) and center wavelength for the left minima in (a) as a function of TCF length (b).
Figure 5.
Typical transmission spectrum measured on a TCF inline sensor with a length of 24.2 mm held in air (a) and center wavelength for the left minima in (a) as a function of TCF length (b).

Figure 6.
The wavelength of the transmission minima for a 20.0 mm long TCF sensor submerged in solutions with different RI (a) and the sensitivity in nm per RIU as a function of RI (b).
Figure 6.
The wavelength of the transmission minima for a 20.0 mm long TCF sensor submerged in solutions with different RI (a) and the sensitivity in nm per RIU as a function of RI (b).

Figure 7.
TCF coated with a thin, ∼0.5 m layer of pH-sensitive coating based on 1.3-BDDA and PIP (a). Large volume expansion of the polymer creating problem with adhesion to the glass fiber when the coated fiber is submerged in a liquid (b).
Figure 7.
TCF coated with a thin, ∼0.5 m layer of pH-sensitive coating based on 1.3-BDDA and PIP (a). Large volume expansion of the polymer creating problem with adhesion to the glass fiber when the coated fiber is submerged in a liquid (b).

Figure 8.
Spectral response from a 1.4-BDDA/PIP polymer coated inline sensor when submerged in liquids with pH-levels ranging from 1.95 to 11.89. The wavelength of the central minima as a function of pH is shown in the inset for pH 6.12 to 11.89.
Figure 8.
Spectral response from a 1.4-BDDA/PIP polymer coated inline sensor when submerged in liquids with pH-levels ranging from 1.95 to 11.89. The wavelength of the central minima as a function of pH is shown in the inset for pH 6.12 to 11.89.

Figure 9.
Schematic picture showing the interaction of the evanescent wave with the hydrogel coated layer on the fiber cladding. For thin hydrogel layers, the evanescent wave will be influenced not only by the RI of the hydrogel but also the RI of the surrounding liquid (a). For thicker layers the evanescent wave will only be influenced by the effective index of the hydrogel (b).

Figure 10.
Wavelength of the central minima as a function of time for a sensor repeatedly submerged in pH-levels of 7.10 and 8.15.
Figure 10.
Wavelength of the central minima as a function of time for a sensor repeatedly submerged in pH-levels of 7.10 and 8.15.

© 2019 by the authors. Licensee MDPI, Basel, Switzerland. This article is an open access article distributed under the terms and conditions of the Creative Commons Attribution (CC BY) license (http://creativecommons.org/licenses/by/4.0/).
Share and Cite
MDPI and ACS Style
Engholm, M.; Hammarling, K.; Andersson, H.; Sandberg, M.; Nilsson, H.-E. A Bio-Compatible Fiber Optic pH Sensor Based on a Thin Core Interferometric Technique. Photonics 2019, 6, 11. https://doi.org/10.3390/photonics6010011
AMA Style
Engholm M, Hammarling K, Andersson H, Sandberg M, Nilsson H-E. A Bio-Compatible Fiber Optic pH Sensor Based on a Thin Core Interferometric Technique. Photonics. 2019; 6(1):11. https://doi.org/10.3390/photonics6010011
Chicago/Turabian StyleEngholm, Magnus, Krister Hammarling, Henrik Andersson, Mats Sandberg, and Hans-Erik Nilsson. 2019. "A Bio-Compatible Fiber Optic pH Sensor Based on a Thin Core Interferometric Technique" Photonics 6, no. 1: 11. https://doi.org/10.3390/photonics6010011
Note that from the first issue of 2016, this journal uses article numbers instead of page numbers. See further details here.