Salinity Sensing Characteristics Based on Optical Microfiber Coupler Interferometer
by
 ,
,
Lingjun Zhou
1,2 ,
,
Yang Yu
2,3,*,
Huimin Huang
1,
Yuyu Tao
1,
Kui Wen
2,
Guofeng Li
1,
Junbo Yang
2 and
Zhenrong Zhang
1
1
Guangxi Key Laboratory of Multimedia Communications and Network Technology, School of Computer, Electronic and Information, Guangxi University, Nanning 530004, China
2
Center of Material Science, College of Liberal Arts and Sciences, National University of Defense Technology, Changsha 410073, China
3
Deep Sea Technology Laboratory, College of Meteorology and Oceanology, National University of Defense Technology, Changsha 410073, China
*
Author to whom correspondence should be addressed.
Photonics 2020, 7(3), 77; https://doi.org/10.3390/photonics7030077
Submission received: 31 August 2020
/
Revised: 17 September 2020
/
Accepted: 18 September 2020
/
Published: 21 September 2020
(This article belongs to the Special Issue Optical Fiber Interferometric Sensors: New Production Methodologies and Novel Applications)
Abstract
:In this paper, we report a novel and compact sensor based on an optic microfiber coupler interferometer (OMCI) for seawater salinity application. The OMCI device is fabricated by connecting Faraday rotating mirrors to the two out-ports of the microfiber coupler, respectively. The sensor signal processing is based on a wavelength demodulation technique. We theoretically analyze the sensing characteristics with different device structure parameters. Besides, the results show that the date reading error decreases with the thinner waist region and longer arm difference. Through the experiment, the reflection spectra red-shifted as the sea water salinity increased; the highest response sensitivity of the OMCI salinity sensor reached 303.7 pm/‰ for a range of 16.6–23.8‰, and the resolution was less than 0.03‰. This study provides a new technical solution for the development of practical optical fiber seawater salinity sensors.
1. Introduction
Salinity is one of the basic parameters of the ocean state equation. At the same time, it plays an important role in global water cycle change, and provides a means of studying the linkages of the oceans with the terrestrial water cycle, which affects marine phenomena such as precipitation and circulation [1,2,3,4]. In addition, the salinity directly determines the halocline of the seawater [5], which poses a threat to the safe operation of underwater equipment. Therefore, real-time and large-scale online monitoring of seawater salinity distribution is of great significance to ecosystem protection, the global climate, sea creatures, ocean economic development, and marine equipment operation.
Traditionally, the equipment used to measure the salinity of seawater is mainly the electrical conductivity-temperature-depth (CTD) system. Among them, its salinity sensor works by using the correspondence between the chloride ion content and the conductivity in the water solution. Although this technology can achieve higher precision, it is vulnerable to electromagnetic interference, and other conductive ions in seawater can also cause measurement errors [5,6]. Because of its large size and complicated structure, it is not applicable for salinity measurement at the micro scale and the water vapor interface [7]. Moreover, in order to obtain salinity data with high spatial resolution, many CTDs must be used in series, which greatly increases the cost. Therefore, there is an urgent need to develop low-cost and compact sensors to meet the demand of subtle measurement in the ocean.
In the last decades, optical fiber sensors have attracted significant research attention due to the advantages of small size, low cost, immunity to electromagnetic interference, and easy integration and reuse [8,9,10,11,12]. There are some fiber optic sensor structures that have been developed and applied to ocean salinity measurement, such as optical reflection [13,14], fiber Bragg grating [15,16,17], fiber surface plasmon resonance [2,18], and interferometer [19,20]. However, the above types of optical fiber seawater salinity sensors have various problems such as low sensitivity and susceptibility to temperature crosstalk. In recent years, researchers have discovered that optical microfiber (OM) is very sensitive to surrounding environmental changes due to the characteristics of large evanescent field transmission (a light field transmitted outside the boundary surface of the waveguide) [21]. It demonstrates important research value in highly sensitive sensing applications that can gradually be used in ocean salinity sensing research, including the microfiber knot resonator [6], optical microfiber coupler (OMC) [22,23,24], and OMC-Sagnac [25]. However, to truly succeed in the monitoring of seawater salinity, the optical fiber salinity sensor based on evanescent field transmission must adopt a particular package design to eliminate the influence of seawater impurities, algae and other stray parameters on the detection accuracy and stability of the sensor [24]. Thus, the optical fiber sensor must have a simple and compact optical path to facilitate probe package integration.
In this paper, a sensing device based on an optical microfiber coupler combined with an interferometer (OMCI) is proposed for the first time. The seawater salinity sensing mechanism and signal demodulation error are theoretically analyzed. Meanwhile, the salinity sensing experiment shows that the maximum salinity sensitivity is 303.7 pm/‰. The sensor demonstrated here is high sensitivity, simple and compact, easy to fabricate, convenient to be encapsulated due to the simple and compact optical path, and provides new technical solutions for the development of practical optical fiber seawater salinity sensors.
2. Sensing Principle
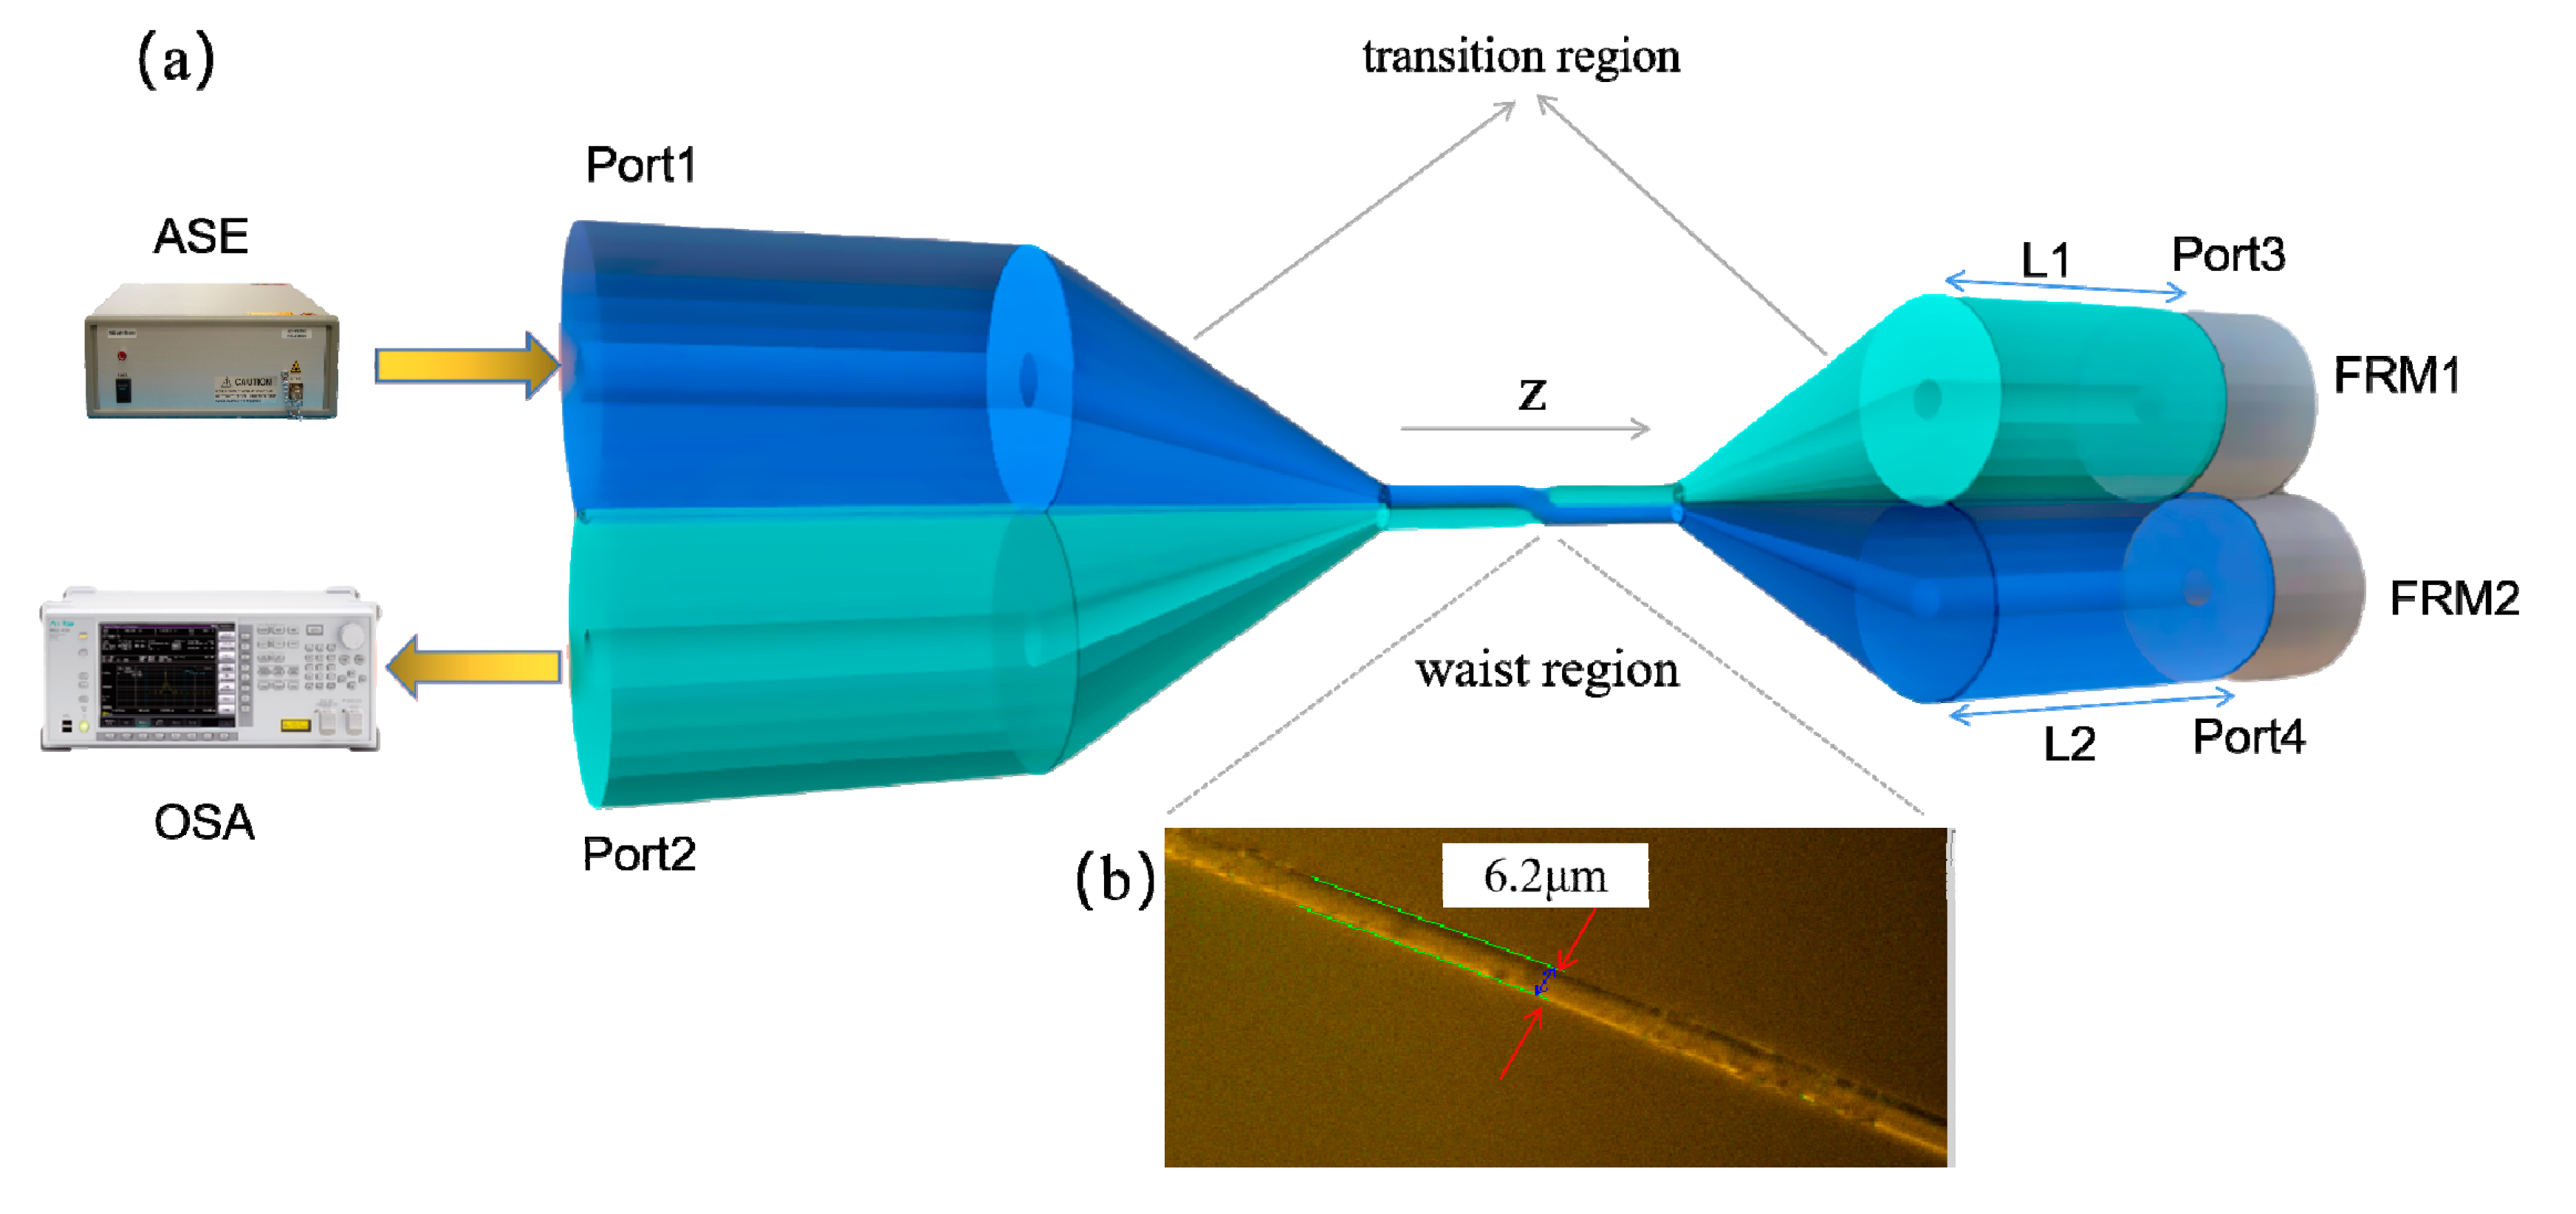
The OMC proposed in this article is fabricated by fusing and tapering two twisted conventional single mode fibers (SMFs) [26,27]. As shown in Figure 1a, the OMC is mainly composed of three parts, including a uniform waist region, two tapered transition regions and four input/output ports. As shown in Figure 1a, the OMCI is constructed by connecting two faraday rotating mirrors (FRMs) to Port3 and Port4 of the OMC, respectively. Figure 1b shows the microscope images of OMC uniform waist region. The waist region with the characteristics of large evanescent field transmission is the main sensing unit of OMCI. While the two FRMs are only used as mirrors to simplify the optical path and make the structure more compact, the interferometer does not participate in salinity sensing.
For the dual-fiber fusing and tapering OMC, optical coupling at the waist region can be regarded as the coupling between two optical microfibers. If the input light P0 is injected into Port1, the output light intensity of Port3 and Port4 can be expressed as [23,24]:
where l is the coupling length and is the coupling coefficient at wavelength λ and location z. The fusing and tapering OMC is manufactured according to the volume conservation model. The uniform waist length L and the coupling length l satisfy a specific relationship [28], and the thin uniform waist region plays a leading role in the coupling characteristics of the whole OMC [26]. Assuming that the OMC uniform waist region matches the condition of strong coupling, the coupling coefficient C can be expressed as [26]:
where is the normalized frequency, λ is the incident light wavelength, r is the radius of the OMs at the uniform waist region. n2 and n3 are the refractive indexes (RIs) of the fiber cladding (silica) and the external environment (sea water), respectively.
When the probe light output from Port3 and Port4 of OMC are reflected by the FRMs and re-enter the coupling area, secondary coupling and interference occur. Assuming that the reflection efficiency of the FRMs is 100%, the output light intensity at Port2 can be expressed as:
where is the interference phase difference, and la is the interferometer arm difference. Due to the large evanescent field transmission characteristics of OMC’s thin waist region, seawater can be regarded as the OMs’ cladding in the waist area of the OMC when OMCI is immersed in seawater [6]. As can be seen from Equations (2) and (3), the seawater RI n3 changes with the variation of seawater salinity, which results in the shift of specific wavelength. It means that the OMCI’s waist region with the characteristics of large evanescent field transmission is the main sensing unit in seawater salinity sensing applications. When tracking a specific wavelength (dip or peak) of the OMCI output spectra, the seawater salinity response sensitivity of OMCI can be expressed [25]:
In the condition of atmospheric pressure, the relationship between seawater salinity and refractive index is [29]:
where S and T represent salinity and temperature, respectively; the units are ‰ and °C. As can be known in Equation (5), the RI of seawater is controlled by the seawater temperature, salinity and detection light wavelength at atmospheric pressure. Under the condition that the seawater temperature T is 25 °C, the OMC uniform waist length L is 2 mm, and the radius of the OM is 1.55 μm, the salinity response characteristics of the OMCI transmission spectra under different arm differences are simulated and analyzed. The calculation results are shown in Figure 2, when the arm difference la is 0; that is, in the case of equal arms, the output spectra only have intensity fluctuations related to the filter beam splitting characteristics of OMC. When the arm of the OMCI is not equal, the difference is that the interference peaks (phase interference signals) related to the interferometer arm differences appear in the output spectra, and there is an intensity envelope on the interference peaks when the arm of the OMCI is not equal. In addition, the larger the OMCI arm difference, the denser the interference peaks in its output spectrum.
In fact, when a light source with different wavelengths (broadband source) injects to OMCI, the output intensity corresponding to each wavelength is the superimposed output effect after interference, and the phase difference of the interferometer corresponding to different wavelengths is different, so the output light intensity at each wavelength is different (corresponding to the optical path difference of the interferometer and the wavelength filtering characteristics of the OMC). It means that the reflection spectrum of OMCI will present an intensity envelope signal related to the OMC coupling characteristics, as well as “interference fringe” (intensity periodic oscillations) related to the optical path difference of the interferometer. This “interference” reflects the output result of the interference intensity caused by the phase difference of the interferometer at different wavelengths, rather than the traditional meaning of interference. In salinity sensing applications, the filtering characteristics of OMCI play a major role, and sensing is achieved by tracking reflection spectra with environmental salinity changes.
Figure 3a shows the detail of the peak1 of the output spectra near 1576 nm with the salinities when the OMCI is equal arm. It can be seen from the figure that the output spectra of OMCI red-shift as the salinity increases. By monitoring the drift of specific wavelength (peak), the salinity response sensitivity of the OMCI is 318 pm/‰. Moreover, when the two arms of OMCI are not equal, the output spectra with the variation of salinity also red-shift, and the salinity sensing response can be realized by tracking the extreme point of the interference peak. However, it should be noted that when the difference value of the OMCI arm is small, the output characteristic interference spectra will be very sparse. When the wavelength shift caused by the change of seawater salinity is less than the interference peak spacing, it will not be accurately monitored and will read the drift of the maximum point of the interference peak, which will cause a large error of data reading. The problem can be clearly seen from Figure 3b, which partially details that the change of the OMCI-specific spectra with the difference of salinity under the arm is 3 mm.
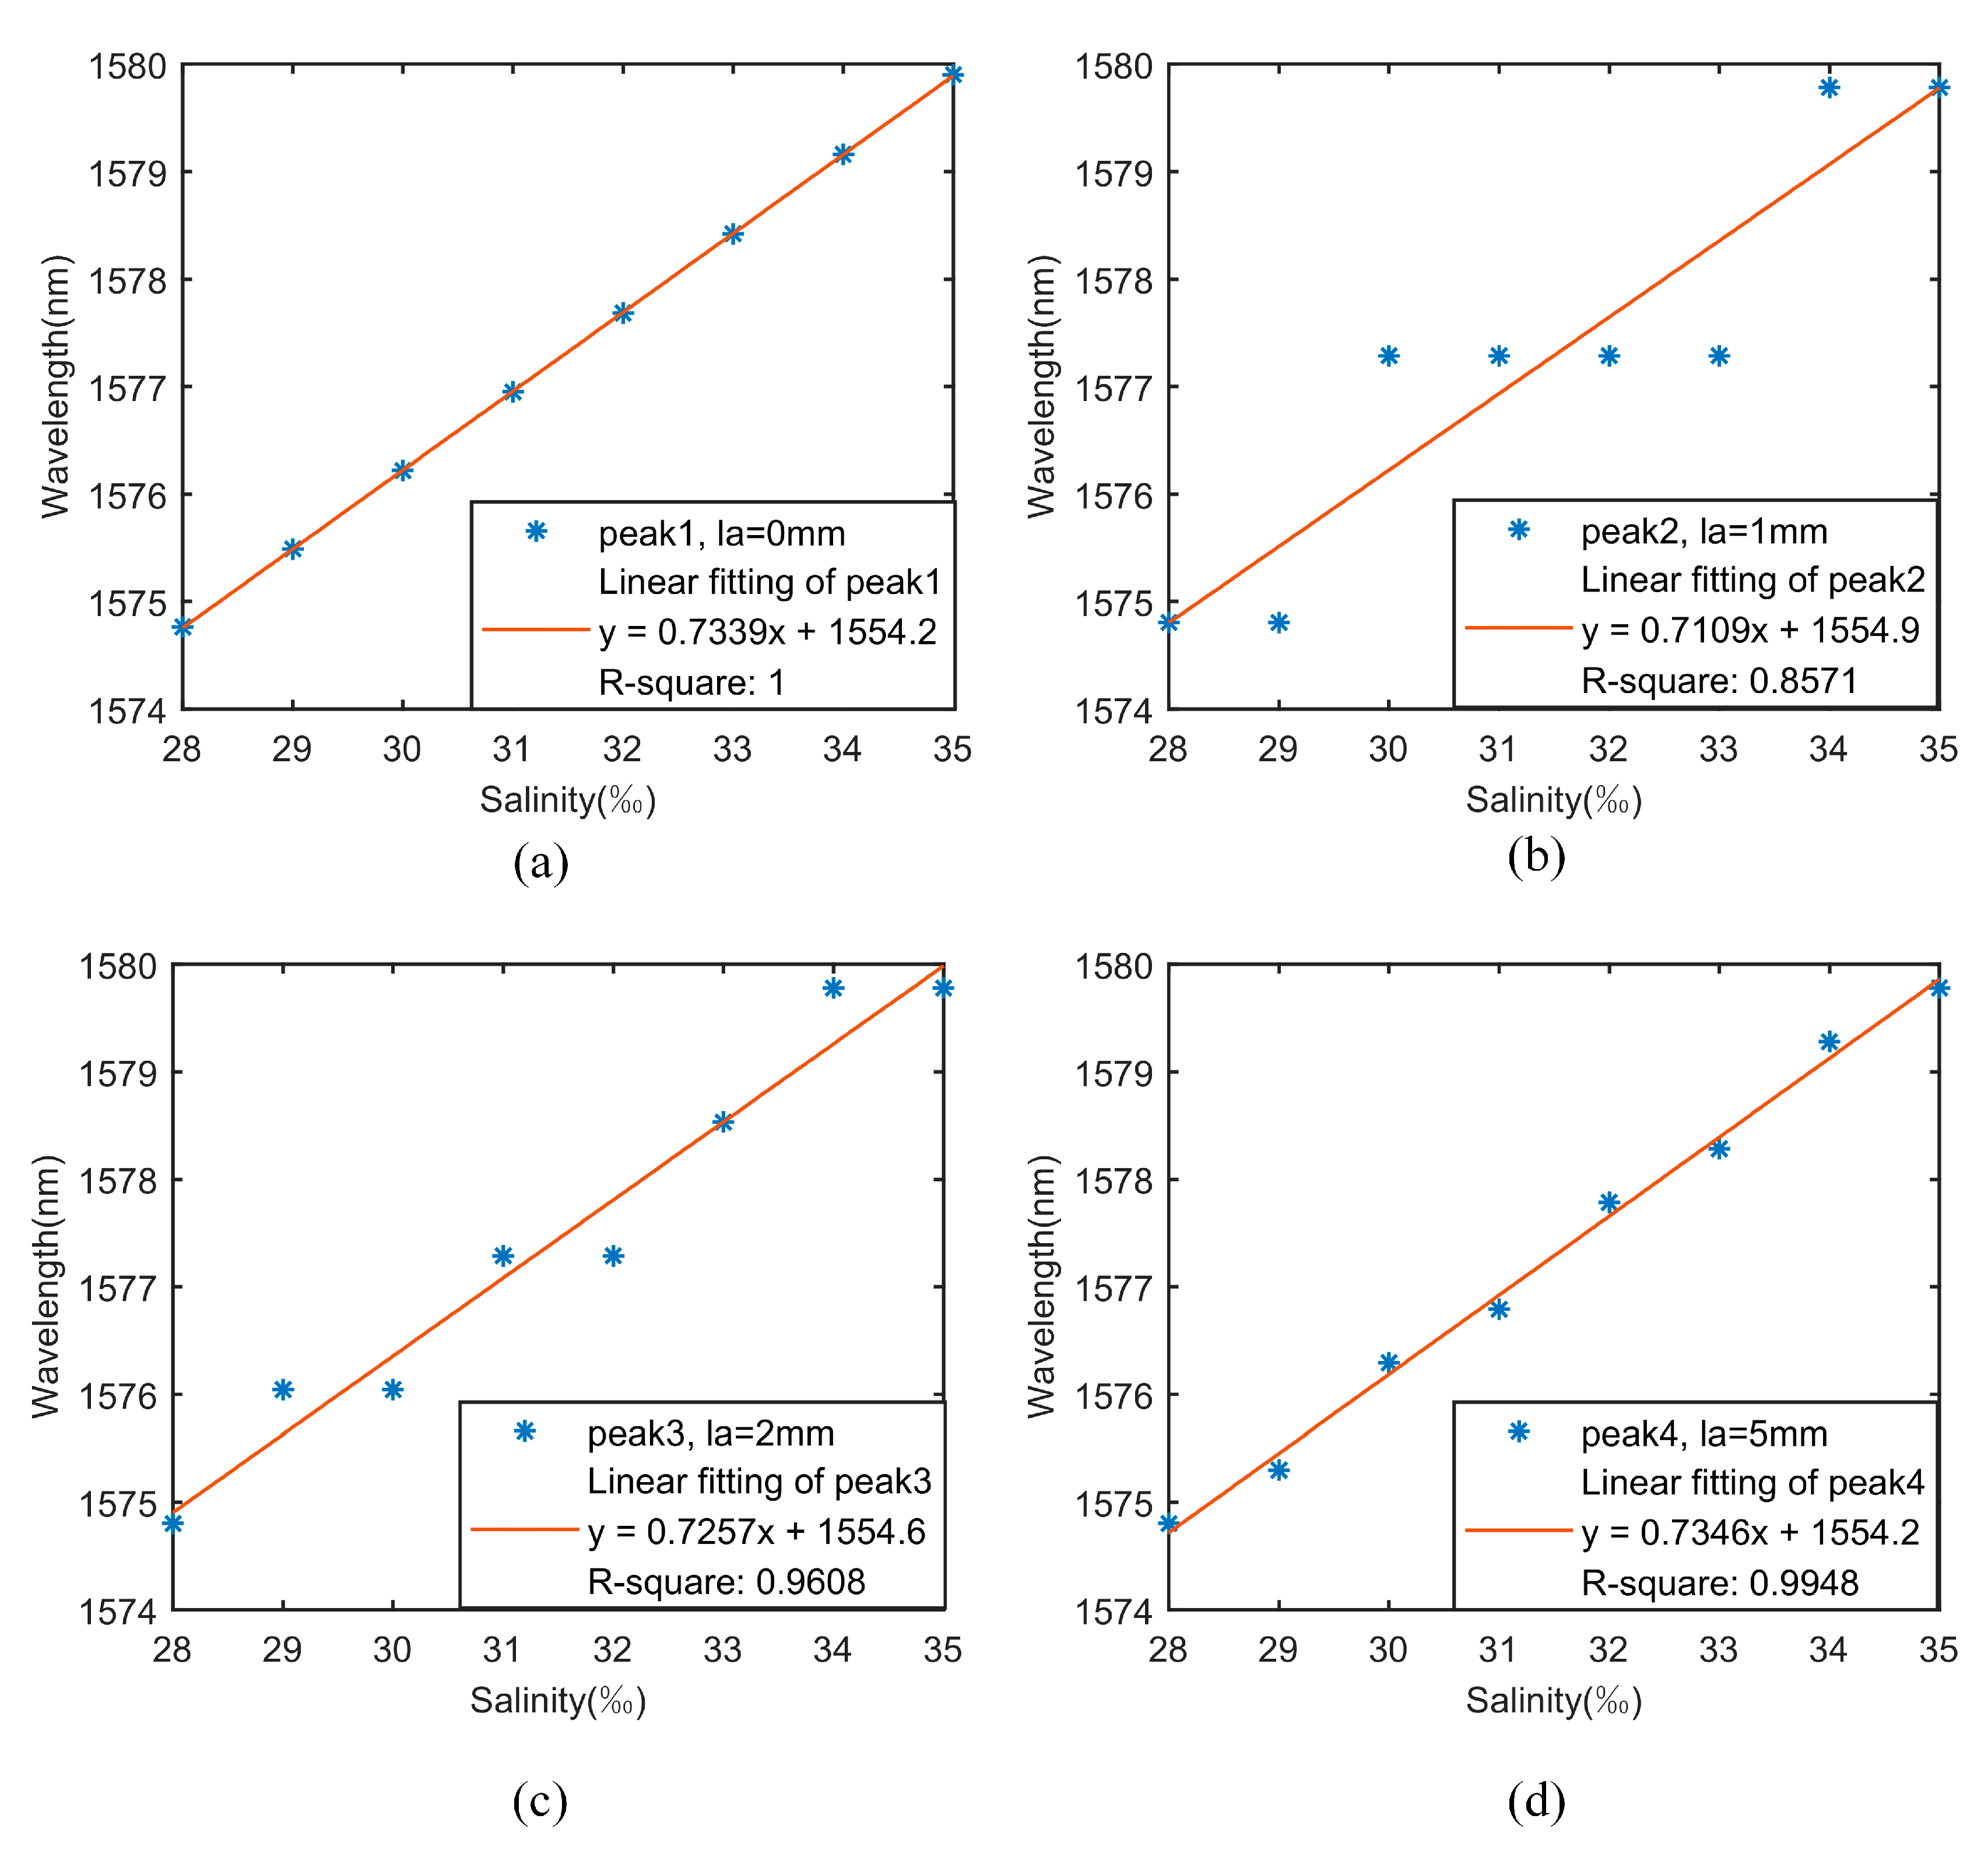
For the sake of further analyzing the effect of the OMCI interferometer arm difference on the data reading error of the salinity sensing response, we tracked and analyzed the characteristic spectra of OMCIs in salinity sensing with different arm differences. The calculation results are shown in Figure 4; when the OMCI is equal arm, there is no interference peak in its output spectrum, so there is no wavelength drift error that directly reads the wavelength offset corresponding to the extreme point. As shown in Figure 4b,c, the data reading error of the salinity sensing response is large under the small arm difference, and the fitting effect is not obvious (low R2). In addition, as can be seen from Figure 4d, the fitting result of the sensing response data is closer to the zero arm difference as the OMCI arm difference increases; that is, the error is getting smaller.
From the above analysis, if the OMCI structure designed in this paper chooses 0 arm difference or a larger arm difference, the error of signal demodulation can be reduced. In practice, however, it is more difficult to manufacture an interferometer with 0 arm difference. The output spectrum interference peaks of OMCI with large arm difference are relatively dense, which imposes higher precision reading requirements on the demodulation equipment (OSA), and it is easy to bring other environmental noise, thereby reducing the system’s signal-to-noise ratio. Therefore, in the practical salinity sensing application of OMCI, it is more appropriate to keep the OMCI arm difference within 5–30 mm.
For almost all sensor applications, improving the signal-to-noise ratio of the device is an effective means to reduce detection errors. It is found from Figure 5 that the the sensing sensitivity of OMCI structure can be improved by reducing the uniform waist radius r of OM. We tracked the specific wavelengths of peak1′, peak2′, and peak3′; the linear results are shown in Figure 6. The red line (guideline) in the picture represents the three peaks’ drift under zero arm difference. We can find that the result is closer to the guideline as the sensitivity rises. That is, when the wavelength drift with salinities is much larger than the interference peak spacing, the detection error will be greatly reduced. Therefore, if the manufacturing process conditions permit, the OM radius r should be reduced as much as possible to improve sensor performance. The length L of the OMCI waist region has little effect on sensitivity, but directly determines the output spectral characteristics (number of specific wavelengths) [30]. In addition, multiple specific wavelengths can realize multi-parameter sensing, so in practical engineering applications, device parameters should be selected reasonably according to requirements.
3. Experimental Results
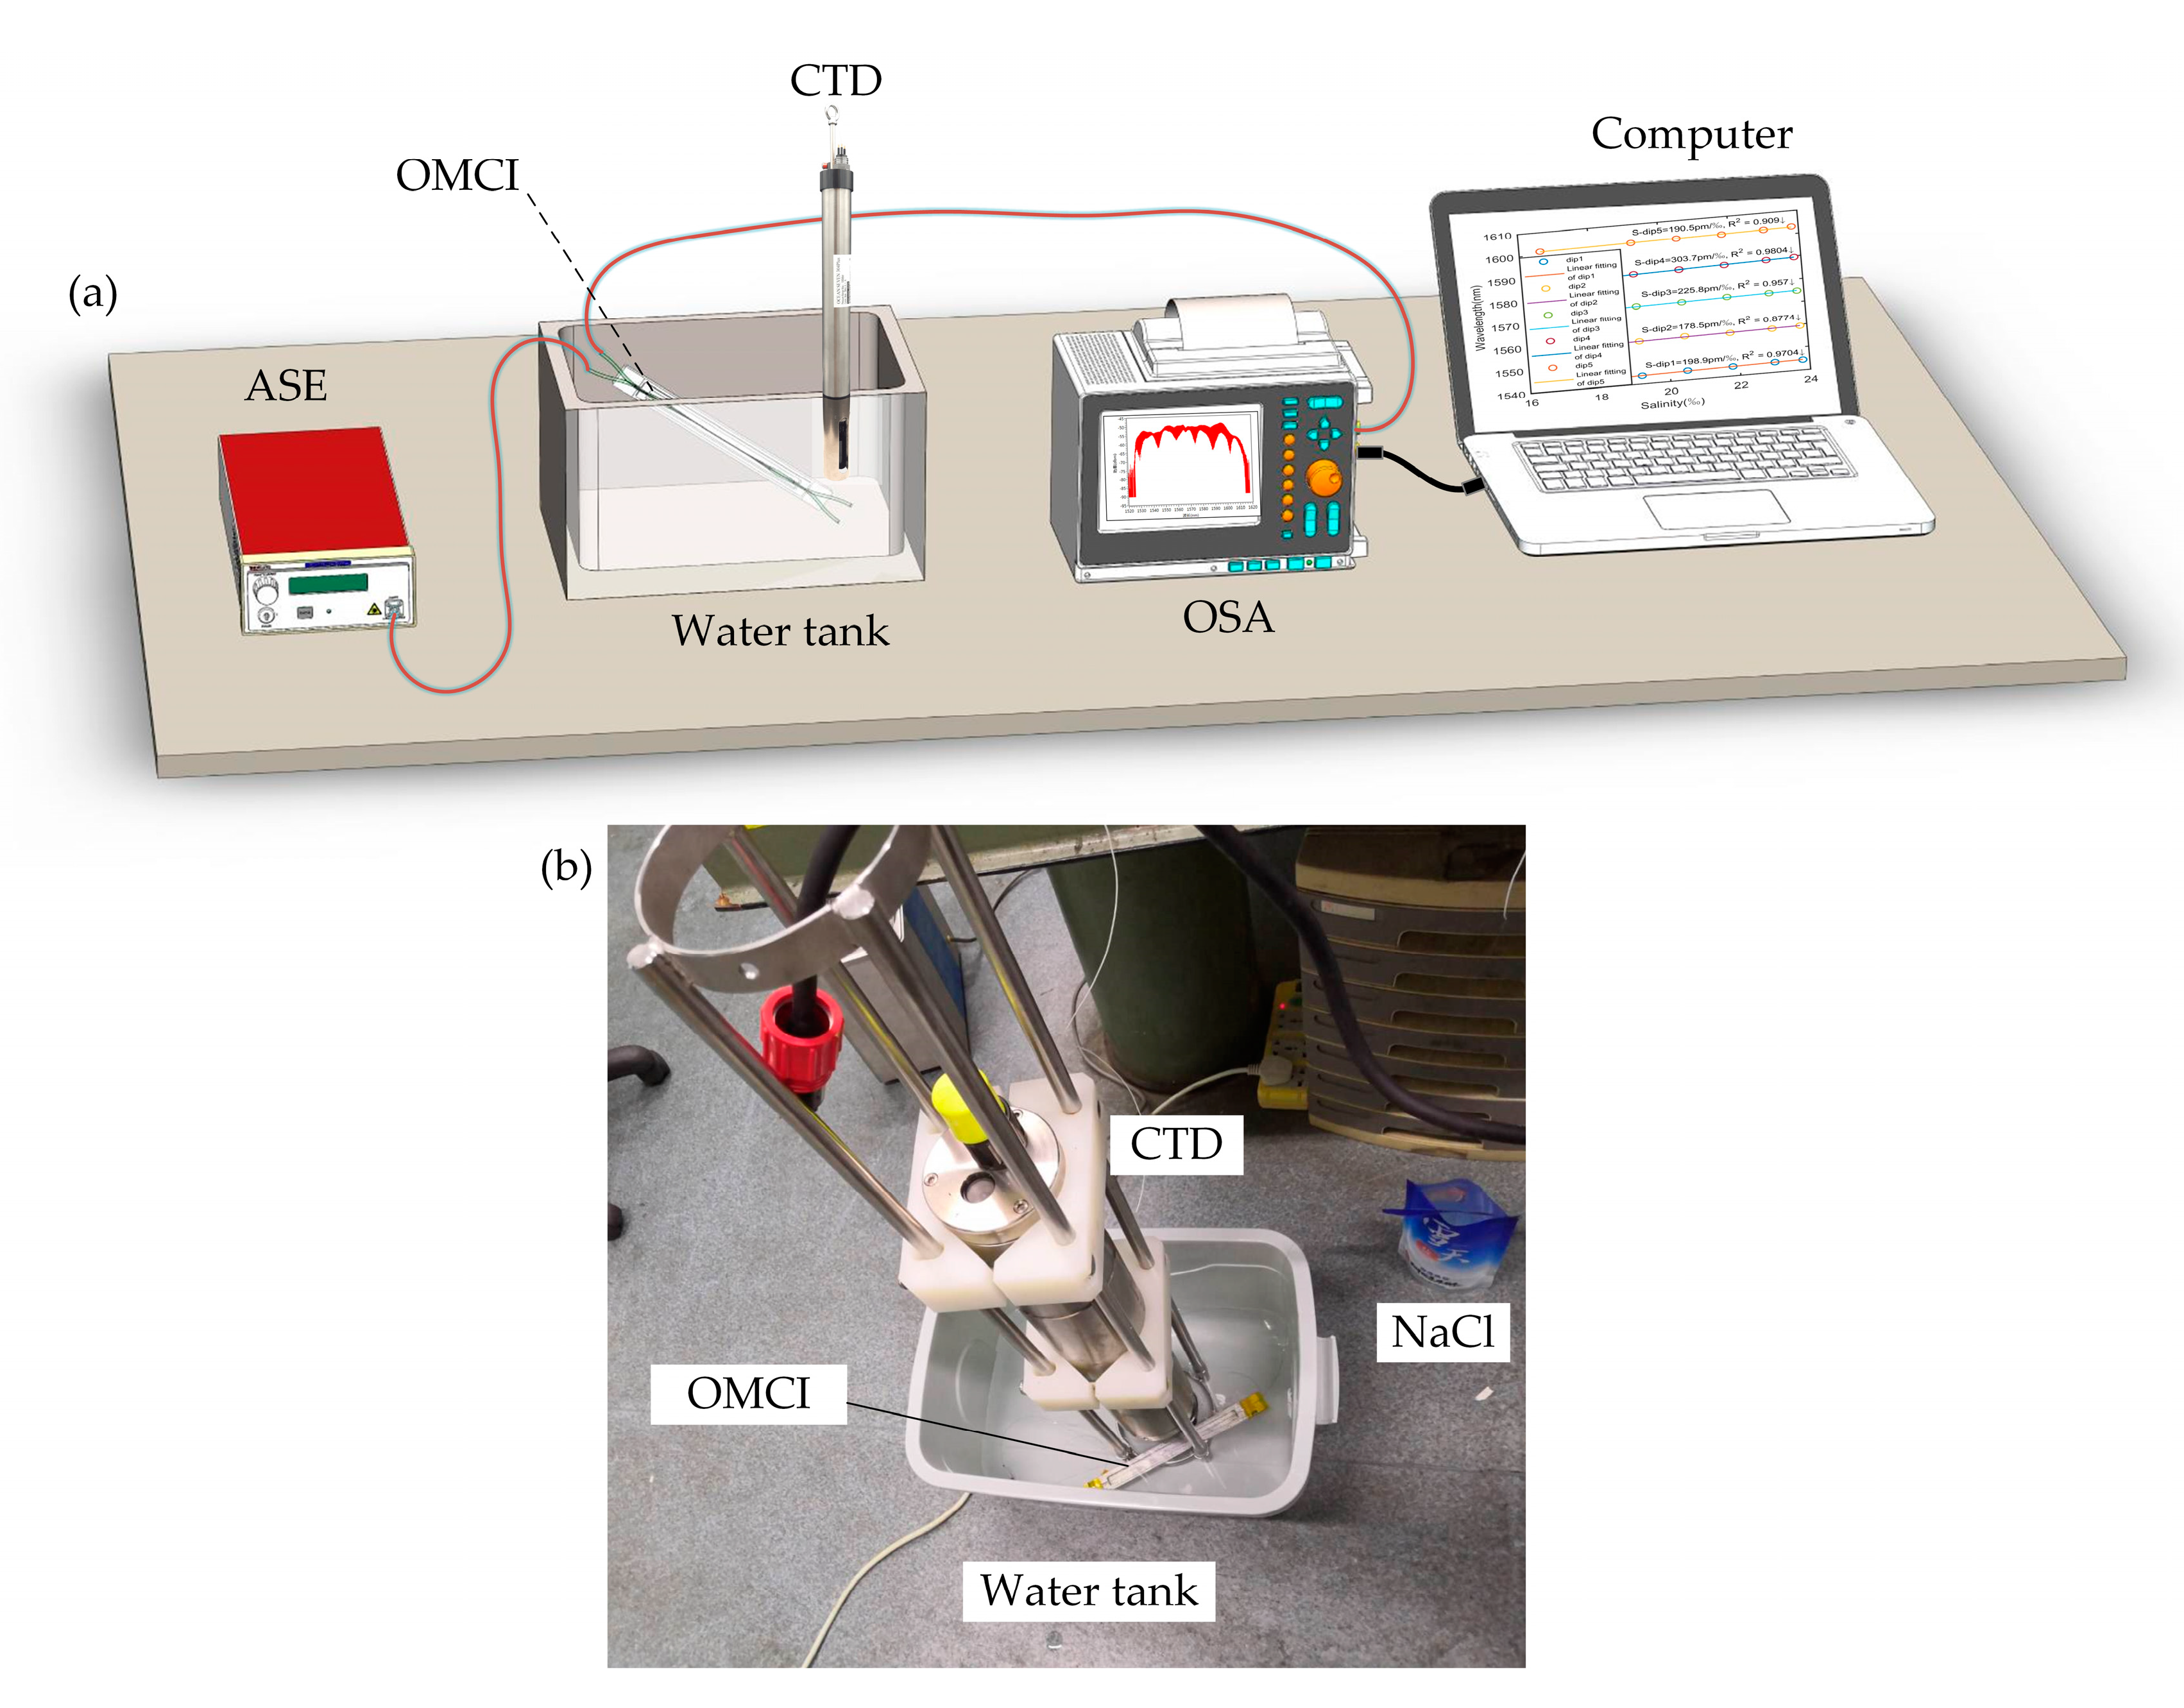
We established an experimental system in order to fully verify the foregoing theoretical analysis results and grasp the salinity sensing characteristics of OMCI. As shown in Figure 7, it consists of an ASE broadband light source (1520–1620 nm), an optical spectrum analyzer (OSA, 600–1700 nm, Q8384, ADVANTEST, resolution 0.01 nm), a CTD system (Midas, VALEPORT), a water tank, a signal processing computer, etc. Port1 of the OMCI is connected to the ASE light source, and the output signal from Port2 is sent into the OSA. The electrical CTD system is used for calibrating and comparing the salinity tests. The salinity measuring experimental setup is shown in Figure 7b.
In the sanility experiment, we first used an OMCI sample with the uniform waist length L of approximately 7 mm; the radius of the microfiber was 1.55 μm, and the lengths of the two arms of the interferometer were about L1 = 2.0 m, L2 = 2.006 m. The water tank capacity was about 4 L. The seawater samples were blended with NaCl crystals and pure water. Firstly, the salinity of the seawater samples was adjusted to 23.8‰, and the centration of the seawater samples was then changed by adding pure water with the aim of avoiding exothermic impact when the NaCl crystals were dissolved in water. About 200–300 mL of pure water was added and stirred evenly each time; at the same time, the electrical CTD system was used to monitor the seawater salinity and temperature changes (the impact of temperature has been eliminated). The data was recorded after the salinity became stable and the output spectrum no longer shifted. Figure 8a,b show that the red shifted at the sensing dips as the salinity increased from 16.6‰ to 23.8‰.
To estimate the sensitivities, we tracked five dips in output spectra, and the dip values at different salinities are shown in Figure 9. The fitting results show that the salinity sensitivity responses of OMCI in different specific wavelengths are: Sdip1 = 198.9 pm/‰, Sdip2 = 178.5 pm/‰, Sdip3 = 225.8 pm/‰. Sdip4 = 303.7 pm/‰, Sdip5 = 190.5 pm/‰. Under the condition of 0.01 nm resolution of OSA, the salinity resolution of the OMCI sample is less than 0.03‰. The minimum dynamic range of the dip3 wavelength is 13.97 nm, allowing the salinity to vary by 46.1‰. In the global sea area, the average salinity is 35‰. From the Baltic Sea with the lowest salinity to the Red Sea with the highest salinity, the range is about 7.4–40‰ [31,32]. Therefore, the dynamic range of the salinity response of the experimental sample of the OMCI sensor is applicable to the practical measurement requirements of salinity in most sea areas.
The above simulation results show that the OMCI salinity sensing under small arm difference will bring a large specific wavelength drift error; that is, the data fitting degree of the dip wavelength drift is bad. To verify this feature, we adjust the arm difference of the above OMCI sample to la = 1mm. The output spectra (partial) at different salinities are shown in Figure 10a. There is a large interference peak spacing, with a width of about 2100 pm, in the output characteristic spectrum. Figure 10b shows the salinity response sensitivity and fitting results at different dips. It can be seen from the figure that the data reading error of this sample is large (the minimum R2 is about 0.027), which is consistent with the previous theoretical analysis; that is, there is large detection error under the small arm difference. Therefore, the OMCI sample with large arm difference should be selected to make the sensor obtain more accurate sensing results. It should be noted that the signal intensity at the dips of the OMCI characteristic spectrum is weak. Because of the groundnoise, there are large data reading errors for salinity sensing detection by tracking the dips’ wavelengths and low signal-to-noise ratios. Therefore, it is more reasonable to track the peaks of the characteristic OMCI spectrum to achieve higher precision salinity sensor detection.
4. Discussion
The waist region of OMCI can respond to salinity and temperature simultaneously. There is a proven solution to eliminate the effects of cross-sensitivity; that is, tracking two sensing dips and constructing a salinity and temperature sensitivity matrix, then performing inversion calculations [12,22,24], as shown in Equation (6). In addition, the two arms of the interferometer only respond to temperature; tracking the distance of two adjacent interference peaks can realize this sensitivity to temperature. In view of this, the temperature sensitivity of the interferometer can compensate for the temperature sensitivity of the OMCI’s waist region; we have analyzed this feature in detail in previous work [31].
According to the above results, it shows excellent salinity sensing performance by reasonably setting the parameters of OMCI sensor. Comparing other salinity sensors, for example, the salinity sensors based on optical reflection have high sensitivity, but their prism systems are complicated and difficult to apply to harsh marine environments. The structure of the fiber grating salinity sensor is relatively simple, but its sensitivity is generally low. There is a sensitivity of around 50–200 pm/‰ with the SPR sensor, However, what matters is that the metal film should be coated effectively. As far as we know, most interference structures are complex although some of them can reach high sensitivity. As we all know, fiber optic sensors are immune to electromagnetic interference, but most of them are sensitive to temperature; in practical application, ways of eliminating the effects of cross-sensitivity should be considered. The sensor designed in this paper not only has high sensitivity, a compact structure to encapsulate it, and ease of manufacturing, but also has special advantages for temperature self-compensation.
5. Conclusions
In summary, a novel seawater salinity sensor based on the structure of optical microfiber coupler interferometer is proposed. The results show that the output spectra of OMCI red-shift as salinity increases, and the salinity response sensitivity reaches 303.7 pm/‰. The experiment is consistent with the theoretical analysis. In addition, we discussed the relationship between the OMCI arm difference and the wavelength drift error. When the arm difference is small, the interference peak of the output spectrum is relatively sparse. Moreover, there is an error between the dip wavelength in the output spectrum and the dip wavelength in the envelope (0 arm difference), and the smaller the arm difference, the greater the error. At the same time, when the sensitivity is low (that is, wavelength drift is much smaller than the interference peak spacing), the error is more obvious. Therefore, this paper proposes three improvement suggestions: firstly, controlling the OMCI arm difference to zero; secondly, controlling the OMCI arm difference to 5–30 mm; third, reducing the OM radius r to improve the sensor’s signal-to-noise ratio. In practical applications, the latter two schemes are easier to implement. This OMCI salinity sensor meets the needs of salinity testing in most sea areas. It provides good research ideas and alternative technical solutions for the development of practical optical fiber salinity sensors.
Author Contributions
Conceptualization, L.Z. and Y.Y.; Validation, L.Z.; Data curation, Y.T. and G.L.; Writing—original draft, L.Z.; Writing—review and editing, K.W., Y.Y., H.H. and J.Y. Project administration, Z.Z.; Supervision, Y.Y.; All authors have read and agreed to the published version of the manuscript.
Funding
This work was supported by the National Natural Science Foundation of China (Nos. 61805278, 61605249, and 61661004), Guangxi Science Foundation (Nos. 2017GXNSF and AA198227), the Equipment Pre-Research Field Foundation (61404140304), the China Postdoctoral Science Foundation (2018M633704) and Innovation Project of Guangxi Graduate Education (YCSW2020021)
Acknowledgments
The authors would like to thank the support of the laboratory and university.
Conflicts of Interest
The authors declare no conflict of interest.
References
- Fofonoff, N.P. Physical properties of seawater: A new salinity scale and equation of state for seawater. J. Geophys. Res. 1985, 90, 3332. [Google Scholar] [CrossRef]
- Gentleman, D.J.; Booksh, K.S. Determining salinity using a multimode fiber optic surface plasmon resonance dip-probe. Talanta 2006, 68, 504–515. [Google Scholar] [CrossRef] [PubMed]
- Nathan, A.J.; Scobell, A. Salinity: Environment-Plants-Molecules; Springer: Berlin, Germany, 2012; Volume 91, ISBN 9788578110796. [Google Scholar]
- Durack, P.J.; Wijffels, S.E.; Matear, R.J. Ocean salinities reveal strong global water cycle intensification during 1950 to 2000. Science 2012, 336, 455–458. [Google Scholar] [CrossRef] [Green Version]
- Díaz-Herrera, N.; Esteban, O.; Navarrete, M.C.; Le Haitre, M.; Gonzalez-Cano, A. In situ salinity measurements in seawater with a fibre-optic probe. Meas. Sci. Technol. 2006, 17, 2227–2232. [Google Scholar] [CrossRef] [Green Version]
- Liao, Y.; Wang, J.; Yang, H.; Wang, X.; Wang, S. Salinity sensing based on microfiber knot resonator. Sens. Actuators A Phys. 2015, 233, 22–25. [Google Scholar] [CrossRef]
- Cox, R.A.; Culkin, F.; Riley, J.P. The electrical conductivity/chlorinity relationship in natural sea water. Deep. Res. Oceanogr. Abstr. 1967, 14, 203–220. [Google Scholar] [CrossRef]
- Qian, Y.; Zhao, Y.; Wu, Q.L.; Yang, Y. Review of salinity measurement technology based on optical fiber sensor. Sens. Actuators B Chem. 2018, 260, 86–105. [Google Scholar] [CrossRef]
- Huang, H.; Yu, Y.; Zhou, L.; Tao, Y.; Yang, J.; Zhang, Z. Whispering gallery modes in a microsphere attached to a side-polished fiber and their application for Magnetic field sensing. Opt. Commun. 2020, 478, 126366. [Google Scholar] [CrossRef]
- Huang, H.; Zhang, Z.; Yu, Y.; Zhou, L.; Tao, Y.; Li, G. A Highly Magnetic Field Sensitive Photonic Crystal. Sensors 2020, 20, 5193. [Google Scholar] [CrossRef]
- Yang, L.; Luo, J.; Xu, Y.; Zhang, Z.; Dong, Z. A Distributed dual consensus admm based on partition for dc-dopf with carbon emission trading. IEEE Trans. Ind. Inform. 2020, 16, 1858–1872. [Google Scholar] [CrossRef]
- Hou, Y.; Wang, J.; Wang, X.; Liao, Y.; Yang, L.; Cai, E.; Wang, S. Simultaneous Measurement of Pressure and Temperature in Seawater with PDMS Sealed Microfiber Mach-Zehnder Interferometer. J. Lightwave Technol. 2020. [Google Scholar] [CrossRef]
- Yang, H.Z.; Qiao, X.G.; Lim, K.S.; Harun, S.W.; Chong, W.Y.; Islam, M.R.; Ahmad, H. Optical fiber sensing of salinity and liquid level. IEEE Photonics Technol. Lett. 2014, 26, 1742–1745. [Google Scholar] [CrossRef]
- Rahman, H.A.; Harun, S.W.; Yasin, M.; Ahmad, H. Fiber-optic salinity sensor using fiber-optic displacement measurement with flat and concave mirror. IEEE J. Sel. Top. Quantum Electron. 2012, 18, 1529–1533. [Google Scholar] [CrossRef]
- Cong, J.; Zhang, X.; Chen, K.; Xu, J. Fiber optic Bragg grating sensor based on hydrogels for measuring salinity. Sens. Actuators, B Chem. 2002, 87, 487–490. [Google Scholar] [CrossRef]
- Men, L.; Lu, P.; Chen, Q. A multiplexed fiber Bragg grating sensor for simultaneous salinity and temperature measurement. J. Appl. Phys. 2008, 103, 053107. [Google Scholar] [CrossRef]
- Wang, Y.-J.; Dai, X.; Zhao, Q.; Li, F.; Gao, X.; Bo, B.-X. Based on fiber grating the high sensitivity all optical fiber CTD. In Proceedings of the OFS2012 22nd International Conference on Optical Fiber Sensors, Beijing, China, 14–19 October 2012; Volume 8421. [Google Scholar]
- Sharma, A.K.; Mohr, G.J. On the application of different bimetallic alloy nanoparticle combinations in fiber optic surface plasmon resonance salinity sensor and its performance optimization against thermal effects. J. Nanosci. Nanotechnol. 2010, 10, 3145–3154. [Google Scholar] [CrossRef]
- Jaddoa, M.F.; Jasim, A.A.; Razak, M.Z.A.; Harun, S.W.; Ahmad, H. Highly responsive NaCl detector based on inline microfiber Mach-Zehnder interferometer. Sens. Actuators A Phys. 2016, 237, 56–61. [Google Scholar] [CrossRef]
- Wang, X.; Wang, J.; Wang, S.S.; Liao, Y.P. Fiber-Optic Salinity Sensing with a Panda-Microfiber-Based Multimode Interferometer. J. Lightwave Technol. 2017, 35, 5086–5091. [Google Scholar] [CrossRef]
- Lou, J.; Tong, L.; Ye, Z. Modeling of silica nanowires for optical sensing. Opt. Express 2005, 13, 2135. [Google Scholar] [CrossRef]
- Wang, S.; Yang, H.; Liao, Y.; Wang, X.; Wang, J. High-Sensitivity Salinity and Temperature Sensing in Seawater Based on a Microfiber Directional Coupler. IEEE Photonics J. 2016, 8. [Google Scholar] [CrossRef]
- Wang, S.; Liao, Y.; Yang, H.; Wang, X.; Wang, J. Modeling seawater salinity and temperature sensing based on directional coupler assembled by polyimide-coated micro/nanofibers. Appl. Opt. 2015, 54, 10283. [Google Scholar] [CrossRef] [PubMed]
- Yu, Y.; Bian, Q.; Lu, Y.; Zhang, X.; Yang, J.; Liang, L. High Sensitivity All Optical Fiber Conductivity- Temperature-Depth (CTD) Sensing Based on an Optical Microfiber Coupler (OMC). J. Lightwave Technol. 2019, 37, 2739–2747. [Google Scholar] [CrossRef]
- Cao, L.; Yu, Y.; Xiao, M.; Yang, J. High sensitivity conductivity-temperature-depth sensing based on an optical microfiber coupler combined fiber loop. Chin. Opt. Lett. 2020, 18, 011202. [Google Scholar] [CrossRef]
- Yu, Y.; Bian, Q.; Zhang, N.; Lu, Y.; Zhang, X.; Yang, J. Investigation on an all-optical intensity modulator based on an optical microfiber coupler. Chin. Opt. Lett. 2018, 16, 040605. [Google Scholar]
- Yu, Y.; Zhang, X.; Song, Z.; Wang, J.; Meng, Z. Precise control of the optical microfiber tapering process based on monitoring of intermodal interference. Appl. Opt. 2014, 53, 8222. [Google Scholar] [CrossRef]
- Birks, T.A.; Li, Y.W. The Shape of Fiber Tapers. J. Lightwave Technol. 1992, 10, 432–438. [Google Scholar] [CrossRef]
- Quan, X.; Fry, E.S. Empirical equation for the index of refraction of seawater. Appl. Opt. 1995, 34, 3477. [Google Scholar] [CrossRef]
- Zhou, L.; Yu, Y.; Cao, L.; Huang, H.; Tao, Y.; Zhang, Z.; Wang, J.; Yang, J.; Zhang, Z. Fabrication and characterization of seawater temperature sensor with self-calibration based on optical microfiber coupler interferometer. Appl. Sci. 2020, 10, 6018. [Google Scholar] [CrossRef]
- Meier, H.E.M.; Kauker, F. Sensitivity of the Baltic Sea salinity to the freshwater supply. Clim. Res. 2003, 24, 231–242. [Google Scholar] [CrossRef]
- Beal, L.M.; Ffield, A.; Gordon, A.L. Spreading of Red Sea overflow waters in the Indian Ocean. J. Geophys. Res. Ocean. 2000, 105, 8549–8564. [Google Scholar] [CrossRef]
Figure 1.
(a) Schematic of OMCI composition; it is constructed by connecting two faraday rotating mirrors to port3 and port4 of the OMC, respectively, the amplified spontaneous emission (ASE) broadband light source injecting to port1 and monitoring the signal from port2 by using the optical spectrum analyze (OSA). (b) Microscopic image of the OMC waist region.

Figure 2.
The simulation output spectra with salinities for OMCI arm difference (a) la = 0 mm, (b) la = 1 mm, (c) la = 2 mm, and (d) la = 5 mm.
Figure 2.
The simulation output spectra with salinities for OMCI arm difference (a) la = 0 mm, (b) la = 1 mm, (c) la = 2 mm, and (d) la = 5 mm.

Figure 3.
Details of the output spectra with salinity (a) at peak1 with arm difference la = 0 mm, and (b) at peak2 with arm difference la = 3 mm.
Figure 3.
Details of the output spectra with salinity (a) at peak1 with arm difference la = 0 mm, and (b) at peak2 with arm difference la = 3 mm.

Figure 4.
The fitting lines of interference peak wavelength shift with salinities under the arm difference (a) la = 0 mm, (b) la = 1 mm, (c) la = 2 mm, and (d) la = 5 mm.
Figure 4.
The fitting lines of interference peak wavelength shift with salinities under the arm difference (a) la = 0 mm, (b) la = 1 mm, (c) la = 2 mm, and (d) la = 5 mm.

Figure 5.
The results of simulation output spectra with OMCI waist length of 2 mm, arm difference of 3 mm and OM radius of 1, 2, and 3 μm, respectively, for the salinity range of 28–35‰.
Figure 5.
The results of simulation output spectra with OMCI waist length of 2 mm, arm difference of 3 mm and OM radius of 1, 2, and 3 μm, respectively, for the salinity range of 28–35‰.

Figure 6.
Linear fitting result of peaks. The red lines represent the peak wavelengths’ shift under an arm difference of zero; (a) linear fitting of peak1′, (b) linear fitting of peak2′ and (c) linear fitting of peak3′.
Figure 6.
Linear fitting result of peaks. The red lines represent the peak wavelengths’ shift under an arm difference of zero; (a) linear fitting of peak1′, (b) linear fitting of peak2′ and (c) linear fitting of peak3′.

Figure 7.
(a) The schematic diagram of the experimental system, and (b) the salinity measuring experimental setup.
Figure 7.
(a) The schematic diagram of the experimental system, and (b) the salinity measuring experimental setup.

Figure 8.
(a) The output spectra at different salinities with L = 7 mm, r = 1.55, la = 6 mm. (b) Detail of output spectra near dip3.
Figure 8.
(a) The output spectra at different salinities with L = 7 mm, r = 1.55, la = 6 mm. (b) Detail of output spectra near dip3.

Figure 9.
Relationships between the specific wavelengths and the salinities.

Figure 10.
After adjusting arm difference la = 1, (a) the output spectrum (partial) at different salinities, and (b) relationships between the characteristic wavelengths and the salinities.
Figure 10.
After adjusting arm difference la = 1, (a) the output spectrum (partial) at different salinities, and (b) relationships between the characteristic wavelengths and the salinities.

© 2020 by the authors. Licensee MDPI, Basel, Switzerland. This article is an open access article distributed under the terms and conditions of the Creative Commons Attribution (CC BY) license (http://creativecommons.org/licenses/by/4.0/).
Share and Cite
MDPI and ACS Style
Zhou, L.; Yu, Y.; Huang, H.; Tao, Y.; Wen, K.; Li, G.; Yang, J.; Zhang, Z. Salinity Sensing Characteristics Based on Optical Microfiber Coupler Interferometer. Photonics 2020, 7, 77. https://doi.org/10.3390/photonics7030077
AMA Style
Zhou L, Yu Y, Huang H, Tao Y, Wen K, Li G, Yang J, Zhang Z. Salinity Sensing Characteristics Based on Optical Microfiber Coupler Interferometer. Photonics. 2020; 7(3):77. https://doi.org/10.3390/photonics7030077
Chicago/Turabian StyleZhou, Lingjun, Yang Yu, Huimin Huang, Yuyu Tao, Kui Wen, Guofeng Li, Junbo Yang, and Zhenrong Zhang. 2020. "Salinity Sensing Characteristics Based on Optical Microfiber Coupler Interferometer" Photonics 7, no. 3: 77. https://doi.org/10.3390/photonics7030077
Note that from the first issue of 2016, this journal uses article numbers instead of page numbers. See further details here.