Roadmap on Universal Photonic Biosensors for Real-Time Detection of Emerging Pathogens
by
 , ,
, ,
Morgan G. Blevins
1,† ,
,
Alvaro Fernandez-Galiana
2,†,
Milo J. Hooper
2,† and
Svetlana V. Boriskina
2,*,† 1
Department of Aeronautics and Astronautics, Massachusetts Institute of Technology, Cambridge, MA 02139, USA
2
Department of Mechanical Engineering, Massachusetts Institute of Technology, Cambridge, MA 02139, USA
*
Author to whom correspondence should be addressed.
†
These authors contributed equally to this work.
Photonics 2021, 8(8), 342; https://doi.org/10.3390/photonics8080342
Submission received: 13 July 2021
/
Revised: 11 August 2021
/
Accepted: 16 August 2021
/
Published: 20 August 2021
(This article belongs to the Special Issue Integrated Optics and Devices)
Abstract
:The COVID-19 pandemic has made it abundantly clear that the state-of-the-art biosensors may not be adequate for providing a tool for rapid mass testing and population screening in response to newly emerging pathogens. The main limitations of the conventional techniques are their dependency on virus-specific receptors and reagents that need to be custom-developed for each recently-emerged pathogen, the time required for this development as well as for sample preparation and detection, the need for biological amplification, which can increase false positive outcomes, and the cost and size of the necessary equipment. Thus, new platform technologies that can be readily modified as soon as new pathogens are detected, sequenced, and characterized are needed to enable rapid deployment and mass distribution of biosensors. This need can be addressed by the development of adaptive, multiplexed, and affordable sensing technologies that can avoid the conventional biological amplification step, make use of the optical and/or electrical signal amplification, and shorten both the preliminary development and the point-of-care testing time frames. We provide a comparative review of the existing and emergent photonic biosensing techniques by matching them to the above criteria and capabilities of preventing the spread of the next global pandemic.
1. Introduction
To achieve both selectivity and sensitivity of detection, bio(chemical) sensors typically require a target recognition element that has a strong affinity with the molecular target analyte in the tested sample, a transducer that generates a signal based on the presence of an analyte, which can be detected and processed, and an amplifier that increases the signal level, thus decreasing the minimum amount of target molecules that can be reliably detected. Biosensors with photonic transducers generate optical signals, which carry the information on either the presence or absence of the target analyte in the biological sample. These optical signals can be generated as a result of linear and/or non-linear light–matter interactions, including effective refractive index changes, increased light absorption, fluorescence, and Raman or Brillouin scattering. Small size, weak non-linear response, and low refractive index values of biological molecules of interest severely limit the intensity of any optical signal they can generate. Detection becomes even more challenging when only a few copies of these molecules are present in the tested sample, which is often the case in the early disease diagnostic efforts.
To address these challenges, various transducers and signal amplification schemes have been developed and optimized in the past decades. Despite many specific device realizations, descriptions of which can be found in recent review articles [1,2,3,4,5], the unique mechanisms of the observable optical signal generation include: (i) local changes to the light wave propagation and dissipation caused by the capture of the target molecules (Figure 1a), (ii) native non-linear signatures of target molecules revealed by optical excitation (Figure 1b), and (iii) target-activated release of optical labels that are the actual sources of the observable optical signals (Figure 1c). The affinity-type sensors shown in Figure 1a evaluate selective target capture events and, while they can be used in the label-free format, require development of target-specific receptors to achieve selectivity [5,6,7]. The detection of newly-emerged or mutated viral strains requires the development of new receptors to maintain specificity.
In contrast, spectroscopic label-free detection techniques, schematically illustrated in Figure 1b, enable reading the native optical signature of the target molecules, which do not necessarily need to be selectively captured by the sensor surfaces [8]. However, nonlinear light–matter interactions that cause the generation of native optical fingerprints of target biomolecules are weak and often require optical or plasmonic amplification [9,10,11,12].
Finally, molecular recognition events that yield selectivity to the reporter-release biosensors are often similar to those used in the affinity-type sensors, with the observable signals being produced when optically-bright reporters are released during the recognition process and start generating optical signals (most often, fluorescence or visible color changes). This mechanism is illustrated in Figure 1c with a specific example of the reverse transcription polymerase chain reaction (RT-PCR), currently considered the gold standard for SARS-CoV-2 detection [13,14,15].
All the above sensing approaches often rely on some signal amplification mechanisms that can help to reduce the limit of detection (LOD) and make them suitable for real-life applications in the field of medical diagnostics. As we will discuss in detail below, both the affinity-type and the spectroscopic detection approaches typically make use of the optical signal amplification techniques, based on the photonic density of states engineering to enhance both linear and nonlinear light–matter interactions. The use of labels (e.g., fluorophores or secondary receptors captured by the target molecules in the sandwich sensor format) can further increase the affinity detector sensitivity [16] but also increases its cost and complexity of preparation and testing procedures. However, in the case of low target molecule densities and high noise background, the sensor LOD may still be too high to efficiently reduce the false-negative detection rate. To address this challenge, spectroscopic sensors often use digital signal pre- and post-processing techniques as the means of signal enhancement [17,18]. Affinity-type sensors also increasingly employ the emerging machine learning tools for the digital signal amplification [16,19,20].
On the other hand, most successful commercial techniques, such as the RT-PCR method, combine the reporter-release approach with the biological signal amplification, where the small amount of target molecules is dramatically increased by their chain-replication [13,14,15,21]. In particular, the RT-PCR method involves multiple repeating cycles of DNA denaturation, followed by hybridization with appropriate primers and extension by polymerase (Figure 1c). This biological amplification decreases the LOD but increases the sensor complexity, detection time, and probability of false positive outcomes [22,23]. Furthermore, multiple required temperature-changing cycles increase the detection time and require precise temperature control instruments. The isothermal biological amplification techniques, on the other hand, often require multiple enzymes or complex primers.
Recently, a new biological recognition and amplification mechanism has been identified and is increasingly utilized in medical research and diagnostics. It is based on using the enzymes capable of hydrolyzing phosphodiester bonds that link nucleotides in DNA/RNA chains, such as deoxyribonuclease (DNase) [24] or Clustered Regularly Interspaced Short Palindromic Repeats-associated complexes (CRISPR-Cas) [25,26]. In particular, CRISPR-Cas systems are RNA-guided adaptive immune systems that protect prokaryotes from invading nucleic acids. They provide excellent biological selectivity as they may be selectively activated by the target RNA, which binds to the CRISPS complex and induces its conformational change. Some of these complexes, once activated, cleave both target RNA and any other RNA or single-stranded DNA present in the sample, thus providing a strong biological amplification mechanism that can significantly reduce the sensor LOD [25,27]. We believe that the use of cleavage-type detection mechanism is very promising for the development of new types of biosensors for the rapid detection of new pathogens and early disease diagnostics, especially if combined judicially with the previously developed optical amplification, digital amplification, and multiplexed detection techniques. In the following sections, we discuss the advantages and disadvantages of the above optical signal generation and signal amplifications mechanisms and chart the roadmap for combining them with each other and the emerging cleavage-based techniques of biological target recognition and amplification.
2. Affinity-Type Biosensors with Optical Signal Amplification
Affinity-type refractometric optical sensors use target-specific receptors anchored to their surface to capture biological molecules. The presence of captured molecules changes the effective refractive index (RI) of the optical transducers, which can be integrated waveguides, optical fibers, photonic crystal cavities, microresonators, metasurfaces, etc. [28]. The role of the transducer is not only to produce an optical signal but also to amplify it to the level where it can be distinguished from the noise level. The observable dielectric constant of a medium above the transducer is a function of the concentration of the target biomolecule [29,30]; thus, signal amplification is required because nanoscale objects, such as biological molecules, are often present in small concentrations and do not cause a strong detectable perturbation of the optical field.
The linear response of a molecule to the external electric field is characterized by its complex polarizability , which, for objects much smaller than the excitation field wavelength, can be evaluated from the Clausius–Mossotti equation in the dipole approximation: and scales with the object volume (i.e., third power of its radius) [29,30]. Here, is the relative dielectric permittivity of the molecule (typically about 2.25 for biological molecules such as DNA and RNA); a is a molecule radius (typically measuring few to hundreds of nanometers); and is the dielectric permittivity of the host medium (e.g., for air and for water in the visible frequency range). The scattering cross-section of a molecule scales with the square of its polarizability, (i.e., with the sixth power of its radius), making direct microscopic observations of small molecules by measuring the intensity of the scattered optical fields impossible.
On the other hand, the scattered field amplitude scales linearly with the molecule polarizability, and an absorption cross-section of a molecule scales linearly with the imaginary part of its polarizability (). With this in mind, a majority of sensitive photonic biosensing schemes either measure the absorption-mediated changes in the signal intensity or make use of the optical interference effects by superimposing the reference excitation signal with the phase-shifted scattered signal and measuring the associated changes in the system optical response.
The simplest interference-type photonic biosensor is a planar vertically interrogated Fabry–Perot interferometer (Figure 2a), which creates an interference pattern by combining the phase-shifted light reflected from different surfaces within the structure [31,32]. The spectral shifts and the periodicity changes of the interferometric pattern caused by the target molecules adsorption are evaluated during the detection process. Materials permeable to the target molecules (e.g., porous silicon or polymers) allow for a larger optical phase accumulation and thus exhibit more pronounced optical spectral shifts, but only if the concentration of target molecules or the volume of the analyte is large enough (or both), allowing for the capture of many molecules. This is not a situation observed in the early decrease diagnostics efforts, where only limited-volume samples containing femtomolar (fM) or sub-fM concentrations of target molecules are available for the analysis.
The detection of small amounts of surface-adsorbed molecules can be achieved via ellipsometric techniques, when not only the scattered light intensity but also the phase is measured (Figure 2b) [33,34,35]. However, this detection technique requires bulky and expensive ellipsometry equipment. It may also not provide a reliable detection mechanism in the case when only a few copies of target molecules are present in the sample, which greatly reduces the sensor surface coverage.
However, since molecule polarization depends not only on its polarizability but also on the strength of the excitation electric field, optical amplification techniques can improve the detection sensitivity. The optical amplification step is typically achieved in photonic biosensors via the transducer’s optical design [28]. The local electric field intensity can be increased by engineering the photonic transducer to trap light, localizing it to a micro- or nano-scale volume, and recycling the optical energy in the form of either a volumetric resonant mode or a surface polariton mode. Light trapping and guiding in high-contrast dielectric or metal structures enables both sensing volume miniaturization and optical amplification [36,37,38]. Guided-mode sensors can be realized with structures, such as metal–dielectric interfaces, supporting surface plasmon polariton modes or integrated Si waveguides. These sensing structures can be implemented in prism configurations or in waveguides, such as optical fibers (Figure 2c). Optical fiber-based sensors have been implemented for a variety of applications, including antibody [39], bacteria [40], and environmental sensing [41,42]. Fiber optic sensors offer many potential advantages over conventional planar structures, including their simplicity, low cost, and potential for multiplexing [43]. However, additional optical signal amplification is often required, which can be achieved via fiber-integrated structures supporting surface plasmon modes.
These on-chip sensors can also make use of the interferometric techniques, e.g., in the integrated Mach–Zehnder interferometer configuration shown in Figure 2d [44,45].
Even larger optical energy accumulation and electric field intensity enhancement is enabled by light trapping in optical microcavities, such as whispering gallery mode (WGM) disk, ring, toroidal, or spherical resonators [46,47,48,49,50] or photonic-crystal micro- and nano-cavities (Figure 2e) [51,52,53]. Photonic crystals (PhCs) are structures made of materials with differing dielectric constants in periodic arrangements [54]. PhCs can be designed to exhibit photonic band gaps with band edge and defect modes, whose spectral positions are sensitive to environmental stimulus, such as the 1-dimension PhC structure shown in Figure 2e, in which the middle defect layer acts as an optical microcavity [51,55]. PhC structures with resonant features can be constructed in 1, 2, and 3-dimensional systems and are an emerging player in developing low-cost point-of-care (POC) biosensors [51].
PhC cavities and other optical microcavity structures exhibit sharp resonant features in their transmission spectra as a result of the light interference between the reference signal propagating through the bus waveguide and the light trapped in the resonator optical mode [56]. These resonant spectral features are characterized by high-quality (Q) factors, defined as the ratio of the resonant frequency to resonance bandwidth [57,58], and shift in response to the resonator surface chemistry changes [46,56], providing a sensitive optical transduction mechanism.
The of biomolecules by a microcavity-type biosensor operating at wavelength is defined as a ratio of the sensor resolution to the sensitivity of the biomolecular detection : ,, where is the density of attached molecules on the sensor surface, is the molecule polarizability, and are the refractive indices of the resonator material and the host medium, respectively, (, ), and S is the sensitivity of the resonator mode to the bulk RI changes [59,60]. The sensor resolution is defined as three standard deviations of the sensor measurement caused by the limited device spectral resolution () as well as by the amplitude () and thermal noise level () [59]. For the optical microcavity sensors, the standard deviation caused by the amplitude noise depends on the mode linewidth as , where is the signal-to-noise ratio of the system, and is the full width at half maximum (FWHM) of the ring resonator mode amplitude, which is related to the mode Q-factor as .
To decrease LOD, either the sensor sensitivity or the sensor resolution need to be increased, or ideally, both. The increase in the resolution can be achieved by engineering high-Q (i.e., small FWHM) resonant photonic elements. For example, in a system with temperature stabilization with fm, the sensor resolution will be limited by the mode FWHM if . For dB and a moderate spectral resolution of 1 pm ( pm), the FWHM pm becomes the dominant contribution to the sensor resolution , which is a typical situation for integrated Si microresonator-based sensors with ( pm). Microtoroidal and microsphere WGM biosensors typically demonstrate larger Q-factors and higher sensitivity than integrated planar microcavities but have not yet been adapted for the point-of-care applications due to the challenge of achieving portable system packaging and integration with microfluidics while maintaining system stability and reliability [46].
On the other hand, surface plasmon resonance (SPR) and localized surface plasmon resonance (LSPR) biosensors have been highly utilized for viral detection [61,62] despite the large FWHM values of the surface plasmon resonance modes caused by dissipative losses in metals [28,63]. It should be noted that plasmonic nanomaterials synthesized with special approaches can greatly reduce dissipative losses, as the geometric arrangement of nanoparticles determines the broadening of the plasmon resonance [64,65]. The low Q-factors of SPR and LSPR sensor modes are compensated by their high sensitivity values, stemming from the dramatically enhanced local electric field in the vicinity of the metal surfaces. Surface plasmon mode excitation can be utilized in both the affinity-type label-free sensing and for the enhancement of Raman signals in the surface-enhanced Raman scattering (SERS) techniques described in the following sections [38,65,66,67]. Finally, high sensitivity and high resolution can be simultaneously achieved in photonic-plasmonic sensors, which take advantage of hybrid integration of low-loss high-Q dielectric microresonators with metal elements supporting surface plasmon resonances [68,69,70,71,72].
All types of label-free photonic biosensors discussed above typically require either broadband sources paired with the high-resolution spectrometers or light sources whose wavelengths can be tuned fast enough to follow the kinetics of the molecule adsorption processes. Repeatable fabrication and the integration of high-Q optical microcavities is also challenging. These requirements increase the photonic sensor systems complexity and cost, often making them prohibitive for point-of-care bio-sensing applications. Some of these challenges can be overcome either in the interferometric photonic biosensors engineered to operate in the intensity readout mode or by using the diffractive-type biosensors (Figure 2f) that measure the reflected intensity changes at fixed wavelengths and angles [73,74,75,76,77,78]. The diffractive sensors illustrated in Figure 2f are 2-dimensional PhC stuctures [54]. In these configurations, only a single-frequency (or a narrow-band) light source and a photodetector are required, which eliminates the need for complicated broadband high-spectral-resolution signal processing, offering promise for the development of simple real-time point-of-care sensing systems. However, low-concentration low-volume samples containing only a few target molecules typically cannot generate strong enough changes in the diffraction grating environment to enable detectable changes in the sensor diffracted patterns.
Finally, all the label-free biosensors with optical signal amplification require chemical surface functionalization to immobilize target-specific receptors [28] and are vulnerable to non-specific binding [79,80,81]. This greatly decreases the sensor performance and reliability, as non-specific binding increases background signals and the sensor limit of detection. Although self-referencing techniques can somewhat improve the sensor performance by reducing the effect of the non-specific binding [82,83,84,85], incorporating self-referencing schemes in the sensor design increases the sensor cost and complexity. Another way to reduce the effect of non-specific binding and the LOD is by increasing the signal-to-noise ratio via adding labels that selectively bind to the target molecules, thus increasing the optical signal associated with the target capture event. Just like the surface receptors for the molecular target capture, these labels need to be custom-engineered to provide target selectivity and added to the assay together with the sample [86,87,88,89,90,91]. This further complicates the process and increases the initial development time of the sensor technology. Generally, SPR and LSPR can show real-time detection [92]; however, adding labels to reduce the LOD will increase the detection time because more time will be needed for particle diffusion [93].
SPR [94], interferometer [95], and microcavity [96] chips, as well as PhC [97,98] and fiber optic-type sensors [99], have all been integrated with microfluidic cells or other systems to create POC devices. The realization of these techniques into integrated, POC-type devices is mostly limited to research lab development, though some techniques have been commercialized [100]. Chen et al. (2020) argue that these types of integrated biosensors will act as key players in the future market of miniaturized, POC technology as their sensitivities, accuracy, and fabrication processes improve [100].
Plasmonic nanostructures, photonic crystal, and fiber optic biosensors have been developed to detect Ebola virus antigens [101], SARS-CoV-2 proteins [102], HIV [103], and other antigens [104] at femtomolar concentrations, which are low enough to enable detection without any amplification of the target molecule’s concentration. A table comparing the reported sensitivities and LODs of affinity-type photonic biosensors for detecting viral pathogens using different mechanisms of light trapping and amplification can be found in a recent review article (see Table 2 in [7]).
3. Label-Free Spectroscopic Sensors with Digital and Optical Amplification
Some of the limitations of affinity-type refractometric optical biosensors can be overcome using vibrational spectroscopic techniques, such as infrared (IR) [105,106] and Raman spectroscopy (Figure 3) [10,107]. These techniques measure the nonlinear interactions of the atoms and molecules present in the sample with incident electromagnetic radiation. The outcome is a spectral ’fingerprint’ of the sample that contains the information about its content, which is, most often, a vibrational spectrum of the biological molecule. While these direct ’fingerprinting’ methods can be combined with the use of IR-active or Raman-active labels, they typically are used to directly detect the native biological targets present in the sample [108,109]. This not only eliminates the need for multiple complex reagents, but also the physics involved in these processes are inherently faster than the ones requiring electrochemical reactions, and the sample preparation can be minimal. Furthermore, no prior knowledge of the composition of the sample is required in principle, as the target recognition step is performed digitally, by analyzing the acquired vibrational spectra. Therefore, vibration spectroscopy has the potential for fast, non-invasive, multiplexed, and reagent- and label-free detection.
In IR spectroscopy, an absorption spectrum is measured from the fraction of the incident electromagnetic radiation absorbed by the sample as a function of the wavenumber. There are two regions of particular interest for biological analysis. The first is the optical window in the near-infrared (NIR) region: ∼650–1100 nm (≈15,000–9000 cm) [110]. The spectral results in this region are particularly valuable due to the low absorption (and therefore, low false information gained) from water and hemoglobin. The second region of interest is the biofingerprint region in the mid-infrared (MIR) region: (∼900–1800 cm) [111,112]. Spectral results in this region contain information about the presence of DNA and RNA, as well as biologically relevant lipids, carbohydrates, and proteins. However, MIR spectral information often contains interference from water and CO absorption, as well as spectral overlap from cellular and pathogenic vibrational responses.
The most common technique in the MIR region is Fourier-Transform Infrared (FTIR) spectroscopy, which allows the rapid collection of broadband, high-resolution MIR/NIR spectra [113]. The sample can be probed in transmission, reflection, or by attenuated total reflection (ATR) [114]. In the latter, the sample is probed by the evanescent wave that is generated by the total internal reflection between the sample and the ATR crystal (typically diamond or ZnSe). This method requires the least sample preparation, and, oftentimes, the sample is placed onto the ATR crystal for direct measurement. Due to its simplicity in operation and compactness, the combination of FTIR with ATR sampling (ATR-FTIR) has great potential for the development of user-friendly, cost-effective, point-of-care mass screening detectors. Moreover, the minimal amount of waste generated makes this technique particularly sustainable, especially when considering large-scale deployment. ATR-FTIR has already been used to detect a variety of pathogens and diseases, such as hepatitis [115,116], dengue [117], or cancer [118], to name a few. Since NIR relies on overtones and combination bands, which are not strong absorbers, ATR is not typically used in the NIR region.
On the other hand, Raman spectroscopy offers the possibility of sample analysis [119] and exhibits higher molecular specificity and no O-H stretching interference from water. This is due to the fact that Raman active transitions are characterized by a change in polarizability of the molecule in the vibration, which is not the case for IR, where the change must be in the dipole moment. In particular, the region of interest for biological studies is ∼550–1750 cm [111]. However, the Raman signal is based on the non-linear process of inelastic scattering, which has a low efficiency and is typically orders of magnitude weaker than the linear elastic scattering process. Therefore, the spontaneous Raman signal is often masked by background fluorescence, compromising the sensitivity of the instrument.
Similar to the case of affinity-type refractometric biosensors, a primary limitation to the widespread use of spectroscopic biosensors is their limit of detection. Generally, the limit of detection of these techniques depends on the intensity of the signal generated by the interaction of the analyte and the incoming radiation and the SNR of the instrument. For IR, Beer–Lambert’s law establishes that the absorptance of an analyte at a specific band () depends on its absorptivity at that band (), the optical path length (l), and the molecular number density (n): , where and are the source and transmitted intensities, respectively, [120]. For spontaneous Raman processes, the intensity of the Raman-shifted light can be written as , where is the Raman cross-section of the analyte [121]. Thus, the performance of these detectors is concentration-dependent, which has obvious disadvantages. However, in practice, its consequences could be less harmful if there is a correlation between the viral load of a patient and their contagiousness or disease severity, which appears to be the case, for example, for SARS-CoV-2 virus [122,123].
Regarding the SNR, its value is completely dependent on the experimental setup, and a large variety of spectrometers exist with different levels of SNR, making the determination of an overall “technique limit of detection” particularly challenging. However, some studies have been done to estimate and test these limits for certain analytes and under specific conditions [124,125,126]. However, since the spectrum used for detection contains information about all the IR/Raman-active biological components in the sample, imbalances in the content of the sample caused by disease-induced metabolic changes can be detected, enhancing the overall detection performance. Nevertheless, while the individual spectra of IR absorption and Raman scattering show greater variation between different biological species than their corresponding optical spectra, they may be hard to resolve since some of the vibrational bands might be common to other compounds of the sample. Thus, the ultimate performance of vibration spectroscopy-based detectors is not only determined by the limit of detection for the molecules of the pathogen. Given the aforementioned intricacies, experimental determination remains the best approach to assess the potential of these techniques for diagnosis. Table 1 contains a non-extensive selection of experimental results highlighting the state-of-the-art performance of vibrational spectroscopy detectors.
The results presented in Table 1 show that sensitivity and specificity > 90% have been achieved in a variety of practical experiments. This performance, along with the aforementioned intrinsic advantages of these techniques, demonstrates their potential as a tool for point-of-care mass screening detection, where a reduction in sensitivity can be traded-off.
Another potential disadvantage could be a limited capability to distinguish between closely-related pathogens that exhibit similar symptomatology and metabolic changes. This is the case in Roy et al. [115], where a modest decrease in performance in the classification of Hepatitis B vs. Hepatitis C samples is observed when compared with the performance of classifying each of them separately vs. the control. However, Santos et al. [117] demonstrate outstanding classification performance even with a virus within the same family and genus (Zika and Dengue). This is an area of active investigation, and future experiments performed on larger, more heterogeneous populations could provide an answer and determine the real potential of these techniques.
While the sensitivity and specificity of spectroscopic detection methods can be increased by using the same target-specific receptors as those used in label-free affinity-type sensors, this would increase the sensor complexity, limit its use as a multiple pathogen detection platform, and may introduce additional noise from receptor-generated spectroscopic signatures. A potential alternative is to implement a two-step detection scheme where patients are first screened using fast spectroscopic techniques to identify likely positive candidates. This preliminary diagnosis could then be confirmed by a second more sensitive, slower, and resource-intensive detection method (e.g., PCR). This scheme could increase the overall number of tests and optimize the allocation of resources, which is essential during pandemics and in regions with limited resources. The advantage of less-sensitive, mass-deployable detection techniques for pandemic management has been explored in recent years [157,158]. Furthermore, chemometric techniques are often leveraged to facilitate the spectral analysis and classification [159]. Over the last several years, the combination of vibrational spectroscopy and chemometrics has been successfully demonstrated for the detection of various pathogens [160,161]. Spectroscopic techniques could also be used in combination with biological amplification for increased performance at the expense of detection time.
Finally, optical and digital amplification techniques have been successfully implemented to enhance sensitivity and decrease the LOD of spectroscopic detection techniques. For example, several stimulated Raman techniques, such as coherent anti-Stokes Raman scattering [162] or stimulated Raman scattering [163], have been developed, and the potential of Raman spectroscopy for pathogen detection has been studied and demonstrated in recent decades [119,161,164,165]. Similar to the case of affinity-type biosensors, both the Raman signal and the infrared absorption efficiency can be enhanced by the excitation of the surface plasmon polariton modes on the sensing surfaces. Since the signal scales with the product of the optical field intensities at the excitation and the Raman scattering wavelengths, plasmon-enhanced local field amplification can yield orders-of-magnitude signal enhancement. In particular, two techniques have emerged as particularly promising for bioanalysis, which are surface-enhanced Raman spectroscopy (SERS) [142,166,167,168] and tip-enhanced Raman spectroscopy (TERS) [169]. These techniques have already been proven effective for pathogen detection [165,170,171]. Overall, one of the greatest advantages of vibrational spectroscopy is its potential use for the multiplexed detection of a variety of pathogens, in combination with affinity-type optical detection techniques.
4. Cleavage-Based Sensing
Despite recent developments in the photonic biosensor techniques aimed at enhancing the optical amplification mechanisms, the techniques combining biological amplification, optical labels, and molecular cleavage techniques—exemplified by the RT-PCR method—remain the most reliable and scalable approaches to mass screening for harmful pathogens. Another recently introduced cleavage-based approach to biosensing makes use of enzymes that can cleave RNA or DNA strands (either selectively or indiscriminately) to modify the target molecules or to release optical labels. Especially interesting cleaving agents belong to the CRISPR family of DNA sequences found in the genomes of prokaryotic organisms such as bacteria [25,26,27,172,173]. CRISPR can be derived from DNA fragments of bacteriophages that had previously infected the prokaryote and are capable of detecting and destroying DNA from similar bacteriophages during subsequent infections.
CRISPR-associated (Cas) nucleases (proteins that cleave DNA) are effectively RNA-guided adaptive immune systems that protect prokaryotes from invading nucleic acids [174], with some CRISPR–Cas complexes being especially useful for biosensing application owing to their ability to achieve collateral RNA/DNA cleavage. In particular, target RNA binding induces conformational changes in these complexes, activating the agent, and then the activated CRISPR–Cas nuclease cleaves both the target RNA and any other RNA or single-stranded DNA sequences it encounters. As a result, CRISPR–Cas-mediated sensors offer several key advantages over the current cleavage-based techniques: they are capable of achieving incredibly high selectivity, potentially down to a single nucleotide; they can bypass the long wait times associated with RT-PCR thermal cycling; and they can be rapidly and easily modified to track the spread of novel viral strains. This enables rapid point-of-care diagnostic testing, with highly accurate results acquired in less than an half an hour [27,175].
The list of CRISPR-associated nucleases increasingly being explored for viral detection applications typically includes Cas12/a, Cas13, or Cas14 complexes. The better known Cas9 protein is commonly used in gene knockout due to its low quantity of cleaved base pairs and the single shot nature of its binding-cleavage interaction, as well as the fact that the cleaved site is highly proximal to the binding site [176]. However, it is sub-optimal for biosensing applications due to its inability to achieve collateral cleavage. On the other hand, the Cas12/13/14 enzymes are capable of cleaving many more base pairs, creating staggered cuts far from the site of binding. They induce significant (up to ) nonspecific collateral cleavage of nearby DNA or RNA strands in the presence of DNA or RNA containing the target sequence [27].
Though the CRISPR cleavage process itself is non-optical, collateral cleavage can serve as a transduction mechanism to produce an optical signal readout and to achieve optical signal amplification. This often takes the form of fluorophore-quencher (FQ) pairs that are separated through collateral cleavage in the presence of target viral DNA or RNA, creating a strong fluorescent signal in the presence of target viral sequences (Figure 4, left). A non-fluorescent alternative reporting mechanism following a similar principle uses FAM–biotin reporter molecules that are run on a lateral strip (Figure 4, right). In order to generate a strong enough visual output to be read with the unaided eye, amplification is often required, using either RT-PCR, RT-LAMP, or RPA to produce additional copies of viral genetic material to be cleaved.
Numerous systems have been developed that integrate optical readouts with CRISPR–Cas12a or Cas13 for the detection of SARS-CoV-2: among them are SherLOCK, CARMEN, DETECTR, and AIOD-CRISPR, discussed briefly below. To enable greater utility for point-of-care applications, several of these systems incorporate the amplification step within the sensor housing itself.
The DETECTR method combines RT-LAMP (Loop-mediated AMPlification) and CRISPR–Cas12a for a rapid, highly sensitive sensor for SARS-CoV-2 [26]. In this sensor, following the typical RT-LAMP process, the sample swab is isothermally amplified, and then undergoes a Cas12 cleavage reaction. If the target sequences are present, the makeup of the relative molecule sizes should have changed. A visual output is created when the proteins are run on a lateral strip, with FAM–biotin as a fluorescent reporter molecule. With the given amplification method, the DETECTR sensor has a limit of detection of 10 copies of target RNA per microliter of the sample, and the process takes about 30–40 min. However, the system requires substantial heating control and a multiple-stage, multiple-temperature process in order to give an output.
The AIOD-CRISPR (“all-in-one-dual CRISPR”) [177] addresses some issues that were present with DETECTR by replacing the RT-LAMP stage with an innovative method of heat activation, producing results in only 20 min. Instead of RT-LAMP, a low-cost hand warmer is used to achieve the target temperature for CRISPR activity of 37 °C. The continual amplification from the DNA polymerase allows for continuously triggered cleavage as more and more binding sites are available, increasing the fluorescent signal. Small concentrations of the target analyte are thus made visible upon blue/UV illumination; larger concentrations are visible to the unaided eye. The researchers were able to reliably detect positive results with only five copies of target RNA in a sample. Of particular note with this sensor development is the fact that the sensor detection, amplification, and readout all can occur isothermally, reducing the time to readout and the complexity of the overall sensor architecture.
An attractive feature of CRISPR-based sensors is the ability to rapidly modify the crRNA (CRISPR RNA) complexes in the biosensor to accommodate detection of even single-nucleotide mutations, allowing for both epidemiological strain tracking and rapid adjustment to test for strains as they are discovered and sequenced. As an example, CARMEN (Combinatorial Arrayed Reactions for Multiplexed Evaluation of Nucleic acids) was not originally designed as a SARS-CoV-2 specific sensor; rather, it is a generalized method for mass testing of a sample against many different possible pathogens [178]. CARMEN uses Cas13 matching sequences to various target analytes in its microwell arrays. This was used to create testing chips that would enable rapid and scalable testing of many viruses at once. To achieve an optical readout, CARMEN mixed various combinations of a variety of off-the-shelf fluorophores to produce unique color signatures for each well, minimizing the effect of “optical bleeding” from neighboring cells when a particular array entry lights up positive.
This platform allows for a simplified integration of novel viruses into the microwell array as they are discovered. CARMEN was under development months before the COVID-19 pandemic; however, the team was able to rapidly incorporate a crRNA matching sequence for SARS-CoV-2. This flexibility may be key to monitoring the spread of variant strains of SARS-CoV-2, as crRNA for the detection wells can be used to distinguish even single-nucleotide differences in the genetic makeup. The ability to distinguish variants with this method was demonstrated with CARMEN in an array that allowed for simultaneous testing of all H(1–16) and N(1–9) influenza A common viral mutation combinations.
Likewise, the specific high-sensitivity enzymatic reporter unlocking (SHERLOCK) allows for multiplexed, portable, and ultra-sensitive detection of RNA or DNA from clinical samples, uses fluorescence and colorimetric readouts, and provides results in less than an hour with a setup time of less than 15 min [179]. It has been developed in 2019 and was quickly adapted for SARS-CoV-2 RNA detection in 2020 [180]. As global pandemic alleviation efforts depend on a combination of mass testing, mutation tracking, and vaccination programs, a flexible platform in which one can rapidly identify the particular strand of virus that a patient is infected with will be crucial. A detailed comparative summary of recently developed CRISPR-based biosensors can be found in a recent topical review article (see Tables 2 and 3 in [181]).
Further Avenues for Cleavage-Based Photonic Sensors
As cleavage-based sensing is still a relatively new approach, there are numerous novel applications being developed that make use of the unique combination of the biological recognition and amplification mechanisms provided by the CRISPR technology with the optical signal amplification techniques provided by photonic and plasmonic biosensing platforms. Nonspecific collateral cleavages activated by precise crRNA target matching to viral RNA and DNA are being investigated as a transduction mechanism in photonic biosensors of various configurations, including planar porous biosensors with Fabry–Perot spectra and out-of-plane readout (Figure 5a) [182], integrated microresonator sensors with in-plane readout [183,184], and diffractive biosensors inverse-designed for cleavage-enabled sensing with simple single-frequency readout (Figure 5b) [185].
The new approach makes use of the biosensor surface pre-test functionalization with high-index nanoscale reporters (e.g., quantum dots, semiconductor or noble-metal nanoparticles), which are then cleaved from the surface by a cleaving agent (e.g., a CRISPR complex) activated by a target biomolecule in the sample. Surface functionalization can be done by using known chemistry and does not require re-designing for every new type of pathogen or a variant. This approach can also provide dramatic optical signal amplification, which results from the collateral cleavages of large numbers (up to ) of high-contrast nanoparticle probes instead of the adsorption of few low-index biological molecules. We estimate the reduction of LOD caused by replacing the molecule capture event with the collateral probes cleavage event as: , where M is the cleavage multiplication factor (i.e., the number of probes cleaved collaterally upon the enzyme activation by a single target molecule), and is the polarizability of the probe. is the sensor resolution under the probe-cleavage detection scenario, while is the sensor resolution in the affinity mode operation.
It can be easily seen that the sensor LOD value can be reduced by choosing the probes with larger polarizability values than that of the target molecule . For comparison, at m, the ratios of polarizabilities of an Au (), Si () and Ge () nanoparticle probes to the polarizability of a biological particle () of the same size in water are as follows: , , and . The choice of the probe size offers an even larger degree of control over LOD as the polarizability scales linearly with the particle volume: .
On the other hand, the standard deviation caused by the amplitude noise may be increased by the presence of high-contrast probes, which will decrease the sensor resolution and, in turn, increase the LOD, reducing the effect of the larger probe polarizability. However, as long as the probe-to-molecule polarizability ratio exceeds the corresponding FWHM ratio, the probe-cleavage-based approach reduces the sensor LOD over the molecule-capture-based approach. As an example, a recent study predicts that high-index semiconductor nanoparticles used as probes with an integrated silicon microring resonator are expected to provide dramatic signal amplification without causing significant degradation of the resonant mode quality factors [184]. The cleavage multiplication factor M has an even stronger effect on the LOD reduction than the large polarizability of the probes since a single CRISPR complex, activated by the hybridization of viral RNA/DNA to CRISPR RNA/DNA, can produce thousands of non-specific collateral cleavages. Furthermore, the probes can be chosen such that they either produce an additional optical signal, e.g., fluorescence and Raman scattering [186] or strongly modify the electrical conductivity of the sensor [173,187], allowing for the development of a multiplexed sensor platform design.
5. Conclusions and Outlook
To provide resiliency against pandemics, new types of universal biosensors that can be rapidly adapted and deployed on a large scale for the detection of new pathogens and new variants of known pathogens and exhibit real-time detection with LOD as low as a few target molecules need to be developed. Photonic biosensors, which provide optical signal amplification and can be mass-produced by existing semiconductor foundries, offer a promising platform, which is in principle amenable to multiplexing with spectroscopic and electrochemical detection techniques. However, to reach sub-fM detection levels, photonic biosensors typically have had to be engineered to support ultra-high-Q trapped modes. On the other hand, the plasmonic field enhancement required for SERS, infrared and fluorescent signal enhancement is accompanied by the inevitable Q-factor reduction due to Ohmic losses in metals, hindering multiplexing opportunities. Hybrid optoplasmonic biosensors offer a partial solution to this dilemma [68,69,70,71,72] but have not been adopted on larger scale owing to their complexity in fabrication and operation. Finally, even ’label-free’ photonic sensors typically rely on target-specific receptors to achieve specificity and increase sensitivity and need to be re-designed for detection of new pathogens.
The recently introduced concept of the probe-cleavage detection makes the rapid development of new highly sensitive real-time photonic biosensor platforms possible for emergent pathogens and new variants of known pathogens because it no longer requires the development of target-specific receptors and offers low detection limits (down to few molecules) owing to the high collateral cleavage counts exhibited by the commercially available programmable CRISPR–Cas complexes [26,177,178,179,180].
Interestingly, both low- and high-quality-factor photonic biosensors can be re-engineered to work efficiently under the probe-cleavage detection scenario owing to the dramatic signal amplification provided by the high-contrast probes and collateral cleavage multiplication factors [182,184,185]. This offers opportunities for multiplexing photonic biosensors with spectroscopic techniques and making use of the surface-plasmon signal enhancement. Furthermore, low- and moderate-Q photonic biosensor platforms can be engineered to operate with the single-frequency fixed-angle intensity vertical readout, reducing their cost and complexity and enabling integration with portable smartphone-based systems [188,189,190]. We expect that many previously developed photonic biosensing platforms can be redesigned to operate in the probe-cleavage detection regime and provide multiplexed capabilities. The recently developed toolbox of the inverse design and machine-learning techniques [185,191,192,193,194,195] can be utilized to find the optimum sensor configuration (i.e., a photonic device platform, readout mechanism, type and surface coverage of the nanoparticle probes, etc.) that balances the sensor ease of use, detection time, LOD, and the dynamic range requirements.
Author Contributions
All authors contributed equally to the literature research and manuscript writing. All authors have read and agreed to the published version of the manuscript.
Funding
This research received no external funding.
Institutional Review Board Statement
Not applicable.
Informed Consent Statement
Not applicable.
Acknowledgments
We thank Michael Dubrovsky, Diedrik Vermeulen, Ke Du, Sharon Weiss, and Haejun Chung for useful discussions.
Conflicts of Interest
The authors declare no conflict of interest.
Abbreviations
The following abbreviations are used in this manuscript:
| ATR | Attenuated Total Reflection |
| Cas | CRISPR-associated |
| CRISPR–Cas | Clustered Regularly Interspaced Short Palindromic Repeats-associated complexes |
| crRNA | CRISPR RNA |
| DNase | Deoxyribonuclease |
| DLB | Dementia with Lewy bodies |
| fM | Femtomolar |
| FQ | Fluorophore-Quencher |
| FTIR | Fourier-Transform Infrared |
| FWHM | Full Width at Half Maximum |
| GDM | Gestational Diabetes Mellitus |
| HCV | Hepatitis C Virus |
| HIV | Human Immunodeficiency Virus |
| IR | Infrared |
| LAMP | Loop-mediated AMPlification |
| LOD | Limit of Detection |
| LSPR | Localized Surface Plasmon Resonance |
| MIR | Mid-Infrared |
| NIR | Near-Infrared |
| POC | Point-of-care |
| PhC | Photonic crystal |
| RI | Refractive Index |
| RNA | Ribonucleic Acid |
| RT-PCR | Reverse Transcription Polymerase Chain Reaction |
| SARS-CoV-2 | Severe Acute Respiratory Syndrome CoronaVirus 2 |
| SERS | Surface-Enhanced Raman Spectroscopy |
| SHERLOCK | Specific High-Sensitivity Enzymatic Reporter UnLOCKing |
| SNR | Signal-to-Noise Ratio |
| SPR | Surface Plasmon Resonance |
| TERS | Tip-Enhanced Raman Spectroscopy |
| Q | Quality |
| WGM | Whispering Gallery Mode |
References
- González-Guerrero, A.; Dante, S.; Duval, D.; Osmond, J.; Lechuga, L.M. Advanced photonic biosensors for point-of-care diagnostics. Procedia Eng. 2011, 25, 71–75. [Google Scholar] [CrossRef] [Green Version]
- Luan, E.; Shoman, H.; Ratner, D.M.; Cheung, K.C.; Chrostowski, L. Silicon photonic biosensors using label-free detection. Sensors 2018, 18, 3519. [Google Scholar] [CrossRef] [Green Version]
- Vollmer, F.; Yang, L. Review Label-free detection with high-Q microcavities: A review of biosensing mechanisms for integrated devices. Nanophotonics 2012, 1, 267–291. [Google Scholar] [CrossRef] [Green Version]
- Chen, C.; Wang, J. Optical biosensors: An exhaustive and comprehensive review. Analyst 2020, 145, 1605–1628. [Google Scholar] [CrossRef]
- Huertas, C.S.; Calvo-Lozano, O.; Mitchell, A.; Lechuga, L.M. Advanced evanescent-wave optical biosensors for the detection of nucleic acids: An analytic perspective. Front. Chem. 2019, 7, 724. [Google Scholar] [CrossRef] [Green Version]
- Nangare, S.N.; Patil, P.O. Affinity-Based Nanoarchitectured Biotransducer for Sensitivity Enhancement of Surface Plasmon Resonance Sensors for In Vitro Diagnosis: A Review. ACS Biomater. Sci. Eng. 2020, 7, 2–30. [Google Scholar] [CrossRef]
- Soler, M.; Estevez, M.C.; Cardenosa-Rubio, M.; Astua, A.; Lechuga, L.M. How nanophotonic label-free biosensors can contribute to rapid and massive diagnostics of respiratory virus infections: COVID-19 case. ACS Sens. 2020, 5, 2663–2678. [Google Scholar] [CrossRef] [PubMed]
- Cheng, Y.; Dong, L.; Zhang, J.; Zhao, Y.; Li, Z. Recent advances in microRNA detection. Analyst 2018, 143, 1758–1774. [Google Scholar] [CrossRef] [PubMed]
- Langer, J.; Jimenez de Aberasturi, D.; Aizpurua, J.; Alvarez-Puebla, R.A.; Auguié, B.; Baumberg, J.J.; Bazan, G.C.; Bell, S.E.; Boisen, A.; Brolo, A.G.; et al. Present and future of surface-enhanced Raman scattering. ACS Nano 2019, 14, 28–117. [Google Scholar] [CrossRef] [PubMed] [Green Version]
- Pilot, R.; Signorini, R.; Durante, C.; Orian, L.; Bhamidipati, M.; Fabris, L. A review on surface-enhanced Raman scattering. Biosensors 2019, 9, 57. [Google Scholar] [CrossRef] [PubMed] [Green Version]
- Stockman, M.I.; Kneipp, K.; Bozhevolnyi, S.I.; Saha, S.; Dutta, A.; Ndukaife, J.; Kinsey, N.; Reddy, H.; Guler, U.; Shalaev, V.M.; et al. Roadmap on plasmonics. J. Opt. 2018, 20, 043001. [Google Scholar] [CrossRef] [Green Version]
- Zhou, C.; Zou, H.; Sun, C.; Ren, D.; Chen, J.; Li, Y. Signal amplification strategies for DNA-based surface plasmon resonance biosensors. Biosens. Bioelectron. 2018, 117, 678–689. [Google Scholar] [CrossRef]
- Zhao, S. Alternative splicing, RNA-seq and drug discovery. Drug Discov. Today 2019, 24, 1258–1267. [Google Scholar] [CrossRef]
- Tahamtan, A.; Ardebili, A. Real-time RT-PCR in COVID-19 detection: Issues affecting the results. Expert Rev. Mol. Diagn. 2020, 20, 453–454. [Google Scholar] [CrossRef] [PubMed] [Green Version]
- Van Kasteren, P.B.; van Der Veer, B.; van den Brink, S.; Wijsman, L.; de Jonge, J.; van den Brandt, A.; Molenkamp, R.; Reusken, C.B.; Meijer, A. Comparison of seven commercial RT-PCR diagnostic kits for COVID-19. J. Clin. Virol. 2020, 128, 104412. [Google Scholar] [CrossRef] [PubMed]
- Huang, Q.; Li, N.; Zhang, H.; Che, C.; Sun, F.; Xiong, Y.; Canady, T.D.; Cunningham, B.T. Critical Review: Digital resolution biomolecular sensing for diagnostics and life science research. Lab Chip 2020, 20, 2816–2840. [Google Scholar] [CrossRef] [PubMed]
- Lussier, F.; Thibault, V.; Charron, B.; Wallace, G.Q.; Masson, J.F. Deep learning and artificial intelligence methods for Raman and surface-enhanced Raman scattering. TrAC Trends Anal. Chem. 2020, 124, 115796. [Google Scholar] [CrossRef]
- Guo, S.; Mayerhöfer, T.; Pahlow, S.; Hübner, U.; Popp, J.; Bocklitz, T. Deep learning for ‘artefact’ removal in infrared spectroscopy. Analyst 2020, 145, 5213–5220. [Google Scholar] [CrossRef]
- Cui, F.; Yue, Y.; Zhang, Y.; Zhang, Z.; Zhou, H.S. Advancing Biosensors with Machine Learning. ACS Sens. 2020, 5, 3346–3364. [Google Scholar] [CrossRef] [PubMed]
- Lee, S.Y.; Amsden, J.J.; Boriskina, S.V.; Gopinath, A.; Mitropolous, A.; Kaplan, D.L.; Omenetto, F.G.; Negro, L.D. Spatial and spectral detection of protein monolayers with deterministic aperiodic arrays of metal nanoparticles. Proc. Natl. Acad. Sci. USA 2010, 107, 12086–12090. [Google Scholar] [CrossRef] [Green Version]
- Nolan, T.; Hands, R.E.; Bustin, S.A. Quantification of mRNA using real-time RT-PCR. Nat. Protoc. 2006, 1, 1559–1582. [Google Scholar] [CrossRef]
- Surkova, E.; Nikolayevskyy, V.; Drobniewski, F. False-positive COVID-19 results: Hidden problems and costs. Lancet Respir. Med. 2020, 8, 1167–1168. [Google Scholar] [CrossRef]
- Kwok, S.; Higuchi, R. Avoiding false positives with PCR. Nature 1989, 339, 237–238. [Google Scholar] [CrossRef]
- Galas, D.J.; Schmitz, A. DNAase footprinting a simple method for the detection of protein-DNA binding specificity. Nucleic Acids Res. 1978, 5, 3157–3170. [Google Scholar] [CrossRef]
- Li, S.Y.; Cheng, Q.X.; Wang, J.M.; Li, X.Y.; Zhang, Z.L.; Gao, S.; Cao, R.B.; Zhao, G.P.; Wang, J. CRISPR-Cas12a-assisted nucleic acid detection. Cell Discov. 2018, 4, 1–4. [Google Scholar] [CrossRef] [PubMed] [Green Version]
- Broughton, J.P.; Deng, X.; Yu, G.; Fasching, C.L.; Servellita, V.; Singh, J.; Miao, X.; Streithorst, J.A.; Granados, A.; Sotomayor-Gonzalez, A.; et al. CRISPR—Cas12-based detection of SARS-CoV-2. Nat. Biotechnol. 2020, 38, 870–874. [Google Scholar] [CrossRef] [PubMed] [Green Version]
- East-Seletsky, A.; O’Connell, M.R.; Knight, S.C.; Burstein, D.; Cate, J.H.; Tjian, R.; Doudna, J.A. Two distinct RNase activities of CRISPR-C2c2 enable guide-RNA processing and RNA detection. Nature 2016, 538, 270–273. [Google Scholar] [CrossRef]
- Chen, Y.; Liu, J.; Yang, Z.; Wilkinson, J.S.; Zhou, X. Optical biosensors based on refractometric sensing schemes: A review. Biosens. Bioelectron. 2019, 144, 111693. [Google Scholar] [CrossRef]
- Hannay, J.H. The Clausius-Mossotti equation: An alternative derivation. Eur. J. Phys. 1983, 4. [Google Scholar] [CrossRef]
- Talebian, E.; Talebian, M. A general review on the derivation of Clausius—Mossotti relation. Optik 2013, 124, 2324–2326. [Google Scholar] [CrossRef]
- Lin, V.S. A Porous Silicon-Based Optical Interferometric Biosensor. Science 1997, 278, 840–843. [Google Scholar] [CrossRef]
- Arshavsky-Graham, S.; Massad-Ivanir, N.; Segal, E.; Weiss, S. Porous Silicon-Based Photonic Biosensors: Current Status and Emerging Applications. Anal. Chem. 2019, 91, 441–467. [Google Scholar] [CrossRef]
- Tsurimaki, Y.; Tong, J.K.; Boriskin, V.N.; Semenov, A.; Ayzatsky, M.I.; Machekhin, Y.P.; Chen, G.; Boriskina, S.V. Topological Engineering of Interfacial Optical Tamm States for Highly Sensitive Near-Singular-Phase Optical Detection. ACS Photonics 2018, 5, 929–938. [Google Scholar] [CrossRef] [Green Version]
- Coutant, C.; Ravaine, S.; Wang, X.; Toudert, J.; Ponsinet, V.; Barois, P. Plasmonic metamaterials for ultra-sensitive sensing: Topological darkness. Rend. Lincei 2015, 26, 175–182. [Google Scholar] [CrossRef]
- Kravets, V.G.; Schedin, F.; Jalil, R.; Britnell, L.; Gorbachev, R.V.; Ansell, D.; Thackray, B.; Novoselov, K.S.; Geim, A.K.; Kabashin, A.V.; et al. Singular phase nano-optics in plasmonic metamaterials for label-free single-molecule detection. Nat. Mater. 2013, 12, 304–309. [Google Scholar] [CrossRef]
- Wu, L.; Guo, J.; Xu, H.; Dai, X.; Xiang, Y. Ultrasensitive biosensors based on long-range surface plasmon polariton and dielectric waveguide modes. Photonics Res. 2016, 4, 262. [Google Scholar] [CrossRef]
- Fan, B.; Liu, F.; Li, Y.; Wang, X.; Cui, K.; Feng, X.; Zhang, W.; Huang, Y. Integrated refractive index sensor based on hybrid coupler with short range surface plasmon polariton and dielectric waveguide. Sens. Actuators B Chem. 2013, 186, 495–505. [Google Scholar] [CrossRef]
- Piliarik, M.; Vaisocherová, H.; Homola, J. Surface plasmon resonance biosensing. Biosens. Biodetect. 2009, 65–88. [Google Scholar] [CrossRef]
- Zeni, L.; Perri, C.; Cennamo, N.; Arcadio, F.; D’Agostino, G.; Salmona, M.; Beeg, M.; Gobbi, M. A portable optical-fibre-based surface plasmon resonance biosensor for the detection of therapeutic antibodies in human serum. Sci. Rep. 2020, 10, 11154. [Google Scholar] [CrossRef]
- Kumar, S.; Guo, Z.; Singh, R.; Wang, Q.; Zhang, B.; Cheng, S.; Liu, F.Z.; Marques, C.; Kaushik, B.K.; Jha, R. MoS2 Functionalized Multicore Fiber Probes for Selective Detection of Shigella Bacteria Based on Localized Plasmon. J. Light. Technol. 2021, 39, 4069–4081. [Google Scholar] [CrossRef]
- Cai, S.; Pan, H.; González-Vila, Á.; Guo, T.; Gillan, D.C.; Wattiez, R.; Caucheteur, C. Selective detection of cadmium ions using plasmonic optical fiber gratings functionalized with bacteria. Opt. Express 2020, 28, 19740. [Google Scholar] [CrossRef]
- Wang, Y.; Zhu, G.; Li, M.; Singh, R.; Marques, C.; Min, R.; Kaushik, B.K.; Zhang, B.; Jha, R.; Kumar, S. Water pollutants p-Cresol detection based on Au-ZnO nanoparticles modified tapered optical fiber. IEEE Trans. Nanobiosci. 2021, 20, 377–384. [Google Scholar] [CrossRef]
- Zhao, Y.; Tong, R.j.; Xia, F.; Peng, Y. Current status of optical fiber biosensor based on surface plasmon resonance. Biosens. Bioelectron. 2019, 142, 111505. [Google Scholar] [CrossRef]
- Sarkar, D.; Gunda, N.S.K.; Jamal, I.; Mitra, S.K. Optical biosensors with an integrated Mach-Zehnder Interferometer for detection of Listeria monocytogenes. Biomed. Microdevices 2014, 16, 509–520. [Google Scholar] [CrossRef]
- Liu, Q.; Tu, X.; Kim, K.W.; Kee, J.S.; Shin, Y.; Han, K.; Yoon, Y.J.; Lo, G.Q.; Park, M.K. Highly sensitive Mach-Zehnder interferometer biosensor based on silicon nitride slot waveguide. Sens. Actuators B Chem. 2013, 188, 681–688. [Google Scholar] [CrossRef]
- Wang, Y.; Zeng, S.; Humbert, G.; Ho, H. Microfluidic Whispering Gallery Mode Optical Sensors for Biological Applications. Laser Photonics Rev. 2020, 14, 2000135. [Google Scholar] [CrossRef]
- Wu, S.; Guo, Y.; Wang, W.; Zhou, J.; Zhang, Q. Label-free biosensing using a microring resonator integrated with poly-(dimethylsiloxane) microfluidic channels. Rev. Sci. Instrum. 2019, 90, 035004. [Google Scholar] [CrossRef]
- Yalçin, A.; Popat, K.C.; Aldridge, J.C.; Desai, T.A.; Hryniewicz, J.; Chbouki, N.; Little, B.E.; King, O.; Van, V.; Chu, S.; et al. Optical sensing of biomolecules using microring resonators. IEEE J. Sel. Top. Quantum Electron. 2006, 12, 148–154. [Google Scholar] [CrossRef]
- Kim, E.; Baaske, M.D.; Vollmer, F. Towards next-generation label-free biosensors: Recent advances in whispering gallery mode sensors. Lab Chip 2017, 17, 1190–1205. [Google Scholar] [CrossRef] [PubMed]
- Ozgur, E.; Toren, P.; Aktas, O.; Huseyinoglu, E.; Bayindir, M. Label-Free Biosensing with High Selectivity in Complex Media using Microtoroidal Optical Resonators. Sci. Rep. 2015, 5, 13173. [Google Scholar] [CrossRef] [PubMed] [Green Version]
- Inan, H.; Poyraz, M.; Inci, F.; Lifson, M.A.; Baday, M.; Cunningham, B.T.; Demirci, U. Photonic crystals: Emerging biosensors and their promise for point-of-care applications. Chem. Soc. Rev. 2017, 46, 366–388. [Google Scholar] [CrossRef]
- Guo, Y.; Ye, J.Y.; Divin, C.; Huang, B.; Thomas, T.P.; Baker, J.R.; Norris, T.B. Real-time biomolecular binding detection using a sensitive photonic crystal biosensor. Anal. Chem. 2010, 82, 5211–5218. [Google Scholar] [CrossRef] [Green Version]
- Lo, S.M.; Hu, S.; Gaur, G.; Kostoulas, Y.; Weiss, S.M.; Fauchet, P.M. Photonic crystal microring resonator for label-free biosensing. Opt. Express 2017, 25, 7046. [Google Scholar] [CrossRef]
- Joannopoulos, J.D.; Johnson, S.G.; Winn, J.N.; Meade, R.D. Photonic Crystals: Molding the Flow of Light, 2nd ed.; Princeton University Press: Princeton, NJ, USA, 2011. [Google Scholar]
- El-Aziz, O.A.; Abd Elsayed, H.A.; Sayed, M. One-dimensional defective photonic crystals for the sensing and detection of protein. Appl. Opt. 2019, 58, 8309–8315. [Google Scholar] [CrossRef]
- Su, J. Label-Free Biological and Chemical Sensing Using Whispering Gallery Mode Optical Resonators: Past, Present, and Future. Sensors 2017, 17, 540. [Google Scholar] [CrossRef] [PubMed] [Green Version]
- Paschotta, R. Q factor. In Encyclopedia of Laser Physics and Technology, 1st ed.; Wiley-VCH: Weinheim, Germany, 2008. [Google Scholar]
- Braginsky, V.; Gorodetsky, M.; Ilchenko, V. Quality-factor and nonlinear properties of optical whispering-gallery modes. Phys. Lett. A 1989, 137, 393–397. [Google Scholar] [CrossRef]
- White, I.M.; Fan, X. On the performance quantification of resonant refractive index sensors. Opt. Express 2008, 16, 1020–1028. [Google Scholar] [CrossRef] [PubMed] [Green Version]
- Arnold, S.; Khoshsima, M.; Teraoka, I.; Holler, S.; Vollmer, F. Shift of whispering-gallery modes in microspheres by protein adsorption. Opt. Lett. 2003, 28, 272–274. [Google Scholar] [CrossRef] [PubMed] [Green Version]
- Miyazaki, C.M.; Shimizu, F.M.; Ferreira, M. 6-Surface Plasmon Resonance (SPR) for Sensors and Biosensors. In Nanocharacterization Techniques; Da Róz, A.L., Ferreira, M., de Lima Leite, F., Oliveira, O.N., Eds.; Micro and Nano Technologies; William Andrew Publishing: Norwich, NY, USA, 2017; pp. 183–200. [Google Scholar] [CrossRef]
- Mauriz, E. Recent Progress in Plasmonic Biosensing Schemes for Virus Detection. Sensors 2020, 20, 4745. [Google Scholar] [CrossRef] [PubMed]
- Homola, J. Surface Plasmon Resonance Sensors for Detection of Chemical and Biological Species. Chem. Rev. 2008, 108, 462–493. [Google Scholar] [CrossRef] [PubMed]
- Lamprecht, B.; Schider, G.; Lechner, R.T.; Ditlbacher, H.; Krenn, J.R.; Leitner, A.; Aussenegg, F.R. Metal Nanoparticle Gratings: Influence of Dipolar Particle Interaction on the Plasmon Resonance. Phys. Rev. Lett. 2000, 84, 4721. [Google Scholar] [CrossRef]
- Petryayeva, E.; Krull, U.J. Localized surface plasmon resonance: Nanostructures, bioassays and biosensing—A review. Anal. Chim. Acta 2011, 706, 8–24. [Google Scholar] [CrossRef]
- Campion, A.; Kambhampati, P. Surface-enhanced Raman scattering. Chem. Soc. Rev. 1998, 27, 241–250. [Google Scholar] [CrossRef]
- Bonyár, A. Label-Free Nucleic Acid Biosensing Using Nanomaterial-Based Localized Surface Plasmon Resonance Imaging: A Review. ACS Appl. Nano Mater. 2020, 3, 8506–8521. [Google Scholar] [CrossRef]
- Santiago-Cordoba, M.A.; Boriskina, S.V.; Vollmer, F.; Demirel, M.C. Nanoparticle-based protein detection by optical shift of a resonant microcavity. Appl. Phys. Lett. 2011, 99, 073701. [Google Scholar] [CrossRef]
- Santiago-Cordoba, M.A.; Cetinkaya, M.; Boriskina, S.V.; Vollmer, F.; Demirel, M.C. Ultrasensitive detection of a protein by optical trapping in a photonic-plasmonic microcavity. J. Biophotonics 2012, 5, 629–638. [Google Scholar] [CrossRef] [Green Version]
- Shopova, S.I.; Rajmangal, R.; Holler, S.; Arnold, S. Plasmonic enhancement of a whispering-gallery-mode biosensor for single nanoparticle detection. Appl. Phys. Lett. 2011, 98, 243104. [Google Scholar] [CrossRef] [Green Version]
- Hong, Y.; Reinhard, B.M. Optoplasmonics: Basic principles and applications. J. Opt. 2019, 21, 113001. [Google Scholar] [CrossRef]
- Baaske, M.D.; Foreman, M.R.; Vollmer, F. Single-molecule nucleic acid interactions monitored on a label-free microcavity biosensor platform. Nat. Nanotechnol. 2014, 9, 933–939. [Google Scholar] [CrossRef]
- Lv, C.; Jia, Z.; Liu, Y.; Mo, J.; Li, P.; Lv, X. Angle-resolved diffraction grating biosensor based on porous silicon. J. Appl. Phys. 2016, 119, 094502. [Google Scholar] [CrossRef]
- Ryckman, J.D.; Liscidini, M.; Sipe, J.E.; Weiss, S.M. Porous silicon structures for low-cost diffraction-based biosensing. Appl. Phys. Lett. 2010, 96, 171103. [Google Scholar] [CrossRef] [Green Version]
- Amsden, J.J.; Perry, H.; Boriskina, S.V.; Gopinath, A.; Kaplan, D.L.; Negro, L.D.; Omenetto, F.G. Spectral analysis of induced color change on periodically nanopatterned silk films. Opt. Express 2009, 17, 21271–21279. [Google Scholar] [CrossRef] [PubMed]
- Goh, J.; Loo, R.; McAloney, R.; Goh, C. Diffraction-based assay for detecting multiple analytes. Anal. Bioanal. Chem. 2002, 374, 54–56. [Google Scholar] [CrossRef]
- Liscidini, M.; Sipe, J.E. Enhancement of diffraction for biosensing applications via Bloch surface waves. Appl. Phys. Lett. 2007, 91, 253125. [Google Scholar] [CrossRef]
- Talukdar, T.H.; McCoy, B.; Timmins, S.K.; Khan, T.; Ryckman, J.D. Hyperchromatic structural color for perceptually enhanced sensing by the naked eye. Proc. Natl. Acad. Sci. USA 2020, 117, 30107–30117. [Google Scholar] [CrossRef] [PubMed]
- Lichtenberg, J.Y.; Ling, Y.; Kim, S. Non-Specific Adsorption Reduction Methods in Biosensing. Sensors 2019, 19, 2488. [Google Scholar] [CrossRef] [Green Version]
- Johnson, B.N.; Mutharasan, R. Biosensor-based microRNA detection: Techniques, design, performance, and challenges. Analyst 2014, 139, 1576–1588. [Google Scholar] [CrossRef] [PubMed]
- Liu, B.; Liu, X.; Shi, S.; Huang, R.; Su, R.; Qi, W.; He, Z. Design and mechanisms of antifouling materials for surface plasmon resonance sensors. Acta Biomater. 2016, 40, 100–118. [Google Scholar] [CrossRef]
- Zourob, M.; Elwary, S.; Turner, A.; Campbell, D.P. Interferometric Biosensors. In Principles of Bacterial Detection: Biosensors, Recognition Receptors and Microsystems; Springer: Berlin/Heidelberg, Germany, 2008. [Google Scholar]
- Goodwin, M.J.; Besselink, G.A.J.; Falke, F.; Everhardt, A.S.; Cornelissen, J.J.L.M.; Huskens, J. Highly Sensitive Protein Detection by Asymmetric Mach–Zehnder Interferometry for Biosensing Applications. ACS Appl. Bio Mater. 2020, 3, 4566–4572. [Google Scholar] [CrossRef]
- Li, M.; Wu, X.; Liu, L.; Fan, X.; Xu, L. Self-Referencing Optofluidic Ring Resonator Sensor for Highly Sensitive Biomolecular Detection. Anal. Chem. 2013, 85, 9328–9332. [Google Scholar] [CrossRef]
- Boriskina, S.V.; Negro, L.D. Self-referenced photonic molecule bio(chemical)sensor. Opt. Lett. 2010, 35, 2496–2498. [Google Scholar] [CrossRef] [PubMed] [Green Version]
- Jang, H.S.; Park, K.N.; Kang, C.D.; Kim, J.P.; Sim, S.J.; Lee, K.S. Optical fiber SPR biosensor with sandwich assay for the detection of prostate specific antigen. Opt. Commun. 2009, 282, 2827–2830. [Google Scholar] [CrossRef]
- Seo, H.B.; Gu, M.B. Aptamer-based sandwich-type biosensors. J. Biol. Eng. 2017, 11, 1–7. [Google Scholar] [CrossRef] [PubMed] [Green Version]
- Seok, J.S.; Ju, H. Plasmonic Optical Biosensors for Detecting C-Reactive Protein: A Review. Micromachines 2020, 11, 895. [Google Scholar] [CrossRef] [PubMed]
- Wu, B.; Jiang, R.; Wang, Q.; Huang, J.; Yang, X.; Wang, K.; Li, W.; Chen, N.; Li, Q. Detection of C-reactive protein using nanoparticle-enhanced surface plasmon resonance using an aptamer-antibody sandwich assay. Chem. Commun. 2016, 52, 3568–3571. [Google Scholar] [CrossRef] [PubMed] [Green Version]
- Meyer, M.H.; Hartmann, M.; Keusgen, M. SPR-based immunosensor for the CRP detection—A new method to detect a well known protein. Biosens. Bioelectron. 2006, 21, 1987–1990. [Google Scholar] [CrossRef]
- Vance, S.A.; Sandros, M.G. Zeptomole Detection of C-Reactive Protein in Serum by a Nanoparticle Amplified Surface Plasmon Resonance Imaging Aptasensor. Sci. Rep. 2015, 4, 5129. [Google Scholar] [CrossRef] [Green Version]
- Singh, P. SPR Biosensors: Historical Perspectives and Current Challenges. Sens. Actuators B Chem. 2016, 229, 110–130. [Google Scholar] [CrossRef]
- Sheehan, P.E.; Whitman, L.J. Detection Limits for Nanoscale Biosensors. Nano Lett. 2005, 5, 803–807. [Google Scholar] [CrossRef]
- Harpaz, D.; Koh, B.; Marks, R.S.; Seet, R.C.; Abdulhalim, I.; Tok, A.I. Point-of-Care Surface Plasmon Resonance Biosensor for Stroke Biomarkers NT-proBNP and S100β Using a Functionalized Gold Chip with Specific Antibody. Sensors 2019, 19, 2533. [Google Scholar] [CrossRef] [PubMed] [Green Version]
- Liu, Q.; Shin, Y.; Kee, J.S.; Kim, K.W.; Mohamed Rafei, S.R.; Perera, A.P.; Tu, X.; Lo, G.Q.; Ricci, E.; Colombel, M.; et al. Mach–Zehnder interferometer (MZI) point-of-care system for rapid multiplexed detection of microRNAs in human urine specimens. Biosens. Bioelectron. 2015, 71, 365–372. [Google Scholar] [CrossRef]
- Zang, K.; Zhang, D.; Huo, Y.; Chen, X.; Lu, C.Y.; Fei, E.T.; Kamins, T.I.; Feng, X.; Huang, Y.; Harris, J.S. Microring bio-chemical sensor with integrated low dark current Ge photodetector. Appl. Phys. Lett. 2015, 106, 101111. [Google Scholar] [CrossRef]
- Zhang, Y.-N.; Zhao, Y.; Zhou, T.; Wu, Q. Applications and developments of on-chip biochemical sensors based on optofluidic photonic crystal cavities. Lab Chip 2017, 18, 57–74. [Google Scholar] [CrossRef] [PubMed]
- Nath, P.; Kabir, A.; Doust, S.K.; Kreais, Z.J.; Ray, A. Detection of Bacterial and Viral Pathogens Using Photonic Point-of-Care Devices. Diagnostics 2020, 10, 841. [Google Scholar] [CrossRef] [PubMed]
- Manoharan, H.; Kalita, P.; Gupta, S.; Sai, V.V. Plasmonic biosensors for bacterial endotoxin detection on biomimetic C-18 supported fiber optic probes. Biosens. Bioelectron. 2019, 129, 79–86. [Google Scholar] [CrossRef] [PubMed]
- Chen, Y.T.; Lee, Y.C.; Lai, Y.H.; Lim, J.C.; Huang, N.T.; Lin, C.T.; Huang, J.J. Review of Integrated Optical Biosensors for Point-of-Care Applications. Biosensors 2020, 10, 209. [Google Scholar] [CrossRef] [PubMed]
- Zang, F.; Su, Z.; Zhou, L.; Konduru, K.; Kaplan, G.; Chou, S.Y. Ultrasensitive Ebola Virus Antigen Sensing via 3D Nanoantenna Arrays. Adv. Mater. 2019, 31, 1902331. [Google Scholar] [CrossRef]
- Ahmadivand, A.; Gerislioglu, B.; Ramezani, Z.; Kaushik, A.; Manickam, P.; Ghoreishi, S.A. Functionalized terahertz plasmonic metasensors: Femtomolar-level detection of SARS-CoV-2 spike proteins. Biosens. Bioelectron. 2021, 177, 112971. [Google Scholar] [CrossRef] [PubMed]
- Shafiee, H.; Lidstone, E.A.; Jahangir, M.; Inci, F.; Hanhauser, E.; Henrich, T.J.; Kuritzkes, D.R.; Cunningham, B.T.; Demirci, U. Nanostructured Optical Photonic Crystal Biosensor for HIV Viral Load Measurement. Sci. Rep. 2014, 4, 4116. [Google Scholar] [CrossRef] [Green Version]
- Chiavaioli, F.; Zubiate, P.; Villar, I.D.; Zamarreño, C.R.; Giannetti, A.; Tombelli, S.; Trono, C.; Arregui, F.J.; Matias, I.R.; Baldini, F. Femtomolar Detection by Nanocoated Fiber Label-Free Biosensors. ACS Sens. 2018, 3, 936–943. [Google Scholar] [CrossRef]
- Beć, K.B.; Grabska, J.; Huck, C.W. Biomolecular and bioanalytical applications of infrared spectroscopy—A review. Anal. Chim. Acta 2020, 1133, 150–177. [Google Scholar] [CrossRef]
- Ewing, G.E. Infrared Spectroscopy. Annu. Rev. Phys. Chem. 1972, 23, 141–164. [Google Scholar] [CrossRef]
- Notingher, I. Raman Spectroscopy Cell-based Biosensors. Sensors 2007, 7, 1343. [Google Scholar] [CrossRef] [Green Version]
- Chen, Y.; Qian, C.; Liu, C.; Shen, H.; Wang, Z.; Ping, J.; Wu, J.; Chen, H. Nucleic acid amplification free biosensors for pathogen detection. Biosens. Bioelectron. 2020, 153, 112049. [Google Scholar] [CrossRef] [PubMed]
- Balan, V.; Mihai, C.T.; Cojocaru, F.D.; Uritu, C.M.; Dodi, G.; Botezat, D.; Gardikiotis, I. Vibrational spectroscopy fingerprinting in medicine: From molecular to clinical practice. Materials 2019, 12, 2884. [Google Scholar] [CrossRef] [PubMed] [Green Version]
- Sakudo, A. Near-infrared spectroscopy for medical applications: Current status and future perspectives. Clin. Chim. Acta 2016, 455, 181–188. [Google Scholar] [CrossRef] [PubMed]
- Kelly, J.G.; Trevisan, J.; Scott, A.D.; Carmichael, P.L.; Pollock, H.M.; Martin-Hirsch, P.L.; Martin, F.L. Biospectroscopy to metabolically profile biomolecular structure: A multistage approach linking computational analysis with biomarkers. J. Proteome Res. 2011, 10, 1437–1448. [Google Scholar] [CrossRef]
- Baker, M.J.; Trevisan, J.; Bassan, P.; Bhargava, R.; Butler, H.J.; Dorling, K.M.; Fielden, P.R.; Fogarty, S.W.; Fullwood, N.J.; Heys, K.A.; et al. Using Fourier transform IR spectroscopy to analyze biological materials. Nat. Protoc. 2014, 9, 1771. [Google Scholar] [CrossRef] [Green Version]
- Griffiths, P.R. Fourier transform infrared spectrometry. Science 1983, 222, 297–302. [Google Scholar] [CrossRef] [PubMed] [Green Version]
- Fahrenfort, J. Attenuated total reflection: A new principle for the production of useful infra-red reflection spectra of organic compounds. Spectrochim. Acta 1961, 17, 698–709. [Google Scholar] [CrossRef]
- Roy, S.; Perez-Guaita, D.; Bowden, S.; Heraud, P.; Wood, B.R. Spectroscopy goes viral: Diagnosis of hepatitis B and C virus infection from human sera using ATR-FTIR spectroscopy. Clin. Spectrosc. 2019, 1, 100001. [Google Scholar] [CrossRef]
- Rodríguez-Casado, A.; Bartolomé, J.; Carreño, V.; Molina, M.; Carmona, P. Structural characterization of the 5′ untranslated RNA of hepatitis C virus by vibrational spectroscopy. Biophys. Chem. 2006, 124, 73–79. [Google Scholar] [CrossRef] [PubMed]
- Santos, M.C.; Nascimento, Y.M.; Monteiro, J.D.; Alves, B.E.; Melo, M.F.; Paiva, A.A.; Pereira, H.W.; Medeiros, L.G.; Morais, I.C.; Neto, J.C.F.; et al. ATR-FTIR spectroscopy with chemometric algorithms of multivariate classification in the discrimination between healthy vs. dengue vs. chikungunya vs. zika clinical samples. Anal. Methods 2018, 10, 1280–1285. [Google Scholar] [CrossRef]
- Khanmohammadi, M.; Ansari, M.; Garmarudi, A.B.; Hassanzadeh, G.; Garoosi, G. Cancer diagnosis by discrimination between normal and malignant human blood samples using attenuated total reflectance-Fourier transform infrared spectroscopy. Cancer Investig. 2007, 25, 397–404. [Google Scholar] [CrossRef] [PubMed]
- Kong, K.; Kendall, C.; Stone, N.; Notingher, I. Raman spectroscopy for medical diagnostics—From in-vitro biofluid assays to in-vivo cancer detection. Adv. Drug Deliv. Rev. 2015, 89, 121–134. [Google Scholar] [CrossRef] [Green Version]
- The Beer-Lambert Law. Available online: https://pubs.acs.org/doi/pdf/10.1021/ed039p333 (accessed on 1 June 2021).
- Cheng, J.X.; Xie, X.S. Coherent Raman Scattering Microscopy; CRC Press: Boca Raton, FL, USA, 2016. [Google Scholar]
- He, X.; Lau, E.H.; Wu, P.; Deng, X.; Wang, J.; Hao, X.; Lau, Y.C.; Wong, J.Y.; Guan, Y.; Tan, X.; et al. Temporal dynamics in viral shedding and transmissibility of COVID-19. Nat. Med. 2020, 26, 672–675. [Google Scholar] [CrossRef] [PubMed] [Green Version]
- Fajnzylber, J.; Regan, J.; Coxen, K.; Corry, H.; Wong, C.; Rosenthal, A.; Worrall, D.; Giguel, F.; Piechocka-Trocha, A.; Atyeo, C.; et al. SARS-CoV-2 viral load is associated with increased disease severity and mortality. Nat. Commun. 2020, 11, 1–9. [Google Scholar] [CrossRef]
- Khoshmanesh, A.; Dixon, M.W.; Kenny, S.; Tilley, L.; McNaughton, D.; Wood, B.R. Detection and quantification of early-stage malaria parasites in laboratory infected erythrocytes by attenuated total reflectance infrared spectroscopy and multivariate analysis. Anal. Chem. 2014, 86, 4379–4386. [Google Scholar] [CrossRef]
- Theakstone, A.G.; Rinaldi, C.; Butler, H.J.; Cameron, J.M.; Confield, L.R.; Rutherford, S.H.; Sala, A.; Sangamnerkar, S.; Baker, M.J. Fourier-transform infrared spectroscopy of biofluids: A practical approach. Transl. Biophotonics 2021, 3, e202000025. [Google Scholar] [CrossRef]
- Parachalil, D.R.; Bruno, C.; Bonnier, F.; Blasco, H.; Chourpa, I.; Baker, M.J.; McIntyre, J.; Byrne, H.J. Analysis of bodily fluids using vibrational spectroscopy: A direct comparison of Raman scattering and infrared absorption techniques for the case of glucose in blood serum. Analyst 2019, 144, 3334–3346. [Google Scholar] [CrossRef]
- Paraskevaidi, M.; Morais, C.L.; Freitas, D.L.; Lima, K.M.; Mann, D.M.; Allsop, D.; Martin-Hirsch, P.L.; Martin, F.L. Blood-based near-infrared spectroscopy for the rapid low-cost detection of Alzheimer’s disease. Analyst 2018, 143, 5959–5964. [Google Scholar] [CrossRef] [PubMed]
- Paraskevaidi, M.; Morais, C.L.; Halliwell, D.E.; Mann, D.M.; Allsop, D.; Martin-Hirsch, P.L.; Martin, F.L. Raman spectroscopy to diagnose Alzheimer’s disease and dementia with Lewy bodies in blood. ACS Chem. Neurosci. 2018, 9, 2786–2794. [Google Scholar] [CrossRef] [PubMed]
- Cameron, J.M.; Rinaldi, C.; Butler, H.J.; Hegarty, M.G.; Brennan, P.M.; Jenkinson, M.D.; Syed, K.; Ashton, K.M.; Dawson, T.P.; Palmer, D.S.; et al. Stratifying brain tumour histological sub-types: The application of ATR-FTIR serum spectroscopy in secondary care. Cancers 2020, 12, 1710. [Google Scholar] [CrossRef] [PubMed]
- Sitnikova, V.E.; Kotkova, M.A.; Nosenko, T.N.; Kotkova, T.N.; Martynova, D.M.; Uspenskaya, M.V. Breast cancer detection by ATR-FTIR spectroscopy of blood serum and multivariate data-analysis. Talanta 2020, 214, 120857. [Google Scholar] [CrossRef] [PubMed]
- Pichardo-Molina, J.; Frausto-Reyes, C.; Barbosa-García, O.; Huerta-Franco, R.; González-Trujillo, J.; Ramírez-Alvarado, C.; Gutiérrez-Juárez, G.; Medina-Gutiérrez, C. Raman spectroscopy and multivariate analysis of serum samples from breast cancer patients. Lasers Med. Sci. 2007, 22, 229–236. [Google Scholar] [CrossRef] [PubMed]
- Haka, A.S.; Shafer-Peltier, K.E.; Fitzmaurice, M.; Crowe, J.; Dasari, R.R.; Feld, M.S. Diagnosing breast cancer by using Raman spectroscopy. Proc. Natl. Acad. Sci. USA 2005, 102, 12371–12376. [Google Scholar] [CrossRef] [Green Version]
- Yang, B.; Chen, C.; Cheng, C.; Cheng, H.; Yan, Z.; Chen, F.; Zhu, Z.; Zhang, H.; Yue, F.; Lv, X. Detection of breast cancer of various clinical stages based on serum FT-IR spectroscopy combined with multiple algorithms. Photodiagn. Photodyn. Ther. 2021, 33, 102199. [Google Scholar] [CrossRef]
- Elmi, F.; Movaghar, A.F.; Elmi, M.M.; Alinezhad, H.; Nikbakhsh, N. Application of FT-IR spectroscopy on breast cancer serum analysis. Spectrochim. Acta Part A Mol. Biomol. Spectrosc. 2017, 187, 87–91. [Google Scholar] [CrossRef]
- Gajjar, K.; Trevisan, J.; Owens, G.; Keating, P.J.; Wood, N.J.; Stringfellow, H.F.; Martin-Hirsch, P.L.; Martin, F.L. Fourier-transform infrared spectroscopy coupled with a classification machine for the analysis of blood plasma or serum: A novel diagnostic approach for ovarian cancer. Analyst 2013, 138, 3917–3926. [Google Scholar] [CrossRef]
- Theakstone, A.G.; Brennan, P.M.; Jenkinson, M.D.; Mills, S.J.; Syed, K.; Rinaldi, C.; Xu, Y.; Goodacre, R.; Butler, H.J.; Palmer, D.S.; et al. Rapid spectroscopic liquid biopsy for the universal detection of brain tumours. Cancers 2021, 13, 3851. [Google Scholar] [CrossRef]
- Hands, J.R.; Abel, P.; Ashton, K.; Dawson, T.; Davis, C.; Lea, R.W.; McIntosh, A.J.; Baker, M.J. Investigating the rapid diagnosis of gliomas from serum samples using infrared spectroscopy and cytokine and angiogenesis factors. Anal. Bioanal. Chem. 2013, 405, 7347–7355. [Google Scholar] [CrossRef] [PubMed]
- Kaznowska, E.; Depciuch, J.; Łach, K.; Kołodziej, M.; Koziorowska, A.; Vongsvivut, J.; Zawlik, I.; Cholewa, M.; Cebulski, J. The classification of lung cancers and their degree of malignancy by FTIR, PCA-LDA analysis, and a physics-based computational model. Talanta 2018, 186, 337–345. [Google Scholar] [CrossRef] [PubMed]
- Lewis, P.D.; Lewis, K.E.; Ghosal, R.; Bayliss, S.; Lloyd, A.J.; Wills, J.; Godfrey, R.; Kloer, P.; Mur, L.A. Evaluation of FTIR spectroscopy as a diagnostic tool for lung cancer using sputum. BMC Cancer 2010, 10, 1–10. [Google Scholar] [CrossRef] [Green Version]
- Jeng, M.J.; Sharma, M.; Sharma, L.; Chao, T.Y.; Huang, S.F.; Chang, L.B.; Wu, S.L.; Chow, L. Raman spectroscopy analysis for optical diagnosis of oral cancer detection. J. Clin. Med. 2019, 8, 1313. [Google Scholar] [CrossRef]
- Giamougiannis, P.; Morais, C.L.; Rodriguez, B.; Wood, N.J.; Martin-Hirsch, P.L.; Martin, F.L. Detection of ovarian cancer (±neo-adjuvant chemotherapy effects) via ATR-FTIR spectroscopy: Comparative analysis of blood and urine biofluids in a large patient cohort. Anal. Bioanal. Chem. 2021, 1–13. [Google Scholar] [CrossRef]
- Paraskevaidi, M.; Ashton, K.M.; Stringfellow, H.F.; Wood, N.J.; Keating, P.J.; Rowbottom, A.W.; Martin-Hirsch, P.L.; Martin, F.L. Raman spectroscopic techniques to detect ovarian cancer biomarkers in blood plasma. Talanta 2018, 189, 281–288. [Google Scholar] [CrossRef]
- Baker, M.J.; Gazi, E.; Brown, M.D.; Shanks, J.H.; Gardner, P.; Clarke, N.W. FTIR-based spectroscopic analysis in the identification of clinically aggressive prostate cancer. Br. J. Cancer 2008, 99, 1859–1866. [Google Scholar] [CrossRef] [PubMed] [Green Version]
- Naseer, K.; Ali, S.; Mubarik, S.; Hussain, I.; Mirza, B.; Qazi, J. FTIR spectroscopy of freeze-dried human sera as a novel approach for dengue diagnosis. Infrared Phys. Technol. 2019, 102, 102998. [Google Scholar] [CrossRef]
- Patel, S.K.; Rajora, N.; Kumar, S.; Sahu, A.; Kochar, S.K.; Krishna, C.M.; Srivastava, S. Rapid Discrimination of malaria-and dengue-infected patients sera using Raman spectroscopy. Anal. Chem. 2019, 91, 7054–7062. [Google Scholar] [CrossRef] [PubMed]
- Tong, D.; Chen, C.; Zhang, J.; Lv, G.; Zheng, X.; Zhang, Z.; Lv, X. Application of Raman spectroscopy in the detection of hepatitis B virus infection. Photodiagn. Photodyn. Ther. 2019, 28, 248–252. [Google Scholar] [CrossRef]
- Saleem, M.; Ali, S.; Khan, M.B.; Amin, A.; Bilal, M.; Nawaz, H.; Hassan, M. Optical diagnosis of hepatitis B virus infection in blood plasma using Raman spectroscopy and chemometric techniques. J. Raman Spectrosc. 2020, 51, 1067–1077. [Google Scholar] [CrossRef]
- Saade, J.; Pacheco, M.T.T.; Rodrigues, M.R.; Silveira, L., Jr. Identification of hepatitis C in human blood serum by near-infrared Raman spectroscopy. Spectroscopy 2008, 22, 387–395. [Google Scholar] [CrossRef]
- Scaglia, E.; Sockalingum, G.D.; Schmitt, J.; Gobinet, C.; Schneider, N.; Manfait, M.; Thiéfin, G. Noninvasive assessment of hepatic fibrosis in patients with chronic hepatitis C using serum Fourier transform infrared spectroscopy. Anal. Bioanal. Chem. 2011, 401, 2919. [Google Scholar] [CrossRef] [PubMed]
- Pizarro, C.; Esteban-Díez, I.; Arenzana-Rámila, I.; González-Sáiz, J.M. Discrimination of patients with different serological evolution of HIV and co-infection with HCV using metabolic fingerprinting based on Fourier transform infrared. J. Biophotonics 2018, 11, e201700035. [Google Scholar] [CrossRef] [PubMed]
- Silva, L.G.; Péres, A.F.; Freitas, D.L.; Morais, C.L.; Martin, F.L.; Crispim, J.C.; Lima, K.M. ATR-FTIR spectroscopy in blood plasma combined with multivariate analysis to detect HIV infection in pregnant women. Sci. Rep. 2020, 10, 20156. [Google Scholar] [CrossRef]
- Bernardes-Oliveira, E.; de Freitas, D.L.D.; de Morais, C.d.L.M.; de Mesquita Cornetta, M.D.C.; Camargo, J.D.d.A.S.; de Lima, K.M.G.; de Oliveira Crispim, J.C. Spectrochemical differentiation in gestational diabetes mellitus based on attenuated total reflection Fourier-transform infrared (ATR-FTIR) spectroscopy and multivariate analysis. Sci. Rep. 2020, 10, 19259. [Google Scholar] [CrossRef]
- Sakudo, A.; Baba, K.; Ikuta, K. Discrimination of influenza virus-infected nasal fluids by Vis-NIR spectroscopy. Clin. Chim. Acta 2012, 414, 130–134. [Google Scholar] [CrossRef]
- Fan, M.; Liu, X.; Yu, X.; Cui, X.; Cai, W.; Shao, X. Near-infrared spectroscopy and chemometric modelling for rapid diagnosis of kidney disease. Sci. China Chem. 2017, 60, 299–304. [Google Scholar] [CrossRef]
- Barauna, V.G.; Singh, M.N.; Barbosa, L.L.; Marcarini, W.D.; Vassallo, P.F.; Mill, J.G.; Ribeiro-Rodrigues, R.; Campos, L.C.; Warnke, P.H.; Martin, F.L. Ultrarapid On-Site Detection of SARS-CoV-2 Infection Using Simple ATR-FTIR Spectroscopy and an Analysis Algorithm: High Sensitivity and Specificity. Anal. Chem. 2021, 93, 2950–2958. [Google Scholar] [CrossRef]
- Carlomagno, C.; Bertazioli, D.; Gualerzi, A.; Picciolini, S.; Banfi, P.I.; Lax, A.; Bedoni, M. COVID-19 salivary Raman fingerprint: Innovative approach for the detection of current and past SARS-CoV-2 infections. Sci. Rep. 2021, 11, 4943. [Google Scholar] [CrossRef]
- Mina, M.J.; Parker, R.; Larremore, D.B. Rethinking Covid-19 test sensitivity—A strategy for containment. N. Engl. J. Med. 2020, 383, e120. [Google Scholar] [CrossRef] [PubMed]
- Mina, M.J.; Andersen, K.G. COVID-19 testing: One size does not fit all. Science 2021, 371, 126–127. [Google Scholar] [CrossRef] [PubMed]
- Morais, C.L.; Lima, K.M.; Singh, M.; Martin, F.L. Tutorial: Multivariate classification for vibrational spectroscopy in biological samples. Nat. Protoc. 2020, 15, 2143–2162. [Google Scholar] [CrossRef] [PubMed]
- Santos, M.C.; Morais, C.L.; Nascimento, Y.M.; Araujo, J.M.; Lima, K.M. Spectroscopy with computational analysis in virological studies: A decade (2006–2016). TrAC Trends Anal. Chem. 2017, 97, 244–256. [Google Scholar] [CrossRef]
- Ralbovsky, N.M.; Lednev, I.K. Towards development of a novel universal medical diagnostic method: Raman spectroscopy and machine learning. Chem. Soc. Rev. 2020, 49, 7428–7453. [Google Scholar] [CrossRef] [PubMed]
- Evans, C.L.; Xie, X.S. Coherent anti-Stokes Raman scattering microscopy: Chemical imaging for biology and medicine. Annu. Rev. Anal. Chem. 2008, 1, 883–909. [Google Scholar] [CrossRef] [PubMed] [Green Version]
- Freudiger, C.W.; Min, W.; Saar, B.G.; Lu, S.; Holtom, G.R.; He, C.; Tsai, J.C.; Kang, J.X.; Xie, X.S. Label-free biomedical imaging with high sensitivity by stimulated Raman scattering microscopy. Science 2008, 322, 1857–1861. [Google Scholar] [CrossRef] [Green Version]
- Lambert, P.J.; Whitman, A.G.; Dyson, O.F.; Akula, S.M. Raman spectroscopy: The gateway into tomorrow’s virology. Virol. J. 2006, 3, 51. [Google Scholar] [CrossRef] [Green Version]
- Austin, L.A.; Osseiran, S.; Evans, C.L. Raman technologies in cancer diagnostics. Analyst 2016, 141, 476–503. [Google Scholar] [CrossRef]
- Moore, T.J.; Moody, A.S.; Payne, T.D.; Sarabia, G.M.; Daniel, A.R.; Sharma, B. In vitro and in vivo SERS biosensing for disease diagnosis. Biosensors 2018, 8, 46. [Google Scholar] [CrossRef] [Green Version]
- Zong, C.; Xu, M.; Xu, L.J.; Wei, T.; Ma, X.; Zheng, X.S.; Hu, R.; Ren, B. Surface-enhanced Raman spectroscopy for bioanalysis: Reliability and challenges. Chem. Rev. 2018, 118, 4946–4980. [Google Scholar] [CrossRef]
- Henry, A.I.; Sharma, B.; Cardinal, M.F.; Kurouski, D.; Duyne, R.P.V. Surface-Enhanced Raman Spectroscopy Biosensing: Vivo Diagn. Multimodal Imaging. Anal. Chem. 2016, 88, 6638–6647. [Google Scholar] [CrossRef] [PubMed]
- Hermann, P.; Hermelink, A.; Lausch, V.; Holland, G.; Möller, L.; Bannert, N.; Naumann, D. Evaluation of tip-enhanced Raman spectroscopy for characterizing different virus strains. Analyst 2011, 136, 1148–1152. [Google Scholar] [CrossRef]
- Lim, J.Y.; Nam, J.S.; Shin, H.; Park, J.; Song, H.I.; Kang, M.; Lim, K.I.; Choi, Y. Identification of newly emerging influenza viruses by detecting the virally infected cells based on surface enhanced Raman spectroscopy and principal component analysis. Anal. Chem. 2019, 91, 5677–5684. [Google Scholar] [CrossRef] [PubMed]
- Cialla, D.; Deckert-Gaudig, T.; Budich, C.; Laue, M.; Möller, R.; Naumann, D.; Deckert, V.; Popp, J. Raman to the limit: Tip-enhanced Raman spectroscopic investigations of a single tobacco mosaic virus. J. Raman Spectrosc. Int. J. Orig. Work All Asp. Raman Spectrosc. Incl. High. Order Process. Also Brillouin Rayleigh Scatt. 2009, 40, 240–243. [Google Scholar] [CrossRef]
- Gootenberg, J.S.; Abudayyeh, O.O.; Lee, J.W.; Essletzbichler, P.; Dy, A.J.; Joung, J.; Verdine, V.; Donghia, N.; Daringer, N.M.; Freije, C.A.; et al. Nucleic acid detection with CRISPR-Cas13a/C2c2. Science 2017, 356, 438–442. [Google Scholar] [CrossRef] [PubMed] [Green Version]
- Sadat Mousavi, P.; Smith, S.J.; Chen, J.B.; Karlikow, M.; Tinafar, A.; Robinson, C.; Liu, W.; Ma, D.; Green, A.A.; Kelley, S.O.; et al. A multiplexed, electrochemical interface for gene-circuit-based sensors. Nat. Chem. 2020, 12, 48–55. [Google Scholar] [CrossRef]
- Rath, D.; Amlinger, L.; Rath, A.; Lundgren, M. The CRISPR-Cas immune system: Biology, mechanisms and applications. Biochimie 2015, 117, 119–128. [Google Scholar] [CrossRef]
- Bruch, R.; Baaske, J.; Chatelle, C.; Meirich, M.; Madlener, S.; Weber, W.; Dincer, C.; Urban, G.A. CRISPR/Cas13a-Powered Electrochemical Microfluidic Biosensor for Nucleic Acid Amplification-Free miRNA Diagnostics. Adv. Mater. 2019, 31, 1905311. [Google Scholar] [CrossRef] [PubMed] [Green Version]
- Anzalone, A.V.; Koblan, L.W.; Liu, D.R. Genome editing with CRISPR–Cas nucleases, base editors, transposases and prime editors. Nat. Biotechnol. 2020, 38, 824–844. [Google Scholar] [CrossRef]
- Ding, X.; Yin, K.; Li, Z.; Lalla, R.V.; Ballesteros, E.; Sfeir, M.M.; Liu, C. Ultrasensitive and visual detection of SARS-CoV-2 using all-in-one dual CRISPR-Cas12a assay. Nat. Commun. 2020, 11, 1–10. [Google Scholar] [CrossRef]
- Ackerman, C.M.; Myhrvold, C.; Thakku, S.G.; Freije, C.A.; Metsky, H.C.; Yang, D.K.; Simon, H.Y.; Boehm, C.K.; Kosoko-Thoroddsen, T.S.F.; Kehe, J.; et al. Massively multiplexed nucleic acid detection with Cas13. Nature 2020, 582, 277–282. [Google Scholar] [CrossRef]
- Kellner, M.J.; Koob, J.G.; Gootenberg, J.S.; Abudayyeh, O.O.; Zhang, F. SHERLOCK: Nucleic acid detection with CRISPR nucleases. Nat. Protoc. 2019, 14, 2986–3012. [Google Scholar] [CrossRef] [PubMed]
- Patchsung, M.; Jantarug, K.; Pattama, A.; Aphicho, K.; Suraritdechachai, S.; Meesawat, P.; Sappakhaw, K.; Leelahakorn, N.; Ruenkam, T.; Wongsatit, T.; et al. Clinical validation of a Cas13-based assay for the detection of SARS-CoV-2 RNA. Nat. Biomed. Eng. 2020, 4, 1140–1149. [Google Scholar] [CrossRef] [PubMed]
- Bonini, A.; Poma, N.; Vivaldi, F.V.; Kirchhain, A.; Salvo, P.; Bottai, D.; Tavanti, A.; Di Francesco, F. Advances in biosensing: The CRISPR/Cas system as a new powerful tool for the detection of nucleic acids. J. Pharm. Biomed. Anal. 2021, 192, 113645. [Google Scholar] [CrossRef] [PubMed]
- Layouni, R.; Dubrovsky, M.; Bao, M.; Chung, H.; Du, K.; Boriskina, S.V.; Weiss, S.M.; Vermeulen, D. High contrast cleavage detection for enhancing porous silicon sensor sensitivity. Opt. Express 2021, 29, 1. [Google Scholar] [CrossRef] [PubMed]
- Liu, L.; Dubrovsky, M.; Gundavarapu, S.; Vermeulen, D.; Du, K. Viral nucleic acid detection with CRISPR-Cas12a using high contrast cleavage detection on micro-ring resonator biosensors. SPIE-Int. Soc. Opt. Eng. 2021, 11662, 8. [Google Scholar] [CrossRef]
- Dubrovsky, M.; Blevins, M.; Boriskina, S.V.; Vermeulen, D. High Contrast Cleavage Detection. Opt. Lett. 2021, 46, 2593–2596. [Google Scholar] [CrossRef]
- Chung, H.; Boriskina, S.V. Inverse design of a single-frequency diffractive biosensor based on the reporter cleavage detection mechanism. Opt. Express 2021, 29, 10780. [Google Scholar] [CrossRef]
- Turk, N.; Raza, A.; Wuytens, P.; Demol, H.; Daele, M.V.; Detavernier, C.; Skirtach, A.; Gevaert, K.; Baets, R. Waveguide-based surface-enhanced Raman spectroscopy detection of protease activity using non-natural aromatic amino acids. Biomed. Opt. Express 2020, 11, 4800. [Google Scholar] [CrossRef]
- Juan-Colás, J.; Parkin, A.; Dunn, K.E.; Scullion, M.G.; Krauss, T.F.; Johnson, S.D. The electrophotonic silicon biosensor. Nat. Commun. 2016, 7, 1–7. [Google Scholar] [CrossRef] [PubMed] [Green Version]
- Blevins, M.G.; Michel, A.P.M.; Boriskina, S.V. Planar nanophotonic structures for intensity based readout refractive index sensing applied to dissolved methane detection. OSA Contin. 2020, 3, 3556. [Google Scholar] [CrossRef]
- Nazirizadeh, Y.; Bog, U.; Sekula, S.; Mappes, T.; Lemmer, U.; Gerken, M. Low-cost label-free biosensors using photonic crystals embedded between crossed polarizers. Opt. Express 2010, 18, 19120. [Google Scholar] [CrossRef]
- Lin, Y.C.; Hsieh, W.H.; Chau, L.K.; Chang, G.E. Intensity-detection-based guided-mode-resonance optofluidic biosensing system for rapid, low-cost, label-free detection. Sens. Actuators B Chem. 2017, 250, 659–666. [Google Scholar] [CrossRef]
- Kim, D.C.; Hermerschmidt, A.; Dyachenko, P.; Scharf, T. Inverse design and demonstration of high-performance wide-angle diffractive optical elements. Opt. Express 2020, 28, 22321. [Google Scholar] [CrossRef]
- Liu, Z.; Zhu, D.; Raju, L.; Cai, W. Tackling Photonic Inverse Design with Machine Learning. Adv. Sci. 2021, 8, 2002923. [Google Scholar] [CrossRef]
- Chung, H.; Miller, O.D. High-NA achromatic metalenses by inverse design. Opt. Express 2019, 28, 6945–6965. [Google Scholar] [CrossRef]
- Colburn, S.; Majumdar, A. Inverse design and flexible parameterization of meta-optics using algorithmic differentiation. Commun. Phys. 2021, 4, 1–11. [Google Scholar] [CrossRef]
- Ma, W.; Liu, Z.; Kudyshev, Z.A.; Boltasseva, A.; Cai, W.; Liu, Y. Deep learning for the design of photonic structures. Nat. Photonics 2021, 15, 77–90. [Google Scholar] [CrossRef]
Figure 1.
Different detection mechanisms used in bio(chemical)sensors with optical signal readout. (a) Target-capture based detection provides selectivity via the use of target-specific receptors (such as antibodies or aptamers) and sensitivity via the use of resonant photonic structures for optical signal amplification. (b) Spectroscopic label-free detection provides selectivity by using the native vibrational or fluorescence spectra of the target material and often uses polaritonic surface-mode enhancement mechanisms to increase sensitivity. (c) Reporter-release-based detection (illustrated here with an example of the RT-PCR technique) typically provides selectivity via a target-activated release of fluorescent reporters and relies on biological target amplification to increase sensitivity.

Figure 2.
Examples of affinity-type refractometric optical biosensors. (a) In planar interferometers, target molecules are captured either by surface-anchored receptors (above) or are absorbed into a permeable layer (below). In both cases, the presence of target molecules shifts the interferometric reflectance pattern, which is a result of the interference of reflected light from the front and back interface of the layer. (b) In ellipsometric measurements, both the intensity and phase of reflected light is monitored for s- and p-polarized excitation, enabling higher detection sensitivity at the expense of detector cost and complexity. (c) In guided-wave sensors, such as surface plasmon polariton resonance sensors, light is trapped and guided along the surface or within a thin layer, increasing the local electric field near captured target molecules. Light can couple to the guided mode via a prism or, in an optical fiber, light is coupled to the guided mode via a tilted fiber Bragg grating [43]. (d) In integrated interferometers, light is split between the sensing arm (above) and a reference arm (below) and recombined to create a transmitted interference spectrum, which shifts due to the target capture. (e) Microcavity resonators provide optical amplification by re-circulating optical energy in the form of high-quality trapped modes, such as whispering gallery modes. Light traveling through the bus waveguide interferes constructively or destructively with the microcavity resonant modes, creating narrow transmittance dips in the transmission spectrum whose spectral positions can be monitored for detection. Here, a microring resonator is shown. Defects in photonic crystals can also form resonators, such as the illustrated 1-dimensional photonic crystal structure with a defect layer in the middle. The defect layer creates a resonance in the reflectance spectrum of the structure, which can track with target concentration [55]. Here, the transmittance spectrum is shown for the microring cavity, while the transmittance of the photonic crystal would depend upon the number of resonant modes supported in the defect layer. (f) In diffractive-type sensors, incident light is diffracted in certain angles depending on the surface coverage of target molecules. The angle-specific intensity of reflectance can be monitored to measure the concentration of target molecules.

Figure 3.
An example of the detection process for a spectroscopy-based detector. After sample collection, the sample is prepared to be analyzed. This preparation, which can be minimal, depends on the spectroscopic technique, type of sample, and probing mechanism. The prepared sample is measured, and its spectrum is obtained. The spectrum is then classified as positive or negative depending on the pre-build classification model. Oftentimes, pre-processing (e.g., background subtraction) of the raw spectrum is necessary. The final outcome is a decision (i.e., positive/negative), which depends on an pre-established threshold.

Figure 4.
Cleavage-based detection utilizing the biological recognition and collateral cleavage amplification capabilities of CRISPR–Cas complexes. The signal readout can be either fluorescence-based (left) or a lateral flow readout of molecular weight, often with reporter complexes, such as FAM–biotin (right).

Figure 5.
High-Q [184] (a) and low-Q [185] (b) photonic biosensors designed to operate in the cleavage-based detection regime, which can combine optical signal amplification with the biological recognition and collateral cleavage amplification capabilities of CRISPR–Cas complexes. (a) Cleavage and removal of multiple nanoparticle probes from the sensor surface per each target molecule may result in a large spectral shift. Multiple probes attached to a resonant elements, such as the microresonator, can degrade its quality factor and need to be chosen properly. (b) Photonic biosensors utilizing low-Q structures, such as a diffractive biosensor shown here, can be engineered to exhibit switchable behavior activated by the probe cleavage event. The diffracted field patterns illustrate the system switching from the second-order diffraction to the zeroth-order diffraction regime as as result of the cleavage.


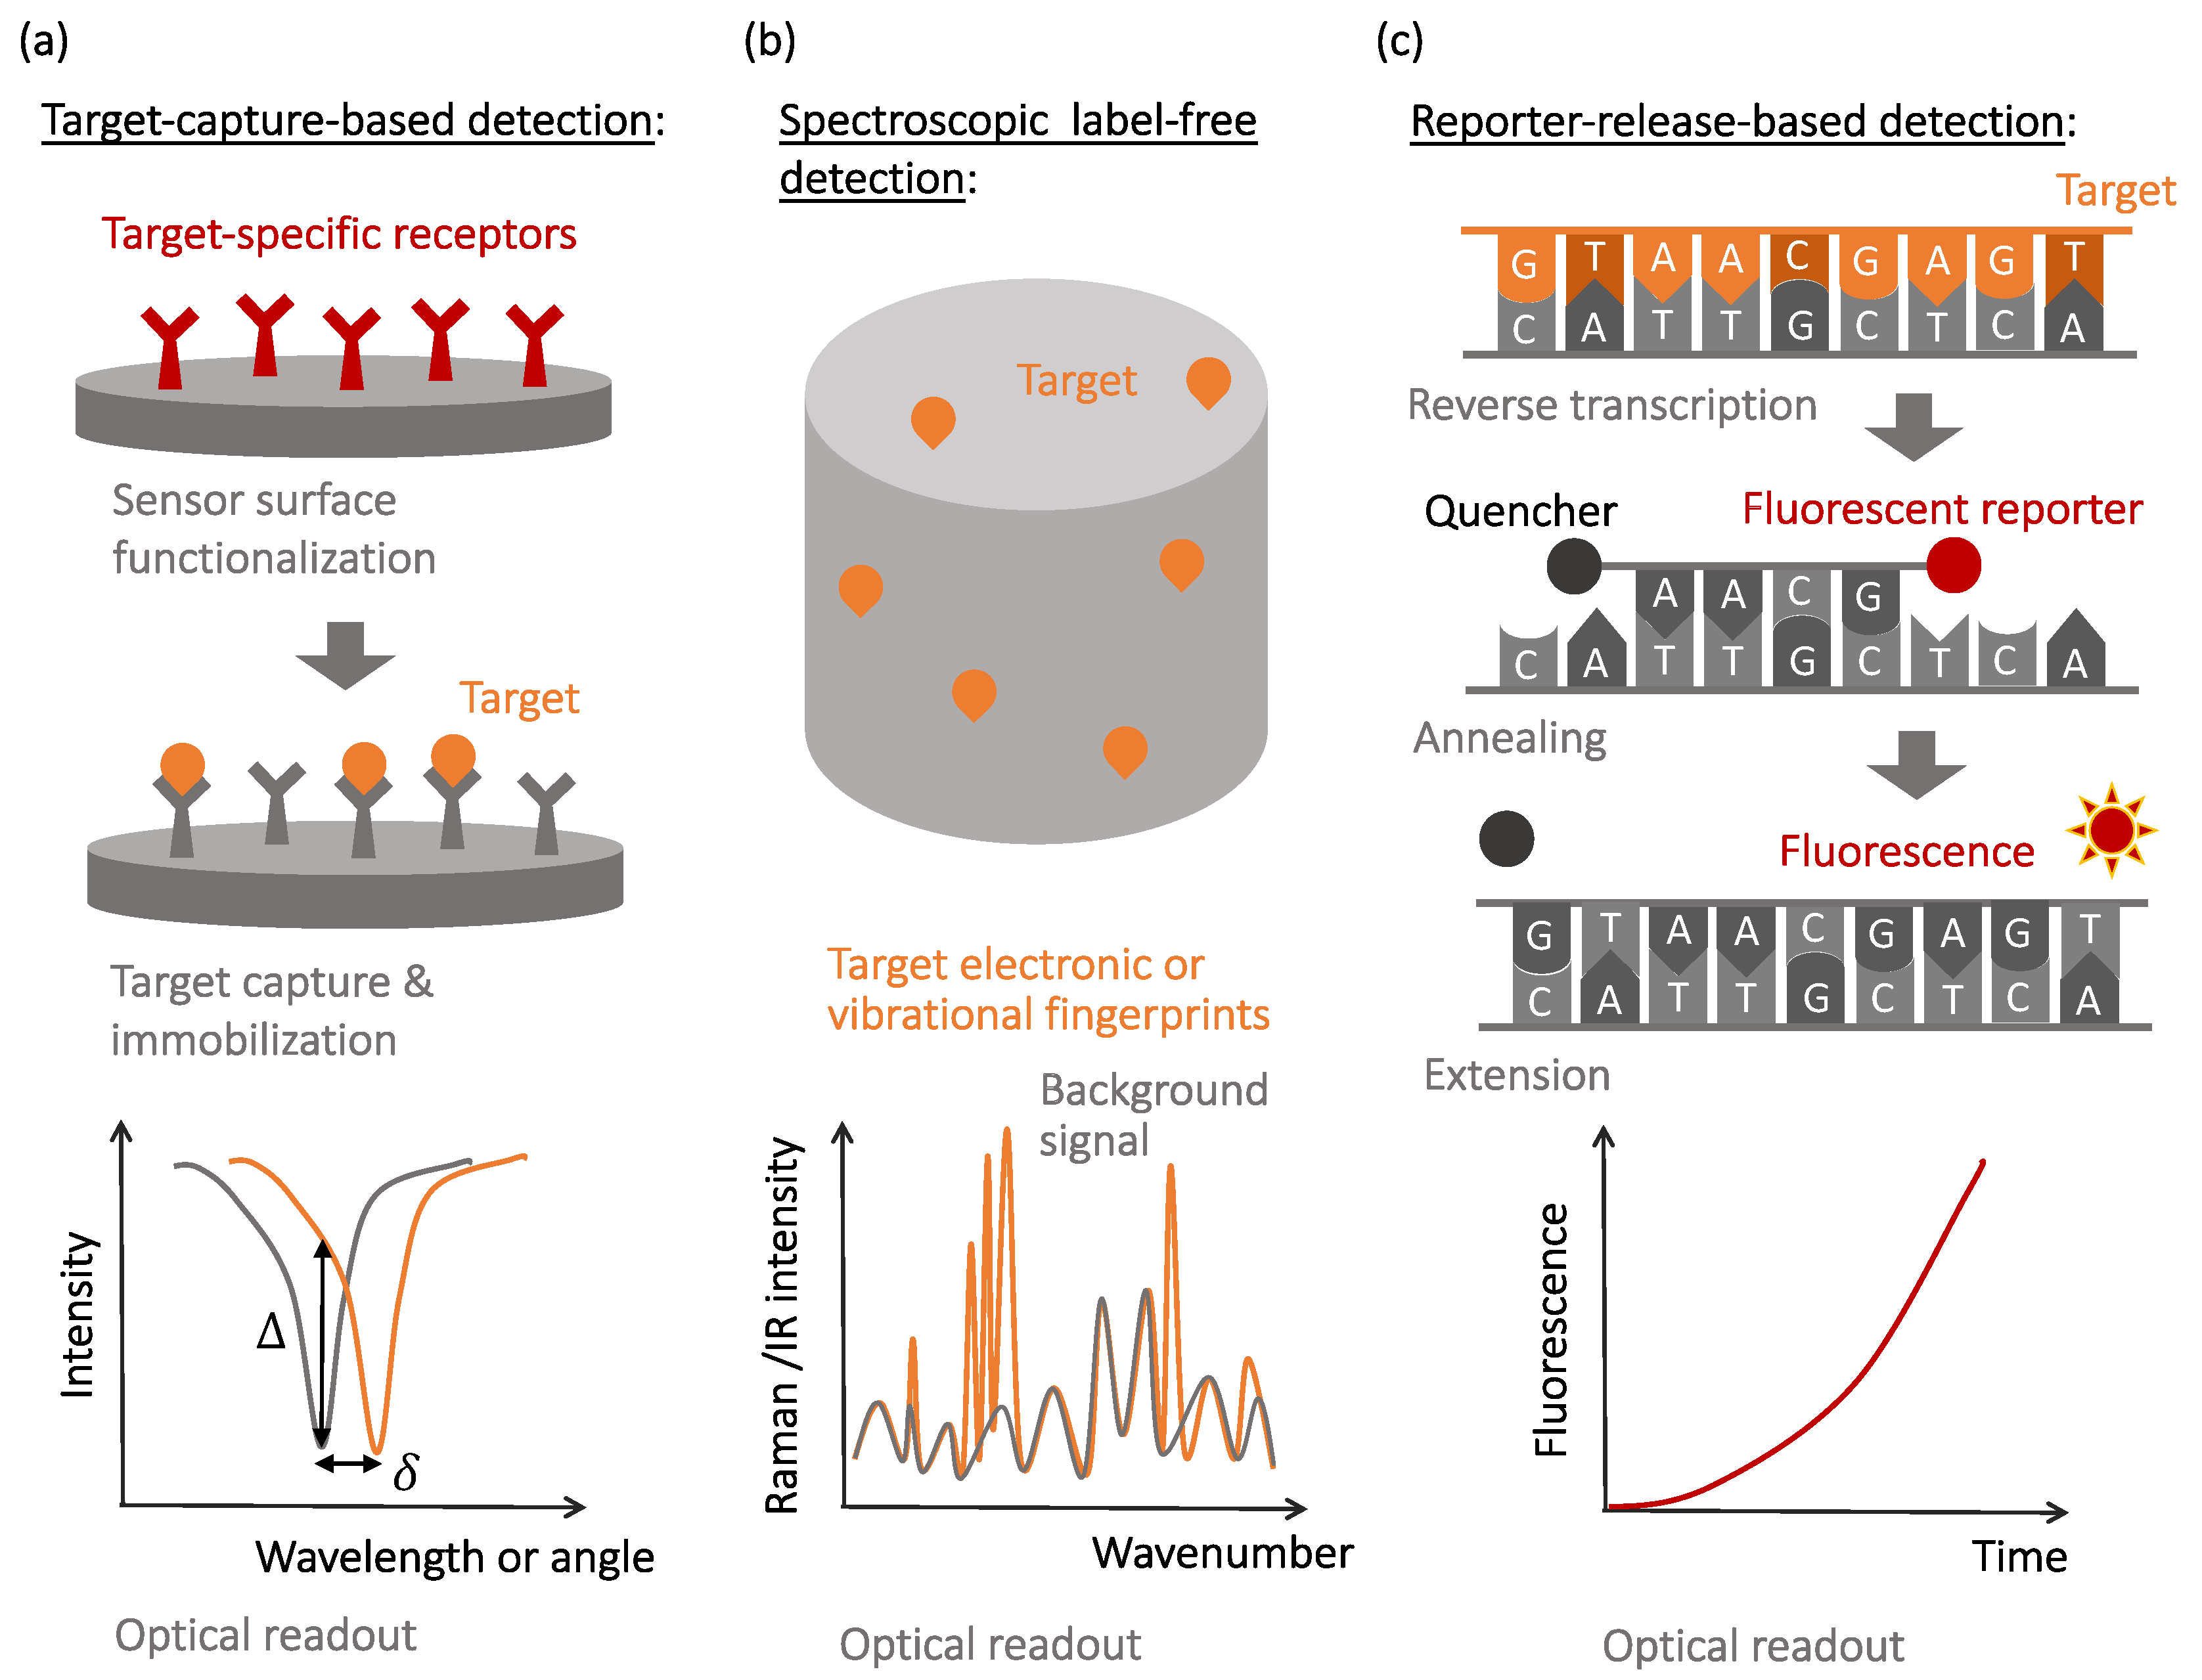
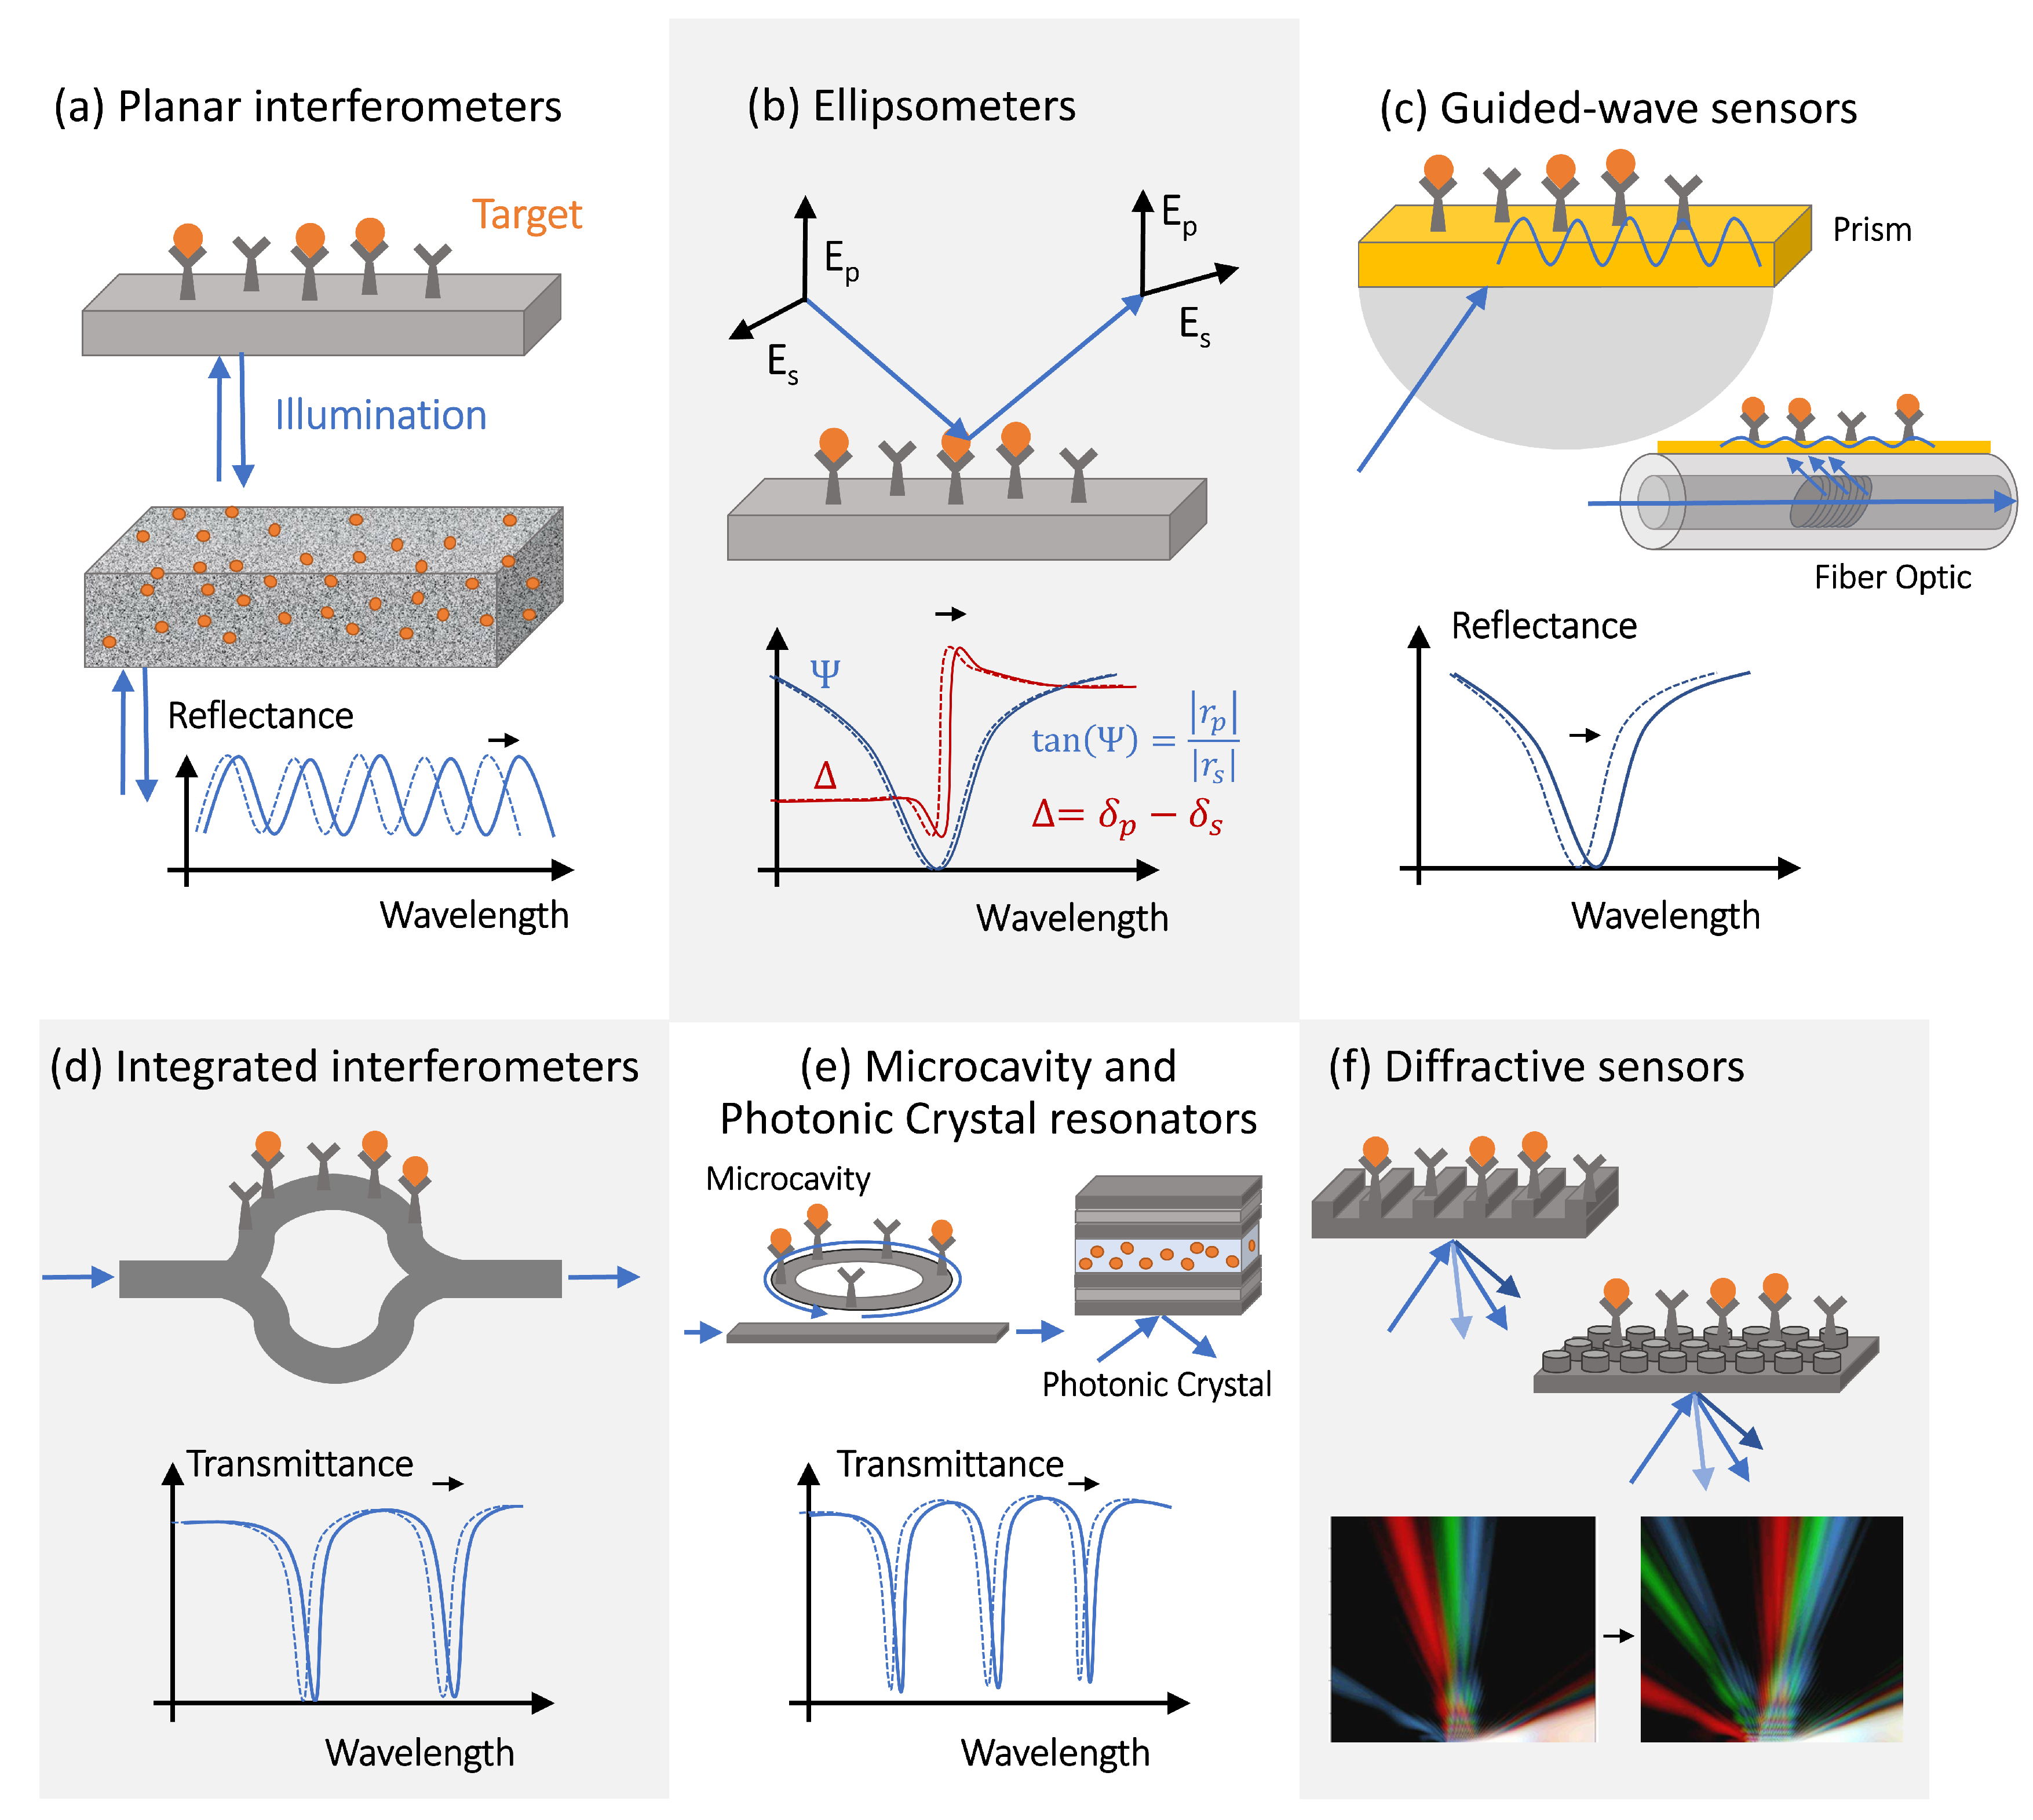
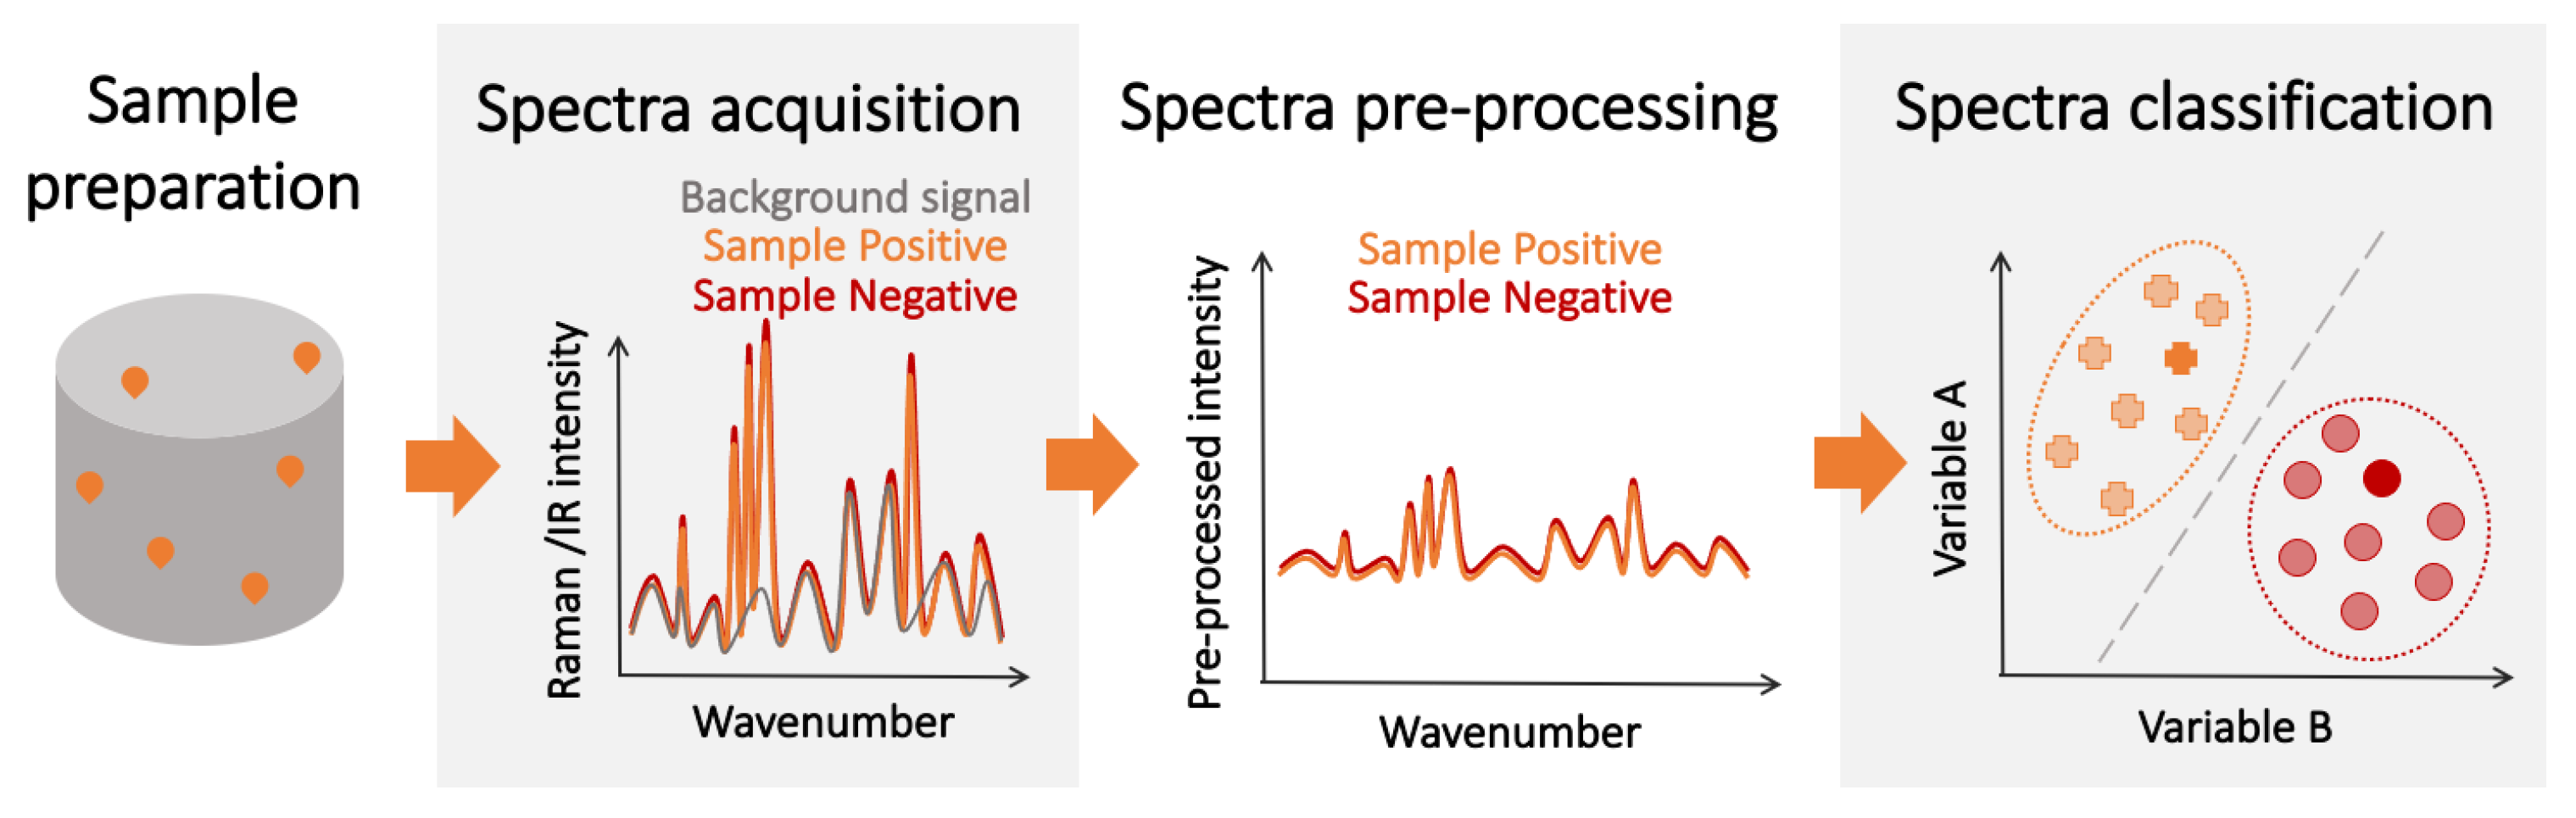
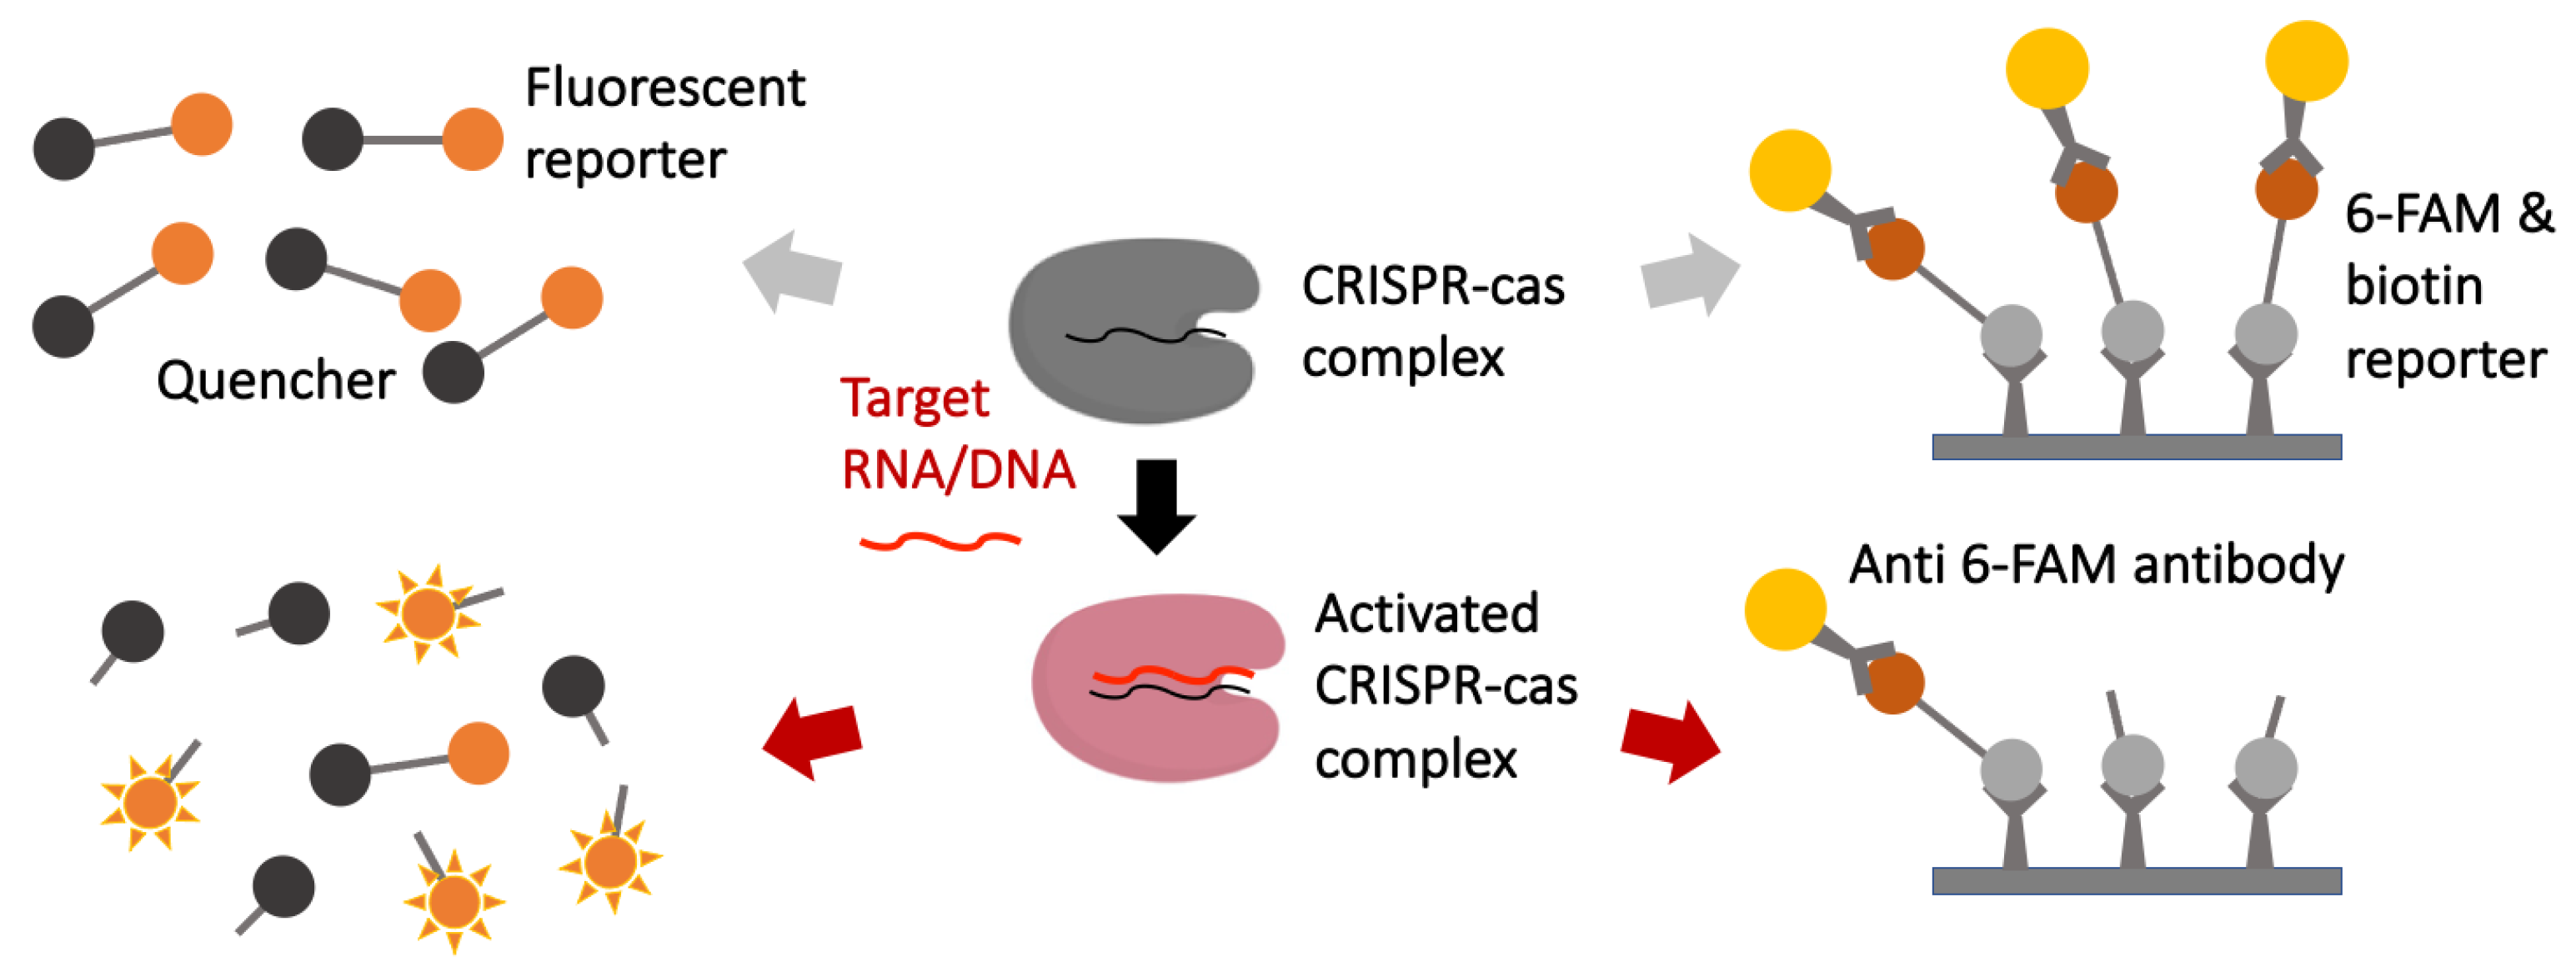
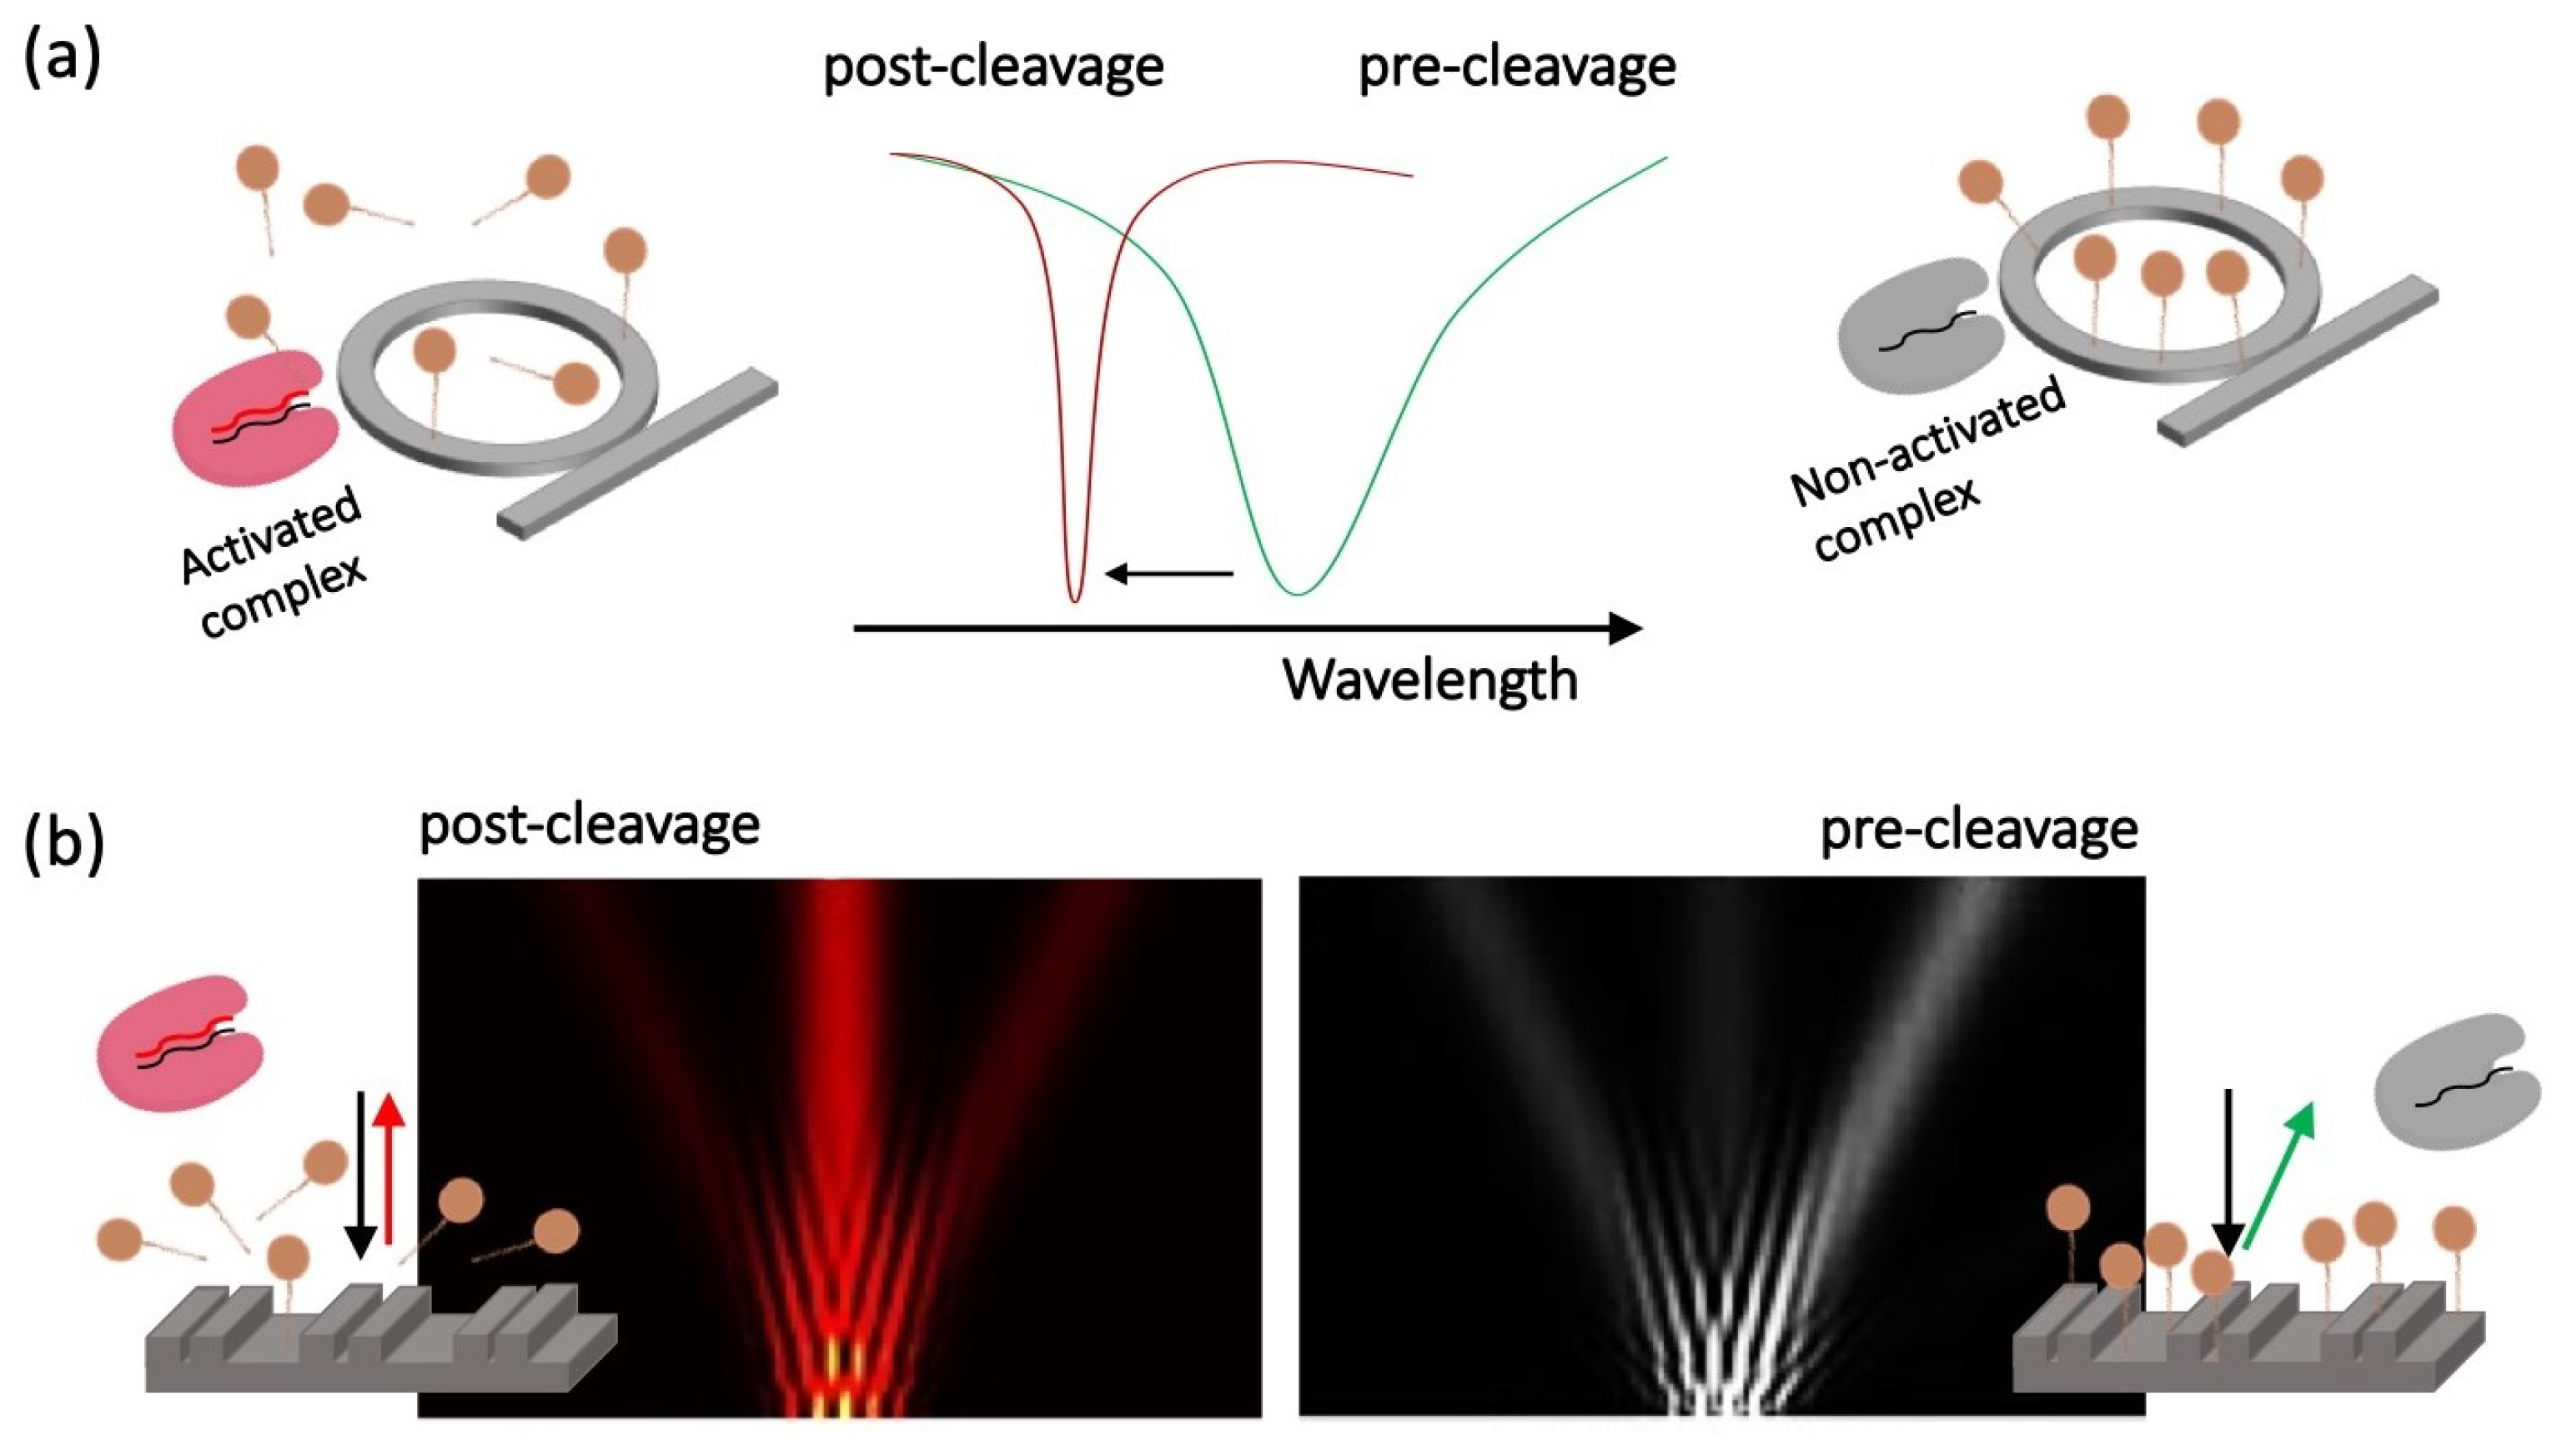
Table 1.
The reported performance of a selection of vibrational-spectroscopy-based detectors for the detection of several pathogens. Due to the slight differences in metric definitions and computations among groups, the reported performances are not directly comparable among techniques and diseases. Thus, the information contained in this table is not to compare the different methodologies but rather to provide an overall figure of merit of the potential and capabilities of these techniques for the detection of a variety pathogens.
| Pathogen/Disease | Sample Type | Spectroscopic Technique | Sensitivity | Specificity | Accuracy | Population (Prevalence) | Ref. |
|---|---|---|---|---|---|---|---|
| Alzheimer’s Disease | Blood (plasma) | NIR | 87.5% | 96.1% | 92.8% | 277 (39%) | [127] |
| Alzheimer’s Disease-DLB | Blood (plasma) | Raman | 81–90% | 77–93% | - | 56 (-) | [128] |
| Cancer (various) | Blood (whole) | MIR | - | - | 90% | 43 (40%) | [118] |
| Cancer (brain) | Blood (serum) | MIR | 95.5% | 94.9% | - | 183 (52%) | [129] |
| Cancer (breast) | Blood (serum) | MIR | 92.3% | 87.1% | 89.3% | 146 (45%) | [130] |
| Cancer (breast) | Blood (serum) | Raman | 97% | 78% | - | 23 (48%) | [131] |
| Cancer (breast) | Tissue | Raman | 94% | 96% | - | 130 (-) | [132] |
| Cancer (breast) | Blood (serum) | MIR | >85% | - | 223 (49%) | [133] | |
| Cancer (cervical) | Blood (serum) | Raman | 100% | 97.1% | - | 42 (53%) | [134] |
| Cancer (colorectal) | Tissue | MIR | 81.4% | 92.7% | - | 88 (54%) | [134] |
| Cancer (endometrial) | Blood (serum) | MIR | - | - | 82.0% | 60 (50%) | [135] |
| Cancer (Glioma) | Blood (serum) | MIR | 98.5% | 95.1% | 96.8% | 265 (33%) | [136] |
| Cancer (Glioma) | Blood (serum) | MIR | 87.5% | 100% | - | 74 (66%) | [137] |
| Cancer (lung) | Tissue | MIR | 78–99% | 65–99% | - | 38 (-) | [138] |
| Cancer (lung) | Sputum | MIR | 100% | 92.0 | - | 50 (50%) | [139] |
| Cancer (oral) | Tissue | Raman | 90.9% | 83.3% | 87.5% | 80 (55%) | [140] |
| Cancer (ovarian) | Blood (serum) | MIR | 76% | 98% | 94% | 378 (19%) | [141] |
| Cancer (ovarian) | Blood (serum) | MIR | - | - | 95% | 60 (50.5%) | [135] |
| Cancer (ovarian) | Blood (serum) | Raman | 94 | 96 | 95% | 55 (49%) | [142] |
| Cancer (ovarian) | Blood (plasma) | MIR | 71% | 84% | 81% | 378 (19%) | [141] |
| Cancer (prostate) | Tissue | MIR | 92.3% | 99.4% | - | 40 (-) | [143] |
| Dengue, Zika, Chikungunya | Blood (whole) | MIR | 98% | 0.98% | 0.98% | 130 (65%) | [117] |
| Dengue | Blood (serum) | MIR | 87.5% | 95.0% | 90.5% | 77 (74%) | [144] |
| Dengue | Blood (plasma) | Raman | 97.38–97.95% | 86.18–95.40% | - | 34 (50%) | [145] |
| Dengue-Malaria | Blood (serum) | Raman | 83.3% | 100% | - | 44 (-) | [145] |
| Hepatitis (B-C) | Blood (serum) | MIR | 77.3–79.6% | 85.1–76.2% | - | 497 (62%) | [115] |
| Hepatitis (B) | Blood (serum) | MIR | 84.3% | 91.3% | - | 333 (44%) | [115] |
| Hepatitis (B) | Blood (serum) | Raman | 100% | 88.0% | 93.1 | 1000 (50%) | [146] |
| Hepatitis (B) | Blood (plasma) | Raman | 98.9% | 98.8% | 98.8 | 34 (29%) | [147] |
| Hepatitis (C) | Blood (serum) | MIR | 77.2% | 92.3% | - | 345 (48%) | [115] |
| Hepatitis (C) | Blood (serum) | Raman | 92% | 88% | - | 29 (41%) | [148] |
| Hepatic fibrosis | Blood (serum) | MIR | 95.2% | 100% | 97.5% | 23 (52%) | [149] |
| HIV-HCV | Blood (plasma) | MIR | - | 100% | 93.7% | 72 (73%) | [150] |
| HIV | Blood (serum) | MIR | 83% | 92% | - | 120 (33%) | [151] |
| GDM | Blood (serum) | MIR | 100% | 100% | 100% | 100 (50%) | [152] |
| Influenza | Nasal aspirate | NIR | 97% | 100% | - | 67 (49%) | [153] |
| Kidney disease | Blood (serum) | NIR | 90–100% | 100% | - | 64 (25%) | [154] |
| SARS-CoV-2 | Pharyngeal Swab | MIR | 95% | 89% | - | 181 (39%) | [155] |
| SARS-CoV-2 | Saliva | Raman | 83.7–97.5% | 92.2–98.5% | - | 101 (-) | [156] |
Multiple spectra per sample—see reference for details. Study performed on multiple pathogens/diseases, severity, or groups—see reference for details. In-sample performance. Estimation of Gleason grade. In pregnant women.
Publisher’s Note: MDPI stays neutral with regard to jurisdictional claims in published maps and institutional affiliations. |
© 2021 by the authors. Licensee MDPI, Basel, Switzerland. This article is an open access article distributed under the terms and conditions of the Creative Commons Attribution (CC BY) license (https://creativecommons.org/licenses/by/4.0/).
Share and Cite
MDPI and ACS Style
Blevins, M.G.; Fernandez-Galiana, A.; Hooper, M.J.; Boriskina, S.V. Roadmap on Universal Photonic Biosensors for Real-Time Detection of Emerging Pathogens. Photonics 2021, 8, 342. https://doi.org/10.3390/photonics8080342
AMA Style
Blevins MG, Fernandez-Galiana A, Hooper MJ, Boriskina SV. Roadmap on Universal Photonic Biosensors for Real-Time Detection of Emerging Pathogens. Photonics. 2021; 8(8):342. https://doi.org/10.3390/photonics8080342
Chicago/Turabian StyleBlevins, Morgan G., Alvaro Fernandez-Galiana, Milo J. Hooper, and Svetlana V. Boriskina. 2021. "Roadmap on Universal Photonic Biosensors for Real-Time Detection of Emerging Pathogens" Photonics 8, no. 8: 342. https://doi.org/10.3390/photonics8080342
Note that from the first issue of 2016, this journal uses article numbers instead of page numbers. See further details here.