Article

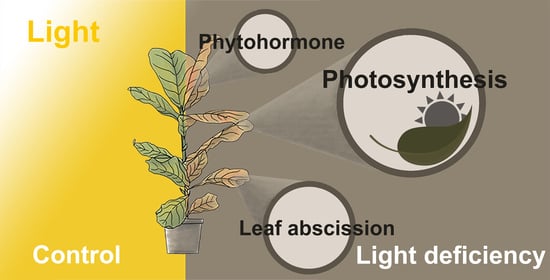
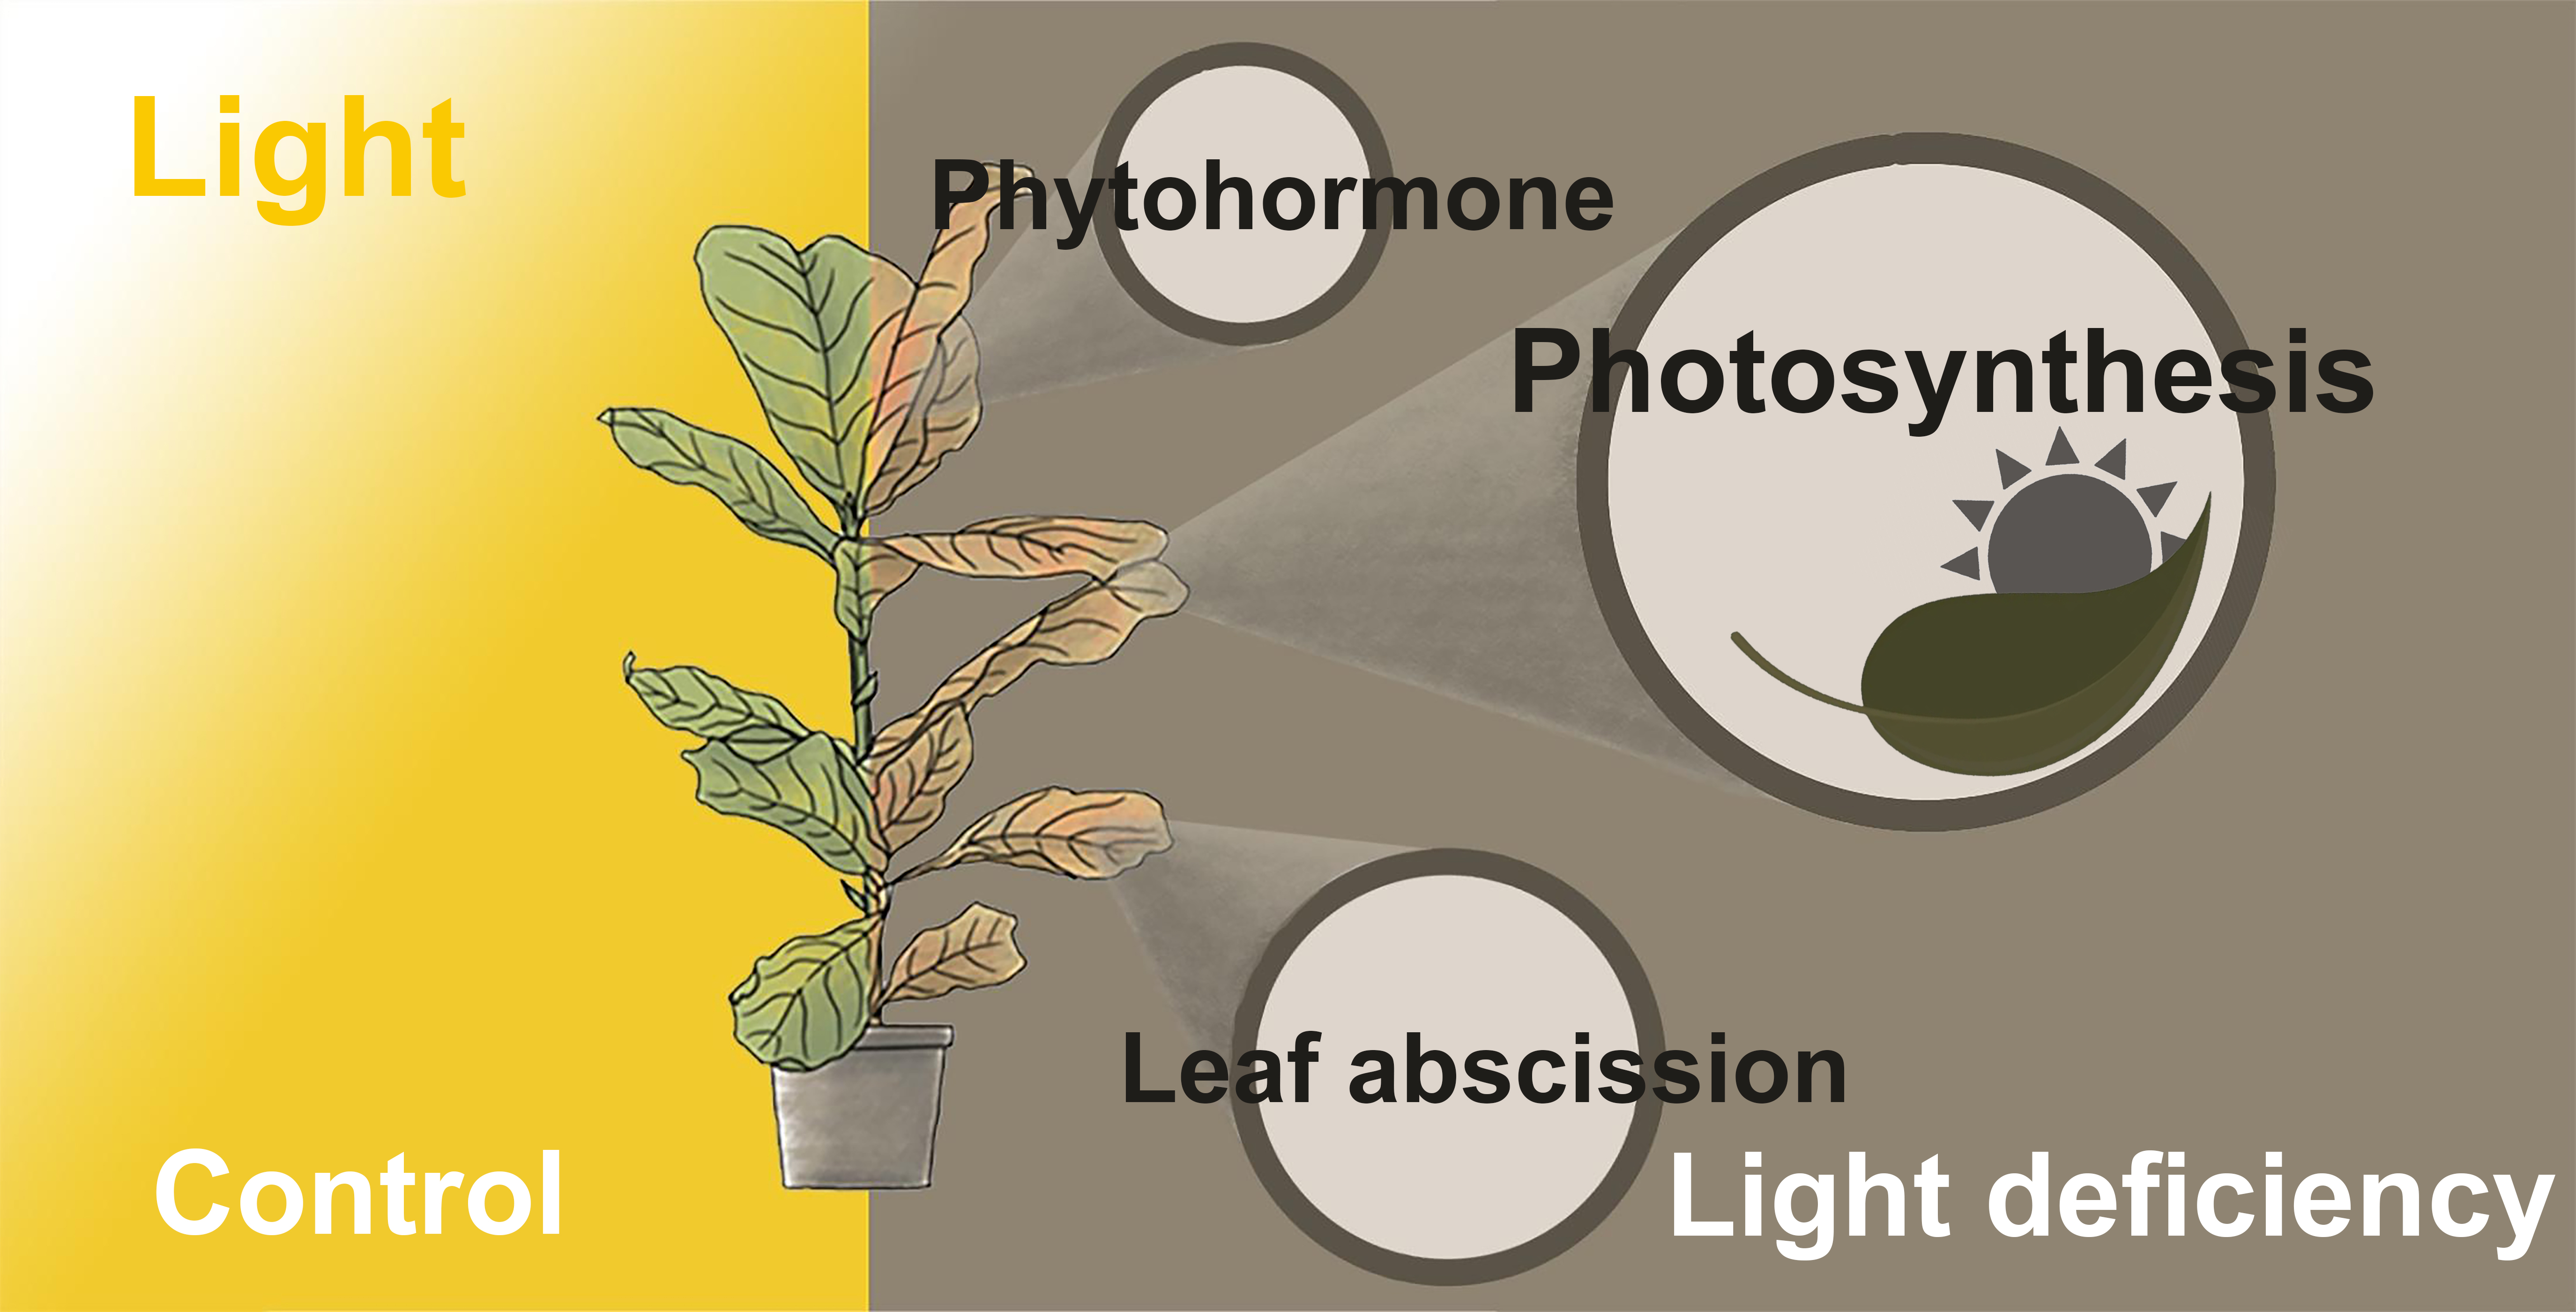
Light Deficiency Inhibits Growth by Affecting Photosynthesis Efficiency as well as JA and Ethylene Signaling in Endangered Plant Magnolia sinostellata

1
Zhejiang Provincial Key Laboratory of Germplasm Innovation and Utilization for Garden Plants, Zhejiang Agriculture & Forestry University, Hangzhou 311300, China
2
College of Landscape and Architecture, Zhejiang Agriculture and Forestry University, Hangzhou 311300, China
3
Department of Plant Genomics, Centre for Research in Agricultural Genomics (CRAG), CSIC-IRTA-UAB-UB, 08193 Bellaterra, Spain
*
Authors to whom correspondence should be addressed.
Plants 2021, 10(11), 2261; https://doi.org/10.3390/plants10112261
Submission received: 19 September 2021 / Revised: 13 October 2021 / Accepted: 13 October 2021 / Published: 22 October 2021

Abstract

:
The endangered plant Magnolia sinostellata largely grows in the understory of forest and suffers light deficiency stress. It is generally recognized that the interaction between plant development and growth environment is intricate; however, the underlying molecular regulatory pathways by which light deficiency induced growth inhibition remain obscure. To understand the physiological and molecular mechanisms of plant response to shading caused light deficiency, we performed photosynthesis efficiency analysis and comparative transcriptome analysis in M. sinostellata leaves, which were subjected to shading treatments of different durations. Most of the parameters relevant to the photosynthesis systems were altered as the result of light deficiency treatment, which was also confirmed by the transcriptome analysis. Gene Ontology and KEGG pathway enrichment analyses illustrated that most of differential expression genes (DEGs) were enriched in photosynthesis-related pathways. Light deficiency may have accelerated leaf abscission by impacting the photosynthesis efficiency and hormone signaling. Further, shading could repress the expression of stress responsive transcription factors and R-genes, which confer disease resistance. This study provides valuable insight into light deficiency-induced molecular regulatory pathways in M. sinostellata and offers a theoretical basis for conservation and cultivation improvements of Magnolia and other endangered woody plants.

Graphical Abstract

1. Introduction

Magnoliaceae plants are widely favored by people for their pleasant ornamental characteristics and high scientific research values. The history of Magnoliaceae plants can be traced back to the Mesozoic Era [1]; however, the deciduous Magnoliaceae plants are now facing the danger of extinction in nature as the result of global climate change, forest vegetation renewal, and the succession of evergreen broad-leaved forest in subtropical areas [2]. The natural distributions of the endangered species of Magnoliaceae are mostly restricted to specific areas.
For example, a number of deciduous Magnoliaceae species, such as Magnolia stellata [3], M. wufengensis [4], M. Zenii [5], M. officinalis [6], and M. sinostellata [7], tend to grow in coniferous community or forest gaps of broad-leaved communities, but are rarely found in the evergreen broad-leaved community. M. sinostellata is an endangered species with high ornamental value, which has been listed in the Red List of Magnoliaceae since 2016 [8]. It is a perennial deciduous flowering shrub that blossoms in early spring in the subtropical regions.
Although M. sinostellata is a sun-loving plant, in its natural habitats, it grows under canopy shade or nearby the brook of the north slope in coniferous forest communities, and sparsely distributes in broad-leaved or mixed forest communities [7]. Canopy shade of evergreen plants in the upper layer of forest community will affect the growth of deciduous plants in the understory [9], as it alters the light intensity as well as the light quality towards a lower ratio of red/far-red light (R/FR) in the forest community [10,11].
Shading is recognized as an important abiotic stress that affects the growth and development of shade-intolerant plants [12]. Under shading conditions, the hypocotyls and petioles of Arabidopsis were significantly elongated, and leaf lamina growth was inhibited [13]. Leaf expansion in Glycine max and Zea mays grown under shade was inhibited, which ultimately affected their seed yield [14,15]. Vegetable seedlings of tomato, cucumber, and eggplant often grow excessively under weak light conditions, leading to decreased yield in cultivation [16].
Similarly, shading increased the vegetative growth but repressed the production of lemon trees [17]. In ornamental plants, shading caused leaf chlorosis in tea [18] and faded flower color of Paeonia lactiflora [19]. As the severity of shading increased, the leaves of Tetrastigma hemsleyanum and Salvia officinalis turned yellow due to decreased chlorophyll content [20,21]. Similarly, the leaf yellowing was also observed in deciduous Acer pseudoplatanus, Fagussylvatica, Tilia cordata, and coniferous Abies alba grown under shade in arbor [22]. However, the shade response phenotype of Magnoliaceae plants remains unclear.
Light changes under canopy shade can be sensed by phytochromes (PHY) [23], which sense changes in both light intensity and quality [24]. In Arabidopsis, the phytochrome family includes five members (phyA–phyE), among which phytochrome B plays a dominant role in shade avoidance responses including leaf expansion, stem elongation, and early flowering [25,26]. Changes in light quality with a low ratio of R/FR induce shade escape responses such as rapid stem elongation and increased apical dominance, which enable plants to reach above the upper vegetation to absorb sun light [27].
Low light intensity alters chloroplast ultrastructure and photosynthetic metabolism [28]. Due to inadequate energy supply, long term exposure to low light conditions can limit growth in plants and even cause cellular damage in shade sensitive plants [29,30]. The primary effect of canopy shade on understory plants is through the weakening of their photosynthesis capacity [9]. Light-harvesting antenna proteins have vital functions in the primary process in photosynthesis, which enables plants to perform photosynthesis under extreme low light environment [31].
Under low light intensities, to maximize photosynthetic efficiency, the size of the light harvesting antenna of the plants is often considerably larger than that grown under normal light [32]. However, the enlargement of the light-harvesting antenna is normally restricted within a certain size and, as a result, the energy generated by the photosynthesis reaction center is also limited under long term shading [32,33]. Due to the insufficient energy supply, carbohydrates transformation in the Calvin cycle was blocked under weak light [34].
The activity and content of ribulose 1,5-bisphosphate carboxylase/oxygenase (Rubisco) were significantly reduced under shade in Hordeum vulgare [35], which catalyze carbon assimilation in plants [36]. The impaired photosynthetic carbon assimilation would influence multiple metabolism pathways in plants, including starch and sucrose metabolism, amino acid metabolism, and other secondary metabolism pathways, as found in Camellia sinensis [37,38]. As the plant seedlings grow, the demand for light intensity increases. Consequently, the suboptimal light intensity inevitably affects the growth and reproduction of plants [39].
To cope with environmental stresses, the plants have evolved elaborate response mechanisms [40]. Phytohormones are known to have pivotal roles in regulating stress responses in plants [41]. Under low light conditions, ethylene production and signaling was induced to increase stress tolerance in Arabidopsis and rice [42,43], but its high level of release could increase the sensitivity to stress and even lead to plant death [44]. In addition, jasmonic acid (JA) is also known as plant stress hormones in higher plants [45]. JA signaling and its content accumulation are often recruited to counteract abiotic stress in tomatoes and rice [46,47,48].
JA interacts with ethylene signaling pathways to regulate abiotic stress tolerance and may act as a core signal in such an intertwined network [49]. Various studies found that light deficiency can alter stress tolerance and disease resistance in plants [50,51,52,53,54,55,56]. However, its molecular mechanisms in plants are complex and unclear. Numerous transcription factors (TFs) are involved in regulating molecular response in plants [57]. TIFY family genes are plant-specific and responsible to multiple abiotic stresses, most of which are stress inducible and able to enhance plant stress tolerance [58], as exemplified in Citrullus lanatus [59], Triticum aestivum [60], and G. max [61].
The mitochondrial transcription termination factor (mTERF) family was also found as essential for plant adaptation or tolerance to abiotic stresses by regulating transcription, translation and DNA replication in mitochondria in plants [62,63]. Furthermore, plant resistance (R) genes encode immune receptors that recognize specific avirulence (Avr) genes of pathogens [64], the expression levels of which are tightly associated with disease resistance and could be induced by environmental stress [65]. To our knowledge, the responses of TIFYs, mTERFs, and R-genes to weak light have not been investigated. Further, the regulatory pathways of molecular responses to light deficiency in M. sinostellata remain obscure.
Previous studies have confirmed that weak light is the main factor that affect the distribution and growth of deciduous magnolia in the understory of forest community [5,7]. The light environment under canopy shade can be quite complex, containing low light intensity and inconsistent light quality [66,67]. To reduce the confounding factors, many studies focused on the impacts of low light intensity on a number of plant species, such as soybean [68], rice [69], Halimium halimifolium [70]. Accordingly, in this study, we mainly focused on the effect of shading caused light deficiency on M. sinostellata and black shade net was used to create light deficiency conditions.
In the preliminary research, we found that low light intensity promoted leaf abscission in M. sinostellata, which is distinct from the response of model plants, such as Arabidopsis and rice. Photosynthesis efficiency analysis revealed that light deficiency altered photosynthesis systems related parameters. Comparative transcriptome analysis in M. sinostellata leaves with and without weak light treatment led to the identification of numerous core low-light responsive pathways, TFs, and R-genes. This study may offer a new insight into the light deficiency response mechanism, which forms a theoretical basis for the protection and conservation of M. sinostellata and other endangered woody plants.

2. Results

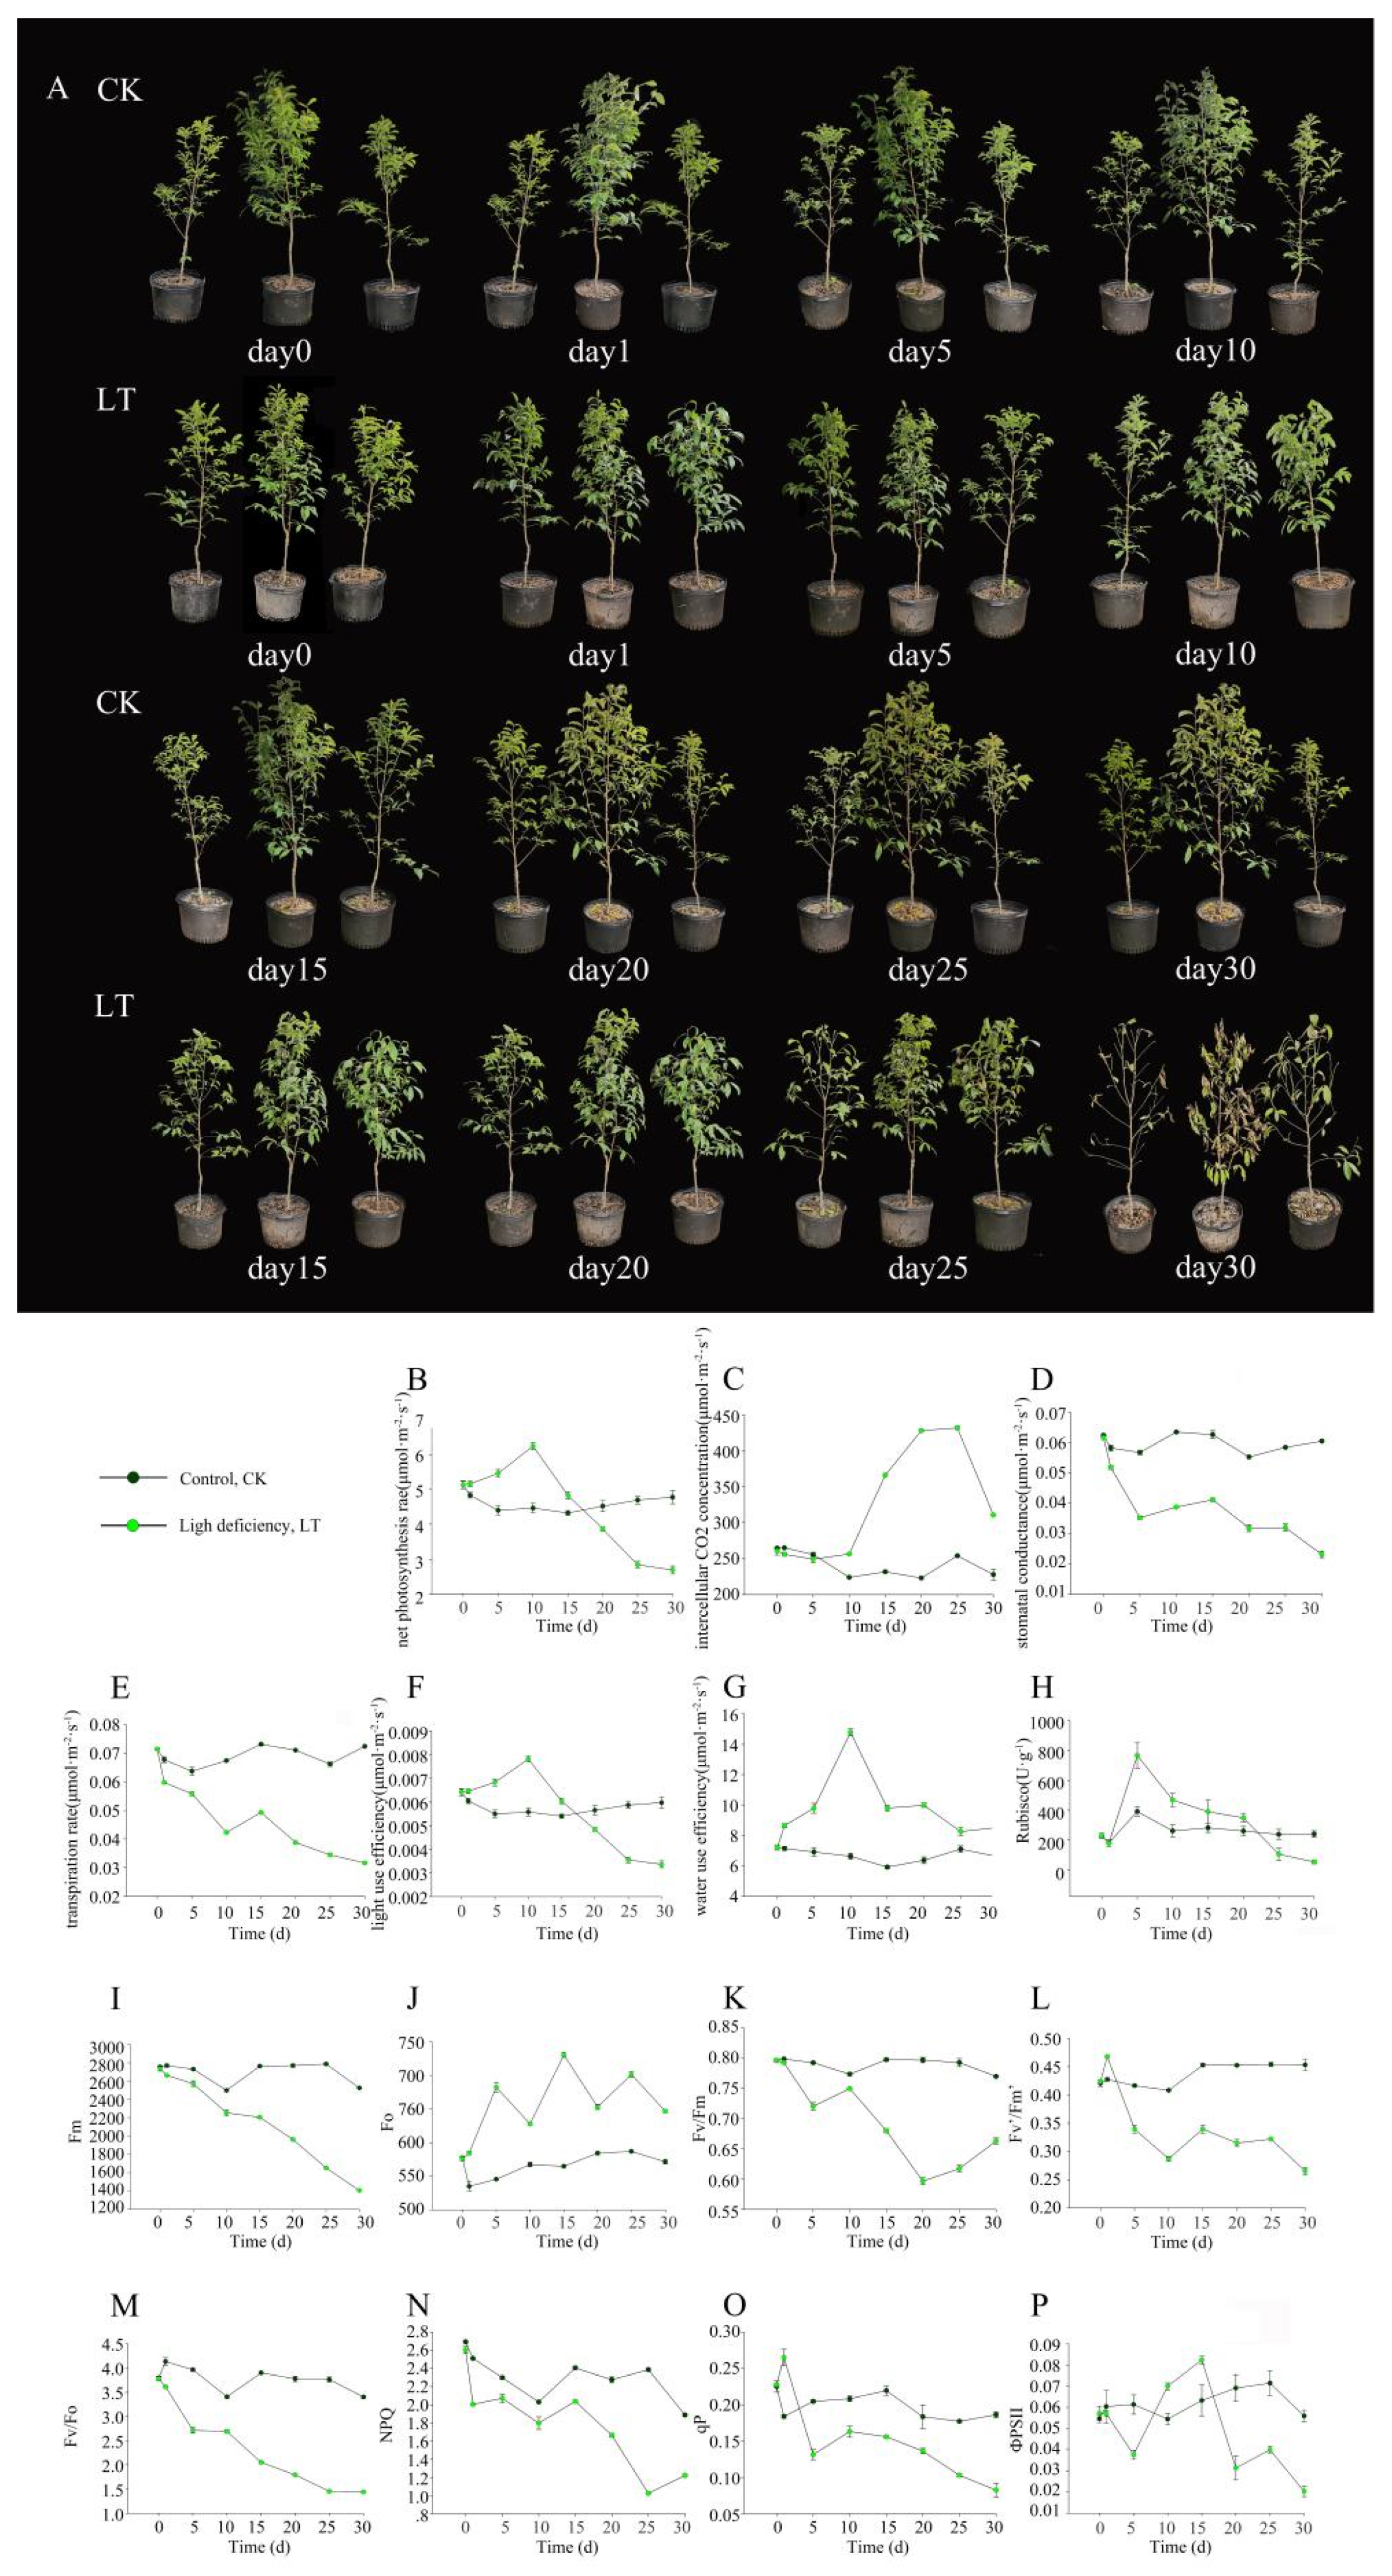
2.1. Light Deficiency Inhibited Growth of M. sinostellata

Significant morphological changes in M. sinostellata seedlings under light deficiency treatment (LT), relative to the control (CK) seedlings, were observed (Figure 1A). The CK leaves of M. sinostellata were fully expanded, and no significant changes were observed in these seedlings at day 1. After being subjected to low light conditions for 5 d, seedlings began to wilt, and around 5% of leaves were shed (Supplementary Materials Figure S1). By 15 d of light deficiency treatment, severe leaf abscission was observed, 17% of leaves fell. After 20 d, most of the leaves were found to face downward, and approximately 28% of leaves were shed.
Furthermore, the whole plants began to show evident phenotypic damage, which worsened as the light deficiency treatment progressed. After 25 d of the treatment, 34% of leaves were shed, and some leaves were completely dried up. After 30 d of the light deficiency stress, 40% of the leaves were shed. Such morphological changes confirm that M. sinostellata is highly sensitive to light deficiency. To investigate the potential changes in carbon assimilation as caused by light deficiency treatment, a number of photosynthetic parameters were measured in the M. sinostellata leaves, including net photosynthetic net (Pn), intercellular CO2 concentration (Ci), stomatal conductance (Gs), and transpiration rate (Tr).
Under weak light, Pn initially increased by 20% after 10 d shade treatment, which were reduced to 60% of that of the controls after 30 d light deficiency treatment (Figure 1B). Ci (Figure 1C) also showed an initial increase prior to dropping at 25 d, while Gs (Figure 1D) and Tr (Figure 1E) consistently decreased. The light utilization efficiency (LUE) (Figure 1F) and water utilization efficiency (WUE) (Figure 1G) were also analyzed, which showed similar trends in response to weak light, both of which peaked at 10 d and then deceased.
Rubisco activity was peaked at d5 before its sharp reduction (Figure 1H). Chlorophyll fluorescence parameters were also affected by light deficiency stress throughout the experiment (Figure 1I–P). The maximal fluorescence (Fm), maximal quantum yield of PSII (Fv/Fm), excitation energy capture efficiency of PSII (Fv’/Fm’), photochemical quenching (qP), active PSII reaction centers (Fv/Fo) and non-photochemical quenching (NPQ) values all decreased throughout the experiment. Fv’/Fm’ values rapidly decreased until 10 d, and then dropped down slowly thereafter. qP declined throughout the experiment, while the initial fluorescence (Fo) values increased consistently. The yield of PSII photochemistry (ΦPSII) value decreased until 5 d, followed by a sharp increase from 5 d to 15 d, before significantly dropping thereafter.

2.2. Summary of Transcriptome Assembly and Function Annotation in M. sinostellata

Based on the results of the photosynthesis analysis, the samples of d 0 (mixed sample of CK and LT), d 5, and d 15 in both CK and LT were selected for transcriptome sequencing. A total of 15 samples in five groups (CK-D0, CK-D5, CK-D15, LT-D5, and LT-D15) were mixed equally, and used for the full-length transcriptome sequencing, which obtained a total of 50.13 GB data and 14,653,022 subreads. The length of subreads varied from 3420.95 bp to 188,350 bp (Figure S2). After de-redundancy, 246,481 unigenes were obtained in M. sinostellata with a total length of 270,112,156 bp, and the GC content was 43.97% (Table S2).
BUSCO was used to evaluate the completeness of transcriptome assembly, which showed that full-length transcriptome of M. sinostellata was comprised of 88.78%, 4.95%, and 6.27% of the complete, fragmented and missing BUSCOs, respectively (Figure S3). All the unigenes were blasted against the seven public databases for functional annotation (Table S3). 173,103, 146,820, 128,216, 135,136, 128,718, 107,462, and 138,676 unigenes were identified in the database of Nr, Nt, Swissprot, KEGG, KOG, Pfam, and GO, respectively, which became the basis for the functional annotation of a total number of 191,343 unigenes.
The high-quality full-length consensus sequences obtained by full-length transcriptome sequencing were employed as the reference gene set for M. sinostellata. To further elucidate the shade responsive patterns of M. sinostellata, de novo transcriptome sequencing was performed on the 15 samples separately and a total of 697.63 M original reads were obtained (Table S4). When the clean reads obtained by the second-generation transcriptome sequencing were aligned to the reference gene set by Bowtie2, a total of 181,902 genes were detected in this de novo transcriptome sequencing.
The mapped ratios were varied from 73.76% to 86.99% with the mean of 80.49% (Table S5). A box plot of the gene expression in FPKM value as calculated using RSEM illustrates the overall distribution of gene expression in each sample (Figure S4). A sample PCA map was generated by analyzing all the 15 samples by dimensionality reduction method (Figure S5), which shows a high level of correlation among the three biological replicates in five groups.

2.3. Identification of Differentially Expressed Gene in M. sinostellata

In total, 11,850, 12,320, 7165, and 15,389 DEGs were detected in CK-D0-vs-LT-D5, CK-D5-vs-LT-D5, CK-D0-vs-LT-D15, and CK-D15-vs-LT-D15 comparison group, respectively (Figure S6A). Following the removal of overlapping DEGs detected in the four comparison groups, a total of 22,433 DEGs for light deficiency response were identified based on strict criteria (Fold change > 4 and p < 0.05). A Venn diagram showed that 3309 DEGs were significantly expressed throughout the treatment (Figure S6B). Among the 22,433 DEGs, GO analysis indicated that the top five enriched GO terms were directly related to photosynthesis components (Figure 2A), which are all photosynthesis and thylakoid related terms (GO:0009765, GO:0009579, GO:0009522, GO:0034357, and GO:0009521).
KEGG analysis showed consistent results with GO analysis. The top five enriched KEGG pathways were all associated with photosynthesis, carbohydrate metabolism or other secondary metabolism, among which ‘Photosynthesis—antenna proteins’ was the most enriched KEGG pathway, followed by ‘Phenylpropanoid biosynthesis’, ‘Glycine, serine and threonine metabolism’, ‘Cyanoamino acid metabolism’, and ‘Starch and sucrose metabolism’ (Figure 2B). Taken together, these results strongly suggest that photosynthesis, carbon fixation and other secondary metabolisms play important roles in response to light deficiency in M. sinostellata.

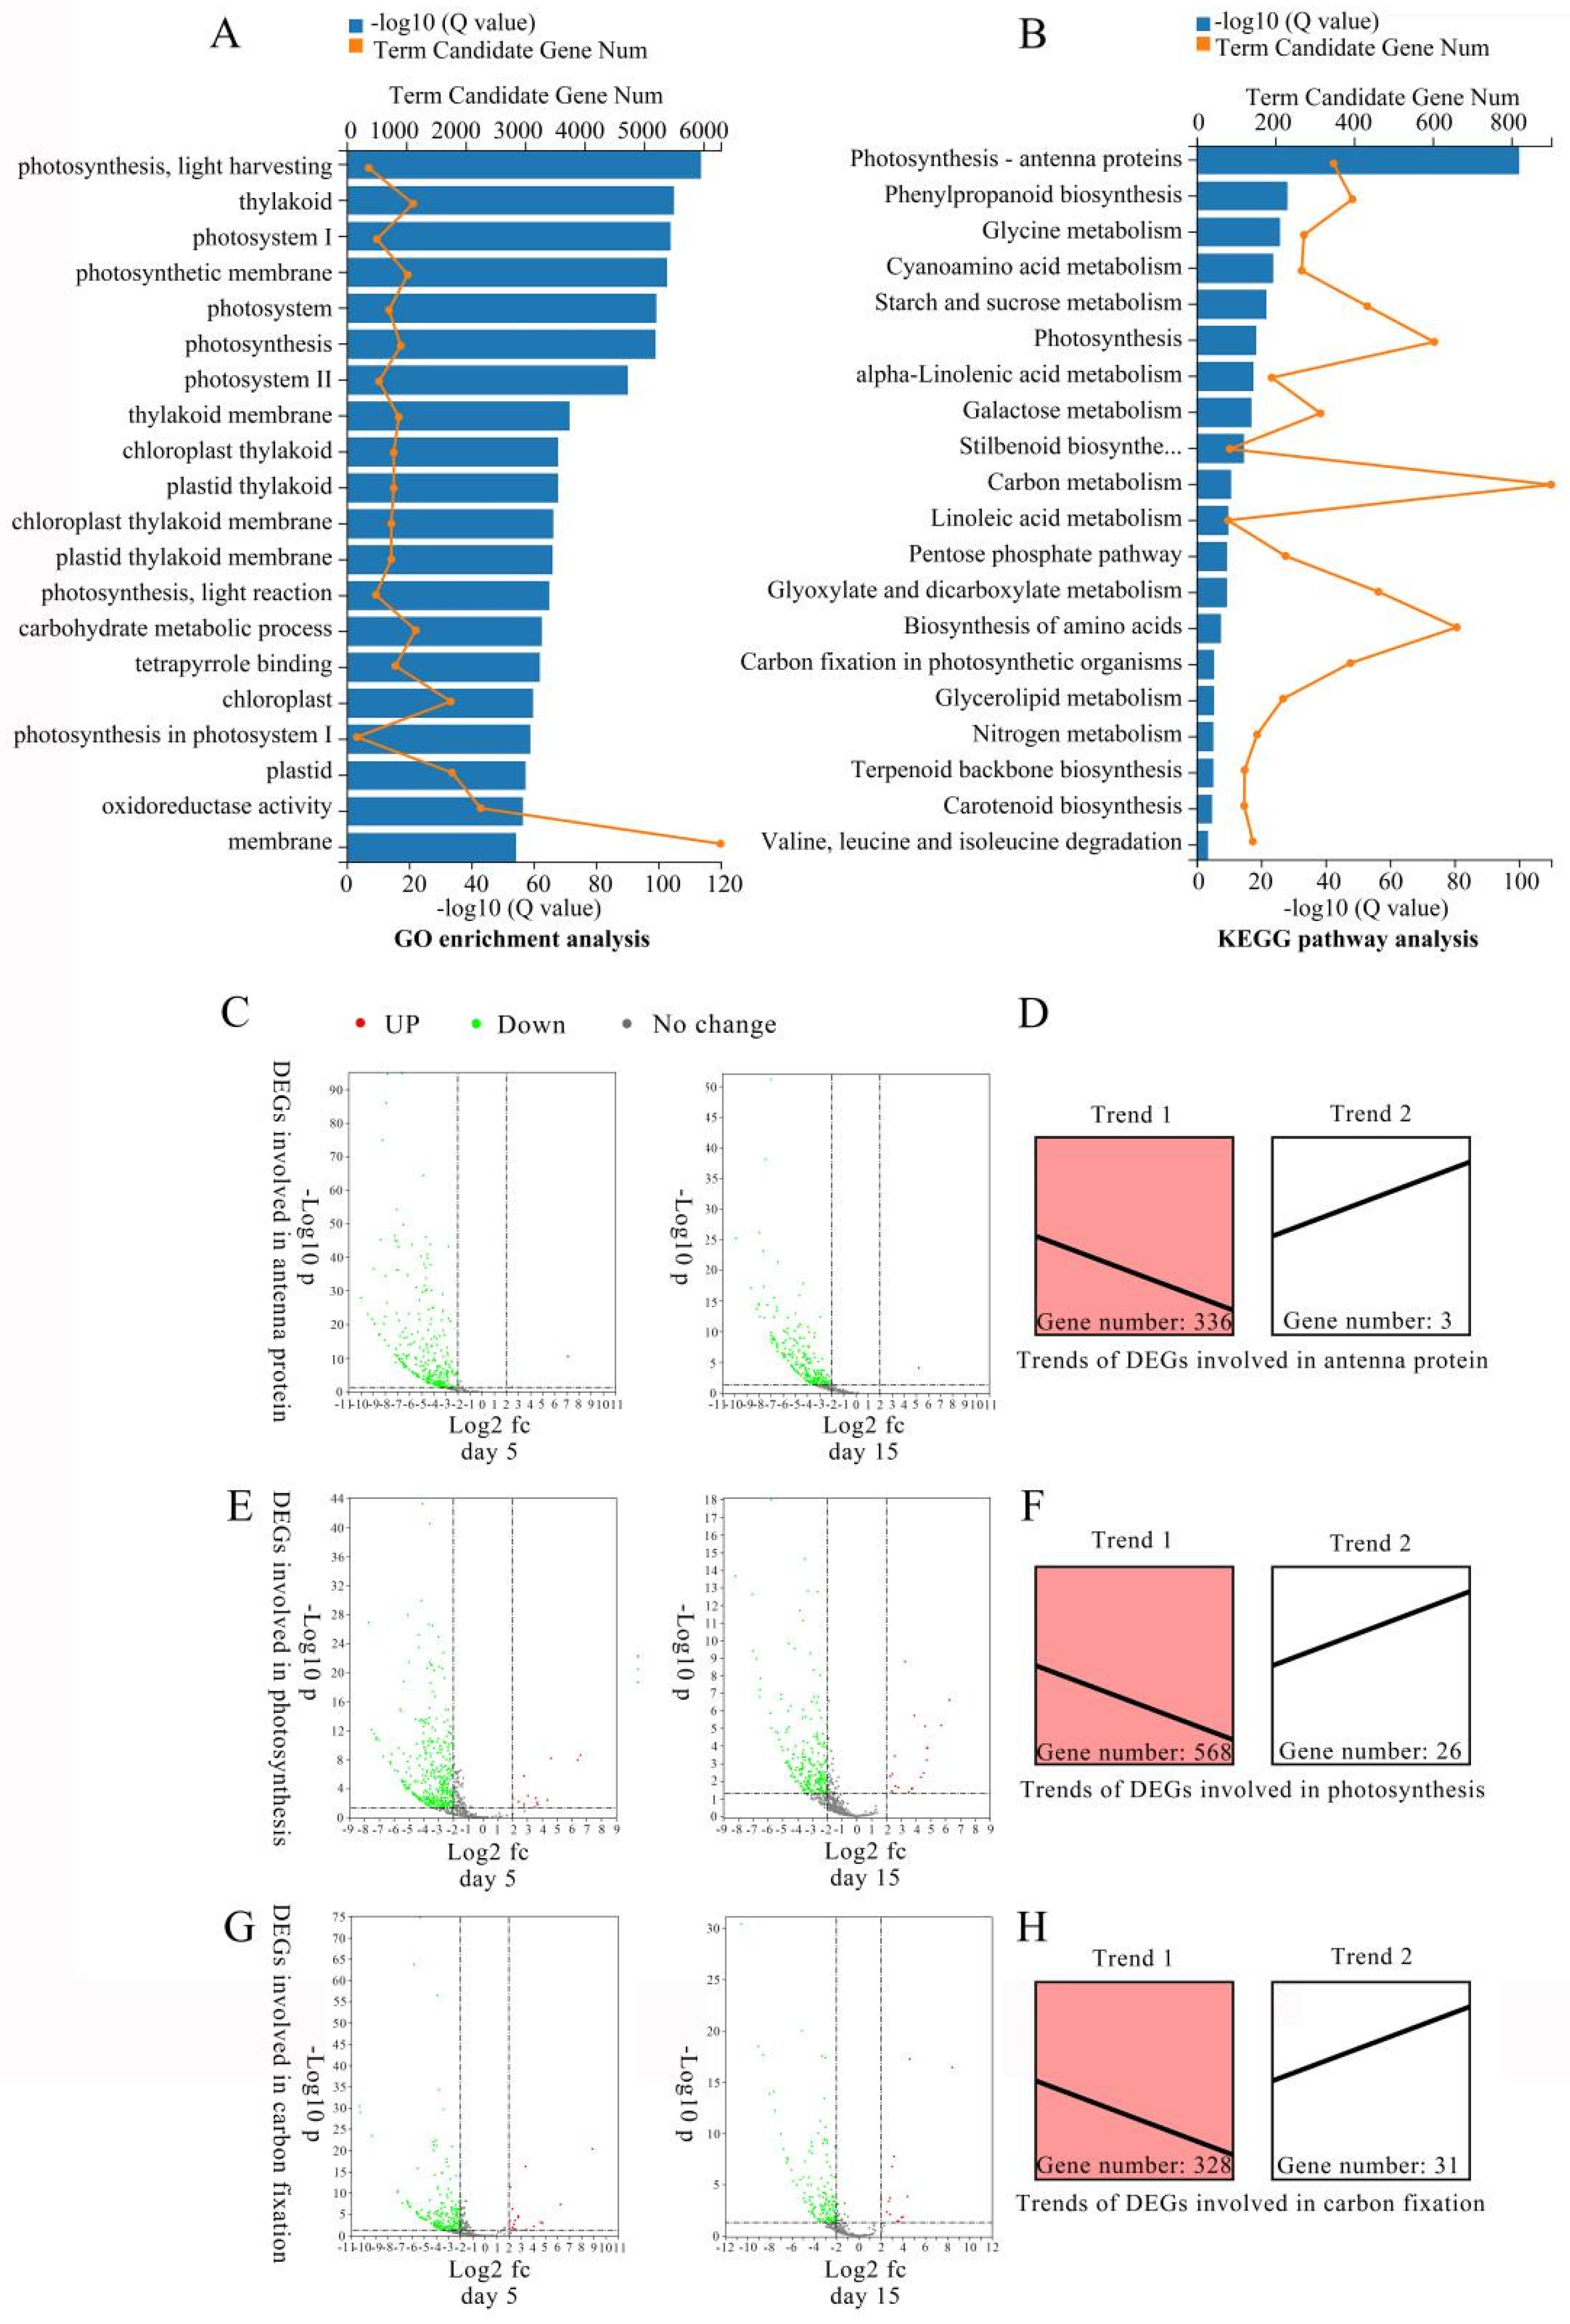
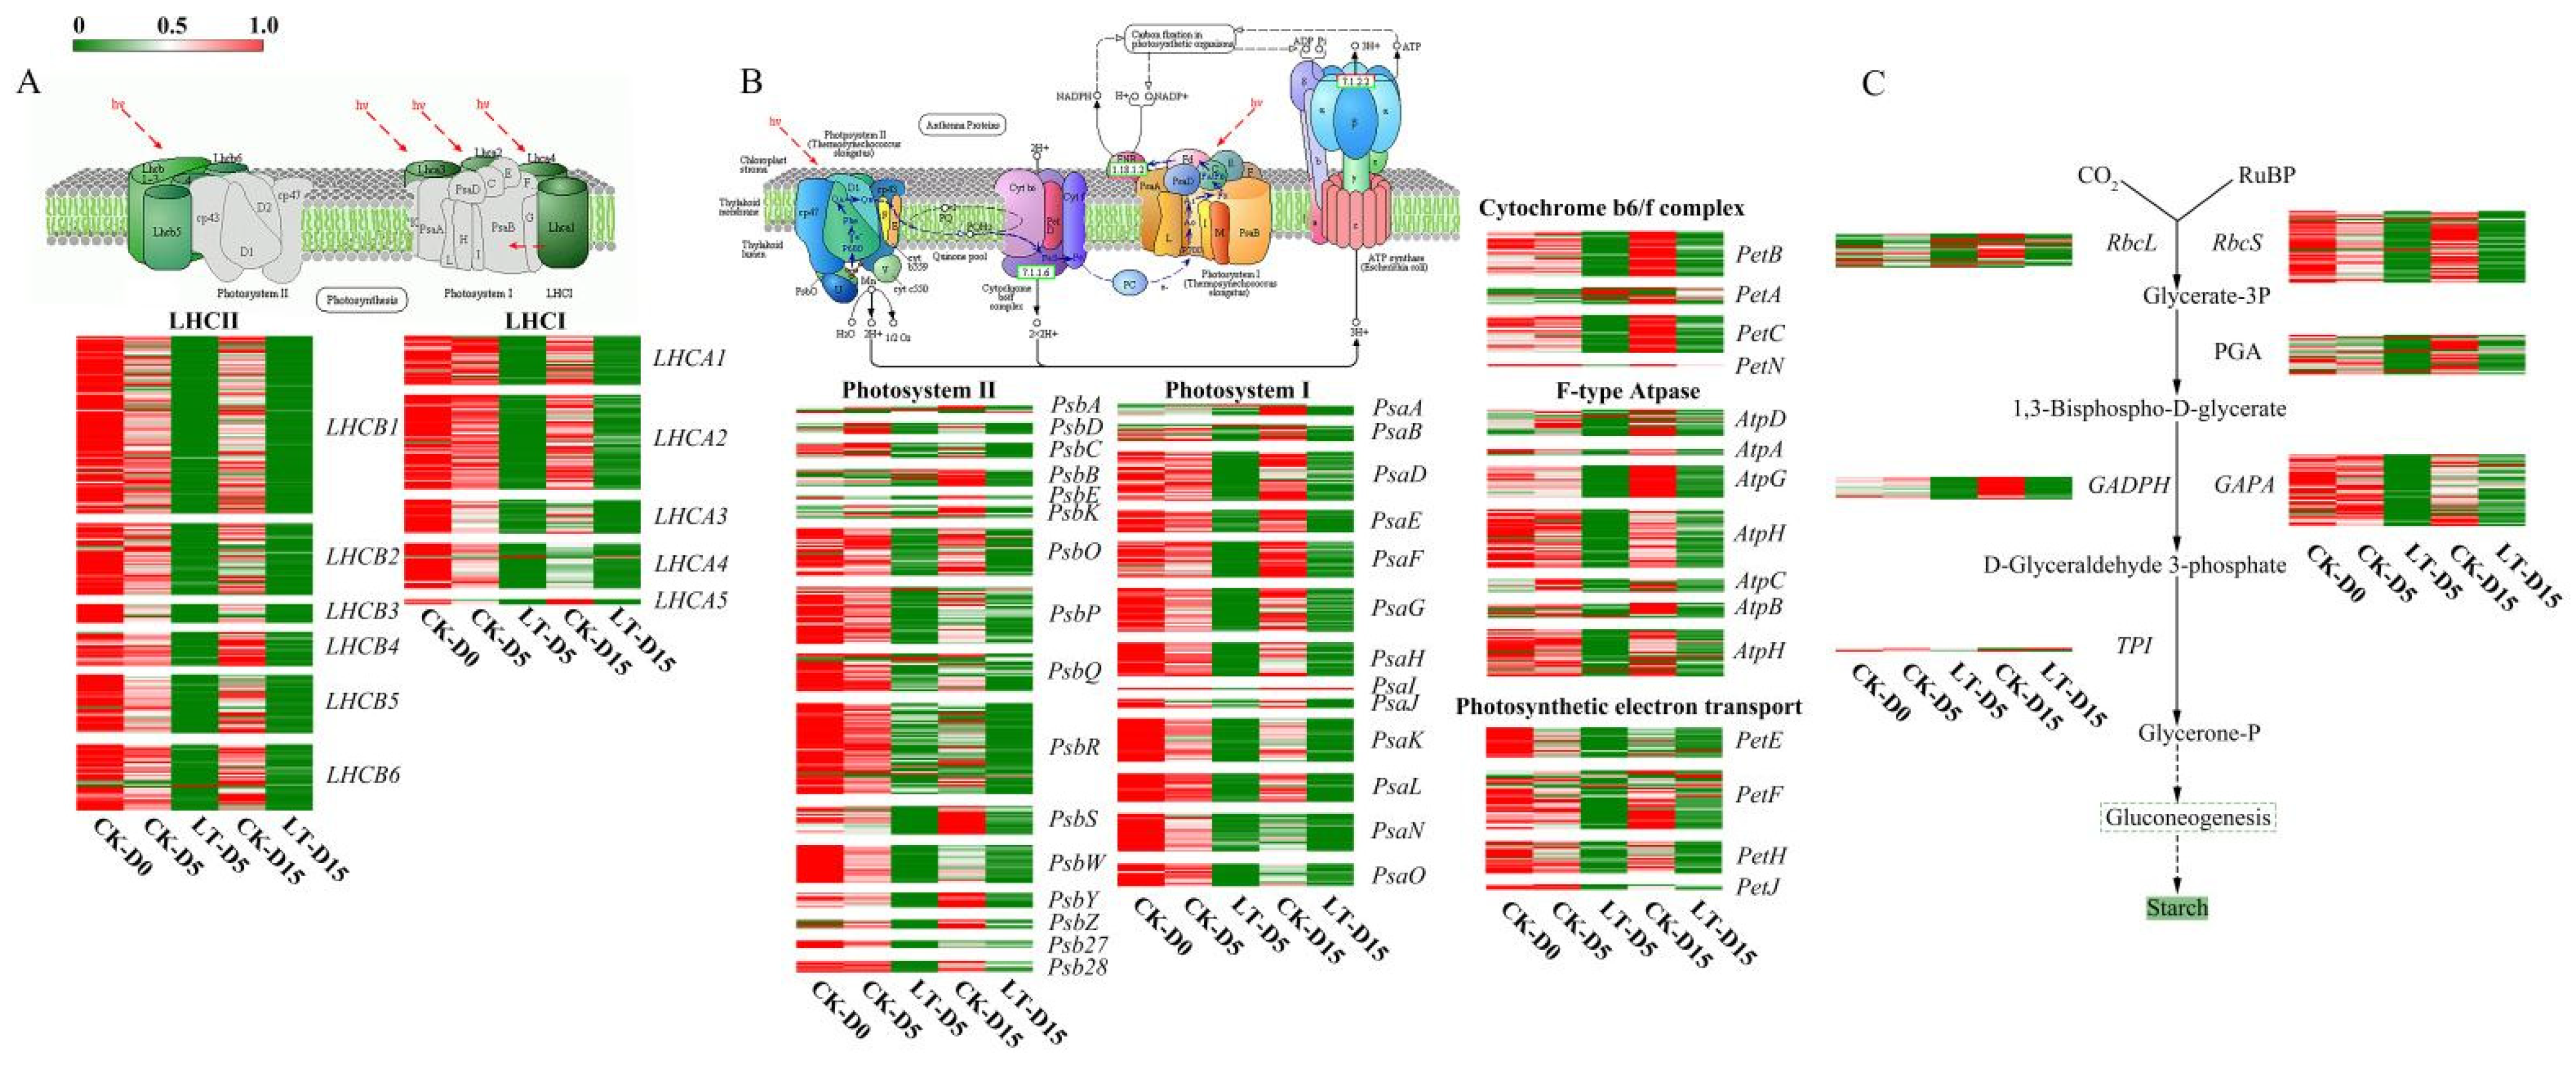
2.4. Expression Patterns of DEGs Involved in Photosynthesis Altered under Light Deficiency

To further investigate the effects of light deficiency on the photosynthesis capacity of M. sinostellata, the expression patterns of DEGs involved in photosynthesis-related pathways were analyzed. Under the low light condition, most of the genes that were predicted to function in antenna protein pathway (ko00196) [71] were significantly down regulated (Figure 2C). In this pathway, gene expression trend analysis indicated that 336 genes were consistently down regulated, whereas three genes were up regulated (Figure 2D). Heatmap analysis showed that expression level of most genes in light harvesting complex I (LHC I and LHCA1-5) and light harvesting complex II (LHC II and LHCB1-7) were decreased under light deficiency treatment (Figure 3A), suggesting that the activity of light-harvesting chlorophyll protein complex (LHC) of M. sinostellata was inhibited.
Similarly, DEGs that are related to the photosynthesis pathway (Ko00195) were also mainly down regulated during light deficiency conditions, among which 568 DEGs were significantly down regulated, whereas 26 genes showed a trend of significant upregulation (Figure 2E,F). Compared with CK, the genes involved in the PSI, PSII, including Cytochrome b6/f complex, photosynthetic electron transport and F-type ATPase, were mostly down regulated under light deficiency treatment, consistent with the reductions in photosynthesis efficiency (Figure 3B).
In the carbon fixation pathway (Ko00710), the expression of 328 genes declined, whereas 31 genes were dramatically up regulated (Figure 2G,H). The significant decrease in the transcription level of the key genes involved in Calvin cycle, including RbcLs, RbcSs, PGAs, GADPHs, GAPAs, and TPIs, may indicate that the carbon assimilation efficiency and further sucrose and starch metabolism were depressed in the shade treated M. sinostellata plants (Figure 3C).

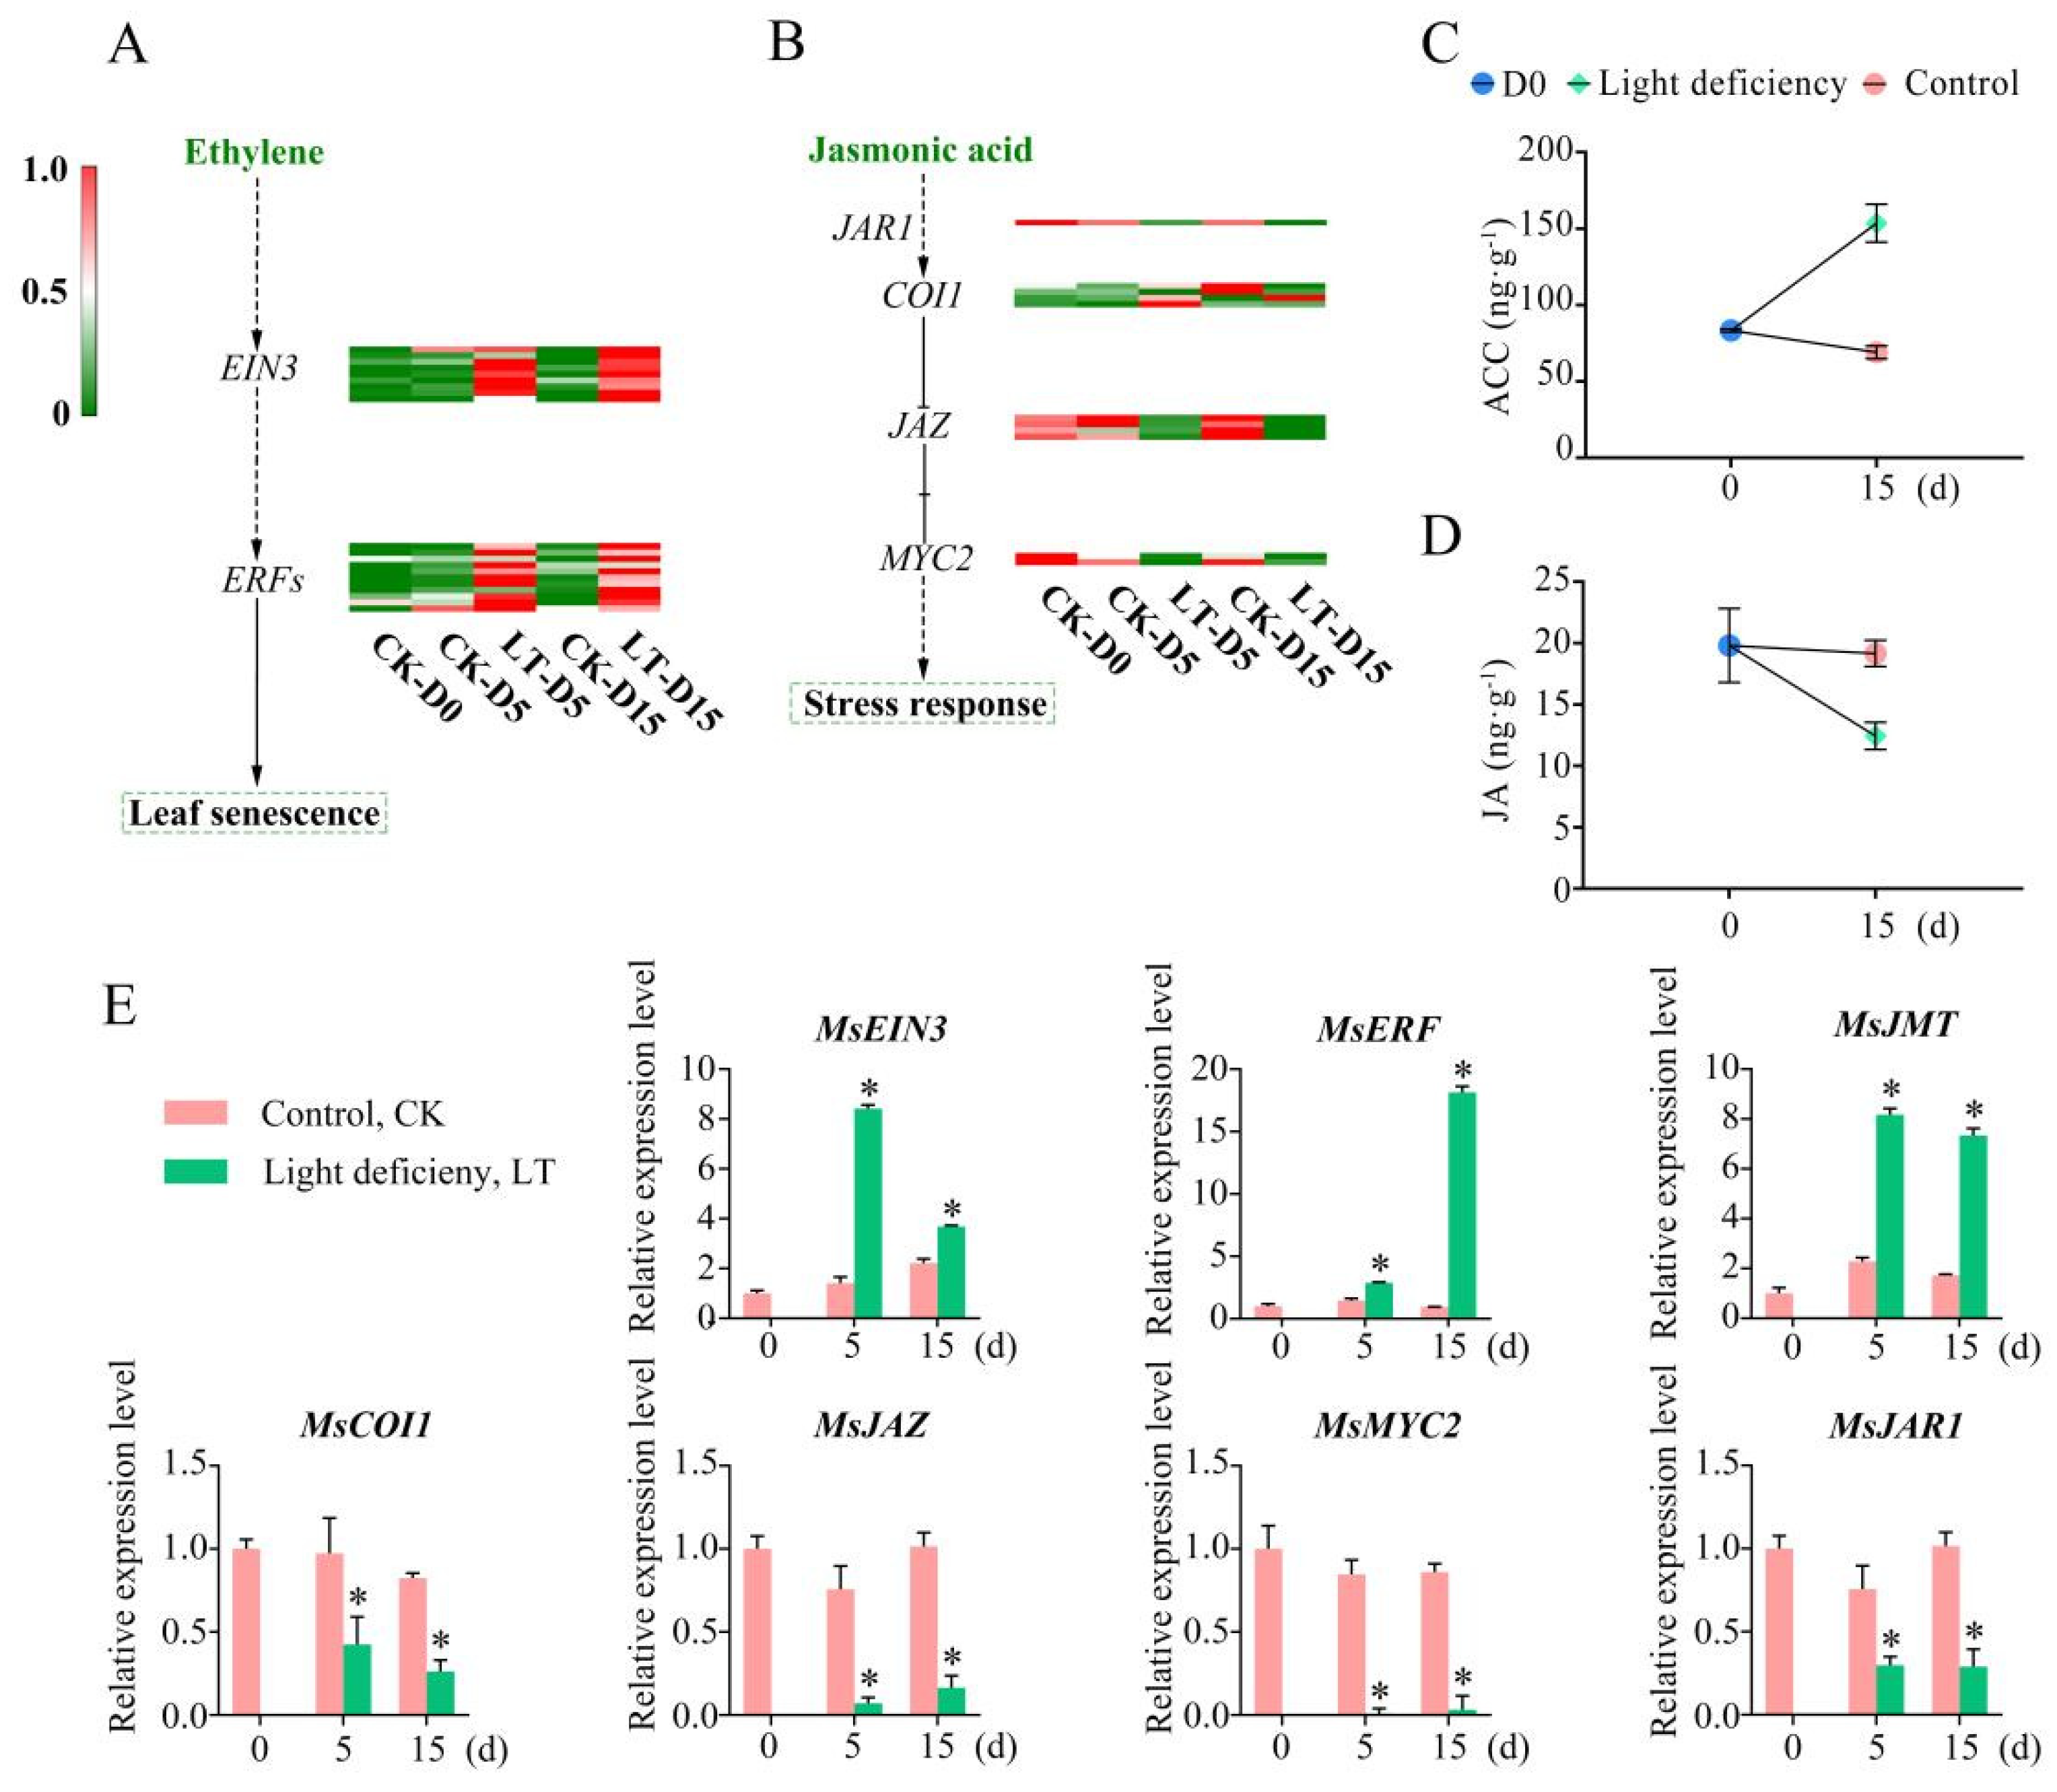
2.5. Phytohormonal Changes in Leave of M. sinostellata under Low Light

Transcriptome data analysis showed that light deficiency mainly affected ethylene and jasmonic acid signaling pathways. Under light deficiency treatment, the ethylene signaling promoting factors, such as EIN3 and ERFs, were significantly up-regulated by weak light, indicating the activation of ET mediated signaling pathway (Figure 4A). A number of key genes related to JA signaling were down regulated by weak light, among which JA signaling inhibitor COI1 was the most significantly induced.
Further, the expression of stress response regulators JAR1 and JAZ were inhibited in the JA signaling pathway, which suggests that the JA-mediated stress response pathway was suppressed by low light (Figure 4B). To further verify whether weak light affects phytohormone accumulation, the concentrations of endogenous ACC (ethylene precursors) and JA were measured during the experiment. After 15 d light deficiency treatment, the endogenous ACC level increased from 83.3 to 153.5 ng/g, Figure 4C. In contrast, the endogenous JA level dropped from 19.8 to 13.1 ng/g at 15 d after experiment (Figure 4D). The alteration in the expression patterns of the above mentioned core genes involved in plant hormone signaling were verified using qRT-PCR, which were consistent with the transcriptome analysis (Figure 4E).

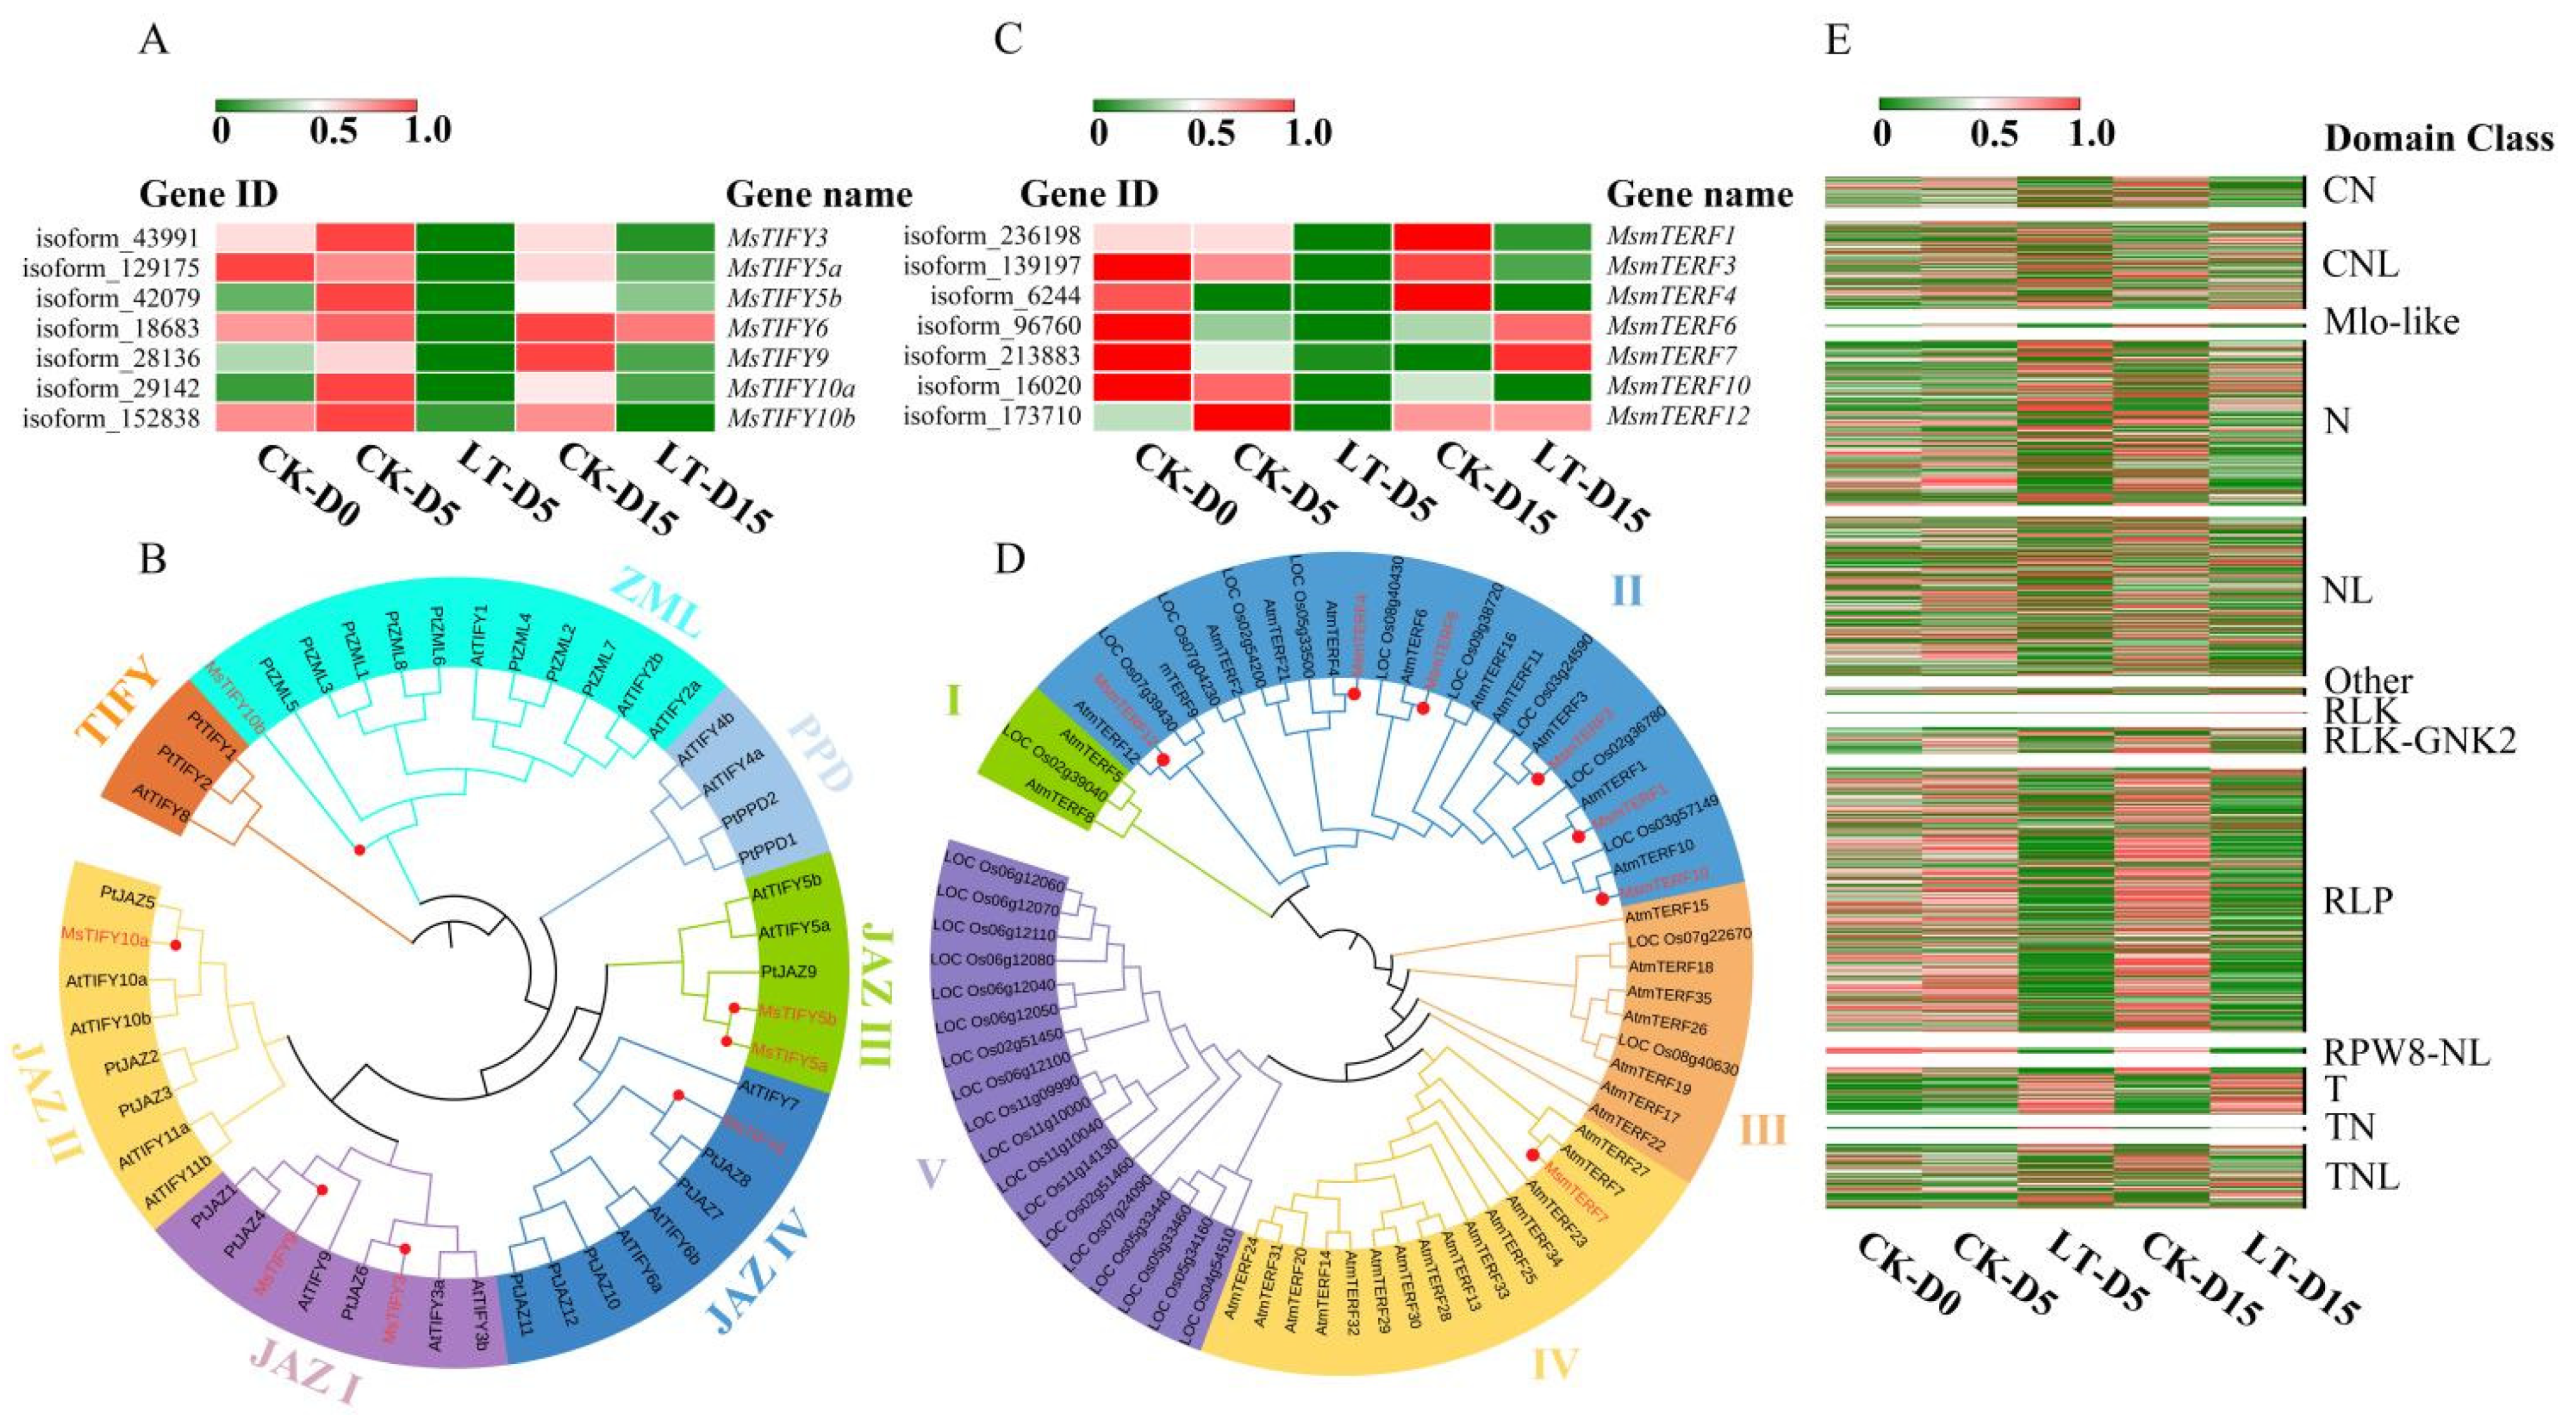
2.6. Light Deficiency Affected Stress-Related Transcription Factors in M. sinostellata

Given that low light intensity can impact stress tolerance in various plants, such as Calamus viminalis, Anoectochilus roxburghii, and Leymus chinensis [50,51,52], and light deficiency also weakened the resistance of M. sinostellata [53], stress response TFs were identified and analyzed in a genome wide range. TIFY and mitochondrial transcription termination factors (mTERFs) are related to stress response and have important roles in stress tolerance in plants [72,73]. Seven MsTIFYs were identified from the M. sinostellata transcriptome, and their physicochemical characters are listed in Table S6.
Based on FPKM values of MsTIFYs, heatmap analysis showed that MsTIFYs were all consistently down regulated during light deficiency treatment, except for MsTIFY6, which showed slight upregulation after 15 d (Figure 5A). To understand the evolutionary relationship of MsTIFYs with its orthologs in other species, a phylogenetic tree consisting of 39 TIFYs were constructed. As shown in Figure 5B, the 39 TIFY proteins could be classified into seven subgroups, including TIFY, ZML, PPD, and JAZ I–Ⅳ, among which MsTIFYs were localized in the ZML and JAZ I–Ⅳ subgroups, among which MsTIFY3 and MsTIFY9 were clustered in subgroup JAZ I; MsTIFY5a and MsTIFY5b were localized in the JAZ III subgroup; and MsTIFY10a, MsTIFY10b, and MsTIFY6 were clustered in the subgroup JAZ II, ZML, and JAZ Ⅳ, respectively. The subgroup TIFY and PPD comprised AtTIFYs and PtTIFYs only.
Seven MsmTERFs were detected among the 22,433 weak-light responsive DEGs (Table S7). The prediction of protein location showed that MsmTERF1, MsmTERF3, and MsmTERF12 were localized in the nucleus. MsmTERF4, MsmTERF6, and MsmTERF10 were predicted to be located in chloroplasts. Interestingly, the MsmTERF7 protein was predicted to function in the cell membrane or chloroplasts. The expression levels of all the seven MsmTERFs declined during low-light treatment, among which the decrease of MsTERF1, MsTERF3, MsTERF10, and MsTERF12 were significant (Figure 5C).
Based on these results, we could assume that MsmTERFs may have participated in low-light response regulation in M. sinostellata. The phylogenetic analysis of the 73 mTERF proteins indicated that they could be divided into five subgroups (subgroups I–Ⅴ) (Figure 5D). Among seven MsTERFs, six MsTRRFs were clustered into subgroup II, and only MsmTERF7 was clustered in subgroup Ⅳ. Subgroup I and III only contain AtmTERFs and ZmmTERFs. Interestingly, subgroup Ⅴ was clustered by 18 ZmmTERF protein sequences. The seven MsmTERFs were all clustered with its A. thaliana ortholog. Accordingly, these mTERF genes might have similar functions to their corresponding Arabidopsis orthologs.

2.7. Low Light Treatment Altered Expression Pattern of R-Genes in M. sinostellata
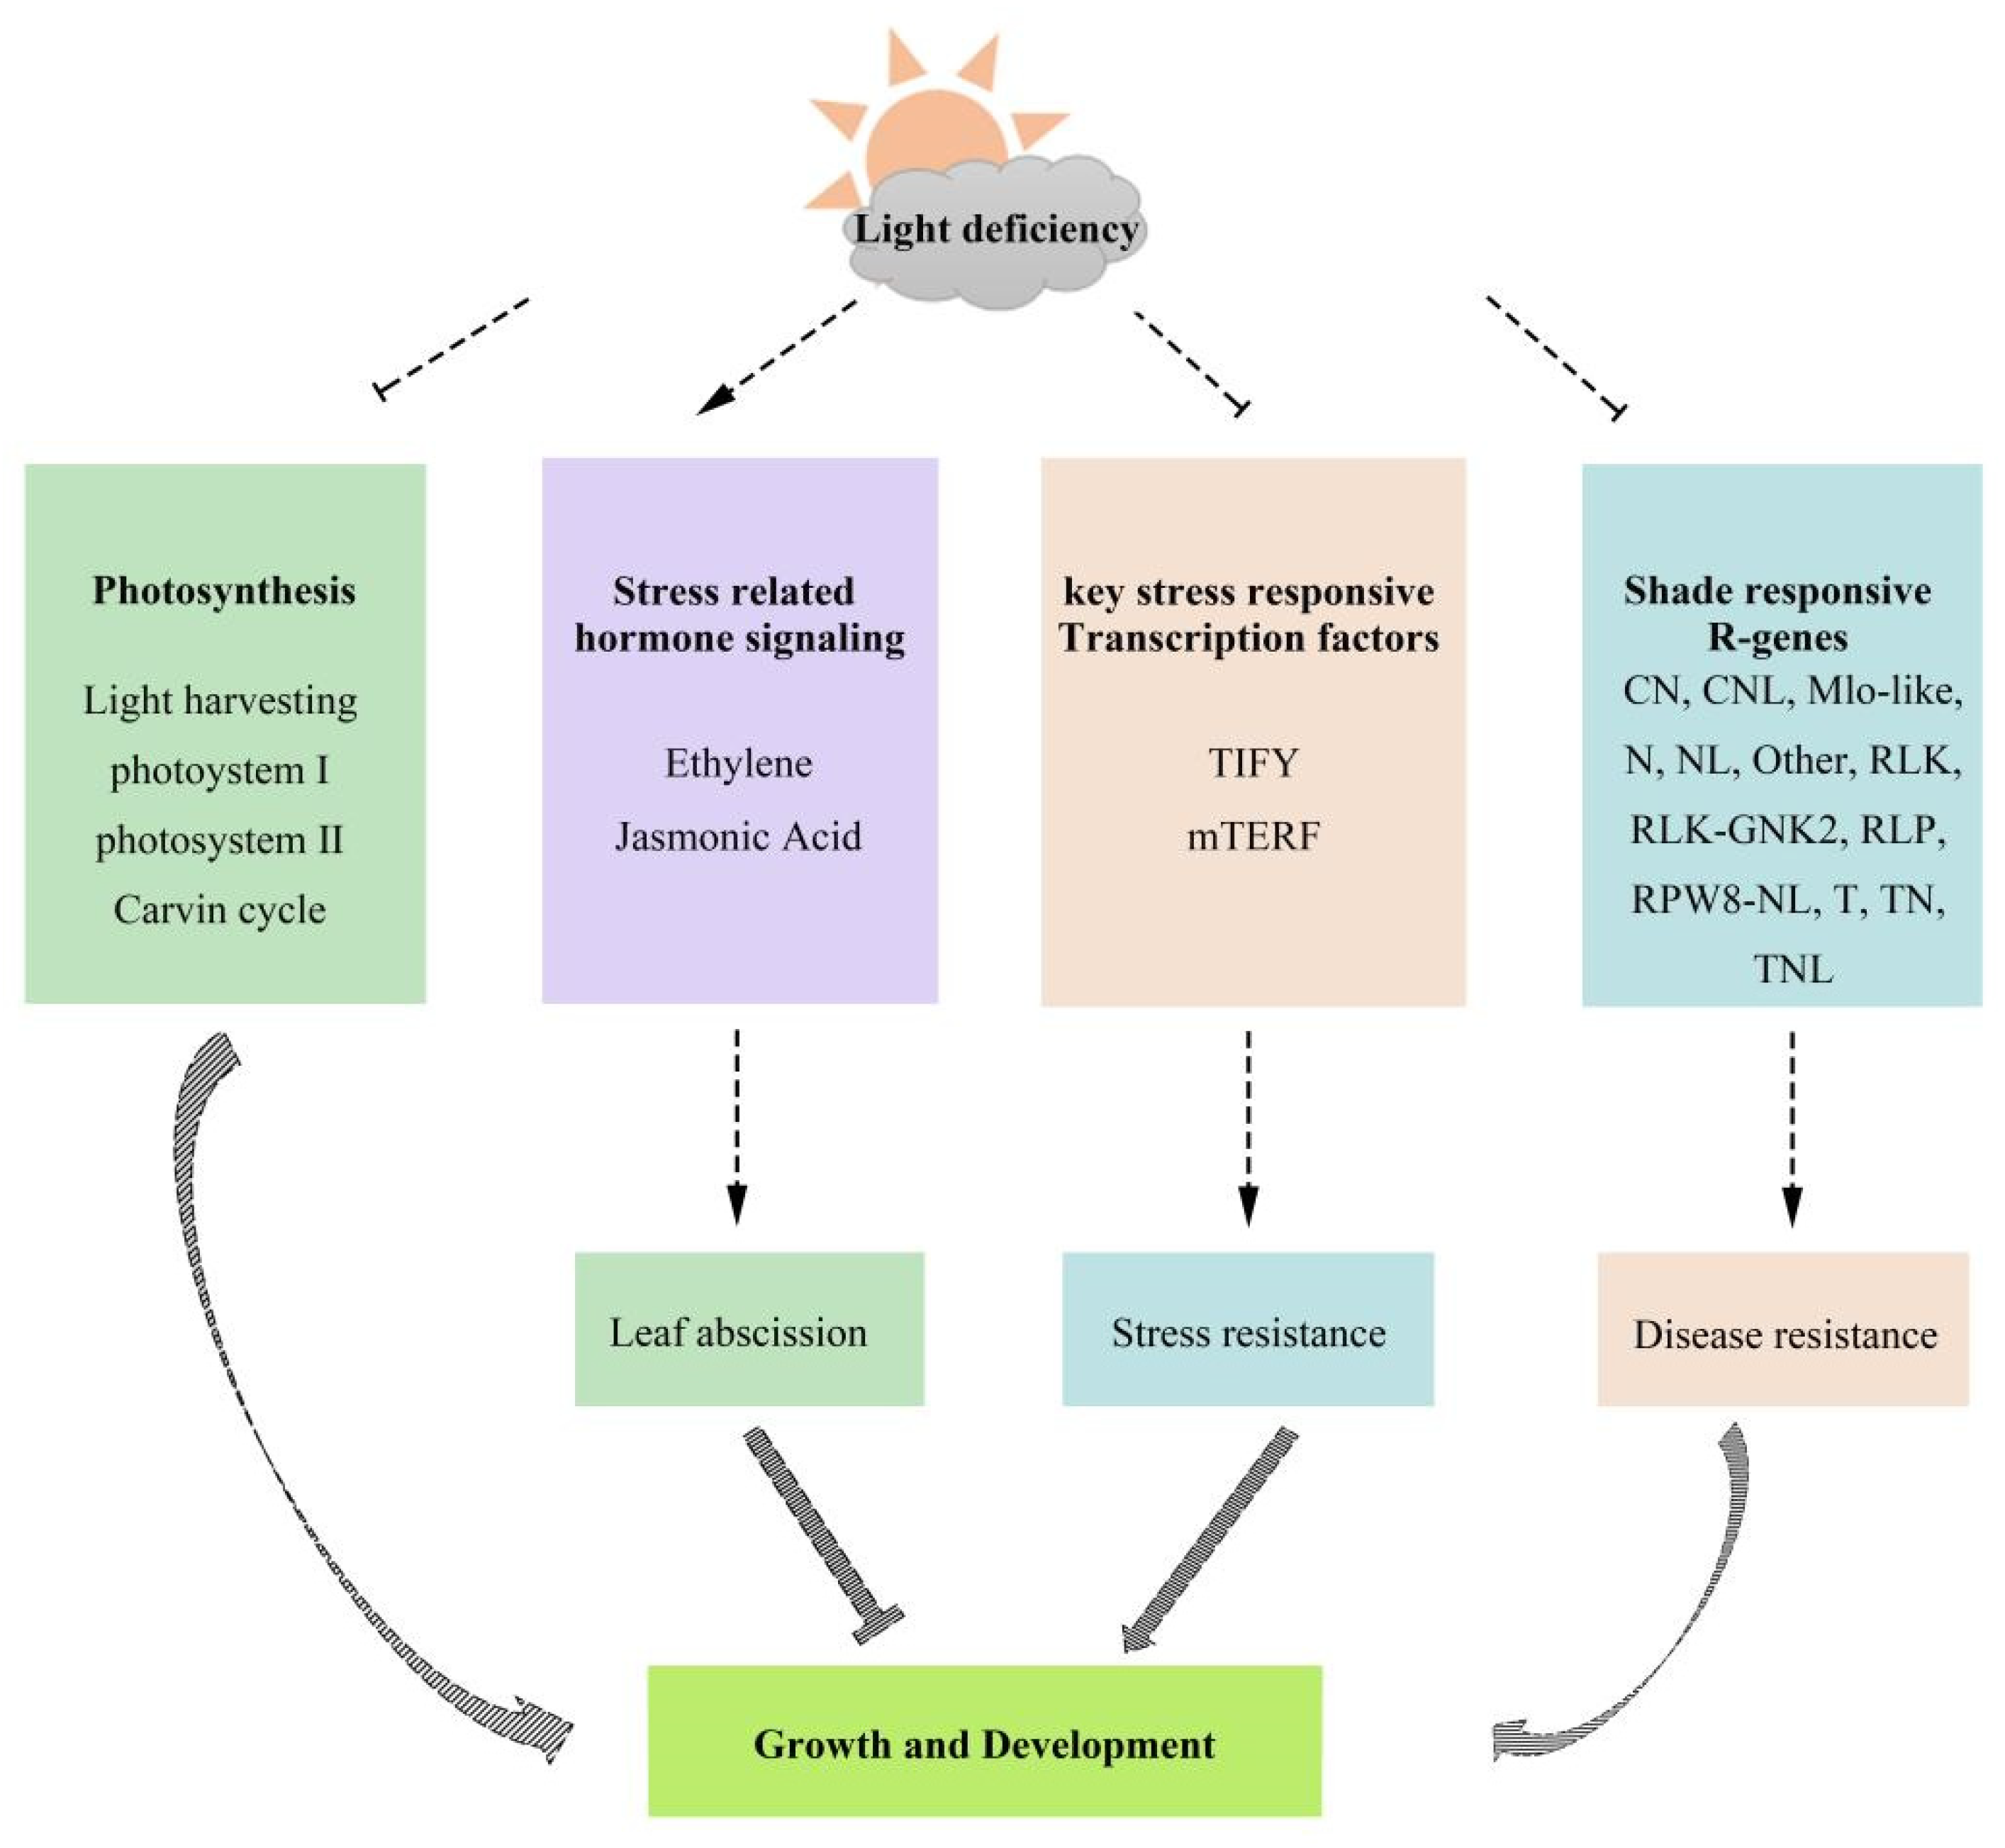
Accumulating evidence showing that changes in light condition can alter disease resistance in various plants [54], such as coffee, tomatoes, Acer rubrum, and Prunus serotina [55,56,74]. To preliminary explore the effect of light deficiency on disease resistance related molecular mechanism in M. sinostellata, R-genes were identified, and its expression pattern under light deficiency was analyzed. The 22,433 DEGs were blasted with the plant resistance gene database (PRGDB, http://prgdb.crg.eu/, access date 30 December 2020), and 1086 R genes belonging to 13 families were functionally annotated (Table 1). Among them, 644 were down-regulated, and 442 were up-regulated, showing that the disease resistance ability in M. sinostellata may have been somewhat compromised under shading (Figure 4E).
Among five Mlo-like class of R genes, four were significantly down-regulated, whereas one was up-regulated in response to low light treatment. It is interesting to note that the expression level of most R genes belonging to the CN, N, NL, RLP, and RLK-GNK2 were drastically reduced. All of the R genes in RLK and RPW8-NL classes were down regulated. In contrast, most R genes belonging to the T, TN, and other classes were up regulated, indicating that their activation was triggered by light deficiency. In both CNL and TNL classes, almost half of the R genes were up-regulated, whereas the other half were down-regulated.

3. Discussion

Canopy shade is a major abiotic stress that affect the growth and development of endangered plants in the understories of forest community [37,75]. In this study, we found that light deficiency had exacerbated leaf abscission, and negatively impacted photosynthesis and phytohormone signaling of M. sinostellata through a comprehensive analysis of transcriptome data.
Phenotype reflects growth and development condition of plants [76]. During the experiment, mature leaves of M. sinostellata gradually wilt and leaf abscission aggravated after being subjected to light deficiency treatment, which is distinct from many other plants, confirming that M. sinostellata is highly sensitive to light deficiency. When grown under weak light, elongated hypocotyls and shoots of Lycopersicon esculentum [77], Arabidopsis [78,79] and C. sativus [80] were observed. Excessive growth and elongated phenotypes were also observed in tomato, cucumber, eggplant, and lemon [16,17].
In addition, leaf chlorosis and senescence were reported in rice [81], Camellia sinensis [82] and Acer pseudoplatanus [22] under weak light, which observed in M. sinostellata. However, to our knowledge, leaf abscission exacerbated by light deficiency has not been observed in any other plants, which severely impaired the growth and development of M. sinostellata seedlings.
Photosynthesis is essential for maintaining plant growth and development [83], and it was significantly impacted by light deficiency in M. sinostellata. Under low light conditions, light captured by antenna proteins were limited. Light-harvesting antenna proteins have vital functions in photosynthesis, which enables plants to perform photosynthesis under extreme low light environments [31]. When under a short period of low light stress, the size of the light harvesting antenna increased to absorb more light [32] and the expression level of LHC genes in C. sinensis and soybean were significantly induced [28,82]. Nevertheless, the enlargement of the light-harvesting antenna is limited [33] and the expression of LHC genes in Arachis hypogaea showed a downward trend under long-term light deficiency [11].
Similarly, the expression of LHCA1-5 and LHCB1-6 were also decreased in M. sinostellata under long term light deficiency (Figure 2C,D, and Figure 3A). Photosynthetic parameters are commonly used as indicators of plant photosynthesis ability [84]. During the experiment, Pn was observed to decline after reaching its highest value. Gs and Tr consistently declined, whereas Ci significantly increased in M. sinostellata (Figure 1B–E). Similar results were reported in Sweet Pepper [85], Zea mays [86], and Castanopsis kawakamii [87], showing that the photosynthesis was inhibited under low light stress. Fv/Fm is a vital indicator of photosynthetic capacity [88] and it declined under light deficiency in M. sinostellata (Figure 1L), indicating that photosynthesis was impaired.
The reduction in the values of other parameters such as Fv/Fo, NPQ, qP, and ΦPSII (Figure 1I–P) were also consistent with previous findings in Cucumis sativus [89] and wheat [90]. These results suggest that electron transport chain in PSI and PSII could be blocked during light deficiency. Genes encoding the components of both PSI and PSII were repressed in M. sinostellata during experiment (Figure 2E,F, and Figure 3B). In most plants, photosystems are sensitive to the change in light environment and their activity could be suppressed under low light stress [91].
Rubisco activity declined after an initial rise during the light deficiency treatment (Figure 1H). Together with the reductions in the expression of RbcL and RbcS in response to light deficiency, the reduction in Rubisco activity is in line with previous findings in C. sativus [92]. A number of other genes involved in the Calvin cycle, including GADPA, GAPA and TPI, were also suppressed by shade (Figure 2G,H, and Figure 3C). Taken together, it is reasonable to say that carbon assimilation in plants could be depressed due to the down-regulation of a suite of genes involved in carbon fixation, which directly inhibits plant growth.
Phytohormones are essential for coordinating various signaling pathways in response to abiotic stress in plants [43]. In addition to the stress response and plant growth, phytohormones can also regulate leaf abscission [93,94], which were observed in M. sinostellata in this study (Figure 1A). The increase in ethylene content can promote leaf abscission [95,96]. 1-Aminocyclopropane-1-carboxylic acid (ACC) is the direct precursors of ethylene, and its content is positively correlated with ethylene [97]. The ACC level in M. sinostellata increased in response to light deficiency (Figure 4C), indicating that the content of ethylene also increased under weak light.
The core regulators of ethylene signaling ethylene-insensitive 3 (EIN3) and ethylene response factors (ERF) were mostly induced under shading in M. sinostellata (Figure 4A). ERF functions downstream of EIN3 and drives ethylene-induced senescence [98]. Further, ethylene can facilitate leaf abscission by weakening the cell walls in the abscission zone [94]. The activation of JA accumulation and signaling triggers the plant stress response and enhances stress tolerance [99]. The increase in JA content under abiotic stress can enhance plant resistance [100], while its reduced content under long term stress increases stress sensitivity [101].
In this study, the level of endogenous JA decreased in M. sinostellata leaves under light deficiency (Figure 4D). In addition, the expression of JAR1 decreased under low light, which interacts with coronatine-insensitive protein 1 (COI1) and then leads to the degradation of JAZ proteins. The down regulation of JAZ is an indication of the weakening of stress resistance [72]. As MYC2 is key transcription activator of JA-Ile/COI1 signaling [102], its downregulation under light deficiency is perhaps not surprising (Figure 4B). Collectively, the exacerbated leaf abscission observed in this study could be explained by the concerted regulation of ethylene and JA signaling pathways.
Various studies found that low light intensity can impact disease resistance in plants, and many works proved that plants reduced stress tolerance under light deficiency [50,51,52,53,54,55,56]. Moreover, our previous study also found that light deficiency impacted stress tolerance in M. sinostellata [64]. To explore the mechanism at the molecular level, stress-related TFs and R genes were identified and analyzed. Stress responsive transcription factors TIFY and mTERF are closely associated with defense and stress response [62,103]. Most TIFY family genes are stress inducible and able to enhance plant stress tolerance by its high expression [58,61,104].
In this study, the expression of all seven MsTIFYs were regulated by light deficiency (Figure 5A), suggesting that its function was suppressed under long term light deficiency. Another stress-responsive TF family mTERF was also reported to regulate plant development and various stress responses [63,105]. Down-regulation of mTERFs would impair chloroplast or mitochondria development [62]. Mutants of AtmTERF9 showed altered response to multiple abiotic stresses [106]. The defective mutants of mTERF6 and mTERF10 in Arabidopsis were hypersensitive to multiple abiotic stresses, while their overexpression could increase stress tolerance [63,105]. The consistent decline in the expression levels of the seven MsmTERFs identified in M. sinostellata (Figure 5C,D) is in agreement with previous findings in Z. mays [73]. R-genes play pivotal roles in restricting pathogen invasion and triggering plant defense responses [107].
The R-genes are classified into five main groups according to their conserved domains and motifs [108]. Due to the high costs of maintaining R-protein-dependent expression, expression levels of R genes are tightly regulated [109]. The expression pattern could be altered by both biotic and abiotic stresses [110,111]. The increased expression of R genes could enhance immunity to bacterial pathogens in plants [112]. The alterations in the expression patterns of a large number of M. sinostellata R-genes discovered in this study suggest that the overall resistance capacity to various pathogens might be affected (Figure 5E), which warrants further studies.
The preliminary study suggested that M. sinostellata was hypersensitive to low light intensity and weak light could severely impact on photosynthesis, phytohormone signaling, expression of stress related TFs, and R-genes of M. sinostellata.

4. Materials and Methods

4.1. Plant Materials and Shade Treatments

The M. sinostellata seedlings were collected from the Lin’an district, Hangzhou in Zhejiang province, China. Throughout the experiment, these seedlings were placed in an artificial climate room (photosynthesis active radiation (PAR) of 648 μmol·m–2·s–1, 14 h photoperiod, temperature 25 °C, humidity 40–60%) in Zhejiang Agriculture and Forestry University. In order to simulate shade-caused low light intensity conditions, seedlings in the treated group (light deficiency treatment, LT) were placed in the shade set-up, which was built using black shade net (25% of full light, PAR of 162 μmol·m–2·s–1, R/FR ratio: 1.09) and several bamboo poles (Figure S7). Seedlings in the control group (control, CK) were not shaded (100% of full light, PAR of 648 μmol·m–2·s–1, R/FR ratio: 1.10).
The illumination intensities in the control group and treated group were measured in luminous flux (LUX) with a digital luxmeter (ZDS-10, Shanghai Jiading Xuelian Instrument Co., Ltd., Shanghai, China). Light intensity was converted from LUX to PAR following methods by Chen [113]. R/FR ratios under different conditions were measured by using a NIR spectrometer (Avaspec-HS-TEC, Avantes, The Netherlands). The data of light intensity and quality in experimental or natural conditions is provided in Table S8. All other experimental conditions were maintained the same for both LT and CK. Each group comprised three replicates. Leaf samples were collected from the seedlings in LT and CK groups at 0, 1, 5, 10, 15, 25, and 30 days (d) and stored at −80 °C for further experiments after being snap frozen in liquid nitrogen until further experiment. Each sample was collected from three seedlings, and each collection was repeated three times as biological replicates.

4.2. Measurement of Photosynthetic Parameters

The photosynthetic parameters, including the net photosynthetic rate (Pn), intercellular carbon dioxide concentration (Ci), stomatal conductance (Gs), and transpiration rate (Tr) were measured between 9:00 and 11.30 a.m. using a LI-6400 photosynthesis analyzer (LI-COR Biosciences, Lincoln, NE, USA). The water-use efficiency (WUE) and light-use efficiency (LUE) were calculated according to the formulas: WUE = Pn/Tr; LUE = Pn/PAR (photosynthetically active radiation). The parameters of the photosynthesis analyzer were set as follows: CO2 concentration at 380 µmol·mol–1; airflow rate at 500 µmol·s–1; block leaf temperature at 25 °C; photosynthetic photon flow density (PPFD) at 800 µmol·m−2·s−1. All the measurements were performed in triplicate.

4.3. Measurement of Chlorophyll Fluorescence Parameters

The chlorophyll fluorescence parameters were determined using a leaf chamber with a red/blue light source in the LI-6400 portable gas exchange system (Li-Cor, Lincoln, NE, USA). Before the initial fluorescence intensity (Fo) determination, leaves were dark-adapted for 30 min. Subsequently, the maximum fluorescence (Fm) was induced and measured by applying a flash of saturating light (6000 μmol·m−2·s−1, 0.7 s). When measuring Fo and Fm, the PPFD was set at 0 µmol·m−2·s−1. After fully light-adaption, the steady-state fluorescence level (Fs) and maximal fluorescence (Fm’) were measured with the PPFD set at 800 µmol·m−2·s−1. The maximal photochemical efficiency (Fv/Fm), actual photochemical efficiency (ΦPSⅡ), non-photochemical dissipation of absorbed light energy (NPQ), and the coefficient for photochemical quenching (qP) were calculated according to the following formulas [86,89]: Fv/Fm = (Fm − Fo)/Fm; ΦPSII= (Fm’ − Fs)/Fm’; qP = (Fm’ − Fs)/(Fm’ − Fo’); and NPQ = (Fm − Fm’)/Fm’. Each measurement comprised three replicates.

4.4. Determination of Rubisco Activity

Fresh leaf samples of M. sinostellata were pooled to measure and calculate the Ribulose diphosphate carboxylase/oxygenase (Rubisco) activity. The Rubisco activity was determined according to the instruction of the Rubisco assay kit (Beijing Solarbio Science & Technology Co., Ltd., Beijing, China). The Rubisco enzyme activity was measured in the unit of U/g, which represents the oxidation of 1 μmol of NADH per min. Each enzyme activity determination was repeated at least three times.

4.5. Transcriptome Sequencing and Analysis

Based on physiological measurement results, samples of d0 (mixed samples of CK-D0 and LT-D0), d5 (CK-D5 and LT-D5), and d15 (CK-D15 and LT-D15) with three biological replicates were collected for subsequent sequencing and analysis. To obtain full-length cDNA sequences, the total RNAs of all the 15 samples were mixed in equal quantities to construct a PacBio Iso-Seq library. The first strand cDNA was synthesized using UMI base PCR cDNA Synthesis Kit (Beijing Genomics institution, Beijing, China).
High-quality full-length consensus sequences were obtained after using SMRT analysis suite to perform insert recognition including Reads of insert (ROI), Reads classification (Classify), and Reads clustering and correction (Cluster, Quvier), which serve as the reference gene sequences of M. sinostellata. Clustering de-redundancy was performed, and the transcripts were then annotated using the public databases including NR, NT, swiss-prot, COG, KEGG, and GO. The total RNAs of the 15 samples were purified, fragmented, reversed, and then synthesized into cDNAs to form double-stranded DNAs. The ends of synthetic double-stranded DNA were filled and repaired. Using specific primers to amplify the ligation product by PCR, the product was denatured into single-strands to obtain a single-stranded circular DNA library using a bridge primer. The single-stranded circular DNA library was sequenced on the DNBSEQ platform.

4.6. Analysis of Shade Responsive DEGs

The expression level of each transcript was normalized using the FPKM (fragments per kilobase of exon per million mapped fragments) method. The R package (edgeR v3.16) was employed to analyze the normalized gene expression level data in order to identify the differentially expressed genes (DEGs) under shading treatments. Genes that fulfilled the criteria of Log2fold change > 2 and q value < 0.05 were identified as DEGs, with a false discovery rate (FDR) < 0.05. The function of the DEGs was annotated using the Gene Ontology (GO) and Kyoto Encyclopedia of Genes and Genomes (KEGG). The phyper function in R software was employed for enrichment analysis.

4.7. Bioinformatic Analysis

DEGs that are involved in the light-regulated and plant hormone pathways were filtered based on GO and KEGG annotation. To identify stress-response TFs, the Getorf function in EMBOSS software was used to predict the open reading frames (ORFs) of the unigenes, from which the TF domains were searched using the Hmmsearch function. CLUSTALW was used to align the amino acid sequences of TFs, and the neighbor joining trees were constructed by using MEGA 5.0 software. The fasta format of DNA sequences of the unigenes was subjected to blast search against the plant disease resistance gene database (PRGDB) using the DIAMOND software. The R genes were filtered and obtained according to the query coverage and the identity of the blast results. Volcano plots were performed using R software. Heatmaps were generated using Morpheus (Morpheus, https://software.broadinstitute.org/morpheus, access date 12 October 2021).

4.8. qRT-PCR Analysis

The total RNA of the 15 leaf samples was extracted using an RNAprep Pure Plant Plus kit (TIANGEN Biotech, Beijing, China) following the manufacturer’s instructions. Electrophoretic apparatus DYY-6C (LIUYI Biotech, Beijing, China), and agarose for electrophoresis use (Sangon Biotech, Shanghai, China) was used to analyze the integrity of RNAs. The purity and concentration of the total RNAs were analyzed by a NanoDrop system (Thermo Fisher Scientific, Waltham, MA, USA). The total RNAs were converted to cDNAs using the PrimeScript™ RT Master Mix (Takara Bio Inc., Shiga, Japan).
Premier 5.0 was employed to design oligo primers for quantitative real time PCR (qRT-PCR), as listed in Table S1. qRT-PCR analysis was performed on LightCycler® 480 II (Roche Applied Science, Penzberg, Germany) using BCG qPCR Master Mix (Beijing Baikaiji Biotechnology Co., Ltd., Beijing, China) using a program that was set with an initial denaturing at 95 °C for 30 s, which was followed by 40 cycles of 95 °C for 5 s and 58 °C for 30 s. Melting curves were generated after the end of the program from 65 °C to 95 °C with 0.2 °C increments. M. sinostellata EF1-α was employed as the reference gene (Forward: 5′-GATGATTCCAACCAAGCCCA -3′, Reverse: 5′-CACCCACTGCAACAGTCTGG -3′) and gene expression was determined using 2−∆∆Ct method [114].
All the qRT-PCR analysis experiments were performed in triplicate. The bar charts of the relative expression level were generated using the Graph pad software (Graph Pad Software, San Diego, CA, USA). SPSS software version 24.0 (SPSS, Inc., Chicago, IL, USA) was employed to analyze statistical significance.

4.9. Phytohormone Quantification

In order to analysis the trend for change in phytohormones, leaf samples of d0 (mixed samples of CK-D0 and LT-D0) and d15 (CK-D15 and LT-D15) with three biological replicates were collected for phytohormone quantification. Approximately 500 mg of each sample was rapidly frozen in liquid nitrogen. The extraction and quantification of endogenous ACC (ethylene precursors) and JA were performed using an LC-ESI-MS/MS system (UPLC, Shim-pack UFLC SHIMADZU CBM30A system, http://www.shimadzu.com.cn/, access date 12 October 2021, Kyoto, Japan; MS/MS, Applied Biosystems, Foster City, CA, 6500 Quadrupole Trap, http://www.appliedbiosystems.com.cn/, access date 12 October 2021) by Wuhan Metware Biotechnology Co., Ltd. (Wuhan, China) [115,116,117,118,119].

5. Conclusions

We provided novel insights into the light deficiency response mechanism in an endangered ornamental tree species M. sinostellata through the analyses of transcriptome deep sequencing and photosynthesis efficiency. Under low light conditions, the intensity of light that captured by light harvesting complex was reduced. Then, the electron transport chains in PS I and PS II were affected. Due to the decline in ATP and NADPH production in the photosystem, the carbon fixation in the Calvin cycle and subsequent carbon metabolism were blocked.
The signaling transduction and accumulation of ET were enhanced, while the content of JA was reduced in M. sinostellata. The expression of stress-responsive transcription TIFY and mTERF was repressed. In addition, most R-genes were downregulated under low-light conditions. Overall, light deficiency could impact on the growth of M. sinostellata plants through its direct effects on photosynthesis, phytohormone transduction, stress related TFs, and R-genes (Figure 6). The DEGs discovered in this study may facilitate further study on light deficiency responsive molecular mechanisms in plants.

Supplementary Materials

The following are available online at https://www.mdpi.com/article/10.3390/plants10112261/s1, Figure S1: Changes in leaf abscission rate during shading treatment, Figure S2: Subread length distribution, Figure S3: BUSCO assembly evaluation results, Figure S4: Box plot of the expression levels of 15 samples, Figure S5: Principal component analysis of 15 samples, Figure S6: Shade responsive DEGs identified in M. sinostellata. (A) Number of DEGs detected in four comparison groups. (B) Venn diagram of DEGs commonly or specifically expressed in M. sinostellata under shade treatment, Figure S7: Shading treatment device used in this research, Table S1: Primers for quantitative real time PCR (RT-qPCR), Table S2: Summary of the final transcript sequence obtained after de-redundancy, Table S3: Summary of function annotation result statistics, Table S4: Summary of filtered read quality statistics, Table S5: Summary of reference gene sequence alignment results, Table S6: Information of TIFY gene family in M. sinostellata, Table S7: Information of mTERF gene family in M. sinostellata, Table S8: The light intensity and quality in different conditions.

Author Contributions

Conceptualization, D.L. and B.L.; methodology, D.L.; software, D.L.; validation, J.M., M.R. and C.W.; formal analysis, B.L.; investigation, Y.S.; resources, Y.S.; data curation, C.W.; writing—original draft preparation, D.L.; writing—review and editing, Y.S.; visualization, M.R.; supervision, Y.S.; project administration, Y.S.; funding acquisition, Y.S. All authors have read and agreed to the published version of the manuscript.

Funding

This research was funded by Zhejiang Provincial Key Laboratory of Germplasm Innovation and Utilization for Garden Plants, grant number S2020004; 14th Five year Plan of Flower Variety Breeding in Zhejiang province, grant number 2021C02071-3; Key R&D project of Shanghai Municipal Science and Technology Commission ‘R&D and demonstration application of new varieties of white magnolia cultivation technology’, grant number 20DZ1203700.

Data Availability Statement

The original transcriptome data used in this research was deposited in the National Center for Biotechnology Information (NCBI) with the accession number PRJNA770262.

Conflicts of Interest

The authors declare no conflict of interest. The funders had no role in the design of the study; in the collection, analyses, or interpretation of data; in the writing of the manuscript, or in the decision to publish the results.

References

  1. Baranova, M. Systematic Anatomy of the Leaf Epidermis in the Magnoliaceae and Some Related Families. Int. Assoc. Plant Taxon. IAPT 1972, 21, 447–469. [Google Scholar]
  2. Shen, Y.; Meng, D.; McGrouther, K.; Zhang, J.; Cheng, L. Efficient isolation of Magnolia protoplasts and the application to subcellular localization of MdeHSF1. Plant Methods 2017, 13, 44. [Google Scholar] [CrossRef]
  3. Suzuki, S.; Kiyoshi, I.; Saneyoshi, U.; Yoshihiko, T.; Nobuhiro, T. Population differentiation and gene flow within ametapopulation of a threatened tree, Magnolia stellata (magnoliaceae). Am. J. Bot. 2007, 94, 128–136. [Google Scholar]
  4. Jiang, G.; Sun, G.; Zhang, G.; Wang, J. Intraspecific and interspecific competition of the endangered plant Magnolia zenii. J. Ecol. 2010, 29, 201–206. [Google Scholar]
  5. Yang, Y.; Jia, Z.; Chen, F.; Sang, Z.; Ma, L. Optimum light environment of rare tree species Magnolia wufengensis in North China. Acta Plant Sci. 2015, 33, 377–387. [Google Scholar]
  6. Tan, M.; Yang, Z.; Yang, X.; Cheng, X.; Li, G.; Ma, W. Study on seed germination and seedling growth of Magnolia officinalis in different habitats. J. Ecol. Rural Environ. 2018, 34, 910–916. [Google Scholar]
  7. Yu, Z.; Chen, C.; Lu, L.; Liu, X.; Yin, H.; Shen, Y. Study on Population Distribution and Community Structure of Magnolia sinostellata. Zhejiang For. Sci. Technol. 2015, 35, 47–52. [Google Scholar]
  8. Yu, Q.; Shen, Y.; Wang, Q.; Wang, X.; Fan, L.; Wang, Y.; Zhang, S.; Liu, Z.; Zhang, M. Light deficiency and waterlogging affect chlorophyll metabolism and photosynthesis in Magnolia sinostellata. Trees 2018, 33, 11–22. [Google Scholar] [CrossRef]
  9. Zivcak, M.; Brestic, M.; Kalaji, H.M.; Govindjee. Photosynthetic responses of sun- and shade-grown barley leaves to high light: Is the lower PSII connectivity in shade leaves associated with protection against excess of light? Photosynth. Res. 2014, 119, 339–354. [Google Scholar] [CrossRef] [Green Version]
  10. Promis, A.; Allen, R.B. Tree seedlings respond to both light and soil nutrients in a Patagonian evergreen-deciduous forest. PLoS ONE 2017, 12, e0188686. [Google Scholar]
  11. Chen, T.; Zhang, H.; Zeng, R.; Wang, X.; Huang, L.; Wang, L.; Wang, X.; Zhang, L. Shade Effects on Peanut Yield Associate with Physiological and Expressional Regulation on Photosynthesis and Sucrose Metabolism. Int. J. Mol. Sci. 2020, 21, 5284. [Google Scholar] [CrossRef]
  12. Semchenko, M.; Lepik, M.; Götzenberger, L.; Zobel, K. Positive effect of shade on plant growth: Amelioration of stress or active regulation of growth rate? J. Ecol. 2012, 100, 459–466. [Google Scholar] [CrossRef]
  13. Carabelli, M.; Possenti, M.; Sessa, G.; Ruzza, V.; Morelli, G.; Ruberti, I. Arabidopsis HD-Zip II proteins regulate the exit from proliferation during leaf development in canopy shade. J. Exp. Bot. 2018, 69, 5419–5431. [Google Scholar] [CrossRef] [PubMed]
  14. Gong, W.; Qi, P.; Du, J.; Sun, X.; Wu, X.; Song, C.; Liu, W.; Wu, Y.; Yu, X.; Yong, T.; et al. Transcriptome analysis of shade-induced inhibition on leaf size in relay intercropped soybean. PLoS ONE 2014, 9, e98465. [Google Scholar]
  15. Gao, J.; Liu, Z.; Zhao, B.; Liu, P.; Zhang, J.W. Physiological and comparative proteomic analysis provides new insights into the effects of shade stress in maize (Zea mays L.). BMC Plant Biol. 2020, 20, 60. [Google Scholar] [CrossRef] [PubMed]
  16. Ji, Y.; Chen, G.; Zheng, X.; Zhong, Q.; Zhang, M.; Wu, Z.; Wen, C.; Liu, M. Comprehensive Transcriptome Reveals an Opposite Regulatory Effect of Plant Growth Retardants in Controlling Seedling Overgrowth between Roots and Shoots. Int. J. Mol. Sci. 2019, 20, 3307. [Google Scholar] [CrossRef] [Green Version]
  17. García-Sánchez, F.; Simón, I.; Lidón, V.; Manera, F.J.; Simón-Grao, S.; Pérez-Pérez, J.G.; Gimeno, V. Shade screen increases the vegetative growth but not the production in ‘Fino 49’ lemon trees grafted on Citrus macrophylla and Citrus aurantium L. Sci. Hortic. 2015, 194, 175–180. [Google Scholar] [CrossRef]
  18. Sano, S.; Takemoto, T.; Ogihara, A.; Suzuki, K.; Masumura, T.; Satoh, S.; Takano, K.; Mimura, Y.; Morita, S. Stress Responses of Shade-Treated Tea Leaves to High Light Exposure after Removal of Shading. Plants 2020, 9, 302. [Google Scholar] [CrossRef] [Green Version]
  19. Zhao, D.; Hao, Z.; Tao, J. Effects of shade on plant growth and flower quality in the herbaceous peony (Paeonia lactiflora Pall.). Plant Physiol. Biochem. 2012, 61, 187–196. [Google Scholar] [CrossRef]
  20. Dai, Y.; Shen, Z.; Liu, Y.; Wang, L.; Hannaway, D.; Lu, H. Effects of shade treatments on the photosynthetic capacity, chlorophyll fluorescence, and chlorophyll content of Tetrastigma hemsleyanum Diels et Gilg. Environ. Exp. Bot. 2009, 65, 177–182. [Google Scholar] [CrossRef]
  21. Sedigheh, R.; Nematollah, E.; Ali, N.; Mostafa, Y.; Mohamad, M. Effect of Light Intensity on Leaf Morphology, Photosynthetic Capacity, and Chlorophyll Content in Sage (Salvia officinalis L.). Korean J. Hortic. Sci. Technol. 2018, 36, 46–57. [Google Scholar]
  22. Lichtenthaler, H.K.; Ac, A.; Marek, M.V.; Kalina, J.; Urban, O. Differences in pigment composition, photosynthetic rates and chlorophyll fluorescence images of sun and shade leaves of four tree species. Plant Physiol. Biochem. 2007, 45, 577–588. [Google Scholar] [CrossRef]
  23. Kozuka, T.; Horiguchi, G.; Kim, G.T.; Ohgishi, M.; Sakai, T.; Tsukaya, H. The different growth responses of the Arabidopsis thaliana leaf blade and the petiole during shade avoidance are regulated by photoreceptors and sugar. Plant Cell Physiol. 2005, 46, 213–223. [Google Scholar] [CrossRef] [Green Version]
  24. Franklin, K.A.; Praekelt, U.; Stoddart, W.M.; Billingham, O.E.; Halliday, K.J.; Whitelam, G.C. Phytochromes B, D, and E act redundantly to control multiple physiological responses in Arabidopsis. Plant Physiol. 2003, 131, 1340–1346. [Google Scholar] [CrossRef] [PubMed] [Green Version]
  25. Yasui, Y.; Mukougawa, K.; Uemoto, M.; Yokofuji, A.; Suzuri, R.; Nishitani, A.; Kohchi, T. The phytochrome-interacting vascular plant one-zinc finger1 and VOZ2 redundantly regulate flowering in Arabidopsis. Plant Cell. 2012, 24, 3248–3263. [Google Scholar] [CrossRef] [PubMed] [Green Version]
  26. Liu, B.; Weng, J.; Guan, D.; Zhang, Y.; Niu, Q.; López-Juez, E.; Lai, Y.; Garcia-Mas, J.; Huang, D. A domestication-associated gene, CsLH, encodes a phytochrome B protein that regulates hypocotyl elongation in cucumber. Mol. Hortic. 2021, 1, 3. [Google Scholar] [CrossRef]
  27. Franklin, K.A. Shade avoidance. New Phytol. 2008, 179, 930–944. [Google Scholar] [CrossRef] [PubMed]
  28. Yang, F.; Feng, L.; Liu, Q.; Wu, X.; Fan, Y.; Raza, M.A.; Cheng, Y.; Chen, J.; Wang, X.; Yong, T. Effect of interactions between light intensity and red-to- far-red ratio on the photosynthesis of soybean leaves under shade condition. Environ. Exp. Bot. 2018, 150, 79–87. [Google Scholar] [CrossRef]
  29. Luesse, D.R.; DeBlasio, S.L.; Hangarter, R.P. Integration of Phot1, Phot2, and PhyB signalling in light-induced chloroplast movements. J. Exp. Bot. 2010, 61, 4387–4397. [Google Scholar] [CrossRef]
  30. Dinakar, C.; Vishwakarma, A.; Raghavendra, A.S.; Padmasree, K. Alternative Oxidase Pathway Optimizes Photosynthesis During Osmotic and Temperature Stress by Regulating Cellular ROS, Malate Valve and Antioxidative Systems. Front. Plant Sci. 2016, 7, 68. [Google Scholar] [CrossRef] [PubMed] [Green Version]
  31. Kriete, B.; Luttig, J.; Kunsel, T.; Maly, P.; Jansen, T.L.C.; Knoester, J.; Brixner, T.; Pshenichnikov, M.S. Interplay between structural hierarchy and exciton diffusion in artificial light harvesting. Nat Commun. 2019, 10, 4615. [Google Scholar] [CrossRef] [Green Version]
  32. Friedland, N.; Negi, S.; Vinogradova-Shah, T.; Wu, G.; Ma, L.; Flynn, S.; Kumssa, T.; Lee, C.H.; Sayre, R.T. Fine-tuning the photosynthetic light harvesting apparatus for improved photosynthetic efficiency and biomass yield. Sci. Rep. 2019, 9, 13028. [Google Scholar] [CrossRef]
  33. Zhou, J.; Zeng, L.; Liu, J.; Xing, D. Manipulation of the Xanthophyll Cycle Increases Plant Susceptibility to Sclerotinia sclerotiorum. PLoS Pathog. 2015, 11, e1004878. [Google Scholar]
  34. Tamoi, M.; Nagaoka, M.; Miyagawa, Y.; Shigeoka, S. Contribution of fructose-1,6-bisphosphatase and sedoheptulose-1,7-bisphosphatase to the photosynthetic rate and carbon flow in the Calvin cycle in transgenic plants. Plant Cell Physiol. 2006, 47, 380–390. [Google Scholar] [CrossRef] [PubMed] [Green Version]
  35. Blenkinsopp, G.; Dale, J.E. The Effects of Shade Treatment and Light Intensity on Rihulose-1,5-Diphosphate Carboxylase Activity. J. Exp. Bot. 1974, 25, 899–912. [Google Scholar] [CrossRef]
  36. Lee, K.; Lee, S.; Woo, S. Rubisco activity and gene expression of tropical tree species under light stress. Afr. J. Biotechnol. 2013, 12, 2764–2769. [Google Scholar]
  37. Geromel, C.; Ferreira, L.P.; Davrieux, F.; Guyot, B.; Ribeyre, F.; Brigida, S.; Protasio, P.; Vaast, P.; Pot, D.; Leroy, T. Effects of shade on the development and sugar metabolism of coffee (Coffea arabica L.) fruits. Plant Physiol. Biochem. 2008, 46, 569–579. [Google Scholar] [CrossRef] [PubMed] [Green Version]
  38. Zhang, Q.; Liu, M.; Ruan, J. Integrated Transcriptome and Metabolic Analyses Reveals Novel Insights into Free Amino Acid Metabolism in Huangjinya Tea Cultivar. Front. Plant Sci. 2017, 8, 291. [Google Scholar] [CrossRef] [Green Version]
  39. Tamaki, I.; Nomura, K.; Nomura, R.; Tate, C.; Watanabe, C.; Miyakami, Y.; Yabe, Y. Evaluation of a field experiment for the conservation of a Magnolia stellata stand using clear-cutting. Landsc. Ecol. Eng. 2018, 14, 269–276. [Google Scholar]
  40. Liu, G.; Jiang, J.; Liu, X.; Jiang, J.; Sun, L.; Duan, W.; Li, R.; Wang, Y.; Lecourieux, D.; Liu, C. New insights into the heat responses of grape leaves via combined phosphoproteomic and acetylproteomic analyses. Hortic. Res. 2019, 6, 100. [Google Scholar] [CrossRef] [Green Version]
  41. Li, P.; Zhang, B.; Su, T.; Li, P.; Xin, X.; Wang, W.; Zhao, X.; Yu, Y.; Zhang, D.; Yu, S. BrLAS, a GRAS Transcription Factor from Brassica rapa, Is Involved in Drought Stress Tolerance in Transgenic Arabidopsis. Front. Plant Sci. 2018, 9, 1792. [Google Scholar] [CrossRef] [Green Version]
  42. Panigrahy, M.; Ranga, A.; Das, J.; Panigrahi, K. Shade tolerance in Swarnaprabha rice is associated with higher rate of panicle emergence and positively regulated by genes of ethylene and cytokinin pathway. Sci. Rep. 2019, 9, 6817. [Google Scholar] [CrossRef]
  43. Liang, S.; Xiong, W.; Yin, C.; Xie, X.; Jin, Y.; Zhang, S.; Yang, B.; Ye, G.; Chen, S.; Luan, W. Overexpression of OsARD1 Improves Submergence, Drought, and Salt Tolerances of Seedling Through the Enhancement of Ethylene Synthesis in Rice. Front. Plant Sci. 2019, 10, 1088. [Google Scholar] [CrossRef]
  44. Marczak, M.; Ciesla, A.; Janicki, M.; Kasprowicz-Maluski, A.; Kubiak, P.; Ludwikow, A. Protein Phosphatases Type 2C Group A Interact with and Regulate the Stability of ACC Synthase 7 in Arabidopsis. Cells 2020, 9, 978. [Google Scholar] [CrossRef] [Green Version]
  45. Mir, M.A.; John, R.; Alyemeni, M.N.; Alam, P.; Ahmad, P. Jasmonic acid ameliorates alkaline stress by improving growth performance, ascorbate glutathione cycle and glyoxylase system in maize seedlings. Sci. Rep. 2018, 8, 2831. [Google Scholar] [CrossRef]
  46. Balfagon, D.; Sengupta, S.; Gomez-Cadenas, A.; Fritschi, F.B.; Azad, R.K.; Mittler, R.; Zandalinas, S.I. Jasmonic Acid Is Required for Plant Acclimation to a Combination of High Light and Heat Stress. Plant Physiol. 2019, 181, 1668–1682. [Google Scholar] [CrossRef] [PubMed] [Green Version]
  47. Zinovieva, S.V.; Vasyukova, N.I.; Udalova, Z.V.; Gerasimova, N.G. The Participation of salicylic and jasmonic acids in genetic and induced resistance of tomato to Meloidogyne incognita (Kofoid and White, 1919). Biol. Bull. 2013, 40, 297–303. [Google Scholar] [CrossRef]
  48. Deb, A.; Grewal, R.K.; Kundu, S. Regulatory Cross-Talks and Cascades in Rice Hormone Biosynthesis Pathways Contribute to Stress Signaling. Front. Plant Sci. 2016, 7, 1303. [Google Scholar] [CrossRef] [PubMed] [Green Version]
  49. Yang, J.; Duan, G.; Li, C.; Liu, L.; Han, G.; Zhang, Y.; Wang, C. The Crosstalks Between Jasmonic Acid and Other Plant Hormone Signaling Highlight the Involvement of Jasmonic Acid as a Core Component in Plant Response to Biotic and Abiotic Stresses. Front. Plant Sci. 2019, 10, 1349. [Google Scholar] [CrossRef] [PubMed] [Green Version]
  50. Shao, Q.; Wang, H.; Guo, H.; Zhou, A.; Huang, Y.; Sun, Y.; Li, M. Effects of shade treatments on photosynthetic characteristics, chloroplast ultrastructure, and physiology of Anoectochilus Roxburghii. PLoS ONE 2014, 9, e85996. [Google Scholar] [CrossRef]
  51. Chen, B.; Li, Y.; Liu, G.; Fan, S.; Yang, H.; Su, H. Effects of the interaction between shade and drought on physiological characteristics in Calamus viminalis seedlings. Not. Bot. Horti Agrobot. Cluj-Napoca 2020, 48, 305–317. [Google Scholar] [CrossRef] [Green Version]
  52. Zong, X.; Yang, A.; Ahmad, A.; Lv, J.; Li, N.; He, X.; Xu, Y.; Wu, X.; Wang, S. Effect of brassinolide application on antioxidant characteristics and endogenous hormones of Leymus chinensis (Trin.) Tzvelev under different light intensity regimes. Chil. J. Agric. Res. 2018, 78, 539–548. [Google Scholar] [CrossRef]
  53. Qin, Y. Effect of Light Intensity and Waterlogging on the Physiology Characteristic and the Relative Expression of Genes in Magnolia sinostellata. Master’s Thesis, Zhejiang Agriculture & Forestry University, Hangzhou, China, 2018. [Google Scholar]
  54. Iqbal, Z.; Iqbal, M.S.; Hashem, A.; Abd, A.; Ansari, M.I. Plant Defense Responses to Biotic Stress and Its Interplay with Fluctuating Dark/Light Conditions. Front. Plant Sci. 2021, 12, 631810. [Google Scholar] [CrossRef] [PubMed]
  55. Durand-Bessart, C.; Tixier, P.; Quinteros, A.; Andreotti, F.; Rapidel, B.; Tauvel, C.; Allinne, C. Analysis of interactions amongst shade trees, coffee foliar diseases and coffee yield in multistrata agroforestry systems. Crop Prot. 2020, 133, 105137. [Google Scholar] [CrossRef]
  56. Czekus, Z.; Iqbal, N.; Pollak, B.; Martics, A.; Ordog, A.; Poor, P. Role of ethylene and light in chitosan-induced local and systemic defence responses of tomato plants. J. Plant Physiol. 2021, 263, 153461. [Google Scholar] [CrossRef] [PubMed]
  57. Yao, W.; Zhou, B.; Zhang, X.; Zhao, K.; Cheng, Z.; Jiang, T. Transcriptome analysis of transcription factor genes under multiple abiotic stresses in Populus simonii × P. nigra. Gene 2019, 707, 189–197. [Google Scholar] [CrossRef] [PubMed]
  58. Ye, H.; Du, H.; Tang, N.; Li, X.; Xiong, L. Identification and expression profiling analysis of TIFY family genes involved in stress and phytohormone responses in rice. Plant Mol Biol. 2009, 71, 291–305. [Google Scholar] [CrossRef] [PubMed]
  59. Yang, Y.; Ahammed, G.J.; Wan, C.; Liu, H.; Chen, R.; Zhou, Y. Comprehensive Analysis of TIFY Transcription Factors and Their Expression Profiles under Jasmonic Acid and Abiotic Stresses in Watermelon. Int. J. Genom. 2019, 2019, 6813086. [Google Scholar] [CrossRef] [PubMed]
  60. Ebel, C.; BenFeki, A.; Hanin, M.; Solano, R.; Chini, A. Characterization of wheat (Triticum aestivum) TIFY family and role of Triticum Durum TdTIFY11a in salt stress tolerance. PLoS ONE 2018, 13, e0200566. [Google Scholar]
  61. Zhao, C.; Pan, X.; Yu, Y.; Zhu, Y.; Kong, F.; Sun, X.; Wang, F. Overexpression of a TIFY family gene, GsJAZ2, exhibits enhanced tolerance to alkaline stress in soybean. Mol. Breed. 2020, 40, 33. [Google Scholar] [CrossRef]
  62. Quesada, V. The roles of mitochondrial transcription termination factors (MTERFs) in plants. Physiol. Plant 2016, 157, 389–399. [Google Scholar] [CrossRef] [PubMed]
  63. Robles, P.; Navarro-Cartagena, S.; Ferrandez-Ayela, A.; Nunez-Delegido, E.; Quesada, V. The Characterization of Arabidopsis mterf6 Mutants Reveals a New Role for mTERF6 in Tolerance to Abiotic Stress. Int. J. Mol. Sci. 2018, 19, 2388. [Google Scholar] [CrossRef] [PubMed] [Green Version]
  64. McDowell, J.M.; Simon, S.A. Recent insights into R gene evolution. Mol. Plant Pathol. 2006, 7, 437–448. [Google Scholar] [CrossRef] [PubMed]
  65. Li, Y.; Tessaro, M.J.; Li, X.; Zhang, Y. Regulation of the expression of plant resistance gene SNC1 by a protein with a conserved BAT2 domain. Plant Physiol. 2010, 153, 1425–1434. [Google Scholar] [CrossRef] [PubMed] [Green Version]
  66. Liu, Z.; An, L.; Lin, S.; Wu, T.; Li, X.; Tu, J.; Yang, F.; Zhu, H.; Yang, L.; Cheng, Y. Comparative physiological and transcriptomic analysis of pear leaves under distinct training systems. Sci. Rep. 2020, 10, 18892. [Google Scholar] [CrossRef]
  67. Yang, F.; Liu, Q.; Cheng, Y.; Feng, L.; Wu, X.; Fan, Y.; Raza, M.A.; Wang, X.; Yong, T.; Liu, W. Low red/far-red ratio as a signal promotes carbon assimilation of soybean seedlings by increasing the photosynthetic capacity. BMC Plant Biol. 2020, 20, 148. [Google Scholar] [CrossRef] [Green Version]
  68. Liu, D.L.; Chen, S.W.; Liu, X.C.; Yang, F.; Liu, W.G.; She, Y.H.; Du, J.B.; Liu, C.Y.; Yang, W.Y.; Wu, X.L. Genetic map construction and QTL analysis of leaf-related traits in soybean under monoculture and relay intercropping. Sci. Rep. 2019, 9, 2716. [Google Scholar] [CrossRef] [PubMed]
  69. Sekhar, S.; Panda, D.; Kumar, J.; Mohanty, N.; Biswal, M.; Baig, M.J.; Kumar, A.; Umakanta, N.; Samantaray, S.; Pradhan, S.K. Comparative transcriptome profiling of low light tolerant and sensitive rice varieties induced by low light stress at active tillering stage. Sci. Rep. 2019, 9, 5753. [Google Scholar] [CrossRef]
  70. Wegener, F.; Beyschlag, W.; Werner, C. High intraspecific ability to adjust both carbon uptake and allocation under light and nutrient reduction in Halimium halimifolium L. Front. Plant Sci. 2015, 6, 609. [Google Scholar] [CrossRef]
  71. Goto, M. KEGG: Kyoto Encyclopedia of Genes and Genomes. Nucleic Acids Res. 2000, 28, 27–30. [Google Scholar]
  72. Chini, A.; Ben-Romdhane, W.; Hassairi, A.; Aboul-Soud, M.A.M. Identification of TIFY/JAZ family genes in Solanum lycopersicum and their regulation in response to abiotic stresses. PLoS ONE 2017, 12, e0177381. [Google Scholar] [CrossRef]
  73. Zhao, Y.; Cai, M.; Zhang, X.; Li, Y.; Zhang, J.; Zhao, H.; Kong, F.; Zheng, Y.; Qiu, F. Genome-wide identification, evolution and expression analysis of mTERF gene family in maize. PLoS ONE 2014, 9, e94126. [Google Scholar] [CrossRef] [Green Version]
  74. Reinhart, K.O.; Royo, A.A.; Kageyama, S.A.; Clay, K. Canopy gaps decrease microbial densities and disease risk for a shade-intolerant tree species. Acta Oecologica 2010, 36, 530–536. [Google Scholar] [CrossRef]
  75. Lorenzo, C.D.; Alonso Iserte, J.; Sanchez Lamas, M.; Antonietti, M.S.; Garcia Gagliardi, P.; Hernando, C.E.; Dezar, C.A.A.; Vazquez, M.; Casal, J.J.; Yanovsky, M.J. Shade delays flowering in Medicago sativa. Plant J. 2019, 99, 7–22. [Google Scholar] [CrossRef] [PubMed] [Green Version]
  76. Kim, G.-T.; Yano, S.; Kozuka, T.; Tsukaya, H. Photomorphogenesis of leaves: Shade-avoidance and differentiation of sun and shade leaves. Photochem. Photobiol. Sci. 2005, 4, 770–774. [Google Scholar] [CrossRef] [PubMed]
  77. Sun, W.; Han, H.; Deng, L.; Sun, C.; Xu, Y.; Lin, L.; Ren, P.; Zhao, J.; Zhai, Q.; Li, C. Mediator Subunit MED25 Physically Interacts with phytochrome interacting factor4 to Regulate Shade-Induced Hypocotyl Elongation in Tomato. Plant Physiol. 2020, 184, 1549–1562. [Google Scholar] [CrossRef]
  78. Das, D.; St Onge, K.R.; Voesenek, L.A.; Pierik, R.; Sasidharan, R. Ethylene- and Shade-Induced Hypocotyl Elongation Share Transcriptome Patterns and Functional Regulators. Plant Physiol. 2016, 172, 718–733. [Google Scholar] [CrossRef]
  79. Liu, B.; Long, H.; Yan, J.; Ye, L.; Zhang, Q.; Chen, H.; Gao, S.; Wang, Y.; Wang, X.; Sun, S. A HY5-COL3-COL13 regulatory chain for controlling hypocotyl elongation in Arabidopsis. Plant Cell Environ. 2021, 44, 130–142. [Google Scholar] [CrossRef]
  80. Liu, B.; Zhao, S.; Li, P.; Yin, Y.; Niu, Q.; Yan, J.; Huang, D. Plant buffering against the high-light stress-induced accumulation of CsGA2ox8 transcripts via alternative splicing to finely tune gibberellin levels and maintain hypocotyl elongation. Hortic. Res. 2021, 8, 2. [Google Scholar] [CrossRef]
  81. Kim, T.; Kang, K.; Kim, S.H.; An, G.; Paek, N.C. OsWRKY5 Promotes Rice Leaf Senescence via Senescence-Associated NAC and Abscisic Acid Biosynthesis Pathway. Int. J. Mol. Sci. 2019, 20, 4437. [Google Scholar] [CrossRef] [PubMed] [Green Version]
  82. Yangen, F.; Xiuxiu, Z.; Hanyue, W.; Yueyue, T.; Qinzeng, X.; Lixia, Z. Effects of light intensity on metabolism of light-harvesting pigment and photosynthetic system in Camellia sinensis L. cultivar ‘Huangjinya’. Environ. Exp. Bot. 2019, 166, 103796. [Google Scholar] [CrossRef]
  83. Zhang, Y.; Liu, N.; Wang, W.; Sun, J.; Zhu, L. Photosynthesis and related metabolic mechanism of promoted rice (Oryza sativa L.) growth by TiO2 nanoparticles. Front. Environ. Sci. Eng. 2020, 14, 103. [Google Scholar] [CrossRef]
  84. Xuan, A.; Song, Y.; Bu, C.; Chen, P.; El-Kassaby, Y.A.; Zhang, D. Changes in DNA Methylation in Response to 6-Benzylaminopurine Affect Allele-Specific Gene Expression in Populus Tomentosa. Int. J. Mol. Sci. 2020, 21, 2117. [Google Scholar] [CrossRef] [Green Version]
  85. Sui, X.; Mao, S.; Wang, L.; Zhang, B.; Zhang, Z. Effect of Low Light on the Characteristics of Photosynthesis and Chlorophyll a Fluorescence During Leaf Development of Sweet Pepper. J. Integr. Agric. 2012, 11, 1633–1643. [Google Scholar] [CrossRef]
  86. Jian, W.; Haijiao, H.; Sen, J.; Xuemei, Z.; Fenghai, L.; Kuangye, Z.; Zhensheng, S. Photosynthesis and chlorophyll fluorescence reaction to different shade stresses of weak light sensitive maize. Pak. J. Bot. 2017, 49, 1681–1688. [Google Scholar]
  87. He, Z.; Tang, R.; Li, M.; Jin, M.; Xin, C.; Liu, J.; Hong, W. Response of Photosynthesis and Chlorophyll Fluorescence Parameters of Castanopsis kawakamii Seedlings to Forest Gaps. Forests 2019, 11, 21. [Google Scholar] [CrossRef] [Green Version]
  88. Gao, S.; Zheng, Z.; Huan, L.; Wang, G. G6PDH activity highlights the operation of the cyclic electron flow around PSI in Physcomitrella patens during salt stress. Sci. Rep. 2016, 6, 21245. [Google Scholar] [CrossRef] [Green Version]
  89. Ding, X.; Jiang, Y.; Hong, W.; Jin, H.; Zhang, H.; Chen, C.; Yu, J. Effects of cytokinin on photosynthetic gas exchange, chlorophyll fluorescence parameters, antioxidative system and carbohydrate accumulation in cucumber (Cucumis sativus L.) under low light. Acta Physiol. Plant. 2012, 35, 1427–1438. [Google Scholar]
  90. Kunderlikova, K.; Brestic, M.; Zivcak, M.; Kusniarova, P. Photosynthetic responses of sun- and shade-grown chlorophyll b deficient mutant of wheat. J. Cent. Eur. Agric. 2016, 17, 950–956. [Google Scholar] [CrossRef] [Green Version]
  91. Huang, W.; Yang, Y.J.; Hu, H.; Zhang, S.B. Responses of Photosystem I Compared with Photosystem II to Fluctuating Light in the Shade-Establishing Tropical Tree Species Psychotria henryi. Front. Plant Sci. 2016, 7, 1549. [Google Scholar] [CrossRef] [Green Version]
  92. Sun, J.; Sui, X.; Huang, H.; Wang, S.; Wei, Y.; Zhang, Z. Low Light Stress Down-Regulated Rubisco Gene Expression and Photosynthetic Capacity During Cucumber (Cucumis sativus L.) Leaf Development. J. Integr. Agric. 2014, 13, 997–1007. [Google Scholar] [CrossRef] [Green Version]
  93. Jensen, L.; Hegelund, J.N.; Olsen, A.; Lutken, H.; Muller, R. A natural frameshift mutation in Campanula EIL2 correlates with ethylene insensitivity in flowers. BMC Plant Biol. 2016, 16, 117. [Google Scholar] [CrossRef] [PubMed] [Green Version]
  94. Mishra, A.; Khare, S.; Trivedi, P.K.; Nath, P. Ethylene induced cotton leaf abscission is associated with higher expression of cellulase (GhCel1) and increased activities of ethylene biosynthesis enzymes in abscission zone. Plant Physiol. Biochem. 2008, 46, 54–63. [Google Scholar] [CrossRef] [PubMed]
  95. Jin, D.; Wang, X.; Xu, Y.; Gui, H.; Zhang, H.; Dong, Q.; Sikder, R.K.; Yang, G.; Song, M. Chemical Defoliant Promotes Leaf Abscission by Altering ROS Metabolism and Photosynthetic Efficiency in Gossypium hirsutum. Int. J. Mol. Sci. 2020, 21, 2738. [Google Scholar] [CrossRef] [PubMed] [Green Version]
  96. Singh, P.; Bharti, N.; Singh, A.P.; Tripathi, S.K.; Pandey, S.P.; Chauhan, A.S.; Kulkarni, A.; Sane, A.P. Petal abscission in fragrant roses is associated with large scale differential regulation of the abscission zone transcriptome. Sci. Rep. 2020, 10, 17176. [Google Scholar]
  97. Zhang, Q.; Dai, W.; Jin, X.; Li, J. Calcium chloride and 1-methylcyclopropene treatments delay postharvest and reduce decay of New Queen melon. Sci. Rep. 2019, 9, 13563. [Google Scholar] [CrossRef] [PubMed]
  98. Trivellini, A.; Cocetta, G.; Hunter, D.A.; Vernieri, P.; Ferrante, A. Spatial and temporal transcriptome changes occurring during flower opening and senescence of the ephemeral hibiscus flower, Hibiscus rosa-sinensis. J. Exp. Bot. 2016, 67, 5919–5931. [Google Scholar] [CrossRef] [PubMed] [Green Version]
  99. Bernal-Vicente, A.; Cantabella, D.; Petri, C.; Hernandez, J.A.; Diaz-Vivancos, P. The Salt-Stress Response of the Transgenic Plum Line J8-1 and Its Interaction with the Salicylic Acid Biosynthetic Pathway from Mandelonitrile. Int. J. Mol. Sci. 2018, 19, 3519. [Google Scholar] [CrossRef] [Green Version]
  100. Hu, Y.; Jiang, L.; Wang, F.; Yu, D. Jasmonate regulates the inducer of cbf expression-C-repeat binding factor/DRE binding factor1 cascade and freezing tolerance in Arabidopsis. Plant Cell 2013, 25, 2907–2924. [Google Scholar] [CrossRef] [Green Version]
  101. Wang, J.; Song, L.; Gong, X.; Xu, J.; Li, M. Functions of Jasmonic Acid in Plant Regulation and Response to Abiotic Stress. Int. J. Mol. Sci. 2020, 21, 1446. [Google Scholar] [CrossRef] [Green Version]
  102. Park, S.W.; Li, W.; Viehhauser, A.; He, B.; Kim, S.; Nilsson, A.K.; Andersson, M.X.; Kittle, J.D.; Ambavaram, M.M.; Luan, S. Cyclophilin 20-3 relays a 12-oxo-phytodienoic acid signal during stress responsive regulation of cellular redox homeostasis. Proc. Natl. Acad. Sci. USA 2013, 110, 9559–9564. [Google Scholar] [CrossRef] [Green Version]
  103. Vanholme, B.; Grunewald, W.; Bateman, A.; Kohchi, T.; Gheysen, G. The tify family previously known as ZIM. Trends Plant Sci. 2007, 12, 239–244. [Google Scholar] [CrossRef] [PubMed]
  104. Sirhindi, G.; Sharma, P.; Arya, P.; Goel, P.; Kumar, G.; Acharya, V.; Singh, A.K. Genome-wide characterization and expression profiling of TIFY gene family in pigeonpea (Cajanus cajan (L.) Millsp.) under copper stress. J. Plant Biochem. Biotechnol. 2016, 25, 301–310. [Google Scholar] [CrossRef]
  105. Xu, D.; Leister, D.; Kleine, T. Arabidopsis thaliana mTERF10 and mTERF11, but Not mTERF12, Are Involved in the Response to Salt Stress. Front. Plant Sci. 2017, 8, 1213. [Google Scholar] [CrossRef] [Green Version]
  106. Robles, P.; Micol, J.L.; Quesada, V. Mutations in the plant-conserved MTERF9 alter chloroplast gene expression, development and tolerance to abiotic stress in Arabidopsis thaliana. Physiol. Plant 2015, 154, 297–313. [Google Scholar] [CrossRef] [PubMed]
  107. Corrion, A.; Day, B. Pathogen Resistance Signalling in Plants. In eLS; American Cancer Society: New York, NY, USA, 2015; pp. 1–14. [Google Scholar]
  108. Li, P.; Quan, X.; Jia, G.; Xiao, J.; Cloutier, S.; You, F.M. RGAugury: A pipeline for genome-wide prediction of resistance gene analogs (RGAs) in plants. BMC Genom. 2016, 17, 852. [Google Scholar] [CrossRef] [PubMed] [Green Version]
  109. Lin, X.; Zhang, Y.; Kuang, H.; Chen, J. Frequent loss of lineages and deficient duplications accounted for low copy number of disease resistance genes in Cucurbitaceae. BMC Genom. 2013, 14, 335. [Google Scholar] [CrossRef] [PubMed] [Green Version]
  110. Wang, F.; Zhang, F.; Chen, M.; Liu, Z.; Zhang, Z.; Fu, J.; Ma, Y. Comparative Transcriptomics Reveals Differential Gene Expression Related to Colletotrichum gloeosporioides Resistance in the Octoploid Strawberry. Front. Plant Sci. 2017, 8, 779. [Google Scholar] [CrossRef] [Green Version]
  111. Song, L.; Chen, W.; Yao, Q.; Guo, B.; Valliyodan, B.; Wang, Z.; Nguyen, H.T. Genome-wide transcriptional profiling for elucidating the effects of brassinosteroids on Glycine max during early vegetative development. Sci. Rep. 2019, 9, 16085. [Google Scholar] [CrossRef]
  112. Bao, Z.; Yang, H.; Hua, J. Perturbation of cell cycle regulation triggers plant immune response via activation of disease resistance genes. Proc. Natl. Acad. Sci. USA 2013, 110, 2407–2412. [Google Scholar] [CrossRef] [Green Version]
  113. Chen, J. Conversion relationship between lx and μmol·m−2·s−1 of practical light source. Acta Agric. Univ. Henanensis 1998, 32, 200–202. [Google Scholar]
  114. Livak, K.J.; Schmittgen, T.D. Analysis of relative gene expression data using real-time quantitative PCR and the 2(-Delta Delta C(T)) Method. Methods 2001, 25, 402–408. [Google Scholar] [CrossRef]
  115. Fu, X.; Liu, C.; Li, Y.; Liao, S.; Cheng, H.; Tu, Y.; Zhu, X.; Chen, K.; He, Y.; Wang, G. The coordination of OsbZIP72 and OsMYBS2 with reverse roles regulates the transcription of OsPsbS1 in rice. New Phytol. 2020, 229, 370–387. [Google Scholar] [CrossRef] [PubMed]
  116. Miao, R.; Yuan, W.; Wang, Y.; Garcia-Maquilon, I.; Dang, X.; Li, Y.; Zhang, J.; Zhu, Y.; Rodriguez, P.; Xu, W. Low ABA concentration promotes root growth and hydrotropism through relief of ABA INSENSITIVE 1-mediated inhibition of plasma membrane H+-ATPase 2. Sci. Adv. 2021, 7, eabd4113. [Google Scholar] [CrossRef] [PubMed]
  117. Guo, Q.; Li, X.; Niu, L.; Jameson, P.E.; Zhou, W. Transcription-associated metabolomic adjustments in maize occur during combined drought and cold stress. Plant Physiol. 2021, 186, 677–695. [Google Scholar] [CrossRef] [PubMed]
  118. Gai, Z.; Wang, Y.; Ding, Y.; Qian, W.; Qiu, C.; Xie, H.; Sun, L.; Jiang, Z.; Ma, Q.; Wang, L. Exogenous abscisic acid induces the lipid and flavonoid metabolism of tea plants under drought stress. Sci. Rep. 2020, 10, 12275. [Google Scholar] [CrossRef] [PubMed]
  119. He, Y.; Zhao, J.; Yang, B.; Sun, S.; Peng, L.; Wang, Z. Indole-3-acetate beta-glucosyltransferase OsIAGLU regulates seed vigour through mediating crosstalk between auxin and abscisic acid in rice. Plant Biotechnol. J. 2020, 18, 1933–1945. [Google Scholar] [CrossRef] [Green Version]
Figure 1. Phenotypic and physiological changes of M. sinostellata seedlings under light deficiency. (A) Phenotypic shifting of M. sinostellata during experiment. (B) Net photosynthesis rate, Pn. (C) Intercellular CO2 concentration, Ci. (D) Stomatal conductance, Gs. (E) Transpiration rate, Tr. (F) Light use efficiency, LUE. (G) Water use efficiency, WUE. (H) Rubiso activity. (I) Maximum Chl fluorescence yield obtained with dark-adapted leaf, Fm. (J) Minimum Chl fluorescence yield obtained with dark-adapted leaf, Fo. (K) Maximal photochemical efficiency, Fv/Fm. (L) Excitation energy capture efficiency of PSII, Fv’/Fm’. (M) Activity of PSII reaction centers, Fv/Fo. (N) Non-photochemical quenching, NPQ. (O) Photochemical quenching, qP. (P) Yield of PSII photochemistry, ΦPSII.
Plants 10 02261 g001
Figure 2. Analysis of DEGs involved in photosynthesis related pathways in M. sinostellata. (A) GO enrichment analysis of 22,433 DEGs. (B) KEGG enrichment analysis of 22,433 DEGs. The top 20 GO and KEGG Terms with the smallest Qvalue were selected to plot the chart, respectively. (C) Volcano plots of DEGs involved in antenna protein. (D) Trends of DEGs related to antenna protein. (E) Volcano plots of DEGs involved in photosynthesis. (F) Trends of DEGs related to photosynthesis. (G) Volcano plots of DEGs involved in carbon fixation. (H) Trends of DEGs related to carbon fixation.
Plants 10 02261 g002
Figure 3. Heatmaps of DEGs involved in photosynthesis-related pathways in M. sinostellata. (A) Heatmaps of the expression patterns of genes involved in ‘photosynthesis-antenna protein’ pathway under light deficiency and normal light conditions. (B) Heatmaps of the expression patterns of DEGs participated in ‘photosynthesis’ pathway under light deficiency and normal light conditions. (C) Heatmaps of the expression patterns of DEGs related to ‘carbon fixation in photosynthetic organisms’ pathway under light deficiency and normal light conditions.
Plants 10 02261 g003
Figure 4. The impact of light deficiency on plant hormone concentration and signaling pathways. (A) Heatmap of genes involved in ethylene signal transduction under light deficiency and normal light conditions. (B) Heatmaps of genes involved in jasmonic acid signaling under light deficiency and normal light conditions. (C) Concentrations of ethylene at d0 and d15 under light deficiency and normal light conditions. (D) Concentrations of jasmonic acid at d0 and d15 under light deficiency and normal light conditions. (E) qRT-PCR analysis of key genes involved in plant hormone signaling under light deficiency and control conditions for 0 d, 5 d, and 15 d. Data are the means of three biological replicates and three technical replicates. The 2−ΔΔct method was employed to conduct the gene differential expression analysis. * indicates significant differences in comparison with the control groups corresponding to time points at p < 0.05.
Plants 10 02261 g004
Figure 5. Analysis of TIFY family genes, mTERF family genes, and R-genes in M. sinostellata. (A) The expression profile of MsTIFY gene family in leaves of M. sinostellata under light deficiency and untreated conditions. Two pairs of duplicated paralogs are marked by lowercase letters. (B) Phylogenetic tree of TIFY protein sequences from M. sinostellata, Arabidopsis thaliana and Populus trichocarpa, which was constructed using the NJ (neighbor-joining) method with 1000 bootstrap replications. (C) Expression profiles of MsmTERFs under light deficiency and normal light conditions. (D) Phylogenetic tree of mTERF protein sequences from M. sinostellata, Arabidopsis thaliana, and Zea mays, which was constructed using the NJ method with 1000 bootstrap replications. (E) Expression patterns of 13 classification of R-genes in M. sinostellata under light deficiency and normal light conditions.
Plants 10 02261 g005
Figure 6. Hypothetical model of the light deficiency response mechanism in the endangered species M. sinostellata.
Plants 10 02261 g006
Table 1. Classification of up- and down-regulated R-genes among the DEGs in M. sinostellata.
R-Gene ClassAll R-GenesDown-Regulated R-Genes Up-Regulated R-GenesDescription
CN402812Contains coiled-coil and NBS domains
CNL1095059Contains a central nucleotide-binding (NB) subdomain as part of a larger entity called the NB-ARC domain.
Mlo-like541Mlo-like resistant proteins
N217112105Contains NBS domain only, lack of LRR
NL20011288Contains NBS domain at N-terminal and LRR st the C-terminal, and lack of the CC domain
other1349The class “Other” consists in a set of R proteins that do not fit into any of the known four classes, but that has resistance function.
RLK110RLKs, or Receptor like Kinases, consist of an extracellullar leucine-rich repeat region (eLRR) and an intracellular kinase domain.
RLK-GNK2332013RLK class with additional domain GNK2
RLP32725671Receptor Like Proteins consists of a leucine-rich receptor-like repeat, a transmembrane region of ~25 AA, and a short cytoplasmic region, with no kinase domain
RPW8-NL770Contains NBS, LRR, and RPW8 domains
T601248Contains TIR domain only, lack of LRR or NBS
TN202Contains TIR and NBS domains
TNL723834Contains a central nucleotide-binding (NB) subdomain as part of a larger entity called the NB-ARC domain
Total1086644442
Publisher’s Note: MDPI stays neutral with regard to jurisdictional claims in published maps and institutional affiliations.

