A Novel Universal Approach for Temperature Correction on Frequency Domain Spectroscopy Curve of Transformer Polymer Insulation

 ,
,  , ,
, ,
Abstract
:
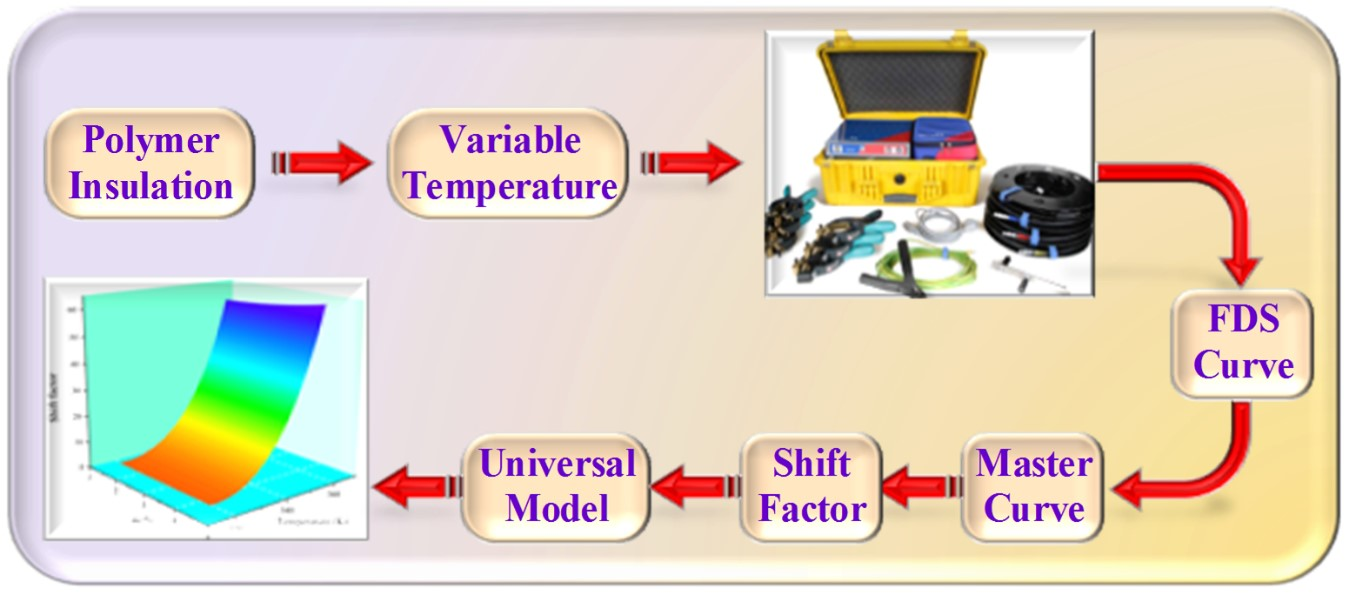
1. Introduction
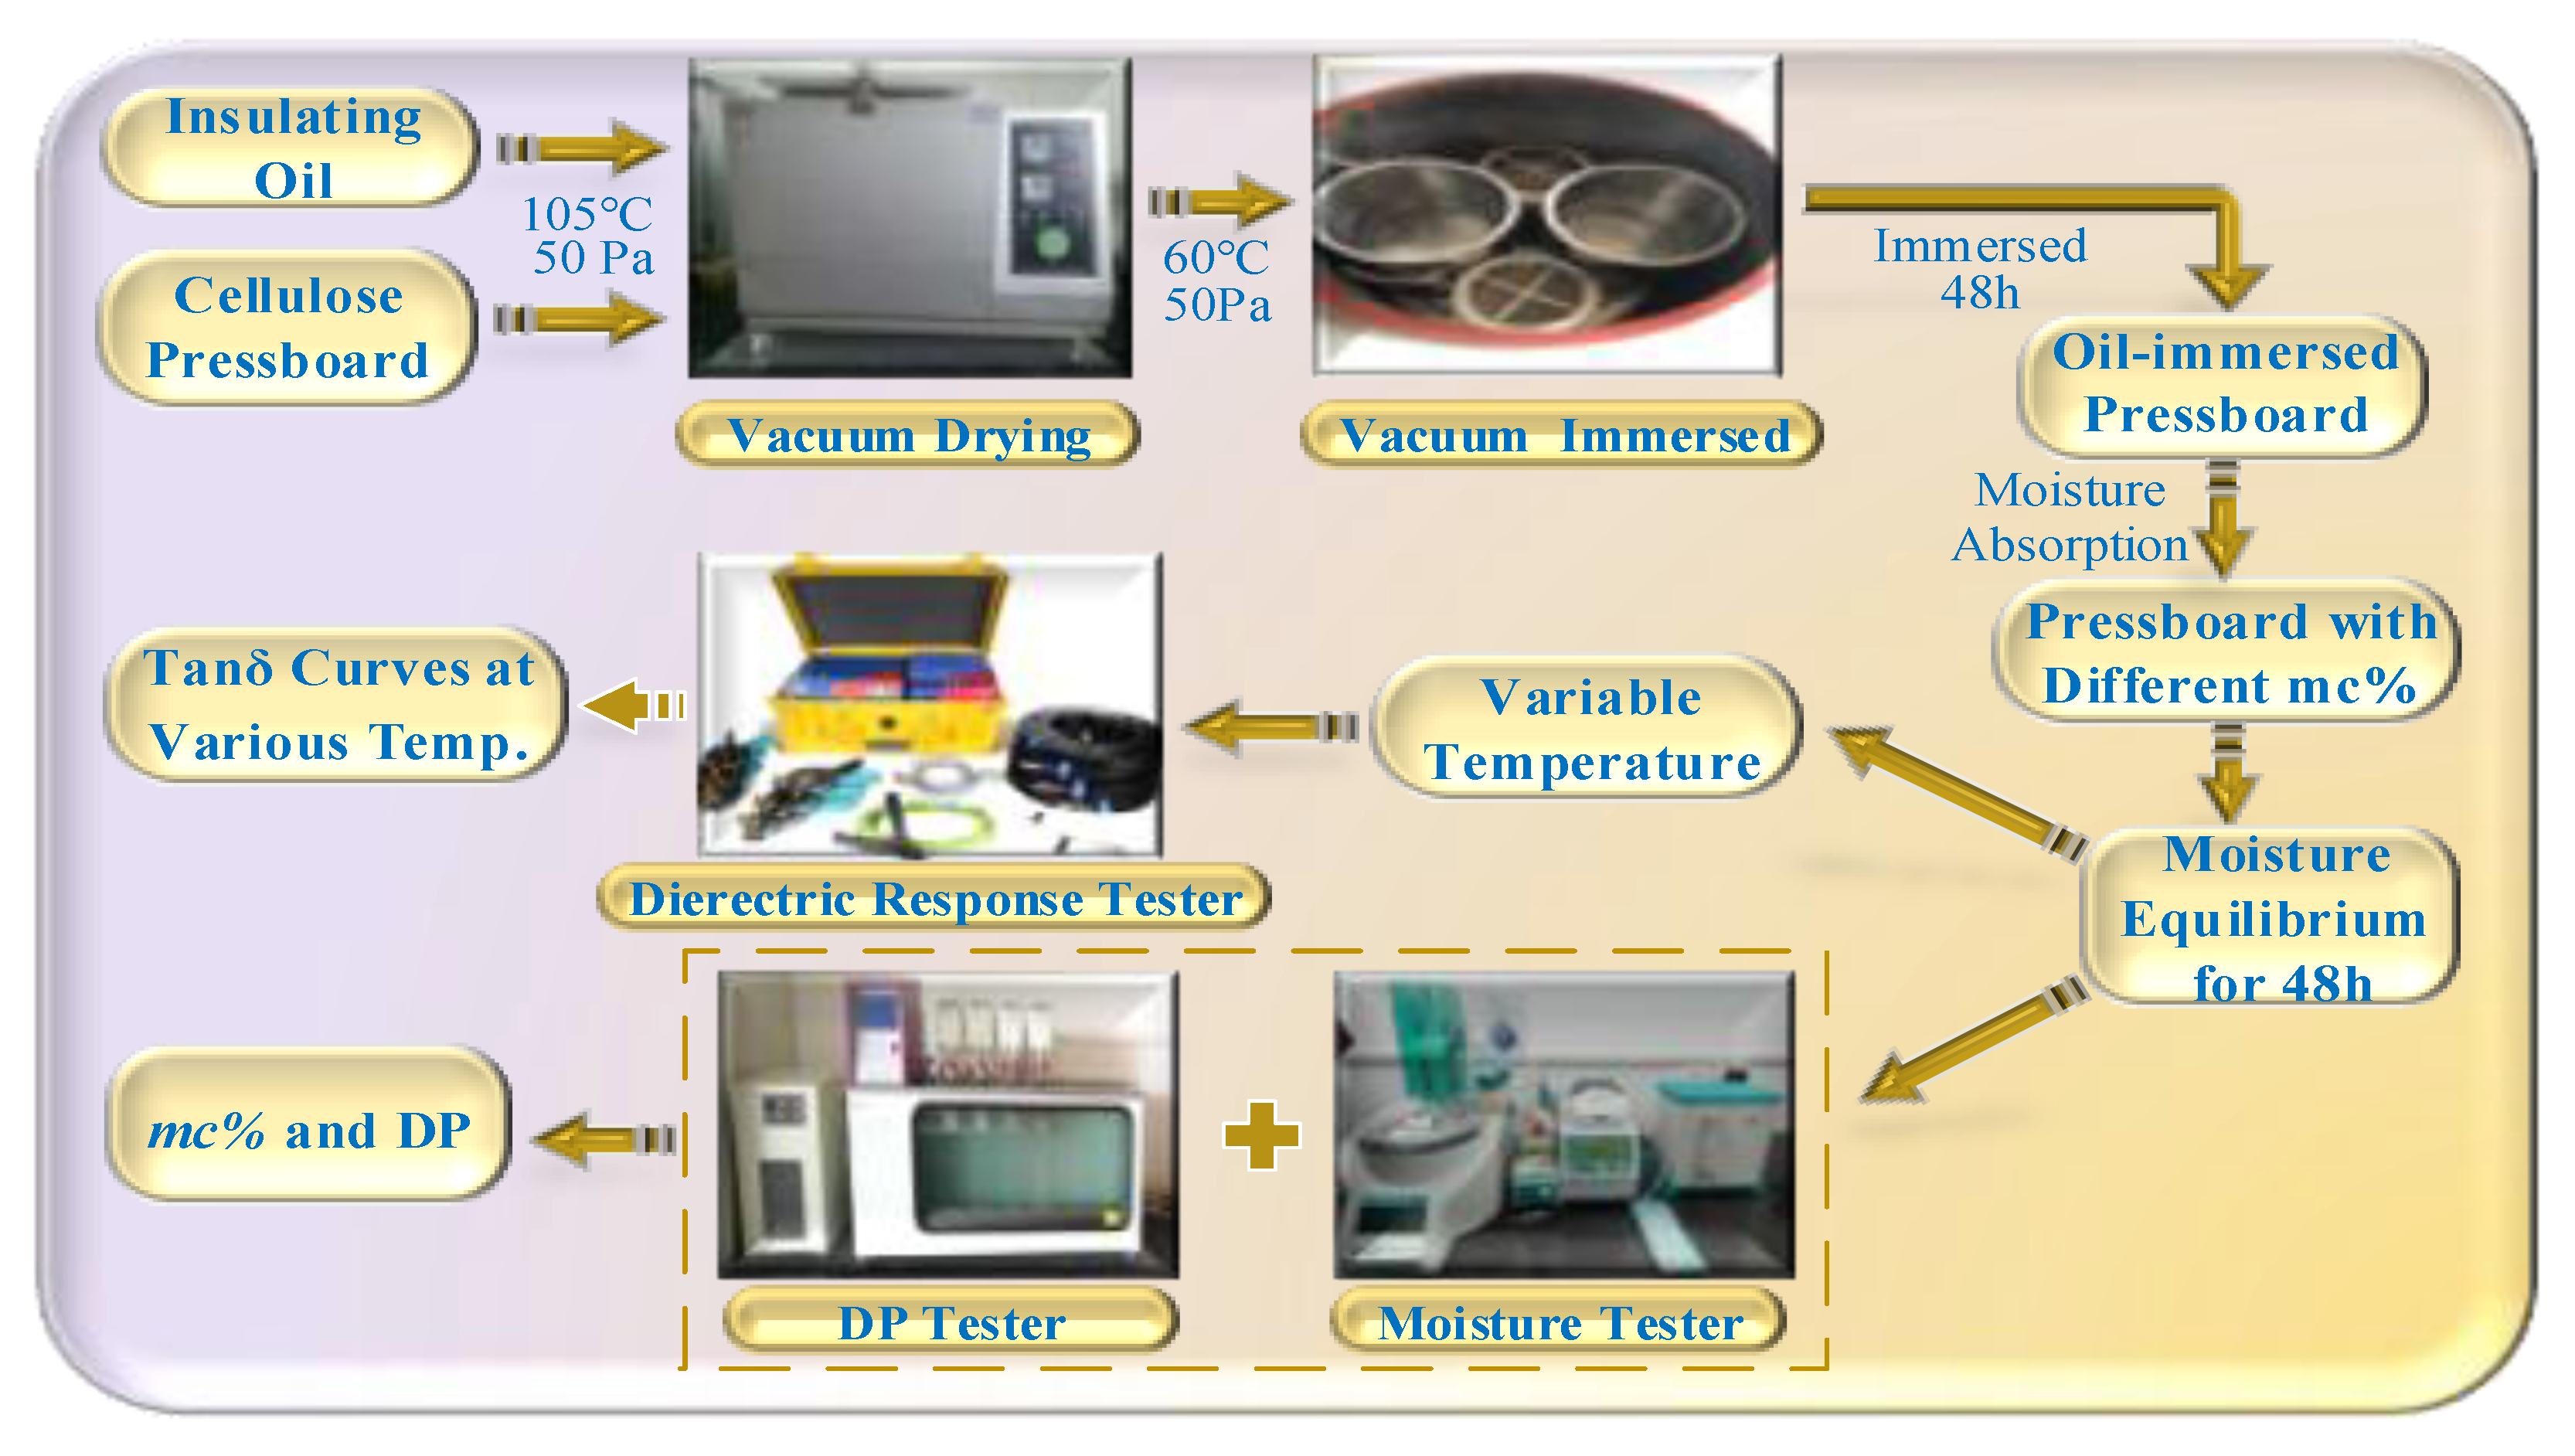
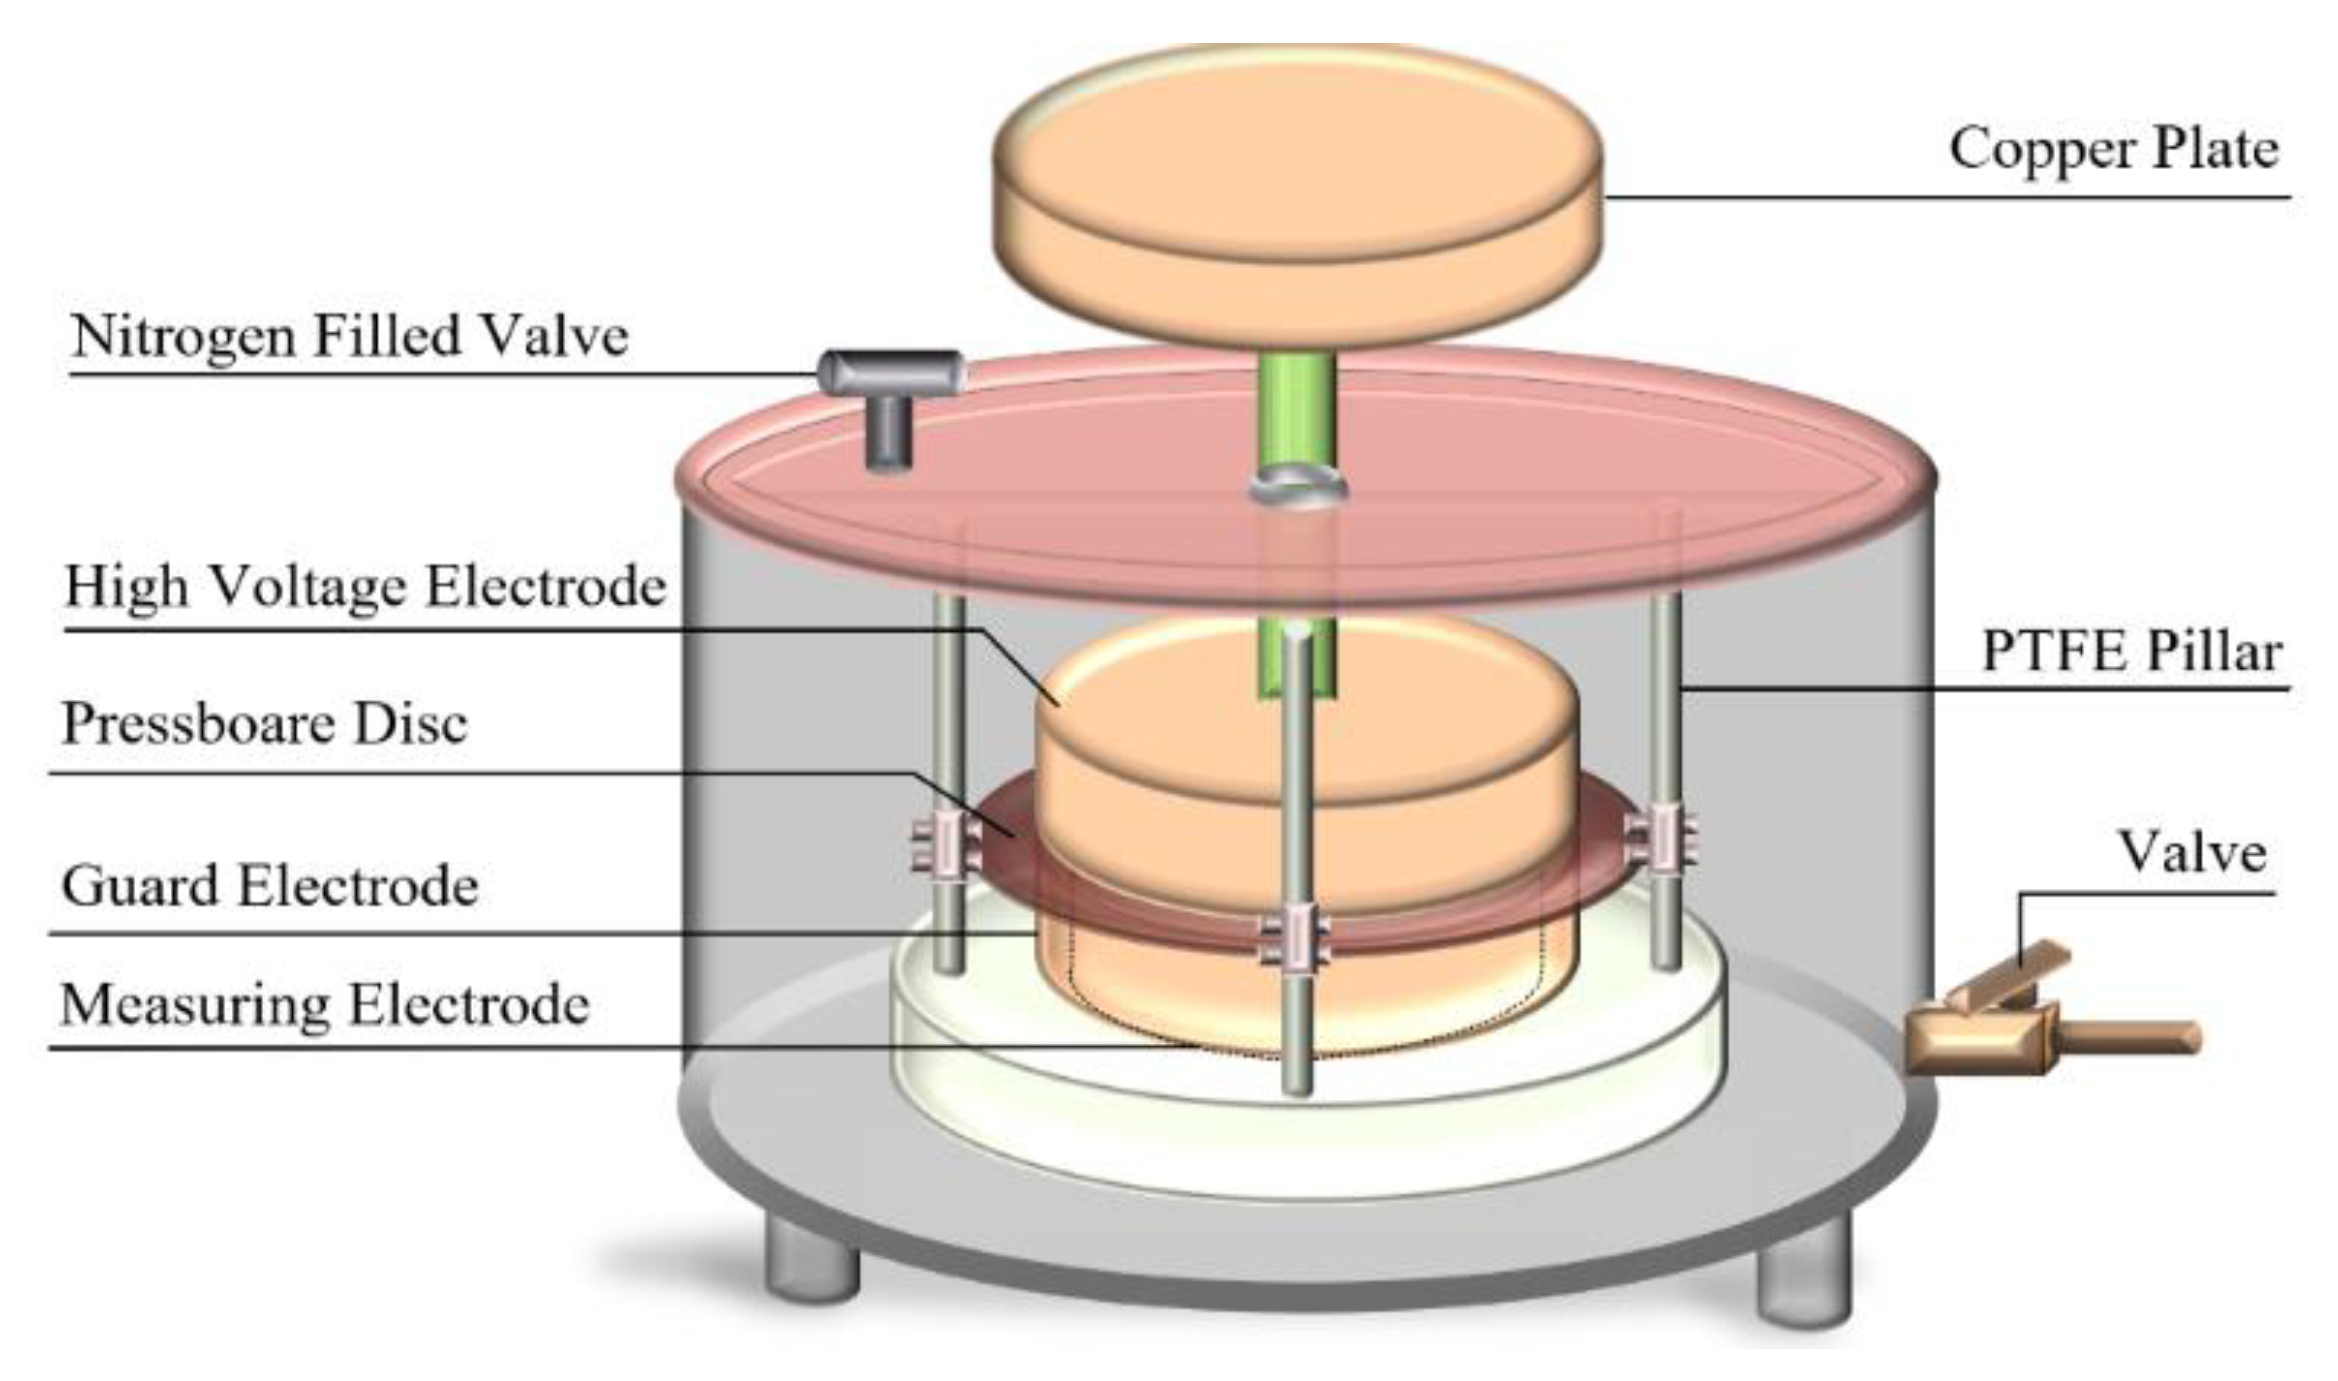
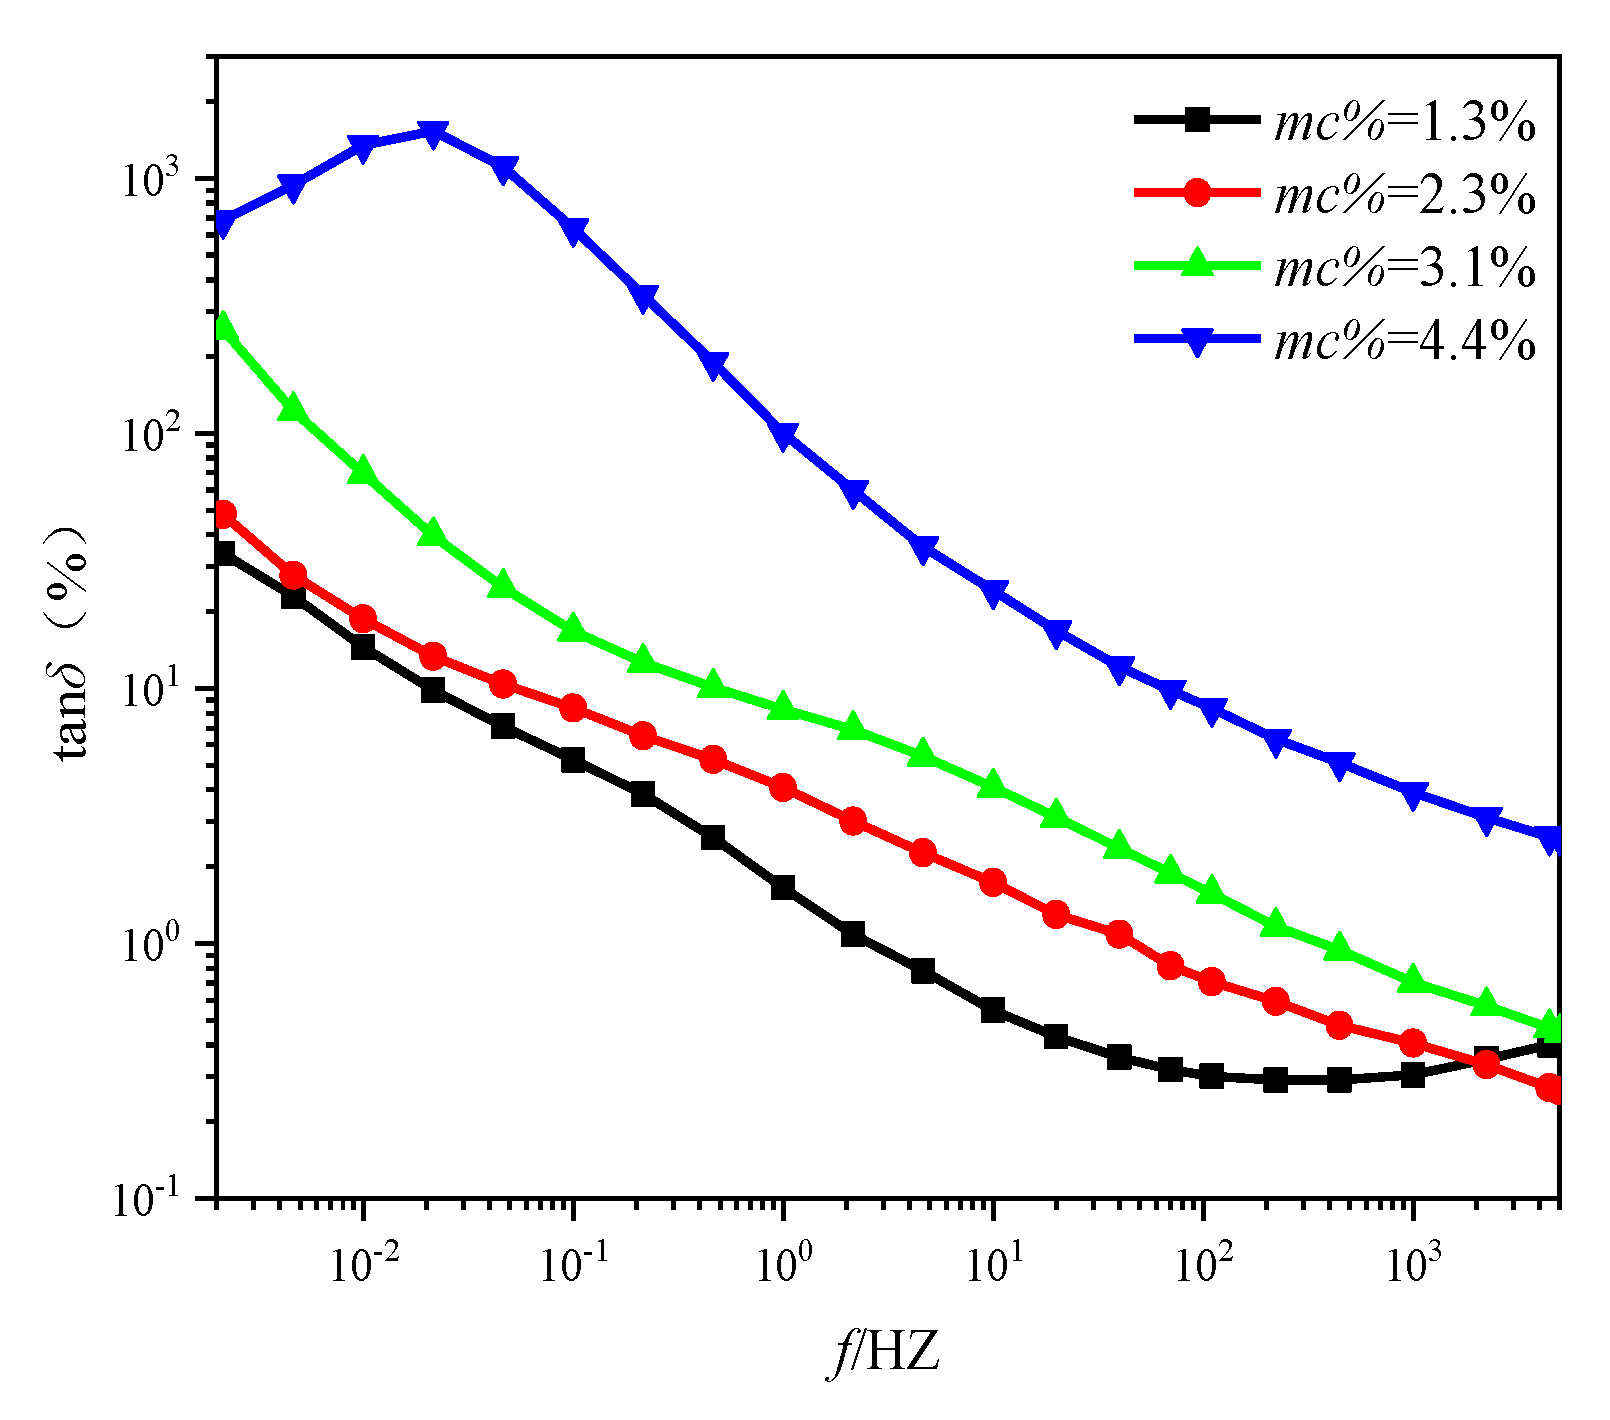
2. Sample Construction
3. The Extraction of the Shift Factor
4. A Universal Model for Extracting the Shift Factor
5. A Scheme for Temperature Correction on FDS Curve Using Reported Universal Approach
6. Conclusions
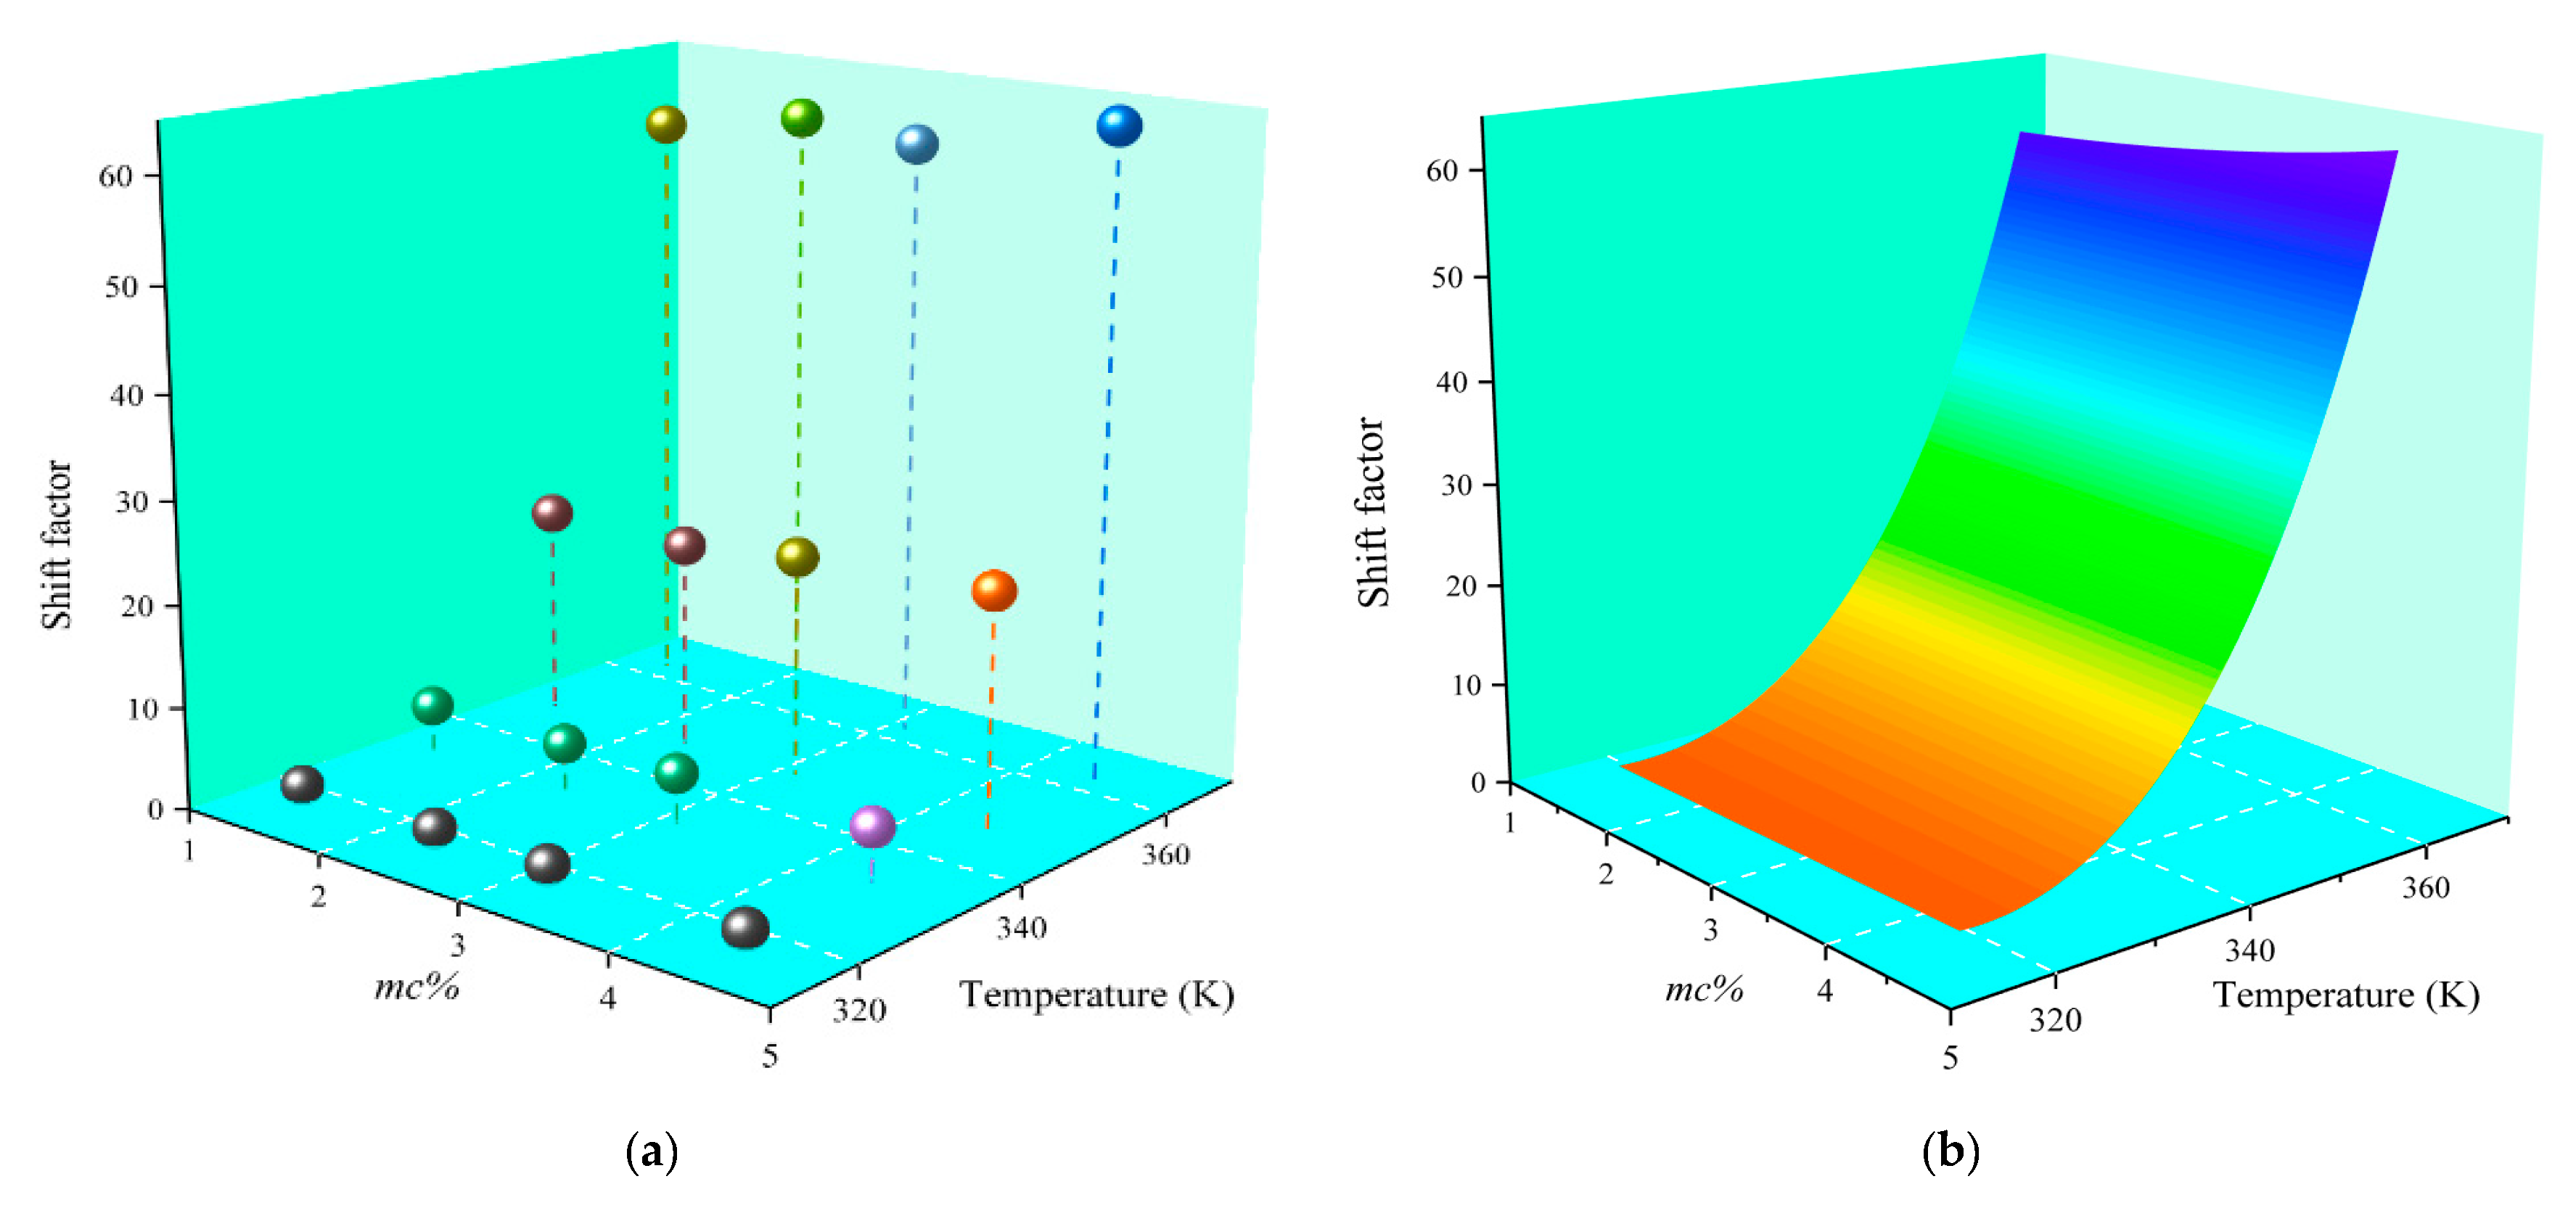
- The reported approach for predicting the shift factor is based upon the depth analysis of the variation law among the shift factor, moisture content and test temperature. The findings reveal that the shift factor is both temperature-dependent and moisture-dependent.
- It is estimated that the value of the shift factor is positively correlated with the moisture content and test temperature. Moreover, the temperature correction results indicate that the shift factor mainly depends on the test temperature and moisture content rather than the aging degree.
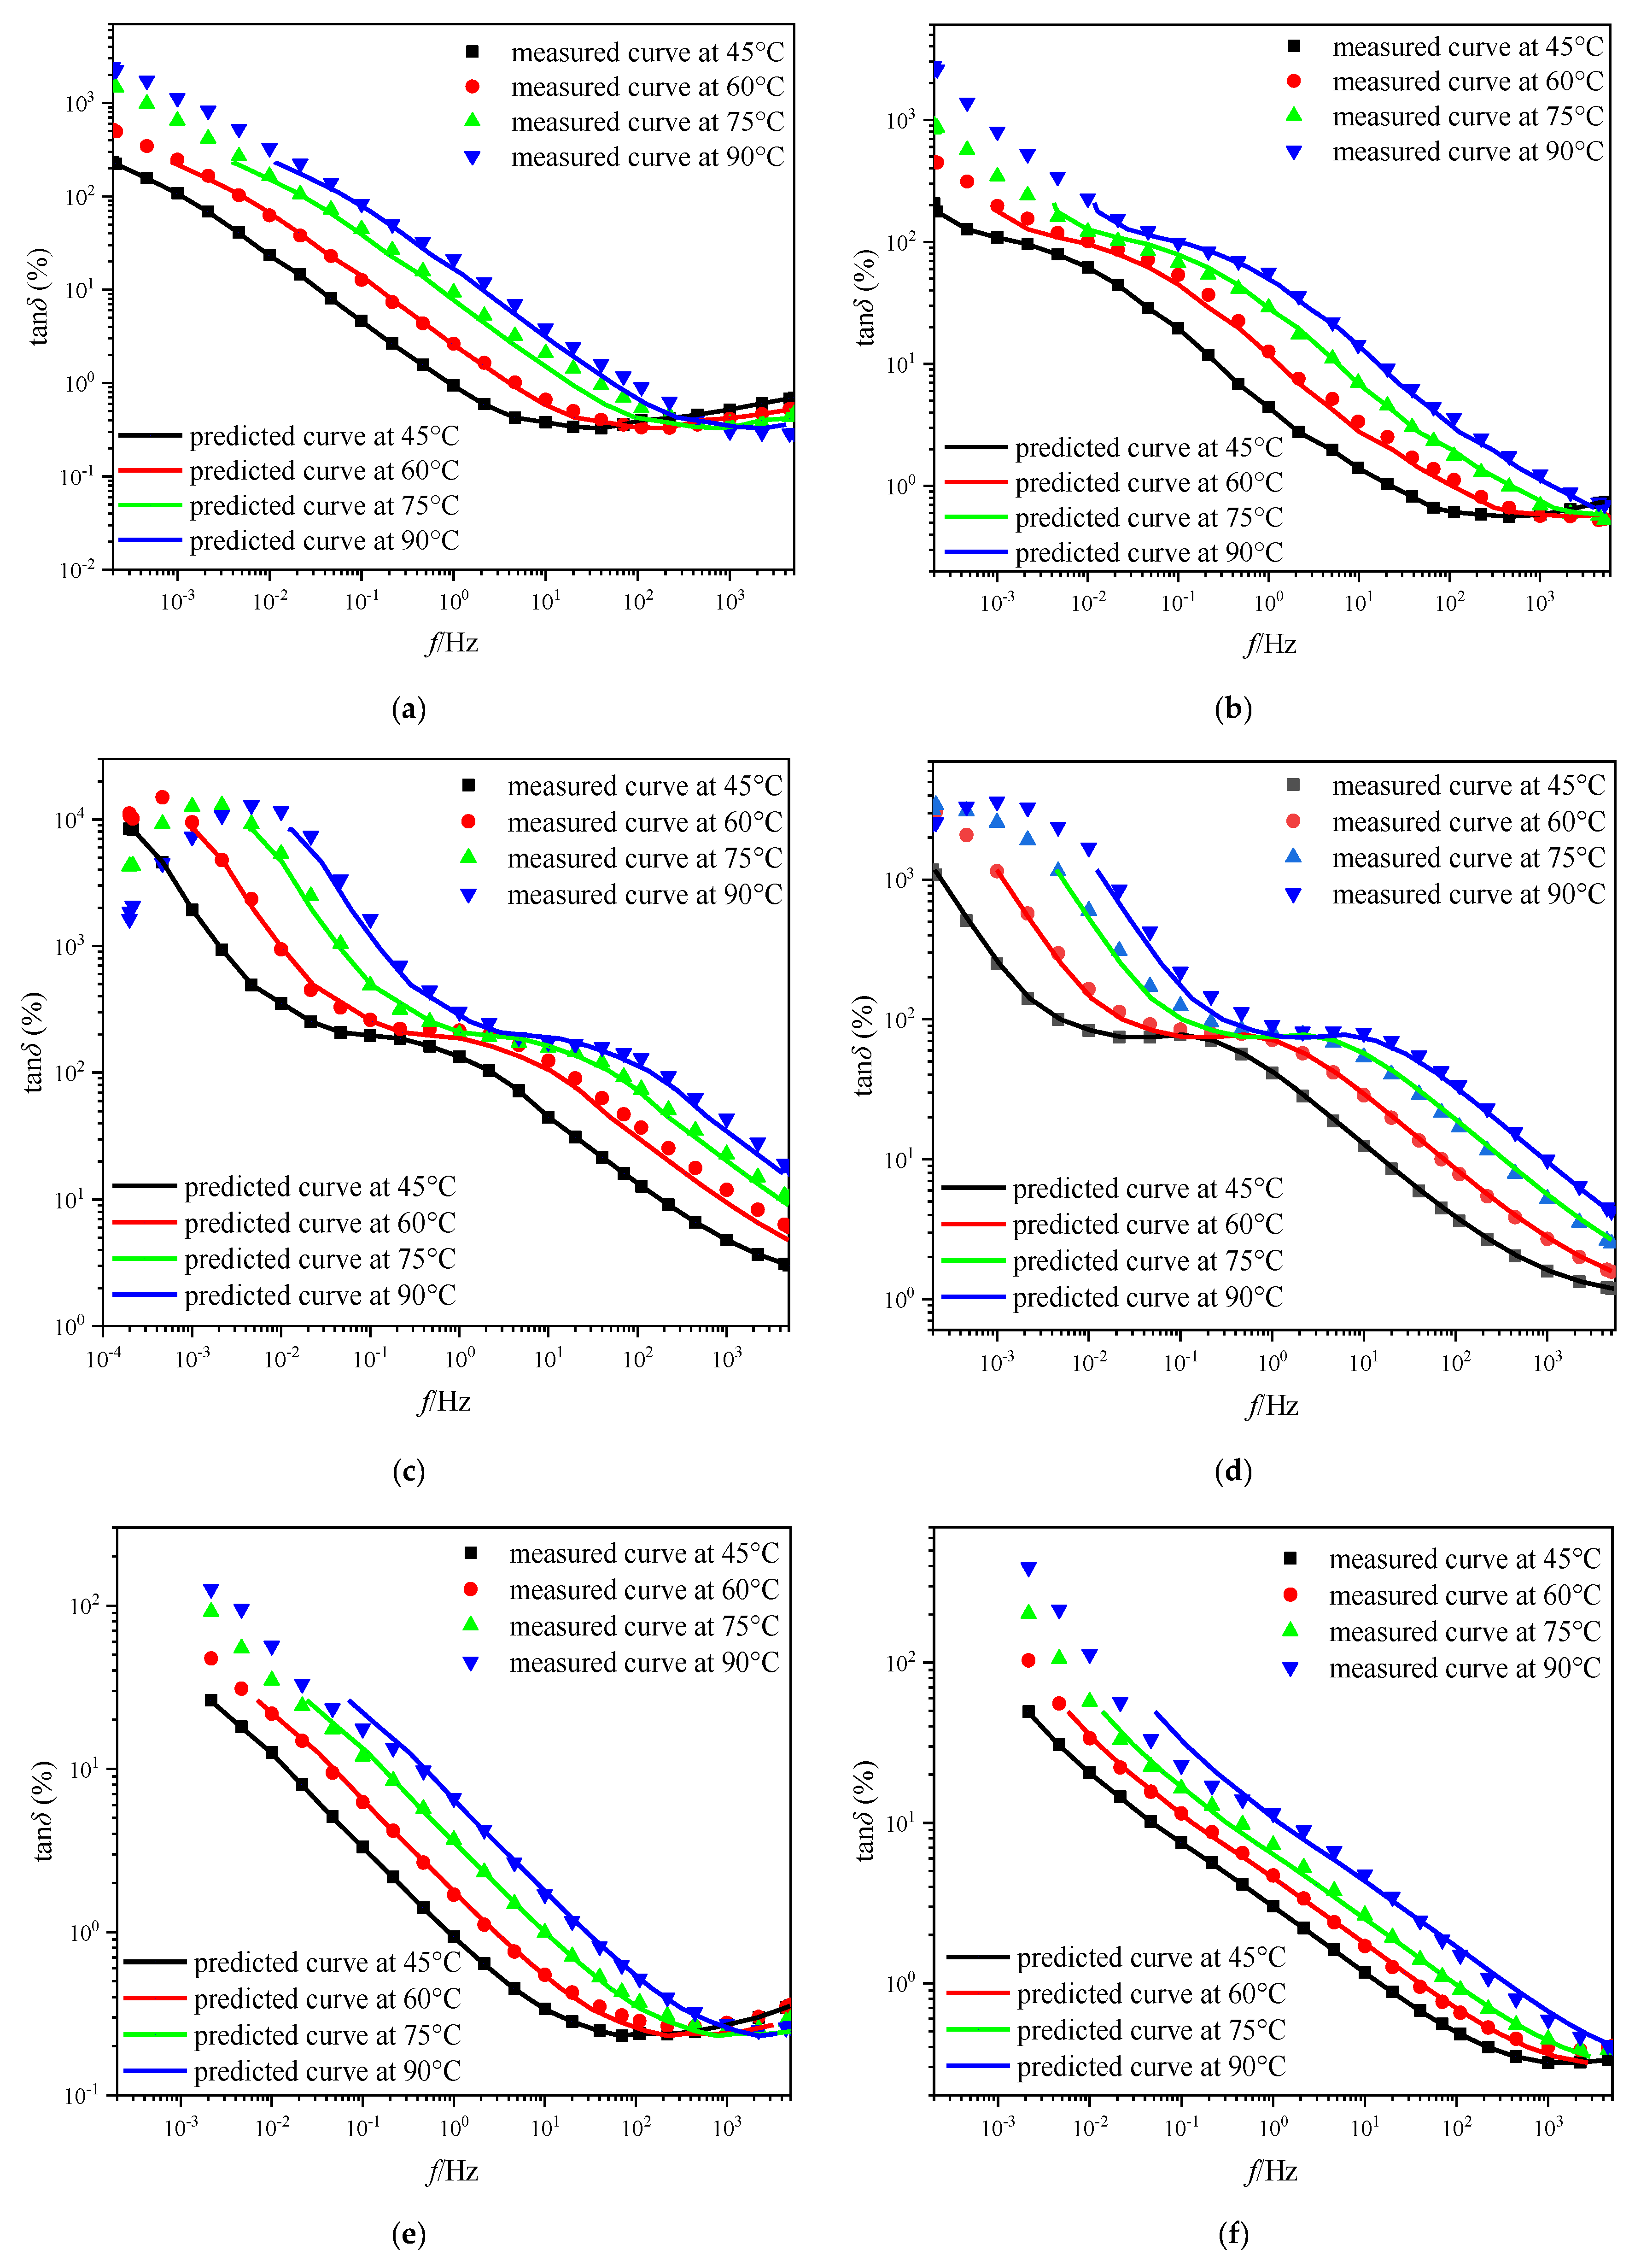
- The verification results preliminarily reveal that the reported approach is not only suitable for temperature correction on FDS curve of pressboard with different insulation content, but also maintains considerable accuracy when applied to different types of paperboard. Therefore, the obtained conclusions will provide a universal idea for temperature correction on FDS curve of transformer polymer insulation.
Author Contributions
Funding
Conflicts of Interest
References
- Feng, D.W.; Yang, L.J.; Zhou, L.W.; Liao, R.J.; Chen, X. Effect of Oil–Paper–Pressboard Mass Ratio on Furfural Content in Transformer Oil. IEEE Trans. Dielectr. Electr. Insul. 2019, 26, 1289–1296. [Google Scholar]
- Feng, D.W.; Yang, L.J.; Liao, R.J.; Zhou, L.W. Effect of Moisture Content on the Production and Partitioning of Furfural in Oil–Paper Insulation. IEEE Trans. Dielectr. Electr. Insul. 2018, 25, 2389–2397. [Google Scholar] [CrossRef]
- Liu, J.; Zheng, H.; Zhang, Y.; Li, X.; Fang, J.; Liu, Y.; Liao, C.; Li, Y.; Zhao, J. Dissolved gases forecasting based on wavelet least squares support vector regression and imperialist competition algorithm for assessing incipient faults of transformer polymer insulation. Polymers 2019, 11, 85. [Google Scholar] [CrossRef] [PubMed]
- Baral, A.; Chakravorti, S. Prediction of Moisture Present in Cellulosic Part of Power Transformer Insulation using Transfer Function of Modified Debye Model. IEEE Trans. Dielectr. Electr. Insul. 2014, 21, 1368–1375. [Google Scholar] [CrossRef]
- Verma, H.C.; Baral, A.; Pradhan, A.K. A Method to Estimate Activation Energy of Power Transformer Insulation Using Time Domain Spectroscopy Data. IEEE Trans. Dielectr. Electr. Insul. 2017, 24, 3245–3253. [Google Scholar] [CrossRef]
- Pradhan, A.K.; Chatterjee, B.; Chakravorti, S. Estimation of Dielectric Dissipation Factor of Cellulosic Parts in Oil-paper Insulation by Frequency Domain Spectroscopy. IEEE Trans. Dielectr. Electr. Insul. 2016, 23, 2720–2729. [Google Scholar] [CrossRef]
- Saha, T.K.; Purkait, P. Understanding the impacts of moisture and thermal aging on transformer’s insulation by dielectric response and molecular weight measurements. IEEE Trans. Dielectr. Electr. Insul. 2008, 15, 568–582. [Google Scholar] [CrossRef]
- Koch, M.; Prevost, T. Analysis of Dielectric Response Measurements for Condition Assessment of Oil-Paper Transformer Insulation. IEEE Trans. Dielectr. Electr. Insul. 2012, 19, 1908–1915. [Google Scholar] [CrossRef]
- Yang, L.; Zou, T.; Deng, B.; Zhang, H.; Mo, Y.; Peng, P. Assessment of Oil-Paper Insulation Aging Using Frequency Domain Spectroscopy and Moisture Equilibrium Curves. IEEE Access 2019, 7, 45670–45678. [Google Scholar] [CrossRef]
- Pradhan, A.K.; Koley, C. Determination of optimized slope of triangular excitation for condition assessment of oil-paper insulation by frequency domain spectroscopy. IEEE Trans. Dielectr. Electr. Insul. 2016, 23, 1303–1312. [Google Scholar] [CrossRef]
- Jaya, M.; Geißler, D.; Leibfried, T. Accelerating dielectric response measurements on power transformers-part I: A frequency-domain approach. IEEE Trans. Power Deliv. 2013, 28, 1469–1473. [Google Scholar] [CrossRef]
- Zhang, D.; Yun, H.; Zhan, J.; Sun, X.; He, W.; Niu, C.; Mu, H.; Zhang, G.-j. Insulation Condition Diagnosis of Oil-Immersed Paper Insulation Based on Non-linear Frequency-Domain Dielectric Response. IEEE Trans. Dielectr. Electr. Insul. 2018, 25, 1980–1988. [Google Scholar] [CrossRef]
- Jadav, R.B.; Ekanayake, C.; Saha, T.K. Understanding the Impact of Moisture and Ageing of Transformer Insulation on Frequency Domain Spectroscopy. IEEE Trans. Dielectr. Electr. Insul. 2014, 21, 369–379. [Google Scholar] [CrossRef]
- Liu, J.; Zheng, H.; Zhang, Y.; Wei, H.; Liao, R. Grey Relational Analysis for Insulation Condition Assessment of Power Transformers Based Upon Conventional Dielectric Response Measurement. Energies 2017, 10, 1526. [Google Scholar] [CrossRef]
- Yang, X.; Nielsen, S.; Ledwich, G. Frequency Domain Spectroscopy Measurements of Oil-paper Insulation for Energized Transformers. IEEE Trans. Dielectr. Electr. Insul. 2017, 24, 1657–1664. [Google Scholar] [CrossRef]
- Ojha, S.K.; Purkait, P. Modeling of Relaxation Phenomena in Transformer Oil-paper Insulation for Understanding Dielectric Response Measurements. IEEE Trans. Dielectr. Electr. Insul. 2016, 23, 3190–3198. [Google Scholar] [CrossRef]
- Saha, T.K.; Purkait, P. Investigations of Temperature Effects on the Dielectric Response Measurements of Transformer Oil-Paper Insulation System. IEEE Trans. Power Deliv. 2008, 23, 252–260. [Google Scholar] [CrossRef]
- Baral, A.; Chakravorti, S. Compensating the Effect of Temperature Variation on Dielectric Response of Oil-paper Insulation used in Power Transformers. IEEE Trans. Dielectr. Electr. Insul. 2016, 23, 2462–2474. [Google Scholar] [CrossRef]
- Dutta, S.; Basalt, A.; Pradhan, A.K.; Chakravorti, S. Effect of measurement temperature on power transformer insulation diagnosis using frequency-domain spectroscopy. IET Sci. Meas. Technol. 2017, 11, 773–779. [Google Scholar] [CrossRef]
- Zhang, Y.; Liu, J.; Zheng, H.; Wang, K. Feasibility of a universal approach for temperature correction in frequency domain spectroscopy of transformer insulation. IEEE Trans. Dielectr. Electr. Insul. 2018, 25, 1766–1773. [Google Scholar] [CrossRef]
- Liao, R.J.; Liu, J.F.; Yang, L.J. Quantitative analysis of insulation condition of oil-paper insulation based on frequency domain spectroscopy. IEEE Trans. Dielectr. Electr. Insul. 2015, 22, 322–334. [Google Scholar] [CrossRef]
- Gao, J.; Yang, L.J.; Wang, Y.Y. Effect of moisture and thermal degradation on the activation energy of oil-paper insulation in frequency domain spectroscope measurement. IET Gener. Transm. Distrib. 2016, 10, 2042–2049. [Google Scholar] [CrossRef]
- Linhjell, D.; Lundgaard, L.E.; Gafvert, U. Dielectric response of mineral oil impregnated cellulose and the impact of aging. IEEE Trans. Dielectr. Electr. Insul. 2007, 14, 156–169. [Google Scholar] [CrossRef]
- Liu, J.; Fan, X.; Zheng, H.; Zhang, Y.; Zhang, C.; Lai, B.; Wang, J.; Ren, G.; Zhang, E. Aging condition assessment of transformer oil-immersed cellulosic insulation based upon the average activation energy method. Cellulose 2019, 26, 3891–3908. [Google Scholar] [CrossRef]
- Liu, J.; Zheng, H.; Zhang, Y.; Zhou, T.; Zhao, J.; Li, J.; Liu, J.; Li, J. Comparative investigation on the performance of modified system poles and traditional system poles obtained from PDC data for diagnosing ageing condition of transformers polymer insulation materials. Polymers 2018, 10, 191. [Google Scholar] [CrossRef] [PubMed]
- Zhang, Y.; Liu, J.; Zheng, H.; Wei, H.; Liao, R. Study on Quantitative Correlations between the Ageing Condition of Transformer Cellulose Insulation and the Large Time Constant Obtained from the Extended Debye Model. Energies 2017, 10, 1842. [Google Scholar] [CrossRef]
- Gillen, K.T.; Celina, M. The wear-out approach for predicting the remaining lifetime of materials. Polym. Degrad. Stab. 2000, 71, 15–30. [Google Scholar] [CrossRef] [Green Version]
- Urzhumtsev, Y.S. Time-temperature superposition. Rev. Mech. Compos. Mater. 1975, 11, 57–72. [Google Scholar]
- Lelekakis, N.; Martin, D.; Wijaya, J. Ageing rate of paper insulation used in power transformers Part 1: Oil/paper system with low oxygen concentration. IEEE Trans. Dielectr. Electr. Insul. 2012, 19, 1999–2008. [Google Scholar] [CrossRef]
- Lelekakis, N.; Martin, D.; Wijaya, J. Ageing rate of paper insulation used in power transformers Part 2: Oil/paper system with medium and high oxygen concentration. IEEE Trans. Dielectr. Electr. Insul. 2012, 19, 2009–2018. [Google Scholar] [CrossRef]


| Pressboard Types | Type I | Type II |
|---|---|---|
| Brand | T4 transformer pressboard | Common transformer pressboard |
| Manufacturer | Taizhou Weidmann High Voltage Insulation Co., Ltd. | Chongqing AEA Group Transformer Co., Ltd. |
| Thickness | 0.5 mm | 2 mm |
| Tensile strength | MD: 98 MPa, CMD: 47 MPa | MD: 150.04 MPa, CMD: 57.14 MPa |
| Density | 0.96 g/cm3 | 1.17 g/cm3 |
| No. | mc% | Measured Value | |||
|---|---|---|---|---|---|
| 318.15 K | 333.15 K | 348.15 K | 363.15 K | ||
| 1 | 1.3% | 1.00 | 4.43 | 20.45 | 57.79 |
| 2 | 2.3% | 1.00 | 4.51 | 20.33 | 60.23 |
| 3 | 3.1% | 1.00 | 4.84 | 21.83 | 59.14 |
| 4 | 4.4% | 1.00 | 5.17 | 22.98 | 63.25 |
| Z0 | −342,488 | A1 | 67.5388 | Precision | 10−15 |
| A01 | −59.000 | A2 | 0.55934 | Degree of freedom | 6 |
| B01 | 2137.2 | A3 | −2.82072 | Reduced Chi-Sqr | 0.5229 |
| B02 | −3.3360 | B1 | 0.00694 | R-Square | 0.9991 |
| C02 | −0.1576 | B2 | −0.18727 | Fit Status | succeeded |
| No. | mc% | Predicted Value | |||
|---|---|---|---|---|---|
| 318.15 K | 333.15 K | 348.15 K | 363.15 K | ||
| 1 | 1.3% | 0.983 | 4.439 | 20.210 | 58.185 |
| 2 | 2.3% | 0.988 | 4.603 | 20.847 | 59.013 |
| 3 | 3.1% | 0.998 | 4.772 | 21.522 | 60.154 |
| 4 | 4.4% | 1.027 | 5.139 | 23.013 | 63.056 |
| No. | DP | mc% | 318.15 K | 333.15 K | 348.15 K | 363.15 K |
|---|---|---|---|---|---|---|
| 1 | 425 | 1.2% | 0.983 | 4.428 | 20.158 | 58.137 |
| 2 | 994 | 2.8% | 0.994 | 4.705 | 21.250 | 59.673 |
| 3 | 841 | 3.7% | 1.010 | 4.926 | 22.143 | 61.318 |
| 4 | 1285 | 4.0% | 1.016 | 5.012 | 22.495 | 62.010 |
| 5 | 663 | 0.9% | 0.983 | 4.385 | 20.012 | 58.028 |
| 6 | 640 | 1.3% | 0.983 | 4.439 | 20.210 | 58.185 |
© 2019 by the authors. Licensee MDPI, Basel, Switzerland. This article is an open access article distributed under the terms and conditions of the Creative Commons Attribution (CC BY) license (http://creativecommons.org/licenses/by/4.0/).
Share and Cite
Liu, J.; Fan, X.; Zhang, Y.; Zheng, H.; Yao, H.; Zhang, C.; Zhang, Y.; Li, D. A Novel Universal Approach for Temperature Correction on Frequency Domain Spectroscopy Curve of Transformer Polymer Insulation. Polymers 2019, 11, 1126. https://doi.org/10.3390/polym11071126
Liu J, Fan X, Zhang Y, Zheng H, Yao H, Zhang C, Zhang Y, Li D. A Novel Universal Approach for Temperature Correction on Frequency Domain Spectroscopy Curve of Transformer Polymer Insulation. Polymers. 2019; 11(7):1126. https://doi.org/10.3390/polym11071126
Chicago/Turabian StyleLiu, Jiefeng, Xianhao Fan, Yiyi Zhang, Hanbo Zheng, Huilu Yao, Chaohai Zhang, Yubo Zhang, and Dajian Li. 2019. "A Novel Universal Approach for Temperature Correction on Frequency Domain Spectroscopy Curve of Transformer Polymer Insulation" Polymers 11, no. 7: 1126. https://doi.org/10.3390/polym11071126