Article

Elucidation of the Relationship between Intrinsic Viscosity and Molecular Weight of Cellulose Dissolved in Tetra-N-Butyl Ammonium Hydroxide/Dimethyl Sulfoxide

Key Laboratory of Advanced Technologies of Materials (Ministry of Education), School of Materials Science and Engineering, Southwest Jiaotong University, Chengdu 610031, China
*
Author to whom correspondence should be addressed.
Polymers 2019, 11(10), 1605; https://doi.org/10.3390/polym11101605
Submission received: 18 August 2019 / Revised: 23 September 2019 / Accepted: 26 September 2019 / Published: 1 October 2019

Abstract

:
The determination of molecular weight of natural cellulose remains a challenge nowadays, due to the difficulty in dissolving cellulose. In this work, tetra-n-butylammonium hydroxide (TBAH) and dimethyl sulfoxide (DMSO) aqueous solution (THDS) were used to dissolve cellulose in a few minutes under room temperature into true molecular solutions. That is to say, the cellulose was dissolved in the solution in molecular level, and the viscosity of the solution is linearly dependent on the concentration of cellulose. The relationship between the molecular weight of cellulose and the intrinsic viscosity tested in such dilute solutions has been established in the form of the Mark–Houwink equation, [ η ] = 0.24 × DP 1.21 . The value of 1.21 indicates that the cellulose molecules dissolve in THDS quite well. The cellulose dispersion in the THDS was proved to be in molecular level by atomic force microscope (AFM) and dynamic light scattering (DLS). The reliability of the established Mark–Houwink equation was cross-checked by the gel permeation chromatography (GPC) and traditional copper (II) ethylenediamine (CED) method. No considerate degradation was observed by comparing the intrinsic viscosity and the degree of polymerization (DP) values of the original with and the regenerated cellulose samples. The natural cellulose can be molecularly dispersed in the multiple-component solvent (THDS), and kept stable for a certain period. A time efficient and reliable method has been supplied for determination of the degree of polymerization and the molecular weight of cellulose.

Graphical Abstract

1. Introduction

Cellulose is the most abundant natural polymer in the Earth, which is widely produced by various plants, bacteria, and algae [1]. The increasingly serious environmental and energy issues have prompted the development of natural polymer materials [2,3]. Cellulose are widely used in our daily life and modern industrial production as renewable materials [4], composite materials [5], and cellulose derivatives [6,7,8]. The molecular weight (M) of cellulose affects the processing conditions, as well as the performance of the final cellulose products. The accurate determination of molecular weight is one of the key issues for the development of cellulose-based materials in laboratory research, as well as industry. There are three methods for determination of molecular weight of cellulose. One is the GPC method [9,10,11], which usually conducted for cellulose derivatives. The other is the viscosity method [9,12]. The static light scattering (SLS) [13] method is also used for determination of the cellulose molecular weight. The premise of the methods is that cellulose is dissolved in the solvent without degradation. The commonly-used method to measure the molecular weight of cellulose in the laboratory is the cuprammonium hydroxide (Cuoxam) method (GB/T 9170–1999). Although the test process of the Cuoxam method is simple and fast, cellulose degrades greatly in Cuoxam solution. There is another common copper (II) ethylenediamine (CED) method (GB/T 1548–2004), which can accurately measure the molecular weight of cellulose, but it is difficult to prepare CED solution. Therefore the search for new efficient solvents to measure the molecular weight of cellulose has always been a research hotspot. However, Cellulose can hardly be dissolved in common solvents, due to its extensive intra- and intermolecular hydrogen bonding [14,15,16,17], and the amphiphilicity distribution of the crystal surfaces [18,19,20]. As is well known, most of the solvent systems have various deficiencies. For example, C2S/NaOH used in viscose fiber production, with sulfuric acid as coagulation bath, causes serious pollution to the air and water, and it is not suitable for testing the molecular weight of cellulose. Although side reaction occurs during the dissolving process [21], N-methylmorpholine-N-oxide (NMMO) [22,23,24] has been prevalently applied in the cellulose wet spinning industry to take the place of traditional C2S/NaOH viscose fiber production. Cellulose can be dissolved in NMMO at 90 °C, and at high temperatures the relationship between molecular weight and intrinsic viscosity of cellulose has become so complicated that no one has studied it. Many new solvents have been developed and the relationship between intrinsic viscosity and molecular weight of cellulose has been studied, such as lithium chloride/N,N-dimethylacetamide (LiCl/DMAc), [ η ] = ( 1.278 × 10 4 ) M w 0.83 [25,26], this equation is applicable to cellulose with a molecular weight range of 12.5 × 10⁴–70.0 × 10⁴, and cannot characterize cellulose with a smaller molecular weight. BmimAc/DMSO, [ η ] = 2.5 × DP 0.83 [9], belongs to the class of ionic liquids (ILs) [17]; LiOH, [ η ] = ( 2.7 × 10 2 ) M 0.79 [27,28] and paraformaldehyde (PF)/DMSO [23,24] [ η ] = 3.01 × DP 0.81 . The alkaline solvents have been studied extensively [29,30,31,32], in which, NaOH/urea [30,31,32] is a quite unique aqueous solvent for fast dissolution of cellulose involving the breakage of the hydrogen bond of cellulose, and dissolving into stable solution with balanced intra- and intermolecular action among the cellulose and the solvent constituents. The relationship between the intrinsic viscosity and molecular weight of cellulose in 6 wt % NaOH/4 wt % urea aqueous was first proposed by Zhang et al., which was [ η ] = ( 2.45 × 10 2 ) M 0.815 [33]. The work also indicated that NaOH solution causes cellulose degradation, and the degradation rate is slower than that of Cuoxam solution. In order to develop a new solvent system for the determination of molecular weight of cellulose, a lot of research had been done on addition of co-solvent. Recently, the addition of co-solvent has gained increasing interest in improving the dissolving capacity for cellulose, such as DMSO [34,35], urea [36], and choline chloride [37]. However, it is still a challenge to quickly dissolve natural cellulose with high degree of polymerization (DP) at near room temperature [38]. Tetra-n-butylammonium hydroxide (TBAH) with DMSO has been proved to be an efficient multiple-component solvent for dissolving cellulose [39,40,41]. Even natural cellulose can be completely dissolved in several minutes under room temperature [4,42,43]. These reports inspire us to establish a fast and accurate method based on viscosity to determine the molecular weight of cellulose, which is anticipated to be much more convenient than the commonly used copper (II) ethylenediamine (CED) method (GB/T 1548–2004), and cuprammonium hydroxide (Cuoxam) method (GB/T 9170–1999).
In this work, the cellulose samples were dissolved in TBAH/DMSO/H2O (THDS, with the ratio of 1:8:1 in weight) to generate true molecular solutions with five gradient concentrations. The relationship between the DP or molecular weight and the intrinsic viscosity of cellulose in THDS was established in the form of a Mark–Houwink equation, according to the DP value tested by Cuoxam method. Then, the reliability of the equation was checked by CED method, as well as the gel permeation chromatography (GPC) method to test the corresponding cellulose acetate samples. Furthermore, the morphology of cellulose molecules in THDS solvent system was characterized by atomic force microscopy (AFM), and the dispersion level of cellulose molecules in THDS solution was analyzed by dynamic light scattering (DLS). The stability of cellulose molecules in the THDS solution was studied by comparing the DP values of the equivalent regenerated samples with the original cellulose. The crystal structure of the cellulose samples were tested by wide-angle X-ray diffraction (WAXD), Fourier transform infrared (FT-IR), and 13C NMR, before and after regeneration from the THDS solutions.

2. Materials and Methods

2.1. Materials

Materials and reagents: Straw cellulose (Isolated in our lab with the reported method [44]), wood pulp (Zhonglin Industry Co., Ltd., Canada), cotton pulp (Xinxiang Chemical Fiber Co., Ltd., Xinxiang, Henan, China), bamboo pulp (Chengdu Liya Co., Ltd., Chengdu, Sichuan, China), and microcrystalline cellulose (MCC, Shanghai Aladdin Biochemical Technology Co., Ltd., Shanghai, China) were adopted as the cellulose samples for testing. The samples were codes as C1–C5 sequentially, with the increase of their molecular weights. Other two kinds of bamboo pulp with different degrees of polymerization (Chengdu Liya Co., Ltd., Chengdu, Sichuan, China) were codes as C6–C7 sequentially. Samples C1–C5 were used for equation derivation and samples C6–C7 for equation verification. Cellulose samples were all oven dried at 105 °C for 2 h before use. Tetra-n-butylammonium hydroxide (TBAH, 15 wt %) was purchased from Alfa Aesar Co. The TBAH aqueous solution was concentrated to 50 wt % under vacuum before use. Dimethyl sulfoxide (DMSO, A.R. grade) and acetylation reagent acetic anhydride (Ac2O, A.R. grade) were supplied by Chengdu Haihong Experimental Instrument Co., Ltd., Chengdu, Sichuan, China. The Cuoxam and the CED solution were prepared according the standard methods.

2.2. Preparation of Dilute Cellulose Solution

2.2.1. Preparation of Cellulose/Cuoxam Solution

The Cuoxam solution was prepared by dissolving copper carbonate in ammonium hydroxide at room temperature under continuous stirring, according to the standard method (GB/T 9170–1999). The content of copper in Cuoxam solution should be greater than 1.3 g/100 mL. The cellulose samples C1–C7 were separately dissolved in Cuoxam solution under room temperature with magnetic stirring to give a blue homogeneous solution with the concentration of about 1.5 g/L, to test the degree of polymerization (DPC).

2.2.2. Preparation of Cellulose/CED Solution

The CED solvent was prepared by using newly synthesized copper hydroxide and ethylenediamine according to the standard method (GB/T 1548–2004). The copper content in the CED solution was determined to be 1.00 ± 0.02 mol/L by titration method. The cellulose samples C1–C5 were completely dissolved in CED by continuous vigorous magnetic stirring at room temperature for 7 days. The concentration of cellulose/CED solution was controlled between 3 and 4 g/L to test the degree of polymerization (DPCED).

2.2.3. Preparation of Cellulose/THDS Solution

The DMSO was evenly mixed with the cellulose samples C1–C5 at room temperature. Then, the TBAH aqueous solution was added under mild stirring for 12 min to obtain the transparent cellulose solution with the concentration of 0.25 wt %, which was taken as the mother liquor. A series of the diluted cellulose solutions were prepared by gradient dilution, as shown in Table 1.

2.3. Viscosity Analysis of the Cellulose Solution by Ubbelohde Viscometer

2.3.1. Cellulose/Cuoxam Solution

The flow time of Cuoxam (t0, s) and the corresponding solution (t1, s) were tested with the Ubbelohde viscometer under 25 °C. The intrinsic viscosity ([η]) was determined via Huggins’ plot (i.e., the plot of ηsp/c versus c) based on Equation (1), where c was the cellulose concentration in unit of g/L, and K1 is a constant. The specific viscosity (ηsp) was calculated based on Equation (2). The intrinsic viscosity [η] values of the cellulose samples C1–C7 in Cuoxam were recorded for further calculating the DPc.
η sp / c = [ η ] + K 1   [ η ] 2 c .
η sp = t 1 / t 0 1 .

2.3.2. Cellulose/CED Solution

The outflow time (t) of the cellulose/CED solutions of samples C1–C5 were tested with the Ubbelohde viscometer under 25 °C, in the unit of s. According to the one-to-one correspondence between the viscosity ratio ([η]/η) and [η]·c. (GB/T 1548–2004), and Equation (3), the intrinsic viscosity [η] of the cellulose samples C1–C5 in CED solution would be calculated.
[ η ] η = h · t .
Here, h is the constant of viscosity meter in unit of s−1. The constant of viscosity meter (h) was determined according to the standard method by glycerin aqueous solution calibration.
The intrinsic viscosity [η] of the cellulose samples C1–C5 in CED solution would be further adopted to calculate the DP values measured by CED method (DPCED), and comparably analyzed with the Cuoxam and THDS solutions.

2.3.3. Cellulose/THDS Solution

The capillary Ubbelohde viscometer with inside diameter of 0.8–0.9 mm was used to measure the flow time (t0 and t) of the cellulose solution and the solvent. The water bath temperature was set at 25 °C. All the tests were conducted for more than 5 times. Only the values that met the requirement of Grubbs’ Test (α = 0.01), Dixon’s Test (α = 0.01), and Student’s t test (t = 5.598) were selected for elucidating the intrinsic viscosity-molecular weight relationship for cellulose in THDS solution.

2.4. Determination of the Degree of Polymerization (DP) of Cellulose

2.4.1. Cuoxam Method

The degree of polymerization of the cellulose samples C1–C7 in Cuoxam solutions were analyzed according to Equation (4), and noted as DPc.
DP = η sp ( 1 + 0.29 η sp ) × 5 × 10 4 × c
Here, ηsp is the specific viscosity of the Cuoxam solution, and c is the concentration of cellulose, in the unit of g/L.
The DPC values of the cellulose samples C1–C5 were implicated to determine the Mark–Houwink equation for cellulose in THDS solution. The DPC values of samples C6 and C7 were used for the difference analysis between Cuoxam method and THDS method.

2.4.2. CED Method

According to the intrinsic viscosity of the cellulose/CED solution obtained above, the DPCED of the cellulose samples were calculated according to Equation (5).
DP = ( [ η ] 2.28 ) 1.316 .
Here the unit of the intrinsic viscosity [η] is mL/g.
The DPCED values of samples C1–C5 were applied for analyzing the difference of the DP values of the cellulose samples obtained by different methods.

2.4.3. THDS Method

The following Equation (7) was adopted for THDS method.
[ η ] = K 2 × DP α .
Here [η] is the intrinsic viscosity of cellulose/THDS solution, in the unit of mL/g, K2 and α are parameters which depend on the solvents. DP is the degree of polymerization of the cellulose sample, which is tested by the Cuoxam method. The intrinsic viscosity [η] is determined by using an Ubbelohde viscometer via Huggins’ plot (i.e., plot of ηsp/c versus c) according to Equation (1).

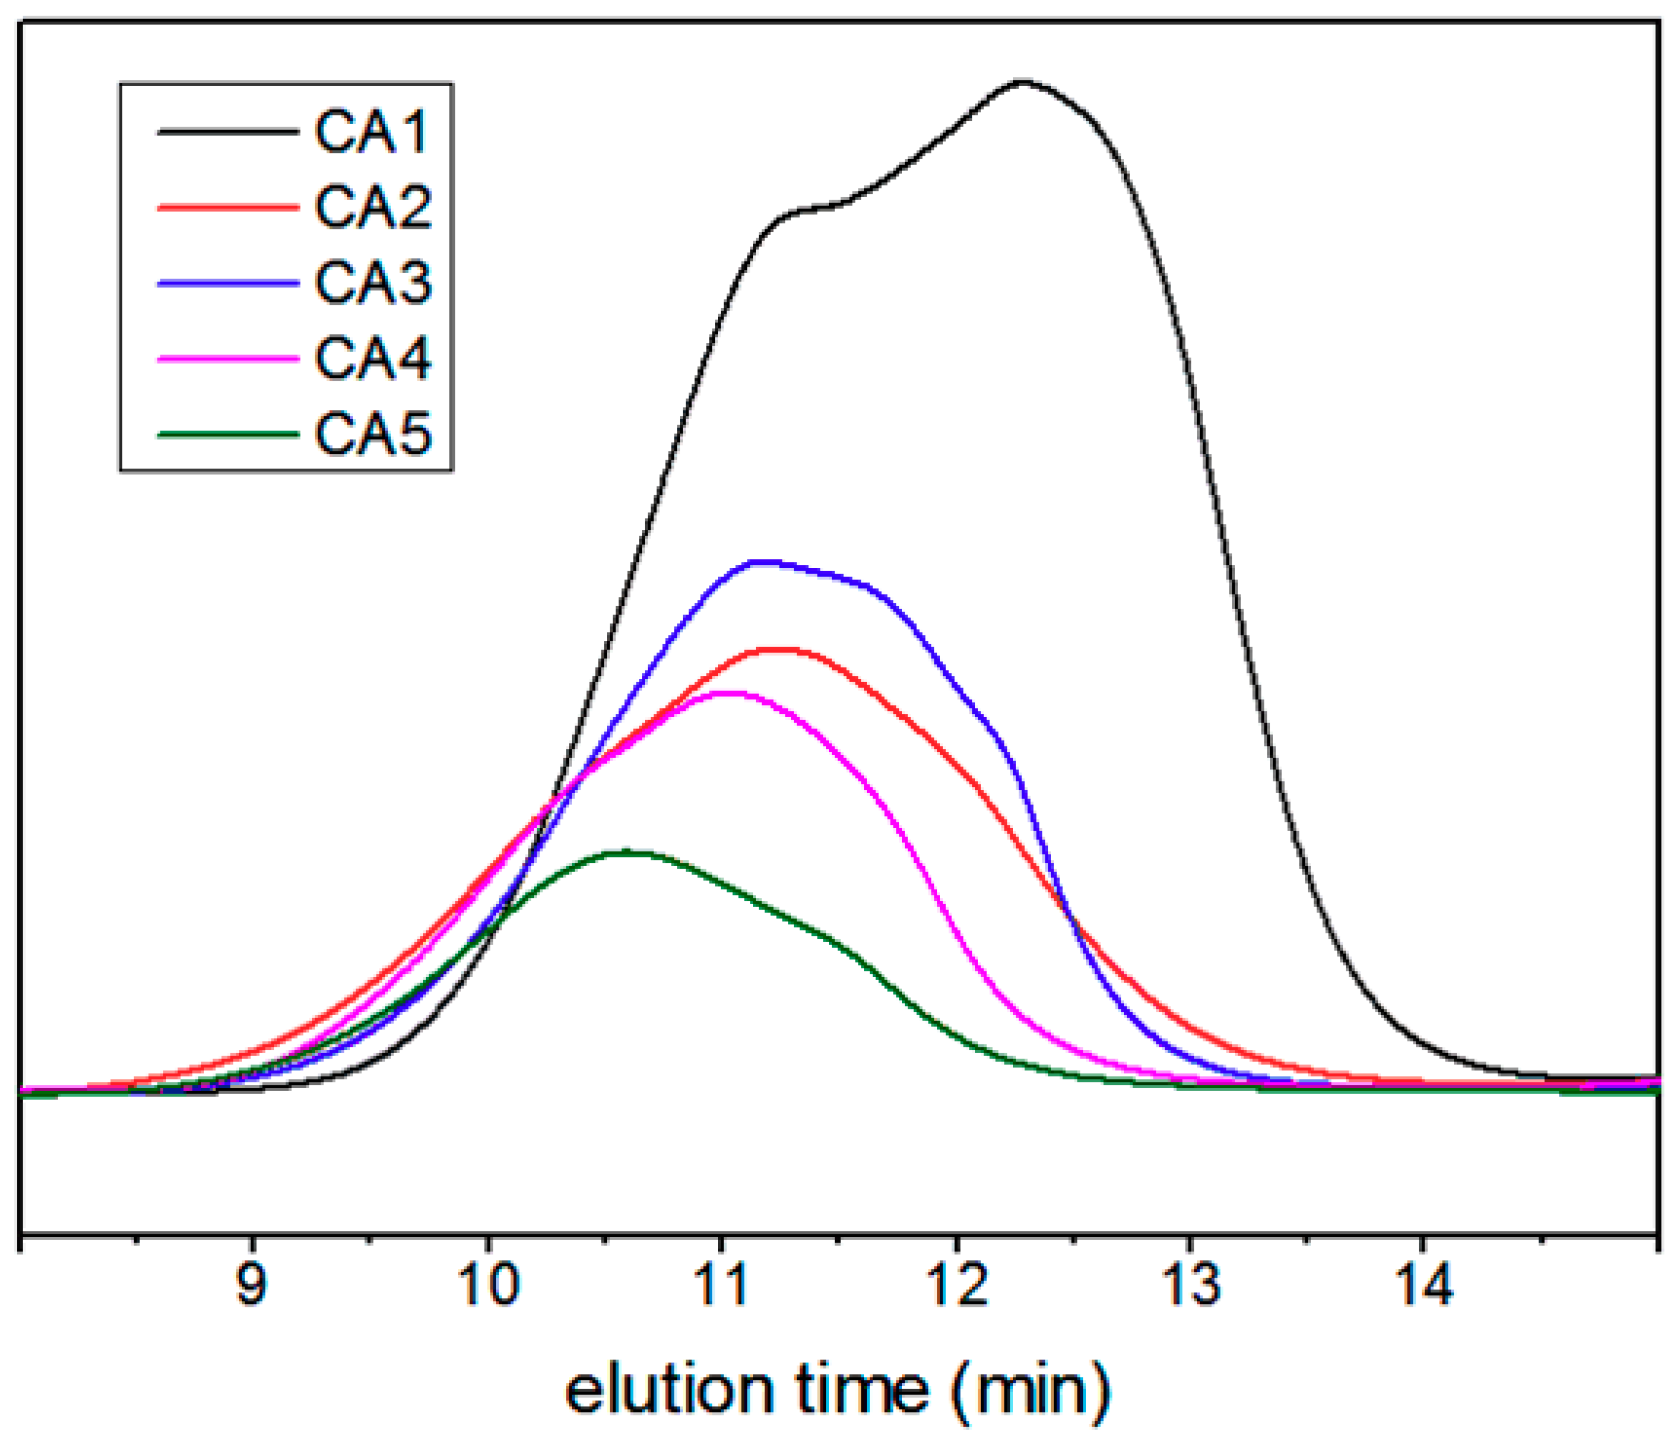
2.4.4. Determination of the DP of the Derived Cellulose Acetate Samples by the GPC Method

The cellulose samples C1–C5 were transferred into the corresponding acetylated cellulose samples with acetylation reagent Ac2O in the THDS solvent. According to the reported procedures [45,46,47,48,49]. At first, 1 wt % cellulose was dissolved in THDS, then, 13 mol Ac2O per mole of AGU was added into the solution. The reaction mixture was stirred at 60 °C for 3 h. The cellulose acetate samples (CA) were precipitated by pouring the reaction mixture into 500 ml ethanol under continuous stirring. After filtration, the crude cellulose acetate samples were washed three times with ethanol, and then vacuum dried at 60 °C. The prepared cellulose acetate samples were named as CA1–CA5, corresponding to the five cellulose samples C1–C5. FT-IR spectra proved the successful acetylation of cellulose. The degrees of substitution (DS) were calculated by 1H NMR spectra method (Supporting Information).
A gel permeation chromatography (HLC-8320GPC, Tosoh Corporation, Shanghai, China) instrument with two columns in series (TSK gel Super AWM-H, Tosoh Corporation, Shanghai, China) connected to refractive index detector, was used to calibrate the molecular weight of the cellulose acetate samples. The GPC test was performed with N, N-dimethyl formamide (DMF) as eluent, polymethyl methacrylate as a standard at 40 °C. The flow rate of eluent was set as 0.4 mL/min. The time was 30 min for one sample.
The DP values measured by GPC method (DPGPC) of the cellulose samples (C1–C5) were calculated by Equation (7), based on the molecular weight of cellulose acetate samples (CA1–CA5). Where, Mw is the weight-average molecular weight of the cellulose acetate samples, DS is the degree of substitution of acetylated cellulose. The DP value of the cellulose sample was calculated by dividing the molecular weight of the corresponding cellulose acetate by the weight of the repeating units [9].
DP = M w 43 × DS + 162 .

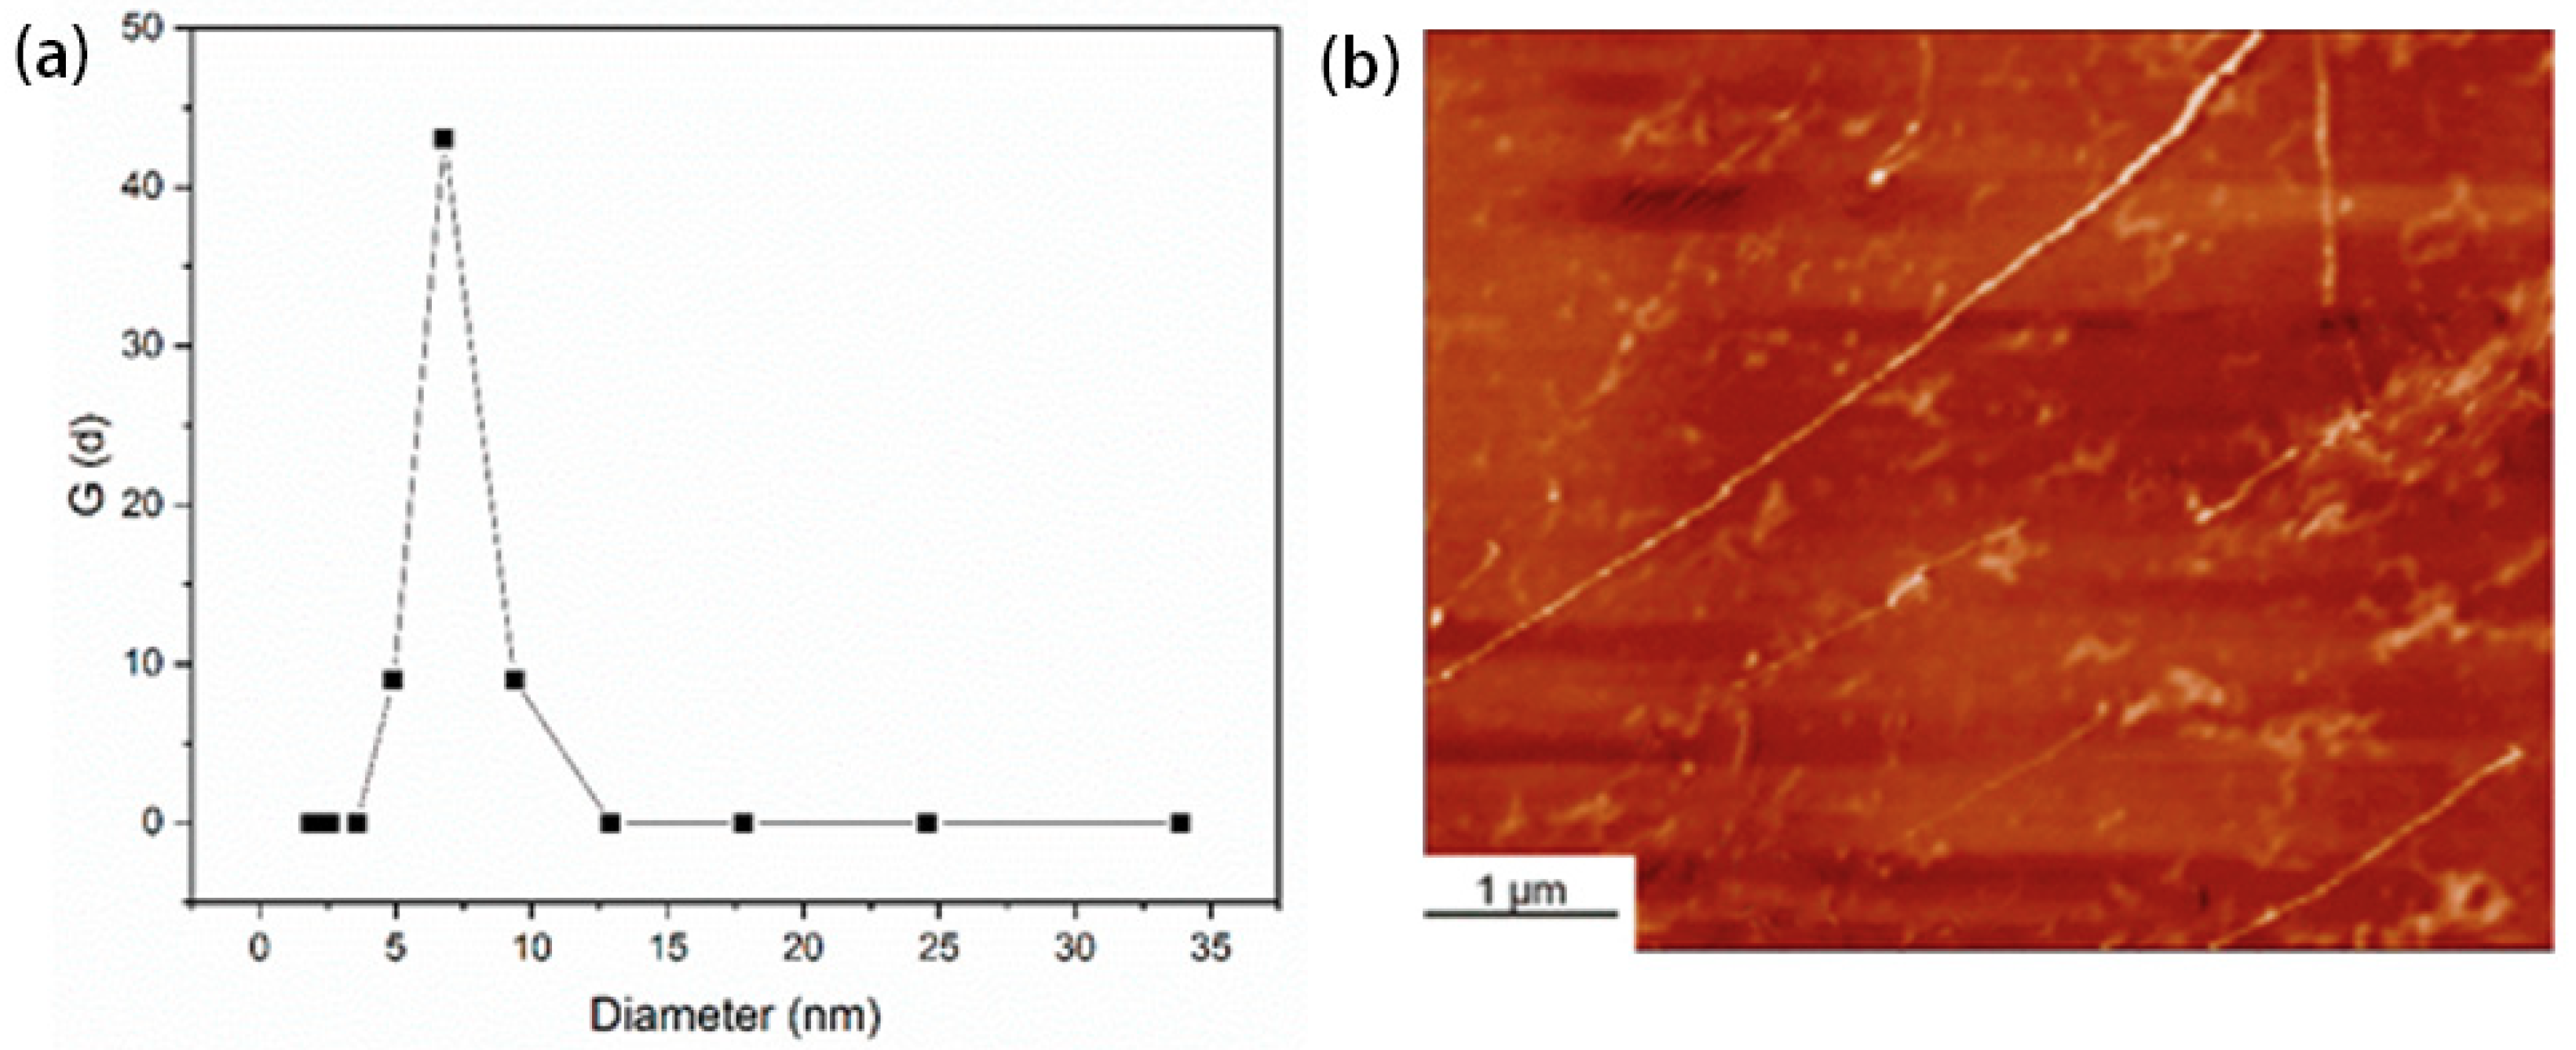
2.5. The Analysis of Cellulose Molecules Dispersion Level in THDS Solution

2.5.1. Dynamic Light Scattering (DLS)

The cellulose solution (C1, 0.5 × 10⁻⁴ g/mL) was prepared in the similar way as shown in Section 2.2.3. The prepared solution was filtrated through a 0.25 μm PTFE Millipore filters into a clean vial. The dispersion level of the cellulose molecules in the THDS solution was tested by dynamic light scattering (DLS, wide-angle laser scattering instrument (Nano Brook Zeta PALS; Brookhaven Instruments, Holtsville, NY, USA)). The refractive index of the cellulose/THDS solution was 1.466. DLS data was analyzed using the CONTIN program. Meanwhile, the Stokes–Einstein relationship was used to calculate the hydrodynamic radius (Rh).
R h = k B T 6 π η 0 D ,
where kB is the Boltzmann constant; T is the temperature, in the units of K; η0 is the solvent viscosity, in the unit of cP; and D is the translational diffusion coefficient.

2.5.2. Atomic Force Microscope (AFM)

Multimode scanning probe microscope (AFM, Veeco, Santa Barbara, CA, USA) operated in the tapping mode was used for the imaging of the 0.05 mg/mL cellulose solution sample (C5). The morphological data of the images were analyzed using the AFM-accessory software.

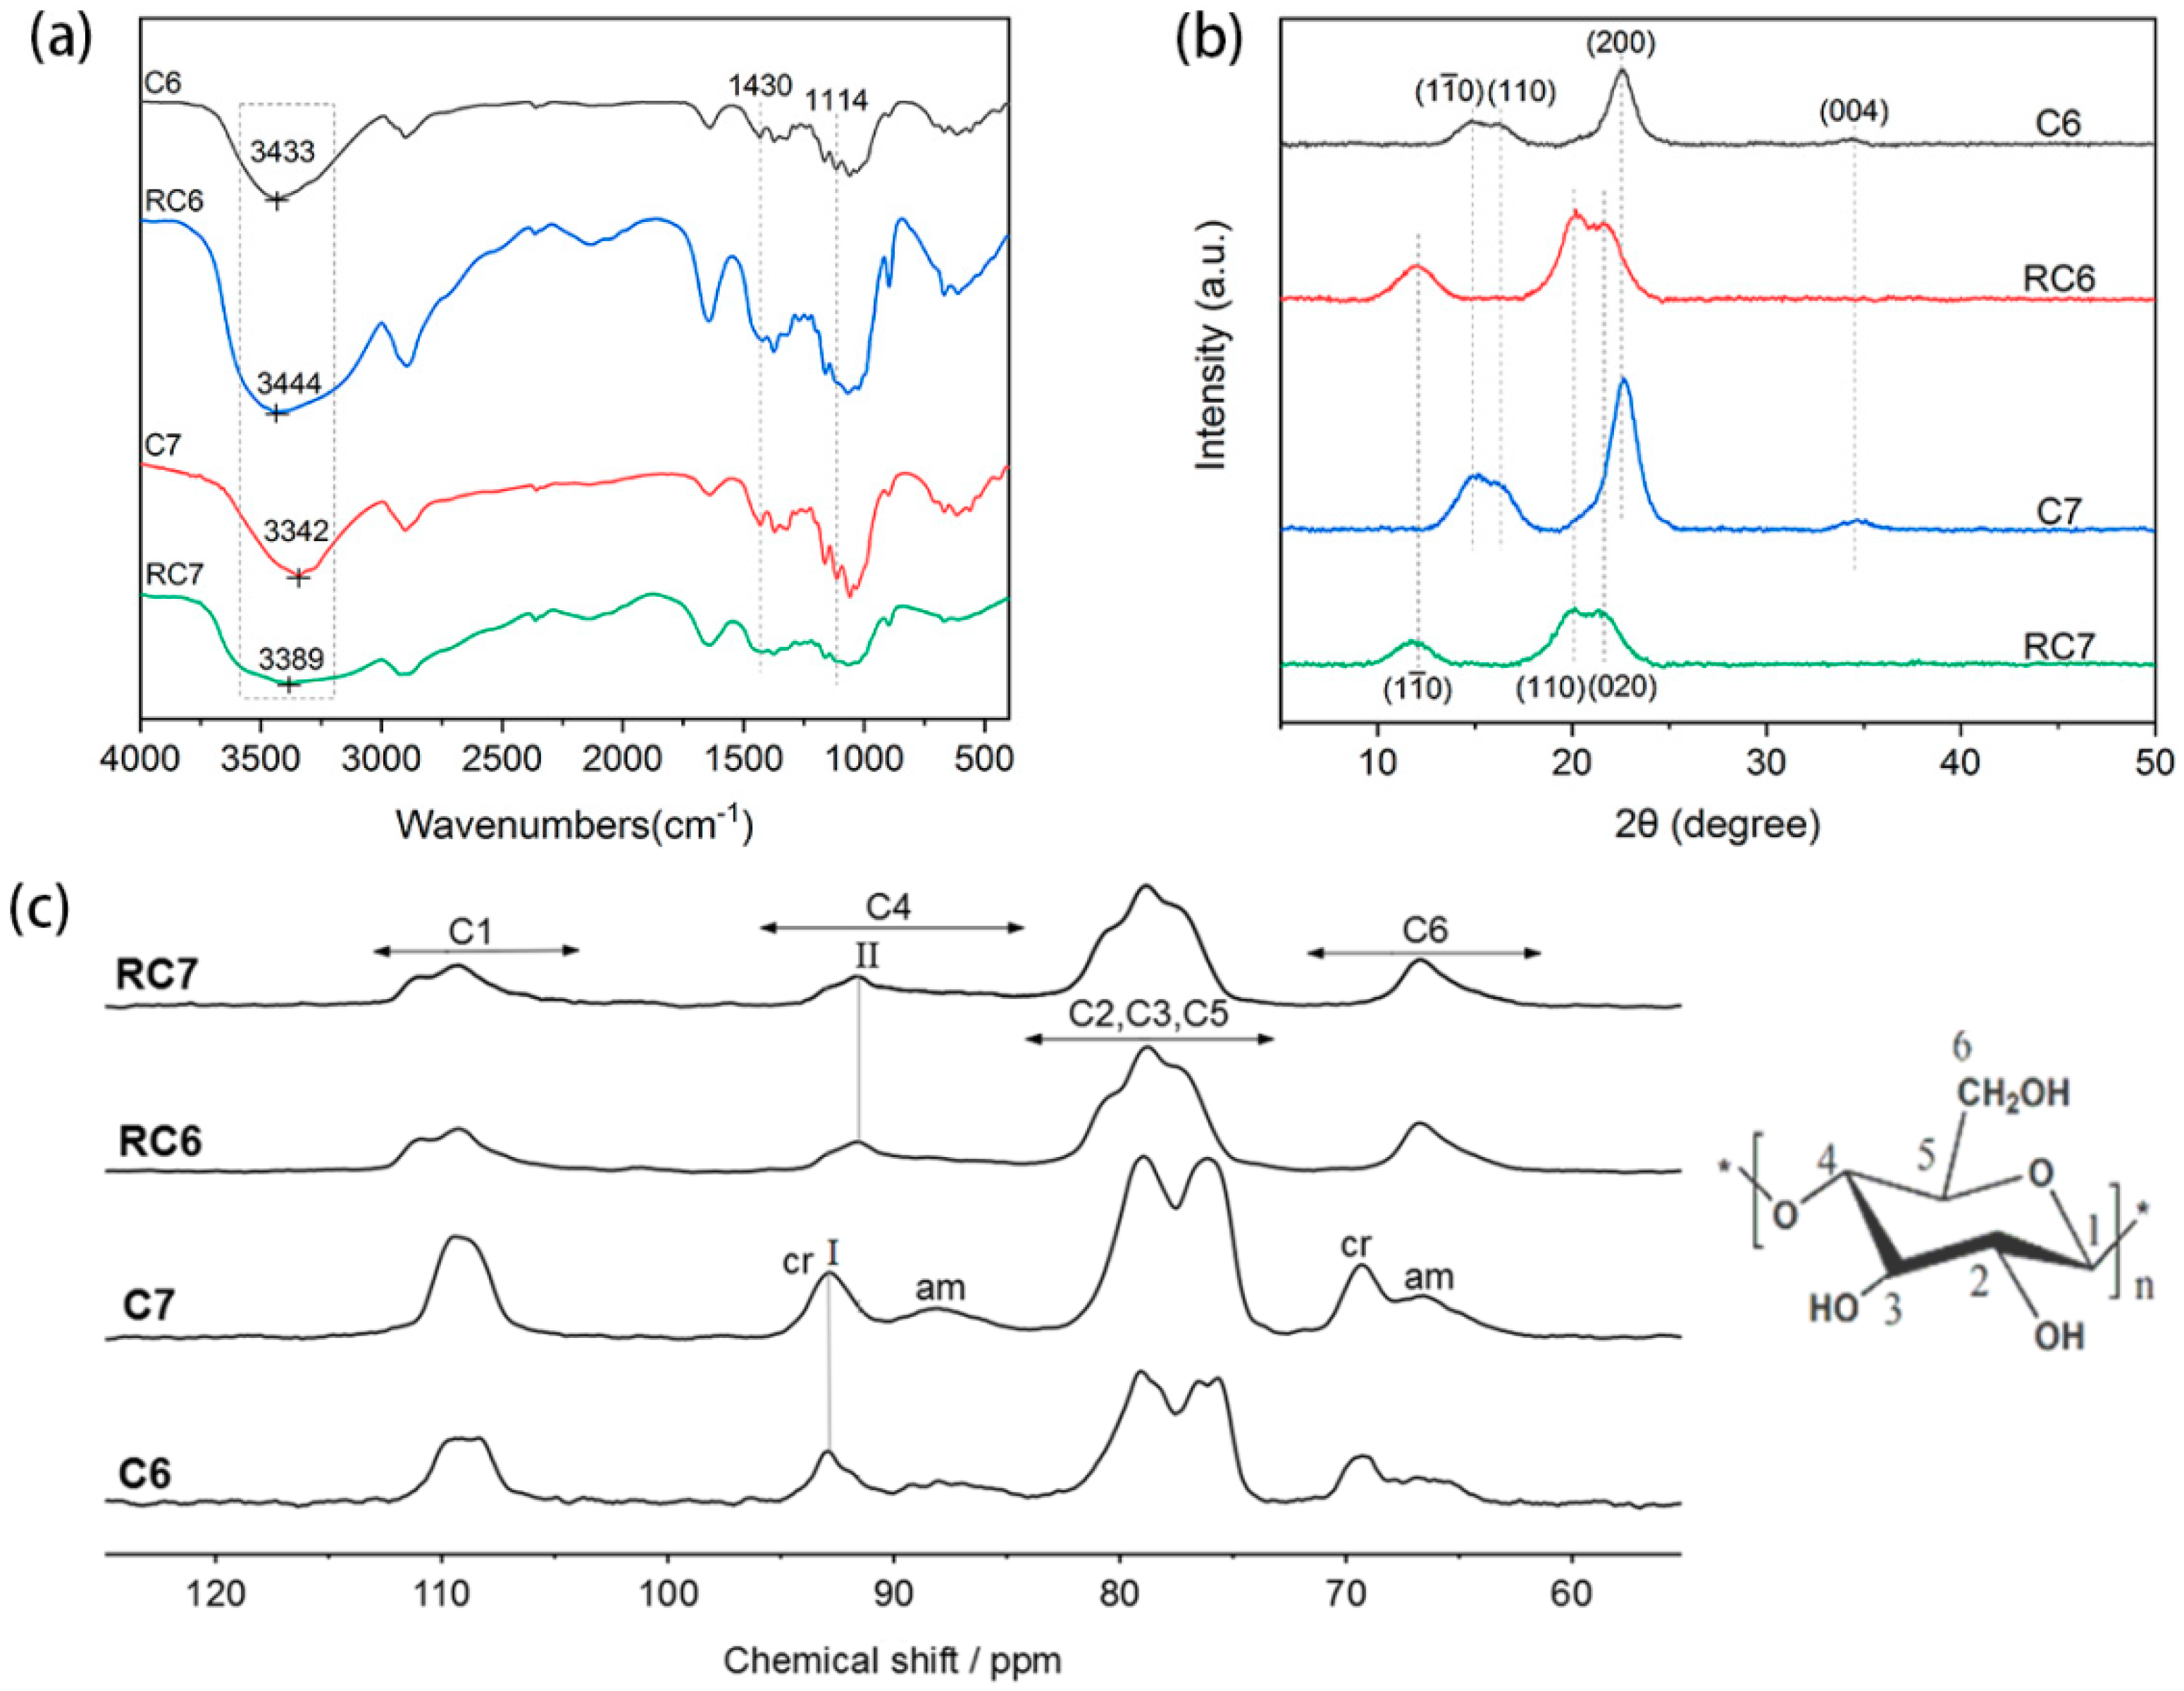
2.6. The Structure Analysis of Cellulose in THDS Solution

The cellulose/THDS solution was added into excessive deionized (DI) water under continuous stirring to completely regenerate the cellulose, which was named RC. The RC was washed with DI water, and filtered through a 0.22 μm filter until the filtrate was neutral. The washed RC was freeze-dried for further use and its DP value was tested bythe THDS solution method to compare with original cellulose sample.
Fourier transform infrared (FT-IR) spectra were recorded on a Nicolet 6700 (Thermo Scientific Inc., Waltham, MA, USA) in room temperature, using the KBr tablet method. The spectral resolution was 2 cm−1. In the sample preparation and measurement process, infrared light was used to dry to remove moisture.
The crystal structures of the original cellulose (C6 and C7) and regenerated samples (RC6 and RC7) were characterized by wide-angle X-ray diffraction (WAXD, Panalytical X’pert PRO diffractometer, Ni-filtered Cu Kα radiation, Wageningen, The Netherlands), at 40 kV and 30 mA. The scanning angle ranged from 5° to 50°.
The aggregation state structure of C6, C7, RC6, and RC7 was analyzed by solid-state 13C nuclear magnetic resonance (NMR). The solid-state 13C NMR spectra were recorded on a AVANCE III 400 apparatus (Bruker Biospin GmbH, Rheinstetten, Germany) with an operating frequency of 75.5 MHz, a magic angle spinning (MAS) rate of 14 kHz, compensation time of 34 ms, contact time of 2 ms, and delay of 2 s between the two pulses.

3. Results and Discussions

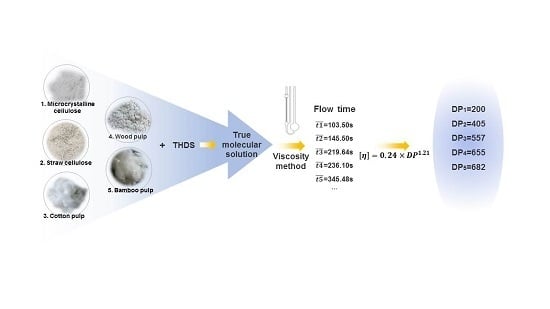
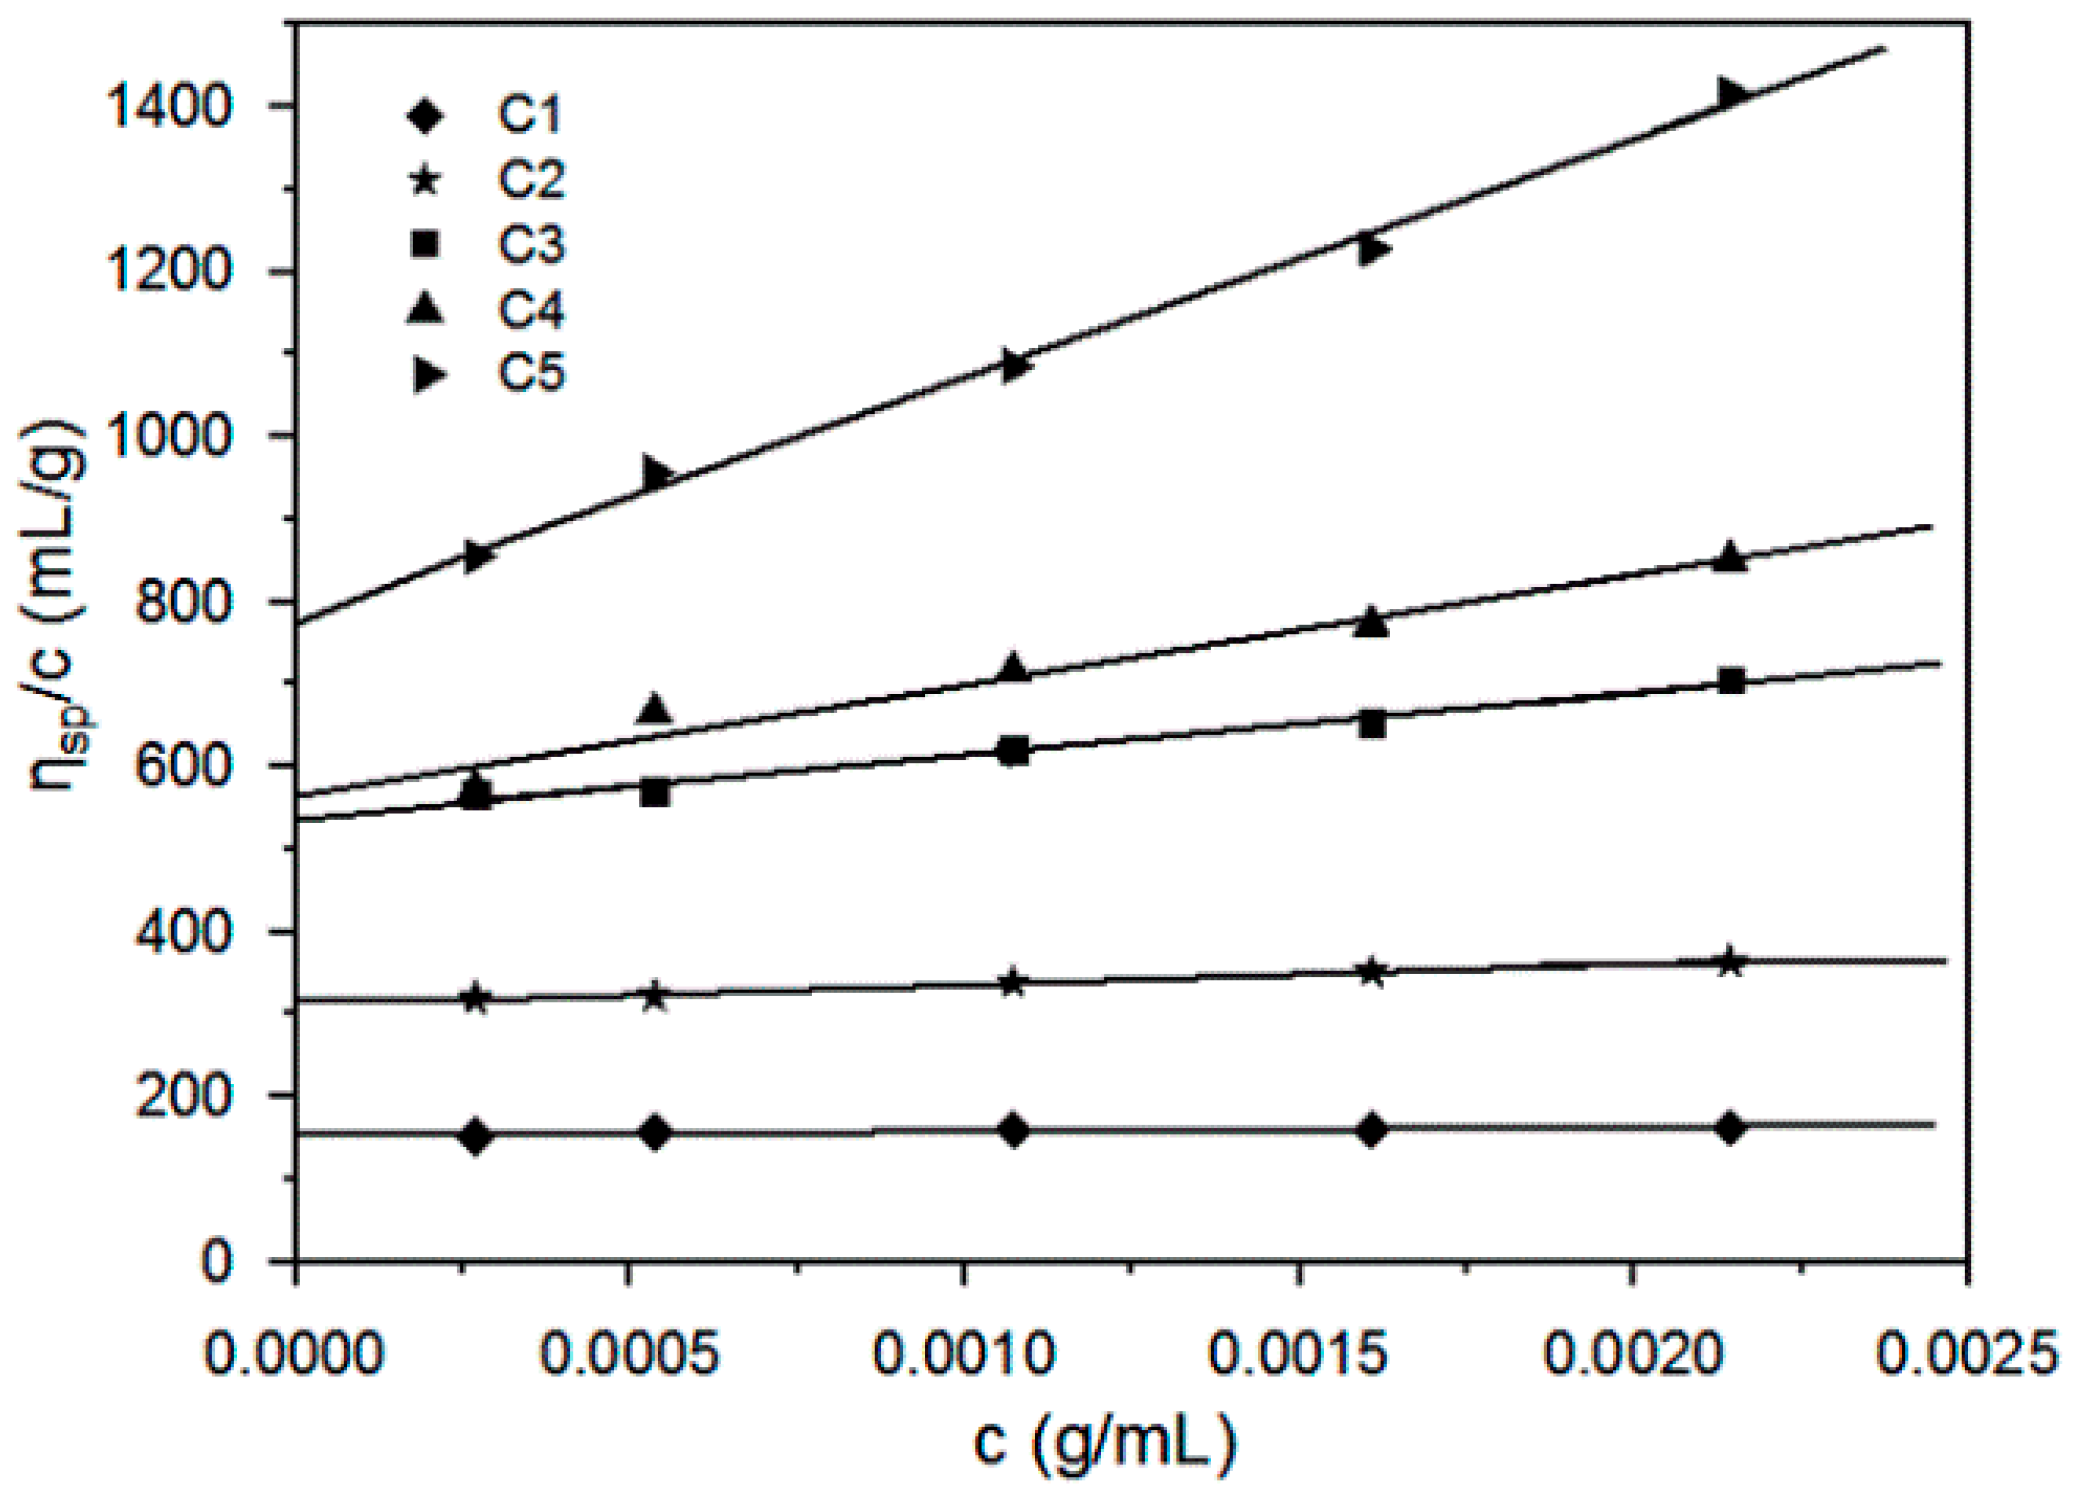
3.1. Preparation and Viscosity Analysis of the Cellulose in THDS Solution

All cellulose samples C1–C9 were dissolved in THDS at room temperature within 12 min to obtain the transparent solutions as shown in Figure S1. A quick dissolving process for cellulose in THDS solvent was provided as Video S1 in the supporting information.
The plots of the reduced specific viscosity ηsp/c were drawn versus the concentration c, as shown in Figure 1. The line was extrapolated to zero concentration to obtain the intrinsic viscosity ([η]) of the cellulose solution in THDS. The lopes of the lines are corresponded to the Huggins’ constant K1 values. The values of [η] and the corresponding K1 in the Equation (1) of the cellulose samples were summarized in Table 2.
The intrinsic viscosity of each specific sample in three solvents are listed in Table 3. They are in the sequence of [η]Cuoxam < [η]CED < [η]THDS. According to the hydrodynamic theory of polymer in dilute solution, the intrinsic viscosity of a polymer is proportional to the hydrodynamic volume (Ve/M) of a polymer per unit mass in solution. The value of [η] increased with the interaction between the solvent and the polymer molecules. So, the solvation effect of THDS is much better than both the solvation effect of the Cuoxam and the CED. The improvement of [η] in all the three solvents with the order of cellulose samples C1–C5 are ascribed to the increasing of the DP.

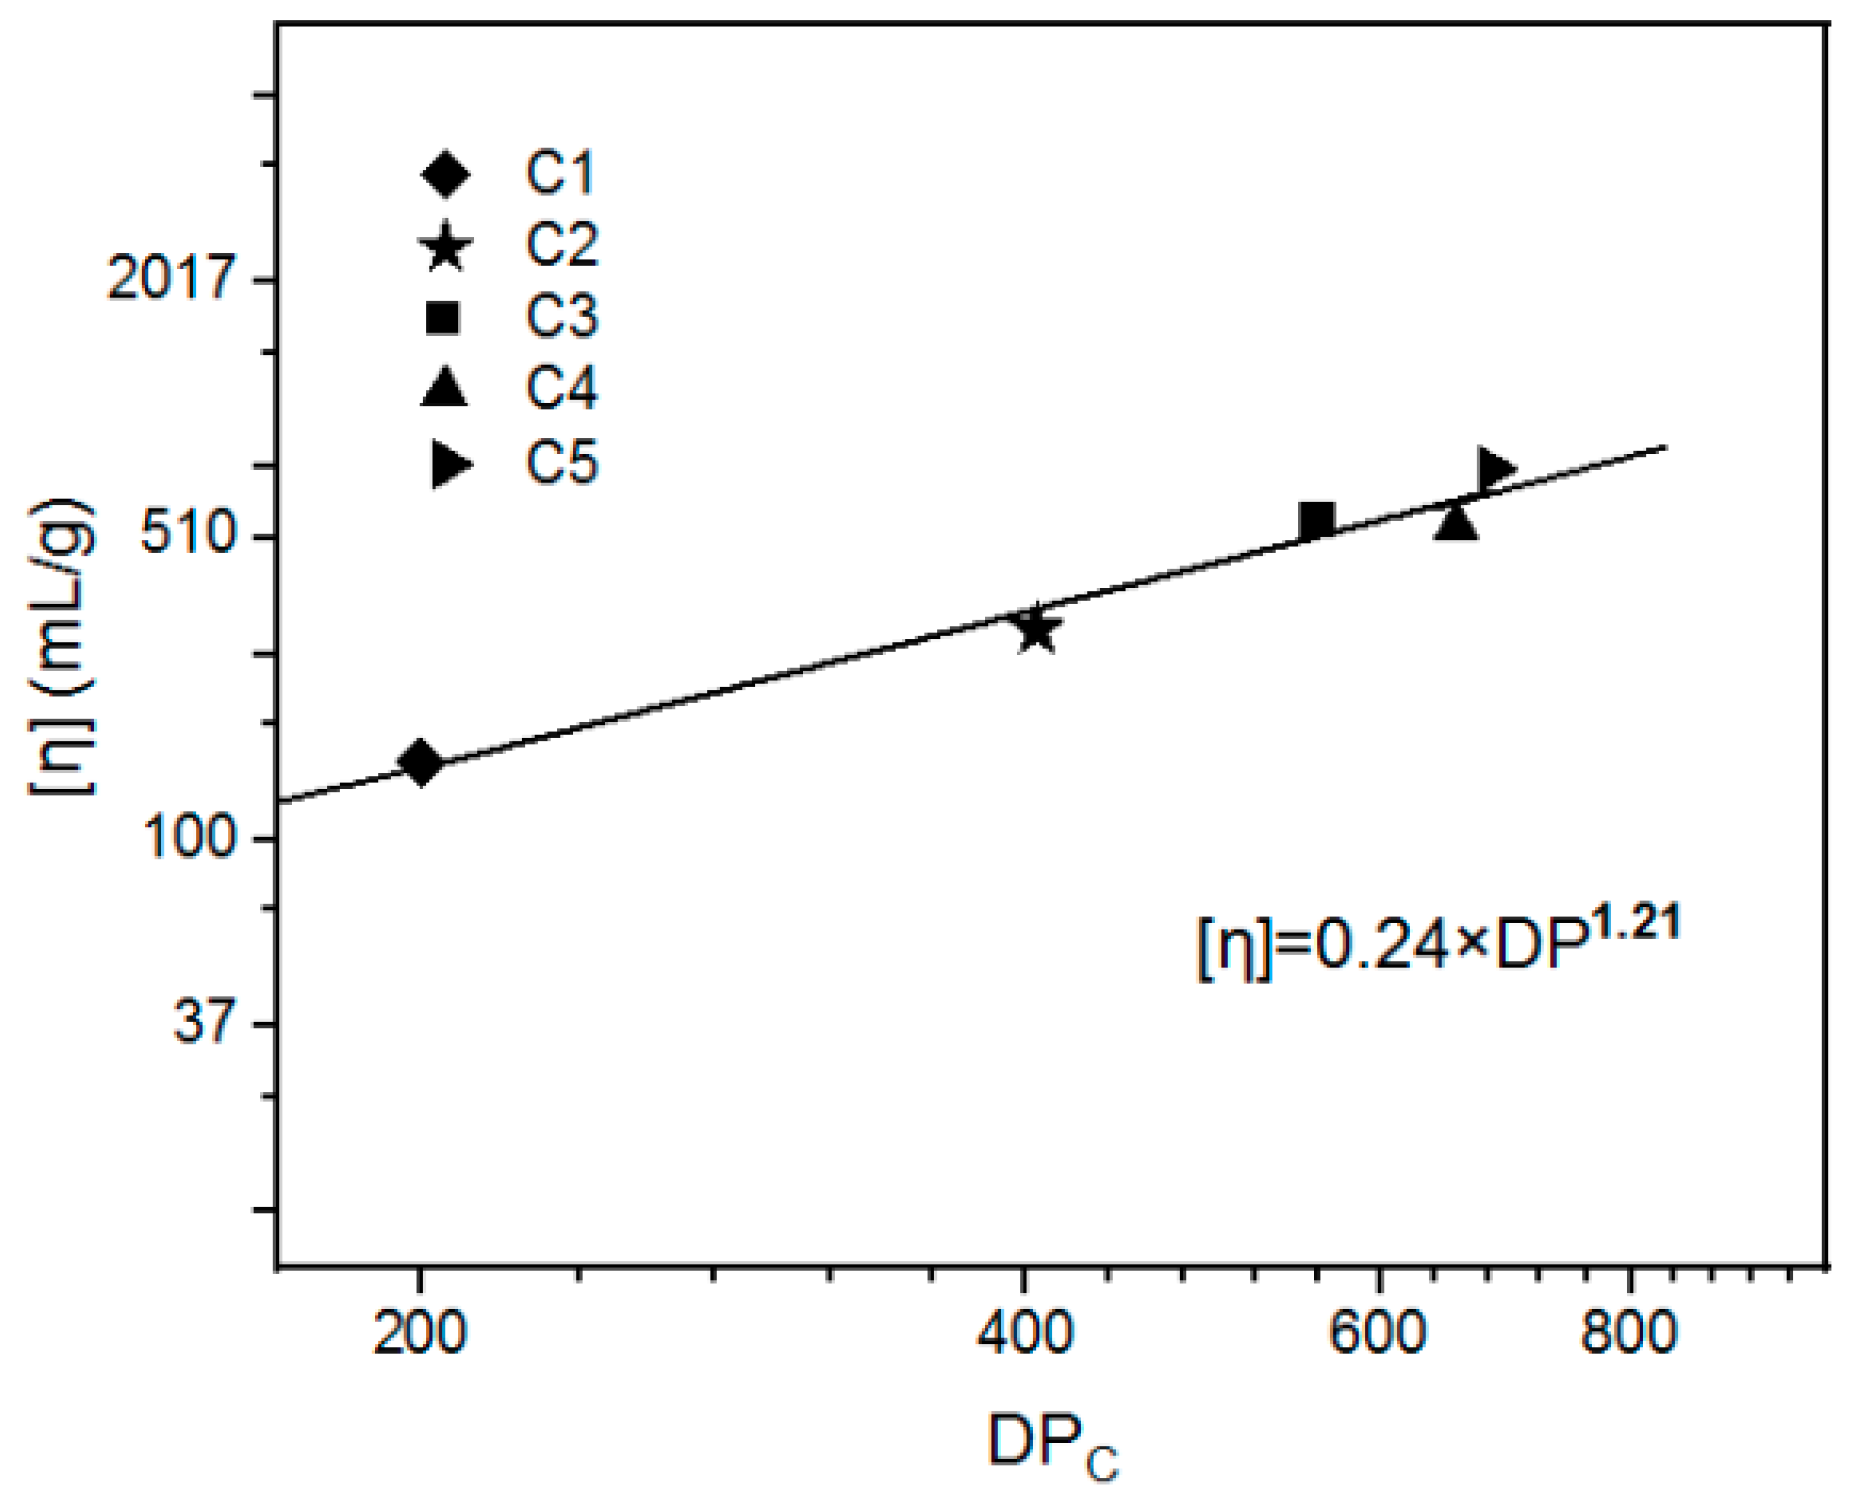
3.2. The Elucidation of the Mark–Houwink Equation for Cellulose/THDS Solution

The DP values of the cellulose samples C1–C5, measured by the Cuoxam method (as shown in Table 4), were used to determine the Mark–Houwink equation for the cellulose/THDS dilute solution. The intrinsic viscosity values of the cellulose samples C1–C5 in the THDS solvent were correlated to the DPc values, as shown in Figure 2. The power law was founded from the ln–ln plot, with the α value as 1.21, and the K2 value as 0.24.
[ η ] = 0.24 × DP 1.21 .
Or
[ η ] = 5.09 × 10 4 M η 1.21 .
Here Mη is the viscosity average molecular weight by dilute solution viscosity method of the cellulose samples.
The correlation coefficient (Pearson’s r) was 0.981 by linear regression analysis, which represented a good reliability of the Mark–Houwink equation. Where, the α value was 1.21, which indicated that the linear flexible chains of cellulose were dispersed in the THDS solvent.
The Mark–Houwink equation for cellulose in PF/DMSO at 30 °C is reported as [ η ] = 3.01 × DP 0.81 [12]. In 1-butyl-3-methylimidazolium acetate/dimethyl sulfoxide (BmimAc/DMSO) solution, the relationship between intrinsic viscosity and DP is proved to be [ η ] = 2.5 × DP 0.83 [9]. The reported values of the α in the Mark–Houwink equation were summarized in Table S1 and Figure S2 (supporting information), including Cadoxen [9,12,50], FeTNa [51], PF/DMSO [12], Cuen [12,50], Cuoxam [12,50], BmimAc/DMSO [9], NaOH/urea aqueous solution [30,32,33], LiOH aqueous solution [27,28,52], NH3/NH4SCN [50], CED, and DMAc/LiCl [25,26]. The α in the Mark–Houwink equation indicates the solubility of the solvent for cellulose. The α values of 0.8 and above means linear flexibility of the macromolecular chains in the solvent [53].
The dissolution state of cellulose in THDS solvent was evaluated by DLS characterization (Figure 3), showed a single distribution, and the average particle size of cellulose was around 7 nm. In brief, cellulose is dispersed as isolated molecules in THDS solution, which consisted of the previous report on static light scattering and small-angle neutron scattering tests [13].
In the two-dimensional (2D) AFM height image (Figure 3) of sample C5, we observed distinct randomly-distributed lines of slender roots on the surface of the amino silicon wafer. Since cellulose is the only solute in the preparation process, these lines certainly belong to cellulose [54]. Moreover, we considered this two-dimensional structure of a single cellulose chain, because cross-sectional analysis showed that the height of this two-dimensional structure was 0.3 to 1 nm, consistent with the diameter of a single cellulose chain [55]. This conclusion showed that the THDS solvent was a suitable solvent for cellulose.

3.3. Comparable Analysis of Cellulose DP

To verify the reliability of the Mark–Houwink equation for the THDS system, the corresponding cellulose samples (C1–C5) were measured by the CED method, and the DP values were collected in Table 4. The DP values determined by the Cuoxam method were lower than those obtained by the CED method. The difference between the two methods was about 21% to 36%. Similar results are reported, and the DP values of cellulose tested by the CED method were higher than those obtained by the Cuoxam method [50]. Moreover, cellulose was partially degraded in both the Cuoxam and the CED solutions.
The cellulose samples C1–C5 were derived into the cellulose acetate samples CA1–CA5 for GPC analysis. The derivative samples were all structurally manifested by FT-IR. The DS values were determined by 1H NMR, according to the literature [10,11,56,57]. The DS values of the CA1–CA5 were 1.03, 0.87, 1.49, 0.97, and 0.89, respectively. The FT-IR spectra and the 1H NMR results were provided in the supporting information.
The GPC curves of the derived cellulose samples CA1–CA5 are shown in Figure 4. Table 5 shows the average molecular weight characterized by GPC method, including weight-average molecular weight (Mw), viscosity-average molecular weight (Mη), number-average molecular weight (Mn), z-average molecular weight (Mz), peak-molecular weight (Mp) of the derived cellulose, and the corresponding molecular weight distribution coefficients (MWD, Mw/Mn). In addition, the Mw, Mη, Mn of cellulose were calculated from Mw. Generally, the molecular weight of the polymer is in the order of Mw > Mη > Mn. The molecular weight distribution is the relationship between the relative content of each molecular weight close fractions in the homopolymer homologue and the molecular weight. The Mw/Mn value of cellulose ranged from 3 to 7, which indicated the increasing polydispersity of the cellulose acetate samples CA1 to CA5.
As shown in Table 4, the DPs calculated by Mw of GPC results were considerably higher than those tested by the Cuoxam method. The general order of Mw > Mη > Mn and the cellulose degradation in the copper ethylenediamine solution lead to this result [58]. As shown in Table 4, the DP of C6 and C7 determined by the Cuoxam method were about 21–22% lower than those specified by the THDS method. Because the polydispersity is ignored in the Mark–Houwink equation [50], the differences in the viscosity-based DP values are considered to be within a reasonable error range.

3.4. The Structure Analysis of Cellulose in THDS

According to the FT-IR spectra (Figure 5), the peak at 2898 cm−1 was ascribed to the stretching vibration of C–H. The peaks at 1650 and 1370 cm−1 were attributed to the adsorbed water and the deformation vibration of C–H, respectively; two peaks at 1158 and 896 cm−1 were asymmetric stretching vibration and out-of-plane deformation vibration of β-glycosidic bond C–O–C, respectively. C–O stretching vibration peak around 1114 cm−1 was split into several peaks. It is worth noting that early studies indicate that the peak at 1418 cm−1 is the characteristic peak for cellulose II and amorphous cellulose [59]. In contrast, if the sample is rich in cellulose I, characteristic absorption peaks appear at 1430 and 1111 cm−1 [60]. There was apparent blue shift happened to the O–H stretching vibration when the cellulose samples C6 and C7 regenerated from their THDS solutions, which were named as RC6 and RC7, seperately. The peaks shifted from 3433 to 3444 cm−1, and 3342 to 3389 cm−1, corrrespondingly, because of the transformation of the crystal structure from cellulose I to cellulose II. No new covalent bond formed in the regenerated cellulose.
According to the WAXD analysis (Figure 5), the cellulose samples (C6 and C7) showed typical diffraction peaks of cellulose I at 14.9°, 16.5°, 22.7°, and 34.6°, respectively, corresponding to the 1 1 ¯ 0, 110, 200, and 004 crystal surfaces. However, the regenerated cellulose (RC6 and RC7) showed three distinct diffraction peaks at 12.3°, 20.0°, and 22.1°, which were typical diffraction peaks of cellulose II crystal form, corresponding to the 1 1 ¯ 0, 110, and 020 crystal faces, respectively. As was shown in Figure 5, the crystallinity of the regenerated cellulose samples (210.6‰ for RC6 and 174.5‰ for RC7) apparently decreased compared with the original cellulose samples (259.6‰ for C6 and 278.6‰ for C7), which was mainly because of the quick regeneration process by adding excessive water into the cellulose solution.
The same results were shown in the solid-state 13C NMR spectra (Figure 5). The signal at 90–95 ppm corresponded to the highly ordered crystallized cellulose, and the signal at 83–90 ppm corresponded to the disordered and the less-ordered cellulose chains [61,62,63,64,65,66,67]. In addition, various crystal types of cellulose can be identified from the splitting of the peaks [64]. As can be seen in Figure 5, the splitting of the C4 signal was the most prominent. However, the peak separation between amorphous and crystalline was not apparent after cellulose regeneration. It indicated that the degree of crystal order increased after cellulose regeneration. As could be seen from Figure 5, the crystalline region of regenerated cellulose was mostly composed of cellulose II crystal form, while the original cellulose was cellulose I crystal form. So, the variance in the [η]s and DPs was most likely due to the recrystallization of the original cellulose I into cellulose II after regeneration from the solution [43,68]. The cellulose II is less soluble than the original cellulose I [68], leading to a much smaller intrinsic viscosity and a corresponding lower calculated DP value in the solution of the regenerated cellulose.
Then the DP values of cellulose samples regenerated from the corresponding THDS solutions were investigated, as shown in Table 6, and [η]s and DPs measured by the THDS method of the original (C6 and C7) and the regenerated cellulose (RC6 and RC7) in their THDS solutions. There were 16% and 14% variance in the [η]s (([η]Cn − [η]RCn)/[η]Cn) and variance in the DPs ((DPCn − DPRCn)/DPCn) between the original and the regenerated cellulose, respectively.

4. Conclusions

This work reports a convenient and reliable method for determining the molecular weight of cellulose via the intrinsic viscosity, and discloses the cellulose dispersed in THDS at a molecular level by AFM and DLS characterization. The relationship between the intrinsic viscosity and DP of cellulose was determined as [ η ] = 0.24 × DP 1.21 in the dilute THDS solution. The α value of 1.21 in the Mark–Houwink equation also proved the molecular chains stretched well in the THDS solvent. The reliability of the equation was verified by comparing the cellulose DP values tested by this method with those obtained by the Cuoxam method, the CED method, and the GPC method, separately. What is more, the structure analysis proved that cellulose was dissolved in the THDS solvent at the molecular level without derivatization, and was transferred into cellulose II from original cellulose I after regeneration. Furthermore, we found that the TBAH/DMSO aqueous solution provided a beneficial medium for the homogeneous acetylation of cellulose. The controllable acetylation of cellulose in such medium is still under study.

Supplementary Materials

The following are available online at https://www.mdpi.com/2073-4360/11/10/1605/s1, Video S1: Rapid dissolution of cellulose, Figure S1 Photograph of cellulose/CED solution (left), cellulose/Cuoxam solution (middle) and cellulose/THDS solution (right), Table S1: Parameters for the Mark–Houwink equation of cellulose dissolved in various solvents, Figure S2: Comparison of the α values in the Mark–Houwink equation of different cellulose solvents, Figure S3: FT-IR spectra of samples (cellulose C4 and cellulose acetate samples CA1–CA5), Figure S4: 1H NMR spectra of cellulose acetate samples CA1–CA5 in DMSO-d6 recorded.

Author Contributions

Conceptualization, M.J., D.B. and Z.Z.; funding acquisition, M.J. and Z.Z.; experiment research and data curation, D.B.; data analysis, D.B., M.J. and W.W.; writing and revising, D.B., M.J. and A.Z. X.H., Z.Y., X.Y. help the experimental work.

Funding

This research was funded by National Natural Science Foundation of China (NSFC, Grant No. 51303151), International Cooperation Project of Sichuan Province (No. 2018HH0087), Sichuan Province Youth Science and Technology Innovation Team (Grant No. 2016TD0026), and Sichuan Major Science and Technology Project (No. 2019ZDZX0018).

Acknowledgments

We acknowledge the financial support from the National Natural Science Foundation of China (NSFC, Grant No. 51303151), the International Cooperation Project of Sichuan Province (No. 2018HH0087), the Sichuan Province Youth Science and Technology Innovation Team (Grant No. 2016TD0026), and the Sichuan Major Science and Technology Project (No. 2019ZDZX0018).

Conflicts of Interest

The authors declare no conflicts of interest.

References

  1. Moon, R.J.; Martini, A.; Nairn, J.; Simonsen, J.; Youngblood, J. Cellulose nanomaterials review: Structure, properties and nanocomposites. Chem. Soc. Rev. 2011, 40, 3941–3994. [Google Scholar] [CrossRef] [PubMed]
  2. Alexandridis, P.; Ghasemi, M.; Furlani, E.P.; Tsianou, M. Solvent processing of cellulose for effective bioresource utilization. Curr. Opin. Green Sustain. Chem. 2018, 14, 40–52. [Google Scholar] [CrossRef]
  3. Kostag, M.; Jedvert, K.; Achtel, C.; Heinze, T.; El Seoud, O.A. Recent advances in solvents for the dissolution, shaping and derivatization of cellulose: Quaternary ammonium electrolytes and their solutions in water and molecular solvents. Molecules 2018, 23, 511. [Google Scholar] [CrossRef] [PubMed]
  4. Cao, J.; Wei, W.; Gou, G.; Jiang, M.; Cui, Y.; Zhang, S.; Wang, Y.; Zhou, Z. Cellulose films from the aqueous DMSO/TBAH-system. Cellulose 2018, 25, 1975–1986. [Google Scholar] [CrossRef]
  5. Duan, Y.; Freyburger, A.; Kunz, W.; Zollfrank, C. Cellulose and chitin composite materials from an ionic liquid and a green co-solvent. Carbohydr. Polym. 2018, 192, 159–165. [Google Scholar] [CrossRef] [PubMed]
  6. Mehrabi, F.; Shamspur, T.; Mostafavi, A.; Saljooqi, A.; Fathirad, F. Synthesis of cellulose acetate nanofibers and its application in the release of some drugs. Nanomed. Res. J. 2017, 2, 199–207. [Google Scholar]
  7. Mo, J.H.; Kim, J.Y.; Kang, Y.H.; Cho, S.Y.; Jang, K.S. Carbon Nanotube/Cellulose Acetate Thermoelectric Papers. ACS Sustain. Chem. Eng. 2018, 6, 15970–15975. [Google Scholar] [CrossRef]
  8. Zhou, R.; Li, J.; Jiang, H.; Li, H.; Wang, Y.; Briand, D.; Camara, M.; Zhou, G.; de Rooij, N.F. Highly transparent humidity sensor with thin cellulose acetate butyrate and hydrophobic AF1600X vapor permeating layers fabricated by screen printing. Sens. Actuators B 2019, 281, 212–220. [Google Scholar] [CrossRef]
  9. Liu, J.; Zhang, J.; Zhang, B.; Zhang, X.; Xu, L.; Zhang, J.; He, J.; Liu, C.Y. Determination of intrinsic viscosity-molecular weight relationship for cellulose in BmimAc/DMSO solutions. Cellulose 2016, 23, 2341–2348. [Google Scholar] [CrossRef]
  10. El Nemr, A.; Ragab, S.; El Sikaily, A. Testing zinc chloride as a new catalyst for direct synthesis of cellulose di- and tri-acetate in a solvent free system under microwave irradiation. Carbohydr. Polym. 2016, 151, 1058–1067. [Google Scholar] [CrossRef]
  11. Cao, L.; Luo, G.; Tsang, D.C.W.; Chen, H.; Zhang, S.; Chen, J. A novel process for obtaining high quality cellulose acetate from green landscaping waste. J. Clean. Prod. 2018, 176, 338–347. [Google Scholar] [CrossRef]
  12. He, C.; Wang, Q. Viscometric study of cellulose in PF/DMSO solution. J. Macromol. Sci. Part A Pure Appl. Chem. 1999, 36, 105–114. [Google Scholar] [CrossRef]
  13. Gubitosi, M.; Duarte, H.; Gentile, L.; Olsson, U.; Medronho, B. On cellulose dissolution and aggregation in aqueous tetrabutylammonium hydroxide. Biomacromolecules 2016, 17, 2873–2881. [Google Scholar] [CrossRef] [PubMed]
  14. O’sullvian, A.C. Cellulose: The structure slowly unravels. Cellulose 1997, 4, 173–207. [Google Scholar] [CrossRef]
  15. Klemm, D.; Heublein, B.; Fink, H.P.; Bohn, A. Cellulose: Fascinating biopolymer and sustainable raw material. Angew. Chem. Int. Ed. 2005, 44, 3358–3393. [Google Scholar] [CrossRef]
  16. Pinkert, A.; Marsh, K.N.; Pang, S.; Staiger, M.P. Ionic Liquids and Their Interaction with Cellulose. Chem. Rev. 2009, 109, 6712–6728. [Google Scholar] [CrossRef]
  17. Wang, H.; Gurau, G.; Rogers, R.D. Ionic liquid processing of cellulose. Chem. Soc. Rev. 2012, 41, 1519–1537. [Google Scholar] [CrossRef]
  18. Lindman, B.; Karlström, G.; Stigsson, L. On the mechanism of dissolution of cellulose. J. Mol. Liq. 2010, 156, 76–81. [Google Scholar] [CrossRef]
  19. Glasser, W.G.; Atalla, R.H.; Blackwell, J.; Brown, M.M.; Burchard, W.; French, A.D.; Klemm, D.O.; Nishiyama, Y. About the structure of cellulose: Debating the Lindman hypothesis. Cellulose 2012, 19, 589–598. [Google Scholar] [CrossRef]
  20. Hettrich, K.; Pinnow, M.; Volkert, B.; Passauer, L.; Fischer, S. Novel aspects of nanocellulose. Cellulose 2014, 21, 2479–2488. [Google Scholar] [CrossRef]
  21. Rosenau, T.; Potthast, A.; Sixta, H.; Kosma, P. The chemistry of side reactions and byproduct formation in the system NMMO/cellulose (Lyocell process). Prog. Polym. Sci. 2001, 26, 1763–1837. [Google Scholar] [CrossRef]
  22. Rosenau, T.; Potthast, A.; Adorjan, I.; Hofinger, A.; Sixta, H.; Firgo, H.; Kosma, P. Cellulose solutions in N-methylmorpholine-N-oxide (NMMO)—degradation processes and stabilizers. Cellulose 2002, 9, 283–291. [Google Scholar] [CrossRef]
  23. Dogan, H.; Hilmioglu, N.D. Dissolution of cellulose with NMMO by microwave heating. Carbohydr. Polym. 2009, 75, 90–94. [Google Scholar] [CrossRef]
  24. Eckelt, J.; Eich, T.; Röder, T.; Rüf, H.; Sixta, H.; Wolf, B.A. Phase diagram of the ternary system NMMO/water/cellulose. Cellulose 2009, 16, 373–379. [Google Scholar] [CrossRef]
  25. Mccormick, C.L.; Callais, P.A.; Hutchinson, B.H. Solution Studies of Cellulose in Lithium Chloride and N, N-Dimethylacetamide. Macromolecules 1985, 18, 2394–2401. [Google Scholar] [CrossRef]
  26. Dupont, A.L. Cellulose in lithium chloride/N,N-dimethylacetamide, optimisation of a dissolution method using paper substrates and stability of the solutions. Polymer (Guildf.) 2003, 44, 4117–4126. [Google Scholar] [CrossRef]
  27. Cai, J.; Zhang, L. Unique gelation behavior of cellulose in NaOH/urea aqueous solution. Biomacromolecules 2006, 7, 183–189. [Google Scholar] [CrossRef]
  28. Lue, A.; Liu, Y.; Zhang, L.; Potthas, A. Light scattering study on the dynamic behaviour of cellulose inclusion complex in LiOH/urea aqueous solution. Polymer (Guildf.) 2011, 52, 3857–3864. [Google Scholar] [CrossRef]
  29. Alves, L.; Medronho, B.; Antunes, F.E.; Topgaard, D.; Lindman, B. Dissolution state of cellulose in aqueous systems. 1. Alkaline solvents. Cellulose 2016, 23, 247–258. [Google Scholar] [CrossRef]
  30. Zhou, J.; Zhang, L. Solubility of Cellulose in NaOH/Urea Aqueous Solution. Polym. J. 2000, 32, 866–870. [Google Scholar] [CrossRef] [Green Version]
  31. Zhang, L.; Kuga, S.; Cheng, H.; Han, C.C.; Cai, J.; Chen, X.; Chu, B.; Liu, Y.; Xu, J.; Liu, S.; et al. Dynamic Self-Assembly Induced Rapid Dissolution of Cellulose at Low Temperatures. Macromolecules 2008, 41, 9345–9351. [Google Scholar]
  32. Shi, Y.; Kong, R.; Yang, F.; Ren, S.; Xie, J. Participation of sodium sulfamate as hydrogen bond-donating and hydrogen bond-accepting additive in the dissolution of cellulose in NaOH aqueous solution. Cellulose 2018, 25, 2785–2794. [Google Scholar] [CrossRef]
  33. Zhou, J.; Zhang, L.; Cai, J. Behavior of Cellulose in NaOH/Urea Aqueous Solution Characterized by Light Scattering and Viscometry. J. Polym. Sci. Part. B Polym. Phys. 2004, 42, 347–353. [Google Scholar] [CrossRef]
  34. Sánchez, P.B.; González, B.; Salgado, J.; Pádua, A.A.H.; García, J. Cosolvent effect on physical properties of 1,3-dimethyl imidazolium dimethyl phosphate and some theoretical insights on cellulose dissolution. J. Mol. Liq. 2018, 265, 114–120. [Google Scholar] [CrossRef]
  35. Satria, H.; Kuroda, K.; Tsuge, Y.; Ninomiya, K.; Takahashi, K. Dimethyl sulfoxide enhances both the cellulose dissolution ability and biocompatibility of a carboxylate-type liquid zwitterion. New J. Chem. 2018, 42, 13225–13228. [Google Scholar] [CrossRef]
  36. Tenhunen, T.M.; Lewandowska, A.E.; Orelma, H.; Johansson, L.S.; Virtanen, T.; Harlin, A.; Österberg, M.; Eichhorn, S.J.; Tammelin, T. Understanding the interactions of cellulose fibres and deep eutectic solvent of choline chloride and urea. Cellulose 2018, 25, 137–150. [Google Scholar] [CrossRef]
  37. Zhang, L.; Ruan, D.; Zhou, J. Structure and properties of regenerated cellulose films prepared from cotton linters in NaOH/urea aqueous solution. Ind. Eng. Chem. Res. 2001, 40, 5923–5928. [Google Scholar] [CrossRef]
  38. Lu, A.; Liu, Y.; Zhang, L.; Potthast, A. Investigation on metastable solution of cellulose dissolved in NaOH/urea aqueous system at low temperature. J. Phys. Chem. B 2011, 115, 12801–12808. [Google Scholar] [CrossRef]
  39. Östlund, Å.; Lundberg, D.; Nordstierna, L.; Holmberg, K.; Nydén, M. Dissolution and Gelation of Cellulose in TBAF/DMSO Solutions. Biomacromolecules 2009, 10, 2401–2407. [Google Scholar] [CrossRef]
  40. Rinaldi, R. Instantaneous dissolution of cellulose in organic electrolyte solutions. Chem. Commun. 2011, 47, 511–513. [Google Scholar] [CrossRef]
  41. Chen, X.; Chen, X.; Cai, X.M.; Huang, S.; Wang, F. Cellulose Dissolution in a Mixed Solvent of Tetra(n-butyl)ammonium Hydroxide/Dimethyl Sulfoxide via Radical Reactions. ACS Sustain. Chem. Eng. 2018, 6, 2898–2904. [Google Scholar] [CrossRef]
  42. Abe, M.; Fukaya, Y.; Ohno, H. Fast and facile dissolution of cellulose with tetrabutylphosphonium hydroxide containing 40 wt % water. Chem. Commun. 2012, 48, 1808–1810. [Google Scholar] [CrossRef] [PubMed]
  43. Wei, W.; Meng, F.; Cui, Y.; Jiang, M.; Zhou, Z. Room temperature dissolution of cellulose in tetra-butylammonium hydroxide aqueous solvent through adjustment of solvent amphiphilicity. Cellulose 2017, 24, 49–59. [Google Scholar] [CrossRef]
  44. Mu, C.; Jiang, M.; Zhu, J.; Zhao, M.; Zhu, S.; Zhou, Z. Isolation of cellulose from steam-exploded rice straw with aniline catalyzing dimethyl formamide aqueous solution. Renew. Energy 2014, 63, 324–329. [Google Scholar] [CrossRef]
  45. Ass, B.A.P.; Frollini, E.; Heinze, T. Studies on the homogeneous acetylation of cellulose in the novel solvent dimethyl sulfoxide/tetrabutylammonium fluoride trihydrate. Macromol. Biosci. 2004, 4, 1008–1013. [Google Scholar] [CrossRef]
  46. Hussain, M.A.; Liebert, T.; Heinze, T. Acylation of cellulose with N,N′-carbonyldiimidazole-activated acids in the novel solvent dimethyl sulfoxide/tetrabutylammomnium fluoride. Macromol. Rapid Commun. 2004, 25, 916–920. [Google Scholar] [CrossRef]
  47. Argyropoulos, D.S.; Kilpelainen, I.; Granstrom, M.; King, A.; Xie, H. Thorough Chemical Modification of Wood-Based Lignocellulosic Materials in Ionic Liquids. Biomacromolecules 2007, 8, 3740–3748. [Google Scholar]
  48. Zhang, J.; Wu, J.; Cao, Y.; Sang, S.; Zhang, J.; He, J. Synthesis of cellulose benzoates under homogeneous conditions in an ionic liquid. Cellulose 2009, 16, 299–308. [Google Scholar] [CrossRef]
  49. Abe, M.; Sugimura, K.; Nishiyama, Y.; Nishio, Y. Rapid Benzylation of Cellulose in Tetra-n-butylphosphonium Hydroxide Aqueous Solution at Room Temperature. ACS Sustain. Chem. Eng. 2017, 5, 4505–4510. [Google Scholar] [CrossRef]
  50. Kasaai, M.R. Comparison of various solvents for determination of intrinsic viscosity and viscometric constants for cellulose. J. Appl. Polym. Sci. 2002, 86, 2189–2193. [Google Scholar] [CrossRef]
  51. Valtasaari, L.E.A. The Configuration of Cellulose Dissolved in Iron-sodiumtartrate. Macromol. Chem. Phys. 1971, 150, 117–126. [Google Scholar] [CrossRef]
  52. Kamide, K.; Saito, M. Light Scattering and Viscometric Study of Cellulose in Aqueous Lithium Hydroxide. Polym. J. 2006, 18, 569–579. [Google Scholar] [CrossRef]
  53. Hubbe, M.A.; Tayeb, P.; Joyce, M.; Tyagi, P.; Kehoe, M.; Dimic-Misic, K.; Pal, L. Rheology of nanocellulose-rich aqueous suspensions: A review. BioResources 2017, 12, 9556–9661. [Google Scholar]
  54. Wan, Z.; Li, L.; Cui, S. Capturing the portrait of isolated individual natural cellulose molecules. Biopolymers 2008, 89, 1170–1173. [Google Scholar] [CrossRef]
  55. Yokota, S.; Ueno, T.; Kitaoka, T.; Wariishi, H. Molecular imaging of single cellulose chains aligned on a highly oriented pyrolytic graphite surface. Carbohydr. Res. 2007, 342, 2593–2598. [Google Scholar] [CrossRef]
  56. El Nemr, A.; Ragab, S.; El Sikaily, A.; Khaled, A. Synthesis of cellulose triacetate from cotton cellulose by using NIS as a catalyst under mild reaction conditions. Carbohydr. Polym. 2015, 130, 41–48. [Google Scholar] [CrossRef]
  57. Kono, H.; Hashimoto, H.; Shimizu, Y. NMR characterization of cellulose acetate: Chemical shift assignments, substituent effects, and chemical shift additivity. Carbohydr. Polym. 2015, 118, 91–100. [Google Scholar] [CrossRef]
  58. Meehan, E. Characterisation of hydroxypropylmethylcellulose phthalate (HPMCP) by GPC using a modified organic solvent. Anal. Chim. Acta 2006, 557, 2–6. [Google Scholar] [CrossRef]
  59. Nelson, M.L.; O’Connor, R.T. Relation of certain infrared bands to cellulose crystallinity and crystal latticed type. Part, I. Spectra of lattice types I, II, III and of amorphous cellulose. J. Appl. Polym. Sci. 1964, 8, 1311–1324. [Google Scholar] [CrossRef]
  60. Colom, X.; Carrillo, F. Crystallinity changes in lyocell and viscose-type fibres by caustic treatment. Eur. Polym. J. 2002, 38, 2225–2230. [Google Scholar] [CrossRef]
  61. Atalla, R.H.; Gast, J.C.; Sindorf, D.W.; Bartuska, V.J.; Maciel, G.E. 13C NMR Spectra of Cellulose Polymorphs. J. Am. Chem. Soc. 1980, 102, 3249–3251. [Google Scholar] [CrossRef]
  62. Earl, W.L.; VanderHart, D.L. High Resolution, Magic Angle Sample Spinning 13C NMR of Solid Cellulose I. J. Am. Chem. Soc. 1980, 102, 3251–3252. [Google Scholar] [CrossRef]
  63. Earl, W.L.; VanderHart, D.L. Observations by High-Resolution Carbon-13 Nuclear Magnetic Resonance of Cellulose I Related to Morphology and Crystal Structure. Macromolecules 1981, 14, 570–574. [Google Scholar] [CrossRef]
  64. Atalla, R.H.; VanderHart, D.L. Native cellulose: A composite of two distinct crystalline forms. Science 1984, 223, 283–285. [Google Scholar] [CrossRef] [PubMed]
  65. Horii, F.; Hirai, A.; Kitamaru, R. CP/MAS carbon-13 NMR study of spin relaxation phenomena of cellulose containing crystalline and noncrystalline components. J. Carbohydr. Chem. 1984, 3, 641–662. [Google Scholar] [CrossRef]
  66. Bertran, M.S.; Dale, B.E. Enzymatic hydrolysis and recrystallization behavior of initially amorphous cellulose. Biotechnol. Bioeng. 1985, 27, 177–181. [Google Scholar] [CrossRef] [PubMed]
  67. HORII, F.; HIRAI, A.; KITAMARU, R. Cross-polarization/magic angle spinning 13C-NMR study: Molecular chain conformations of native and regenerated cellulose. ACS Symp. Ser. 1984, 260, 27–42. [Google Scholar]
  68. Gubitosi, M.; Nosrati, P.; Hamid, M.K.; Kuczera, S.; Behrens, M.A.; Johansson, E.G.; Olsson, U. Stable, metastable and unstable cellulose solutions. R. Soc. Open Sci. 2017, 4, 1–11. [Google Scholar] [CrossRef]
Figure 1. Condensed viscosity (ηsp/c) and concentration of five cellulose samples in the THDS.
Polymers 11 01605 g001
Figure 2. The relationship between the [η] and the DPC of cellulose.
Polymers 11 01605 g002
Figure 3. The dissolved state of cellulose in THDS solution: (a) DLS profiles of the cellulose (C1) solution in THDS with concentration of 0.5 × 10⁻⁴ g/mL, at 25 °C; (b) AFM image of the dilute cellulose solution in THDS observed on an amino silicon wafer adsorption.
Polymers 11 01605 g003
Figure 4. The GPC curves of the derived cellulose samples of CA1–CA5.
Polymers 11 01605 g004
Figure 5. The structure analysis of cellulose samples (cellulose before and after regeneration) in THDS: (a) The FT-IR spectra of cellulose samples; (b) the XRD spectra of cellulose samples; (c) the solid-state 13C NMR spectra of cellulose samples: cr corresponding to the crystalline signal; am corresponding to amorphous signal; I corresponding to cellulose I crystal form; II corresponding to cellulose II crystal form.
Polymers 11 01605 g005
Table 1. Preparation of cellulose/THDS aqueous solutions by dilution method.
Concentration (wt %)Mother Liquor (mL)TBAH (50% w/w, mL)DMSO (mL)
0.0565.3418.66
0.10124.0014.00
0.15182.679.33
0.20241.344.66
Table 2. The intrinsic viscosity ([η]) and the K1 values of cellulose solution in THDS at 25 °C.
ParametersSamples
C1C2C3C4C5C6C7
[η] (mL/g)152.8310.6538.8564.5738.6550.6693.4
K10.20.30.30.40.50.20.4
Table 3. Comparison of the intrinsic viscosity the cellulose solutions.
Intrinsic Viscosity (mL/g) *Sample
C1C2C3C4C5
[η]Cuoxam29.568.1137.2277.4279.9
[η]CED-281.6335.8419.9458.1
[η]THDS152.8310.6538.8564.5738.6
* The intrinsic viscosities of the samples in the three solvents are presented as [η]Cuoxam, [η]CED, and [η]THDS, respectively.
Table 4. The DP values of cellulose samples C1–C7 determined by different methods.
DPSample
C1C2C3C4C5C6C7
DPC200405557655682486600
DPCED2755637139581073--
DPGPC a232556731983---
DPTHDS-----616752
(DPCED-DPC)/DPCED (%)2728213136--
(DPGPC-DPC)/DPGPC (%)13272333---
(DPTHDS-DPC)/DPTHDS (%)-----2122
a The DPGPC values were calculated from the corresponding Mw.
Table 5. The molecular weight and the distribution of cellulose acetate samples of CA1–CA5 tested by the GPC method.
SamplesMolecular Weight
MnMwMzMηMpMw/Mn
CA1117844789825293247898155274.1
CA2324111110161039096111016457533.4
CA349199165543980068165543578393.4
CA4291472004204247791200420444734.9
CA5756643733744805672373374986796.9
Table 6. Comparison of the intrinsic viscosity and DP between the original cellulose solution and cellulose solution after regeneration.
SampleParameter
[η] (mL/g)([η]Cn − [η]RCn)/[η]Cn (%)DP(DPCn − DPRCn)/DPCn (%)
C6550.61661614
RC6459.8528
C7693.41675214
RC7579.9644

