Article

Highly Deformable Porous Electromagnetic Wave Absorber Based on Ethylene–Propylene–Diene Monomer/Multiwall Carbon Nanotube Nanocomposites

by
Hasti Bizhani
1,
Ali Asghar Katbab
1,*,
Emil Lopez-Hernandez
2,
Jose Miguel Miranda
3 and
Raquel Verdejo
2,*
1
Department of Polymer and Color Engineering, Amirkabir University of Technology, Hafez Ave., Tehran 1591634311, Iran
2
Institute of Polymer Science and Technology (ICTP-CSIC), C/ Juan de la Cierva 3, 28006 Madrid, Spain
3
Department of Estructura de la Materia, Facultad de Físicas, Universidad Complutense de Madrid, 28040 Madrid, Spain
*
Authors to whom correspondence should be addressed.
Polymers 2020, 12(4), 858; https://doi.org/10.3390/polym12040858
Submission received: 12 March 2020 / Revised: 2 April 2020 / Accepted: 6 April 2020 / Published: 8 April 2020

Abstract

:
The need for electromagnetic interference (EMI) shields has risen over the years as the result of our digitally and highly connected lifestyle. This work reports on the development of one such shield based on vulcanized rubber foams. Nanocomposites of ethylene–propylene–diene monomer (EPDM) rubber and multiwall carbon nanotubes (MWCNTs) were prepared via hot compression molding using a chemical blowing agent as foaming agent. MWCNTs accelerated the cure and led to high shear-thinning behavior, indicative of the formation of a 3D interconnected physical network. Foamed nanocomposites exhibited lower electrical percolation threshold than their solid counterparts. Above percolation, foamed nanocomposites displayed EMI absorption values of 28–45 dB in the frequency range of the X-band. The total EMI shielding efficiency of the foams was insignificantly affected by repeated bending with high recovery behavior. Our results highlight the potential of cross-linked EPDM/MWCNT foams as a lightweight EM wave absorber with high flexibility and deformability.

Graphical Abstract

1. Introduction

The need for electromagnetic interference (EMI) shields has risen over the years as the result of our digitally and highly connected lifestyle, which will intensify with the advent of 5G and driverless cars, among others. EMI is defined as the adverse effects of electromagnetic emissions, such as auroras and cellular phones, among many others, on the performance of other devices [1,2]._ENREF_1 Hence, over the past five decades, scientists have optimized circuits and designed advanced materials to minimize EMI [3].
Conductive polymer composites, in particular, carbon-based filled systems, have already shown to be a lightweight solution for EM absorbing shields [4]. Among the initial studies, Yang et al. [5] developed polystyrene foams obtaining shielding efficiencies (SE) around 20 dB with 15 wt.% and 7 wt.% carbon nanofibers and nanotubes, respectively. Subsequent works improved the SE or decreased the loading fractions required to achieve commercially attractive EMI shielding materials (around 20 dB in the X-band region (8.2–12.4 GHz)) and mostly looked at thermoplastic or rigid thermoset matrices or coated the foam surfaces with conductive nanofillers [6,7,8,9,10,11,12,13,14,15,16,17,18,19,20]. These previous studies have demonstrated that the development of the cellular structure causes the redistribution of the nanoparticles, decreasing the average gap between the nanoparticles along the cell walls, thus enhancing the electrical conductivity and EMI shielding properties [9,14]. However, repeated loading may reduce the conductivity of these strategies as the coating spalls off the foam surface or point contacts within the rigid polymer loading are lost. Additionally, the scalability of some of the proposed methodologies is also limited. Hence, the use of rubber matrices could potentially reduce these shortcomings. Some studies have also reported adequate EMI shielding features of rubber nanocomposite foams, in particular, natural rubber (NR) filled with multiwall carbon nanotubes (MWCNTs) [21] and silicone rubber filled with MWCNTs/ferriferous oxide (Fe3O4) [22]. Zhan et al. fabricated closed-cell NR nanocomposite foams using supercritical CO2 and observed improved electrical, EMI shielding, and compressive properties [21]. Yang et al. investigated the effect of MWCNTs/Fe3O4 and reported average EM absorptions of up to 64% in the X-band [22].
Hence, the aim of this study was to develop an intrinsically conductive elastomeric foam with appropriate EMI shielding behavior that could withstand repeated bending using a scalable process. To that end, ethylene–propylene–diene monomer (EPDM) rubber, a copolymer of ethylene (45–75%), propylene monomers (13–45%), and nonconjugated dienes (ethylidene norbornene, dicyclopentadiene, and 1,4-hexadiene; 1–11%), was selected for its high hydrophobic characteristics as well as remarkable ozone and light resistivity [23]. These characteristics make EPDM the most commonly used rubber in the automotive and construction industries. In this study, we report on the fabrication of both solid and cellular EPDM/MWCNT nanocomposites by means of an industrial processing technology using an open two-roll mill and compression molding protocols. The materials developed here are highly flexible and deformable and present high EM absorbing characteristics, which are not significantly affected by repeated bending.

2. Experimental

2.1. Materials

EPDM rubber, Keltan 2750 (ethylene content: 48 wt.%; 5-ethylidene-2-norbornene (ENB) content: 7.8 wt.%) with Mooney viscosity of ML (1 + 4) 100 °C = 28, was kindly provided by ARLANXEO (Geleen, Netherlands). Maleic anhydride grafted EPDM (EPDM-g-MA), Royaltuf® 498, with Mooney viscosity of 30 (ML (1 + 4) 100 °C), maleic anhydride content = 0.8–1.2 wt.%, and density = 0.87 g/cm3, was purchased from Crompton—Uniroyal Chemical Co. (Connecticut, USA). 4,4′-Oxy-bis(benzenesulfonyl hydrazide) (OBSH, GENITRON® OB) as an inorganic blowing agent was also provided by Lanxess (Leverkusen, Germany). MWCNTs, NC7000, were purchased from Nanocyl SA (Sambreville, Belgium) (average diameter, length, and surface area of 9.5 nm, 1.5 μm, and 250–300 m2/gr, respectively).

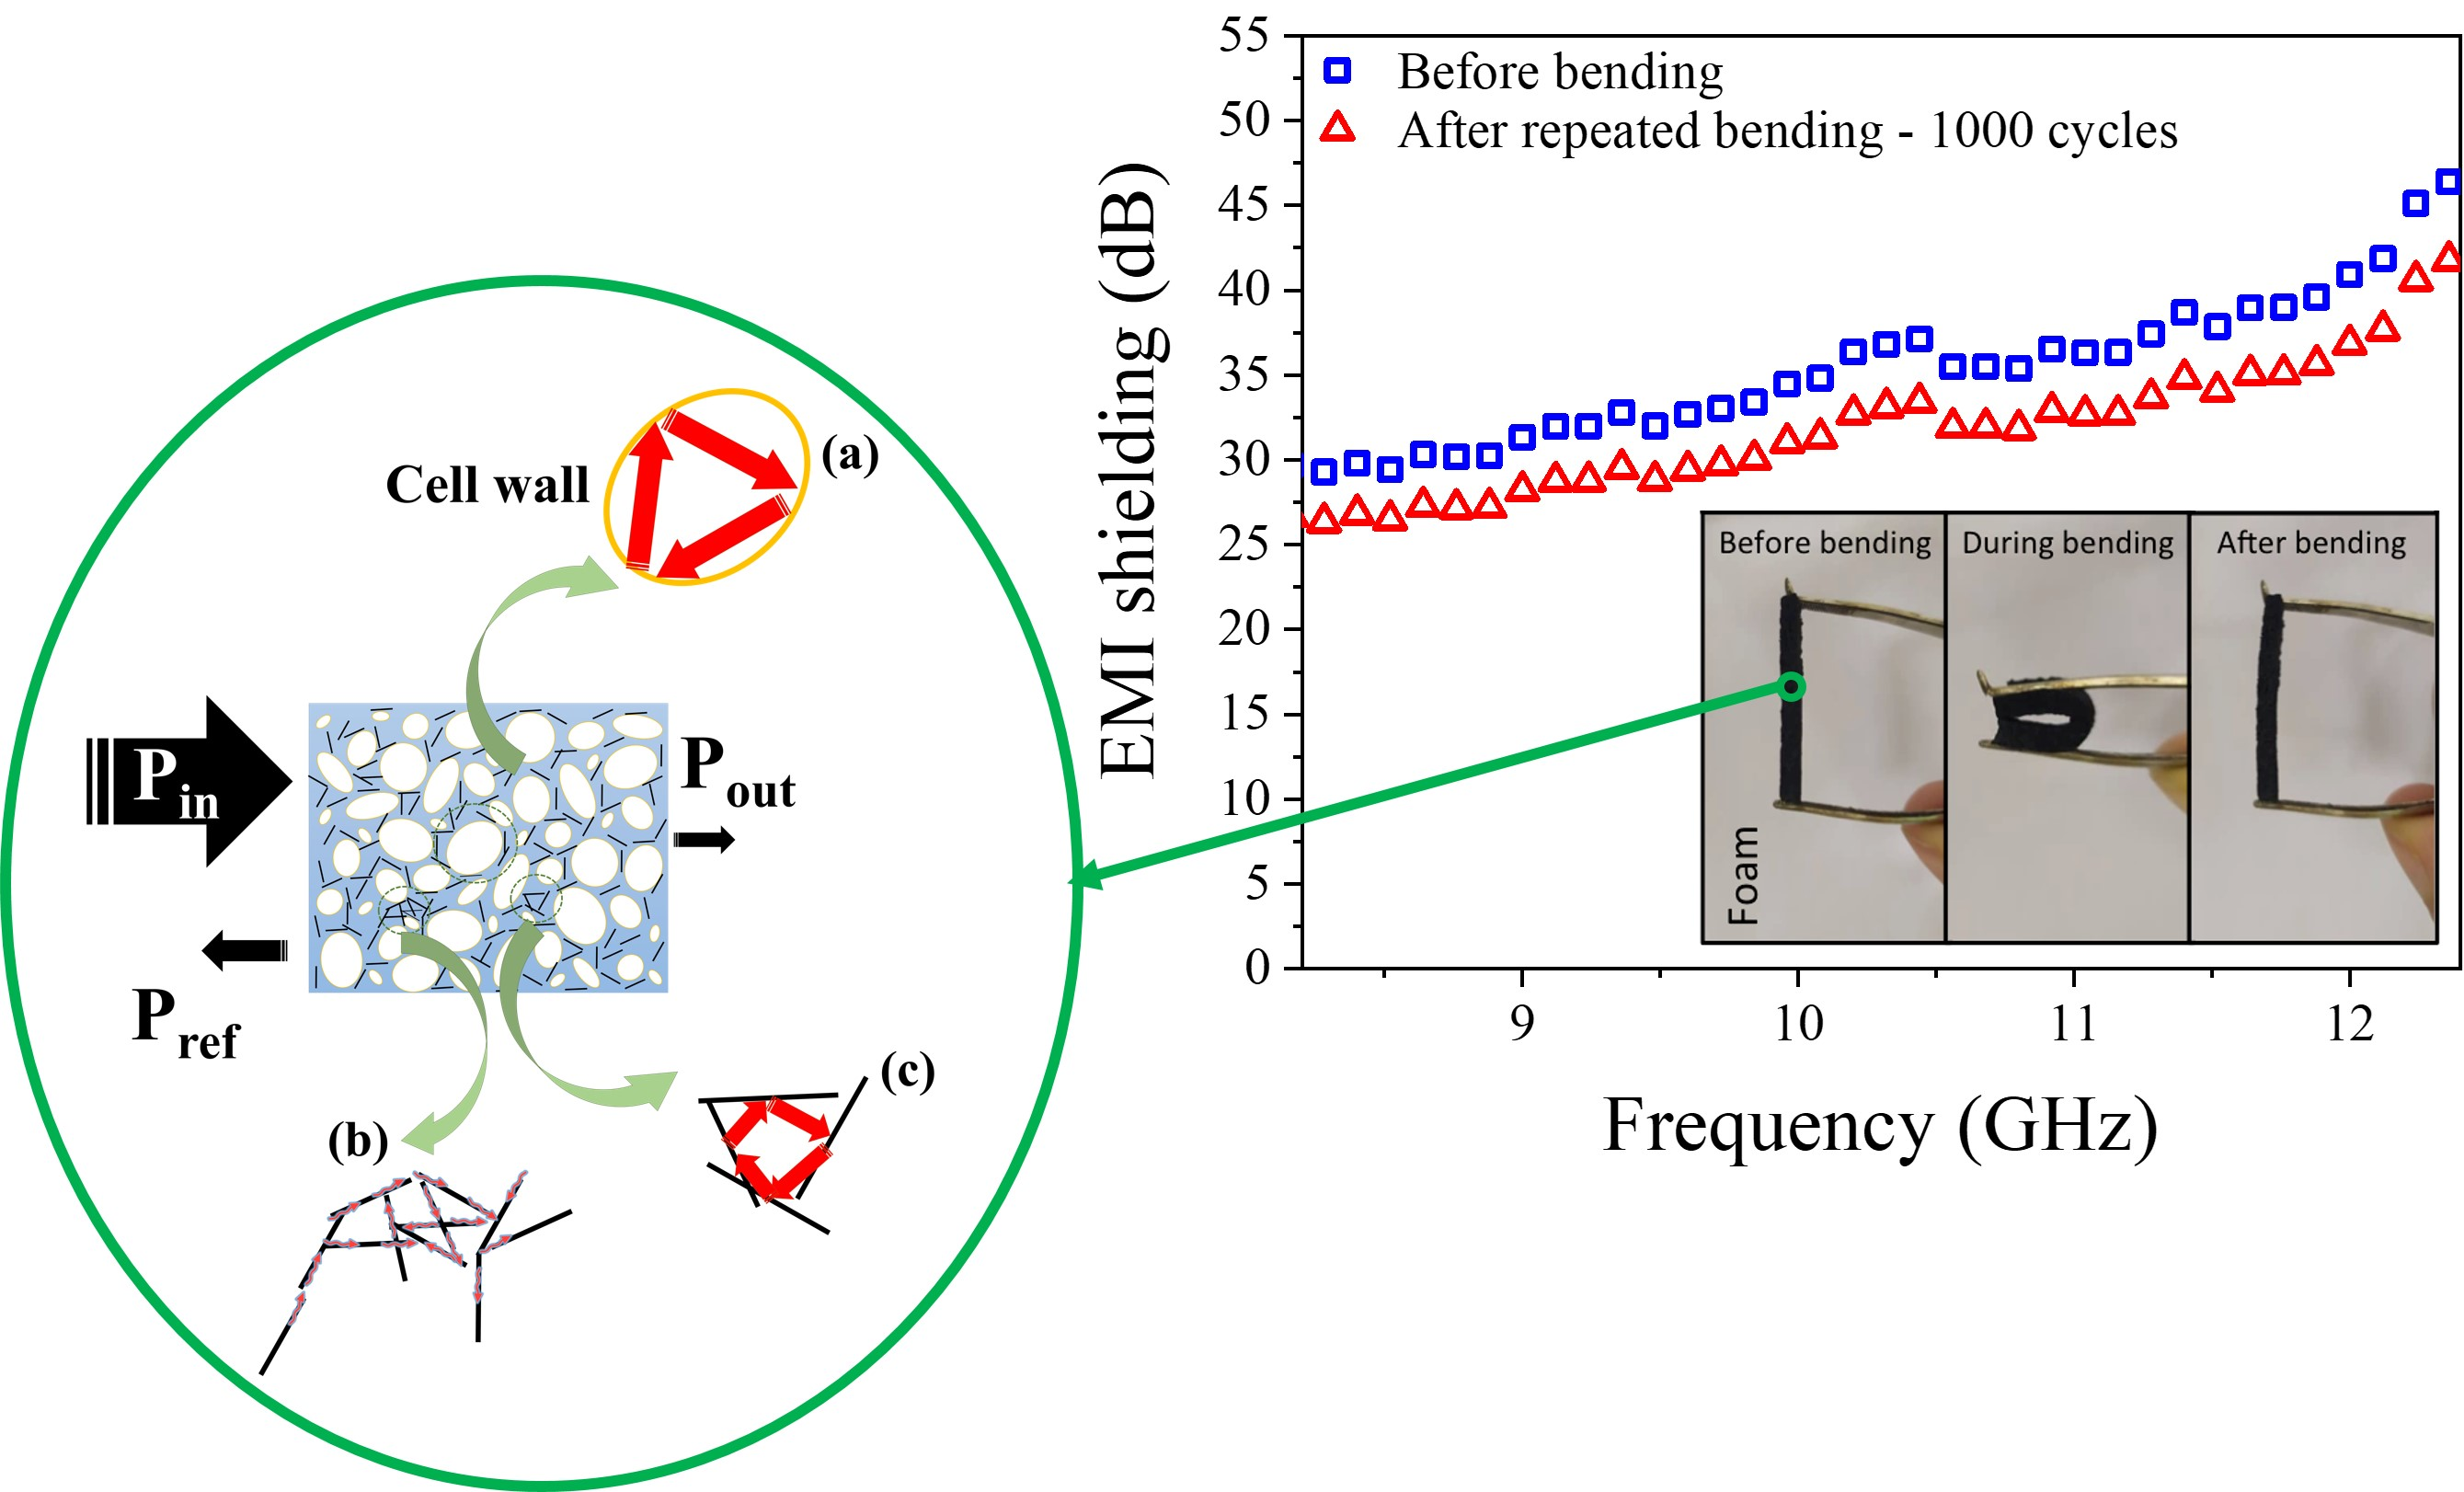
2.2. Compounding and Sample Preparation

All EPDM/MWCNT compounds were prepared according to ASTM D3182 using an open two-roll laboratory mill at 70 °C. EPDM rubber was first masticated and preheated for 5 min and then blended with EPDM-g-MA. Afterwards, dried MWCNTs were incorporated into the rubber band, followed by the sequential addition of the curing ingredients (zinc oxide (ZnO), stearic acid (SA), sulfur (S), and dicumyl peroxide (DCP)) and blowing agent (for foams, OBSH) for 20 min. The optimum rubber recipe (Table 1) was selected after studying the foaming behavior and morphology of a set of samples, varying the OBSH concentration. Milled compounds were left for 24 h and then compression molded using an electrically heated hydraulic press (Gumix) at 160 °C and 200 bars to optimum cure time (t90) of each individual compound. Both crosslinking and foaming occurred simultaneously during molding.

2.3. Characterization

Basic characterization regarding curing, crosslink density, viscoelastic behavior, and thermal degradation of the compounds can be found in the Supplementary Materials.
The density (ρ) was calculated directly from the mass–geometric volume relationship, ρ = m/V. The porosity percentage of foams was also calculated as 100(1 − ρfs), where ρf and ρs denote the density of the foam and solid nanocomposite, respectively.
Cryofractured cross sections of the samples were analyzed by scanning electron microscopy (SEM), Philips ESEM XL30 (Philips, Amsterdam, Netherlands), after being sputter-coated with Au/Pd. SEM images were processed with Digimizer software to calculate the cell density as N = (nM2/A)1.5, where n, M, and A are the cell number, magnification factor, and area, respectively.
Uniaxial tensile tests were carried out at room temperature at a cross-head speed of 200 mm/min using an Instron 3366 universal testing machine (Instron Corp., Norwood, USA) (BS ISO 37). Compressive strength was evaluated on circular specimens, 28.6 ± 0.1 mm in diameter and 12.5 ± 0.5 mm in thickness, following ASTM D575-9, at a cross-head speed of 12 mm/min to 50% of their initial height. Both tensile and compression tests were carried out on a minimum of five specimens of each sample.
Thermal conductivity tests were performed in accordance with ASTM E 1530 using LaserComp FOX 50 (TA Instruments, Wakefield, USA) on cylindrical specimens, 51 mm diameter and 12.5 mm thickness, with an experimental error of less than 5% of the absolute value.
Complex dielectric permittivity (ε* = ε′ − jε′′) measurements were performed using ALPHA high-resolution Novocontrol broadband dielectric spectrometer (Novocontrol, Aachen, Germany) from 0.1 Hz to 10 MHz at room temperature. The samples were fixed in the cell between two parallel gold-plated electrodes (the diameters of upper and lower electrodes were 20 and 30 mm, respectively). The amplitude of the applied AC electric signal was 1 V.
The EMI shielding efficiency and extent of EM wave absorption were analyzed using an Agilent E8364B PNA vector network analyzer (Keysight Technologies Inc., Santa Rosa, USA) within the frequency range of the X-band. The measurements were performed on rectangular samples, 22.9 × 10.2 mm2 and 3 ± 0.2 mm in thickness. The reported values of the dielectric permittivity and EMI SE tests are the averages of five samples for each compound.

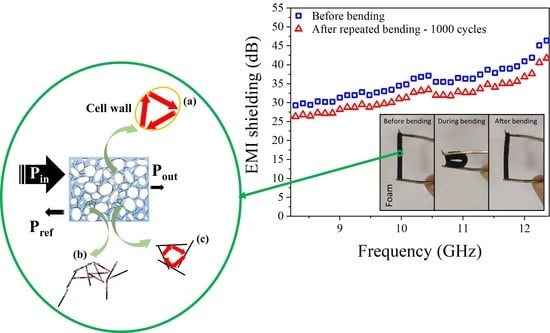
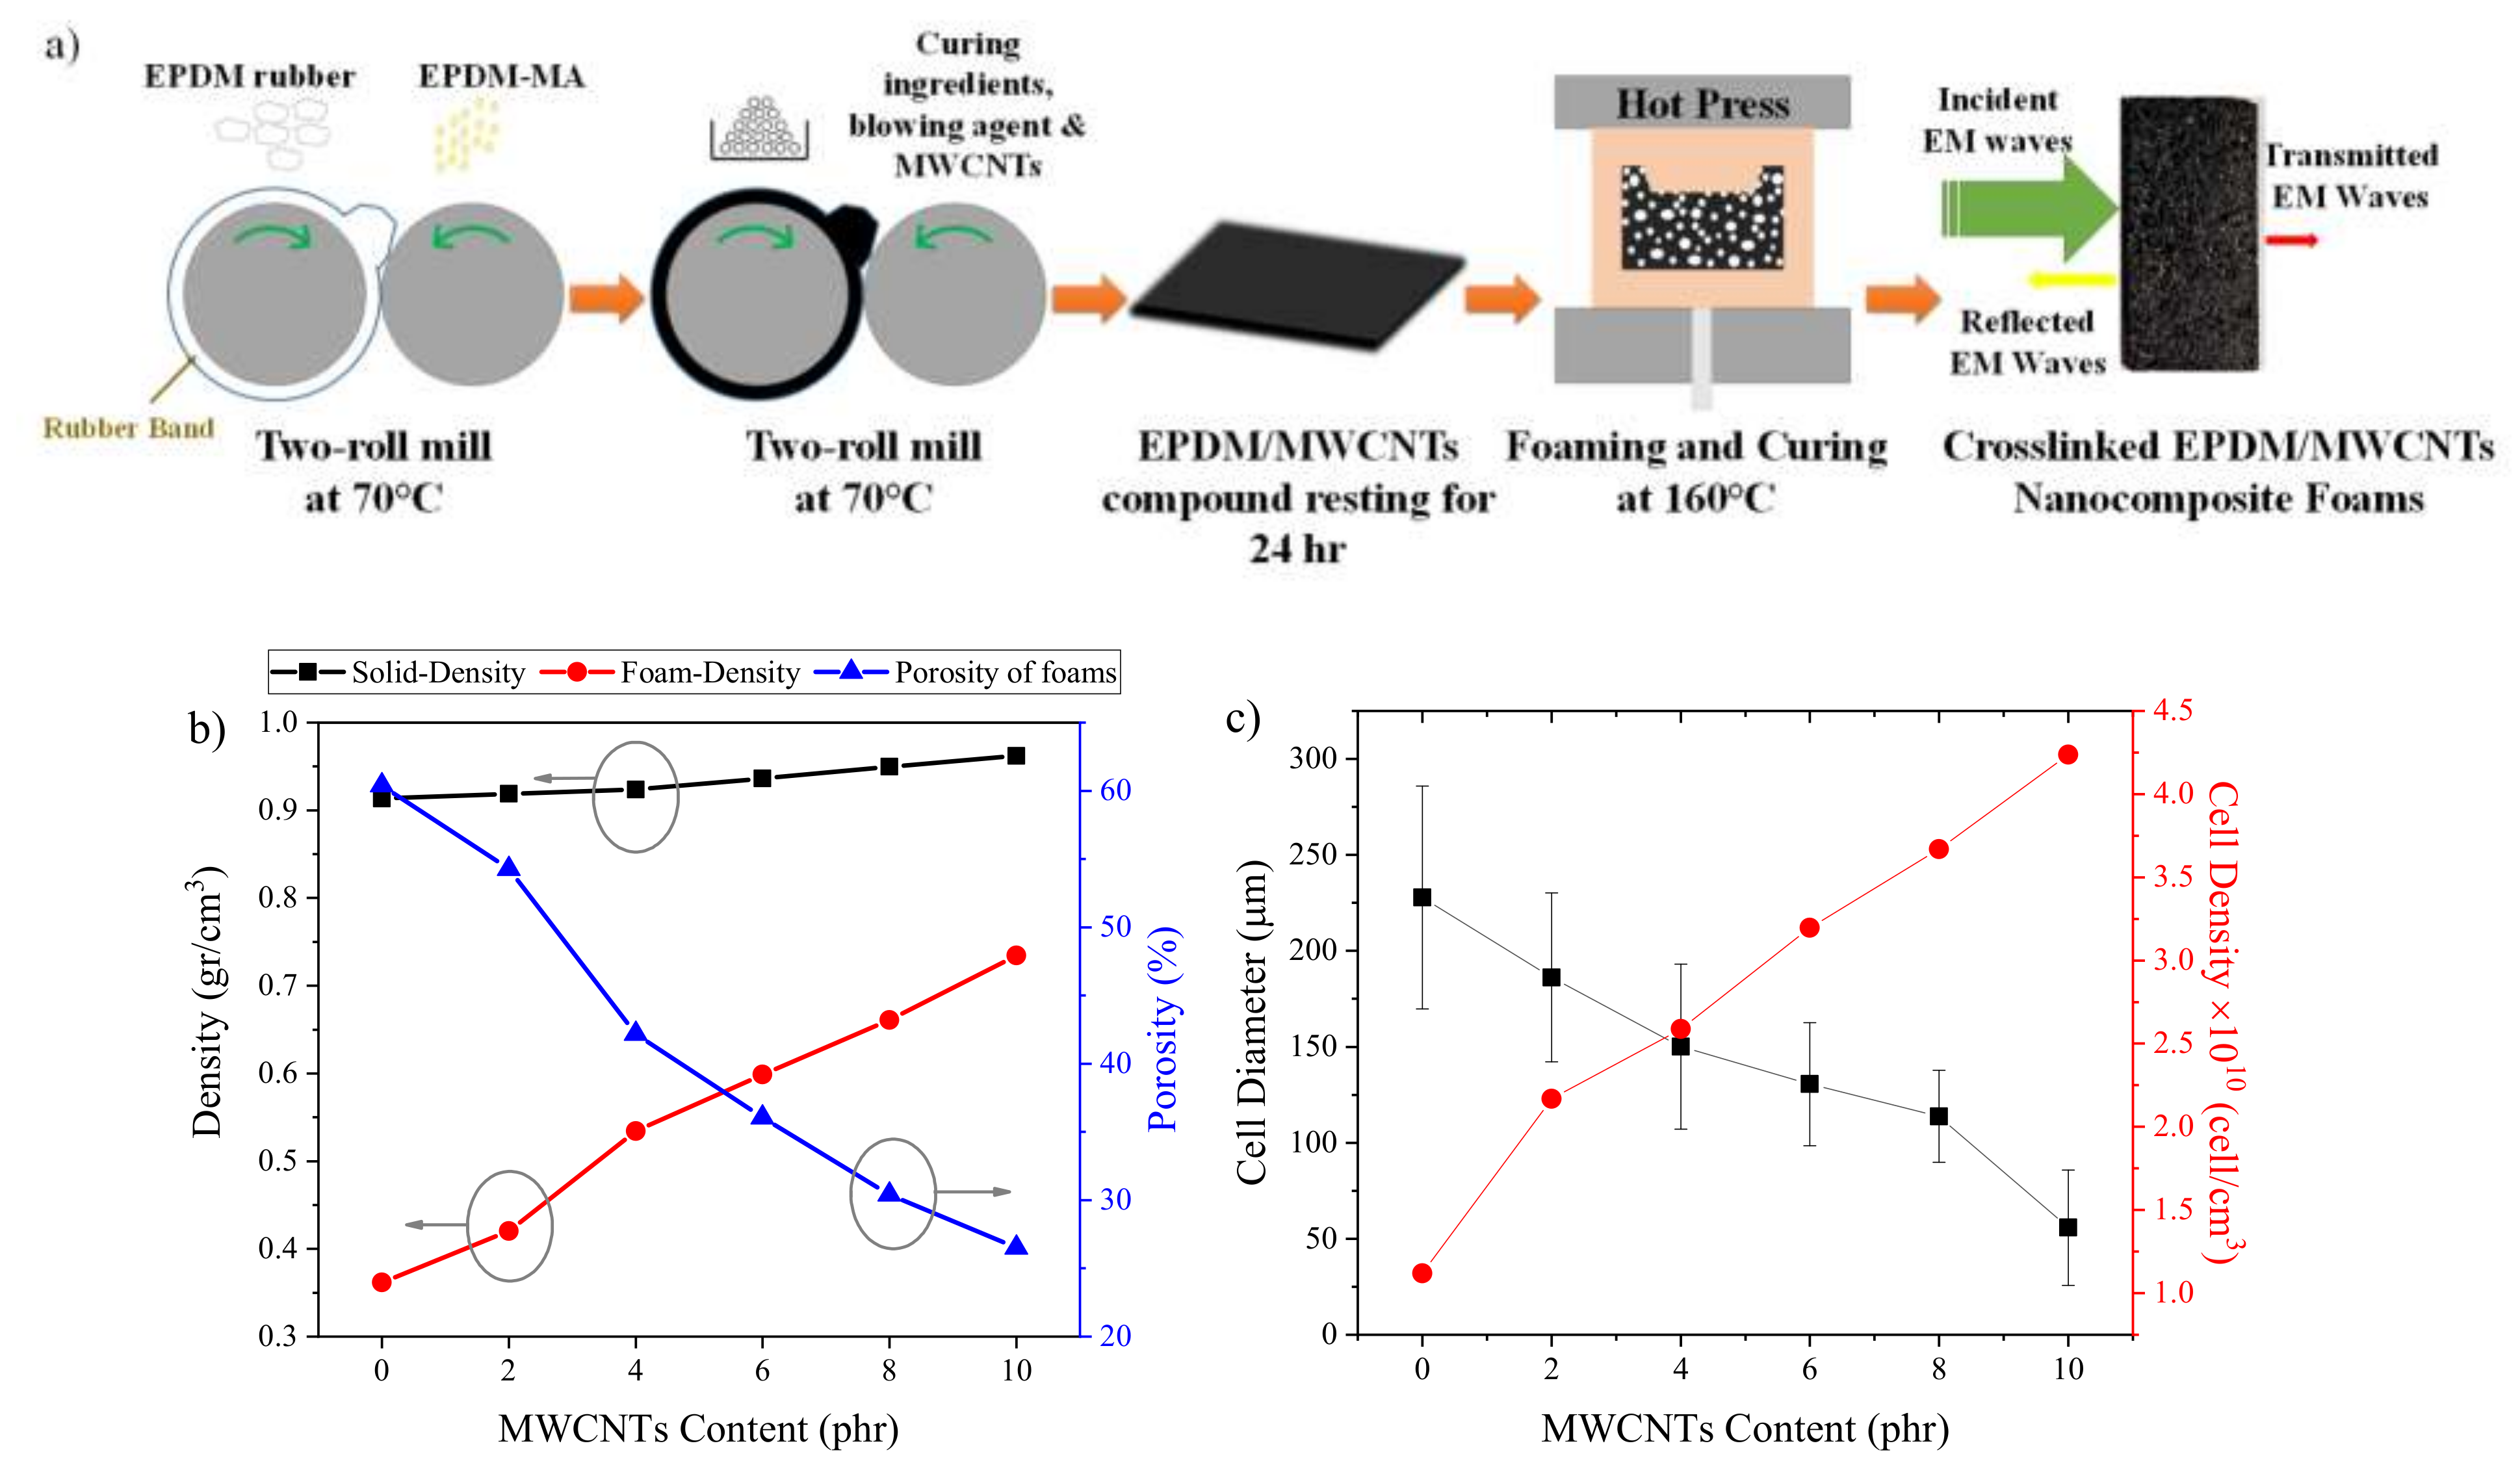
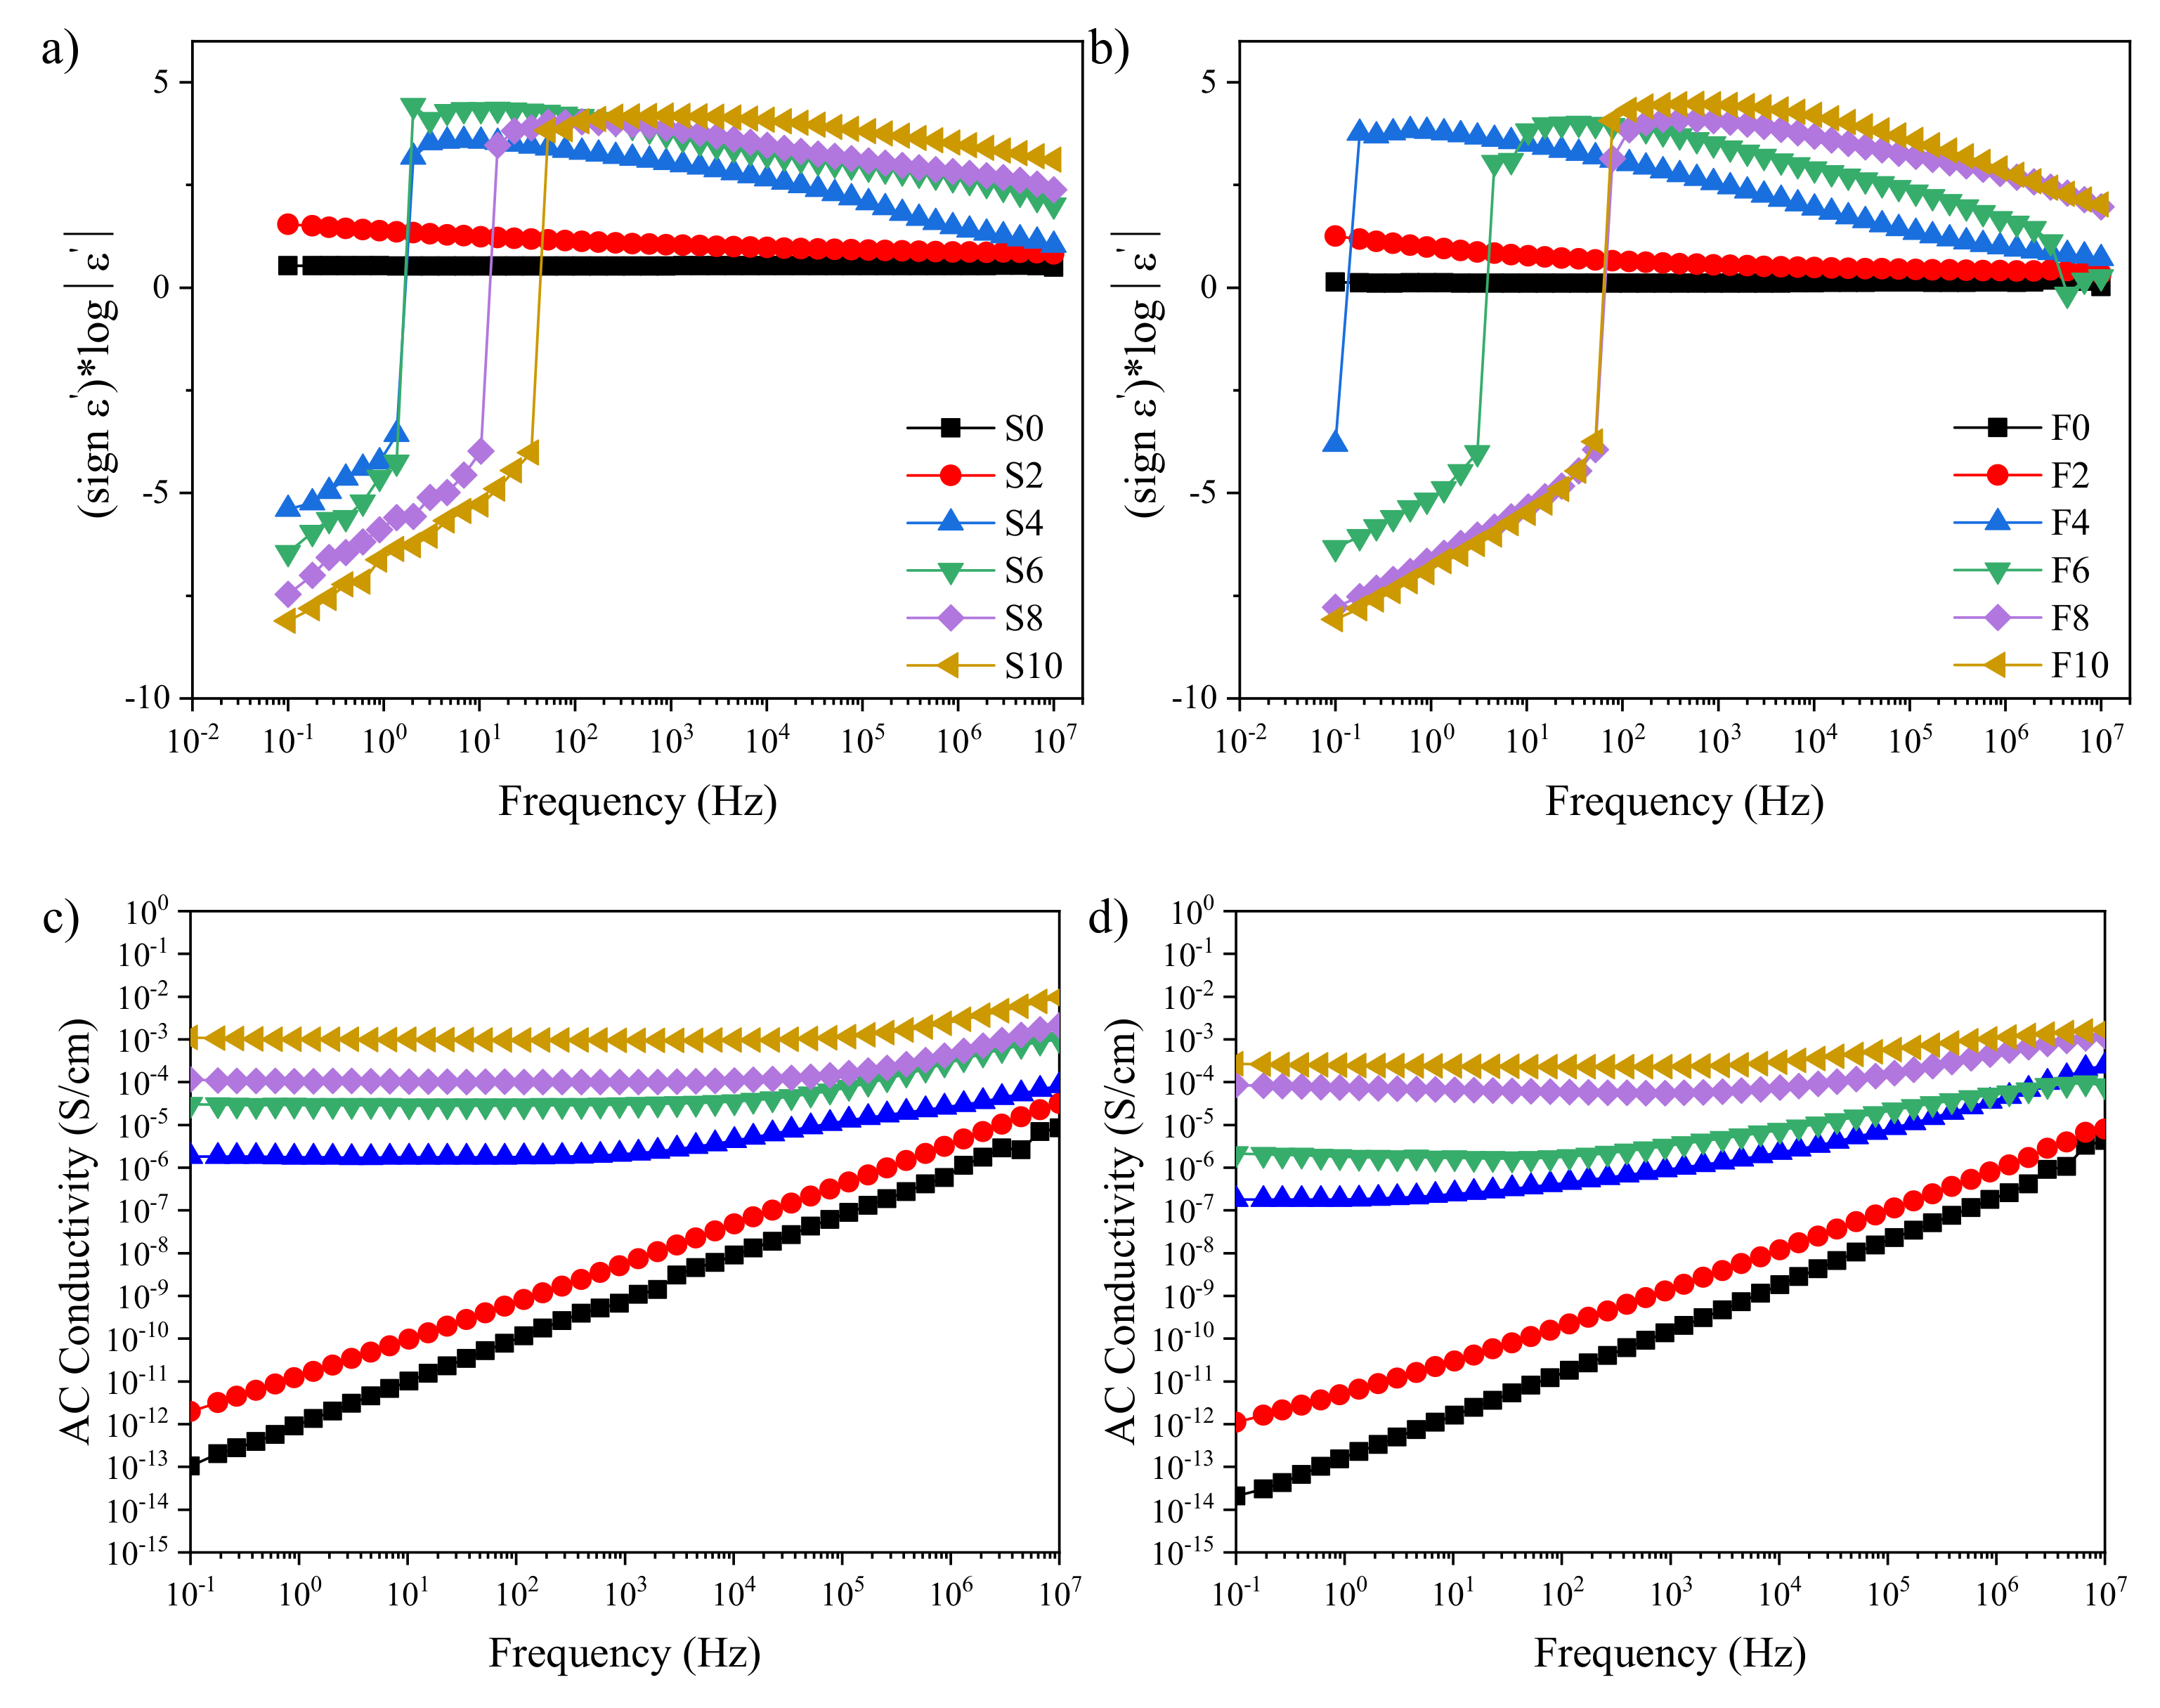
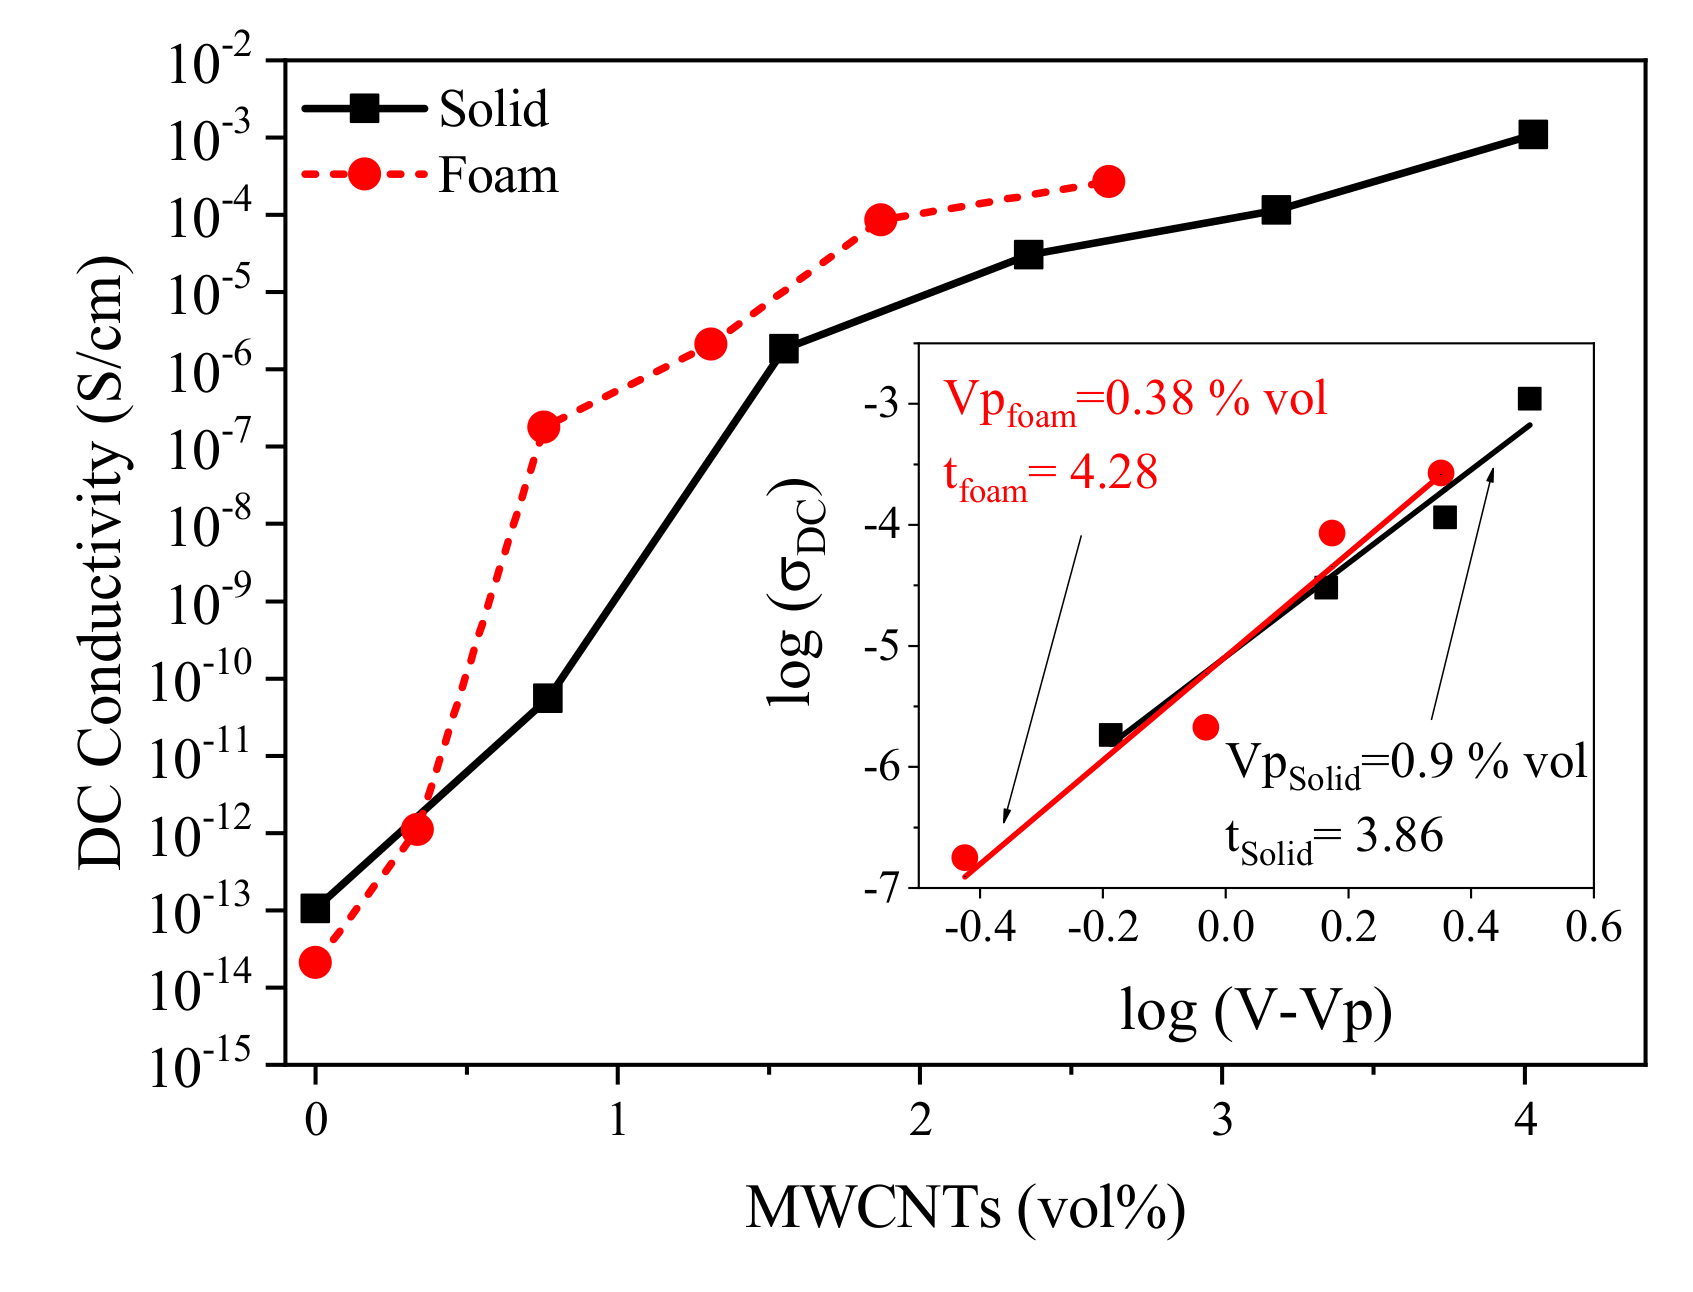
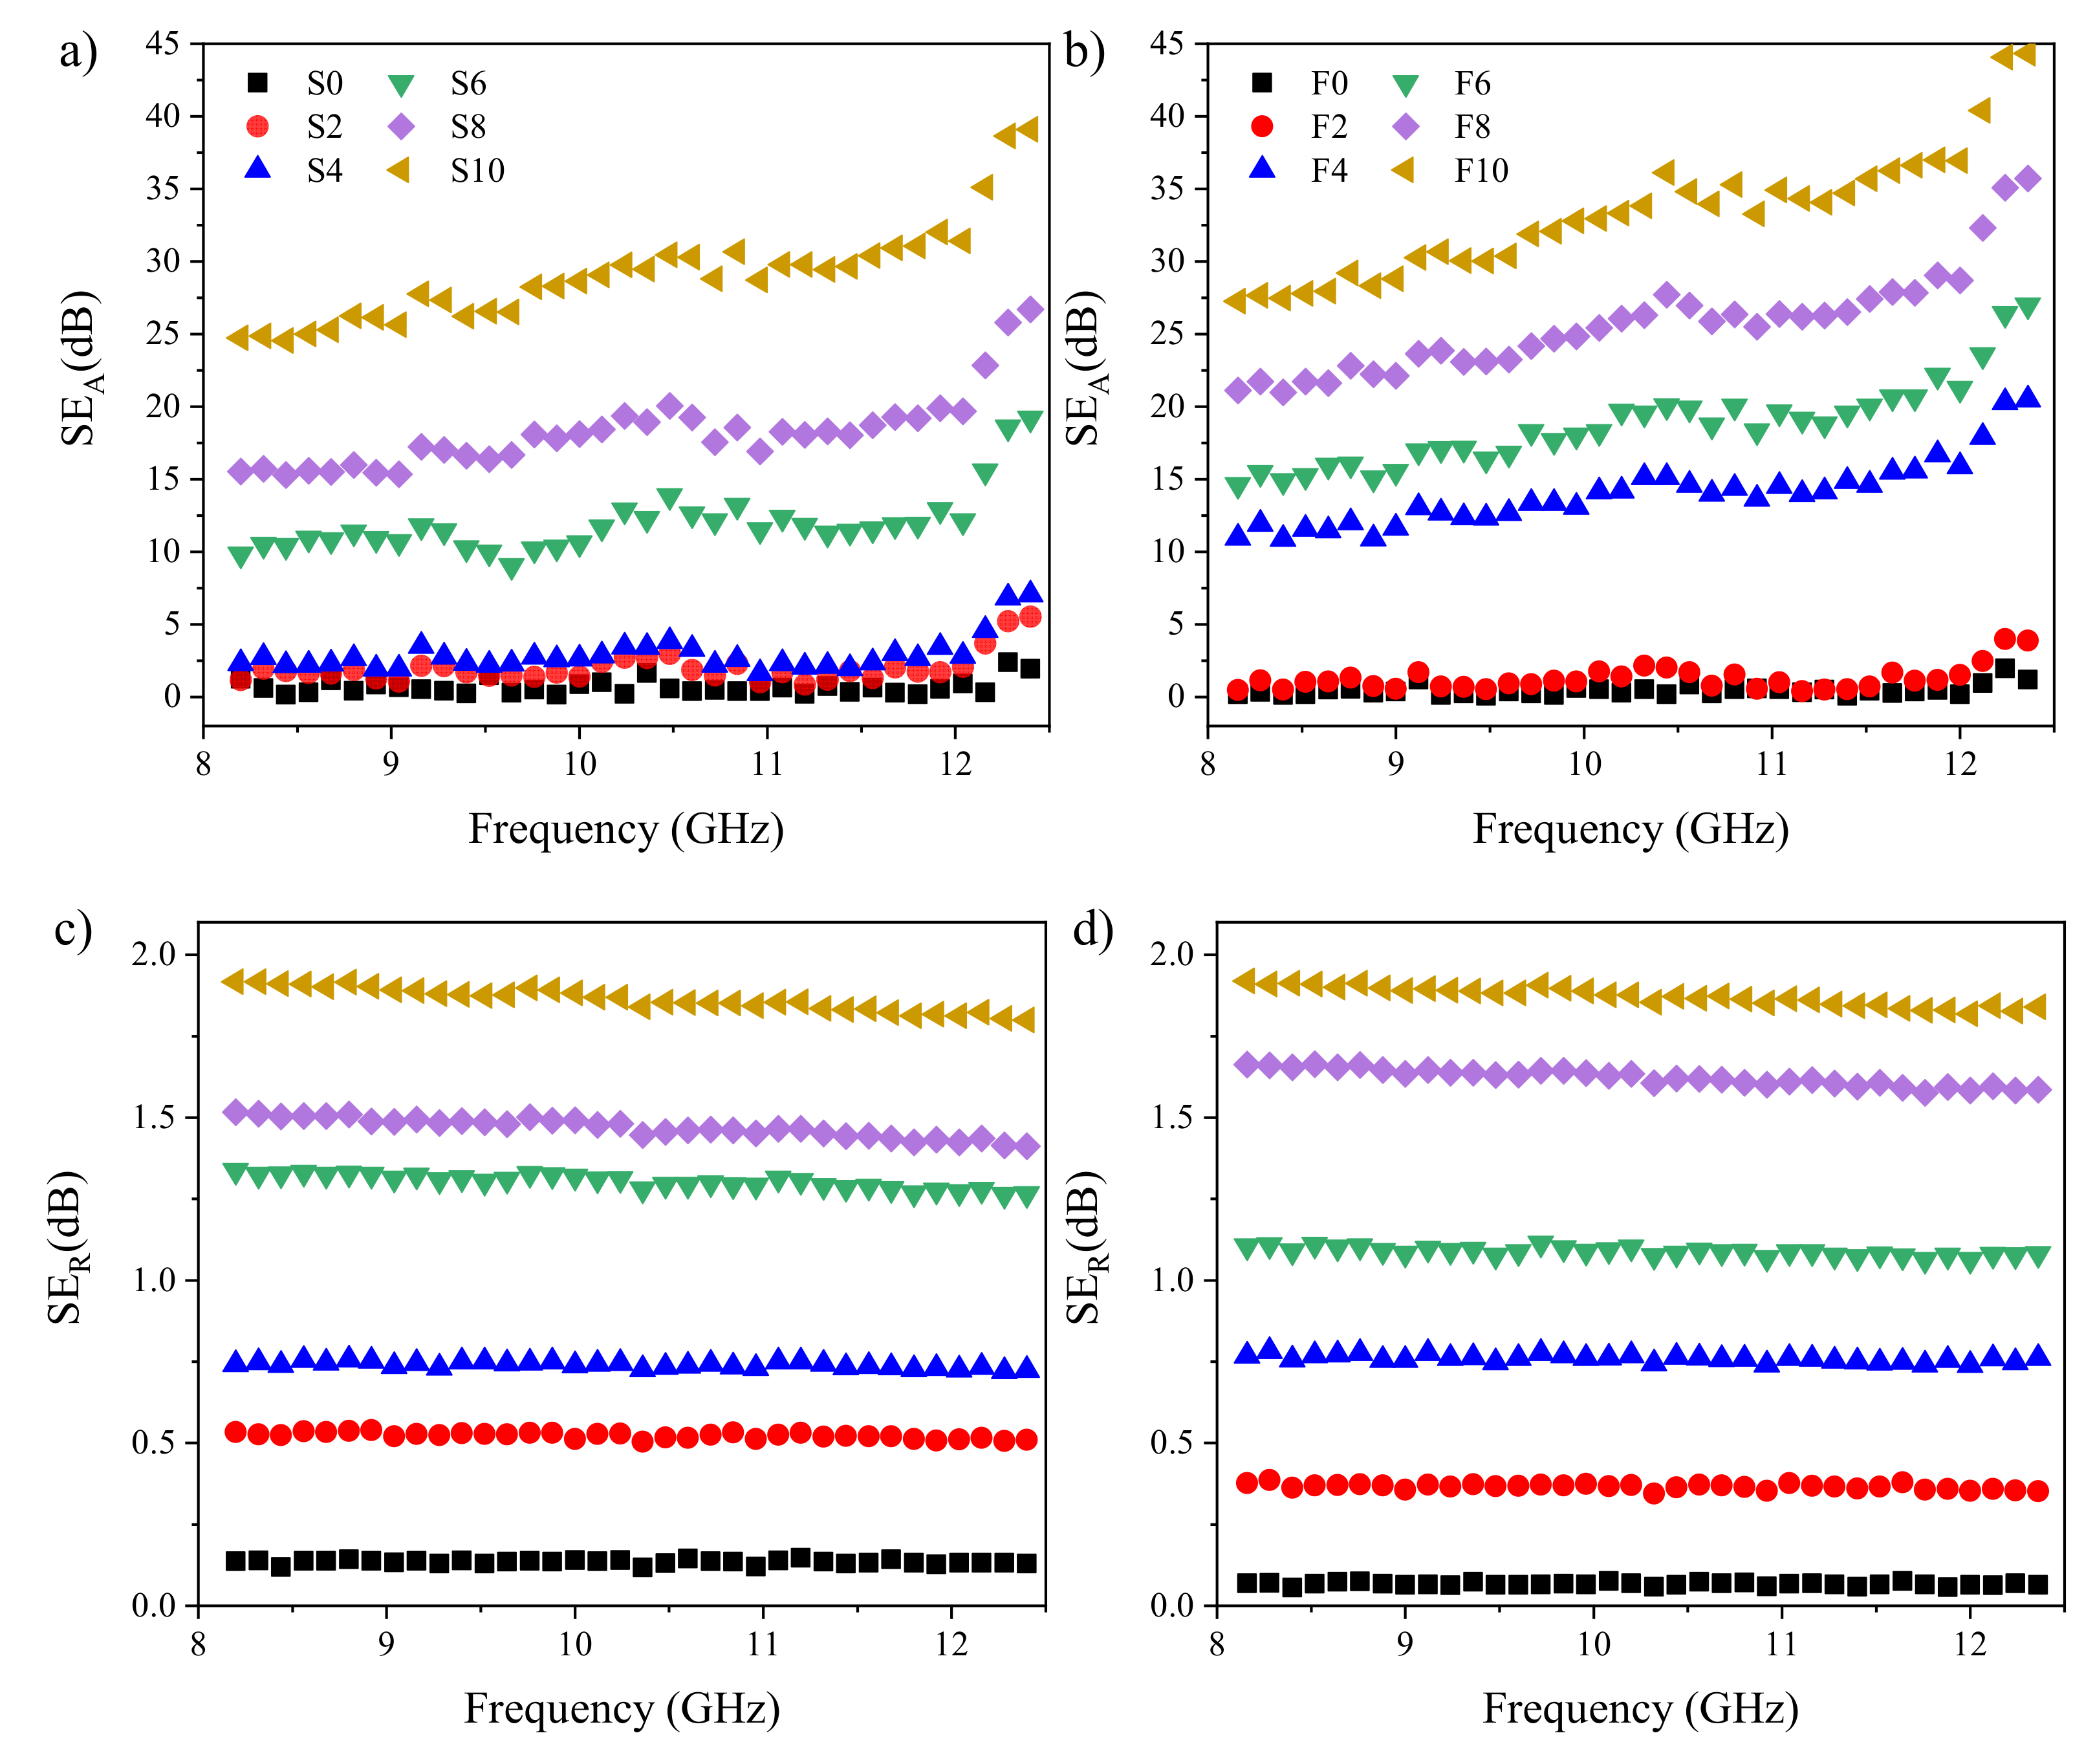
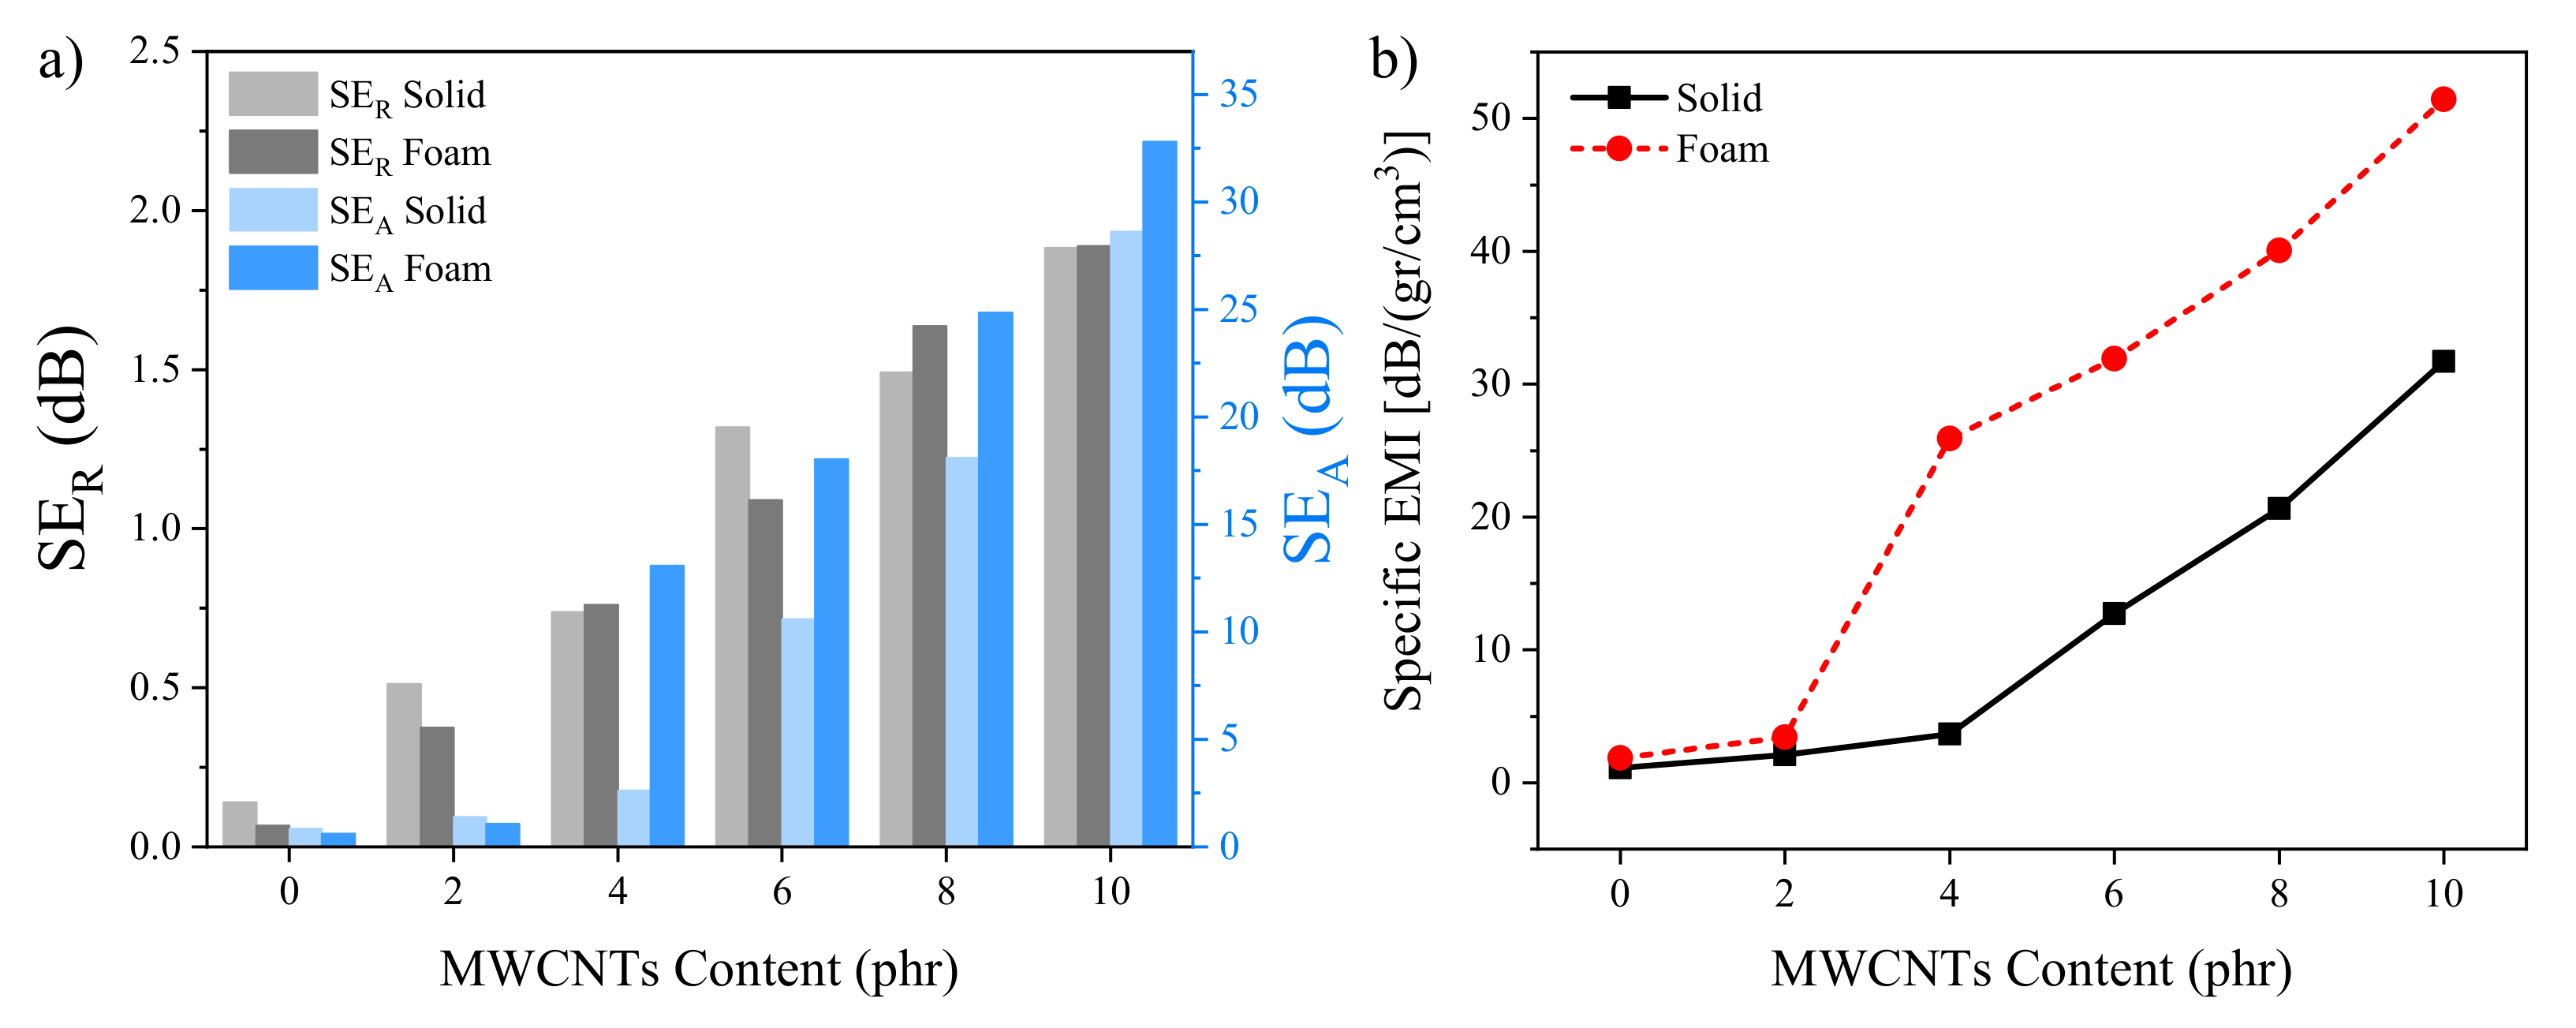
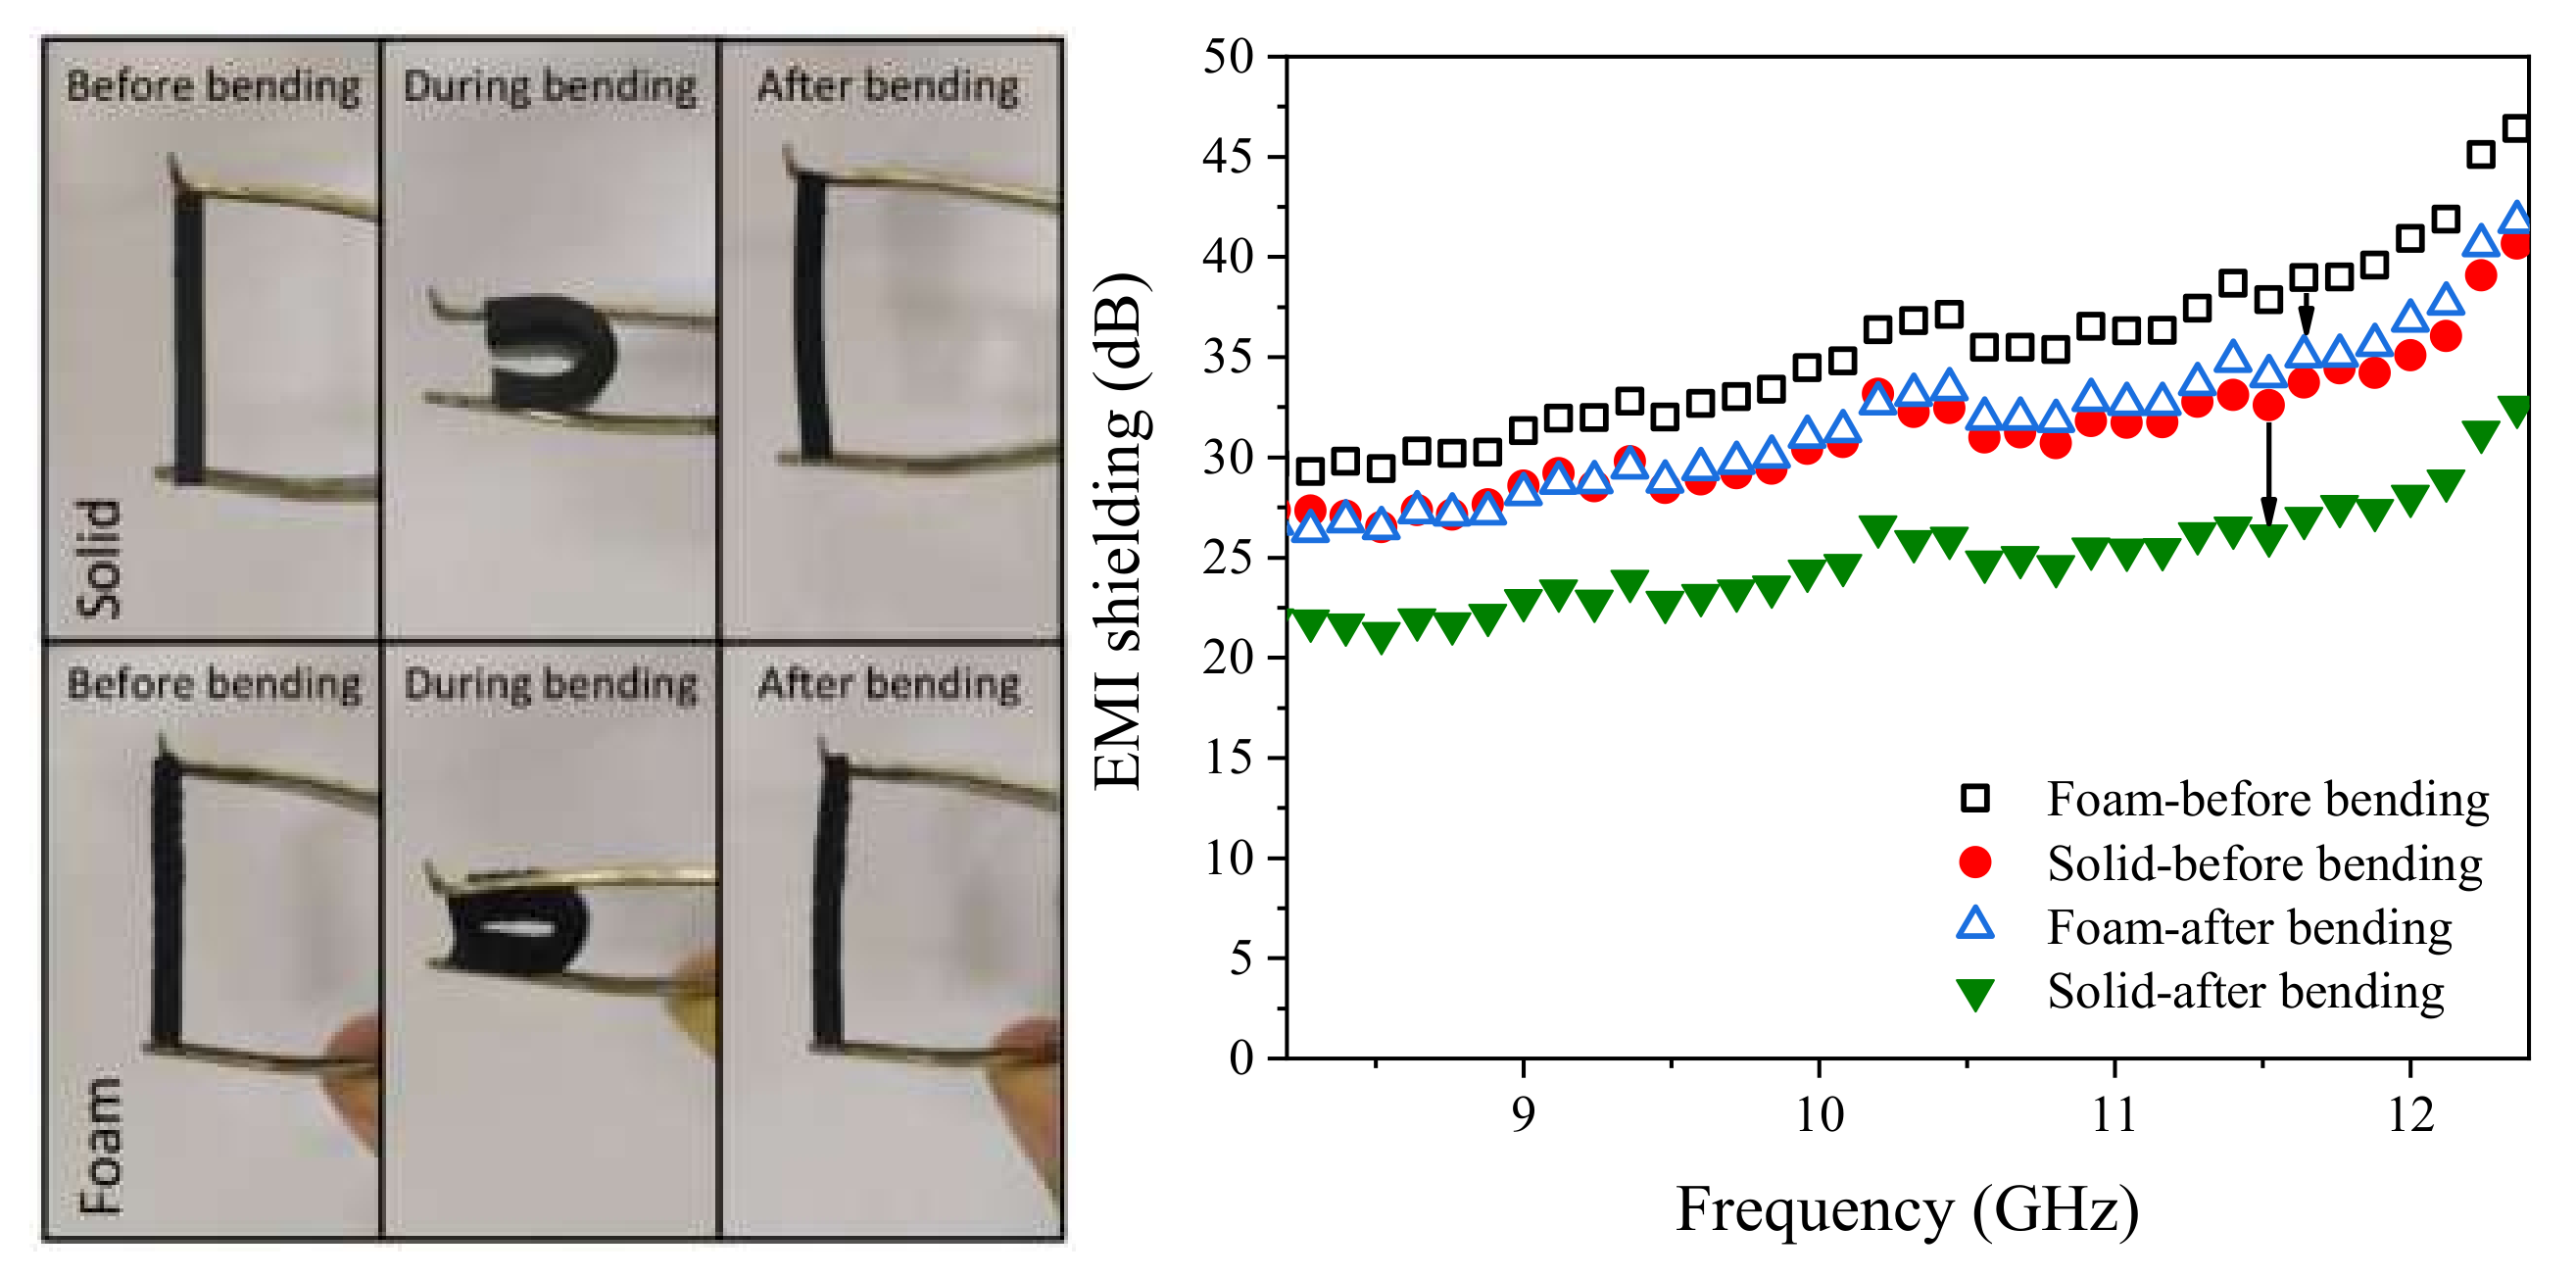
3. Results and Discussion

We selected an extensively used rubber processing technology to prepare the EPDM nanocomposites based on an open two-roll mill, for mastication and mixing of the rubber ingredients, followed by compression molding, for the vulcanization and foaming (Figure 1a). Rubber foams are obtained through the decomposition reaction of a chemical agent, OBSH in this case, and occurs simultaneously with the vulcanization reaction. Thus, the kinetics of these reactions have to be well adjusted to obtain a stable system; i.e., if the vulcanization is too slow, the foam collapses, and if it is too fast, the foam does not fully expand. We studied these reactions, analyzing the cure curve (Figure S1), the cross-link density (CLD) (Table S1), and the viscoelastic characteristics of the materials (Figure S2). A detailed explanation of these results is given in the Supplementary Materials. In summary, MWCNTs affect the reaction kinetics by activating the vulcanization reaction and forming a reinforcing 3D physical network within the EPDM matrix. Additionally, the foaming agent acts as an accelerator due to the presence of sulfohydrazide and its by-products, which could activate the sulfur vulcanization of EPDM [24,25,26].
The densities of the solid and foam samples (Figure 1b) increased as a function of MWCNT content. The density increase of the solid samples is related to the higher intrinsic density of the MWCNTs; meanwhile, the density increase of the foams is the result of the observed differences in foaming and vulcanization kinetics. The mentioned differences, i.e., the acceleration of the vulcanization reaction and the increase in both CLD and melt viscosity of the compounds, limited the growth of the cells (Figure 1c). Similar results have been reported on reactive nanocomposite foams, where the kinetics of the reactions are also critical [11,27,28].
These differences are clearly apparent in the cellular morphology (Figure 2), with a cell diameter decrease from 227 ± 58 μm down to 59 ± 30 μm for unfilled and 10 phr MWCNT samples, respectively. Moreover, MWCNTs act as nucleating sites during the foaming process, which leads to the increase in cell number and, hence, the observed decrease in cell size. Yu et al. [29] have reported similar results in ethylene vinyl acetate (EVA)/MWCNT nanocomposite foams developed via chemical blowing agent. SEM micrographs of solid nanocomposites (Figure S3) clearly show the different fracture mechanisms of the samples: from the classical brittle fracture of the unfilled sample to the rough and wavy character of the filled samples, which is a further indication of the reinforcing effect of the MWCNTs. This reinforcing character is ascribed to a good interfacial interaction between the EPDM matrix and the MWCNTs resulting from the presence of the EPDM-g-MA [30].
Table 2 and Figure S4 show the mechanical properties of the samples under both tensile and compression. As expected from the reinforcing effect mentioned above, MWCNTs gradually increased the value of tensile and compression strength at several deformations (50%, 100%, 300%, and 500% for tensile and 10%, 30%, and 50% for compression), while the elongation at break for the solid samples decreased. Tensile strength at 50% strain increased up to 151% and 568% for solid and foam samples with 10 phr MWCNTs, respectively, while in compression, the increases were up to 60% and 1267% for solid and foam, respectively. This larger improvement of the MWCNTs in the elongation at break of the foamed samples is attributed to the decrease in the porosity. Dindarloo et al. prepared similar EPDM foams containing 2 phr MWCNTs, observing similar trends in the elongation at break and stress [31]. It is worth mentioning that the sample prepared in this study showed higher improvement for tensile properties, which could be assigned to a better interfacial adhesion and state of dispersion of the MWCNTs due to the EPDM-g-MA.
Thermal conductivity can be a valuable asset in EMI shielding applications, both to improve EM wave absorption via heat dissipation and to minimize the temperature impact on the electronic components. Stationary measurements showed thermal conductivity variations from 0.185 W/(m·K) to 0.267 W/(m·K) for the unfilled and 10 phr MWCNTs in the solid materials, respectively, and from 0.069 to 0.206 W/(m·K) for their foamed counterparts, respectively (Figure S5). The obtained value is higher compared to the reported values for most of the foamed nanocomposites prepared for EMI application [11,14,32,33]. Hence, MWCNTs increased the thermal conductivity of the EPDM up to nearly 45% and 200% for the solid and foamed samples, respectively. The modest improvement of the solid samples, compared to the increase in orders of magnitude in electrical conductivity, has previously been observed and ascribed to the mismatch in the phonon spectra of the two phases [34,35]. Meanwhile, the thermal conductivity of the foam samples occurred through three main mechanisms: conduction, convection, and radiation. Both convection and radiation in these samples can be considered negligible as the cell sizes were below 4 mm [36] and the relative density was above 0.2 [37]. Thus, the main mechanism was conduction through the solid and gas phases. Hence, the observed improvement in the thermal conductivity was a combination of the improved thermal conductivity through the matrix and the decrease in porosity. This increase in the thermal conductivity of the sample did not affect the onset of the thermal degradation (Figure S6).
Complex dielectric permittivity is defined as ε* = ε′ − jε′′, where ε’ and ε’’ denote the real and imaginary parts of the permittivity, respectively. The ε’ represents the electric energy storage capacity of a material when subjected to an external field. Meanwhile, the ε’’ represents its ability to dissipate the electric field energy as heat through dielectric polarization processes. Figure 3 shows the permittivity and AC conductivity behavior as a function of the frequency at room temperature. In the high-frequency region, we observed an increase of the ε′ with filler content for both solid and foamed samples. This could be attributed to the volumetric effect of the filler and enhanced interfacial charge accumulation [38]. Meanwhile, in the low-frequency region, samples with high loading fractions exhibited negative permittivity. Contrary to the high positive permittivity, which is mainly due to electron localization, a plasma resonance brought up by electron delocalization can create the negative permittivity. This phenomenon has been ascribed to the coexistence of the applied external electric field and an electric field generated by the delocalized electrons [39]. At low frequencies (f < fp, where fp is the plasma resonance frequency), the oscillation rate of the electrons in the structure of the conductive component (in our case, the MWCNTs) becomes faster than the field leading to the negative permittivity [39,40]. At high frequencies (f > fp), electrons vibrate slower than the external field, and the real part of permittivity becomes positive. Among the different models that explain the dielectric behavior of materials, the Drude model is the one that can predict the negative permittivity behavior [41] and is considered as an indication of the formation and existence of a continuous conductive network throughout the matrix [39,40,42]. In our case, this negative ε’ was observed in samples with concentrations ≥ 4 phr MWCNTs. This result is consistent with the increase in melt storage modulus and nonterminal behavior of the nanocomposites with 4 phr or more reported in the SI. For these samples, the dominant dielectric loss (Figure S7) mechanism was conductance loss, which means that the electric charges transferred within the polymer matrix by direct contact between MWCNTs [10,38]. Further evidence of the existence of a percolated 3D network is the frequency-independent behavior of the AC conductivity at low frequencies, with an increase in conductivity values from 10−13 up to 10−3 S/cm.
In order to study the influence of foaming on the electrical conductivity, the DC electrical conductivity (σDC) of the nanocomposites was calculated from the AC data (σAC) as [43]
σ AC = σ DC + A ω s
where ω = 2πf; σDC is the DC electrical conductivity, which is originated from ionic or electronic conductivity; A is a constant; and s is a low power exponent. For polymers, s = 1, and the σDC value is governed by the σAC at low frequency. Figure 4 shows the σDC as a function of MWCNT volume fraction, where a typical electrical percolation behavior is observed with a sudden increase of the conductivity values. We subsequently calculated the concentration of the percolation threshold (Figure 4, inset) by fitting the curve to a power law equation σ DC = σ 0 V V p t , where σ0 is a scaling factor related to the filler intrinsic conductivity, V is the nanofiller volume fraction, Vp is the volume fraction at the percolation threshold, and t is a critical exponent. The results showed that the foams outperformed the solid samples, presenting higher conductivities and lower percolation threshold, 0.4 vol % compared to 0.9 vol %. This obtained percolation threshold is in a suitable range compared to other conductive nanocomposite foams [7,9,33,44]. This behavior has previously been ascribed to a decrease in the interparticle distances between the MWCNTs and to an increase of the MWCNT contacts and orientation due to the biaxial extensional stretching during the cells’ growth [9,10,19].
EMI shielding can occur through three mechanisms: (1) reflection from the surface of the shield (SER) due to the impedance mismatch between the free space and the shield, (2) absorption as the wave goes through the shield (SEA), and (3) multiple reflection (SEM), which can happen due to the heterogeneity within the material (cell and nanoparticles). Hence, according to Schelkunoff [45], the overall shielding efficiency of a layer can be expressed as
SE dB = SE A dB + SE R dB + SE M dB
SE A dB = 20 log e γ s t
SE R dB = 20 log 1 + k 2 4 k
SE M dB = 20 log 1 k 1 2 k + 1 2 e 2 γ s t
where k is the ratio of the impedance of the free space (η0) to that of the shielding material (ηs) and can be obtained by k = η 0 / η s = ε r / μ r . γs is the wave propagation constant in the shield material, expressed as [46]
γ s = i ω ε r ε 0 μ r μ 0
where μ0 and ε0 are the permeability and permittivity of vacuum, respectively. It is worth noticing that, if the thickness of the shield is greater than the skin depth ( δ = 1 / π μ σ f ), i.e., t > δ, SEM approaches zero, which means the multiple reflection effect is negligible [16]. SEA and SER (Figure 5) for the prepared solid and cellular EPDM/MWCNT nanocomposites with a thickness of 25 mm and different MWCNT contents were calculated based on the measured permittivity and permeability in the X-band frequency. The permittivity results are shown in Figure S8. Due to the absence of magnetic filler, the real and imaginary parts of permeability were almost equal to 1 and 0, respectively, within the X-band and are not presented here. The unfilled samples were almost transparent to the EM radiations over the X-band. Meanwhile, the addition of MWCNTs gradually increased SEA and SER with nanofiller content for both solid and foam nanocomposites. This result is ascribed to the increase in both electrical conductivity and high specific surface area of the MWCNTs. We also observed that the rate of increase of SEA was higher than that of SER, indicating that the dominant shielding mechanism was the absorption of the EM wave (Figure 6a). The SE percentages of each mechanism are reported in Table S2.
It is worth mentioning that, above the percolation threshold (≥ 4 phr), foamed samples exhibited higher SEA compared to their solid counterparts (Figure 6a). Meanwhile, below the percolation threshold, no significant differences were observed between the solid and foam samples [33]. Thus, although the key factor governing the EMI SE is the conductive network, the observed change of the cellular structure, i.e., decreased cell size and increased cell density, should also affect it. This change appeared to increase the phase heterogeneity, thus increasing attenuation of the wave energy through multiple reflections. Foam samples displayed higher total SE than their solid counterparts, with the foamed materials with 6 phr of MWCNTs reaching 19.1 dB compared to 11.9 dB, at 10 GHz. Hence, this sample was close to the target value for commercial applications (20 dB). Meanwhile, the samples filled with 10 phr MWCNTs showed excellent EMI SE performance, ~30 and 35 dB at 10 GHz for solid and foam samples, respectively. The excellent electrical conductivities derived from electron tunneling, hopping, and conduction are closely linked to the ohmic loss, which is regarded as a crucial part of microwave absorption [47,48]._ENREF_53 Moreover, in the case of the foams, the scattering effects within the cellular structural increased the extent of the wave energy dissipation and, hence, increased the total EMI shielding values. Finally, we normalized the total EMI SE by the density, specific EMI SE, to properly compare the SE of the solid and foam samples (Figure 6b). This calculation clearly showed the excellent shielding efficiency of the foams compared to the solid samples.
The inadequate flexibility of many conventionally used EMI shielding materials is considered as one of the main shortcomings hindering their application. Moreover, the stability of the dielectric and EMI shielding behavior of shields subjected to consecutive strains is another serious concern of both manufactures and final users. Figure 7a shows the optical photos of the vulcanized solid and foamed EPDM/MWCNT nanocomposites loaded with 10 phr MWCNTs before and after bending. Both solid and foamed samples could be bent freely by applying a low force and, after removal of the force, the samples reversed back to their initial dimensions within a short time. However, the foamed nanocomposites exhibited faster elastic shape recovery compared to the solid counterpart as a result of the air molecules trapped in the cells. We then assessed the effect of repeated bending to a radius of 2 mm for 1000 times (Figure 7b) upon the EMI shielding behavior in these samples. Solid and foam samples exhibited a slight decrease of around 22.1% and 9%, respectively, in the total EMI SE over the X-band frequency range. This small decrease should be the result of a change in the interconnectivity of the 3D MWCNT network within the EPDM matrix. Such modification of the 3D network would be restricted in the foam due to the topological constraints to which MWCNTs are subjected within the cellular structure, and the decrease of EMI performance after repeated bending is therefore smaller.
Finally, the use of different parameters, such as type of filler/matrix, frequency of measurement, fabrication methods, filler concentrations, and thicknesses, hindered the direct comparison of the SE found in the literature on rubber foams. Nevertheless, we have compiled the data (Table 3) in order to provide a comprehensive analysis of the EMI SE of rubber foam nanocomposites. From this data, it can be seen that the developed EPDM/MWCNT foams exhibited superior specific EMI SE and deformability. In addition, properties such as resistance to chemicals, moisture, and ozone should be ensured due to the use of EPDM rubber.

4. Conclusions

In summary, the present work has developed an industrially scalable lightweight EMI shielding material based on EPDM rubber and MWCNTs. The developed foam samples exhibit high thermal conductivities up to 0.2 W/m·K, high electrical conductivities of up to 2.7 × 10⁻⁴ S/cm, and EMI shielding efficiencies of up 45 dB, which do not degrade significantly after repeated bending. Such properties are the result of the formation of a 3D interconnected network within the EPDM matrix.
Even though the developed samples already display high potential as an EMI shield over X-band frequency, further studies could optimize the cellular structure at large loading fractions. This optimization could then result in improved shielding efficiencies. Nevertheless, the samples developed here are suitable for many applications, such as transport, cell phones, and lightweight portable devices. The results obtained highlight the high potential of cross-linked EPDM/MWCNT foams as a lightweight wave absorber with high flexibility and deformability.

Supplementary Materials

The following are available online at https://www.mdpi.com/2073-4360/12/4/858/s1. Figure S1: Curing rheographs of solid and foamed EPDM/MWCNT nanocomposite compounds at 160 °C. Figure S2: (a) Storage modulus, (b) complex visocisty versus angular frequency, and (c) the relaxation time spectra at different MWCNT concentrations. Figure S3: SEM images of cryofractured surfaces of EPDM/MWCNT nanocomposites containing (a) 0, (b) 2, (c) 4, (d) 6, (e) 8, and 10 phr MWCNTs. Figure S4: Representative stress–strain curves of the solid (top) and foam (bottom) samples. Tensile tests (left) and compressive (right). Figure S5: Thermal conductivity of solid and cellular EPDM/MWCNT nanocomposites versus MWCNT loading at room temperature. Figure S6: TGA curves of EPDM/MWCNT nanocomposites with different MWCNT contents: (a) solid and (b) foam. The corresponding 10% weight loss temperatures are shown in the insets. Figure S7: Logarithmic curves of the imaginary permittivity (ε″) vs. frequency for EPDM/MWCNT nanocomposites in the frequency region of 10−1 to 107 Hz: (a) solid and b) foam. Figure S8: Dielectric properties of solid and foamed nanocomposites in the X-band frequencies: real (top) and imaginary (bottom) parts of the relative permittivity for solid samples (left), and real (top) and imaginary (right) parts of the relative permittivity for foamed samples (right). Table S1: Curing characteristics for solid and foamed EPDM/MWCNT nanocomposites. Table S2: SE percentages of each mechanism at 10 GHz.

Author Contributions

H.B.: conceptualization, methodology, experimentation, validation, data curation, formal analysis, writing—original draft, and writing—review and editing. A.A.K.: conceptualization, methodology, validation, data curation, writing—review and editing, and supervision. E.L.-H.: methodology and experimentation. J.M.M.: methodology and experimentation. R.V.: conceptualization, methodology, resources, validation, data curation, writing—review and editing, and supervision. All authors have read and agreed to the published version of the manuscript.

Funding

This research was funded by MICIU, grant number MAT2016-81138-R.

Acknowledgments

Authors thank ARLANXEO Performance Elastomers for supplying raw materials. R.V. acknowledges the financial support of MICIU through the project MAT2016-81138-R.

Conflicts of Interest

The authors declare no conflict of interest.

References

  1. Luo, J.; Wang, L.; Huang, X.; Li, B.; Guo, Z.; Song, X.; Lin, L.; Tang, L.-C.; Xue, H.; Gao, J. Mechanically Durable, Highly Conductive, and Anticorrosive Composite Fabrics with Excellent Self-Cleaning Performance for High-Efficiency Electromagnetic Interference Shielding. ACS Appl. Mater. Interfaces 2019, 11, 10883–10894. [Google Scholar] [CrossRef] [PubMed]
  2. Geetha, S.; Kumar, K.K.S.; Rao, C.R.K.; Vijayan, M.; Trivedi, D.C. EMI shielding: Methods and materials—A review. J. Appl. Polym. Sci. 2009, 112, 2073–2086. [Google Scholar] [CrossRef]
  3. Tong, X.C. Advanced Materials and Design for Electromagnetic Interference Shielding; Informa UK Limited: Boca Raton, FL, USA, 2016. [Google Scholar]
  4. Abbasi, H.; Antunes, M.; Velasco, J.I. Recent advances in carbon-based polymer nanocomposites for electromagnetic interference shielding. Prog. Mater. Sci. 2019, 103, 319–373. [Google Scholar] [CrossRef]
  5. Yang, Y.; Gupta, M.C.; Dudley, K.L.; Lawrence, R.W. Conductive Carbon Nanofiber-Polymer Foam Structures. Adv. Mater. 2005, 17, 1999–2003. [Google Scholar] [CrossRef]
  6. Thomassin, J.-M.; Pagnoulle, C.; Bednarz, L.; Huynen, I.; Jérôme, C.; Detrembleur, C. Foams of polycaprolactone/MWNT nanocomposites for efficient EMI reduction. J. Mater. Chem. 2008, 18, 792–796. [Google Scholar] [CrossRef]
  7. Zhang, H.-B.; Yan, Q.; Zheng, W.-G.; He, Z.; Yu, Z.-Z. Tough Graphene−Polymer Microcellular Foams for Electromagnetic Interference Shielding. ACS Appl. Mater. Interfaces 2011, 3, 918–924. [Google Scholar] [CrossRef]
  8. Eswaraiah, V.; Sankaranarayanan, V.; Ramaprabhu, S. Functionalized Graphene-PVDF Foam Composites for EMI Shielding. Macromol. Mater. Eng. 2011, 296, 894–898. [Google Scholar] [CrossRef]
  9. Ameli, A.; Jung, P.; Park, C. Electrical properties and electromagnetic interference shielding effectiveness of polypropylene/carbon fiber composite foams. Carbon 2013, 60, 379–391. [Google Scholar] [CrossRef]
  10. Ameli, A.; Nofar, M.; Park, C.; Pötschke, P.; Rizvi, G. Polypropylene/carbon nanotube nano/microcellular structures with high dielectric permittivity, low dielectric loss, and low percolation threshold. Carbon 2014, 71, 206–217. [Google Scholar] [CrossRef]
  11. Bernal, M.M.; Martin-Gallego, M.; Molenberg, I.; Huynen, I.; Lopez-Manchado, M.A.; Verdejo, R. Influence of carbon nanoparticles on the polymerization and EMI shielding properties of PU nanocomposite foams. RSC Adv. 2014, 4, 7911. [Google Scholar] [CrossRef] [Green Version]
  12. Chen, Y.; Zhang, H.-B.; Huang, Y.; Jiang, Y.; Zheng, W.-G.; Yu, Z.-Z. Magnetic and electrically conductive epoxy/graphene/carbonyl iron nanocomposites for efficient electromagnetic interference shielding. Compos. Sci. Technol. 2015, 118, 178–185. [Google Scholar] [CrossRef]
  13. Liu, C.; Duan, Y.; Cai, J.; Li, X.; Zhang, D.; Gao, J.; Che, Y. Compressible Fe3O4/MWCNTs-coated polymer foams for high-performance and tunable electromagnetic microwave absorption. Mater. Res. Express 2019, 6, 106114. [Google Scholar] [CrossRef]
  14. Li, J.; Zhang, G.; Ma, Z.; Fan, X.; Fan, X.; Qin, J.; Shi, X. Morphologies and electromagnetic interference shielding performances of microcellular epoxy/multi-wall carbon nanotube nanocomposite foams. Compos. Sci. Technol. 2016, 129, 70–78. [Google Scholar] [CrossRef]
  15. Li, Y.; Shen, B.; Yi, D.; Zhang, L.; Zhai, W.; Wei, X.; Zheng, W. The influence of gradient and sandwich configurations on the electromagnetic interference shielding performance of multilayered thermoplastic polyurethane/graphene composite foams. Compos. Sci. Technol. 2017, 138, 209–216. [Google Scholar] [CrossRef]
  16. Bizhani, H.; Nayyeri, V.; Katbab, A.; Jalali-Arani, A.; Nazockdast, H. Double percolated MWCNTs loaded PC/SAN nanocomposites as an absorbing electromagnetic shield. Eur. Polym. J. 2018, 100, 209–218. [Google Scholar] [CrossRef]
  17. Jiang, Q.; Liao, X.; Li, J.; Chen, J.; Wang, G.; Yi, J.; Yang, Q.; Li, G. Flexible thermoplastic polyurethane/reduced graphene oxide composite foams for electromagnetic interference shielding with high absorption characteristic. Compos. Part A Appl. Sci. Manuf. 2019, 123, 310–319. [Google Scholar] [CrossRef]
  18. Bagotia, N.; Choudhary, V.; Sharma, D.K. Synergistic effect of graphene/multiwalled carbon nanotube hybrid fillers on mechanical, electrical and EMI shielding properties of polycarbonate/ethylene methyl acrylate nanocomposites. Compos. Part B Eng. 2019, 159, 378–388. [Google Scholar] [CrossRef]
  19. Liu, H.; Liang, C.; Chen, J.; Huang, Y.; Cheng, F.; Wen, F.; Xu, B.; Wang, B. Novel 3D network porous graphene nanoplatelets/Fe3O4/epoxy nanocomposites with enhanced electromagnetic interference shielding efficiency. Compos. Sci. Technol. 2019, 169, 103–109. [Google Scholar] [CrossRef]
  20. Shen, B.; Li, Y.; Zhai, W.; Zheng, W. Compressible Graphene-Coated Polymer Foams with Ultralow Density for Adjustable Electromagnetic Interference (EMI) Shielding. ACS Appl. Mater. Interfaces 2016, 8, 8050–8057. [Google Scholar] [CrossRef]
  21. Zhan, Y.; Oliviero, M.; Wang, J.; Sorrentino, A.; Buonocore, G.G.; Sorrentino, L.; Lavorgna, M.; Xia, H.; Iannace, S. Enhancing the EMI shielding of natural rubber-based supercritical CO2 foams by exploiting their porous morphology and CNT segregated networks. Nanoscale 2019, 11, 1011–1020. [Google Scholar] [CrossRef]
  22. Yang, J.; Liao, X.; Li, J.; He, G.; Zhang, Y.; Tang, W.; Wang, G.; Li, G. Light-weight and flexible silicone rubber/MWCNTs/Fe3O4 nanocomposite foams for efficient electromagnetic interference shielding and microwave absorption. Compos. Sci. Technol. 2019, 181, 107670. [Google Scholar] [CrossRef]
  23. Bizhani, H.; Katbab, A.A.; Verdejo, R. Elastomeric nanocomposite foams with improved properties for extreme conditions. In High-Performance Elastomeric Materials Reinforced by Nano-Carbons; Elsevier BV: Amsterdam, The Netherlands, 2020; pp. 133–147. [Google Scholar]
  24. Kueseng, P.; Sae-Oui, P.; Rattanasom, N. Mechanical and electrical properties of natural rubber and nitrile rubber blends filled with multi-wall carbon nanotube: Effect of preparation methods. Polym. Test. 2013, 32, 731–738. [Google Scholar] [CrossRef]
  25. Nakaramontri, Y.; Kummerlöwe, C.; Nakason, C.; Vennemann, N. The effect of surface functionalization of carbon nanotubes on properties of natural rubber/carbon nanotube composites. Polym. Compos. 2014, 36, 2113–2122. [Google Scholar] [CrossRef]
  26. Stehr, J. Chemical Blowing Agents in the Rubber Industry. Past–Present–and Future? Int. Polym. Sci. Technol. 2016, 43, 1–10. [Google Scholar] [CrossRef]
  27. Verdejo, R.; Barroso-Bujans, F.; Rodríguez-Perez, M.A.; De Saja, J.A.; Arroyo, M.; Lopez-Manchado, M.A. Carbon nanotubes provide self-extinguishing grade to silicone-based foams. J. Mater. Chem. 2008, 18, 3933. [Google Scholar] [CrossRef]
  28. Verdejo, R.; Stämpfli, R.; Alvarez-Lainez, M.; Mourad, S.; Rodríguez-Perez, M.A.; Brühwiler, P.; Shaffer, M.S.P. Enhanced acoustic damping in flexible polyurethane foams filled with carbon nanotubes. Compos. Sci. Technol. 2009, 69, 1564–1569. [Google Scholar] [CrossRef]
  29. Yu, D.-R.; Kim, G.-H. Effects of multi-walled carbon nanotube (MWCNT) content on physical properties and cell structure in ethylene vinyl acetate copolymer (EVA)/MWCNT nanocomposite foams. Polym. Plast. Technol. Eng. 2013, 52, 699–703. [Google Scholar] [CrossRef]
  30. Pasbakhsh, P.; Ismail, H.; Fauzi, M.A.; Abu Bakar, A. Influence of maleic anhydride grafted ethylene propylene diene monomer (MAH-g-EPDM) on the properties of EPDM nanocomposites reinforced by halloysite nanotubes. Polym. Test. 2009, 28, 548–559. [Google Scholar] [CrossRef]
  31. Dindarloo, A.S.; Karrabi, M.; Hamid, M.; Ghoreishy, R. Various nano-particles influences on structure, viscoelastic, Vulcanization and mechanical behaviour of EPDM nano-composite rubber foam. Plast. Rubber Compos. 2019, 48, 218–225. [Google Scholar] [CrossRef]
  32. Xu, Y.; Li, Y.; Hua, W.; Zhang, A.; Bao, J. Light-Weight Silver Plating Foam and Carbon Nanotube Hybridized Epoxy Composite Foams with Exceptional Conductivity and Electromagnetic Shielding Property. ACS Appl. Mater. Interfaces 2016, 8, 24131–24142. [Google Scholar] [CrossRef]
  33. Zhang, H.; Zhang, G.; Gao, Q.; Tang, M.; Ma, Z.; Qin, J.; Wang, M.; Kim, J.-K. Multifunctional microcellular PVDF/Ni-chains composite foams with enhanced electromagnetic interference shielding and superior thermal insulation performance. Chem. Eng. J. 2020, 379, 122304. [Google Scholar] [CrossRef]
  34. Sánchez-Hidalgo, R.; Blanco, C.; Menendez, R.; Verdejo, R.; Lopez-Manchado, M.A. Multifunctional Silicone Rubber Nanocomposites by Controlling the Structure and Morphology of Graphene Material. Polym. 2019, 11, 449. [Google Scholar] [CrossRef] [PubMed] [Green Version]
  35. Shenogin, S. Role of thermal boundary resistance on the heat flow in carbon-nanotube composites. J. Appl. Phys. 2004, 95, 8136. [Google Scholar] [CrossRef]
  36. Klempner, D.; Sendijareviʹc, V.; Aseeva, R.M. Handbook of Polymeric Foams and Foam Technology; Hanser Publishers: Munich, Germany, 2004. [Google Scholar]
  37. Solórzano, E.; Lázaro, J.; De Saja, J.A.; Rodríguez-Perez, M.A. Influence of Solid Phase Conductivity and Cellular Structure on the Heat Transfer Mechanisms of Cellular Materials: Diverse Case Studies. Adv. Eng. Mater. 2009, 11, 818–824. [Google Scholar] [CrossRef]
  38. Jeddi, J.; Katbab, A.; Mehranvari, M. Investigation of microstructure, electrical behavior, and EMI shielding effectiveness of silicone rubber/carbon black/nanographite hybrid composites. Polym. Compos. 2019, 40, 4056–4066. [Google Scholar] [CrossRef]
  39. Yao, X.; Kou, X.; Qiu, J. Multi-walled carbon nanotubes/polyaniline composites with negative permittivity and negative permeability. Carbon 2016, 107, 261–267. [Google Scholar] [CrossRef]
  40. Sun, Y.; Wang, J.; Qi, S.; Tian, G.; Wu, D. Permittivity transition from highly positive to negative: Polyimide/carbon nanotube composite’s dielectric behavior around percolation threshold. Appl. Phys. Lett. 2015, 107, 012905. [Google Scholar] [CrossRef]
  41. Kohlman, R.S.; Joo, J.; Wang, Y.Z.; Pouget, J.P.; Kaneko, H.; Ishiguro, T.; Epstein, A.J. Drude Metallic Response of Polypyrrole. Phys. Rev. Lett. 1995, 74, 773–776. [Google Scholar] [CrossRef]
  42. Rao, B.V.B.; Kale, N.; Kothavale, B.S.; Kale, S. Fabrication and evaluation of thin layer PVDF composites using MWCNT reinforcement: Mechanical, electrical and enhanced electromagnetic interference shielding properties. AIP Adv. 2016, 6, 65107. [Google Scholar]
  43. Jana, S.; Garain, S.; Sen, S.; Mandal, D. The influence of hydrogen bonding on the dielectric constant and the piezoelectric energy harvesting performance of hydrated metal salt mediated PVDF films. Phys. Chem. Chem. Phys. 2015, 17, 17429–17436. [Google Scholar] [CrossRef]
  44. Duand, H.-J.; Zhu, H.; Yang, J.; Gao, J.; Yang, Y.; Xu, L.; Zhao, G.; Liu, Y. Effect of carbon nanofiller dimension on synergistic EMI shielding network of epoxy/metal conductive foams. Compos. Part A Appl. Sci. Manuf. 2019, 118, 41–48. [Google Scholar] [CrossRef]
  45. Schelkunoff, S. Electromagnetic Waves; Nostrand Company, Inc.: New York, NY, USA, 1943. [Google Scholar]
  46. Carpi, F.; Gallone, G.; Galantini, F.; De Rossi, D. Enhancing the dielectric permittivity of elastomers. In Dielectric Elastomers Electromechanical Transducers; Elsevier: Amsterdam, The Netherlands, 2008; pp. 51–68. [Google Scholar]
  47. Zhang, H.; Zhang, G.; Tang, M.; Zhou, L.; Li, J.; Fan, X.; Shi, X.; Qin, J. Synergistic effect of carbon nanotube and graphene nanoplates on the mechanical, electrical and electromagnetic interference shielding properties of polymer composites and polymer composite foams. Chem. Eng. J. 2018, 353, 381–393. [Google Scholar] [CrossRef]
  48. Yousefi, N.; Sun, X.; Lin, X.; Shen, X.; Jia, J.; Zhang, B.; Tang, B.; Chan, M.; Kim, J.-K. Highly Aligned Graphene/Polymer Nanocomposites with Excellent Dielectric Properties for High-Performance Electromagnetic Interference Shielding. Adv. Mater. 2014, 26, 5480–5487. [Google Scholar] [CrossRef]
Figure 1. (a) Schematic representation of the sample preparation. (b) Density of the samples and porosity of foams as a function of multiwall carbon nanotubes (MWCNT) content. (c) Cell diameter and cell density of the foams as a function of MWCNT content.
Polymers 12 00858 g001
Figure 2. SEM micrographs of cryofractured ethylene–propylene–diene monomer (EPDM)/MWCNT nanocomposite foams containing (a) 0, (b) 2, (d) 6, and (e) 10 phr MWCNTs. (c,f) Micrographs of the MWCNTs within the morphology.
Polymers 12 00858 g002
Figure 3. Logarithmic plots of ε’ (a,b) and AC conductivity (c,d) as a function of frequency for solid (left) and foam (right) samples.
Polymers 12 00858 g003
Figure 4. DC electrical conductivity of solid and foamed nanocomposites as a function of filler content. The inset shows the log–log plot of DC conductivity versus (V − Vp).
Polymers 12 00858 g004
Figure 5. SEA (a,b) and SER (c,d) of solid (left) and foam (right) samples in the X-band frequencies.
Polymers 12 00858 g005
Figure 6. (a) SEA and SER and (b) specific electromagnetic interference (EMI) shielding efficiency (SE) of the samples at 10 GHz.
Polymers 12 00858 g006
Figure 7. Photos (left) and EMI SE (right) of the samples filled with 10 phr MWCNT before and after repeated bending.
Polymers 12 00858 g007
Table 1. Formulation (in phr, parts per hundred of rubber) of the prepared nanocomposite compounds, where S stands for solid and F for foam.
S0S2S4S6S8S10F0F2F4F6F8F10
EPDM100100100100100100100100100100100100
EPDM-g-MA555555555555
MWCNTs02468100246810
ZnO555555555555
STA1.51.51.51.51.51.51.51.51.51.51.51.5
DCP111111111111
S0.50.50.50.50.50.50.50.50.50.50.50.5
OBSH000000555555
Table 2. Mechanical properties of solid and foamed EPDM/MWCNT nanocomposites.
SampleTensile Stress (MPa)Strain at Break (%)Compressive Stress (MPa)
50%100%300%500%10%30%50%
S00.62 ± 0.040.87 ± 0.101.5 ± 0.12.1 ± 0.2641 ± 530.35 ± 0.011.4 ± 0.023.6 ± 0.1
S20.74 ± 0.031.05 ± 0.031.9 ± 0.12.8 ± 0.3630 ± 310.39 ± 0.021.5 ± 0.034.0 ± 0.2
S40.83 ± 0.051.19 ± 0.072.5 ± 0.13.6 ± 0.1600 ± 390.52 ± 0.041.7 ± 0.064.2 ± 0.1
S61.05 ± 0.031.59 ± 0.053.6 ± 0.15.2 ± 0.2560 ± 420.63 ± 0.012.0 ± 0.075.3 ± 0.1
S81.27 ± 0.061.98 ± 0.074.6 ± 0.16.6 ± 0.2520 ± 390.64 ± 0.042.2 ± 0.15.5 ± 0.3
S101.56 ± 0.072.51 ± 0.095.9 ± 0.1-483 ± 280.72 ± 0.082.4 ± 0.15.8 ± 0.2
F00.15 ± 0.020.23 ± 0.030.5 ± 0.1-344 ± 400.04 ± 0.010.1 ± 0.010.22 ± 0.02
F20.29 ± 0.030.47 ± 0.051.0 ± 0.2-351 ± 210.06 ± 0.020.15 ± 0.020.33 ± 0.06
F40.50 ± 0.050.77 ± 0.071.5 ± 0.1-361 ± 750.11 ± 0.040.3 ± 0.10.70 ± 0.19
F60.70 ± 0.071.09 ± 0.072.3 ± 0.2-377 ± 540.18 ± 0.030.5 ± 0.11.25 ± 0.03
F80.91 ± 0.071.40 ± 0.093.2 ± 0.1-392 ± 650.25 ± 0.060.7 ± 0.11.94 ± 0.33
F100.97 ± 0.101.54 ± 0.143.5 ± 0.2-405 ± 370.33 ± 0.011.1 ± 0.12.94 ± 0.4
Table 3. EMI SE of rubber foam nanocomposites in the X-band frequency range.
MaterialFoam Fabrication ProcedureFiller Content (wt.%)EMI ShieldingMechanical PropertiesOther CharacteristicsRef.
Specific EMI SE (dB/gr cm-3)Thickness (mm)
NR/MWCNTsScCO26.4401.3Compressive stress at 30%: 0.14 MPaSegregated CNT network[21]
PDMS/MWCNTsScCO210722N/AFlexible-Retained EMI shielding properties after bending[22]
EPDM/MWCNTsOBSH foaming agent105225Compressive stress at 30%: 1.06 MPa, tensile stress at 300%: 3.46 MPa, strain at break: 405%Chemical, moisture, and ozone resistive-Retained EMI shielding properties after bendingThis work

