Mechanical Strength Enhancement of 3D Printed Acrylonitrile Butadiene Styrene Polymer Components Using Neural Network Optimization Algorithm

 ,
,  ,
,  and
and
Abstract
:
1. Introduction
2. Materials and Methods
2.1. Neural Network Optimization Algorithm
2.2. Selection of Process Parameters
- Layer thickness in mm.
- Orientation in degrees.
- Raster angle in degrees.
- Raster width in mm.
- Air gap in mm.
3. Results and Discussion
4. Confirmatory Experiments
5. Conclusions
Author Contributions
Funding
Acknowledgments
Conflicts of Interest
Appendix A

| Algorithm | Worst | Best | Average | Median | Std. Dev. |
|---|---|---|---|---|---|
| NBA | 174.6234301 | 174.9214992 | 174.9011405 | 174.921458 | 7.52 × 10⁻² |
| GWO | 174.623429 | 174.9214992 | 174.8620095 | 174.9214386 | 1.05 × 10⁻¹ |
| DA | 174.6234301 | 174.9214992 | 174.8394289 | 174.9201719 | 1.18 × 10⁻¹ |
| SSA | 174.6324965 | 174.9214992 | 174.8028863 | 174.8169921 | 9.99 × 10⁻² |
| SCA | 174.4505185 | 174.9200412 | 174.6821489 | 174.6282199 | 1.24 × 10⁻¹ |
| NNA | 174.8553077 | 174.9214939 | 174.9100097 | 174.9200154 | 1.98 × 10⁻² |
| Algorithm | Worst | Best | Average | Median | Std. Dev. |
|---|---|---|---|---|---|
| NBA | 162.1491001 | 162.6744472 | 162.5693778 | 162.6744472 | 2.14 × 10⁻¹ |
| GWO | 162.674447 | 162.6744472 | 162.6744472 | 162.6744472 | 3.38 × 10⁻⁸ |
| DA | 162.6627456 | 162.6744472 | 162.6740571 | 162.6744472 | 2.14 × 10⁻³ |
| SSA | 162.6744472 | 162.6744472 | 162.6744472 | 162.6744472 | 5.78 × 10⁻¹⁴ |
| SCA | 162.6744472 | 162.6744472 | 162.6744472 | 162.6744472 | 5.78 × 10⁻¹⁴ |
| NNA | 162.6744472 | 162.6744472 | 162.6744472 | 162.6744472 | 5.78 × 10⁻¹⁴ |
| Algorithm | Worst | Best | Average | Median | Std. Dev. |
|---|---|---|---|---|---|
| NBA | 1.605823622 | 1.605823622 | 1.605823622 | 1.605823622 | 2.26 × 10⁻¹⁶ |
| GWO | 1.605823622 | 1.605823622 | 1.605823622 | 1.605823622 | 2.26 × 10⁻¹⁶ |
| DA | 1.605823622 | 1.605823622 | 1.605823622 | 1.605823622 | 2.26 × 10⁻¹⁶ |
| SSA | 1.605823622 | 1.605823622 | 1.605823622 | 1.605823622 | 2.26 × 10⁻¹⁶ |
| SCA | 1.605823622 | 1.605823622 | 1.605823622 | 1.605823622 | 2.26 × 10⁻¹⁶ |
| NNA | 1.605823622 | 1.605823622 | 1.605823622 | 1.605823622 | 2.26 × 10⁻¹⁶ |
| Algorithm | Worst | Best | Average | Median | Std. Dev. |
|---|---|---|---|---|---|
| NBA | 174.6234263 | 174.9214936 | 174.8372247 | 174.9196852 | 1.27 × 10⁻¹ |
| GWO | 174.6242344 | 174.921498 | 174.8359942 | 174.9200114 | 1.11 × 10⁻¹ |
| DA | 171.631808 | 174.9214992 | 174.1513635 | 174.6316391 | 1.04 |
| SSA | 174.5267321 | 174.9214992 | 174.7720952 | 174.7517588 | 1.25 × 10⁻¹ |
| SCA | 174.1631947 | 174.921241 | 174.5762605 | 174.5885636 | 2.10 × 10⁻¹ |
| NNA | 174.6348368 | 174.9214885 | 174.8893958 | 174.9163291 | 6.93 × 10⁻² |
| Algorithm | Worst | Best | Average | Median | Std. Dev. |
|---|---|---|---|---|---|
| NBA | 162.1491001 | 162.6744472 | 162.6044009 | 162.6744472 | 1.82 × 10⁻¹ |
| GWO | 162.6734733 | 162.6744472 | 162.6743693 | 162.6744472 | 2.15 × 10⁻⁴ |
| DA | 162.4635226 | 162.6744472 | 162.6453716 | 162.6744472 | 4.66 × 10⁻² |
| SSA | 162.6744472 | 162.6744472 | 162.6744472 | 162.6744472 | 5.78 × 10⁻¹⁴ |
| SCA | 162.1491001 | 162.6744472 | 162.6569356 | 162.6744472 | 9.59 × 10⁻² |
| NNA | 162.6744472 | 162.6744472 | 162.6744472 | 162.6744472 | 5.78 × 10⁻¹⁴ |
| Algorithm | Worst | Best | Average | Median | Std. Dev. |
|---|---|---|---|---|---|
| NBA | 1.605823622 | 1.605823622 | 1.605823622 | 1.605823622 | 2.26 × 10⁻¹⁶ |
| GWO | 1.605823622 | 1.605823622 | 1.605823622 | 1.605823622 | 2.26 × 10⁻¹⁶ |
| DA | 1.605823622 | 1.605823622 | 1.605823622 | 1.605823622 | 2.26 × 10⁻¹⁶ |
| SSA | 1.605823622 | 1.605823622 | 1.605823622 | 1.605823622 | 2.26 × 10⁻¹⁶ |
| SCA | 1.605823622 | 1.605823622 | 1.605823622 | 1.605823622 | 2.26 × 10⁻¹⁶ |
| NNA | 1.605823622 | 1.605823622 | 1.605823622 | 1.605823622 | 2.26 × 10⁻¹⁶ |
References
- Rao, R.; Rai, D. Optimization of fused deposition modeling process using teaching-learning-based optimization algorithm. Eng. Sci. Technol. Int. J. 2016, 19, 587–603. [Google Scholar] [CrossRef] [Green Version]
- Hambali, R.; Smith, P.; Rennie, A. Determination of the effect of part orientation to the strength value on additive manufacturing FFF for end-use parts by physical testing and validation via three-dimensional finite element analysis. Int. J. Mat. Eng. Innov. 2012, 3, 269–281. [Google Scholar] [CrossRef]
- Kim, G.; Oh, Y. A benchmark study on rapid prototyping processes and machines: Quantitative comparisons of mechanical properties, accuracy, roughness, speed, and material cost. Proc. Inst. Mech. Eng. B J. Eng. Manuf. 2008, 222, 201–215. [Google Scholar] [CrossRef]
- Pandey, P.; Thrimurthulu, K.; Reddy, N. Optimal part deposition orientation in FFF by using a multicriteria genetic algorithm. Int. J. Prod. Res. 2004, 42, 4069–4089. [Google Scholar] [CrossRef]
- Rayegani, F.; Onwubolu, G. Fused deposition modelling (FFF) process parameter prediction and optimization using group method for data handling (GMDH) and differential evolution (DE). Int. J. Adv. Manuf. Technol. 2014, 73, 509–519. [Google Scholar] [CrossRef]
- Rane, R.; Kulkarni, A.; Prajapati, H.; Taylor, R.; Jain, A.; Chen, V. Post-process effects of isothermal annealing and initially applied static uniaxial loading on the ultimate tensile strength of fused filament fabrication parts. Materials 2020, 13, 352. [Google Scholar] [CrossRef] [Green Version]
- Ahn, S.; Montero, M.; Odell, D.; Roundy, S.; Wright, P. Anisotropic material properties of fused deposition modeling ABS. Rapid. Prototyp. J. 2002, 8, 248–257. [Google Scholar] [CrossRef] [Green Version]
- Srinivasan, R.; Babu, B.; Annamalai, P.; Sivasankaran, S.; Tharaan, M. An experimental on the influence of process parameters on the tensile properties of carbon fiber reinforced PLA FFF parts. TEST Eng. Manag. 2019, 81, 4606–4611. [Google Scholar]
- Rao, V.; Geethika, V.; Krishnaveni, P. Multi-objective optimization of mechanical properties of aluminium 7075-based hybrid metal matrix composite using genetic algorithm. In Advances in 3D Printing and Additive Manufacturing Technologies, 1st ed.; Kumar, L., Ed.; Springer: Singapore, 2017. [Google Scholar]
- Natarajan, E.; Kaviarasan, V.; Lim, W.; Tiang, S.; Parasuraman, S.; Elango, S. Non-dominated sorting modified teaching–learning-based optimization for multi-objective machining of polytetrafluoroethylene (PTFE). J. Intell. Manuf. 2020, 31, 911–935. [Google Scholar] [CrossRef]
- Raju, M.; Gupta, M.; Bhanot, N.; Sharma, V. A hybrid PSO–BFO evolutionary algorithm for optimization of fused deposition modelling process parameters. J. Intell. Manuf. 2019, 30, 2743–2758. [Google Scholar] [CrossRef]
- García-Domínguez, A.; Claver, J.; Camacho, A.M.; Sebastián, M.A. Considerations on the applicability of test methods for mechanical characterization of materials manufactured by FDM. Materials 2020, 13, 28. [Google Scholar] [CrossRef] [PubMed] [Green Version]
- Yao, T.; Ye, J.; Deng, Z.; Zhang, K.; Ma, Y.; Ouyang, H. Tensile failure strength and separation angle of FDM 3D printing PLA material: Experimental and theoretical analyses. Compos. Part B Eng. 2020, 188, 107894. [Google Scholar] [CrossRef]
- Wickramasinghe, S.; Do, T.; Tran, P. FDM-based 3D printing of polymer and associated composite: A review on mechanical properties, defects and treatments. Polymers 2020, 12, 1529. [Google Scholar] [CrossRef] [PubMed]
- Zhang, W.; Wu, A.S.; Sun, J.; Quan, Z.; Gu, B.; Sun, B.; Cotton, C.; Heider, D.; Chou, T.-W. Characterization of residual stress and deformation in additively manufactured ABS polymer and composite specimens. Comp. Sci. Technol. 2017, 150, 102–110. [Google Scholar] [CrossRef]
- Rankouhi, B.; Javadpour, S.; Delfanian, F.; Letcher, T. Failure analysis and mechanical characterization of 3D printed ABS with respect to layer thickness and orientation. J. Fail. Anal. Prev. 2016, 16, 467–481. [Google Scholar] [CrossRef]
- Górski, F.; Kuczko, W.; Wichniarek, R. Impact strength of ABS parts manufactured using Fused Deposition Modeling technology. Arch. Mech. Technol. Autom. 2014, 31, 3–12. [Google Scholar]
- Christiyan, K.J.; Chandrasekhar, U.; Venkateswarlu, K. A study on the influence of process parameters on the Mechanical Properties of 3D printed ABS composite. IOP Conf. Mater. Sci. Eng. 2016, 114, 1–8. [Google Scholar] [CrossRef]
- Rodríguez-Panes, A.; Claver, J.; Camacho, A.M. The influence of manufacturing parameters on the mechanical behaviour of PLA and ABS pieces manufactured by FDM: A comparative analysis. Materials 2018, 11, 1333. [Google Scholar] [CrossRef] [Green Version]
- Shubham, P.; Sikidar, A.; Chand, T. The influence of layer thickness on mechanical properties of the 3D printed ABS polymer by fused deposition modeling. Key Eng. Mater. 2016, 706, 636–637. [Google Scholar] [CrossRef]
- Vidakis, N.; Petousis, M.; Vairis, A.; Savvakis, K.; Maniadi, A. A parametric determination of bending and Charpy’s impact strength of ABS and ABS-plus fused deposition modeling specimens. Prog. Add. Manuf. 2019, 4, 323–330. [Google Scholar] [CrossRef]
- Sadollah, A.; Sayyaadi, H.; Yadav, A. A dynamic metaheuristic optimization model inspired by biological nervous systems: Neural network algorithm. Appl. Soft Comput. 2018, 71, 747–782. [Google Scholar] [CrossRef]
- Available online: http://groups.csail.mit.edu/drl/wiki/images/3/3b/MSDS_P400ABSModel_1062730A.pdf (accessed on 27 January 2020).
- Panda, S.; Padhee, S.; Anoop, S.; Mahapatra, S. Optimization of fused deposition modelling (FFF) process parameters using bacterial foraging technique. Intell. Inf. Manag. 2009, 1, 89. [Google Scholar]
- Meng, X.; Gao, X.; Liu, Y.; Zhang, H. A novel bat algorithm with habitat selection and Doppler effect in echoes for optimization. Exp. Syst. Appl. 2015, 42, 6350–6364. [Google Scholar] [CrossRef]
- Mirjalili, S.; Mirjalili, S.; Lewis, A. Grey wolf optimizer. Adv. Eng. Soft 2014, 69, 46–61. [Google Scholar] [CrossRef] [Green Version]
- Mirjalili, S. Dragonfly algorithm: A new meta-heuristic optimization technique for solving single-objective, discrete, and multi-objective problems. Neural Comput. Appl. 2015, 27, 1053–1073. [Google Scholar] [CrossRef]
- Mirjalili, S.; Gandom, A.; Mirjalili, S.; Saremi, S.; Faris, H.; Mirjalili, S. Salp Swarm Algorithm: A bio-inspired optimizer for engineering design problems. Adv. Eng. Soft 2017, 114, 163–191. [Google Scholar] [CrossRef]
- Mirjalili, S. SCA: A Sine cosine algorithm for solving optimization problems. Know Base Syst. 2016, 96, 120–133. [Google Scholar] [CrossRef]
- Boschetto, A.; Giordano, V.; Veniali, F. Surface roughness prediction in fused deposition modelling by neural networks. Int. J. Adv. Manuf. Technol. 2013, 67, 2727–2742. [Google Scholar] [CrossRef]
- Samykano, M.; Selvamani, S.K.; Kadirgama, K.; Ngui, W.K.; Kanagaraj, G.; Sudhakar, K. Mechanical property of FDM printed ABS: Influence of printing parameters. Int. J. Adv. Manuf. Technol. 2019, 102, 2779–2796. [Google Scholar] [CrossRef]


| Algorithm | Parameters |
|---|---|
| NBA | NP = 20–40; D = 5; Gmax = 100–500; = 0.5; = 0.5; α = γ = 0.9; |
| GWO | NP = 20–40; D = 5; Gmax = 100–500; a = [0,1,2] |
| DA SSA SCA | NP = 20–40; D = 5; Gmax = 100–500; w = [0.4–0.9], s = 0.1, a = 0.1, c = 0.7, f = 1, e = 1 NP = 20–40; D = 5; Gmax = 100–500; c1, c2, c3 = [0,1] NP = 20–40; D = 5; Gmax = 100–500; a = 2 |
| NNA | NP = 20–40; D = 5; Gmax = 100–500; = [1–0.05]; = 0.99 |
| Process Parameters | Units | NBA | GWO | DA | SSA | SCA | NNA |
|---|---|---|---|---|---|---|---|
| x1 | mm | 0.127 | 0.127 | 0.127 | 0.127 | 0.127 | 0.127 |
| x2 | degrees | 9.557223075 | 9.556302041 | 9.555264322 | 9.554816312 | 9.418607509 | 9.557224815 |
| x3 | degrees | 60 | 60 | 60 | 60 | 60 | 60 |
| x4 | mm | 0.4064 | 0.4064 | 0.4064 | 0.4064 | 0.4064 | 0.4064 |
| x5 | mm | 0.008 | 0.008 | 0.008 | 0.008 | 0.008 | 0.008 |
| y | --- | 1.605823622 | 1.605823622 | 1.605823622 | 1.605823622 | 1.605823622 | 1.605823622 |
| Process Parameters | Units | NBA | GWO | DA | SSA | SCA | NNA |
|---|---|---|---|---|---|---|---|
| x1 | mm | 0.127 | 0.127 | 0.127 | 0.127 | 0.127 | 0.127 |
| x2 | degrees | 0 | 0 | 0 | 0 | 0 | 0 |
| x3 | degrees | 60 | 60 | 60 | 60 | 60 | 60 |
| x4 | mm | 0.4064 | 0.4064 | 0.4064 | 0.4064 | 0.4064 | 0.4064 |
| x5 | mm | 0.008 | 0.008 | 0.008 | 0.008 | 0.008 | 0.008 |
| y | - | 162.6744472 | 162.6744472 | 162.6744472 | 162.6744472 | 162.6744472 | 162.6744472 |
| Process Parameters | Units | NBA | GWO | DA | SSA | SCA | NNA |
|---|---|---|---|---|---|---|---|
| x1 | mm | 0.254 | 0.254 | 0.254 | 0.254 | 0.254 | 0.254 |
| x2 | degrees | 30 | 30 | 30 | 30 | 30 | 30 |
| x3 | degrees | 60 | 60 | 60 | 60 | 60 | 60 |
| x4 | mm | 0.5064 | 0.5064 | 0.5064 | 0.5064 | 0.5064 | 0.5064 |
| x5 | mm | 0.007951741 | 0.007951741 | 0.007951741 | 0.007951741 | 0.007951741 | 0.007951741 |
| y | - | 1.605823622 | 1.605823622 | 1.605823622 | 1.605823622 | 1.605823622 | 1.605823622 |
| Algorithm | Worst | Best | Average | Median | Std. Dev. |
|---|---|---|---|---|---|
| NBA | 174.6234301 | 174.9214992 | 174.9016279 | 174.9214992 | 7.56 × 10⁻² |
| GWO | 174.6234298 | 174.9214992 | 174.911563 | 174.9214991 | 5.44 × 10⁻² |
| DA | 174.6234301 | 174.9214992 | 174.8800297 | 174.9214992 | 9.72 × 10⁻² |
| SSA | 174.6761253 | 174.9214992 | 174.8844652 | 174.9214992 | 7.32 × 10⁻² |
| SCA | 174.6177085 | 174.9214213 | 174.7818994 | 174.8788781 | 1.44 × 10⁻¹ |
| NNA | 174.9214992 | 174.9214992 | 174.9214992 | 174.9214992 | 1.89 × 10⁻¹⁰ |
| Algorithm | Worst | Best | Average | Median | Std. Dev. |
|---|---|---|---|---|---|
| NBA | 162.1491001 | 162.6744472 | 162.6044009 | 162.6744472 | 1.82 × 10⁻¹ |
| GWO | 162.6744472 | 162.6744472 | 162.6744472 | 162.6744472 | 5.78 × 10⁻¹⁵ |
| DA | 162.6278193 | 162.6744472 | 162.6727806 | 162.6744472 | 8.51 × 10⁻³ |
| SSA | 162.6744472 | 162.6744472 | 162.6744472 | 162.6744472 | 5.78 × 10⁻¹⁴ |
| SCA | 162.6744472 | 162.6744472 | 162.6744472 | 162.6744472 | 5.78 × 10⁻¹⁴ |
| NNA | 162.6744472 | 162.6744472 | 162.6744472 | 162.6744472 | 5.78 × 10⁻¹⁴ |
| Algorithm | Worst | Best | Average | Median | Std. Dev. |
|---|---|---|---|---|---|
| NBA | 1.605823622 | 1.605823622 | 1.605823622 | 1.605823622 | 2.26 × 10⁻¹⁶ |
| GWO | 1.605823622 | 1.605823622 | 1.605823622 | 1.605823622 | 2.26 × 10⁻¹⁶ |
| DA | 1.605823622 | 1.605823622 | 1.605823622 | 1.605823622 | 2.26 × 10⁻¹⁶ |
| SSA | 1.605823622 | 1.605823622 | 1.605823622 | 1.605823622 | 2.26 × 10⁻¹⁶ |
| SCA | 1.605823622 | 1.605823622 | 1.605823622 | 1.605823622 | 2.26 × 10⁻¹⁶ |
| NNA | 1.605823622 | 1.605823622 | 1.605823622 | 1.605823622 | 2.26 × 10⁻¹⁶ |
| S. No. | Fixed Parameter | Value |
|---|---|---|
| 1 | Extrusion temperature | 230 °C |
| 2 | Bed temperature | 80 °C |
| 3 | Ambient temperature | 25 °C |
| 4 | Infill type | Rectilinear |
| 5 | Printing speed | 50 mm/s |
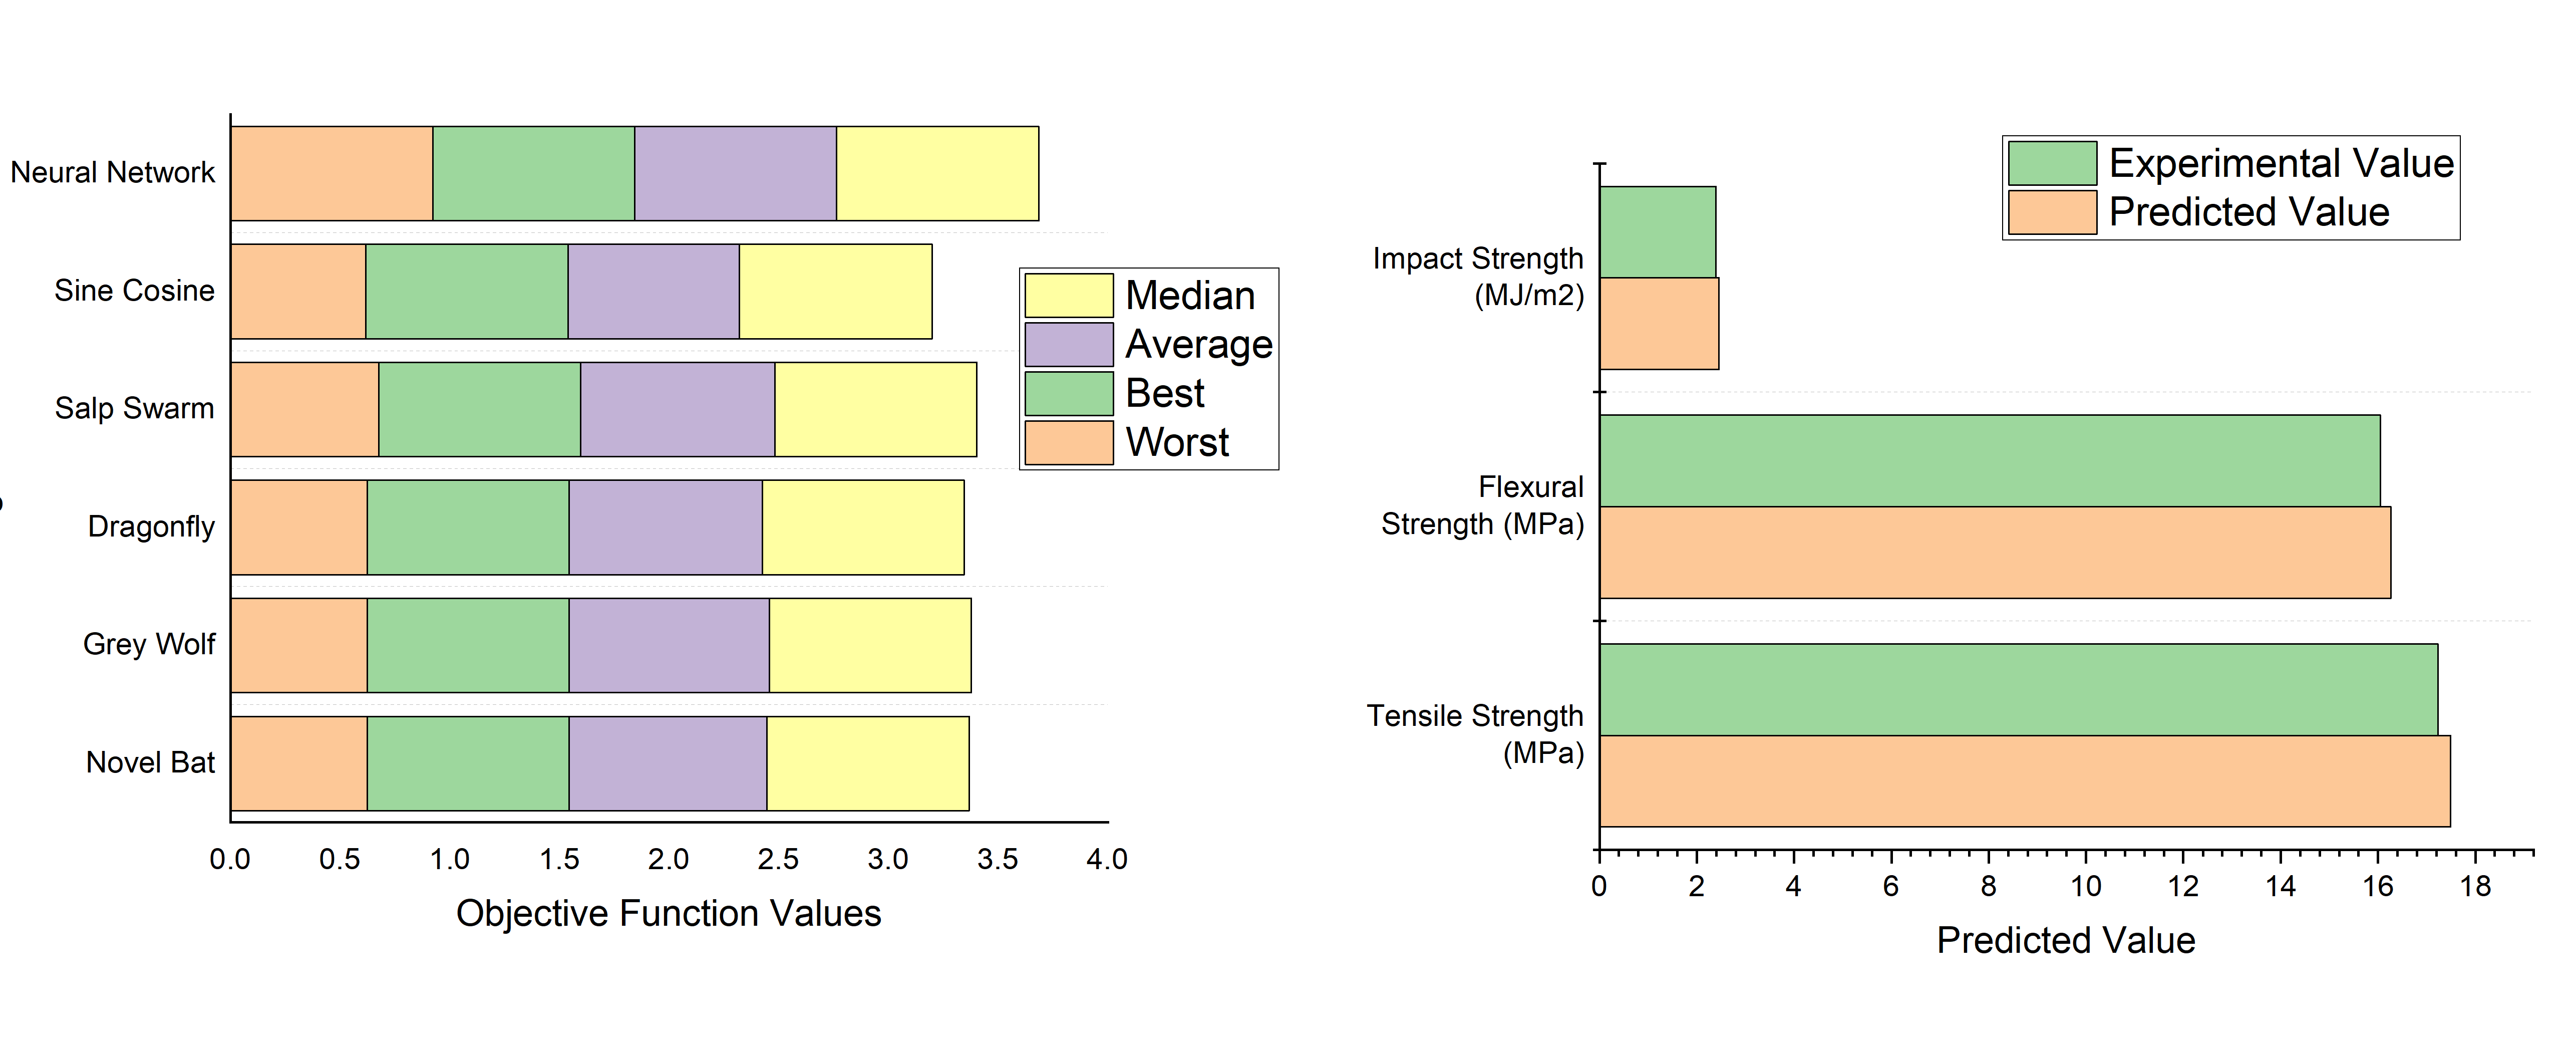
| Sample No. | Layer Thickness (mm) | Orientation Angle (°) | Raster Angle (°) | Raster Width (mm) | Air Gap (mm) | Predicted Value | Experimental Value | Error (%) |
|---|---|---|---|---|---|---|---|---|
| 1 | 0.127 | 9.55 | 60 | 0.4064 | 0.008 | 17.49 | 17.23 | 1.61 |
| 2 | 0.127 | 0 | 60 | 0.4064 | 0.008 | 16.26 | 16.05 | 1.3 |
| 3 | 0.254 | 30 | 60 | 0.5064 | 0.0079 | 2.46 | 2.39 | 2.92 |
© 2020 by the authors. Licensee MDPI, Basel, Switzerland. This article is an open access article distributed under the terms and conditions of the Creative Commons Attribution (CC BY) license (http://creativecommons.org/licenses/by/4.0/).
Share and Cite
Chohan, J.S.; Mittal, N.; Kumar, R.; Singh, S.; Sharma, S.; Singh, J.; Rao, K.V.; Mia, M.; Pimenov, D.Y.; Dwivedi, S.P. Mechanical Strength Enhancement of 3D Printed Acrylonitrile Butadiene Styrene Polymer Components Using Neural Network Optimization Algorithm. Polymers 2020, 12, 2250. https://doi.org/10.3390/polym12102250
Chohan JS, Mittal N, Kumar R, Singh S, Sharma S, Singh J, Rao KV, Mia M, Pimenov DY, Dwivedi SP. Mechanical Strength Enhancement of 3D Printed Acrylonitrile Butadiene Styrene Polymer Components Using Neural Network Optimization Algorithm. Polymers. 2020; 12(10):2250. https://doi.org/10.3390/polym12102250
Chicago/Turabian StyleChohan, Jasgurpreet Singh, Nitin Mittal, Raman Kumar, Sandeep Singh, Shubham Sharma, Jujhar Singh, Kalagadda Venkateswara Rao, Mozammel Mia, Danil Yurievich Pimenov, and Shashi Prakash Dwivedi. 2020. "Mechanical Strength Enhancement of 3D Printed Acrylonitrile Butadiene Styrene Polymer Components Using Neural Network Optimization Algorithm" Polymers 12, no. 10: 2250. https://doi.org/10.3390/polym12102250