On the Strain Rate Sensitivity of Fused Filament Fabrication (FFF) Processed PLA, ABS, PETG, PA6, and PP Thermoplastic Polymers


 , ,
, , 
Abstract
:1. Introduction
2. Materials and Methods
2.1. Materials
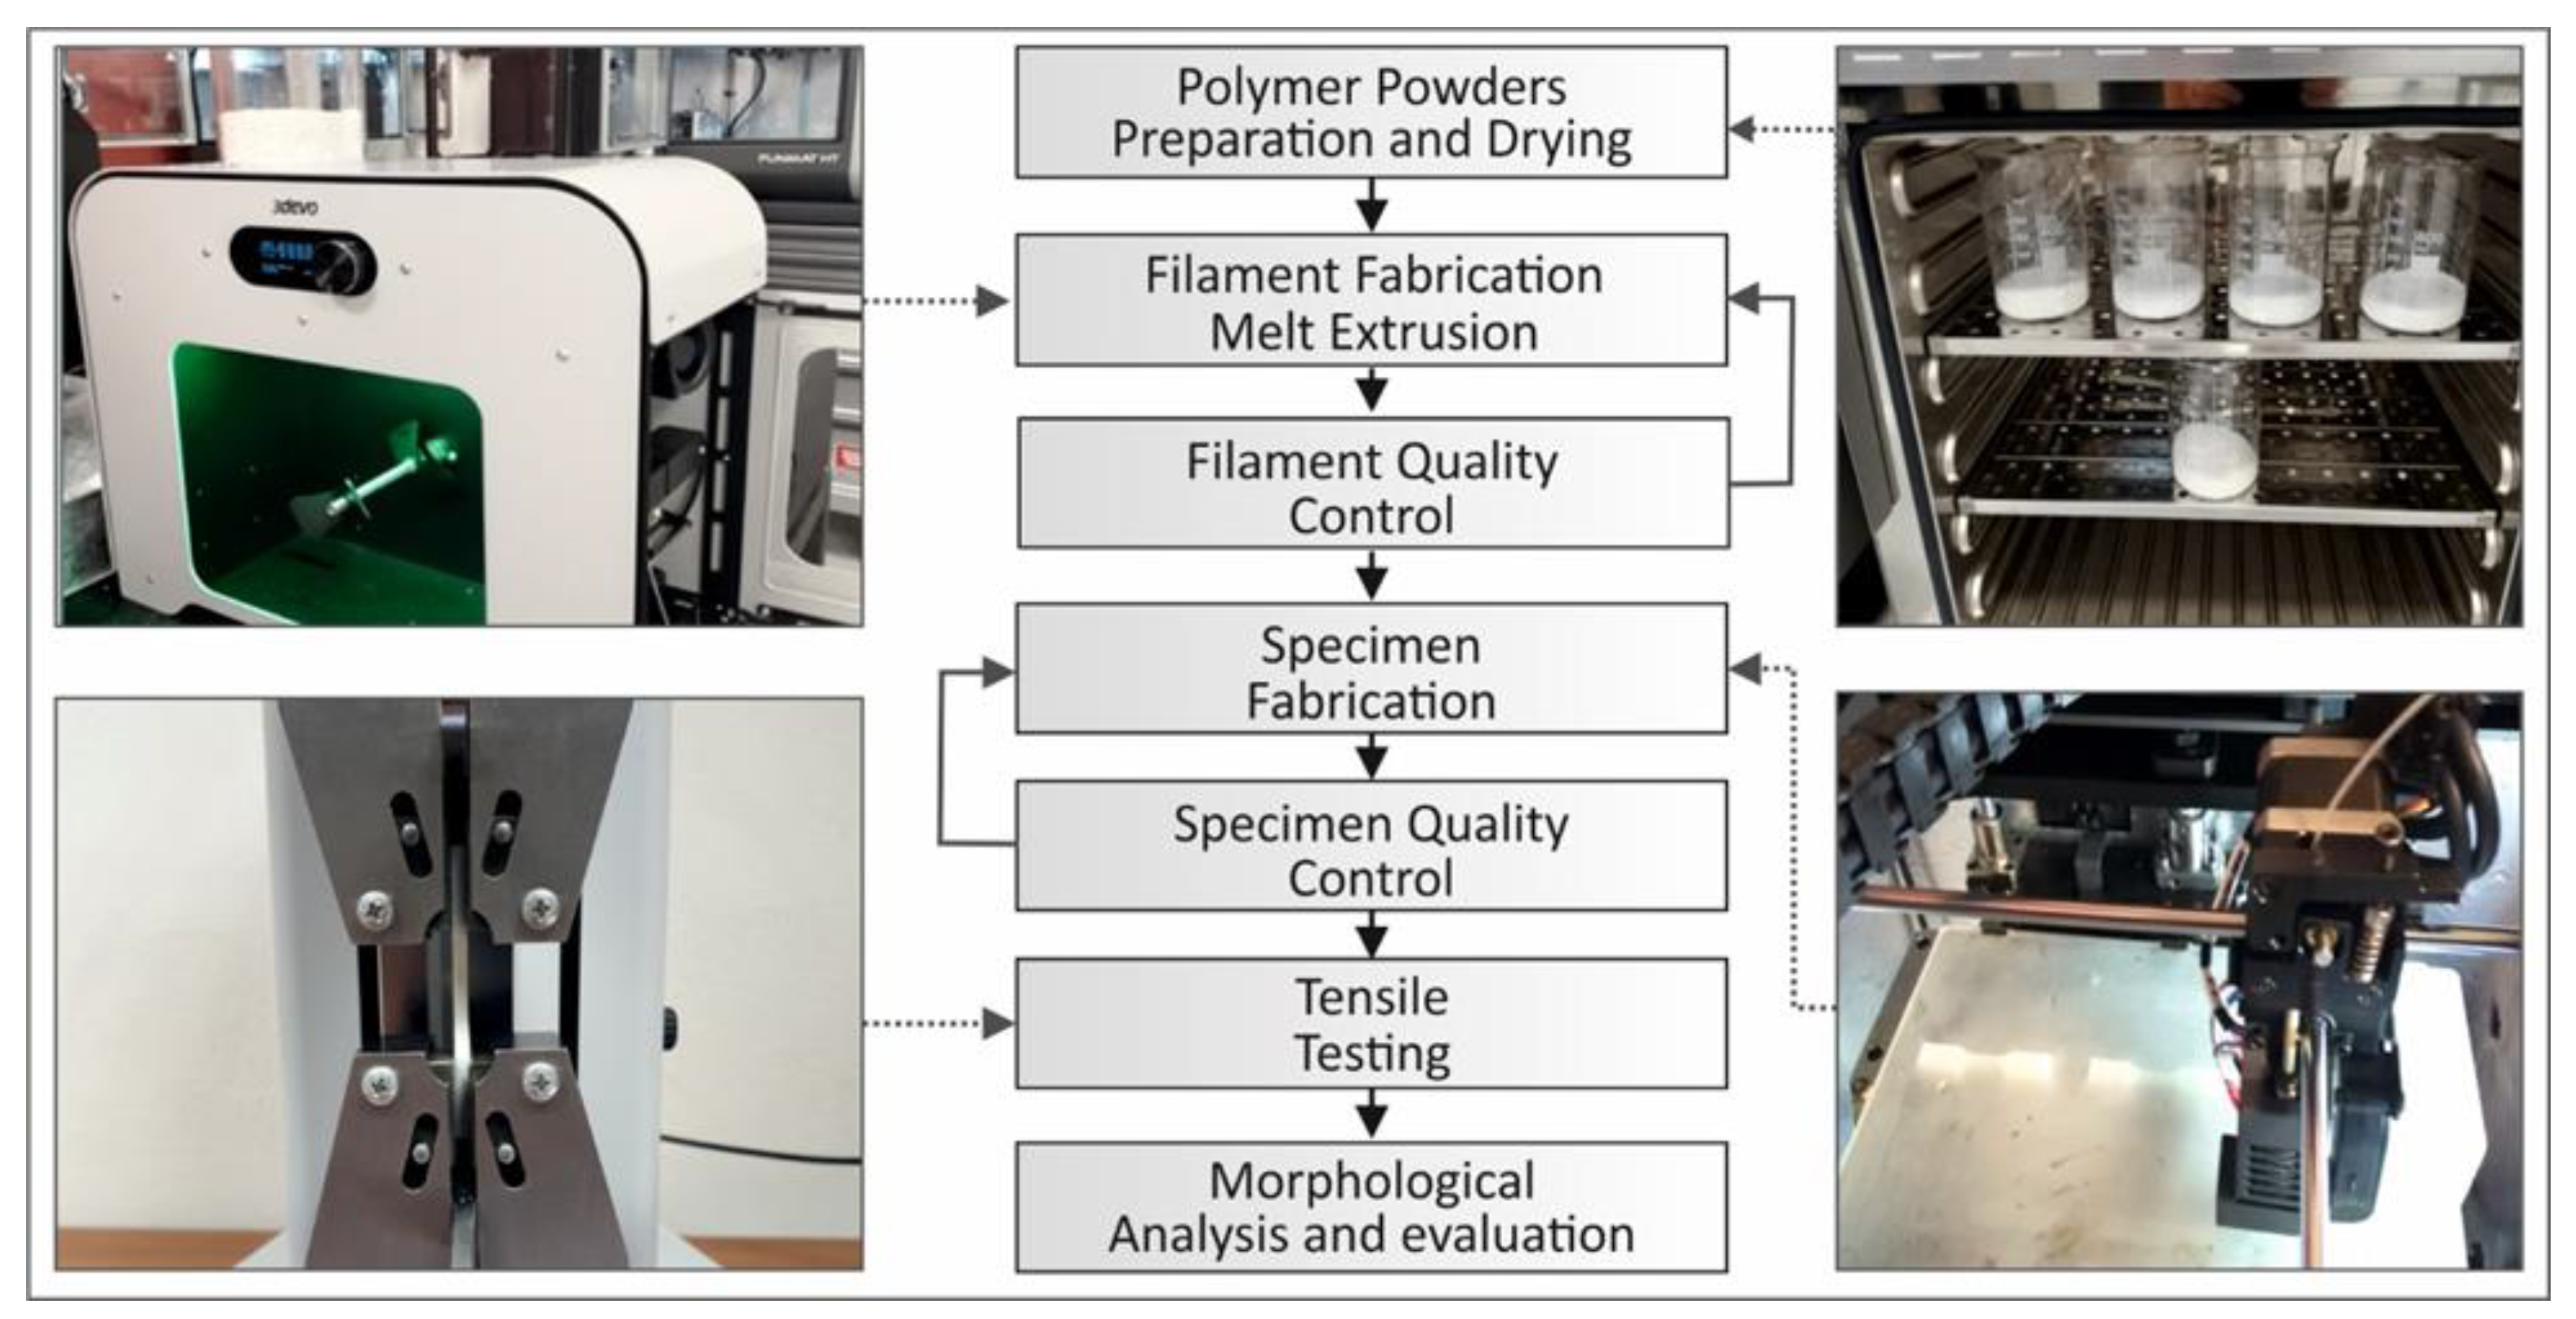
2.2. Methods
2.2.1. Extrusion Procedure
2.2.2. Tensile Specimens’ Fabrication
2.2.3. Testing Procedure
2.2.4. Characterization Techniques
3. Results
3.1. PLA: Tensile Properties as a Function of the Strain Rate
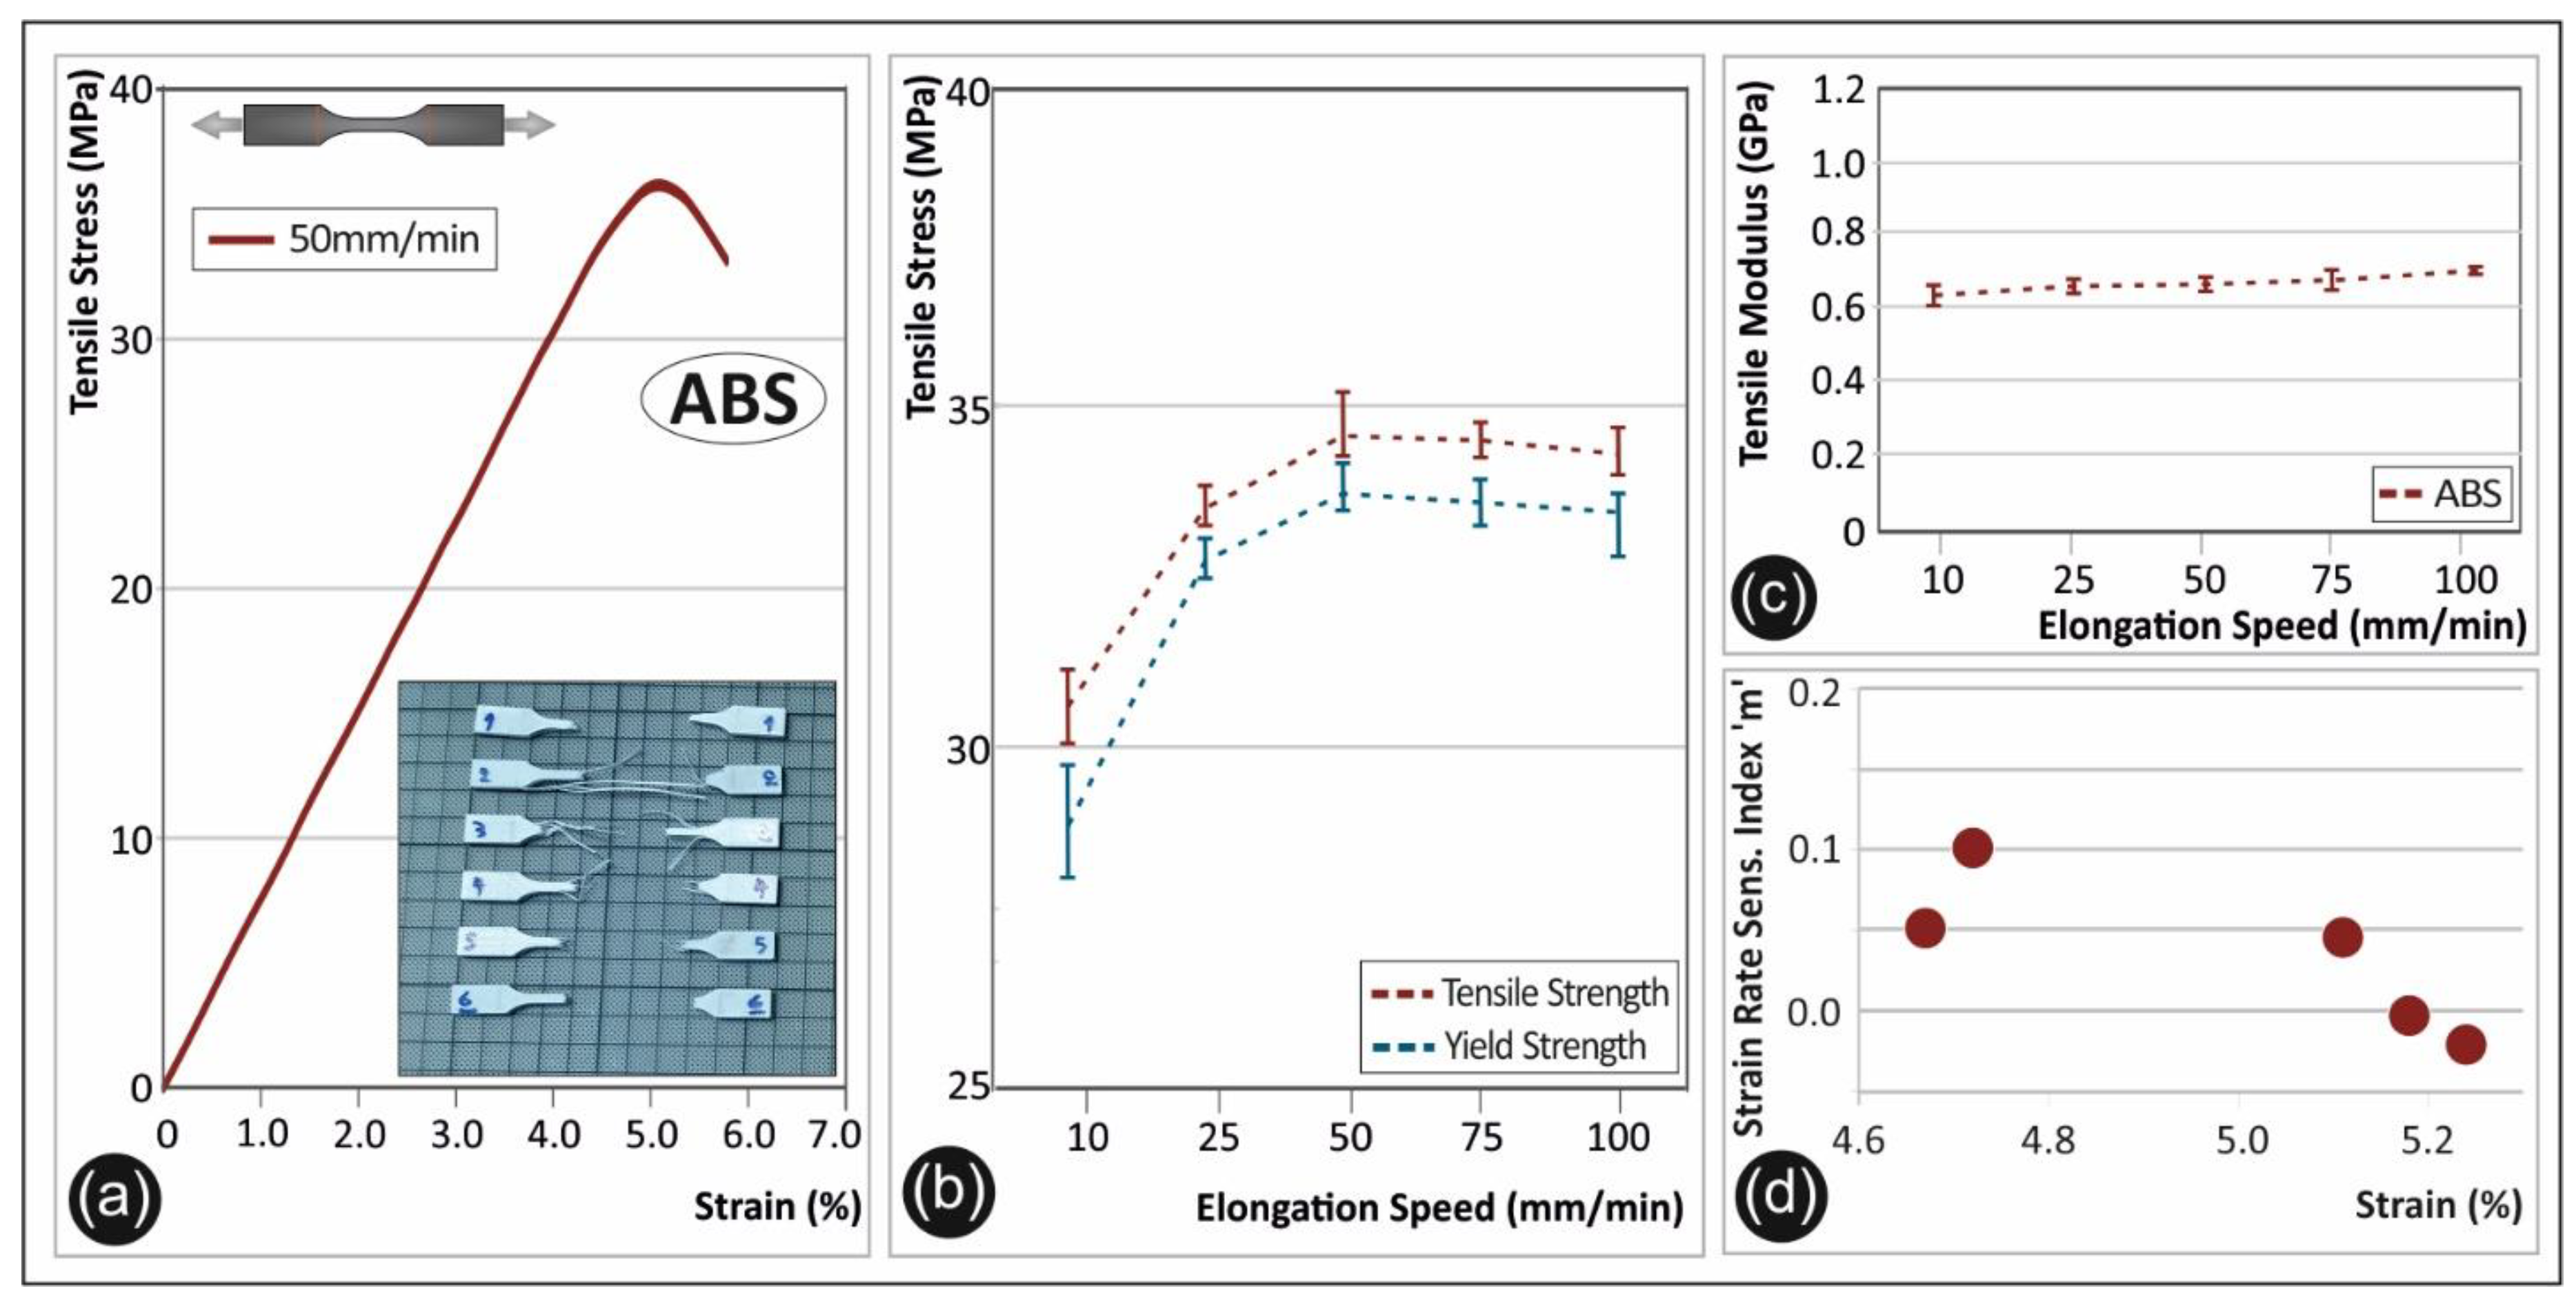
3.2. ABS: Tensile Properties as a Function of the Strain Rate
3.3. PETG: Tensile Properties as a Function of the Strain Rate
3.4. PA6: Tensile Properties as a Function of the Strain Rate
3.5. PP: Tensile Properties as a Function of the Strain Rate
3.6. SEM Morphological Characterization
3.7. Fractography Microstructure Investigations
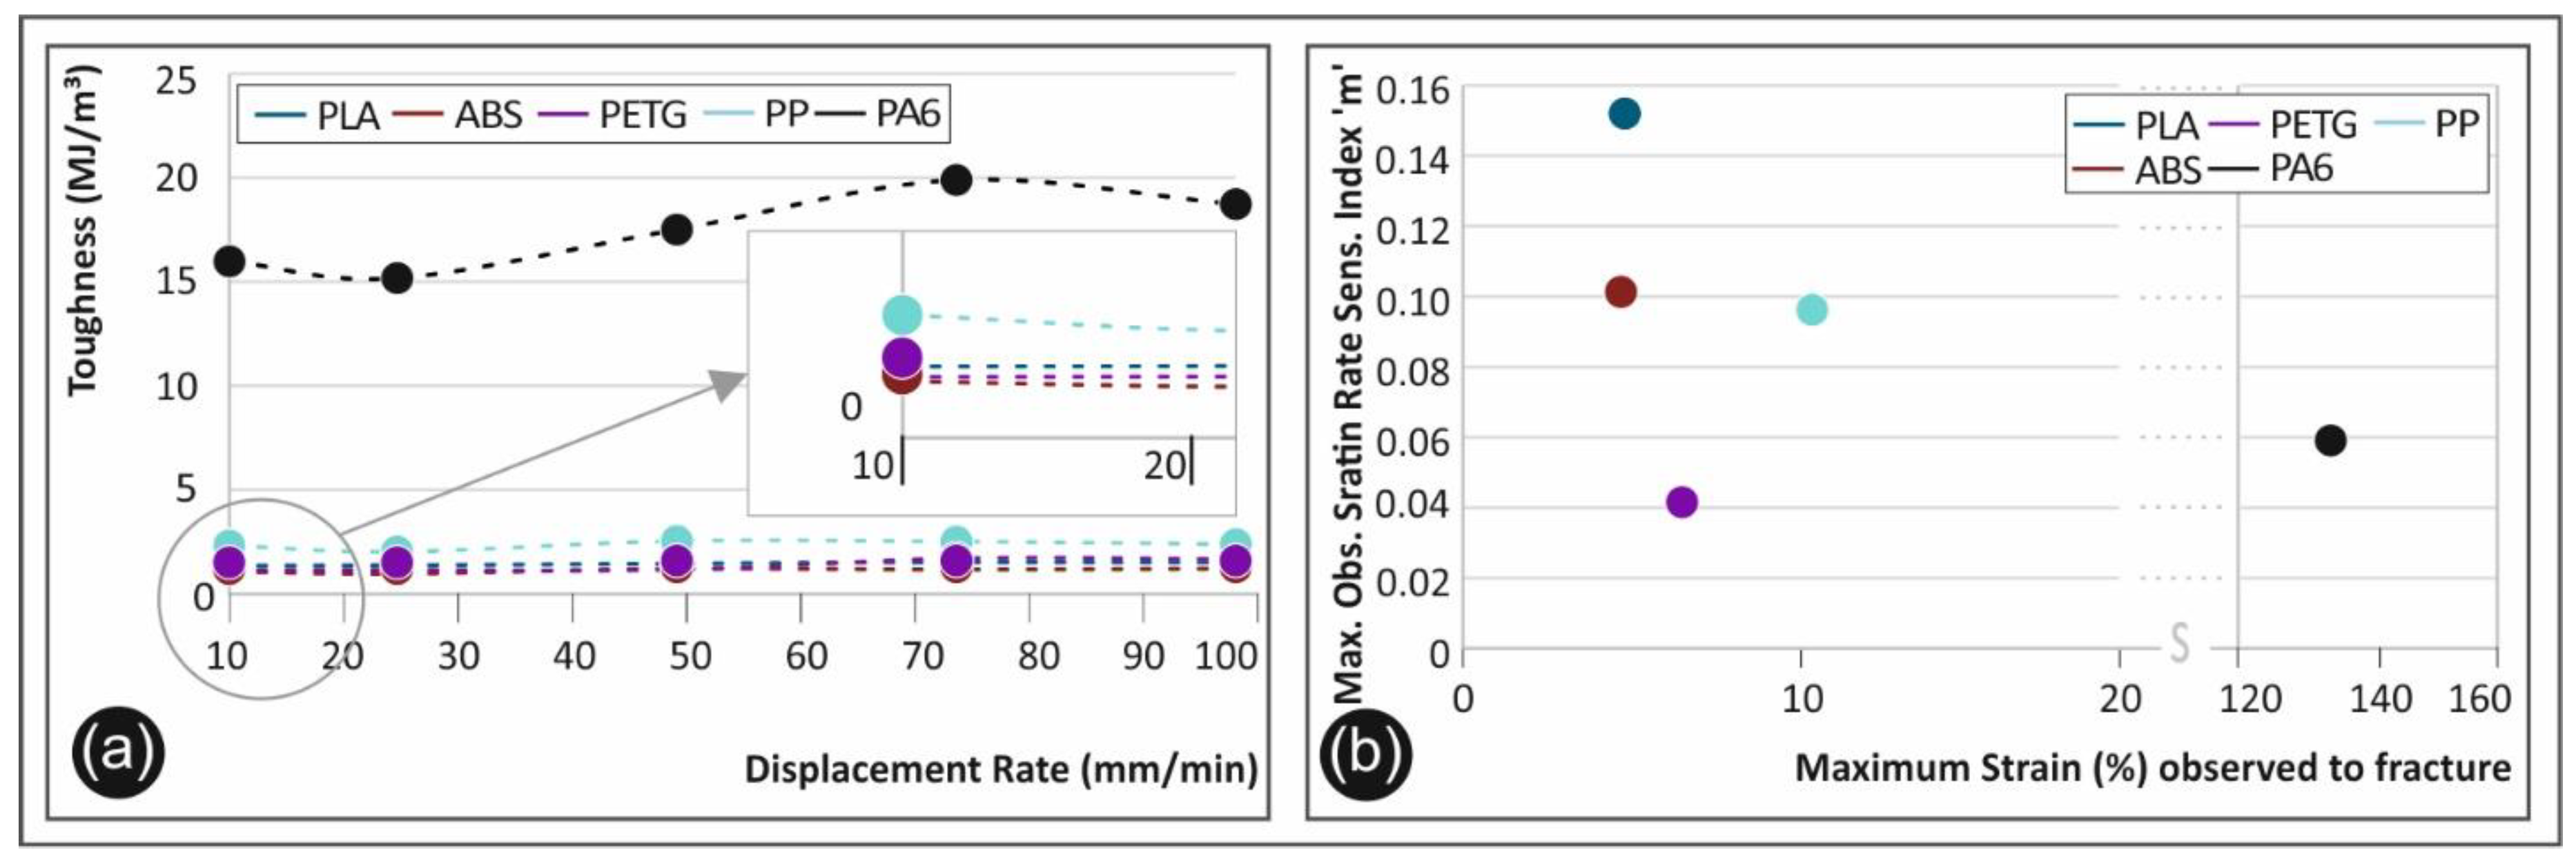
4. Discussion
5. Conclusions
Author Contributions
Funding
Conflicts of Interest
References
- Sood, A.K.; Ohdar, R.K.; Mahapatra, S.S. Experimental investigation and empirical modelling of FDM process for compressive strength improvement. J. Adv. Res. 2012, 3, 81–90. [Google Scholar] [CrossRef] [Green Version]
- Attaran, M. The rise of 3-D printing: The advantages of additive manufacturing over traditional manufacturing. Bus. Horiz. 2017, 60, 677–688. [Google Scholar] [CrossRef]
- Rezgui, F.; Swistek, M.; Hiver, J.M.; G’Sell, C.; Sadoun, T. Deformation and damage upon stretching of degradable polymers (PLA and PCL). Polymer (guildf.) 2005, 46, 7370–7385. [Google Scholar] [CrossRef]
- Vairis, A.; Petousis, M.; Vidakis, N.; Savvakis, K. On the strain rate sensitivity of abs and abs plus fused deposition modeling parts. J. Mater. Eng. Perform. 2016, 25, 3558–3565. [Google Scholar] [CrossRef]
- Ching, E.C.Y.; Li, R.K.Y.; Mai, Y.W. Effects of gauge length and strain rate on fracture toughness of olyethylene Terephthalate Glycol (PETG) film using the essential work of fracture analysis. Polym. Eng. Sci. 2000, 40, 310–319. [Google Scholar] [CrossRef]
- Shan, G.F.; Yang, W.; Yang, M.B.; Xie, B.H.; Feng, J.M.; Fu, Q. Effect of temperature and strain rate on the tensile deformation of polyamide 6. Polymer (guildf.) 2007, 48, 2958–2968. [Google Scholar] [CrossRef]
- Dasari, A.; Misra, R.D.K. On the strain rate sensitivity of high density polyethylene and polypropylenes. Mater. Sci. Eng. A 2003, 358, 356–371. [Google Scholar] [CrossRef]
- Zou, R.; Xia, Y.; Liu, S.; Hu, P.; Hou, W.; Hu, Q.; Shan, C. Isotropic and anisotropic elasticity and yielding of 3D printed material. Compos. Part B Eng. 2016, 99, 506–513. [Google Scholar] [CrossRef]
- Song, Y.; Li, Y.; Song, W.; Yee, K.; Lee, K.Y.; Tagarielli, V.L. Measurements of the mechanical response of unidirectional 3D-printed PLA. Mater. Des. 2017, 123, 154–164. [Google Scholar] [CrossRef]
- Vairis, A.; Savvakis, C.; Petousis, M.; Vidakis, N.; Bikmeyev, A. Experimental determination of the tensile strength of fused deposition modeling parts. In Proceedings of the ASME 2014 International Mechanical Engineering Congress & Exposition, Montreal, QC, Canada, 14–20 November 2014. [Google Scholar] [CrossRef]
- Vidakis, N.; Petousis, M.; Vairis, A.; Savvakis, C.; Maniadi, A. A Parametric determination of bending and Charpy’s impact strength of ABS and ABS-plus fused deposition modeling specimens. Prog. Addit. Manuf. J. 2019, 4, 323–330. [Google Scholar] [CrossRef]
- Vidakis, N.; Petousis, M.; Vairis, A.; Savvakis, K.; Maniadi, A. On the compressive behavior of an FDM Steward Platform part. J. Comput. Des. Eng. 2017, 4, 339–346. [Google Scholar] [CrossRef]
- Lanzotti, A.; Grasso, M.; Staiano, G.; Martorelli, M. The impact of process parameters on mechanical properties of parts fabricated in PLA with an open-source 3-D printer. Rapid Prototyp. J. 2015, 21, 604–617. [Google Scholar] [CrossRef] [Green Version]
- Hibbert, K.; Warner, G.; Brown, C.; Ajide, O.; Owolabi, G.; Azimi, A. The effects of build parameters and strain rate on the mechanical properties of FDM 3D-Printed acrylonitrile Butadiene Styrene. Open J. Org. Polym. Mater. 2019, 9, 1–27. [Google Scholar] [CrossRef] [Green Version]
- Johnson, G.A.; French, J.J. Evaluation of infill effect on mechanical properties of consumer 3D printing materials. Adv. Technol. Innov. 2018, 3, 179–184. [Google Scholar]
- Carneiro, O.S.; Silva, A.F.; Gomes, R. Fused deposition modeling with polypropylene. Mater. Des. 2015, 83, 768–776. [Google Scholar] [CrossRef]
- Vu-Khanh, T.; Fisa, B. Impact fracture of glass-flake reinforced polypropylene. Polym. Compos. 1986, 7, 375–382. [Google Scholar] [CrossRef]
- Todo, M.; Nakamura, T.; Takahashi, K. Mode II interlaminar fracture behavior of fiber reinforced polyamide composites under static and dynamic loading conditions. J. Reinf. Plast. Compos. 1999, 18, 1415–1427. [Google Scholar] [CrossRef]
- Cantwell, W.J.; Blyton, M. Influence of loading rate on the interlaminar fracture properties of high performance composites—A review. Appl. Mech. Rev. 1999, 52, 199–212. [Google Scholar] [CrossRef]
- Shokrieh, M.M.; Omidi, M.J. Tension behavior of unidirectional glass/epoxy composites under different strain rates. Compos. Struct. 2009, 88, 595–601. [Google Scholar] [CrossRef]
- Yang, B.J.; Kim, B.R.; Lee, H.K. Predictions of viscoelastic strain rate dependent behavior of fiber-reinforced polymeric composites. Compos. Struct. 2012, 94, 1420–1429. [Google Scholar] [CrossRef]
- Chen, J.F.; Morozov, E.V. A consistency elasto-viscoplastic damage model for progressive failure analysis of composite laminates subjected to various strain rate loadings. Compos. Struct. 2016, 148, 224–235. [Google Scholar] [CrossRef]
- Ploeckl, M.; Kuhn, P.; Grosser, J.; Wolfahrt, M.; Koerber, H. A dynamic test methodology for analyzing the strain-rate effect on the longitudinal compressive behavior of fiber-reinforced composites. Compos. Struct. 2017, 180, 429–438. [Google Scholar] [CrossRef]
- Wang, K.; Xie, X.; Wang, J.; Zhao, A.; Peng, Y.; Rao, Y. Effects of infill characteristics and strain rate on the deformation and failure properties of additively manufactured polyamide-based composite structures. Results Phys. 2020, 18, 103346. [Google Scholar] [CrossRef]
- Carrasco, P.M.; Tzounis, L.; Mompean, F.J.; Strati, K.; Georgopanos, P.; Garcia-Hernandez, M.; Stamm, M.; Cabañero, G.; Odriozola, I.; Avgeropoulos, A.; et al. Thermoset magnetic materials based on poly(ionic liquid)s block copolymers. Macromolecules 2013, 46, 1860–1867. [Google Scholar] [CrossRef]
- Goh, G.D.; Yap, Y.L.; Tan, H.K.J.; Sing, S.L.; Goh, G.L.; Yeong, W.Y. Process–structure–properties in polymer additive manufacturing via material extrusion: A review. Crit. Rev. Solid State Mater. Sci. 2020, 45, 113–133. [Google Scholar] [CrossRef]


| PLA | ABS | PETG | PA6 | PP | |
|---|---|---|---|---|---|
| Extruder Heat Zone 1 | 170 °C | 190 °C | 180 °C | 190 °C | 195 °C |
| Extruder Heat Zone 2 | 190 °C | 230 °C | 200 °C | 220 °C | 205 °C |
| Extruder Heat Zone 3 | 190 °C | 240 °C | 200 °C | 220 °C | 205 °C |
| Extruder Heat Zone 4 | 170 °C | 220 °C | 180 °C | 190 °C | 195 °C |
| Screw Rotation Speed (rpm) | 5 | 5 | 5 | 3.5 | 3 |
| PLA | ABS | PETG | PA6 | PP | |
|---|---|---|---|---|---|
| Print Speed (mm/s) | 40 | 40 | 40 | 40 | 30 |
| Hotend Temperature (°C) | 215 | 260 | 240 | 235 | 230 |
| Bed Temperature (°C) | 60 | 80 | 70 | 60 | 105 |
Publisher’s Note: MDPI stays neutral with regard to jurisdictional claims in published maps and institutional affiliations. |
© 2020 by the authors. Licensee MDPI, Basel, Switzerland. This article is an open access article distributed under the terms and conditions of the Creative Commons Attribution (CC BY) license (http://creativecommons.org/licenses/by/4.0/).
Share and Cite
Vidakis, N.; Petousis, M.; Velidakis, E.; Liebscher, M.; Mechtcherine, V.; Tzounis, L. On the Strain Rate Sensitivity of Fused Filament Fabrication (FFF) Processed PLA, ABS, PETG, PA6, and PP Thermoplastic Polymers. Polymers 2020, 12, 2924. https://doi.org/10.3390/polym12122924
Vidakis N, Petousis M, Velidakis E, Liebscher M, Mechtcherine V, Tzounis L. On the Strain Rate Sensitivity of Fused Filament Fabrication (FFF) Processed PLA, ABS, PETG, PA6, and PP Thermoplastic Polymers. Polymers. 2020; 12(12):2924. https://doi.org/10.3390/polym12122924
Chicago/Turabian StyleVidakis, Nectarios, Markos Petousis, Emmanouil Velidakis, Marco Liebscher, Viktor Mechtcherine, and Lazaros Tzounis. 2020. "On the Strain Rate Sensitivity of Fused Filament Fabrication (FFF) Processed PLA, ABS, PETG, PA6, and PP Thermoplastic Polymers" Polymers 12, no. 12: 2924. https://doi.org/10.3390/polym12122924