1. Introduction
In the last few decades, the manufacturing sector has witnessed a paradigm shift from conventional to advanced manufacturing techniques in both developed and developing nations. Another breakthrough was achieved by researchers after developing additive manufacturing (AM) technologies, which is gradually taking the present industry into the era of Industry 4.0 [
1]. The ever-increasing demand for good quality and customized products at lower cost has brought additive manufacturing technologies into the limelight. AM primarily solves the problem of long delay periods between customer demands and product development. During new product development, conventionally, it must pass through many stages, which are eliminated in AM, even for complex parts [
2]. This technology used digital fabrication methods where the computer-generated design of the required product is created through a layer-by-layer manufacturing technique. There is no requirement for jigs, fixtures, dies and other tools for processing. Researchers have even successfully developed multiple valve attachments for ventilators during emergency conditions, such as pandemic occurred in 2020 [
3]. Thus, the rapid delivery of high-quality customized products while maintaining minimum cost is the reason for the supremacy of these techniques.
Fused-filament fabrication (FFF) is the most popular AM technology, which works on the principle of layer-by-layer manufacturing as designated by ASTM [
4]. This technology can transfer conceptual digital drawing into an actual product within a few hours using a wide range of polymers and polymer composite filaments as raw material. The fiber and particle-reinforced composites find vast applications in the areas of medicine, aerospace, automobile and electronics [
5,
6]. Moreover, carbon-reinforced composites fabricated using FFF are more cost-efficient than powdered alloys used in metal printers [
7]. Due to its material flexibility, easy transportation, minimal environmental degradation, lower installation and material cost [
8], researchers have used it extensively while developing smart materials, metamaterials, implants, and other biomaterials for medical applications. Medical 3D printing is gaining popularity as customized anatomical models are prepared with higher accuracy and minimum lead time [
9]. The inclusion of materials with sensing capabilities in 3D printing has realized the dream of producing smart materials [
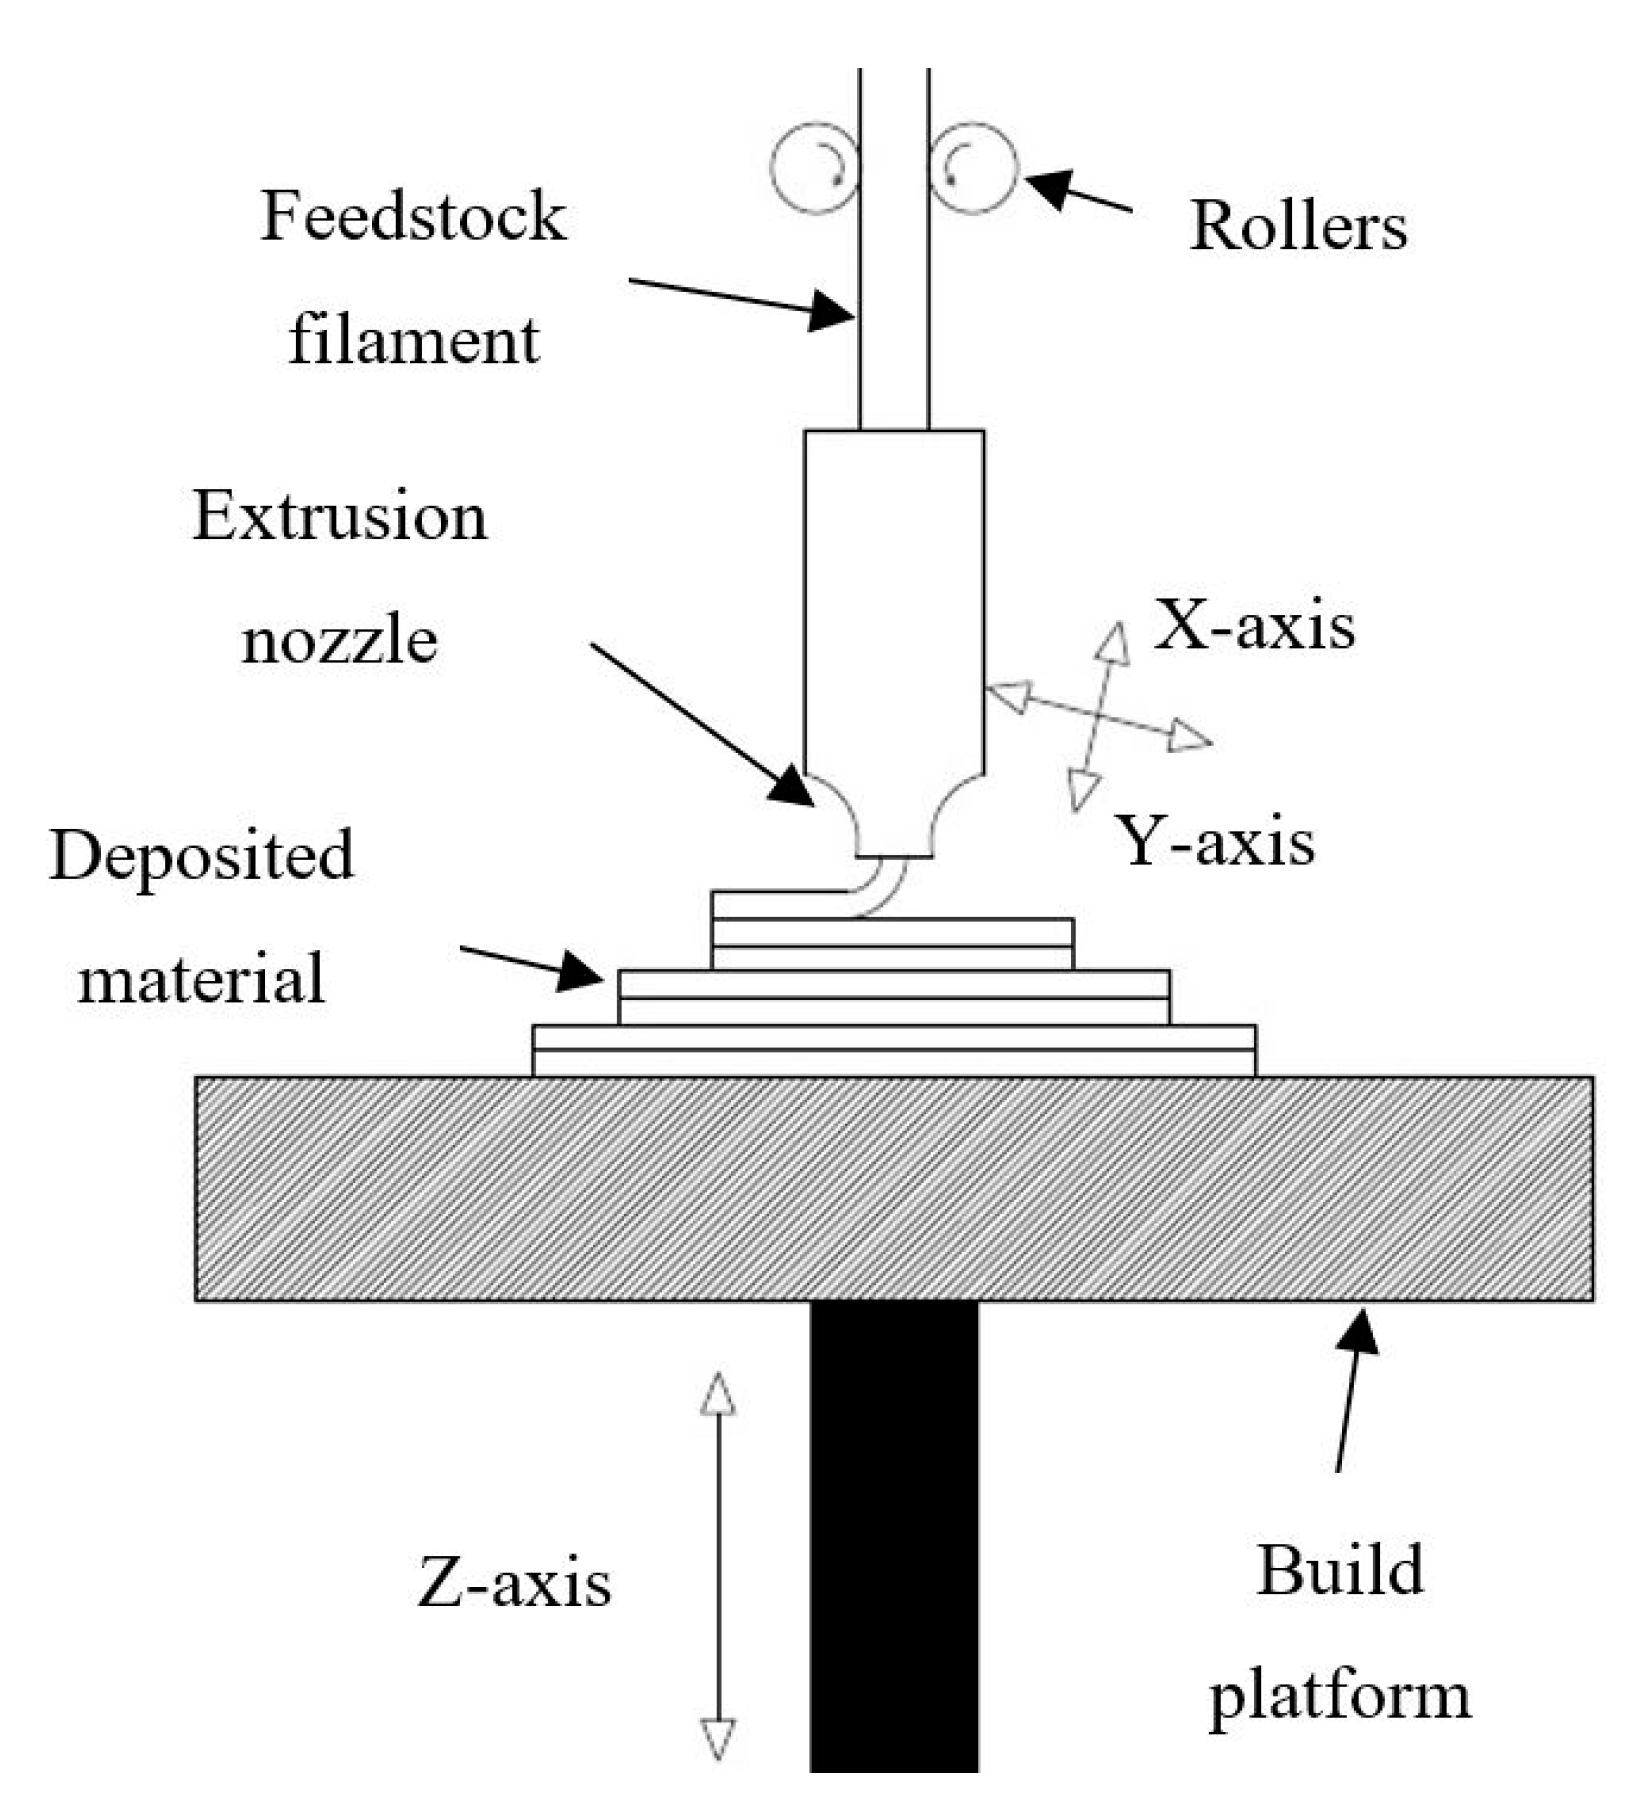
10]. FFF uses two-dimensional motion (X- and Y-direction) of heated extrusion nozzle, moved by stepper motors and controlled by a microprocessor. The feedstock filament is passed by rotating rollers into the extrusion nozzle, which heats it slightly lower than the melting point, as shown in
Figure 1. This semi-molten polymer bead is deposited on the build platform; after one layer is deposited, the build platform moves downward (Z-direction), and the next layer of materials is deposited. The motion of the nozzle and build platform are synchronized by the microprocessor according to the product design [
11]. The part is immediately cooled and cleaned after completion, after which it can be used for the desired application.
Despite advantages, FFF has certain process limitations like poor surface finish and mechanical strength than injection molding [
12]. The surface finish can be enhanced by postprocessing methods, including mechanical finishing, chemical finishing and vapor smoothing. However, there is no method available, which can improve the mechanical strength of FFF parts. This aspect limits the usability of these components for certain applications where flexural strength, compressive strength and tensile strength are mandatory [
13]. On the contrary to postprocessing, the FFF part shows significant variation in mechanical stability while manufactured at different conditions. There are numerous studies, which have found that process parameters like layer thickness, raster angle, build temperature, orientation angle, infill density, infill pattern and layer gap have a significant impact on the mechanical stability of FFF parts [
14,
15]. As a general notion, the filament layers deposited in the direction of tensile force and compressive force results in higher mechanical strength [
11]. Honeycomb structure with 100% infill density has yielded maximum tensile strength, as reported by Fernandez-Vicente et al. [
16]. However, complex issues arise when estimating strength is done for intricate designs manufactured using different build strategies. In addition to conventional optimization techniques, researchers have utilized advanced algorithms to identify optimum parameter settings to attain higher mechanical stability.
Section 2 presents different optimization algorithms used for mechanical strength enhancement of FFF parts. Afterward, in
Section 3 and
Section 4, the novel naked mole-rat algorithm (NMRA) and its variants are discussed.
Section 5 elaborates the case study performed to test the performance of advanced algorithms followed by simulation results and discussion in
Section 6.
2. Literature Review
Most of the studies, which reported using advanced algorithms for the FFF process were performed to enhance surface finish and mechanical strength of parts by optimizing various process parameters. Initially, conventional techniques were used for optimizing tensile strength based on orientation angle. At the same time, results were compared with finite element analysis (FEA) data. The simulated results were in strong correlation with experimental data, thus validating the FEA model. The maximum tensile strength has occurred at a 45° orientation angle [
17]. Panda et al. [
18] studied the impact of several process parameters of FFF-like layer thickness, raster width, raster angle, orientation, and air gap on tensile strength, flexural strength and impact strength of standard test samples. Experiments were carried out, and bacterial foraging technique was implemented after ANOVA tests. This advanced optimization technique was robust enough to predict the response for parameters outside the range of mathematical models formulated by experimental data.
Rayegani and Onwubolu [
19] proposed a relation between input parameters of FFF with tensile strength using the hybrid group method of data handling. The raster angle, air gap, orientation angle, and raster width varied during experimentation. Results were compared with modeled data, which showed a strong correlation between experimental and predicted tensile strength. Goudswaard et al. [
20] tested and compared the efficacy of evolutionary algorithm, particle swarm optimization and Simulated Annealing during optimizing tensile strength of FFF parts. It was clear that particle swarm optimization outclassed both evolutionary and simulated annealing algorithms in quality and consistency. Liu et al. [
13] solved the problems of the anisotropic behavior of FFF materials using hybrid deposition path planning and topology optimization technique. The anisotropy is induced by tool paths generated during the slicing of part, which results in the variation of mechanical properties in different loading directions. The hybrid tool path was developed using the techniques above, which performed better than regular infill strategies, such as crisscross and contour offset. The simulated results were compared with actual parts fabricated using a new algorithm, which validated its efficacy.
Genetic programming technique [
1] was used for optimizing fatigue behavior of FFF parts considering six input parameters with three levels of each. Contour number was found to be a significant parameter than the other five. At the same time, genetic programming outperformed response surface methodology during the prediction of fatigue.
The artificial neural networks technique was successfully implemented to enhance the creep behaviors of FFF parts after investigating the impact of five input parameters [
21]. The best creep compliance occurred at 0.127 mm layer thickness, zero raster angle and air gap, 17.188˚ deposition angle, 0.4572 mm width with 10 contours. ANN emerged as the most popular optimization tool for manufacturing processes. It can be applied to nonlinear and multitudinous cases, which was validated by this study. Raju et al. [
22] utilized hybrid particle swarm and bacterial foraging techniques for four FFF process parameter optimization while studying their impact on hardness, mechanical strength and surface finish of test samples. Compared to conventional optimization tools, the hybrid tool yielded a 7.44% higher response in all the output parameters. Moreover, this tool also performed better than the other algorithms like conventional particle swarm and bacterial foraging. Rao and Rai [
23] solved the single and multiobjective optimization issues of FFF using simple and non-dominated TLBO techniques, respectively. Five case studies were discussed with different objective functions and parameter bounds. The response parameters, such as compressive strength, sliding wear, flexural strength, impact strength and tensile strength, were investigated using advanced optimization tools. All the mathematical models were created by previous researchers during experimentations, which were employed as input to study and compare the performance of the optimization tools, which proves highly efficient than previous results.
Malviya and Desai [
24] coupled two techniques, i.e., artificial neural networks and Bayesian algorithm, to optimize orientation angle. A significant impact on tensile strength parameters was experienced. The proposed methodology has successfully achieved desired goals despite the anisotropic behavior of FFF parts. Yadav et al. [
25] discussed the impact of infill density, material density and nozzle temperature on the tensile strength of FFF parts manufactured by different materials. They used a hybrid genetic algorithm-artificial neural network technique for the optimization. The experimental data showed strong similarity with predicted results with an error of less than 3%, thus validating the efficiency of the hybrid algorithm. Natarajan et al. [
26] used a Non-dominated sorting modified TLBO for conventional machining processes. The impact of four input parameters was studied during the machining of polytetrafluoroethylene with a cemented carbide tool. This algorithm performed better than the other six algorithms by yielding more uniform results and non-dominated solutions. While comparing predicted and experimental results, only 3.7% error was observed while validating the efficacy of this tool. Some researchers also used different algorithms to solve a single objective function to compare and identify the most efficient algorithm. Saad et al. [
27] tested four different algorithms for minimizing the surface roughness of FFF parts. The symbiotic organism search algorithms were most effective as minimum surface roughness was predicted at optimum parameter settings, further validated by experimental results.
Another research reported using the firefly algorithm to optimize the wear rate of copper-plated FFF parts. The mathematical model was designed based on the raster angle, air gap, voltage and time to predict the wear rate [
28]. A Multicriteria genetic algorithm was utilized by Pandey et al. [
2] to predict optimum orientation angle against two objective functions, i.e., build time and surface roughness. The algorithm was robust enough to predict the surface roughness and build time for parts of any geometry.
The research, development and testing of the efficacy of new algorithms is a never-ending process as advanced versions of algorithms are rapidly developed by researchers. This study focuses on optimizing process parameters of FFF to attain maximum mechanical strength using NMRA [
29] and its variants, which are discussed in the next section.
3. Naked Mole-Rat Algorithm Variants
Researchers are motivated by the behavioral characteristics of naked mole rats (NMRs) to design an optimization technique termed NMRA [
29]. The algorithm reproduces the natural mating patterns of NMRs for designing algorithms. NMRs are classified into two types, i.e., breeders and worker NMRs. The breeders are the most efficient NMRs in the group, and these are only intended for mating with the queen. Workers are doing the additional tasks, and the best performing workers will move on to the breeding group. The best executor of the breeder’s pool will be the queen’s mating partner.
There are three steps to the algorithm. The NMR group is initially created, and the NMR group is then divided into employees and breeders. The group of breeders is selected based on the probability of breeding. The NMRA steps are as follows:
3.1. Initialization
Initially,
NMRs are generated at random. The D-dimensional vector space is represented by each NMR in the range of
. Each NMR shall be initialized as
where
,
, and
is a uniform random number. After initialization, the objective function and fitness values are determined, and breeders (B) and workers (W) based on their fitness function and the best solution d is selected.
3.2. Worker Phase
To switch to the breeder group and to get a chance to mate with the queen, each worker tries to improve his fitness. The new fitness value of NMR is calculated, and the updated solution is selected and recorded if the fitness is better than the previous one. The previous solution will otherwise be chosen.
The equation used to generate the updated solution is as follows:
where
th worker is represented by
in the
th iteration. The random solution (
th and
th worker) chosen from the worker’s group is
and
.
represents a new fitness solution. A uniform distribution ranges from [0, 1] provides the value of
.
3.3. Breeder Phase
The breeder needs to update the NMRs to be chosen as their partner or to remain a breeder. The breeder’s NMRs are updated with the best d overall reproductive probability (
). This
is a random [0, 1] number. If breeders do not update fitness, they may be removed from the worker’s pool:
where in
th iteration
represents
th breeder,
controls the mating frequency and assists in the next iteration in identifying a new breeder
. At first,
is set to 0.5 for breeders.
The entire search process is repeated iteratively until the termination criteria is satisfied. Consequently, the best breeder chosen from the whole population is the possible solution to the problem under study.
| Algorithm 1 Pseudocode of NMRA
|
| Input:Define objective functionf(NMR), NMR = (NMR1, NMR2, . . ., NMRD) |
| Output:Identify current best solution; |
| Initialization:Initialize NMRs: n, breedersB:n/5, workersW:B−n |
| Describe breeding probability: bp |
| while iterations < |
| for i = 1: w |
| |
| evaluate |
| end for |
| for i = 1: B |
| if rand >bp |
| |
| end if |
| evaluate |
| end for |
| combine the updated breeder and worker population |
| estimate the NMRs |
| update the overall best d |
| update iteration count |
| end while |
| update final best |
| end |
Because of its linear nature, NMRA has recently gained interest among researchers. The revised NMRA improves performance by improving both its basic exploitation and exploration capabilities. The elite opposition-based learning (EOBL) strategy [
30] improves the exploration of basic NMRA. Exploitation is improved by local neighborhood search (LNS) with information on the best solution to date in the small neighborhood of the solution [
25]. The following are the main changes:
3.3.1. NMRA Version 1.0
NMRV 1.0 has improved NMRA’s exploration capabilities through implementing the EOBL Strategy [
30]. The opposition-based NMRA, also called NMRV 1.0, Algorithm 2 detailed the pseudocode of NMRV 1.0.
| Algorithm 2 Pseudocode of NMRV 1.0
|
| Input:Define objective functionf(NMR), NMR = (NMR1, NMR2, . . ., NMRD) |
| Output:Identify current best solution; |
| Initialization:Initialize NMRs: n, breedersB:n/5, workersW:B−n |
| Describe breeding probability: bp |
| Update the current population with EOBL; |
| while iterations < |
| for i = 1: w |
| |
| evaluate |
| end for |
| for i = 1: B |
| if rand >bp |
| |
| end if |
| evaluate |
| end for |
| combine the updated breeder and worker population |
| estimate the NMRs |
| update the overall best d |
| update iteration count |
| end while |
| update final best |
| end |
3.3.2. NMRA Version 2.0
The local neighborhood search (LNS) model has been employed [
30] to enhance the exploitation capacity of NMRA. In the basic NMRA, workers change their position during the employee phase according to local information and their past experience. The new best solution is restructured with LNS in the upgraded NMRA version 2.0, and the worker phase is updated as a solution:
where
is the best solution in the neighborhood of
and
,
∈ rand() are the scaling factors, and
,
∈ [
i −
r,
i +
r] (
p q i) neighborhood. The updated solution using LNS in the worker phase is given by:
where
∈ rand( ) is a scaling factor,
is the LNS updated best solution. The pseudocode of NMRV 2.0, i.e., LNS-based NMRA, is shown in Algorithm 3.
| Algorithm 3 Pseudocode of NMRV 2.0
|
| Input:Define objective functionf(NMR), NMR = (NMR1, NMR2, . . ., NMRD) |
| Output:Identify current best solution; |
| Initialization:Initialize NMRs: n, breedersB:n/5, workersW:B−n |
| Describe breeding probability: bp |
| while iterations < |
| for i = 1: w |
|
|
| evaluate |
| end for |
| for i = 1: B |
| if rand >bp |
|
| end if |
| evaluate |
| end for |
| combine the updated breeder and worker population |
| estimate the NMRs |
| update the overall best d |
| update iteration count |
| end while |
| update final best |
| end |
3.3.3. NMRA Version 3.0
NMRA version 3.0 has two modifications in basic NMRA to balance the exploitation and exploration capacity [
30]. First, the exploration tendency is improved by the EOBL strategy. Second, the exploitation capability is improved by LNS. The pseudocode of NMRV 3.0 is given in Algorithm 4.
| Algorithm 4 Pseudocode of NMRV 3.0
|
| Input:Define objective functionf(NMR), NMR = (NMR1, NMR2, . . ., NMRD) |
| Output:Identify current best solution; |
| Initialization:Initialize NMRs: n, breedersB:n/5, workersW:B−n |
| Describe breeding probability: bp |
| Update the current population with EOBL; |
| while iterations < |
| for i = 1: w |
| |
| |
| evaluate] |
| end for |
| for i = 1: B |
| if rand >bp |
| |
| end if |
| evaluate |
| end for |
| combine the updated breeder and worker population |
| estimate the NMRs |
| update the overall best d |
| update iteration count |
| end while |
| update final best |
| end |
4. Case Study
The simulation results were compared with the optimization study carried out by Panda et al. [
18], where the influence of five FFF parameters was optimized to improve the mechanical properties. The process parameters utilized for this study are:
The primary motivation for selecting the above-mentioned input parameters is the literature review, which has found a good correlation between abovesaid parameters with mechanical properties of FFF components [
2,
19]. The output variables used for this case study are impact strength (
) in
, flexural strength (
) in
and Tensile Strength (
) in
. The main reason for selecting these output parameters is that these components undergo different types of loading conditions for medical, aerospace and automobile applications. Therefore, it is mandatory to evaluate all these mechanical properties utilizing an advanced optimization algorithm. These response parameters are considered as an objective function for the present case study.
The objective function is shown in Equations (6)–(8):
It is required to maximize each type of strength; thus, maximization of objective functions is performed.
The lower and upper bounds of process parameters are identified based on constraints as most commercially available FFF machines can manufacture components within the following parameter bounds. The parameter bounds for objective function are expressed in
Table 1 as follows:
5. Simulation Results and Discussion
In the FFF process, to resolve this optimization problem, the NMRA variants are utilized. Since heuristic algorithms are stochastic optimization methods, these must be executed at least 10 times to generate meaningful statistics. For this purpose, the simulations are performed 30 times. Population sizes vary from 20 to 40, and the number of iterations varies from 100 to 500. The NMRA variants have been selected for efficiency check by the FFA [
31], FPA [
32], NBA [
33], SCA [
34] and SSA [
35] algorithms.
Table 2 details the parameter settings used to compare the results.
Here, is the population size, is the dimension of the problem, is the number of iterations
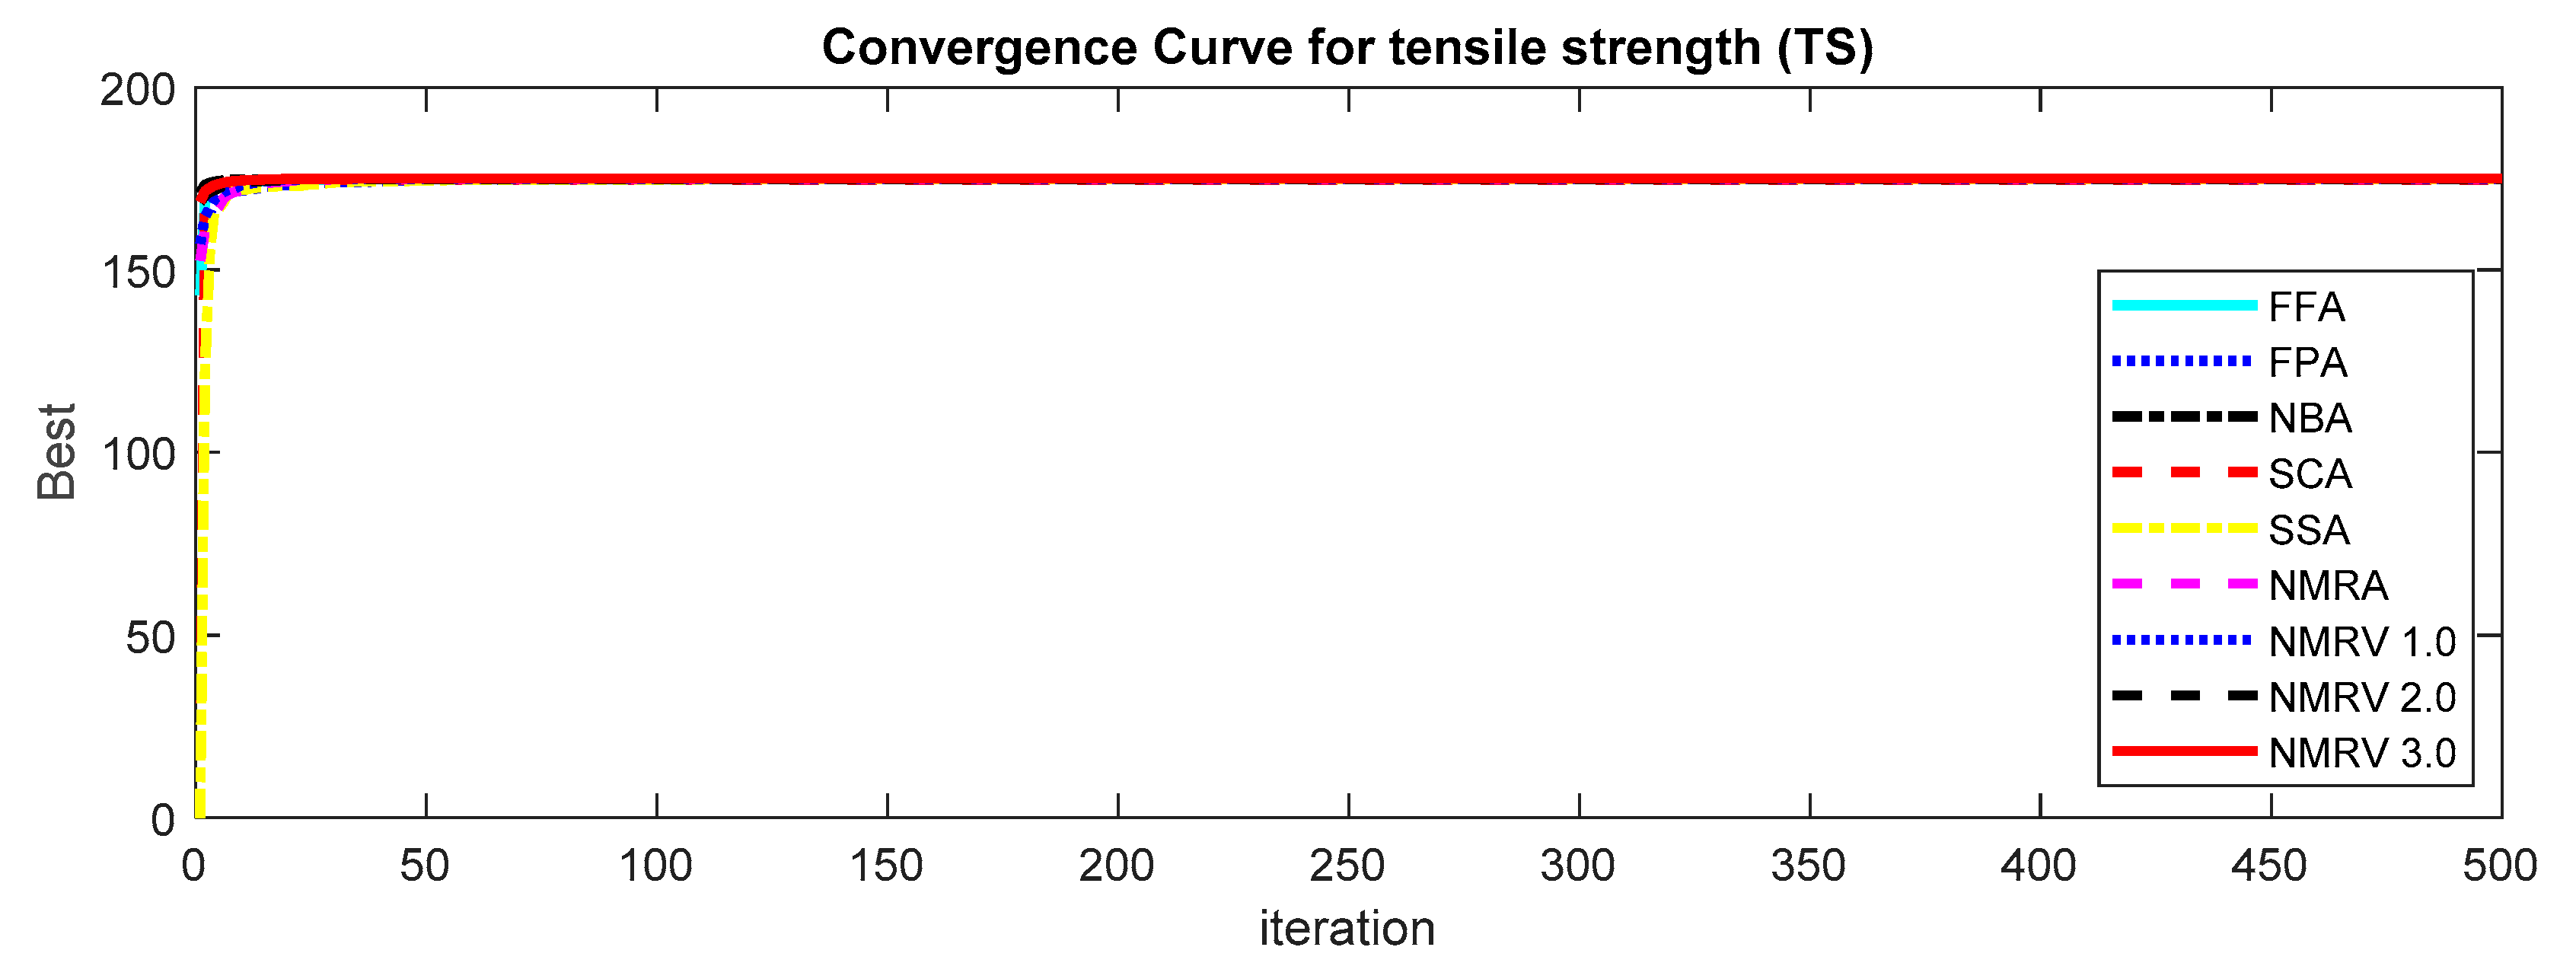
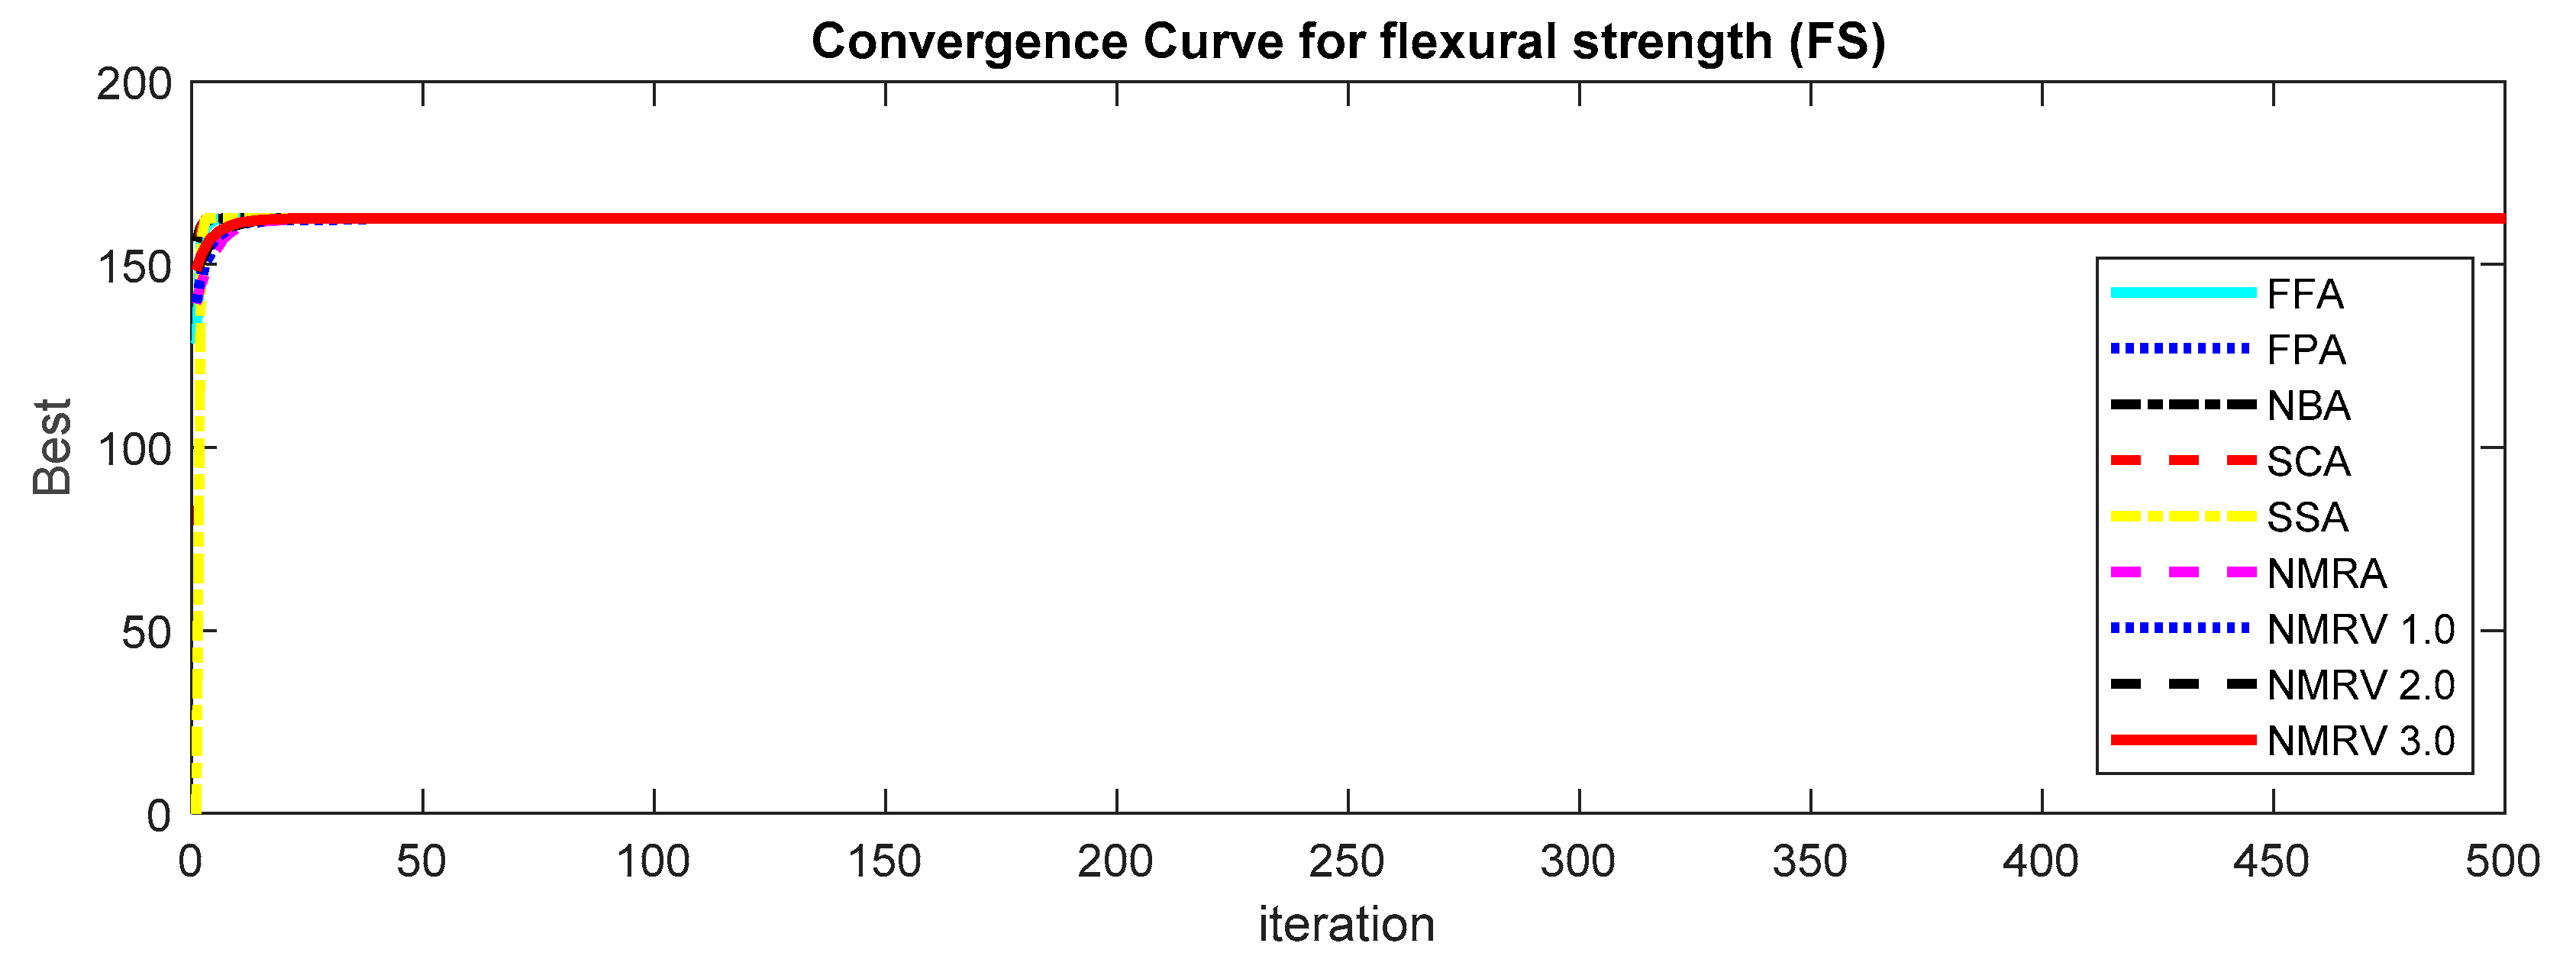
The optimum results attained by simulated algorithms with population size 40 and maximum amount of iterations, i.e., 500, are shown in
Table 3,
Table 4 and
Table 5 for
TS, FS and
IS, respectively. It is clear from the results that the NMRV 2.0 and 3.0 algorithm’s fitness values are slightly better than others for
TS and
FS fitness functions, respectively. Outcomes of all competitive algorithm’s fitness values are nearly similar to competitive algorithms for
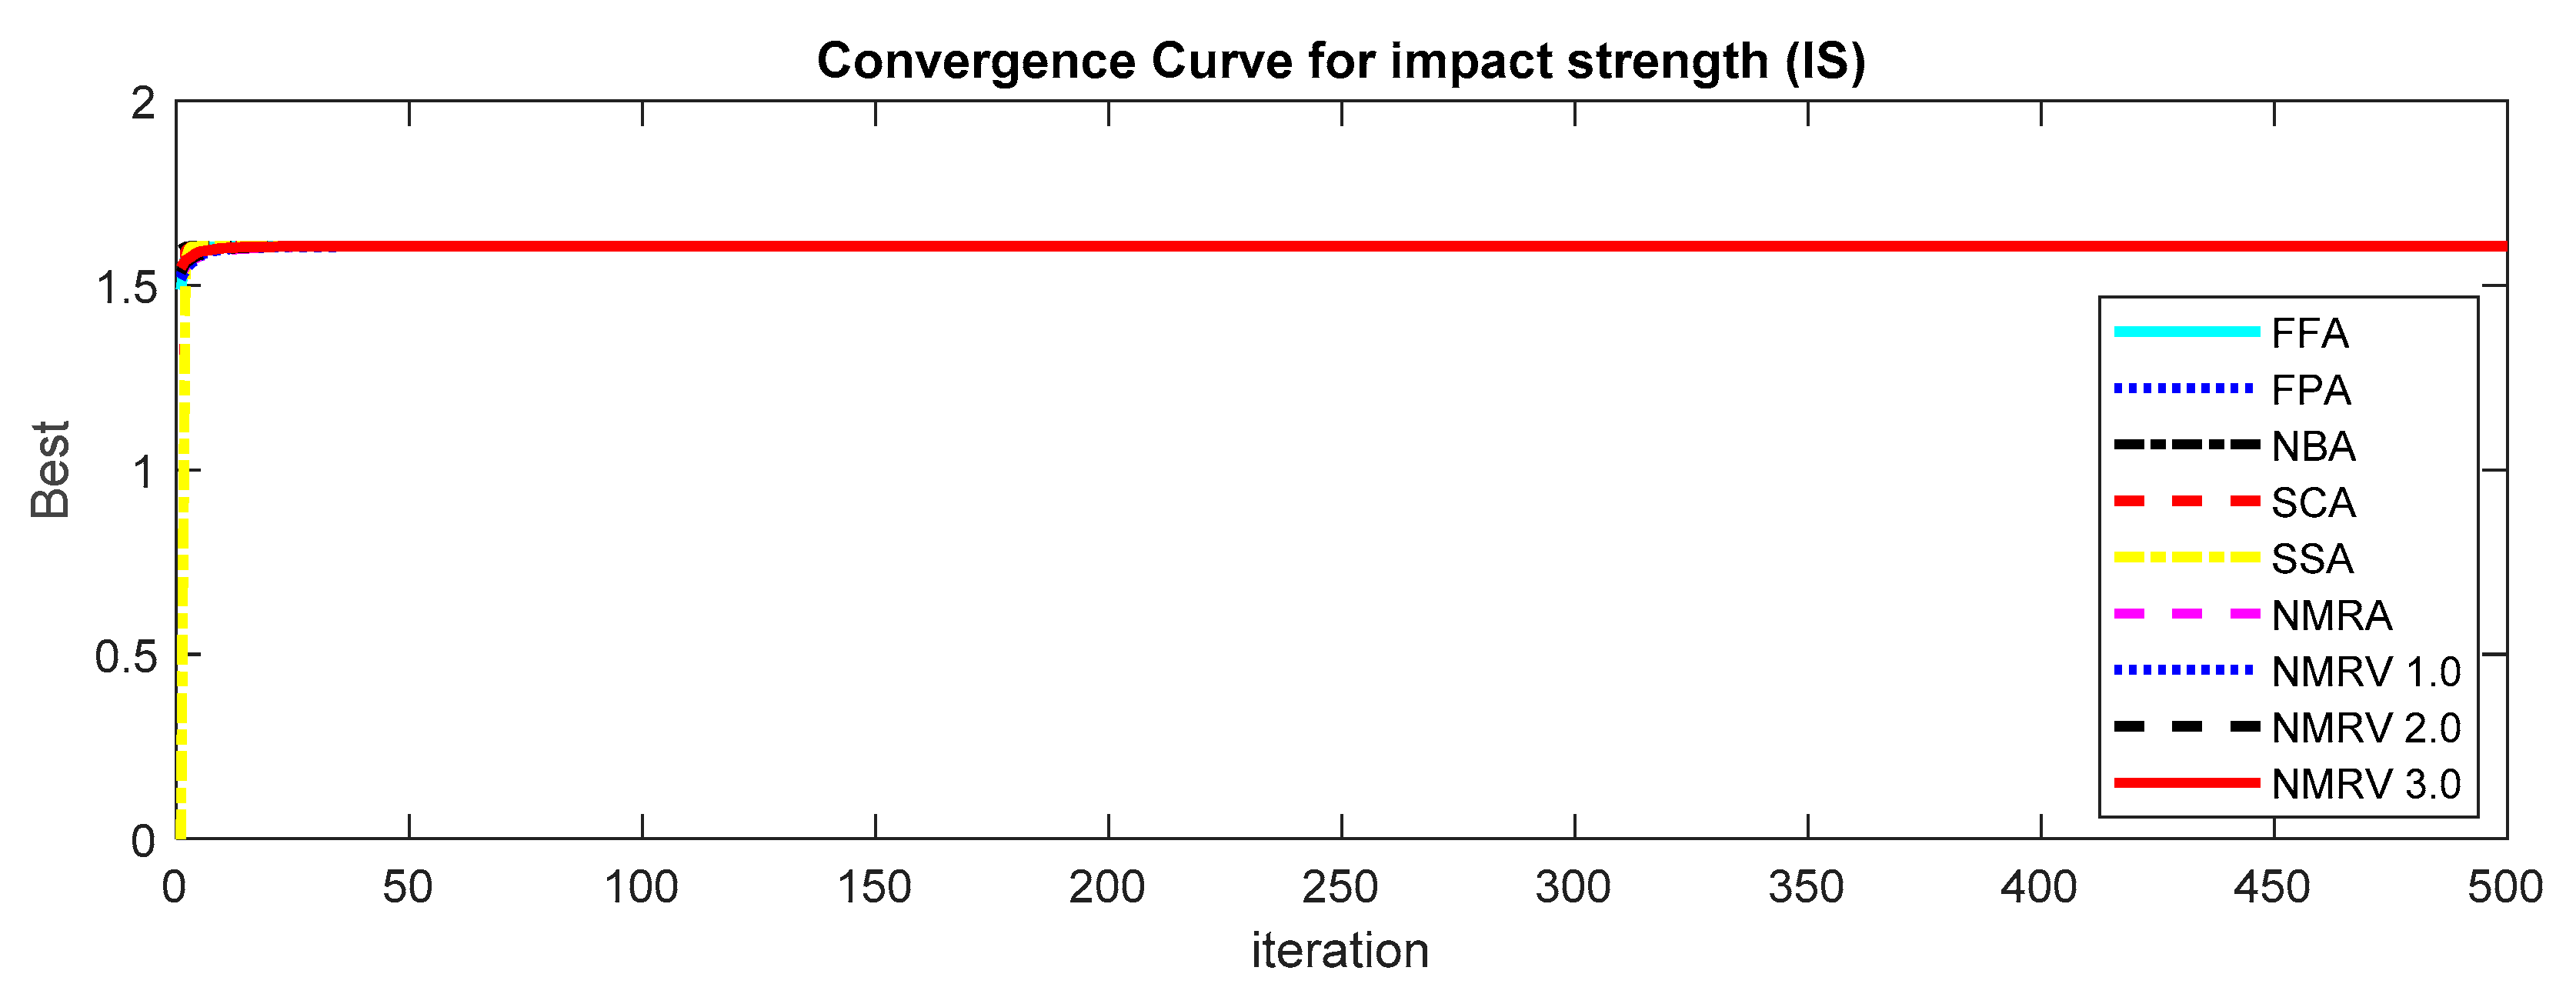
IS fitness function. The convergence rate for
TS, FS and
IS are drawn in
Figure 2,
Figure 3 and
Figure 4, respectively, which is also better than others. The performance of simulated algorithms for FFF for
TS, FS and
IS are specified in
Table 3,
Table 4 and
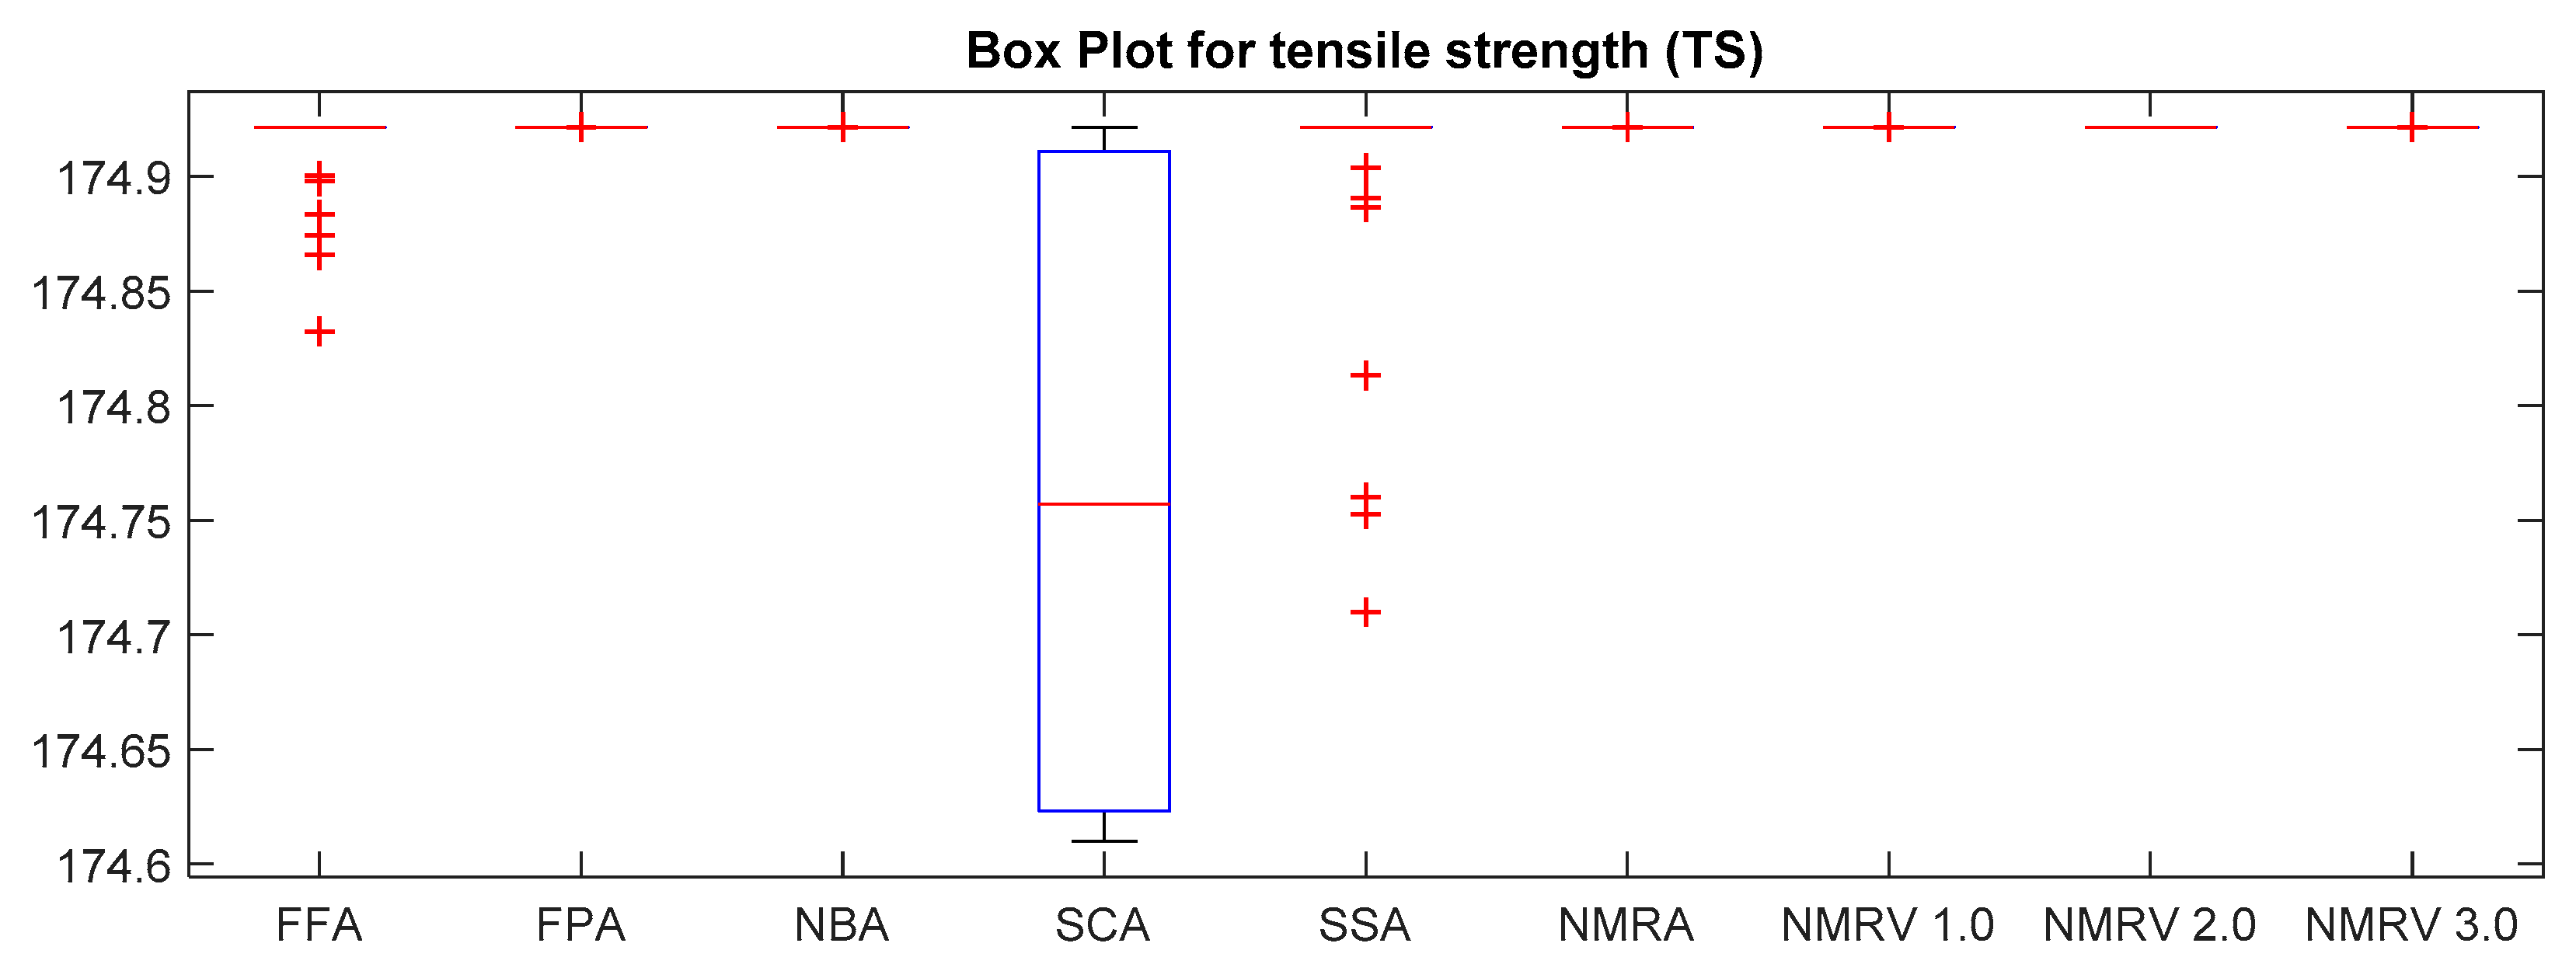
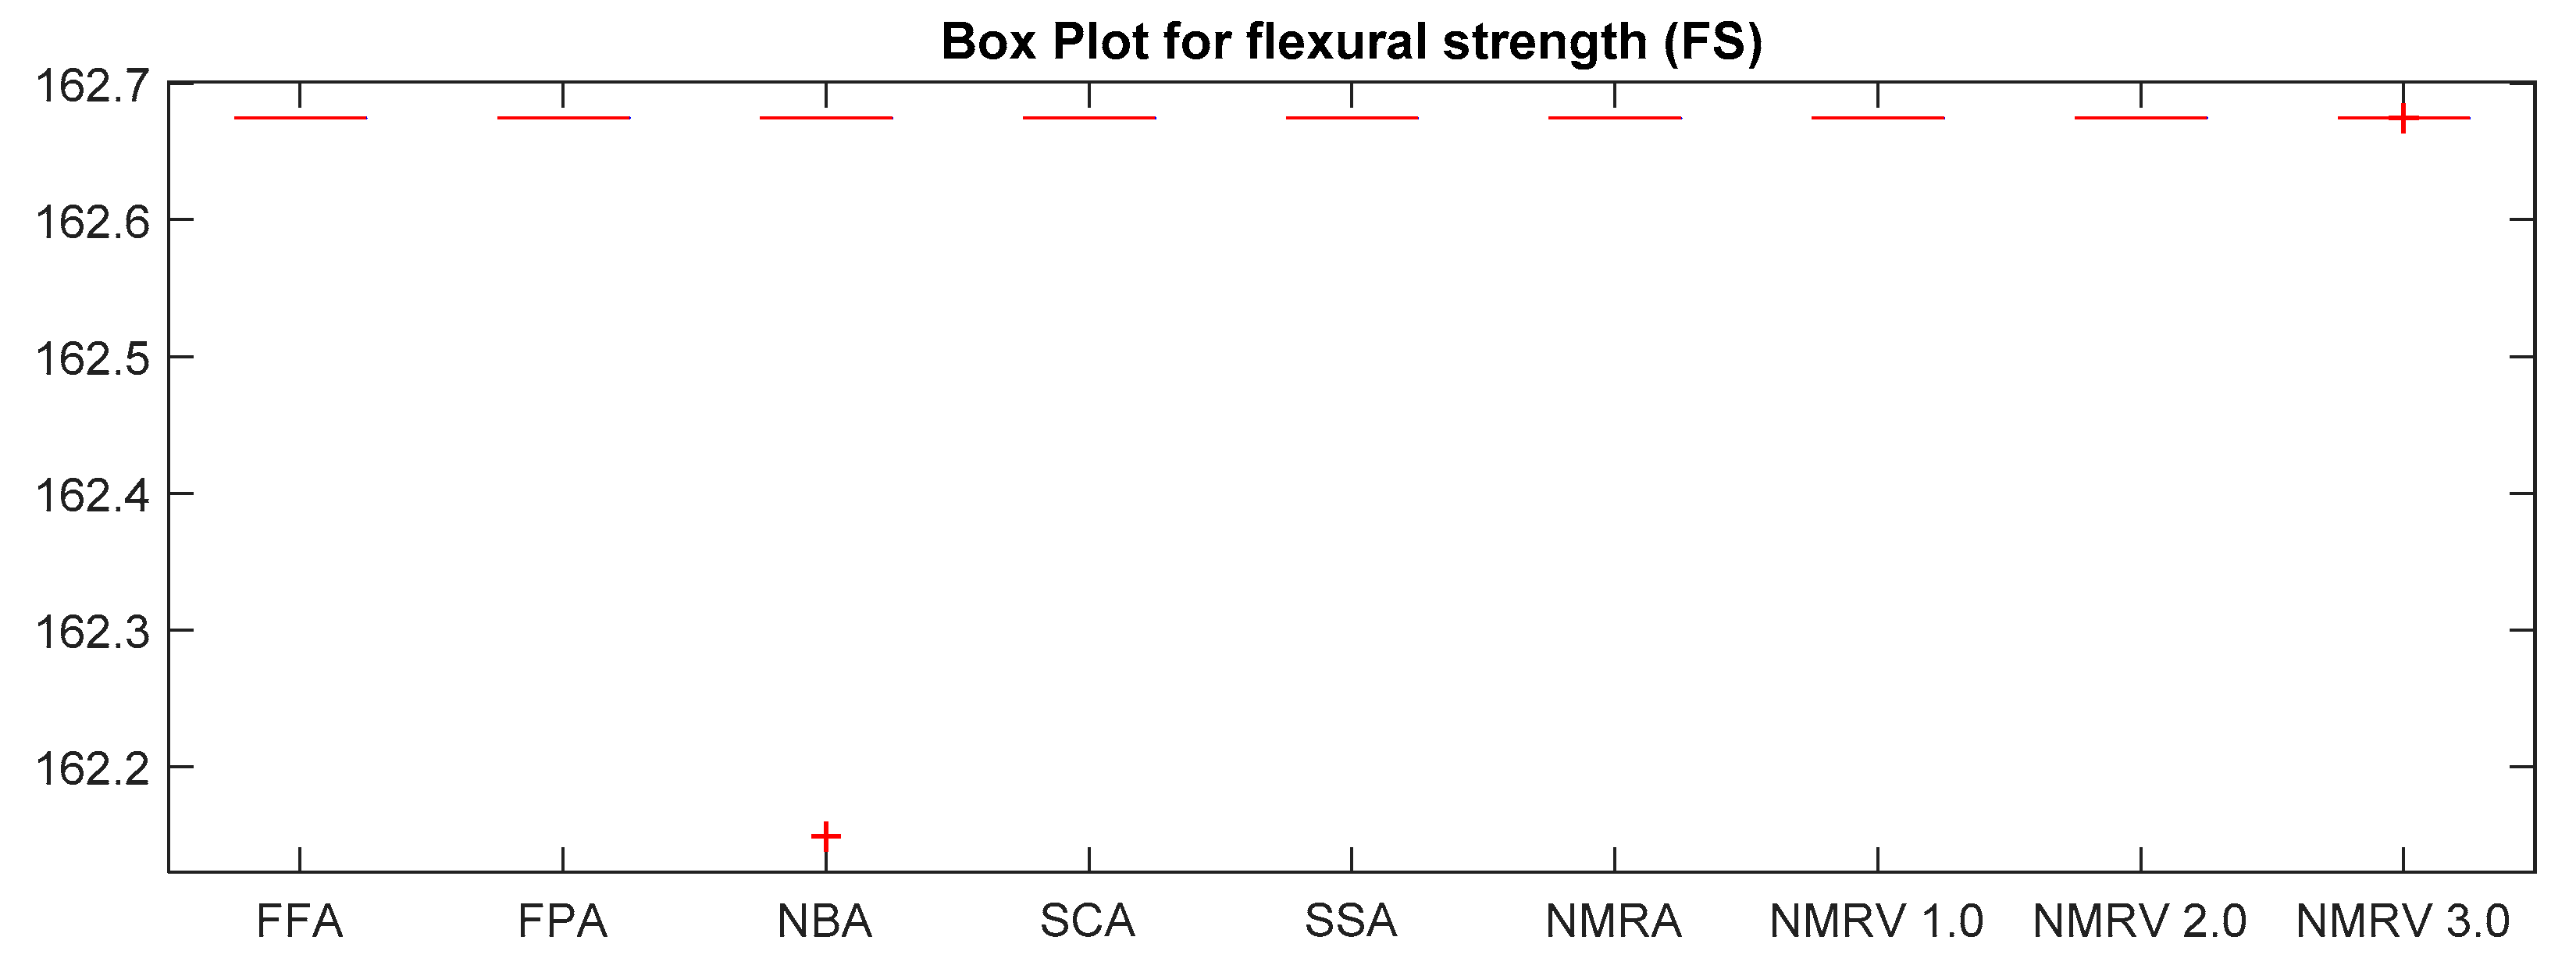
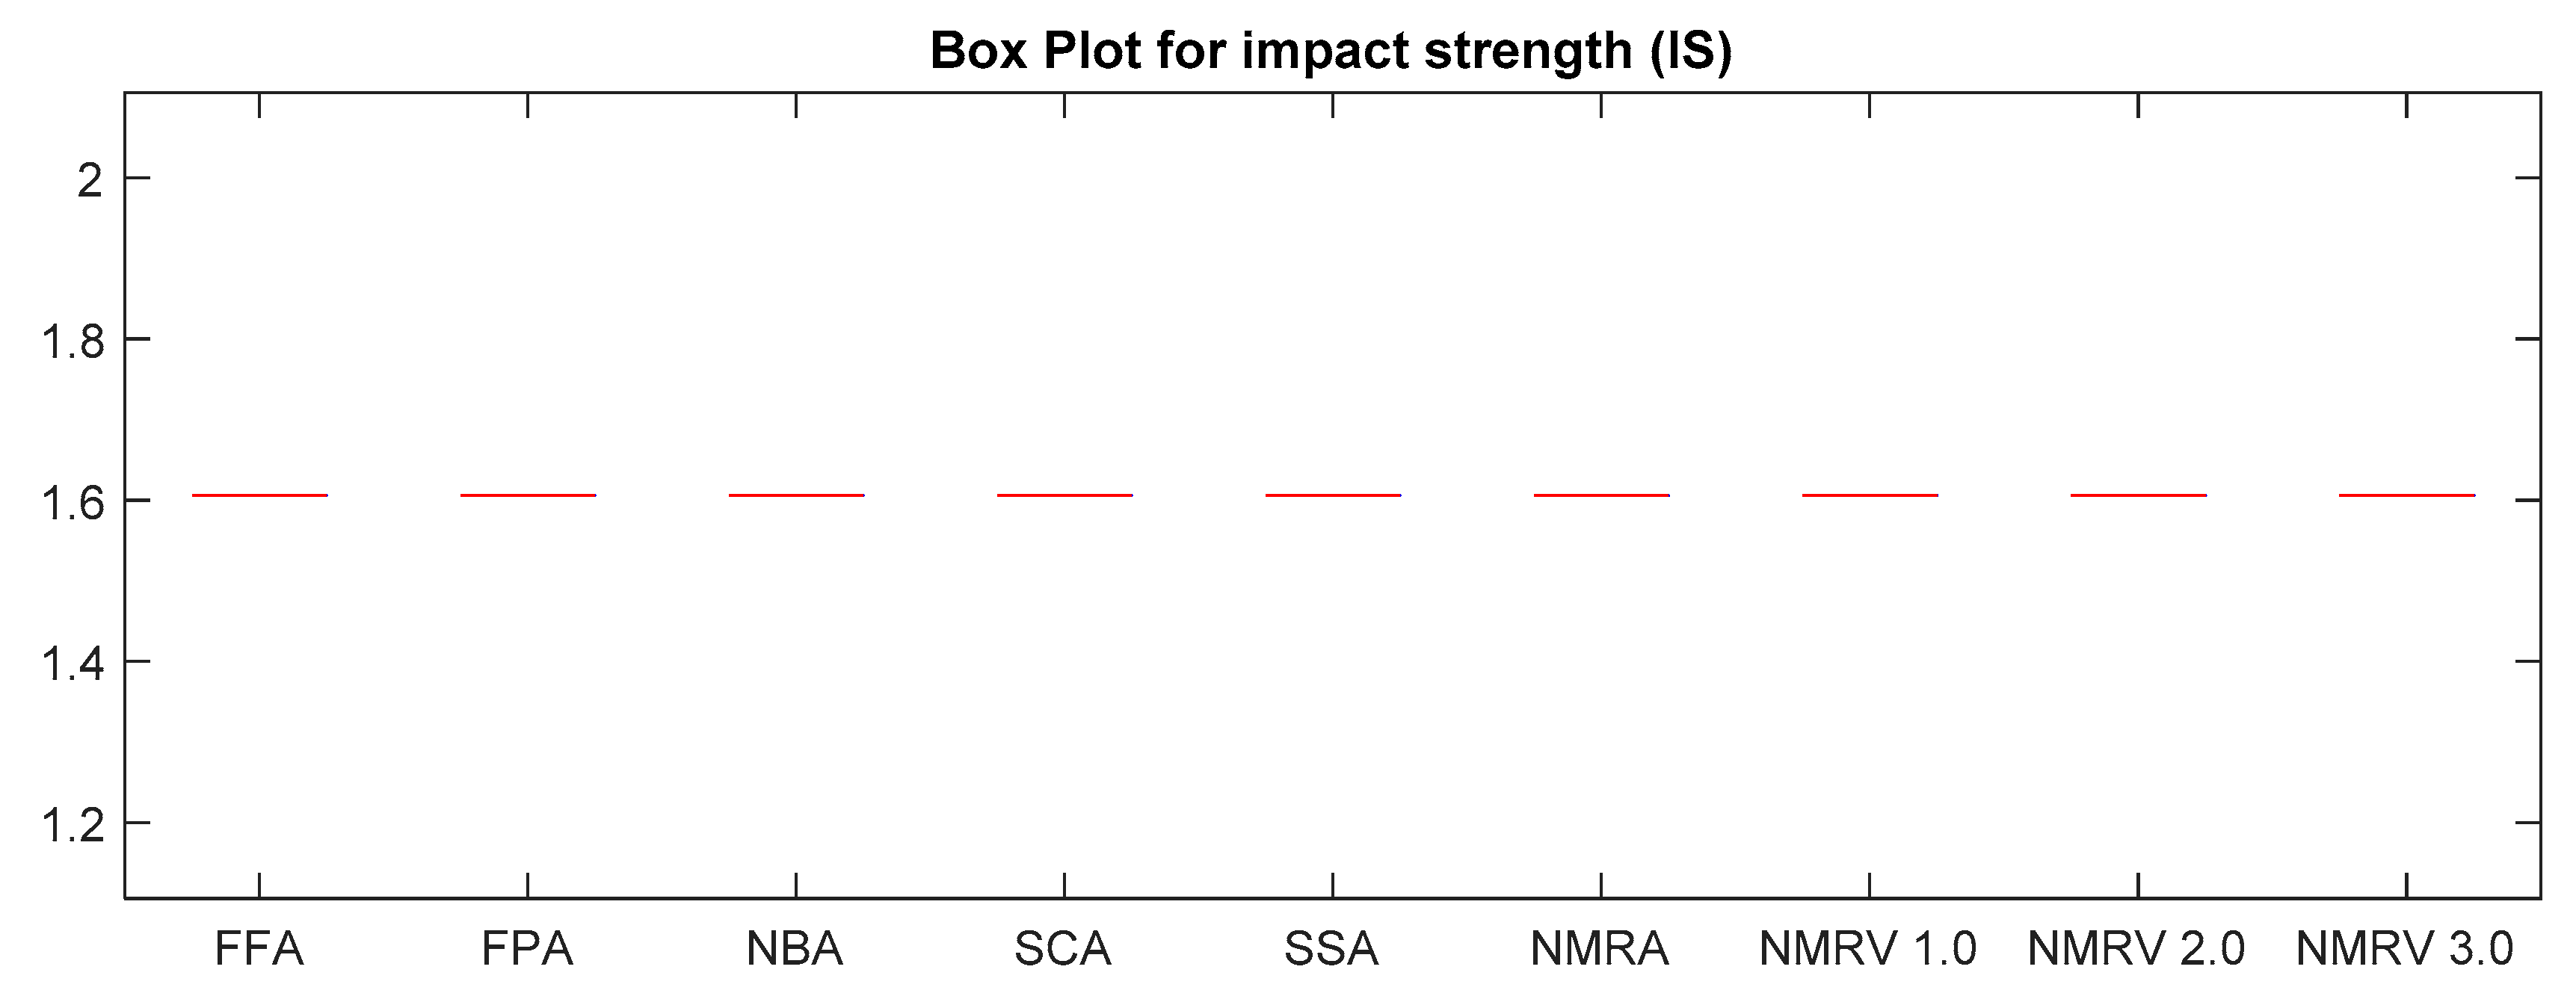
Table 5, respectively. This demonstrates that NMRV 3.0 algorithm’s standard deviation is better than others that demonstrates improved exploitation and exploration capabilities of NMRV 3.0 for process parameters optimization of FFF as confirmed by box-plots shown in
Figure 5,
Figure 6 and
Figure 7.
The performance evaluation of simulated algorithms with population size 40 and maximum amount of iterations, i.e., 100, are specified in
Table 6,
Table 7 and
Table 8 for
TS, FS and
IS, respectively. It is clear from the statistics that NMRV 3.0 algorithm’s fitness values are slightly better than others for
TS, FS and
IS fitness functions.
To further check the effectiveness of proposed variants, the simulations were carried out for different numbers of iterations and population sizes [
36]. The performance evaluation of simulated algorithms with population size 20 and maximum amount of iterations, i.e., 100, are given in
Table 9,
Table 10 and
Table 11. It is clear from the results that NMRV 3.0 algorithm’s fitness values are slightly better than others for
TS, FS and
IS fitness functions.
6. Confirmatory Experiments
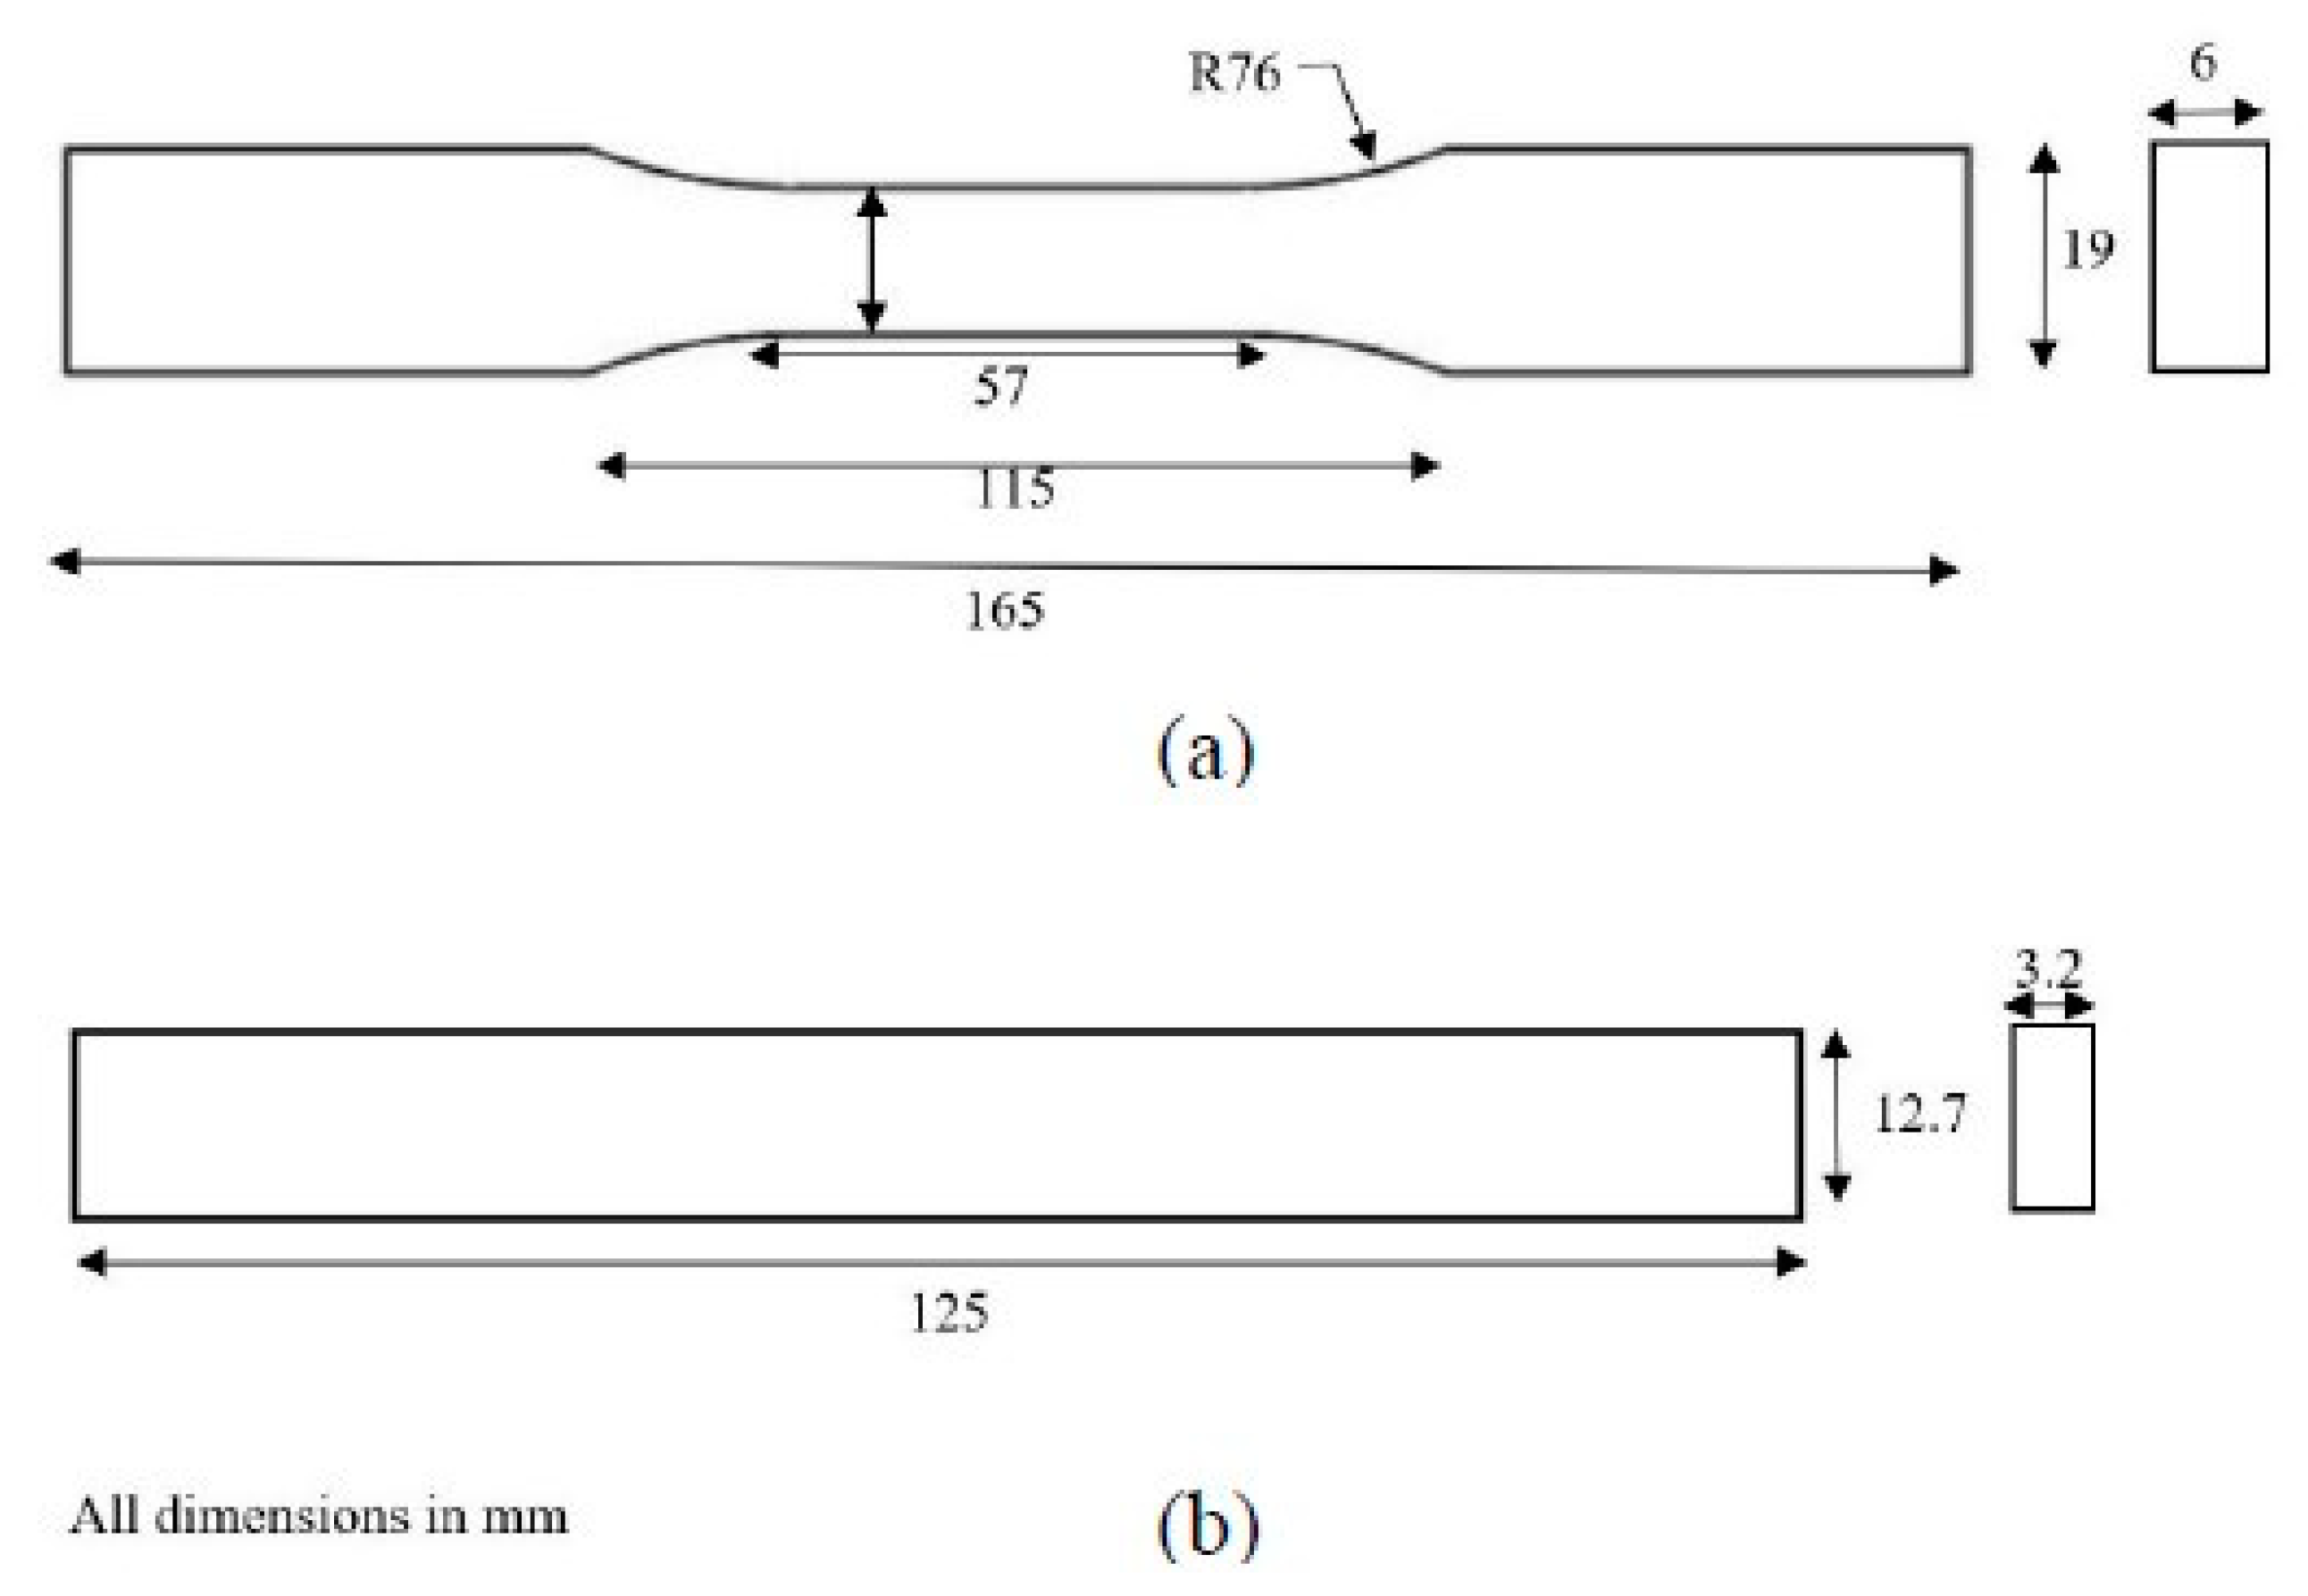
To validate the findings of NMRA, the confirmatory experiments were planned to fabricate sample parts at optimized parameters followed by mechanical testing. Five samples were manufactured using the FFF process at predefined conditions as suggested by NMRA. The samples are prepared for confirmation of
TS and
FS of parts fabricated at optimum parameter settings. The samples for
TS and
FS are prepared as per ASTM D638 and ASTM D790 standards. The dimensions of
TS and
FS samples are shown in
Figure 8.
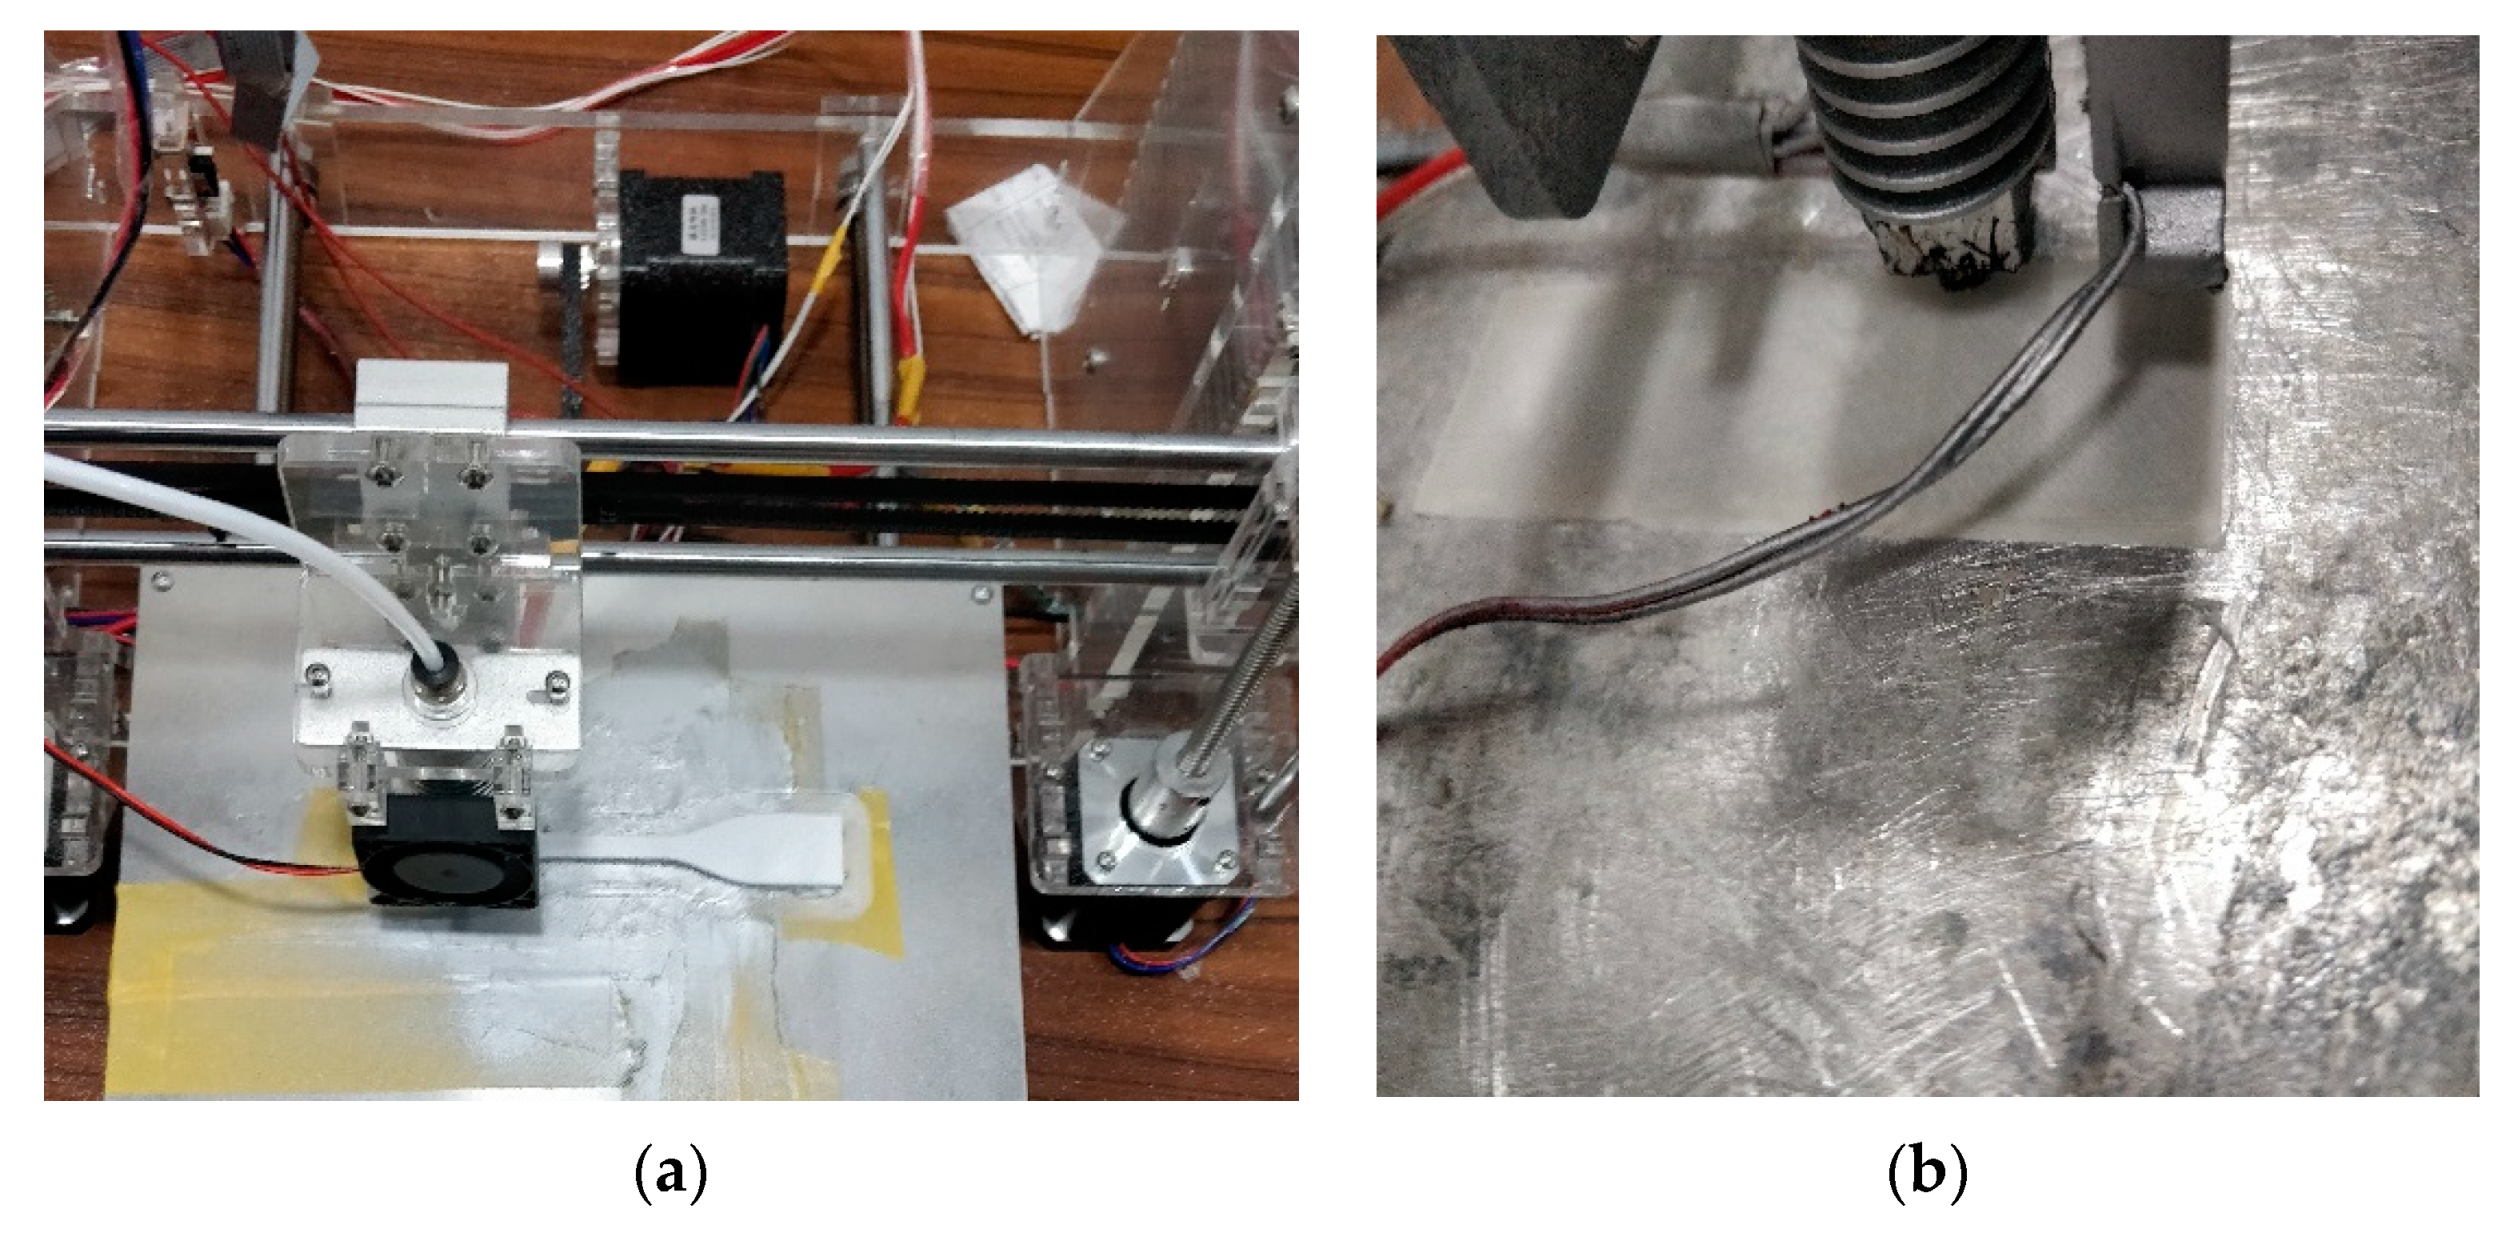
Acrylonitrile butadiene styrene (ABS) has been extensively used for automobile and electronic components and hence it is most popular raw material used in FFF printers. The filament material selected for the fabrication of test samples in the present study is ABS P400 with a 1.75 mm diameter supplied by Robokits, India.
Table 12 displays the FFF process parameters selected during the fabrication of test samples.
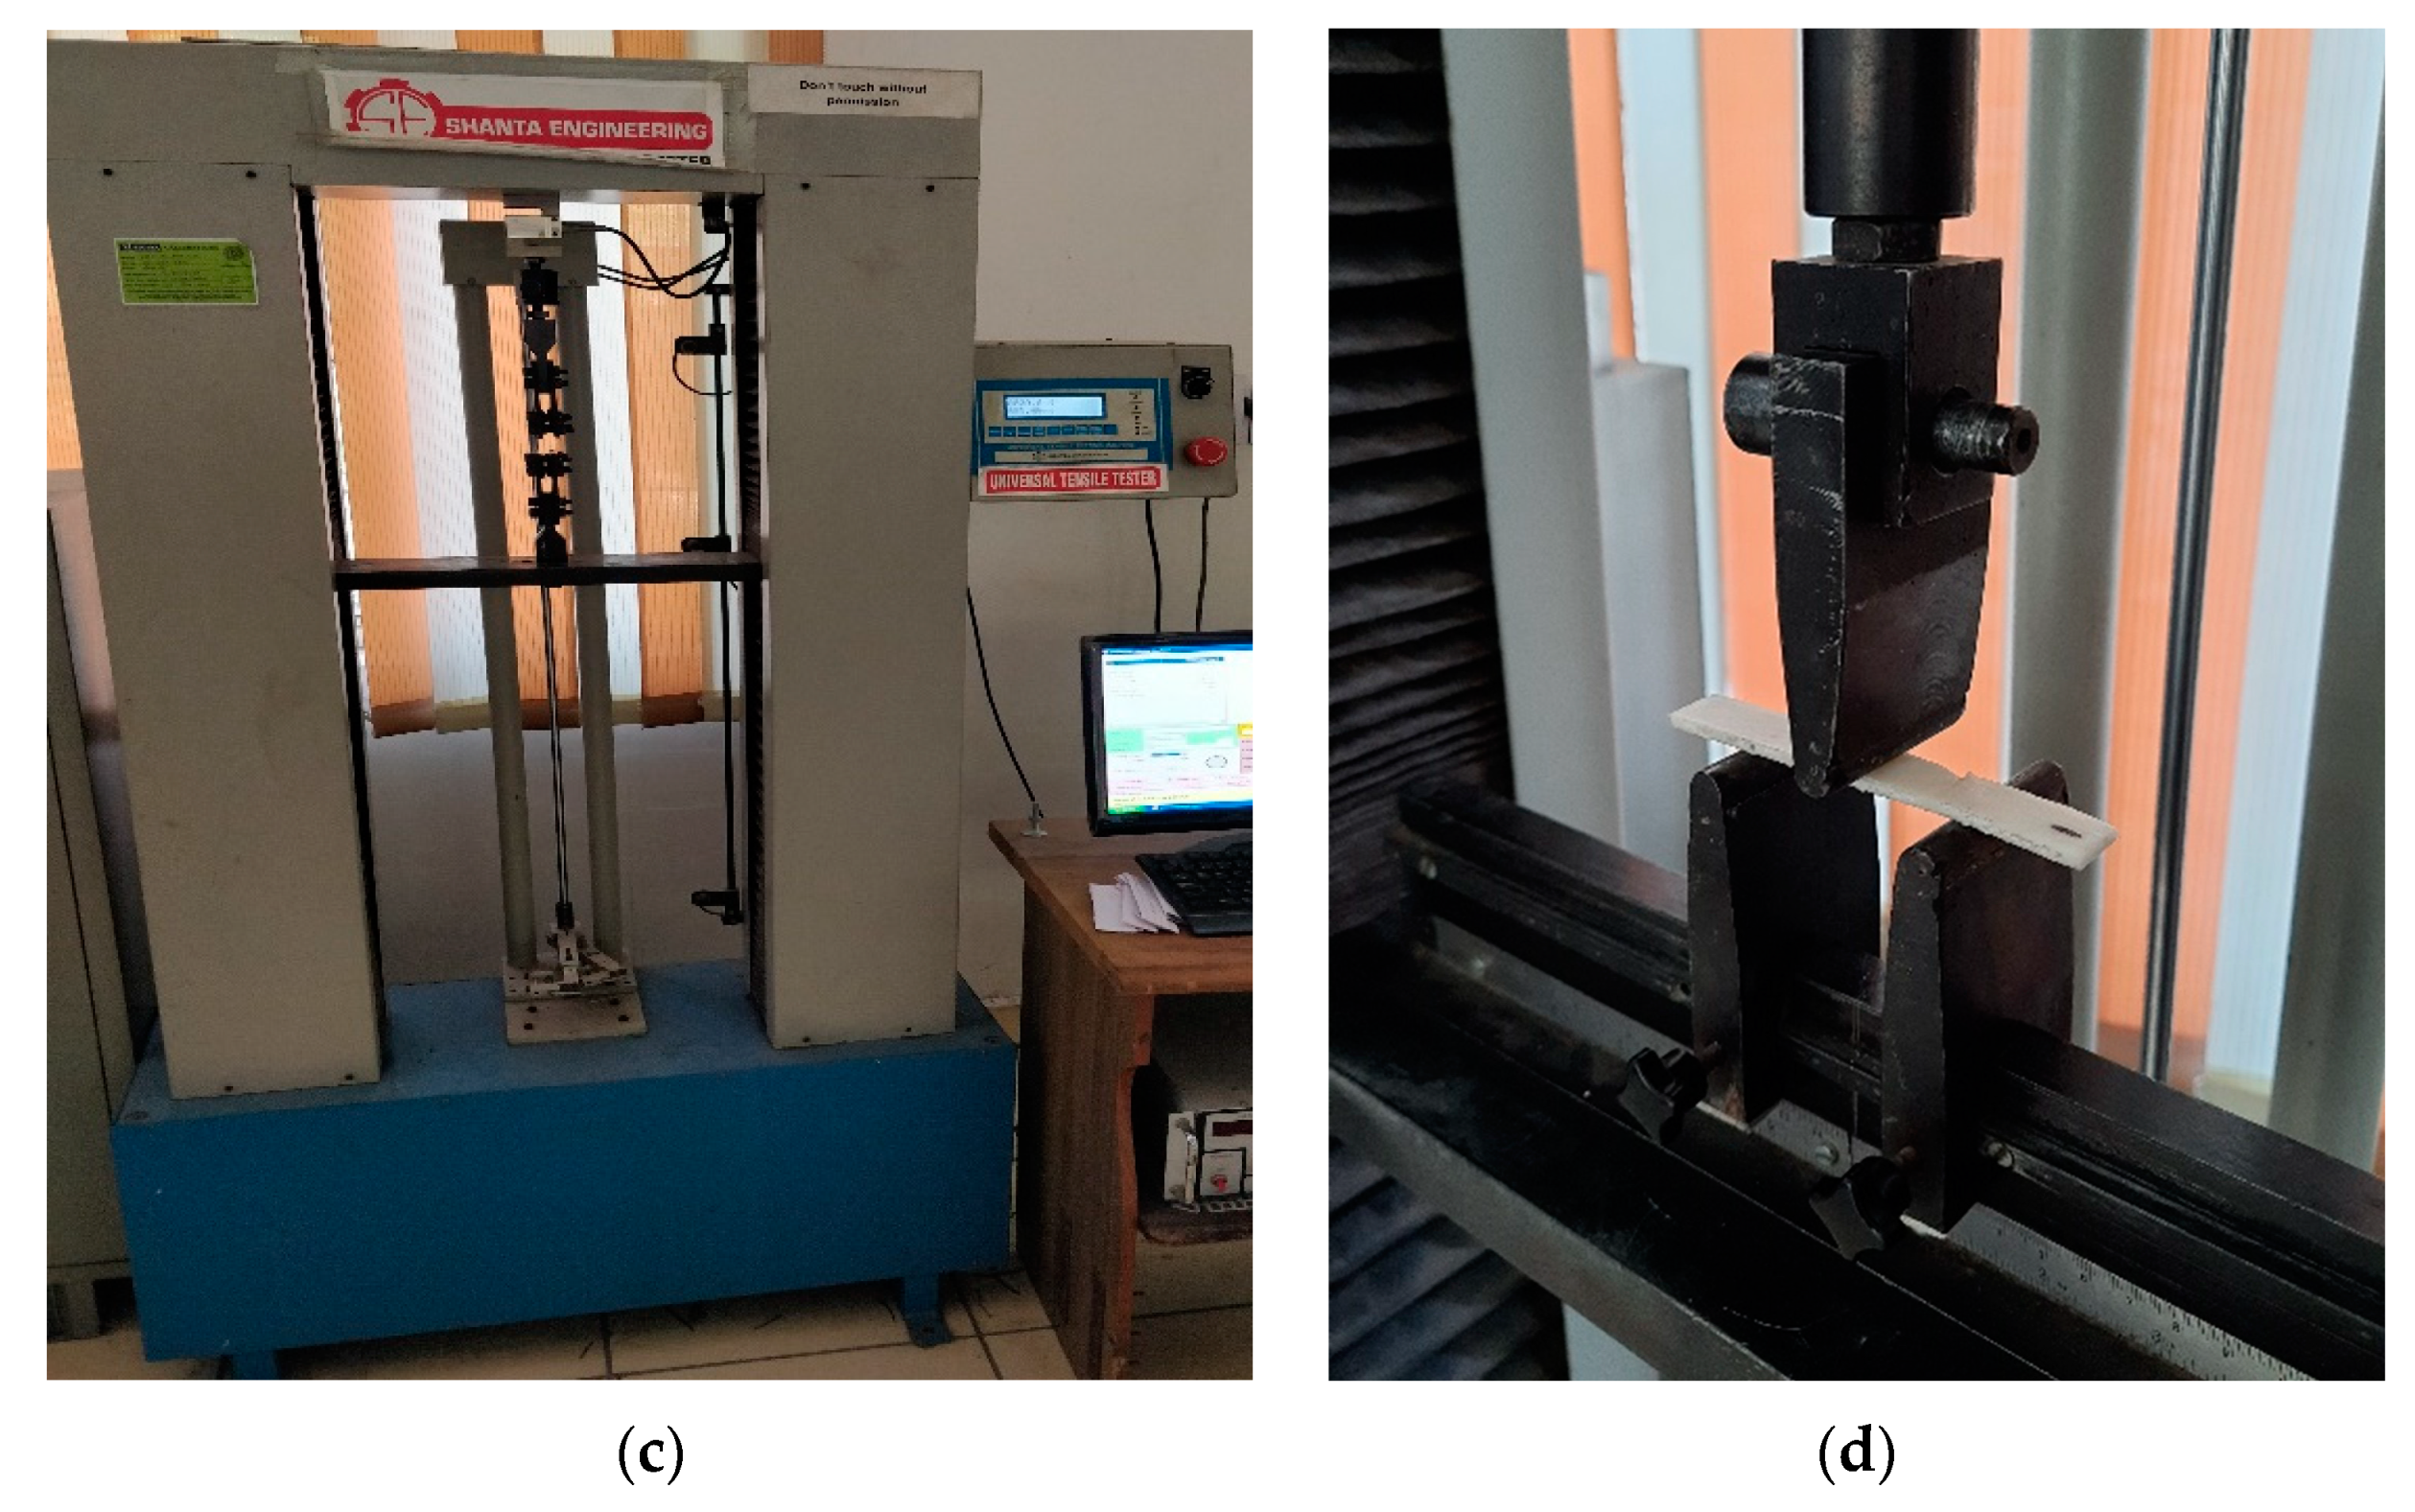
The FFF machine used for the fabrication of test parts was Model I3 supplied by Prusa Research, Prague, Czech Republic and Universal testing machine (UTM) was supplied by Shanta Engineering Pvt. Ltd., Pune, India, as shown in
Figure 9. The UTM was operated at 50 mm/min strain rate with gradual bending load subjected at three points during flexural tests (see
Figure 9d). During tensile testing, the samples were held in two jaws with 52 mm grip separation. The tensile force was exerted gradually at 50 mm/min until the samples were fractured. Afterward, the fracture points of both tensile and flexural test samples were studied using scanning electron microscope (SEM) images which were generated by Model IT500HR supplied by Jeol Ltd. Tokyo, Japan.
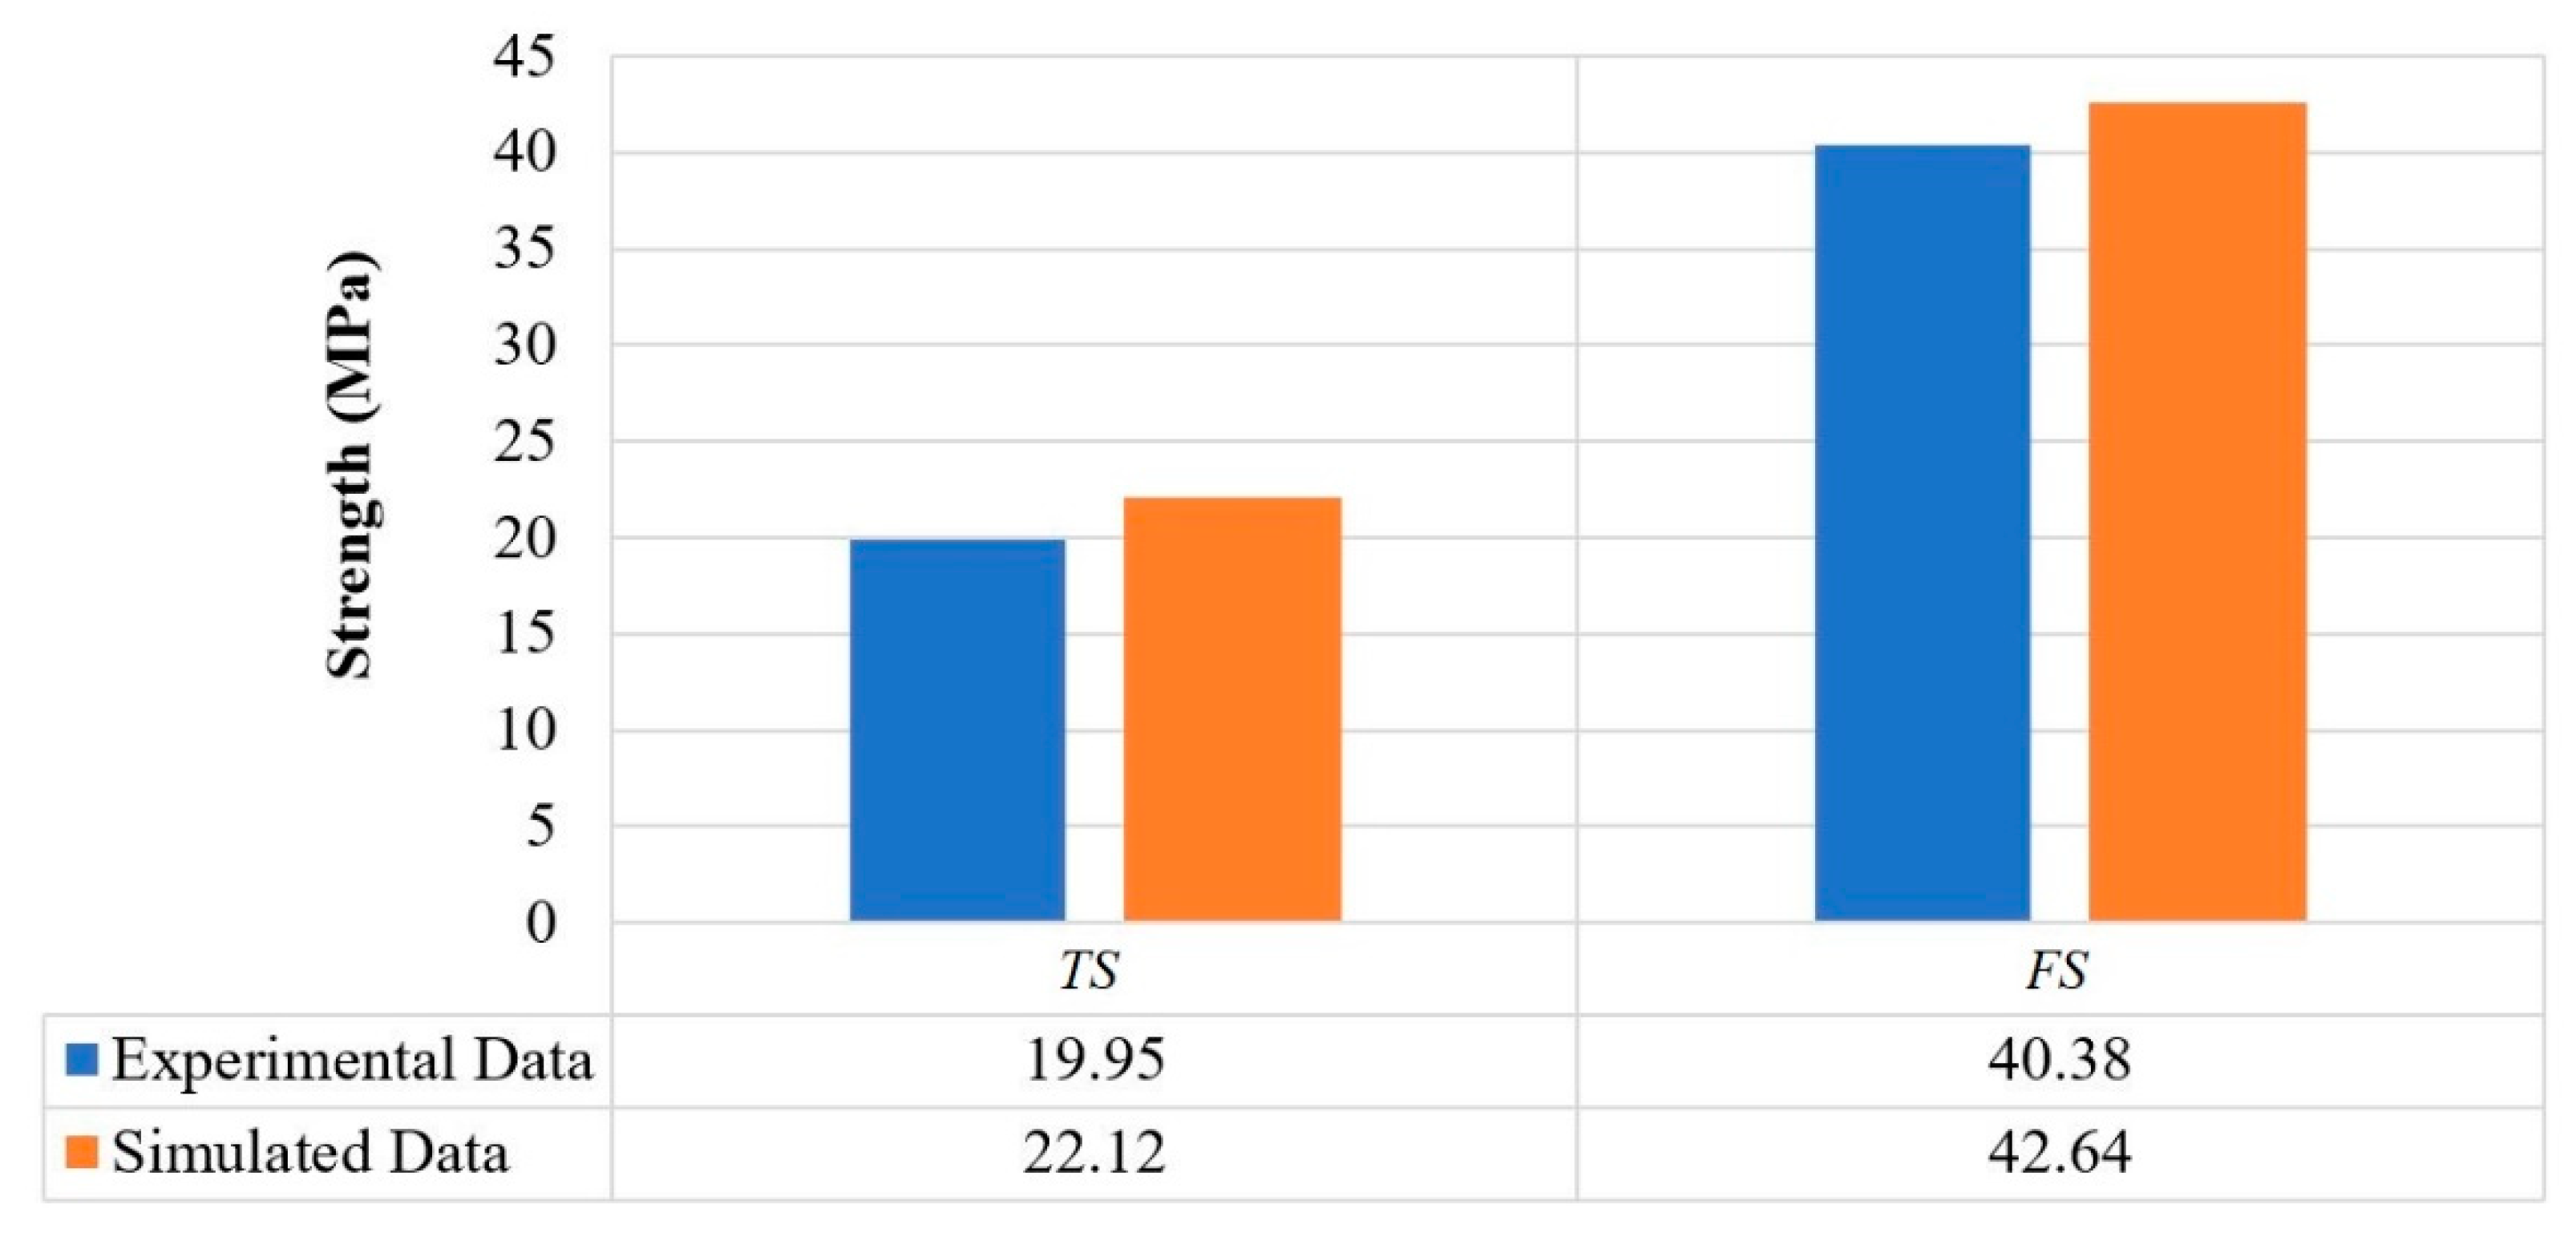
The mechanical strength of parts was measured and compared with simulated results, as shown in
Figure 10. The experimental results were compared with predictions made by the NMRA algorithm at suggested parametric settings. Notably, experimental results were in significant agreement with the modeled data when experiments were performed at optimum parameter settings. The output of NMRA yielded significant and promising results, which may be beneficial for deciding 3D printing and part manufacturing conditions at the commercial level. During mass production and part production, the optimized parametric settings would be utilized to attain desired mechanical properties in products.
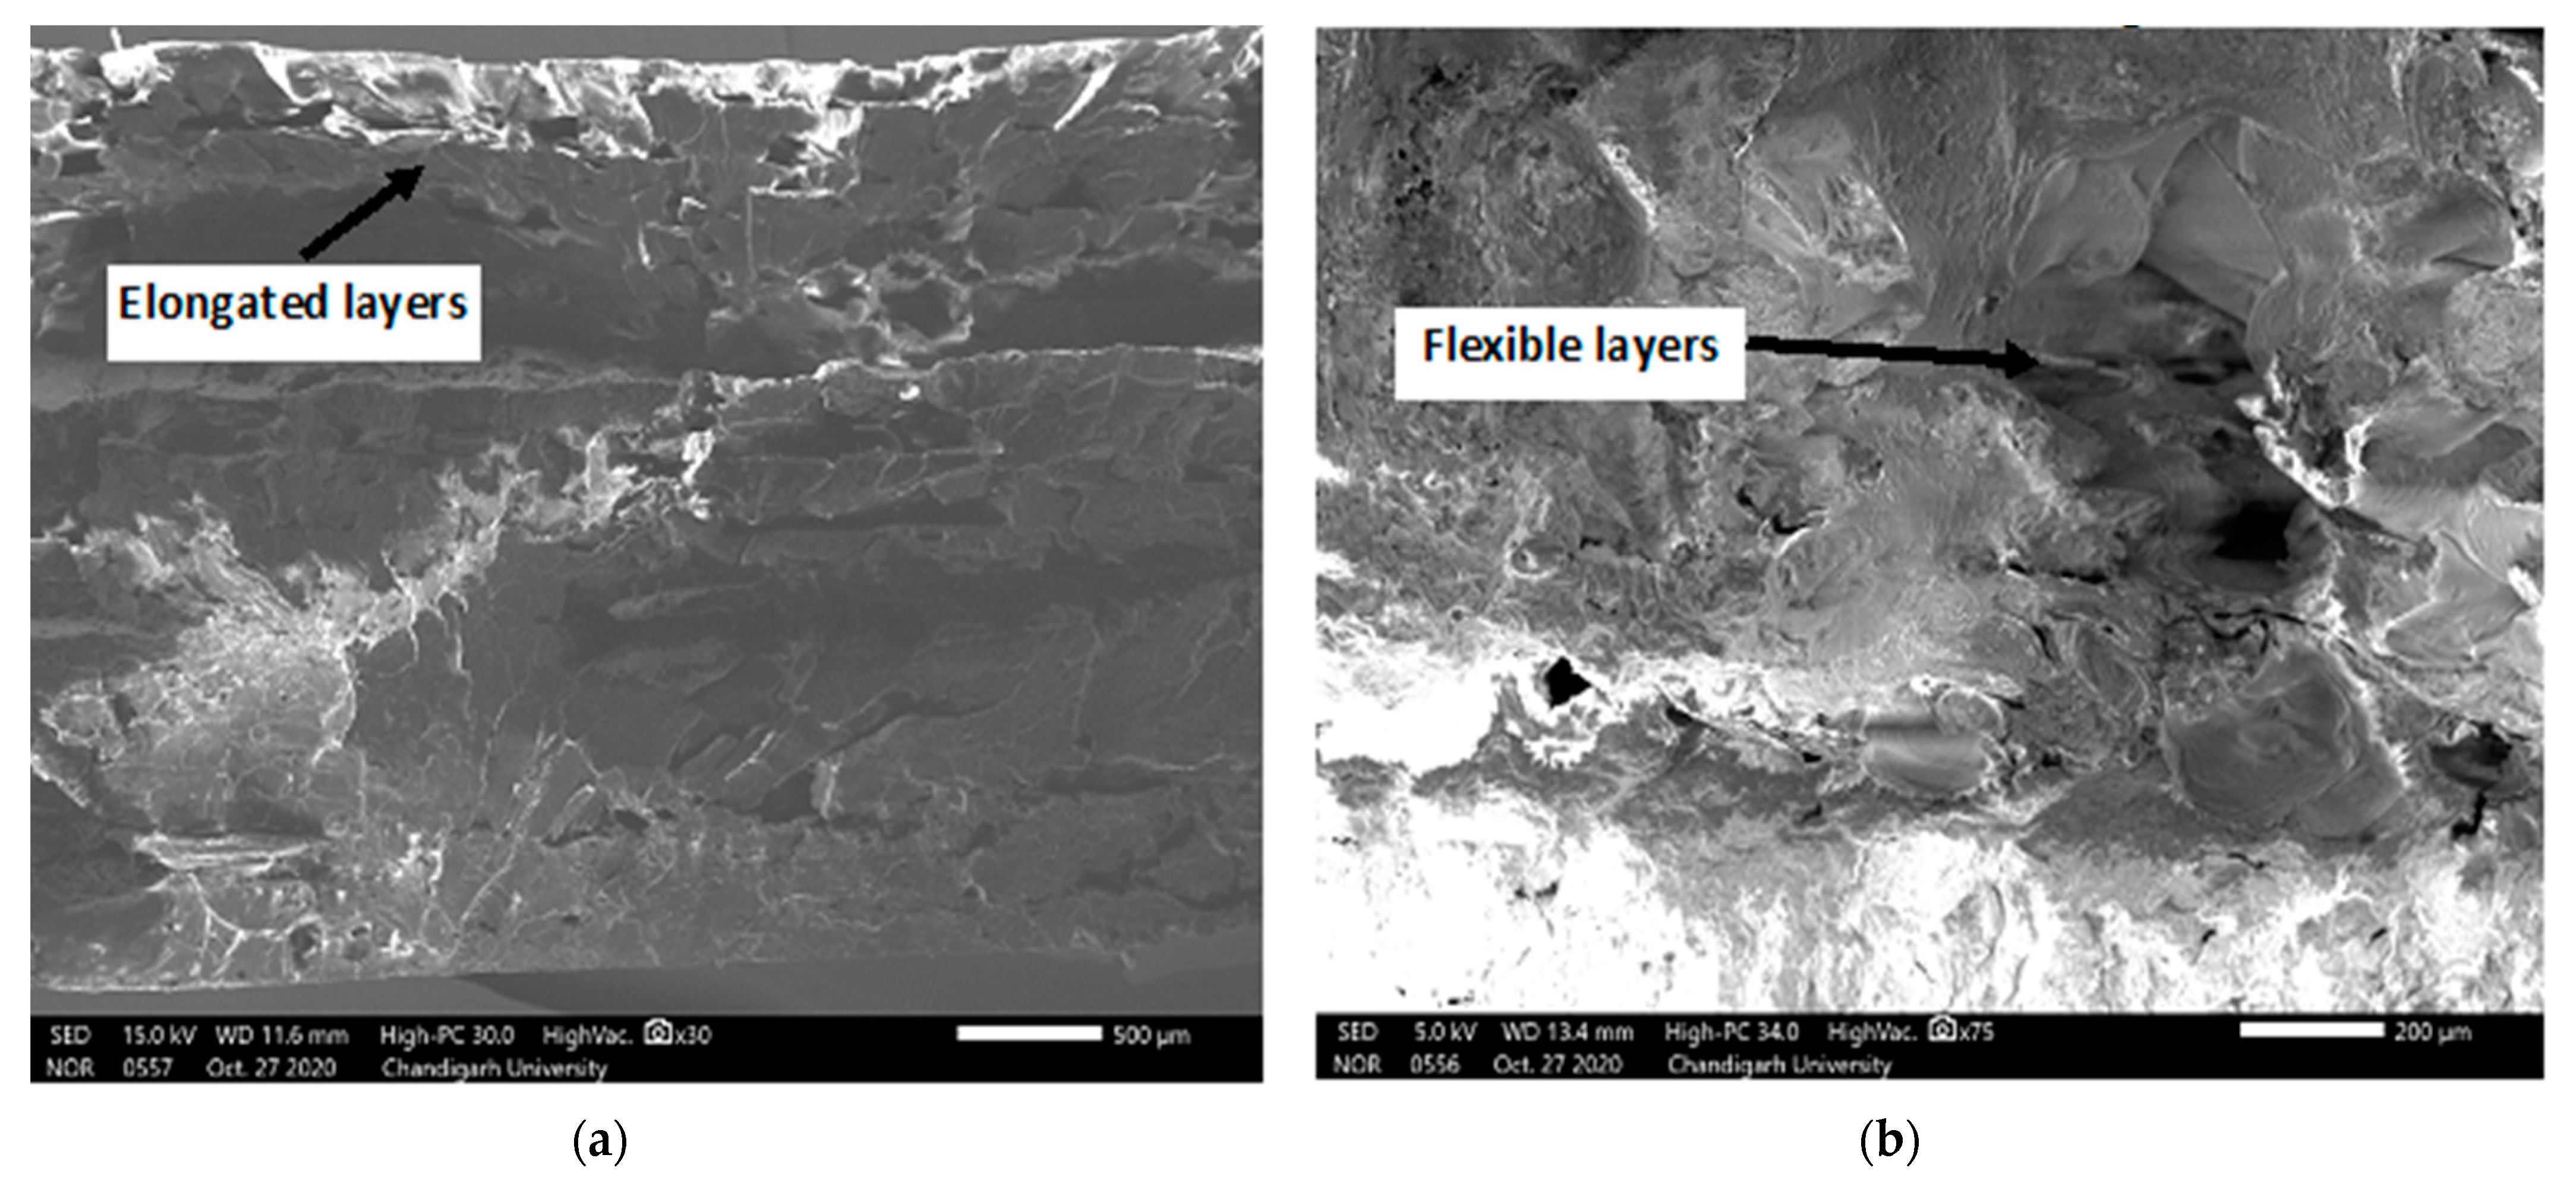
In addition, the SEM images retrieved after mechanical testing reveal the conditions at the location of breakage.
Figure 11a shows the SEM micrographs of tensile test parts, indicating higher flexibility in the layers at the point of failure. A higher elongation was experienced for these parts as an optimized combination of parameters was used. In
Figure 9b, the flexural test sample was photographed. It can be confirmed that failure occurs after extreme elongation due to flexibility induced in parts. The mechanical strength and flexibility attained at this location reveal the strategic selection of parametric levels.


 ,
, 


