Experimental and Numerical Investigation on the Tip Leakage Vortex Cavitation in an Axial Flow Pump with Different Tip Clearances


1
Research Center of Fluid Machinery Engineering and Technology, Jiangsu University, 301 Xuefu Road, Zhenjiang 212013, China
2
Key Laboratory (Fluid Machinery and Engineering Research Base) of Sichuan Province, Xihua University, Chengdu 610039, China
*
Author to whom correspondence should be addressed.
Processes 2019, 7(12), 935; https://doi.org/10.3390/pr7120935
Submission received: 3 September 2019
/
Revised: 19 November 2019
/
Accepted: 26 November 2019
/
Published: 9 December 2019
(This article belongs to the Section Advanced Digital and Other Processes)
Abstract
:The tip gap existing between the blade tip and casing can give rise to tip leakage flow and interfere with the main flow, which causes unstable flow characteristics and intricate vortex in the passage. Investigation on the tip clearance effect is of great important due to its extensive applications in the rotating component of pumps. In this study, a scaling axial flow pump used in a south-north water diversion project with different sizes of tip clearances was employed to study the tip clearance effect on tip leakage vortex (TLV) characteristics. This analysis is based on a modified turbulence model. Validations were carried out using a high-speed photography technique. The tip clearance effect on the generation and evolution of TLV was investigated through the mean velocity, pressure, and vorticity fields. Results show that there are two kinds of TLV structures in the tip region. Accompanied by tip clearance increasing, the viscous loss in the tip area of the axial flow pump increases. Furthermore, the tip clearance effect on pressure distribution in the blade passage is discussed. Beyond that, the tip clearance effect on vortex core pressure and cavitation is studied.
1. Introduction
In the past decades, the speedy development of hydraulic power plants [1] and water pump factories [2] has greatly stimulated research investigating different kinds of flow pumps worldwide. Axial flow pumps have been widely used in water transfer engineering [3], nuclear power engineering [4], water jet propulsion of ships [5], and submarine-launched equipment [6]. The existence of tip clearance between the blade tip and the casing is unavoidable in axial turbomachines, which induces tip leakage flow (TLF). TLF curls into a tip leakage vortex (TLV). Especially, in axial flow pumps, tip leakage vortex cavitation is a common phenomenon that occurs in the center of TLV [7]. Some researchers have developed cavitation models that are able to deal with the numerical description of phase separation [8,9]. Unsteady flow in tip clearance was found to be responsible for the blockage, reduction of efficiency, and operation instabilities [10].
Comprehensive studies have investigated the effect of tip gap sizes on the operating performance and flow characteristics in rotating machinery. Tan et al. [11,12] studied the operating performance and flow patterns of mixed flow pumps with different tip gap sizes experimentally and numerically. The results showed that an increase of the tip clearance has adverse effects on the pump efficiency and head. Similar results were also obtained in a water jet pump by Kim [13,14], in that the difference in efficiency because of the gap variation (1.5% and 0.7% of the diameter) was about 25% in the overall efficiency. A deeper investigation was conducted in compressors [15,16,17]. Enlarging the gap caused a larger TLV size and changed the distribution of static pressure along the blade chord. Particle image velocimetry (PIV) measurements found that with the fortification of the tip gap size, the absolute tangential velocity was reduced and boundary layer of the sidewall casing became thicker.
To reveal the internal flow characteristics near the tip clearance region in hydraulic turbomachineries, numerical studies have been carried out [18,19,20,21]. The tip leakage vortex (TLV) was found to be the main reason for the degradation of pump performance. The pressure difference between the blade pressure side (PS) and suction side (SS) results in the generation of TLV. The TLV and induced cavitation move from the blade tip to the flow channel, become larger in size, and collapse when accessing the neighboring blade. The TLV is usually accompanied by tip clearance cavitation and shear layer cavitation. These complex cavitation interfere with each other, reduce the blade load, and induce flow instability.
Recently, particular attention has been paid to the generation and influence of TLV due to its significant impact on pump performance and operation stability. The phenomena of TLV was discovered by Rains [22]. Inspired by the significant discovery, the oil-paint test was employed to investigate the development of TLV and the development of other important secondary flows by Zierke and Straka [23]. The momentary and phase-averaged inner structure of the TLV within an axial waterjet pump was studied using PIV by Miorini et al. [24]. Katz et al. [25] investigated the effect of large-scale cavitating vertical structures in an axial waterjet pump. The TLV cavitation and secondary vortex cavitation induced by TLV was studied. Besides experimental investigations, computational fluid dynamics (CFD) has huge advantage in obtaining the details of the evolution of TLV. A turbo-machinery tip clearance flow was studied using large eddy simulation by Tan et al. [26,27]. Gross features of the TLV, tip separation vortices, and blade wake were displayed by investigating their corresponding trajectories and average velocity fields. The tip leakage flows and related cavitation in the tip region of an axial flow pump were investigated experimentally and numerically by Shi et al. [28,29]. The cavitating patterns for different cavitation conditions were illustrated. The cavitation facilitated the development of TLV. The swirling strength method was employed to obtain the TLV trajectories. The experiment was simulated by a modified SST k-ω turbulence model by Zhang et al. [30,31]. The start point of TLV was found to be dependent on the flow rate condition and the size of the tip clearance.
In this paper, the effects of different tip clearances on the TLV characteristics of an axial flow pump were investigated systematically. A modified turbulence model was employed to study the characteristics of TLV and induced cavitation. This paper is organized as follows. The experimental part is clarified in Section 2. The mathematical model and computational method are presented in Section 3. The results and discussion are illustrated in Section 4. The experimental results are illustrated in Section 4.1 and Section 4.2. The numerical results are illustrated in Section 4.3, Section 4.4, Section 4.5 and Section 4.6. The conclusion is given in Section 5.
2. Experimental
2.1. Geometrical Model
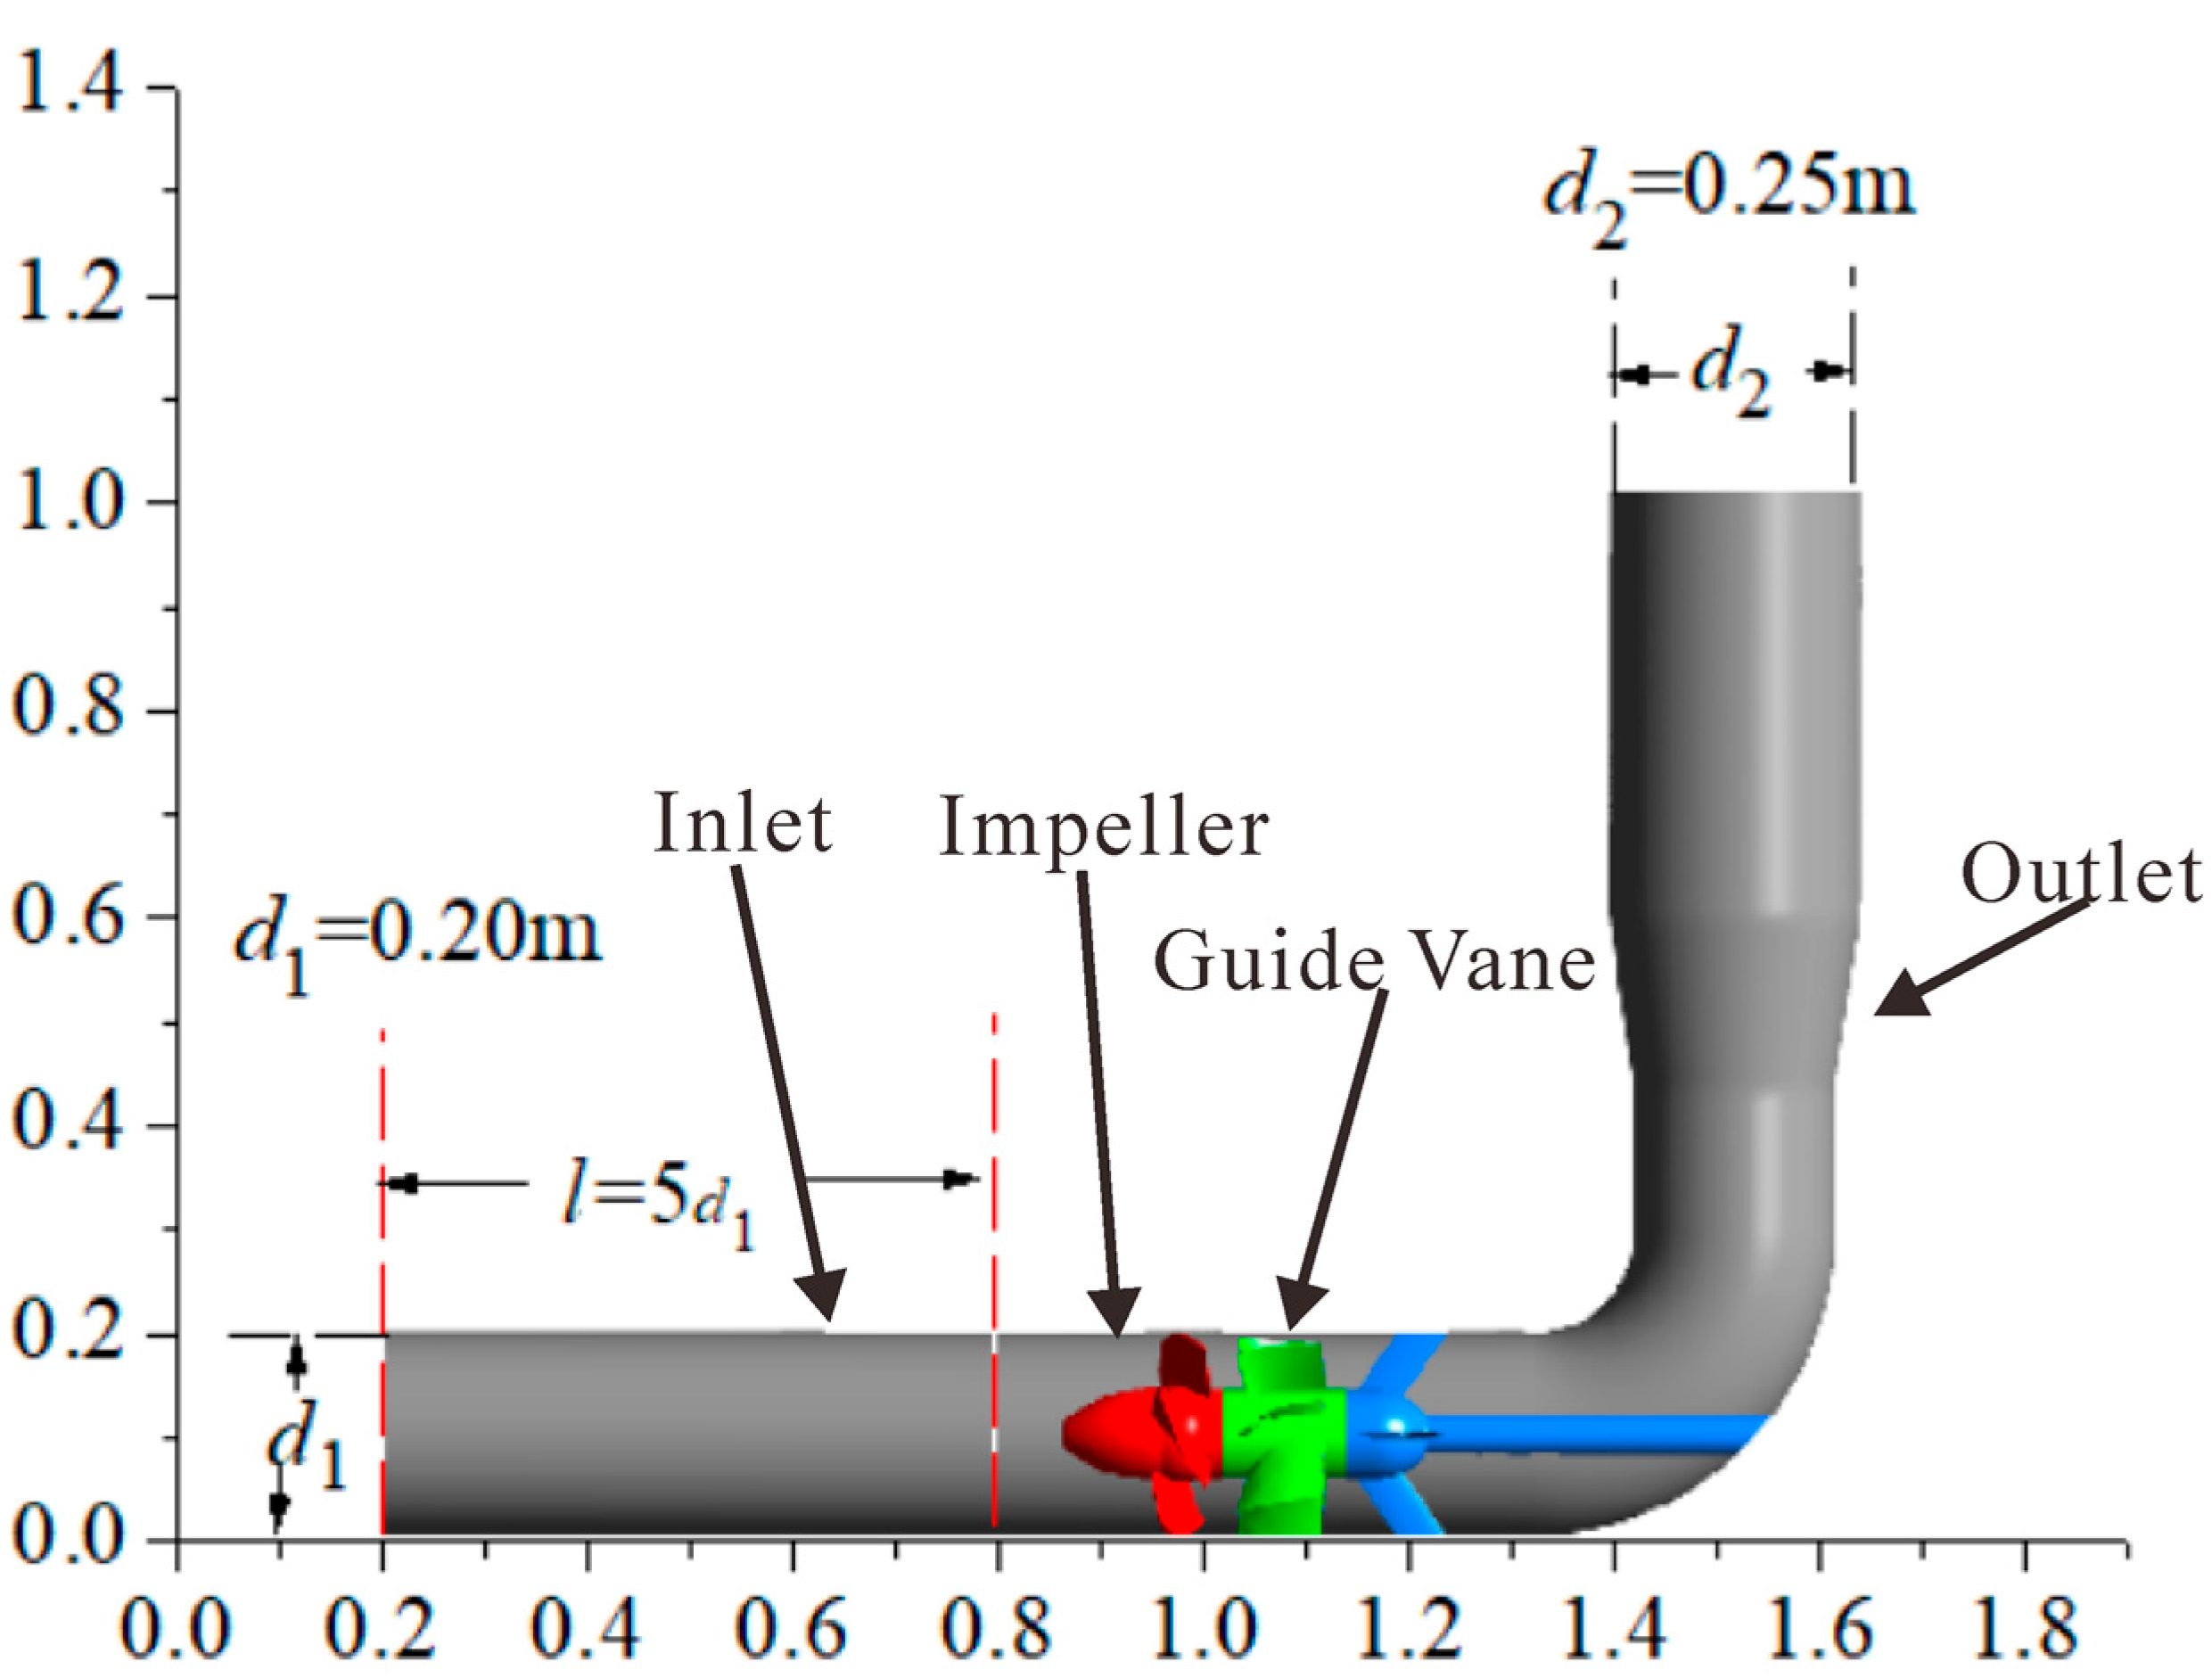
In this paper, the scaled model pump of TJ04-ZL-02 hydraulic model, which is employed in the south-to-north water transfer project, was selected as the prototype pump. The model pump, with a diameter of 200 mm of its equal-scaling impeller, was employed as the research object. The geometrical parameters of the model pump are as follows: Impeller diameter, D2 = 200 mm; flow rate best efficiency point, Qopt = 365 m3/h; head, H = 3.2 m; rotation speed, n = 1450 r/min; tip chord length, c = 112 mm; hub radius of the impeller blade, ht = 45 mm; blade height, h = 54.5 mm; and maximum thickness of the blade tip profile, t = 5.9 mm. The number of impeller blades is Z = 3, and the number of guide vane blades is Zd = 7. The tip clearance size was set to be τ = 0.5 mm and τ = 1.5 mm. A schematic illustration of the model pump structure is shown in Figure 1. The pump model was designed to be visualized in a transparent casing. It consists of an inlet pipe, impeller, the guide vane diffuser, shaft, supporting rib, and outlet pipe.
2.2. Apparatus and Procedure
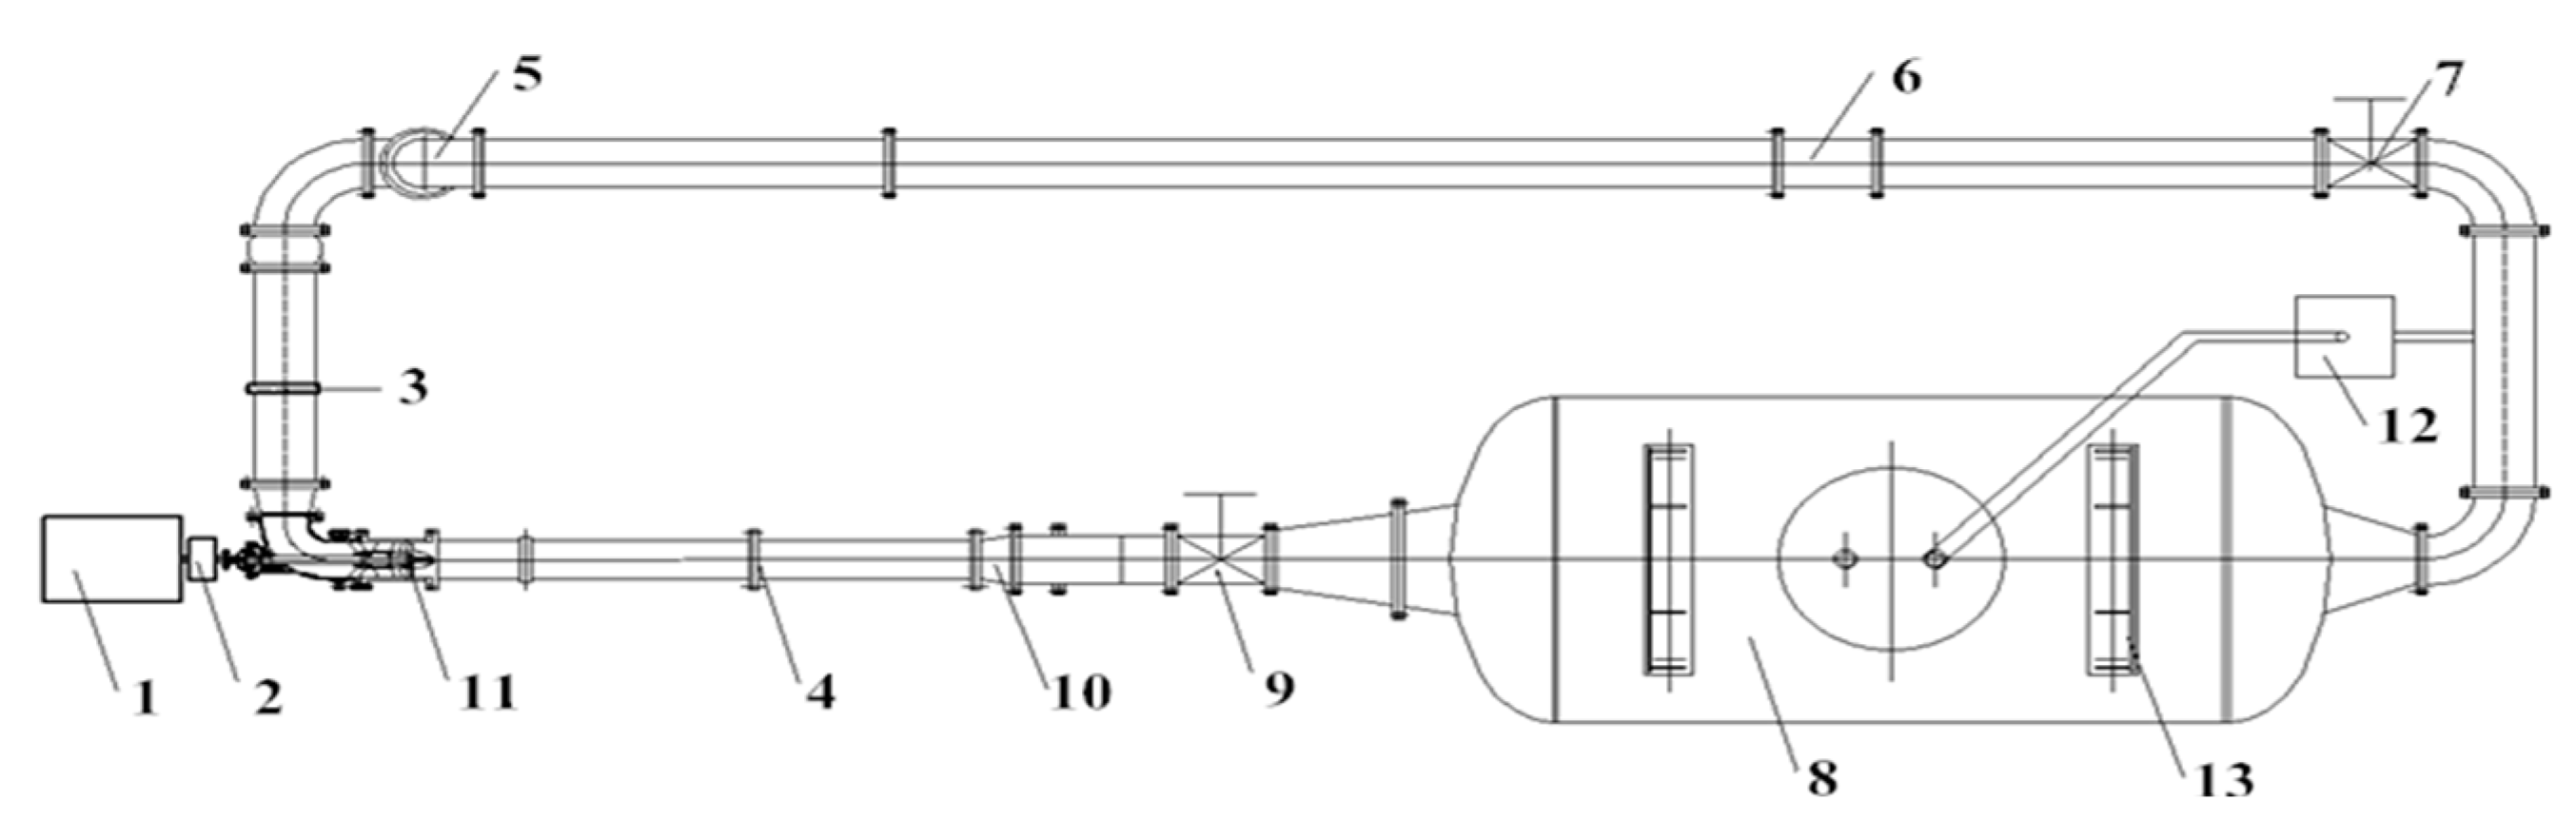
In this paper, the visualization experiment was carried out in a closed test loop at the National Fluid Machinery Laboratory, Jiangsu University, as shown in Figure 2. The test loop consisted of the following parts: 1. Electric motor; 2. torque meter; 3. outlet section; 4. inlet section; 5. booster pump; 6. turbine flow meter; 7. outlet gate valves; 8. water tank; 9. inlet gate valves; 10. flexible connection; 11. test pump section; 12. vacuum pump; and 13. cavitation tank. The impeller chamber is made of transparent Perspex, and its refractive index is close to that of water. This design facilitated high-speed imaging experiments for the axial flow pump. The pressure sensors located at part 3 and part 4 obtained the outlet and inlet pressure value of the test pump, respectively. The pressure head was obtained by following equation:
where is the outlet pressure measured at location 3, is the inlet pressure measured at location 4, is the density of the working fluid, and g is the acceleration of gravity. The flow rate, pressure at inlet and outlet, rotating speed of the impeller, and the cavitating images can be obtained through the procedure.
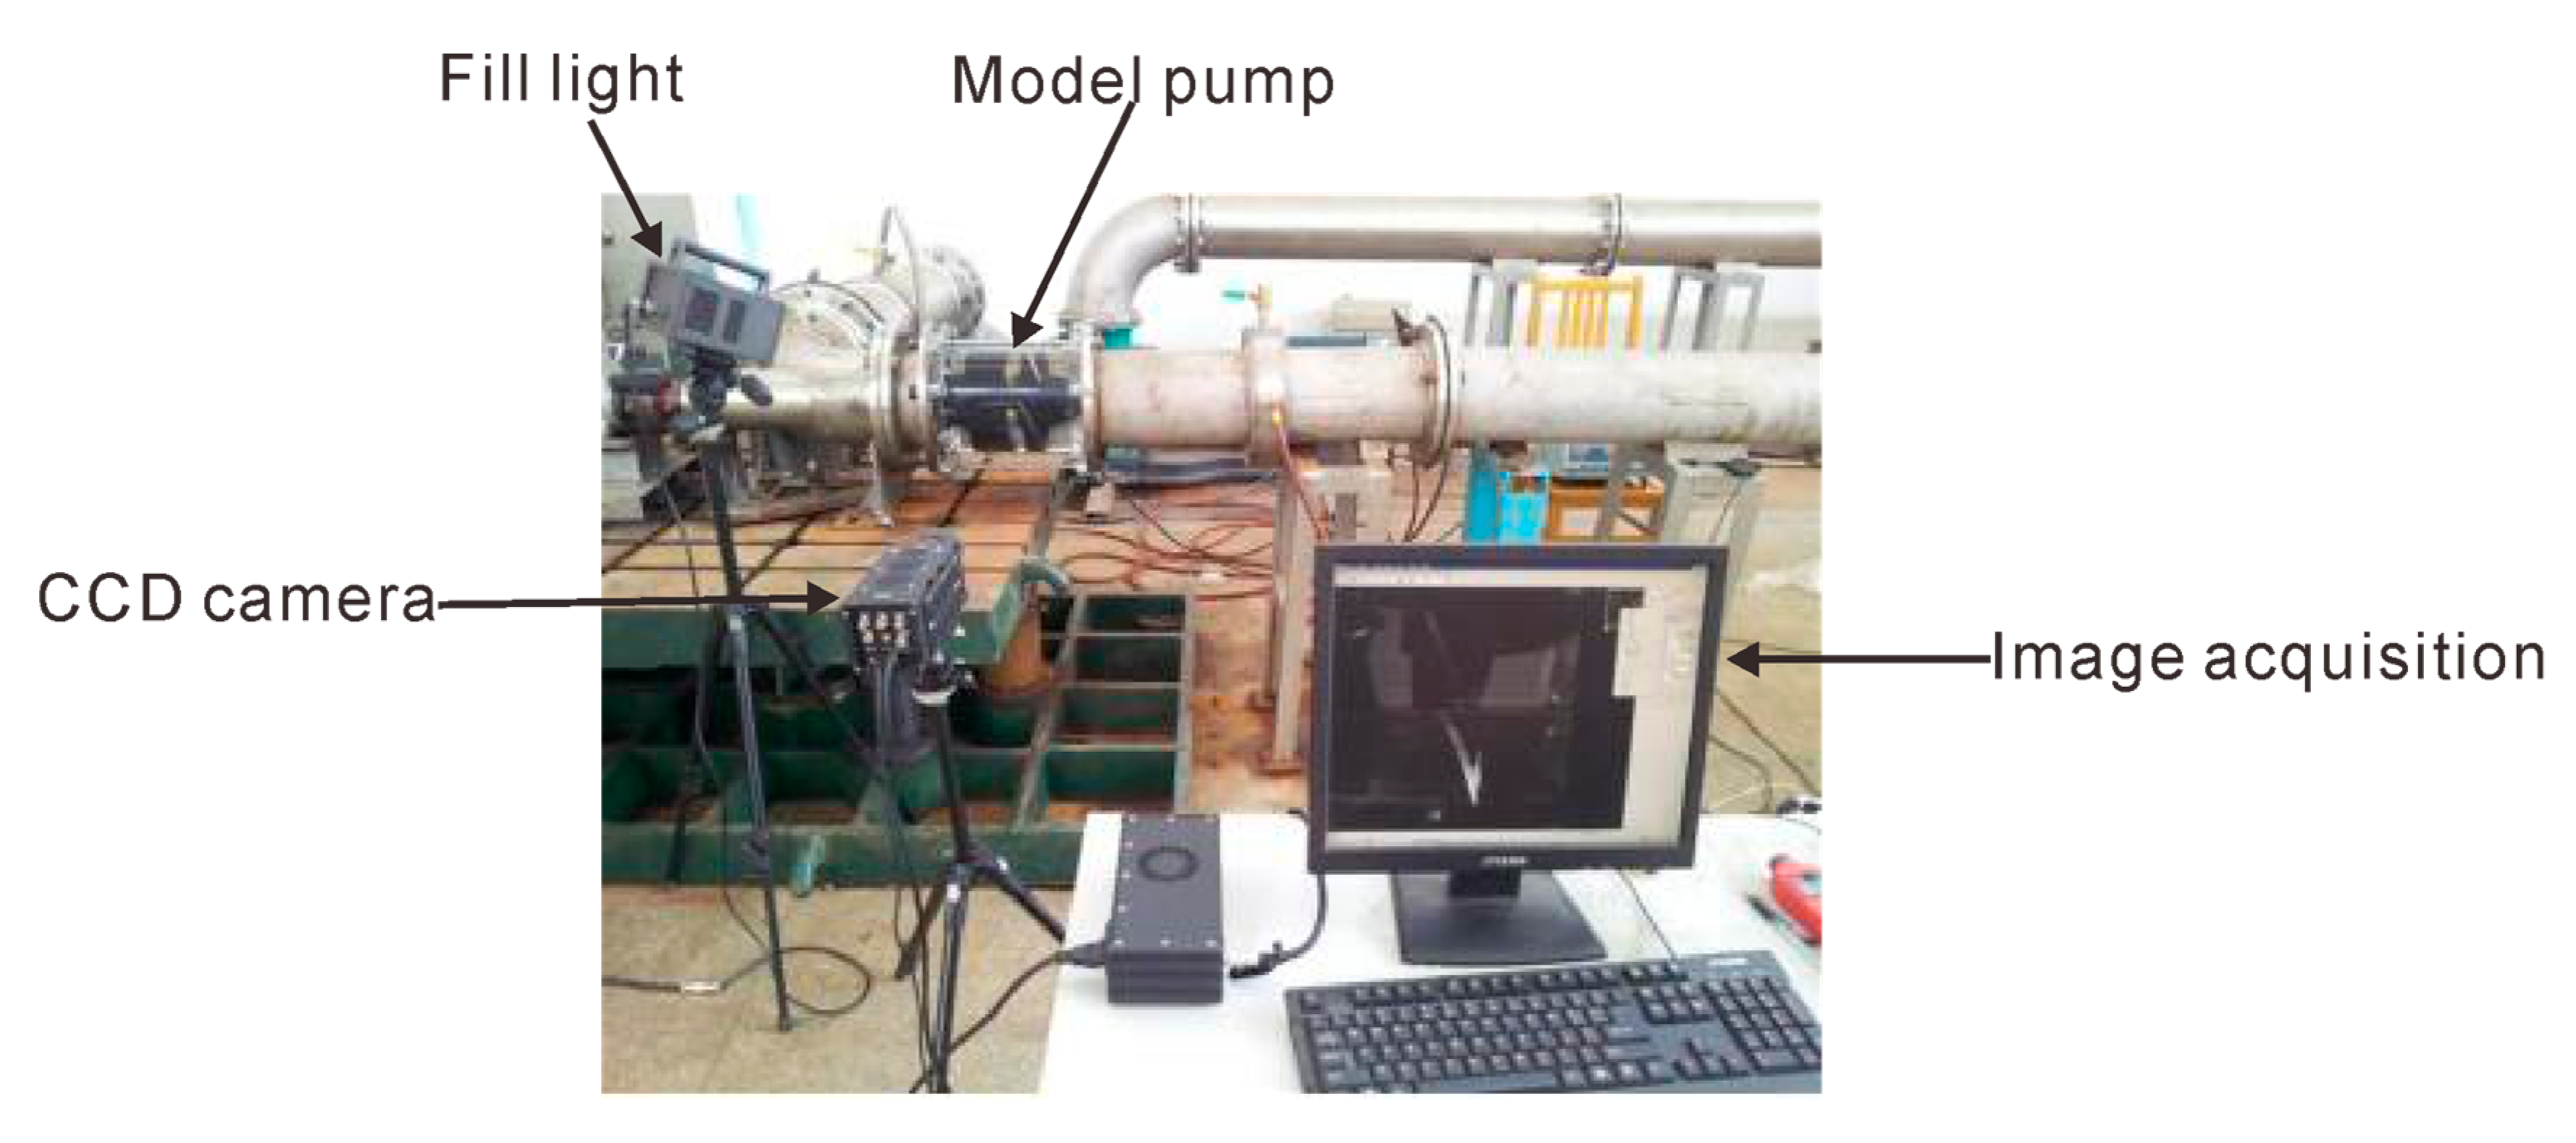
A schematic illustration of the high-speed imaging system is shown in Figure 3. It consists of a CCD (Charge Coupled Device) camera, a model pump, fill lights, and an imaging acquisition computer. The model of the high-speed digital video camera was IDE Y-series 4L. The sampling frequency and the exposure time were set to be 5000 Hz and 107 μs, respectively. To facilitate illumination at high frame rates, a 750-W continuous halogen light was employed.
3. Mathematical Model and Computational Method
3.1. Turbulence Simulation
The standard turbulence model is widely used for simulating turbulent flows. The eddy viscosity coefficient is related to the turbulent kinetic energy and the turbulent kinetic energy dissipation in this turbulence model. The governing equation is shown as follows:
where is the density, is the time, is the velocity, is the spatial coordinate, and is the dynamic viscosity. Spalart and Shur [32] proposed a modified turbulence model considering rotational curvature. The results showed that this modification could be applied in a turbulence model. The accuracy of prediction could be enhanced. The modification method is to perform rotation-curvature correction on the turbulent kinetic energy generation term shown as follows:
where and represent the strain and vorticity tensor components, respectively.
3.2. Mesh Arrangement and Numerical Setup
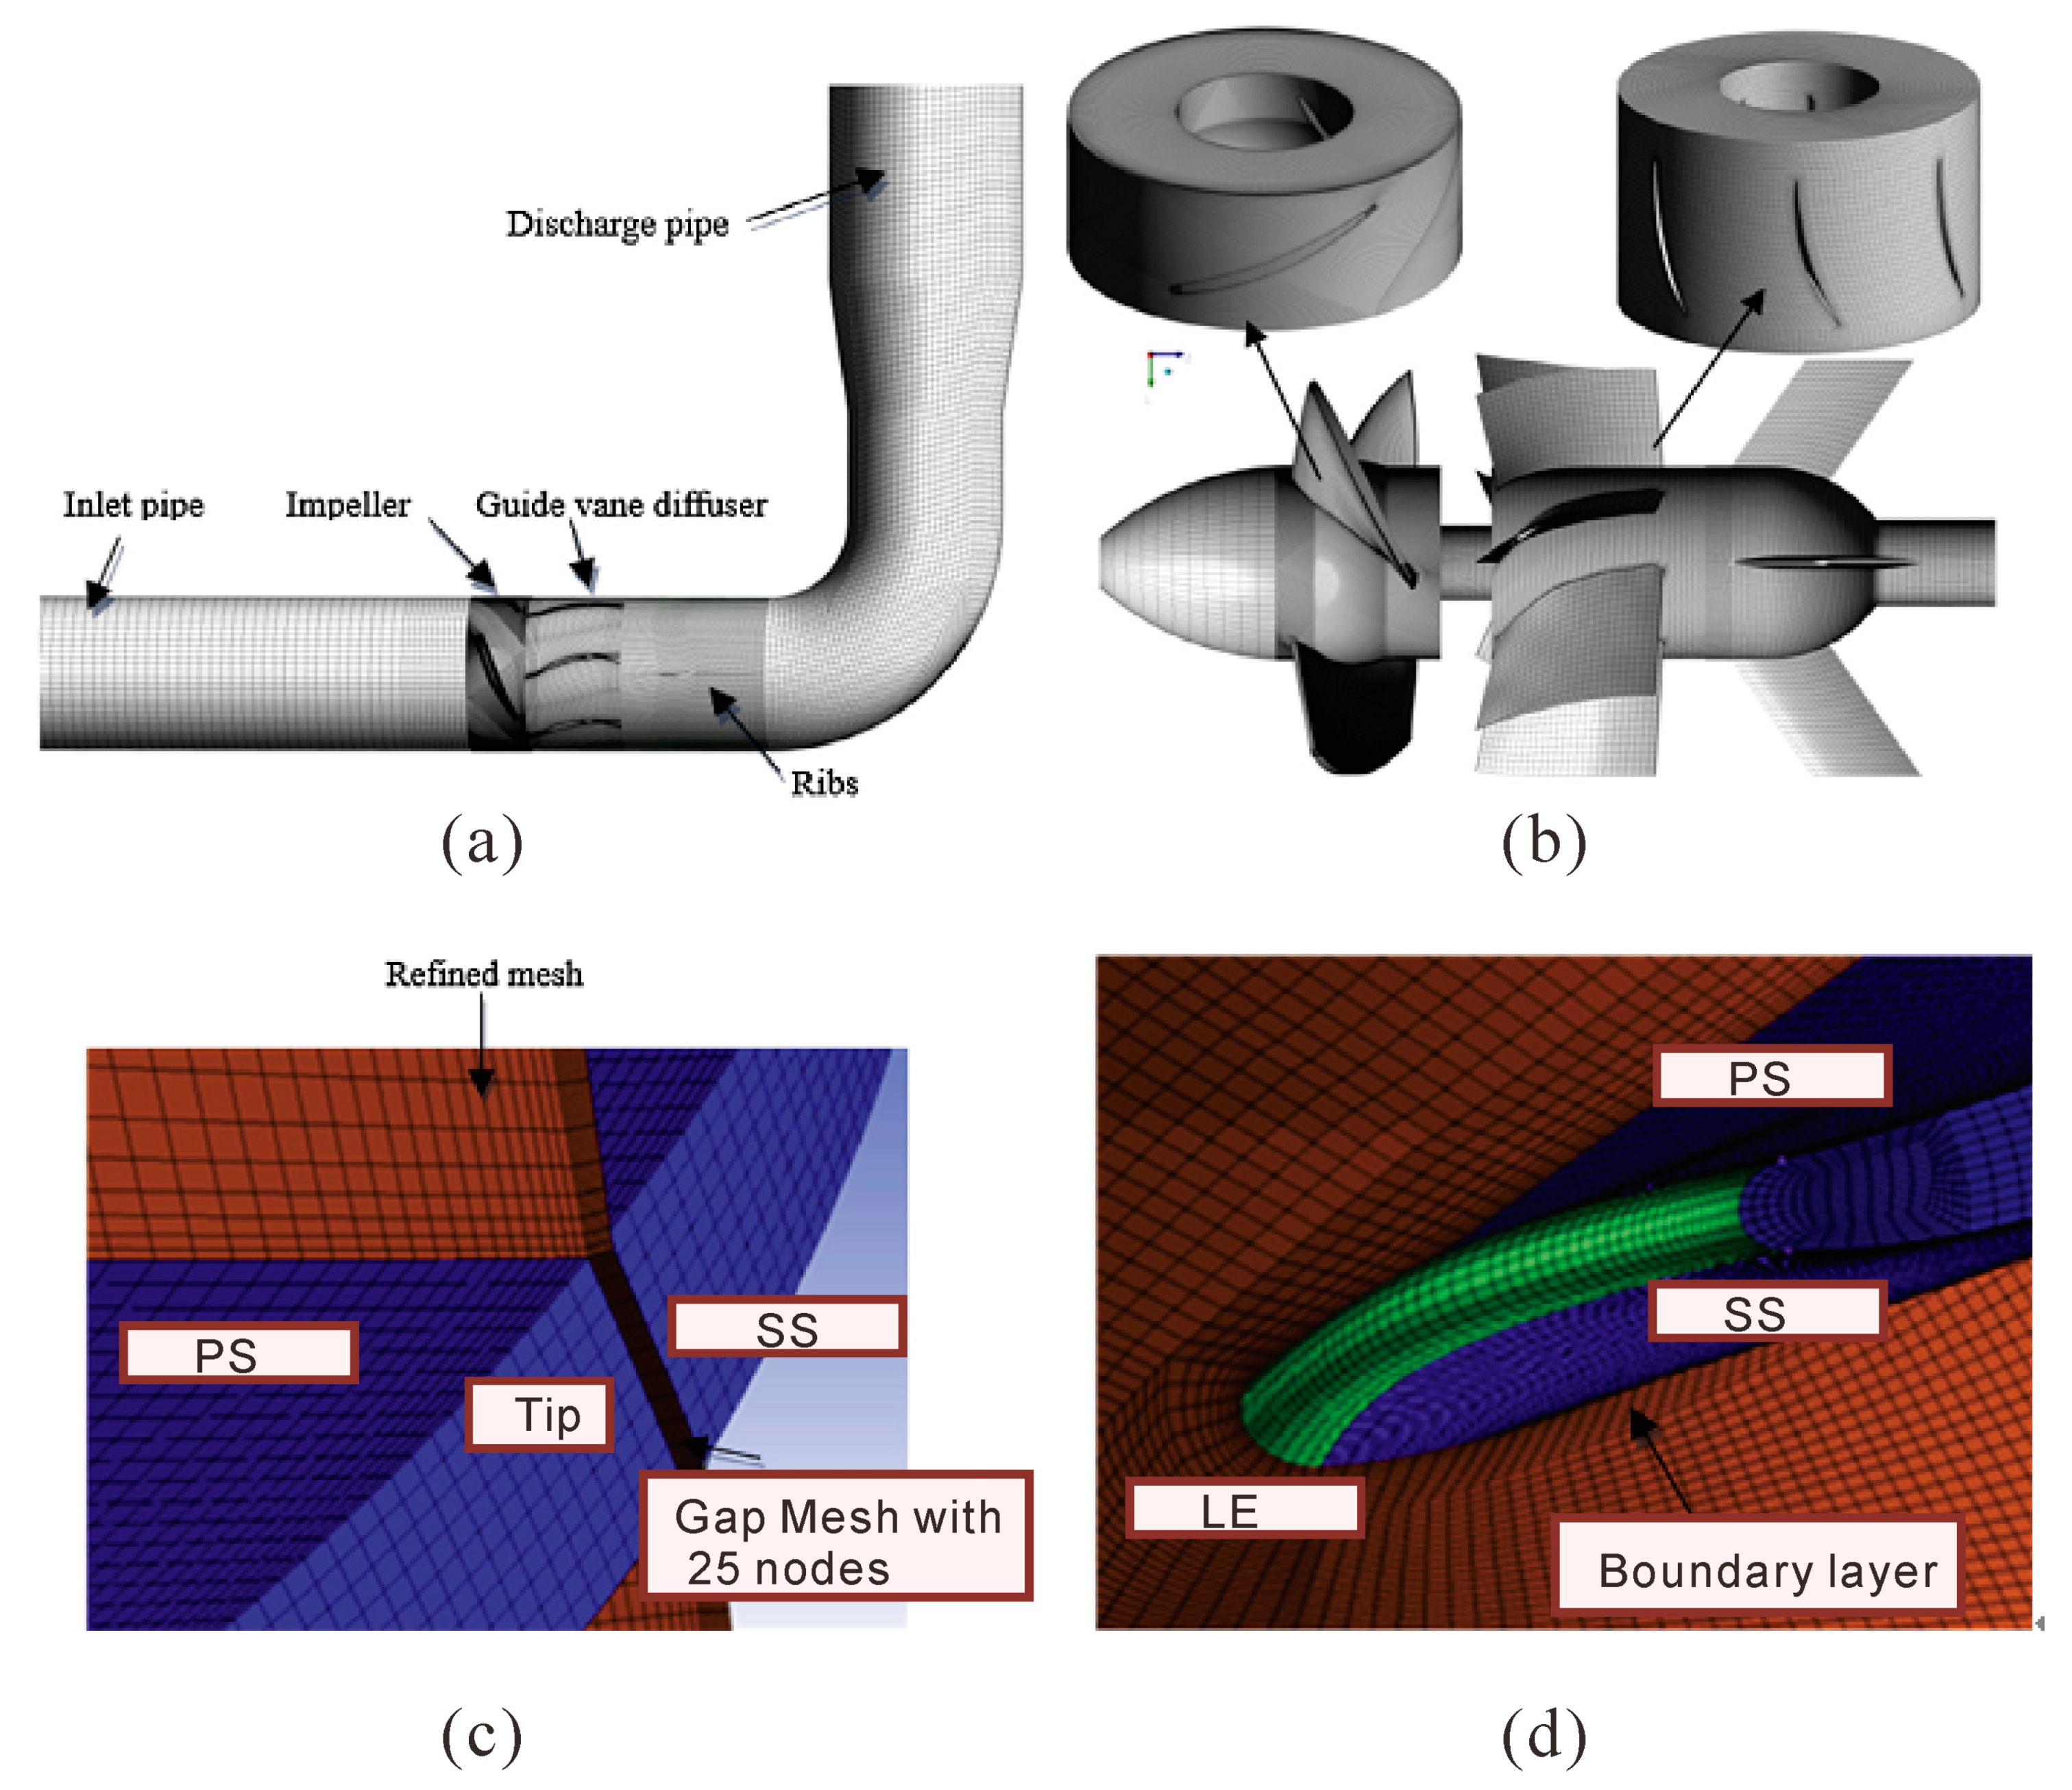
As shown in Figure 4a, the computational domain was divided into five parts: The inlet pipe part, impeller part, guide vane diffuser part, rib part, and discharge elbow pipe part. The impeller part with the tip clearance region was set to be a rotating zone and the remaining parts were set to be stationary zones. In the present work, structured hexahedral meshes were employed for the whole computational domain. The structured mesh of the main components is shown in Figure 4b.
To accurately simulate the flow characteristics near the blade, the O topology method and [33] local mesh refinement were employed around the blade as shown in Figure 4c. The tip clearance with a size of 0.5 and 1.5 mm was filled with different mesh nodes, as shown in Figure 4d.
A boundary layer mesh was created to ensure the y+ on the surface was in a proper range, and the near-wall treatment for the omega-based model was used for the wall treatment [34,35]. The height of the first layer mesh that was perpendicular to the wall surface was set to be 0.002 and 0.003 mm, respectively. Based on the mesh independence study, the mesh information is shown in Table 1. The y+ was defined as follows:
where is the wall shear stress, is the vertical distance from the wall, is the density of fluid, and is the kinematic viscosity.
The unsteady simulations were performed using the CFD software ANSYS CFX. The modified turbulence model was used for turbulence closure. The governing equations were discretized with a second-order scheme in space and a first-order scheme in time and solved by the semi-implicit method for pressure-linked equations (SIMPLE). The inlet boundary was imposed on the pipe inlet, which was defined as the total pressure, while the outlet boundary condition was set as the mass flow rate. All the physical surfaces were set as no-slip walls. The convergence precision was set as 10−5.
4. Results and Discussion
4.1. Validation of the Simulation Methods
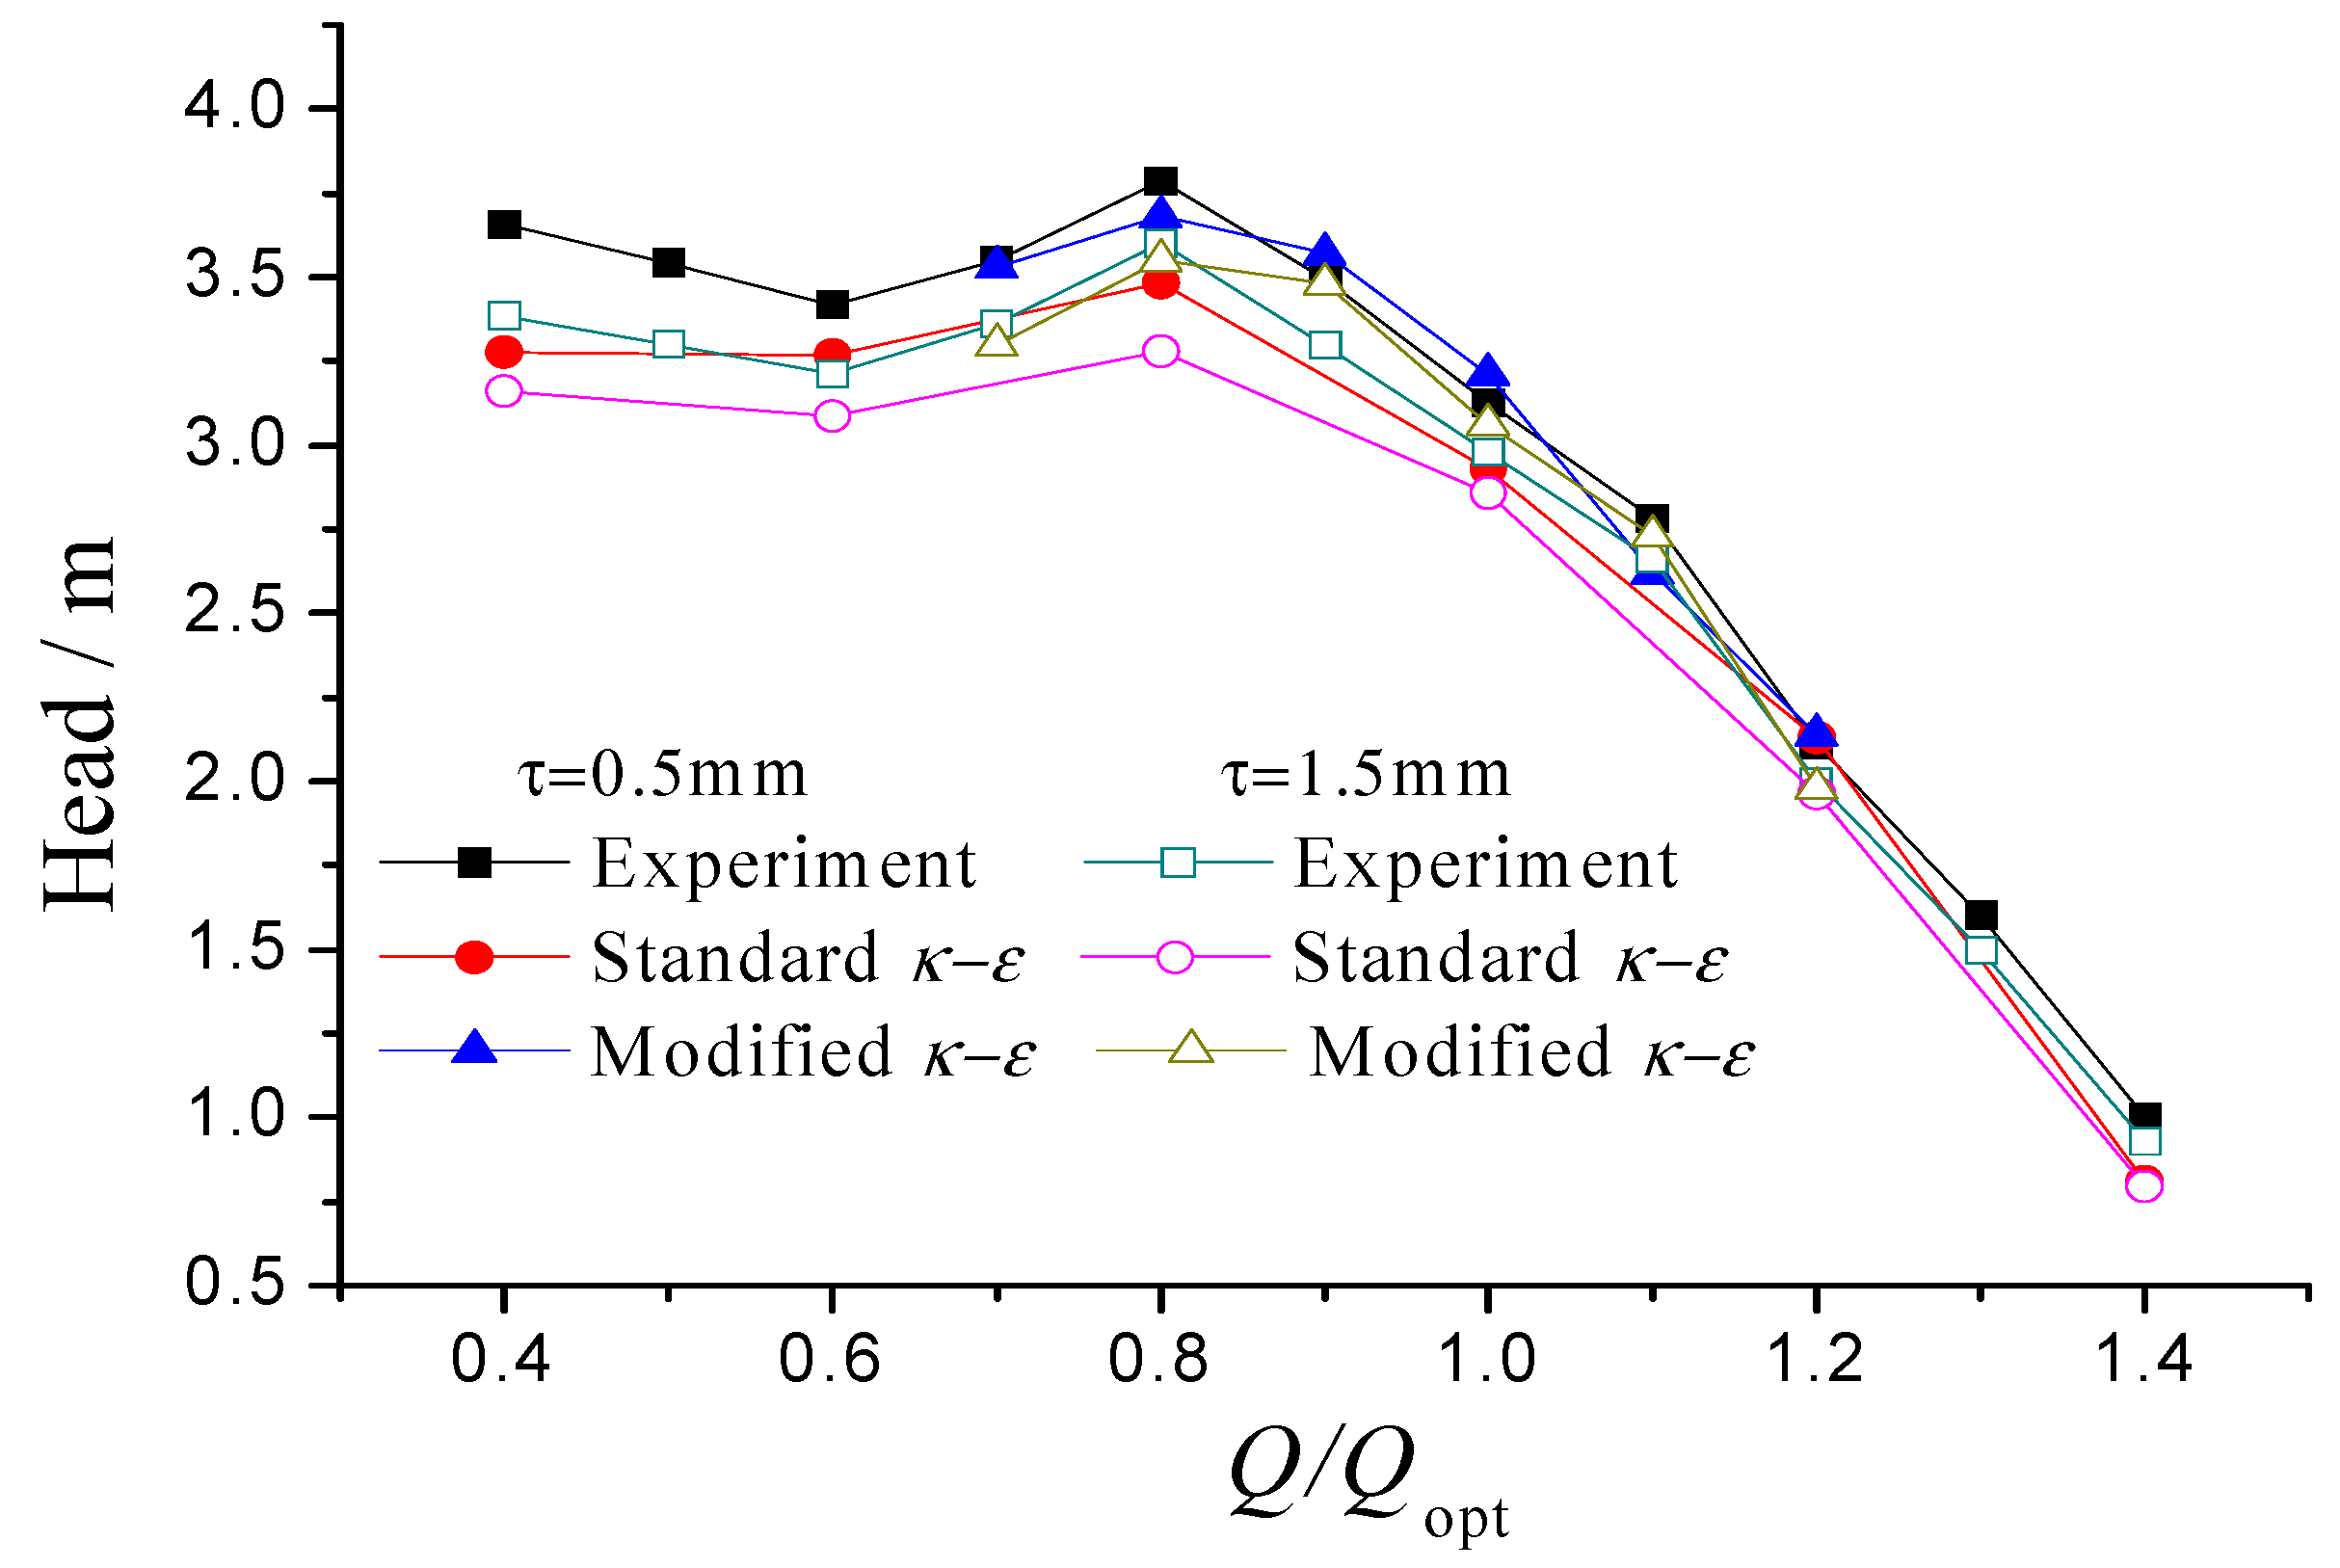
To validate the simulation method, the parameters set in the simulations were kept consistent with that in the experiments. Large eddy simulation was employed to predict the external performance under different flow rates. Q/Qopt ranged from 0.4 to 1.4. The simulated pump head was compared with the experimental pump head. Figure 5 shows that a good agreement was obtained between the numerical results and the experimental results.
4.2. Experimental Flow Pattern of TLV Cavitation
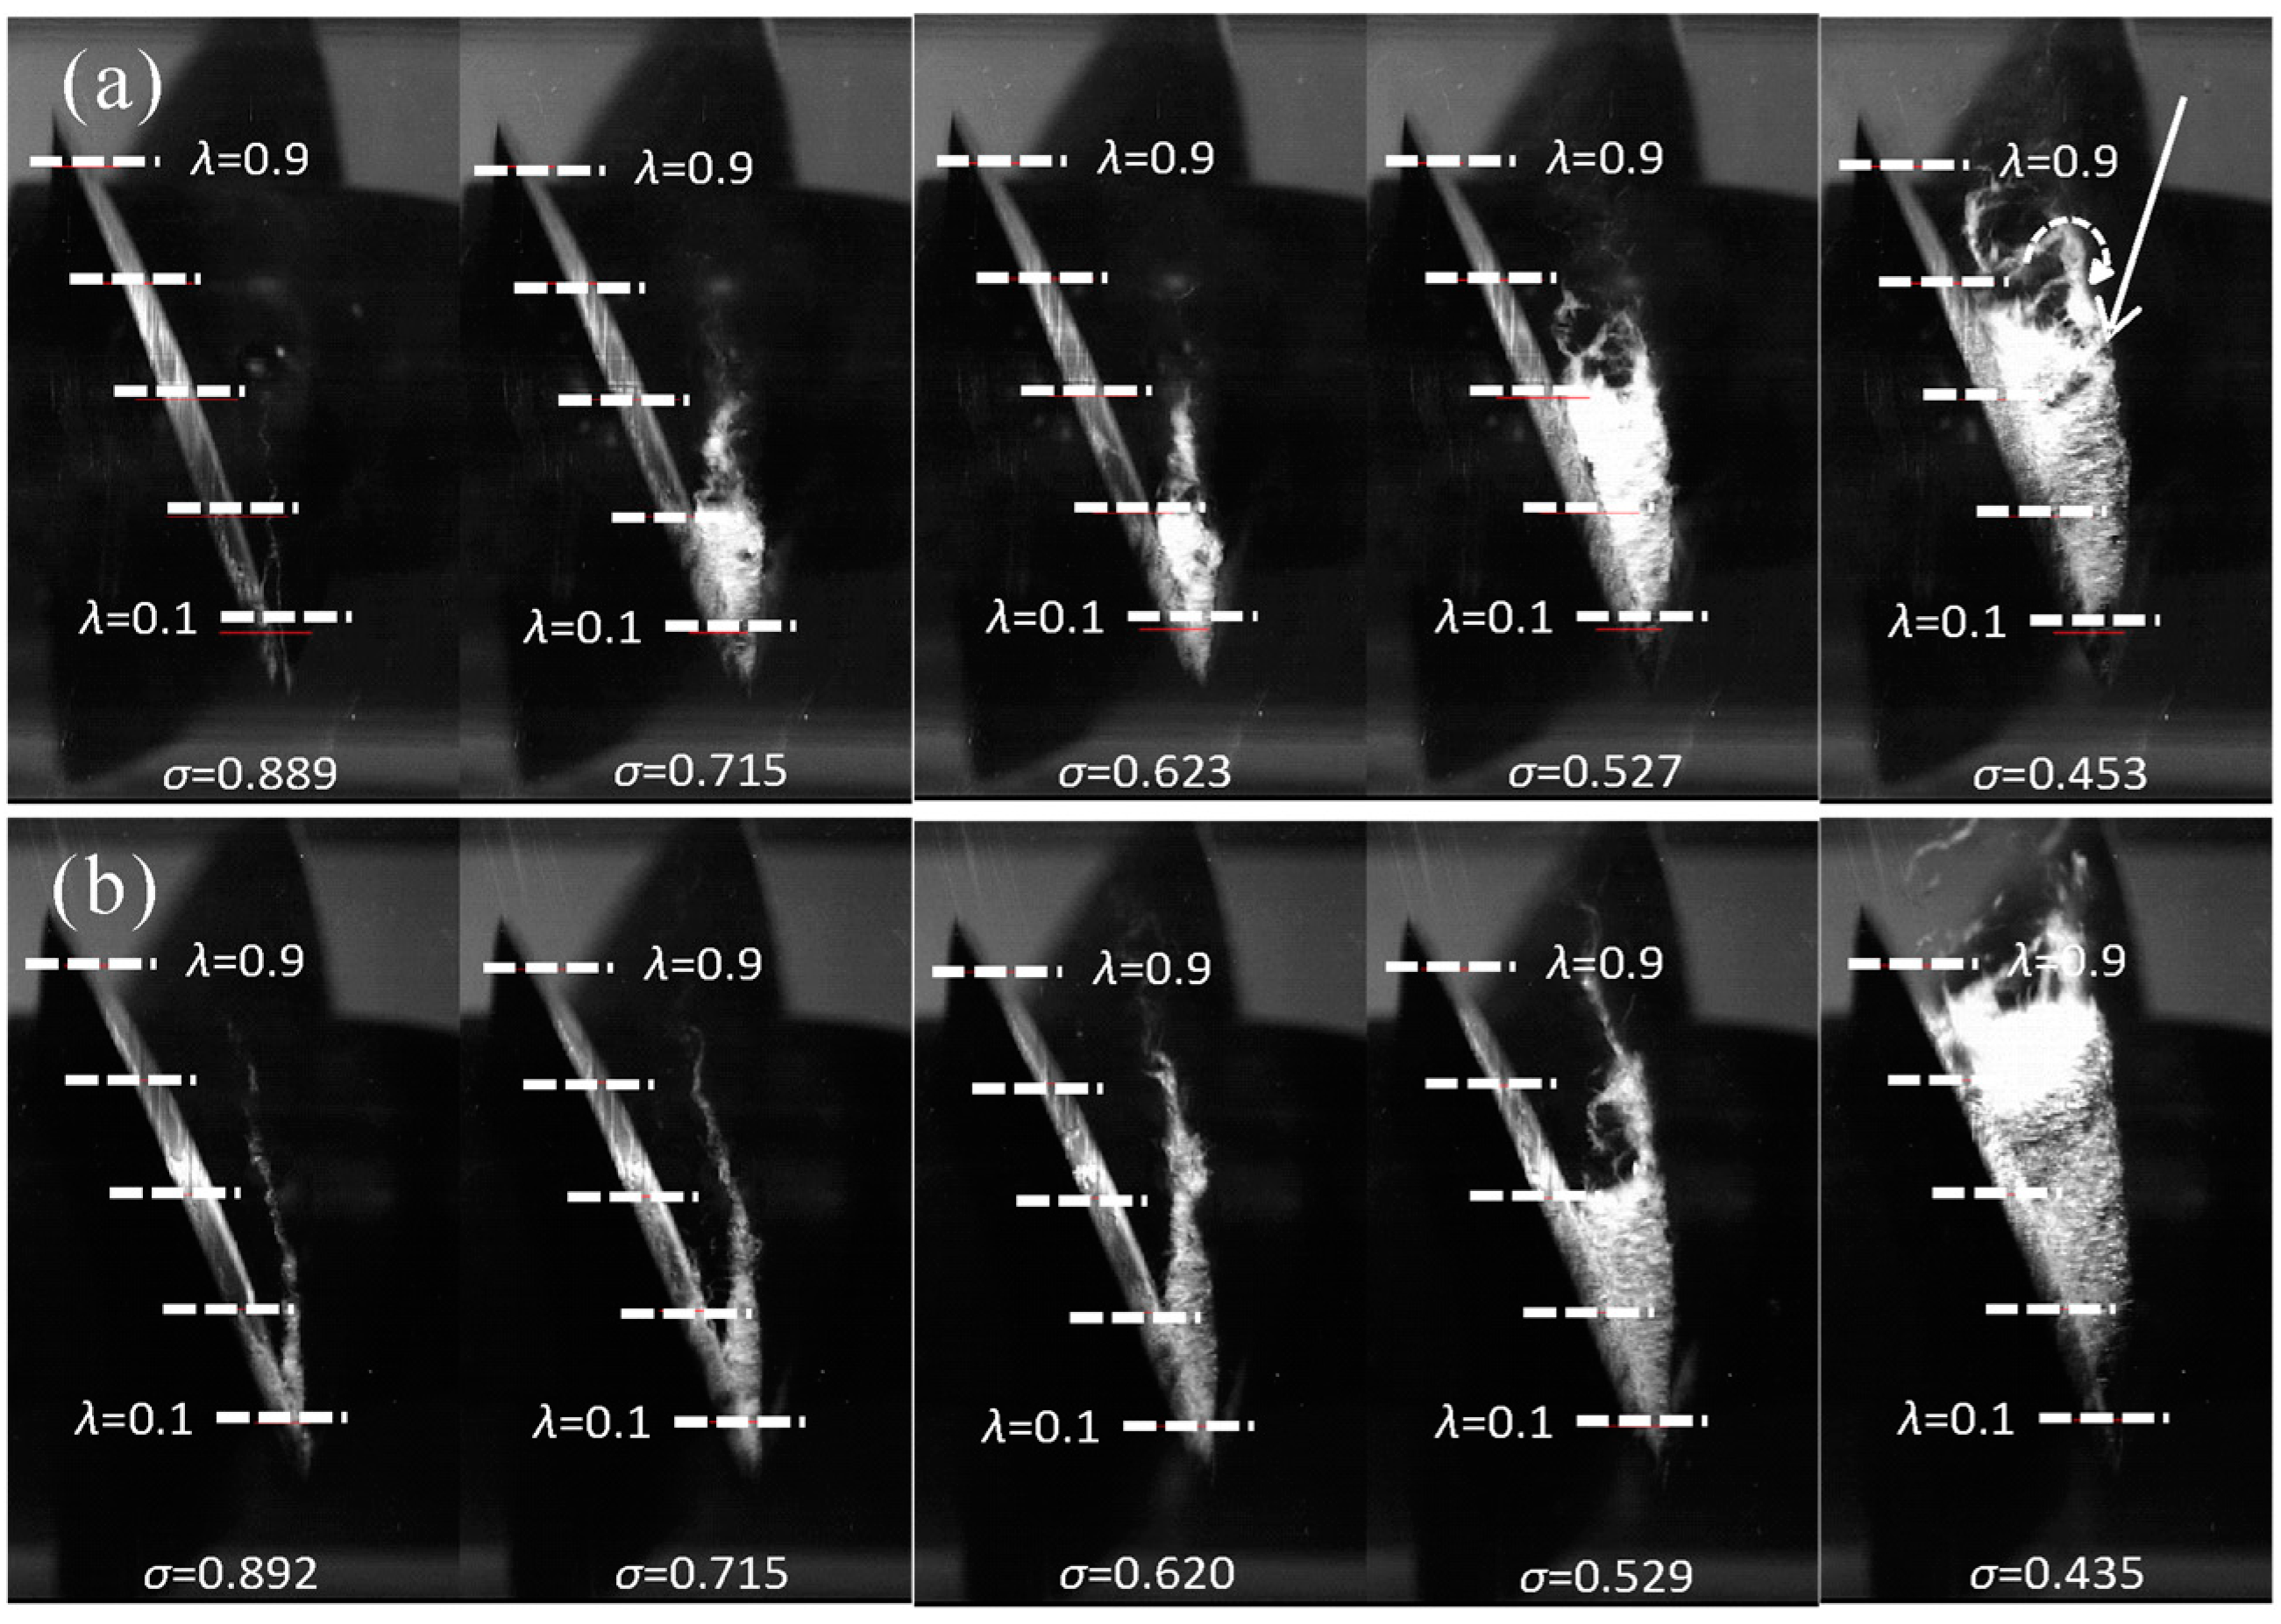
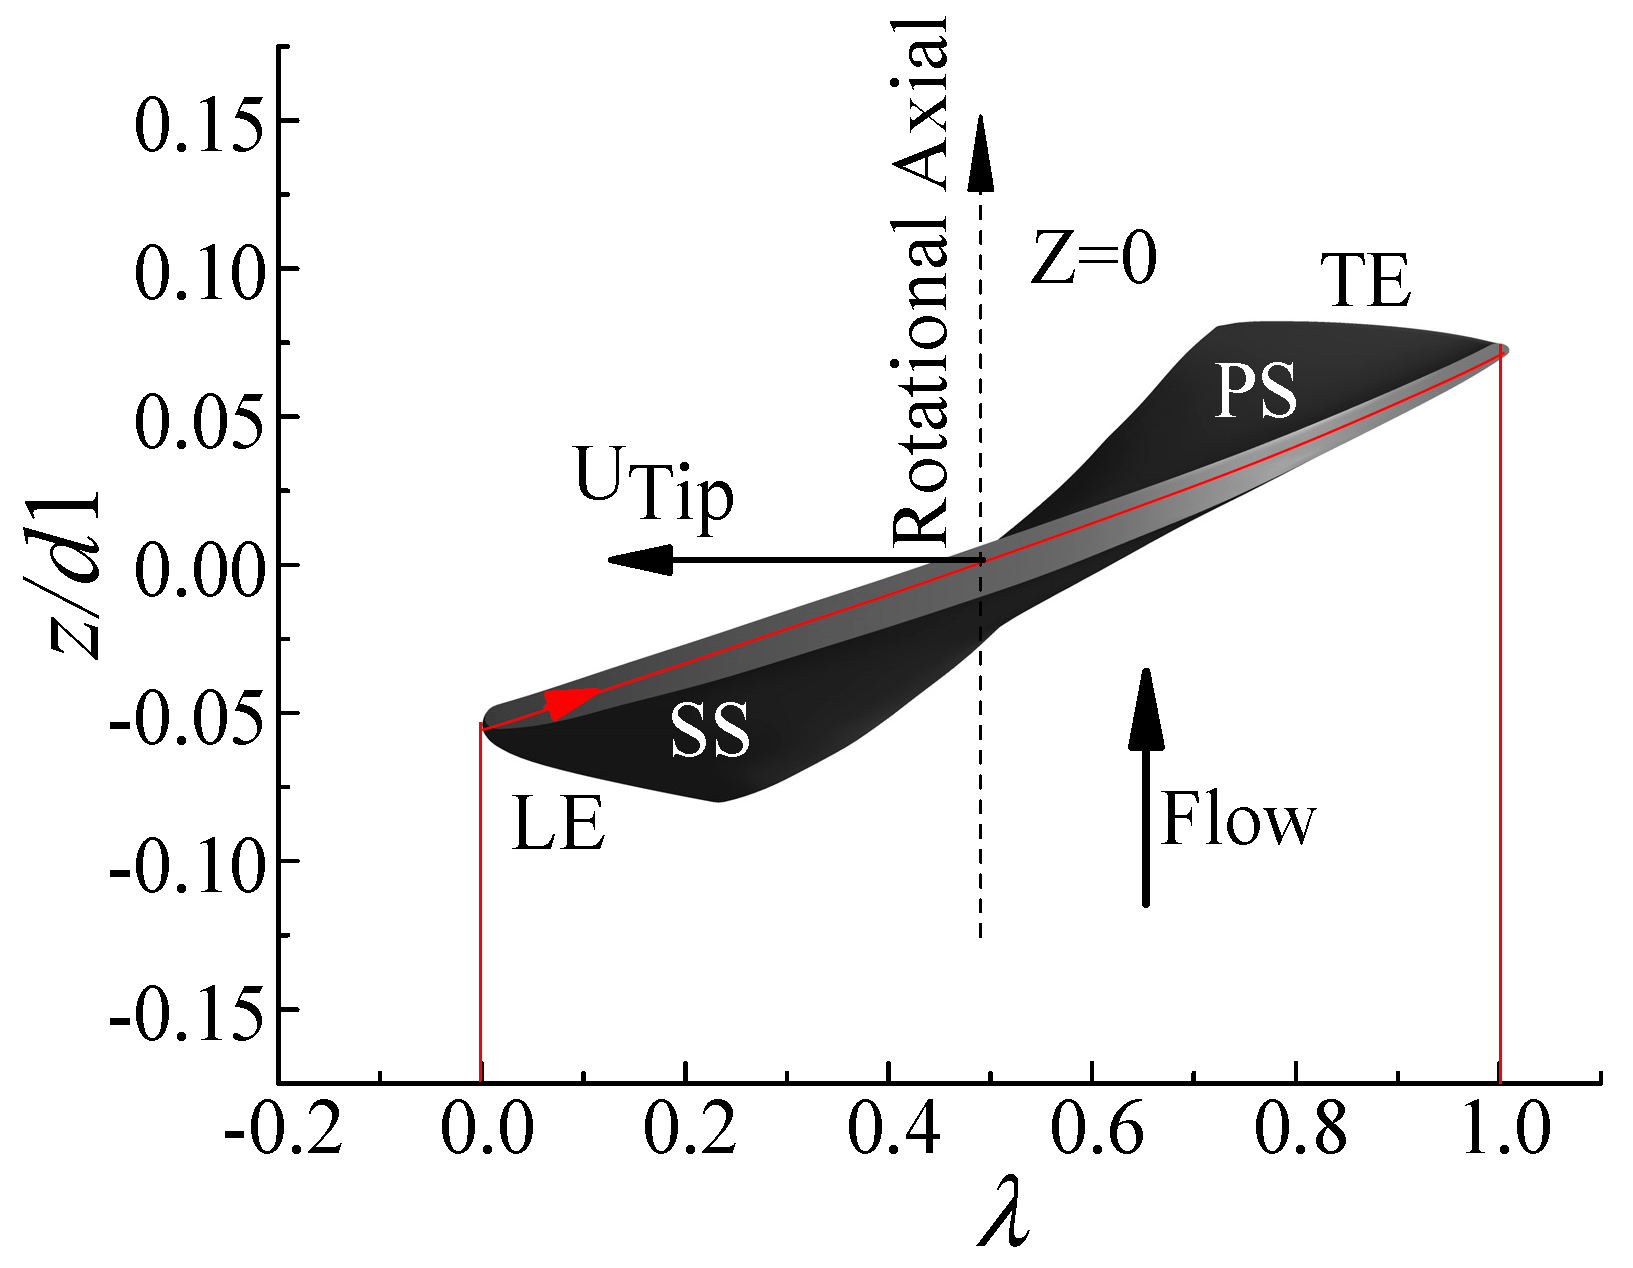
Two different flow patterns of TLV cavitation were captured by a high-speed photography experiment with different sizes of tip clearance as shown in Figure 6. The cavitation number was defined as σ = (Pin − Pva)/(0.5 ρU2), where Pin is the inlet pressure, Pva is the saturated pressure at ambient temperature, ρ is the density of the liquid, and U is the flow velocity. To analyze the flow characteristics at different sections of the blade chord, the blade chord coefficient was defined as λ = s/c as shown in Figure 7, where s is the distance from the leading edge (LE) to the section of the blade chord and c is the distance from the leading edge (LE) to the trailing edge (TE). At τ = 0.5 mm, with the decrease of the cavitation number (ranging from 0.889 to 0.453), the cavitation volume increases. At τ = 1.5 mm, it has the same tendency. Under the same cavitation number (σ = 0.715), the flow pattern of TLV cavitation shows a different behavior. At τ = 0.5 mm, the cavitation volume increases from λ = 0 to λ = 0.3. A cavitation cloud appears at the tip region of the blade. The cavitation cloud decays rapidly from λ = 0.3 to λ = 0.5. When the gap is small, the TLV is closer to the rotating wall surface. The interaction between the TLV and the boundary layer of the wall surface makes the vortex strength attenuate rapidly. As the gap is large, the TLV cavitation develops gradually with non-axisymmetric and twist rotation. The cavitation characteristic of the vortex zone is obvious within the range of λ < 0.7. This indicates that the strength attenuation of leakage vortex is slower, and the existence time of vortex is longer under a large gap. Under the same cavitation number (σ = 0.52), the cavitation under the two gaps covers the front part of the blade tip. Due to the curl of leakage vortex in the tip region, the TLV cavitation appears to be a cavitation cloud. However, in the case of a small gap, the oscillations in the tail of the cavitation cloud are attenuated rapidly to the shedding of tiny vortex filaments, while in the case of large gap, there is still a slender vortex band in the tail of the cavitation cloud. This phenomenon further demonstrates that the existence time of TLV under a large gap is longer. With the decrease of the cavitation number, the cavitation is more intense in the lower blade tip region under a large gap. The TLV cavitation is related to the tip flow field, generation of vorticity, pressure distribution in the blade passage, and vortex core pressure. Numerical simulation was carried out to explore the physics behind this in the following sections.
4.3. Numerical Investigation of Tip Clearance Size on Tip Flow Field
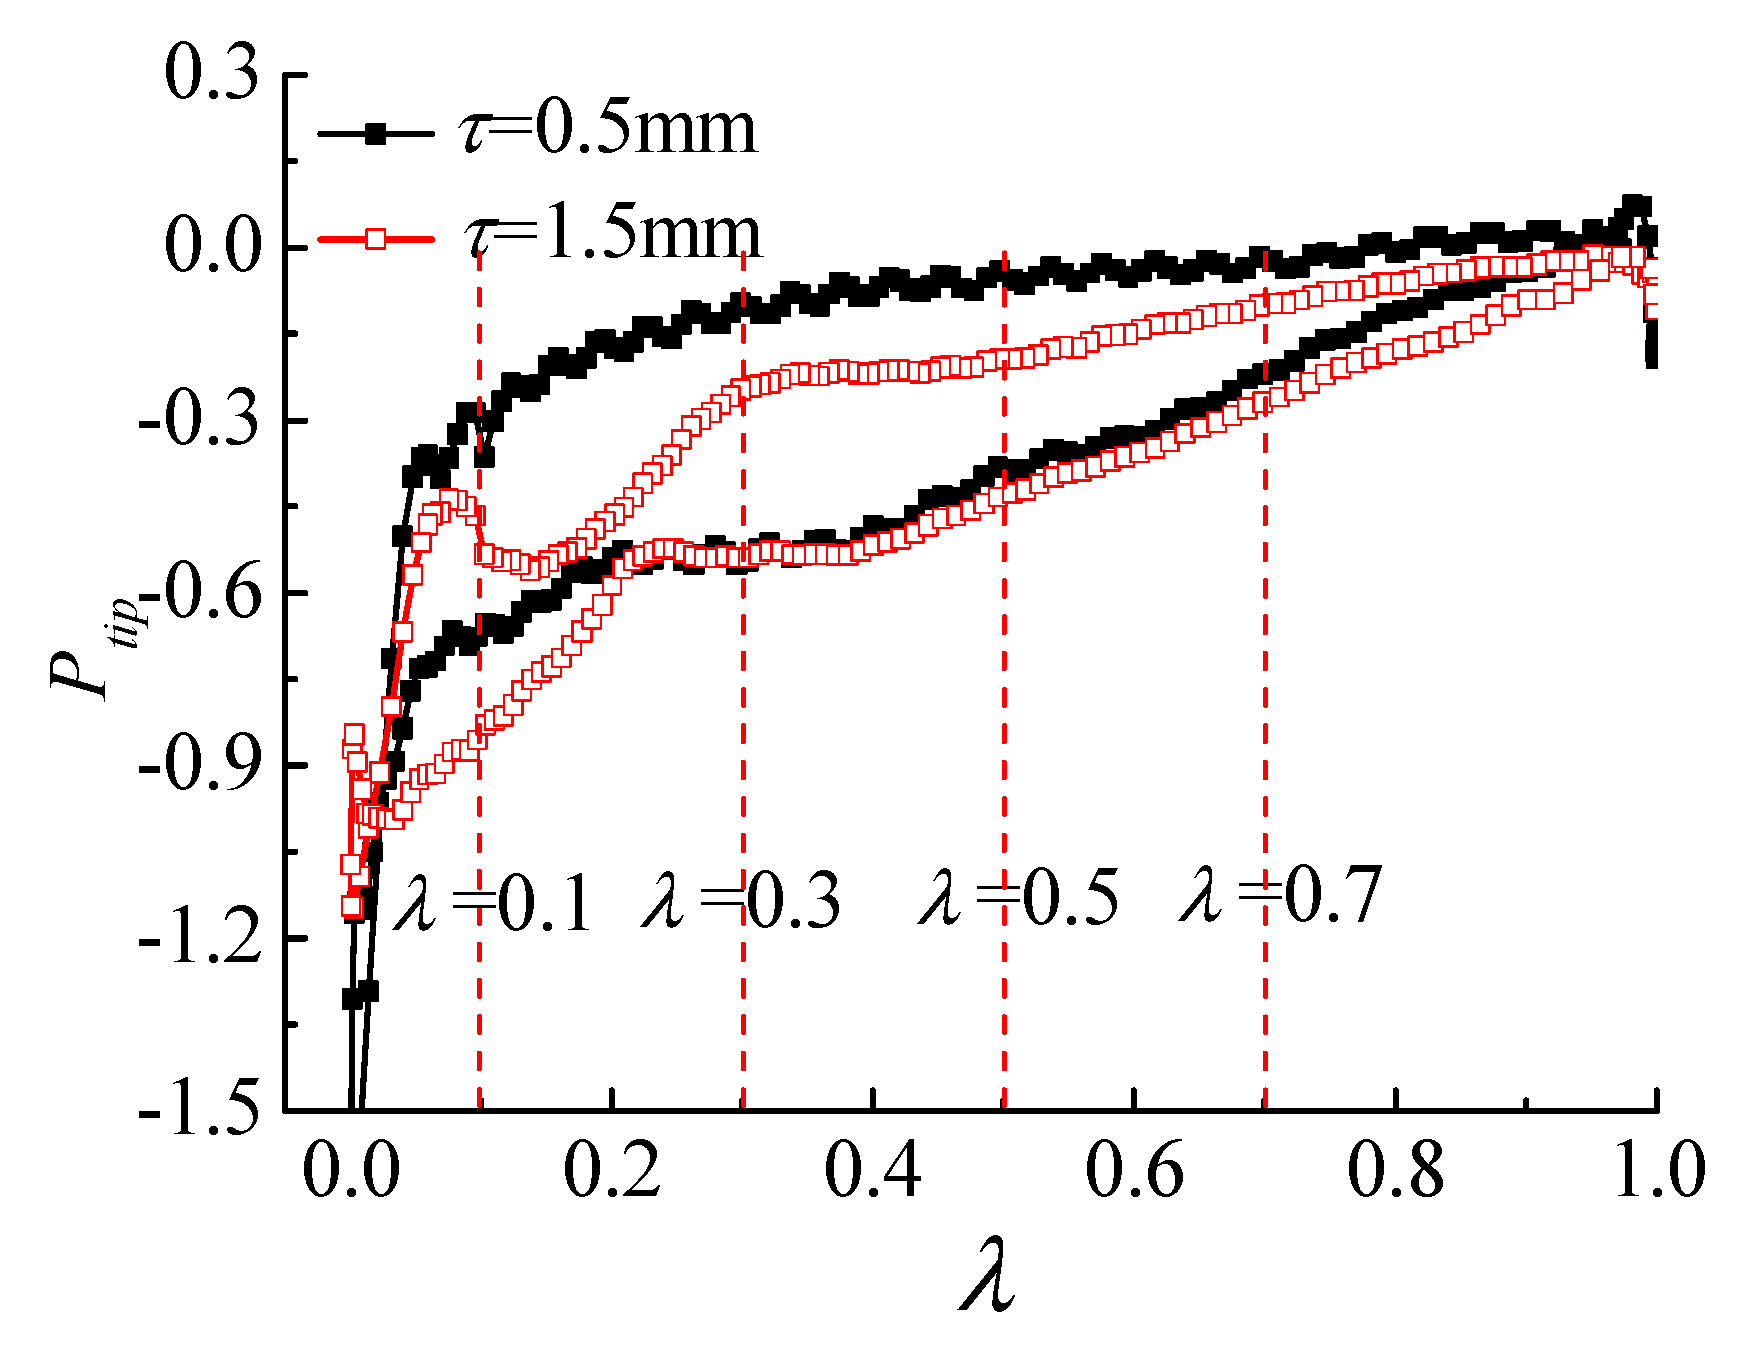
Figure 8 shows the distribution of the tip pressure coefficient under different sizes of tip clearances that were obtained from the simulation. The tip pressure coefficient was defined as Ptip = 2 p/ρUtip2, where p is the instantaneous value of the static pressure, ρ is the density of the working fluid, and Utip is the blade tip velocity. The aim was to identify the load distribution around the tip of the impeller. The pressure difference distribution between the pressure side (PS) and the suction side (SS) was found to be dependent on the size of the tip clearance. The variation of the tip pressure coefficient with the blade chord coefficient at τ = 0.5 mm is shown as a black line. The variation of the tip pressure coefficient with the blade chord coefficient at τ = 1.5 mm is shown as a red line. At τ = 0.5 mm, the maximum pressure difference between the PS and SS is located at a blade chord coefficient of λ = 0.3. The pressure difference between the PS and SS decreases with the increase of the blade chord coefficient. At τ = 1.5 mm, the maximum pressure difference between the PS and SS is located at λ = 0.08. After that, the pressure difference decreases rapidly. The minimum pressure difference is located at λ = 0.2 and then increases until the location of λ = 0.4. The increase of the tip clearance makes the maximum pressure difference in the tip area far away from the blade inlet edge.
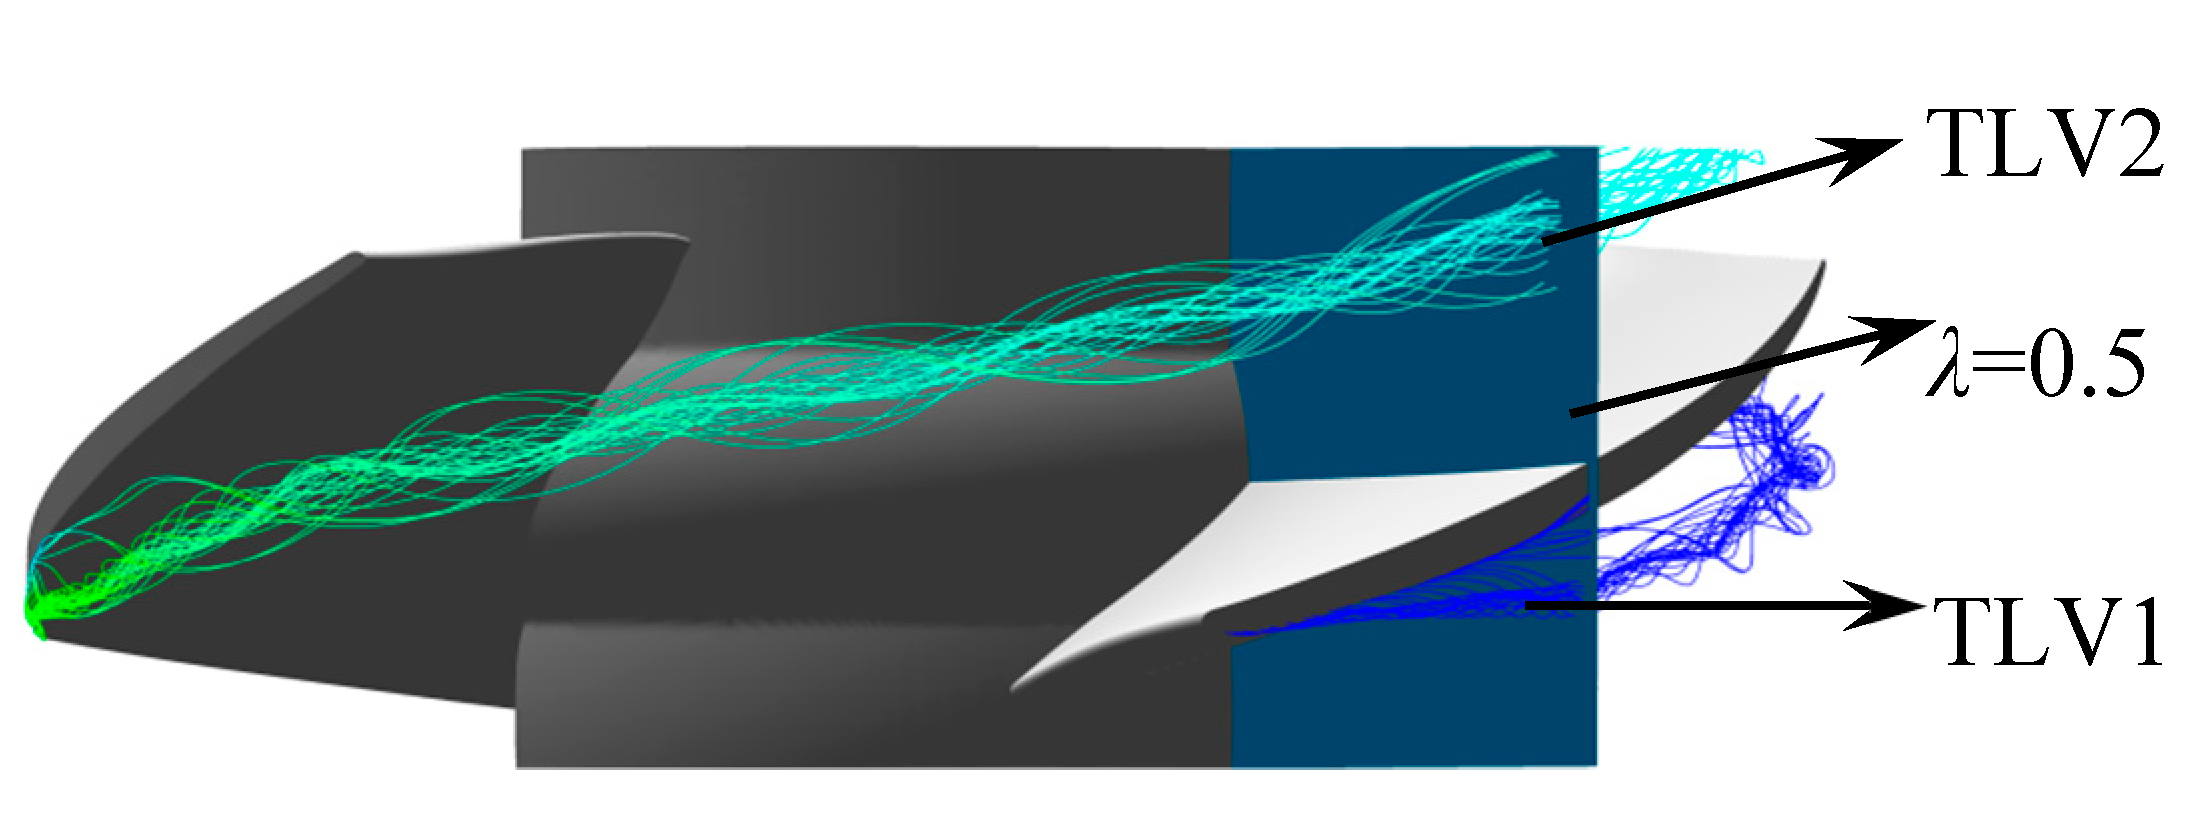
Figure 9 shows the leakage vortex (TLV1) shedding from the tip region and the leakage vortex (TLV2) shedding from the adjacent blade at the section of λ = 0.5.
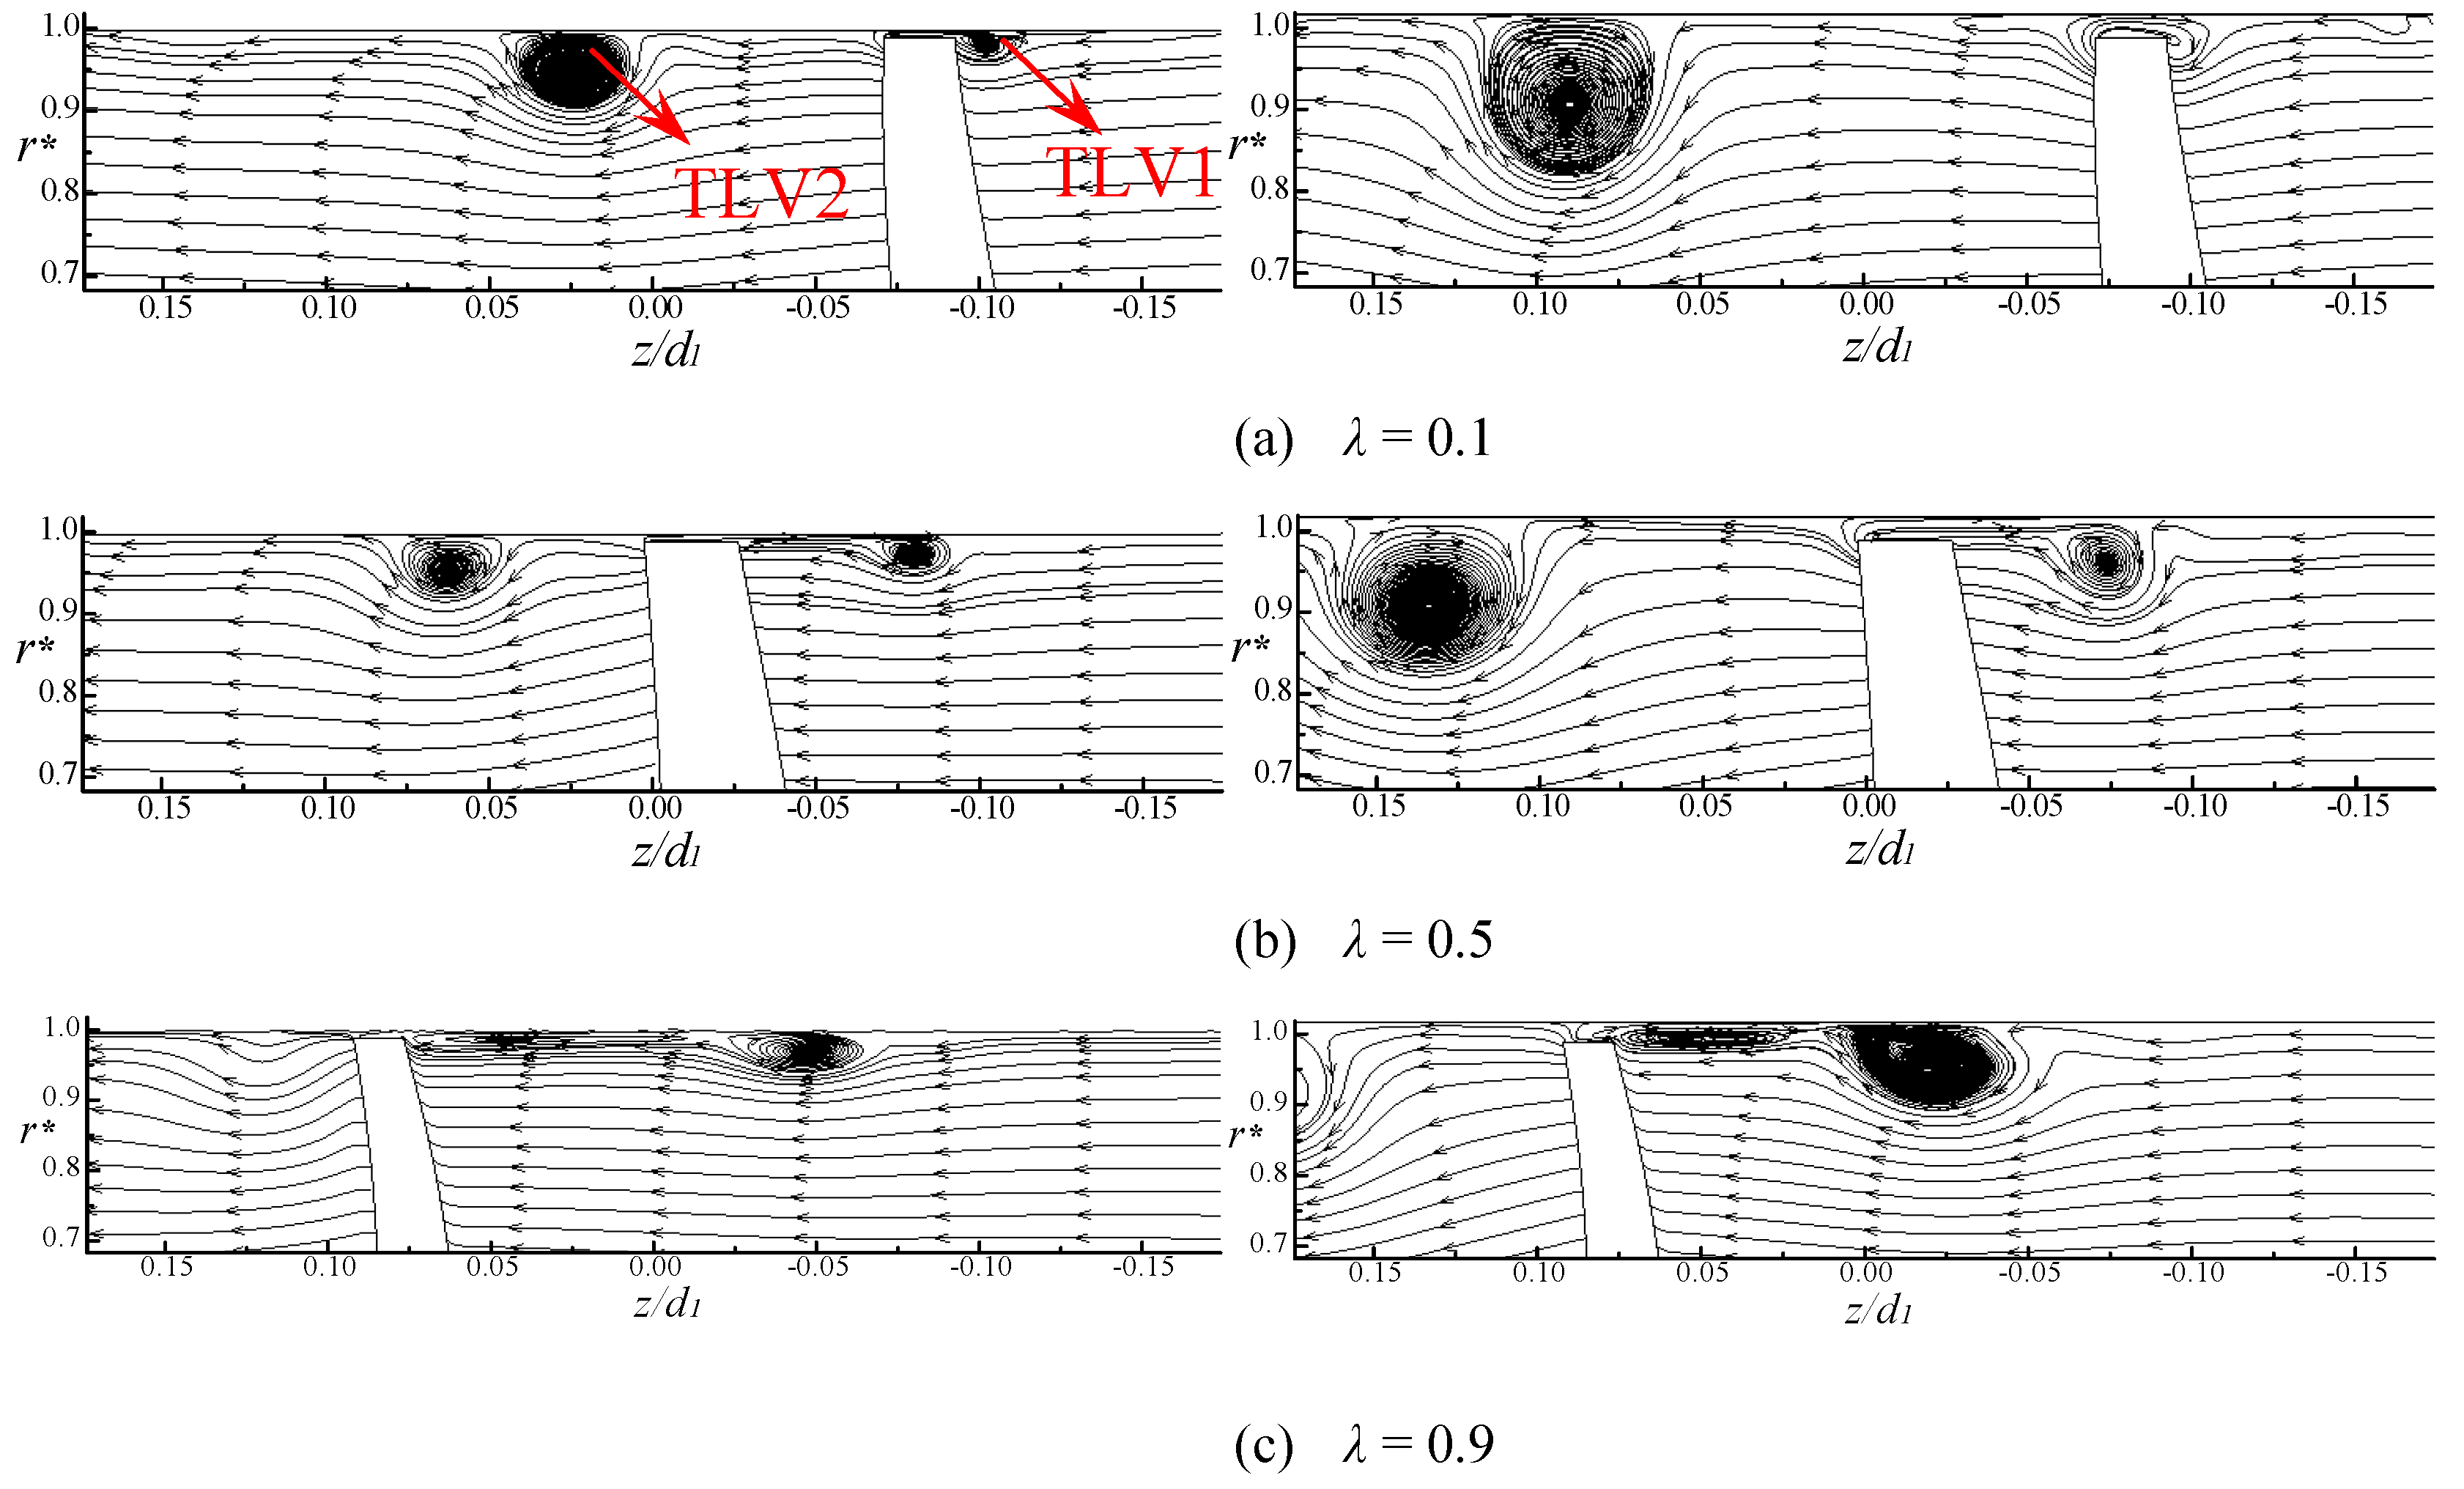
Figure 10 shows the streamline at the tip region of the blade with different blade chord coefficients. The left column is the streamline at τ = 0.5 mm, while the right column is the streamline at τ = 1.5 mm. For τ = 0.5 mm, the size of TLV1 increases with the increase of the blade chord coefficient, and for the size of TLV2, the regularity is the opposite. As TLV1 is generated at the blade tip region of the current section, the vortex is in the growth stage. However, TLV2 remains in the flow passage between the two blades for a long time, and the vortex strength gradually weakens. For τ = 1.5 mm, the size of TLV1 increases with the increase of the blade chord coefficient, but for the size of TLV2, the variation is not obvious. By comparing the vortex structure of the blade tip region with the same blade chord coefficient (λ = 0.1) under different sizes of the tip clearances, it is found that the TLV1 presents a compact structure with a gap of 0.5 mm and there is no obvious TLV1 structure with a gap of 1.5 mm. This indicates that the tip leakage vortex is delayed under a large-sized tip clearance. This is because the maximum pressure difference is far away from the blade inlet side. At the section of λ = 0.5, the size of the TLV1 in a 1.5-mm gap is significantly larger than that in a gap of 0.5 mm. The TLV1 structure under large-sized tip clearance is closer to the blade profile.
4.4. Numerical Investigation of Tip Clearance Size on the Velocity Profile
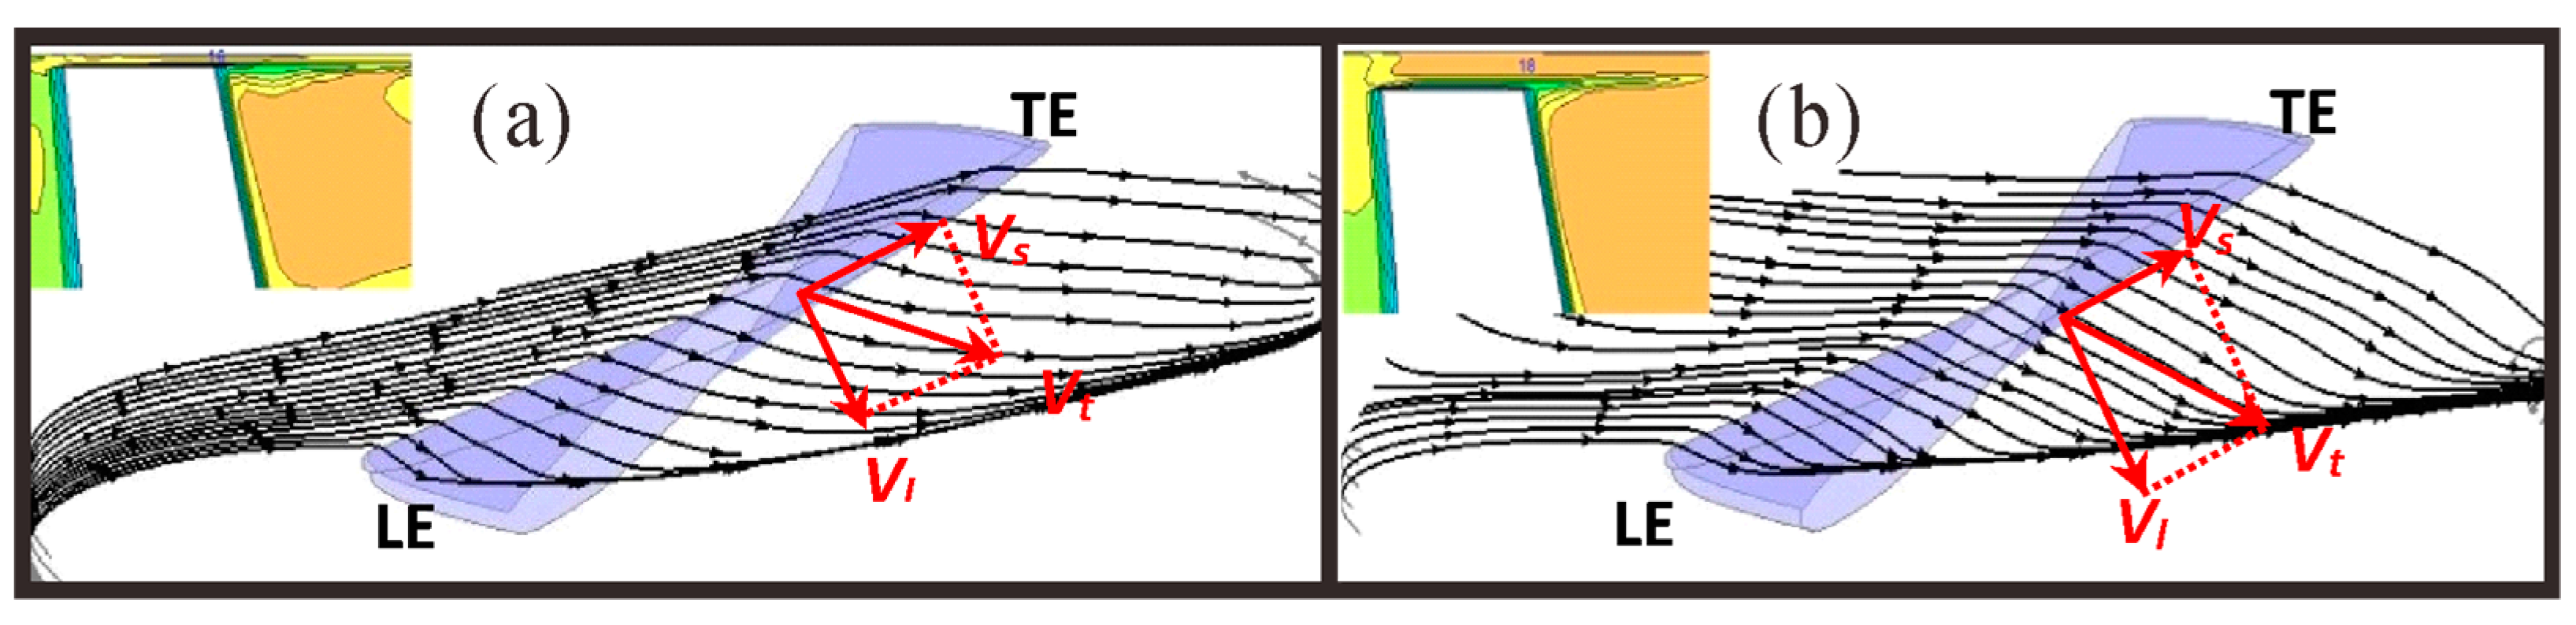
Streamline analysis of the annular surface was carried out in the tip region of the impeller with different sizes of clearance (height of blade tip was r = 99.5 mm). The dimensionless radial location of the blade was defined as r* = 2 r/D3, where r is the radius in the impeller and D3 is the diameter of the casing. For the impeller with a 0.5-mm gap, r = 99.5 mm, D = 200 mm, and annular surface r* = 0.9950 were selected for further analysis. For the impeller with a 1.5-mm gap, r = 99.5 mm, D = 202 mm, and surface r* = 0.985 were selected for further analysis. Figure 10 shows the streamlines in the tip region with different sizes of clearance. Based on the comparison between Figure 11a,b, it is found that the streamlines pass through the tip region of the impeller on the corresponding annular surface and finally converge, but the angle between the streamlines passing through the tip region of the blade and the chord of the blade tip is different under different sizes of tip clearance. The velocity, Vt, is defined as the leakage velocity in the tip clearance area and the direction is the leakage flow direction, Vt is decomposed into Vs in the chordwise direction and the direction of Vl is perpendicular to chordwise. The angle between Vt and Vs is defined as ζ. The angle, ζ, is larger for the impeller with a 1.5-mm gap compared to that for the impeller with a 0.5-mm gap. The velocity distribution at the tip clearance region is shown in the upper left corner in Figure 11a,b with λ = 0.5, respectively. Under the gap of 1.5 mm, the jet flow leaves the tip clearance region at a speed of about 18 m/s, while at the gap of 0.5 mm, the velocity of the jet flow decreases to about 16 m/s, and similar laws are found in other sections of the chord length.
4.5. Numerical Investigation of Tip Clearance Size on Pressure Distribution in Blade Passage
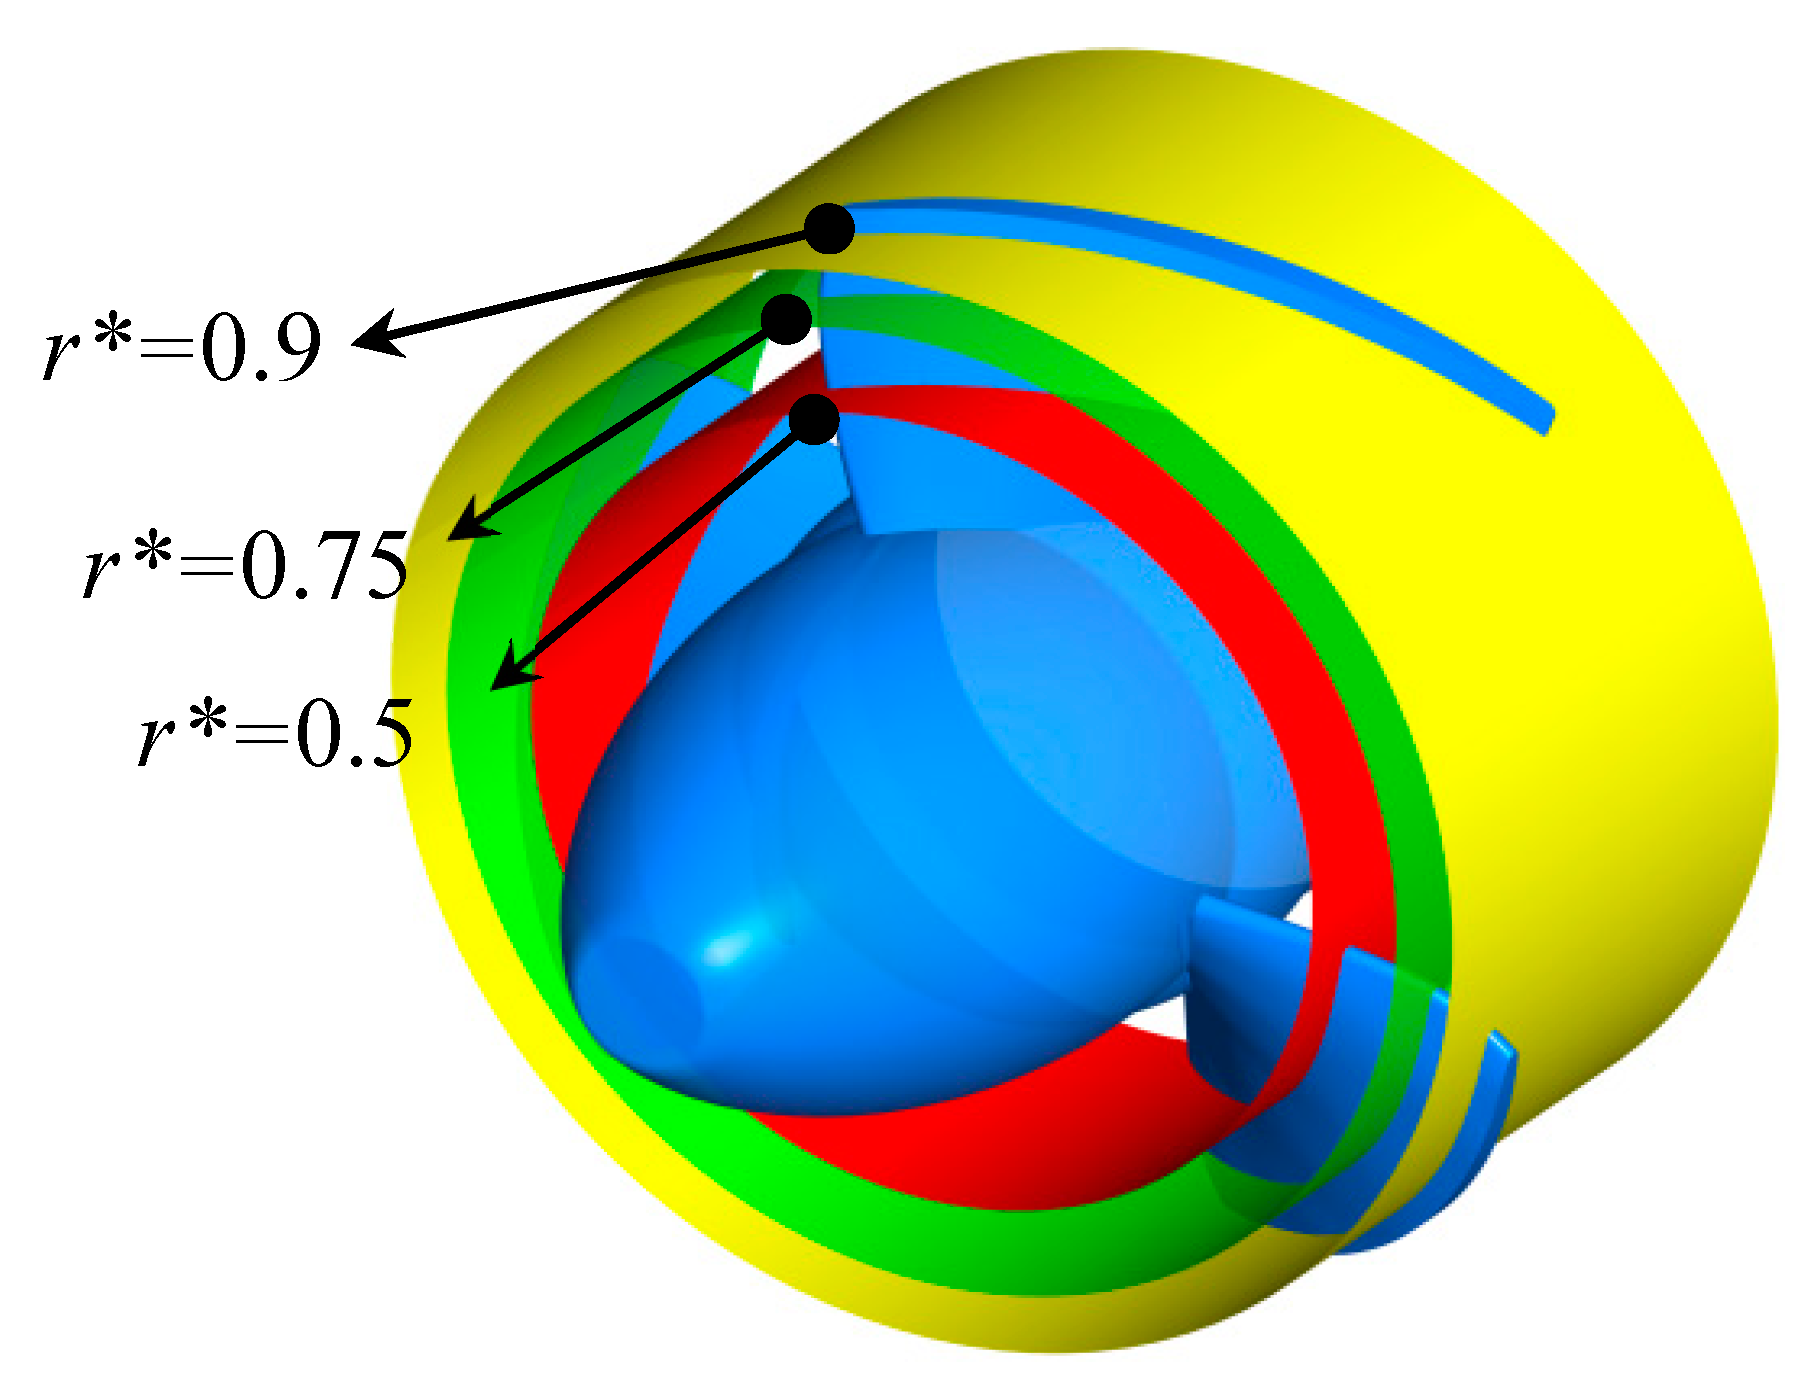
In this section, the pressure distribution on three sections with different radial coefficients was selected for comparative analysis as shown in Figure 12.
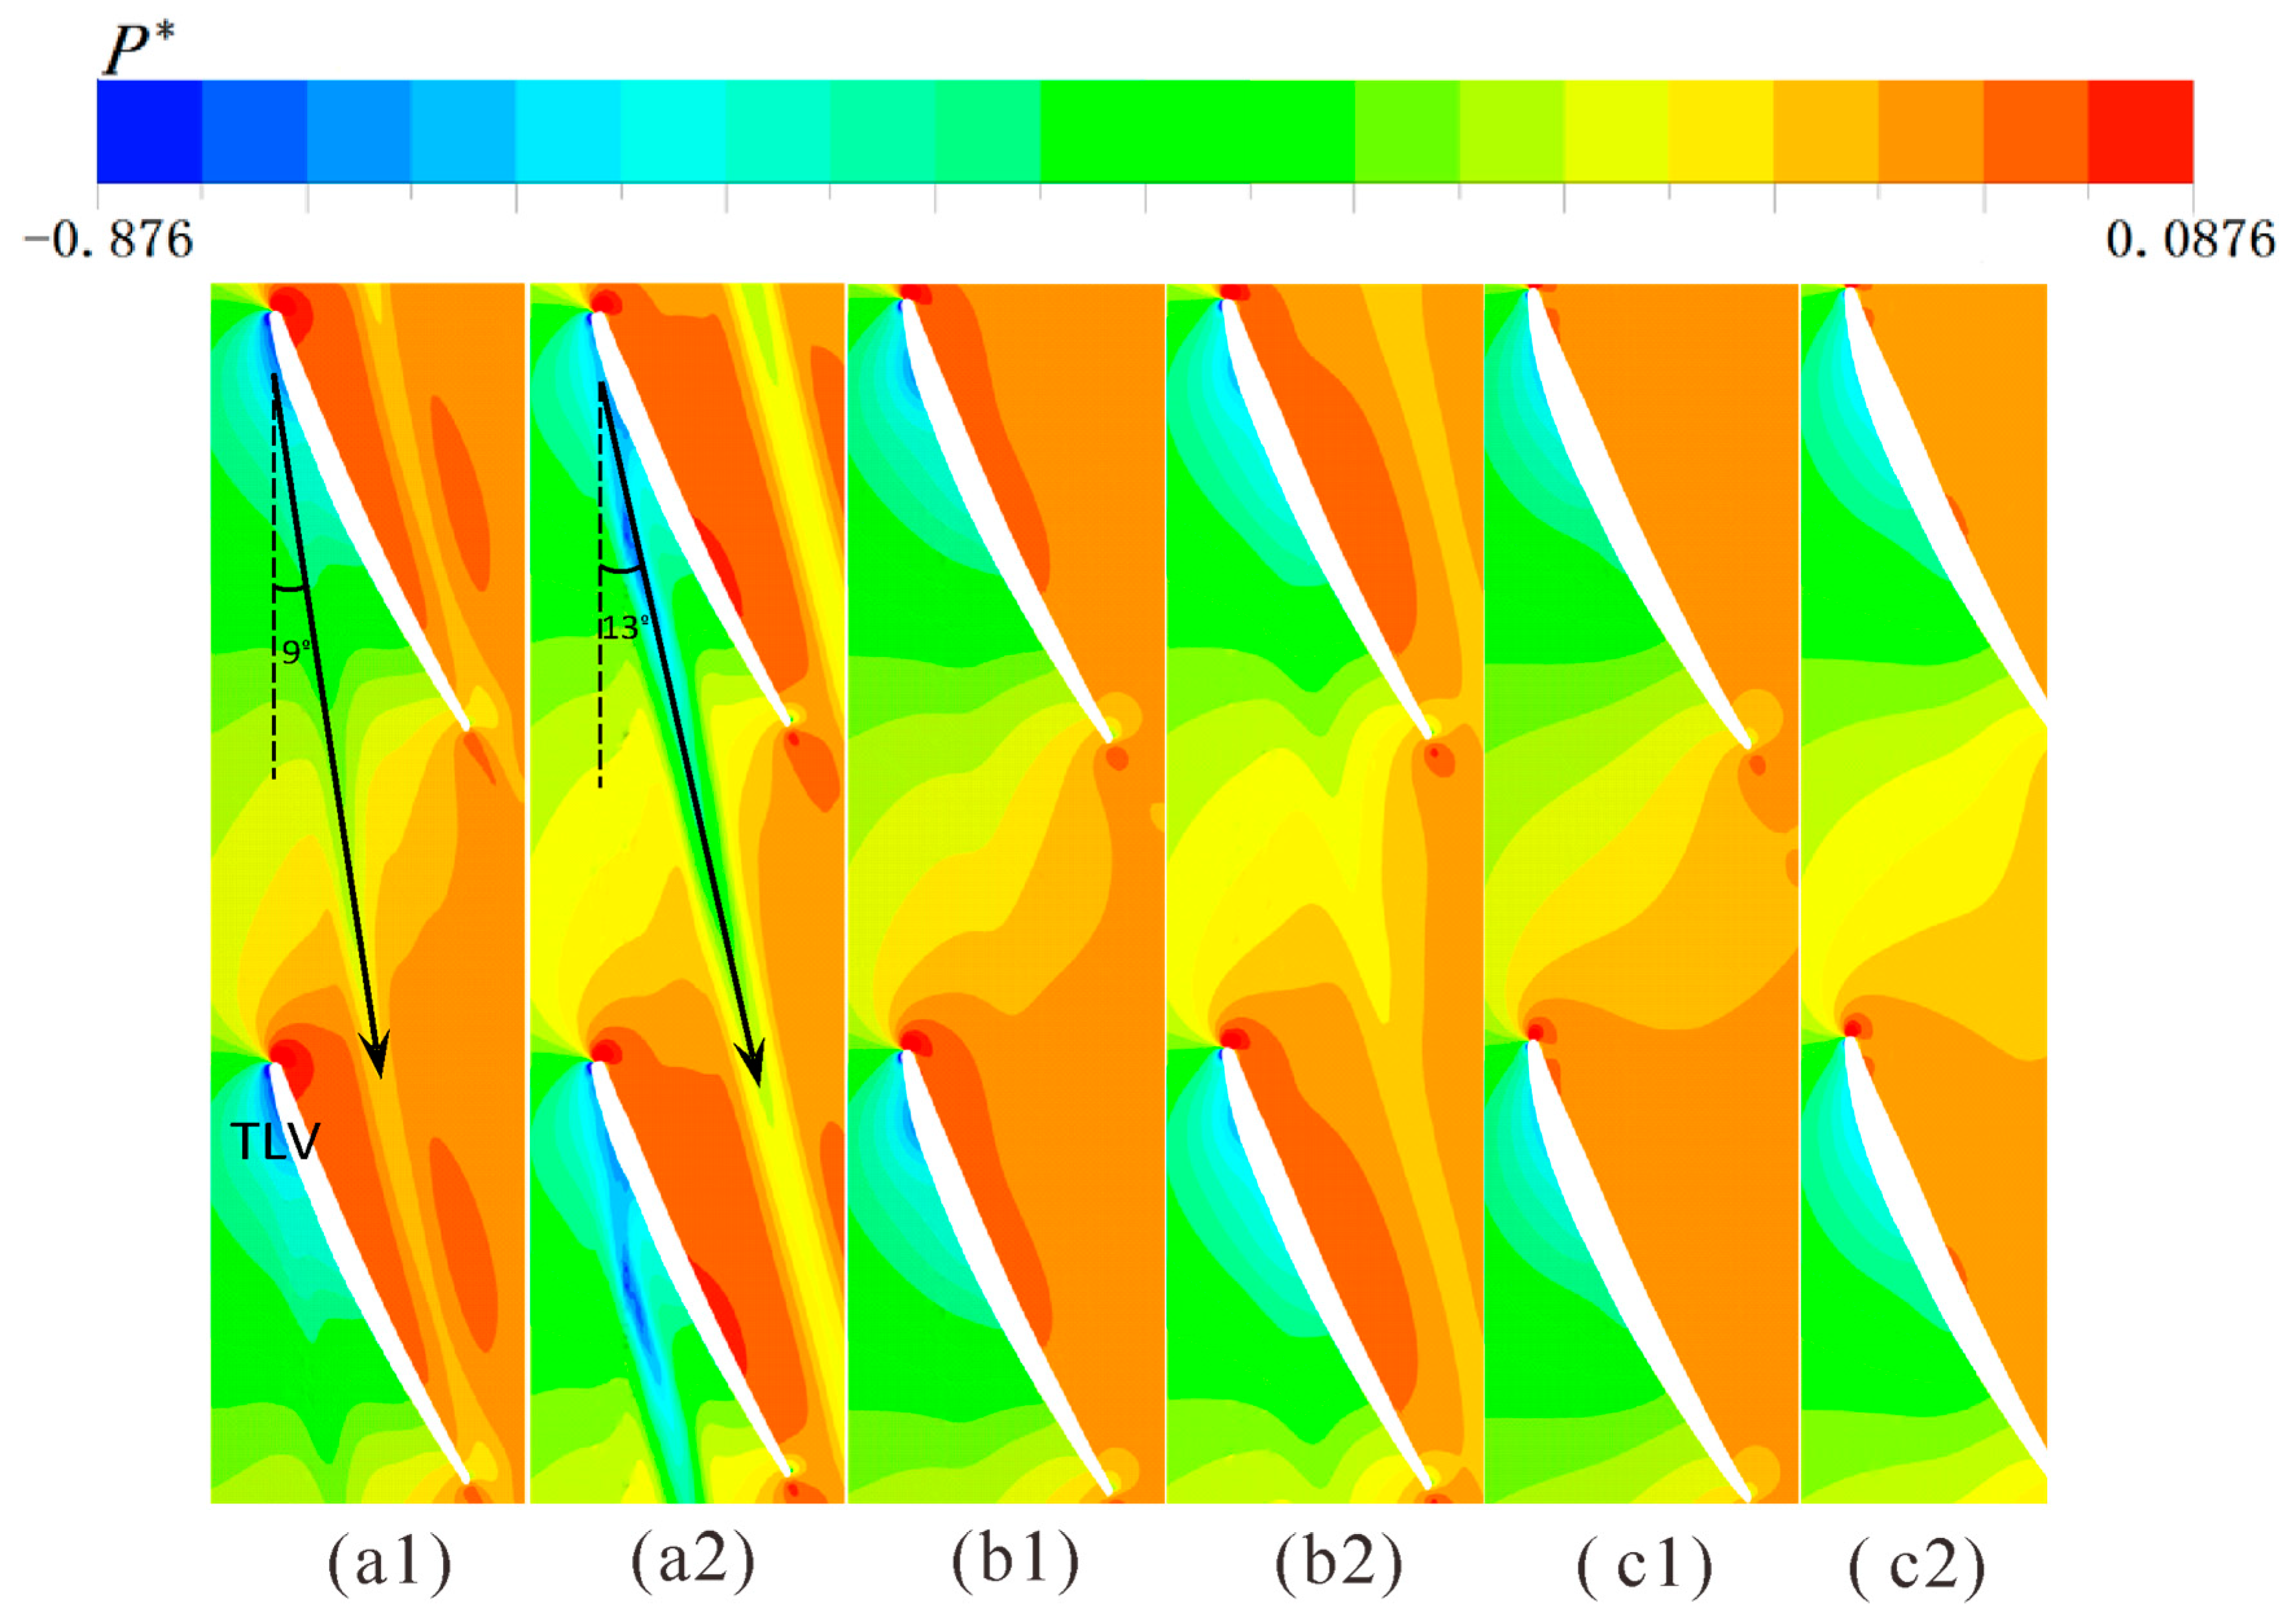
Figure 13 shows the mean pressure coefficient distribution of three radial sections expanded as shown in Figure 11 under different sizes of tip clearance (left: τ = 0.5 mm, right: τ = 1.5 mm). The mean pressure coefficient is defined as , where p is the instantaneous value of the static pressure, Pa; is the average of the static pressure in the selected time period, Pa; ρ is the density of fluid, kg/m3; and U is the velocity of fluid, m/s. On the section r* = 0.9, the pressure in the flow passage gradually increases. Due to the action of TLV, the pressure equipotential line (as shown by the black arrow) in the flow passage appears as an obvious deflection in the area affected by the TLV. The angle between the black arrow and the vertical dashed line is 9°. As the gap increases to 1.5 mm, the deflection phenomenon becomes more obvious. The angle between the black arrow and the vertical dashed line increases to 13°. The pressure in the deflection area is lower than that in the peripheral area. On the section r* = 0.75, the deflection phenomenon is no longer obvious at τ = 0.5 mm. However, the deflection phenomenon still exists at τ = 1.5 mm, indicating that TLV has a significant influence on the pressure distribution in the flow passage under a large-sized tip clearance. On the section r* = 0.5, the pressure distribution in the flow passage is basically the same under τ = 0.5 mm and τ = 1.5 mm. The pressure increases gradually. There is no obvious deflection of the equipotential line. TLV has no effect on the pressure distribution in the flow passage. As the size of the tip clearance increases, the influence of TLV on the pressure distribution in the flow passage becomes larger. The work capacity of the impeller in the tip region reduces correspondingly.
4.6. Numerical Investigation of Tip Clearance Size on Vortex Core Pressure and Cavitation
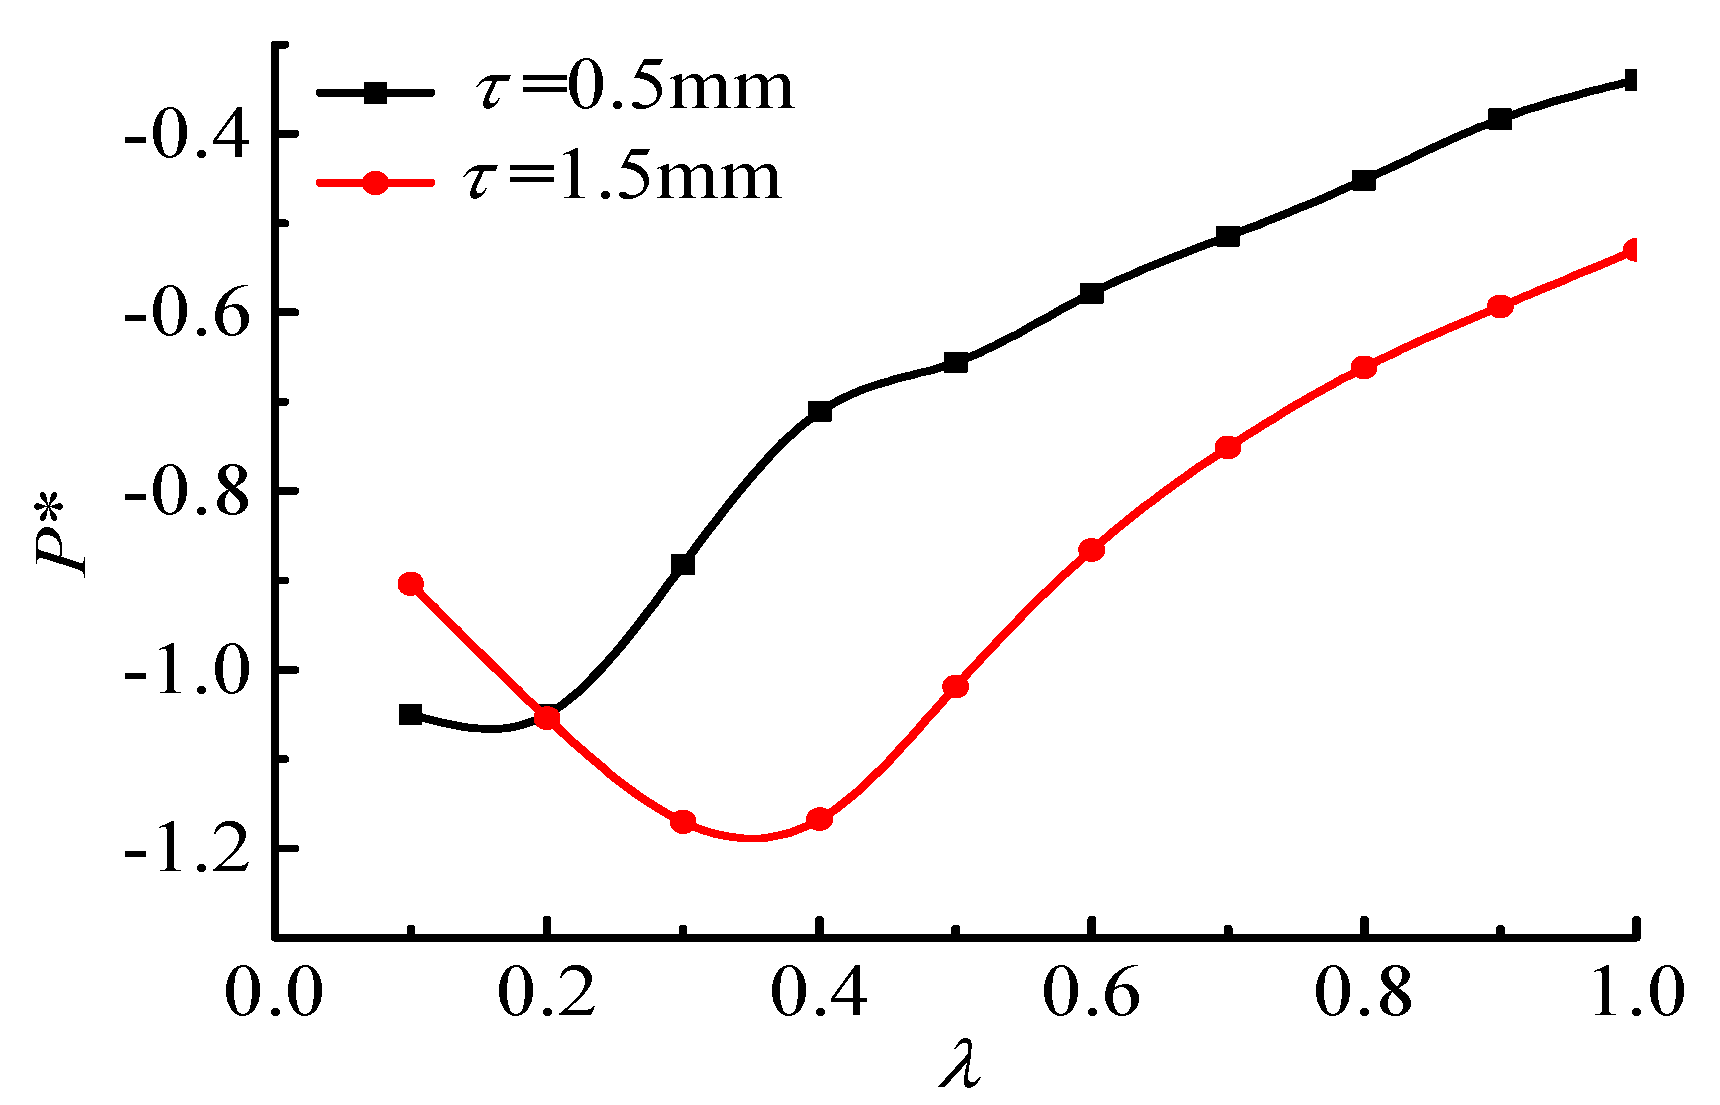
Since the pressure of the TLV core region is much lower than that of the surrounding region, cavitation first occurs within the TLV in an axial flow pump. Figure 14 shows the variation of the pressure coefficient of the vortex core with different blade chord coefficients. For the range of λ < 0.2, TLV developed earlier under the small-sized tip clearance, the pressure of the vortex core was lower. For the range of λ > 0.2, the regularity is the opposite. This indicates that when TLV moves towards the trailing edge, TLV cavitation under a large-sized tip clearance is more likely to occur. The development trend of the vortex core pressure under the two gaps is different. For a small gap, the vortex core pressure increases monotonously, while for a large gap, the vortex core pressure decreases initially and then increases. Therefore, the TLV strength under a large gap increases initially and then decreases.
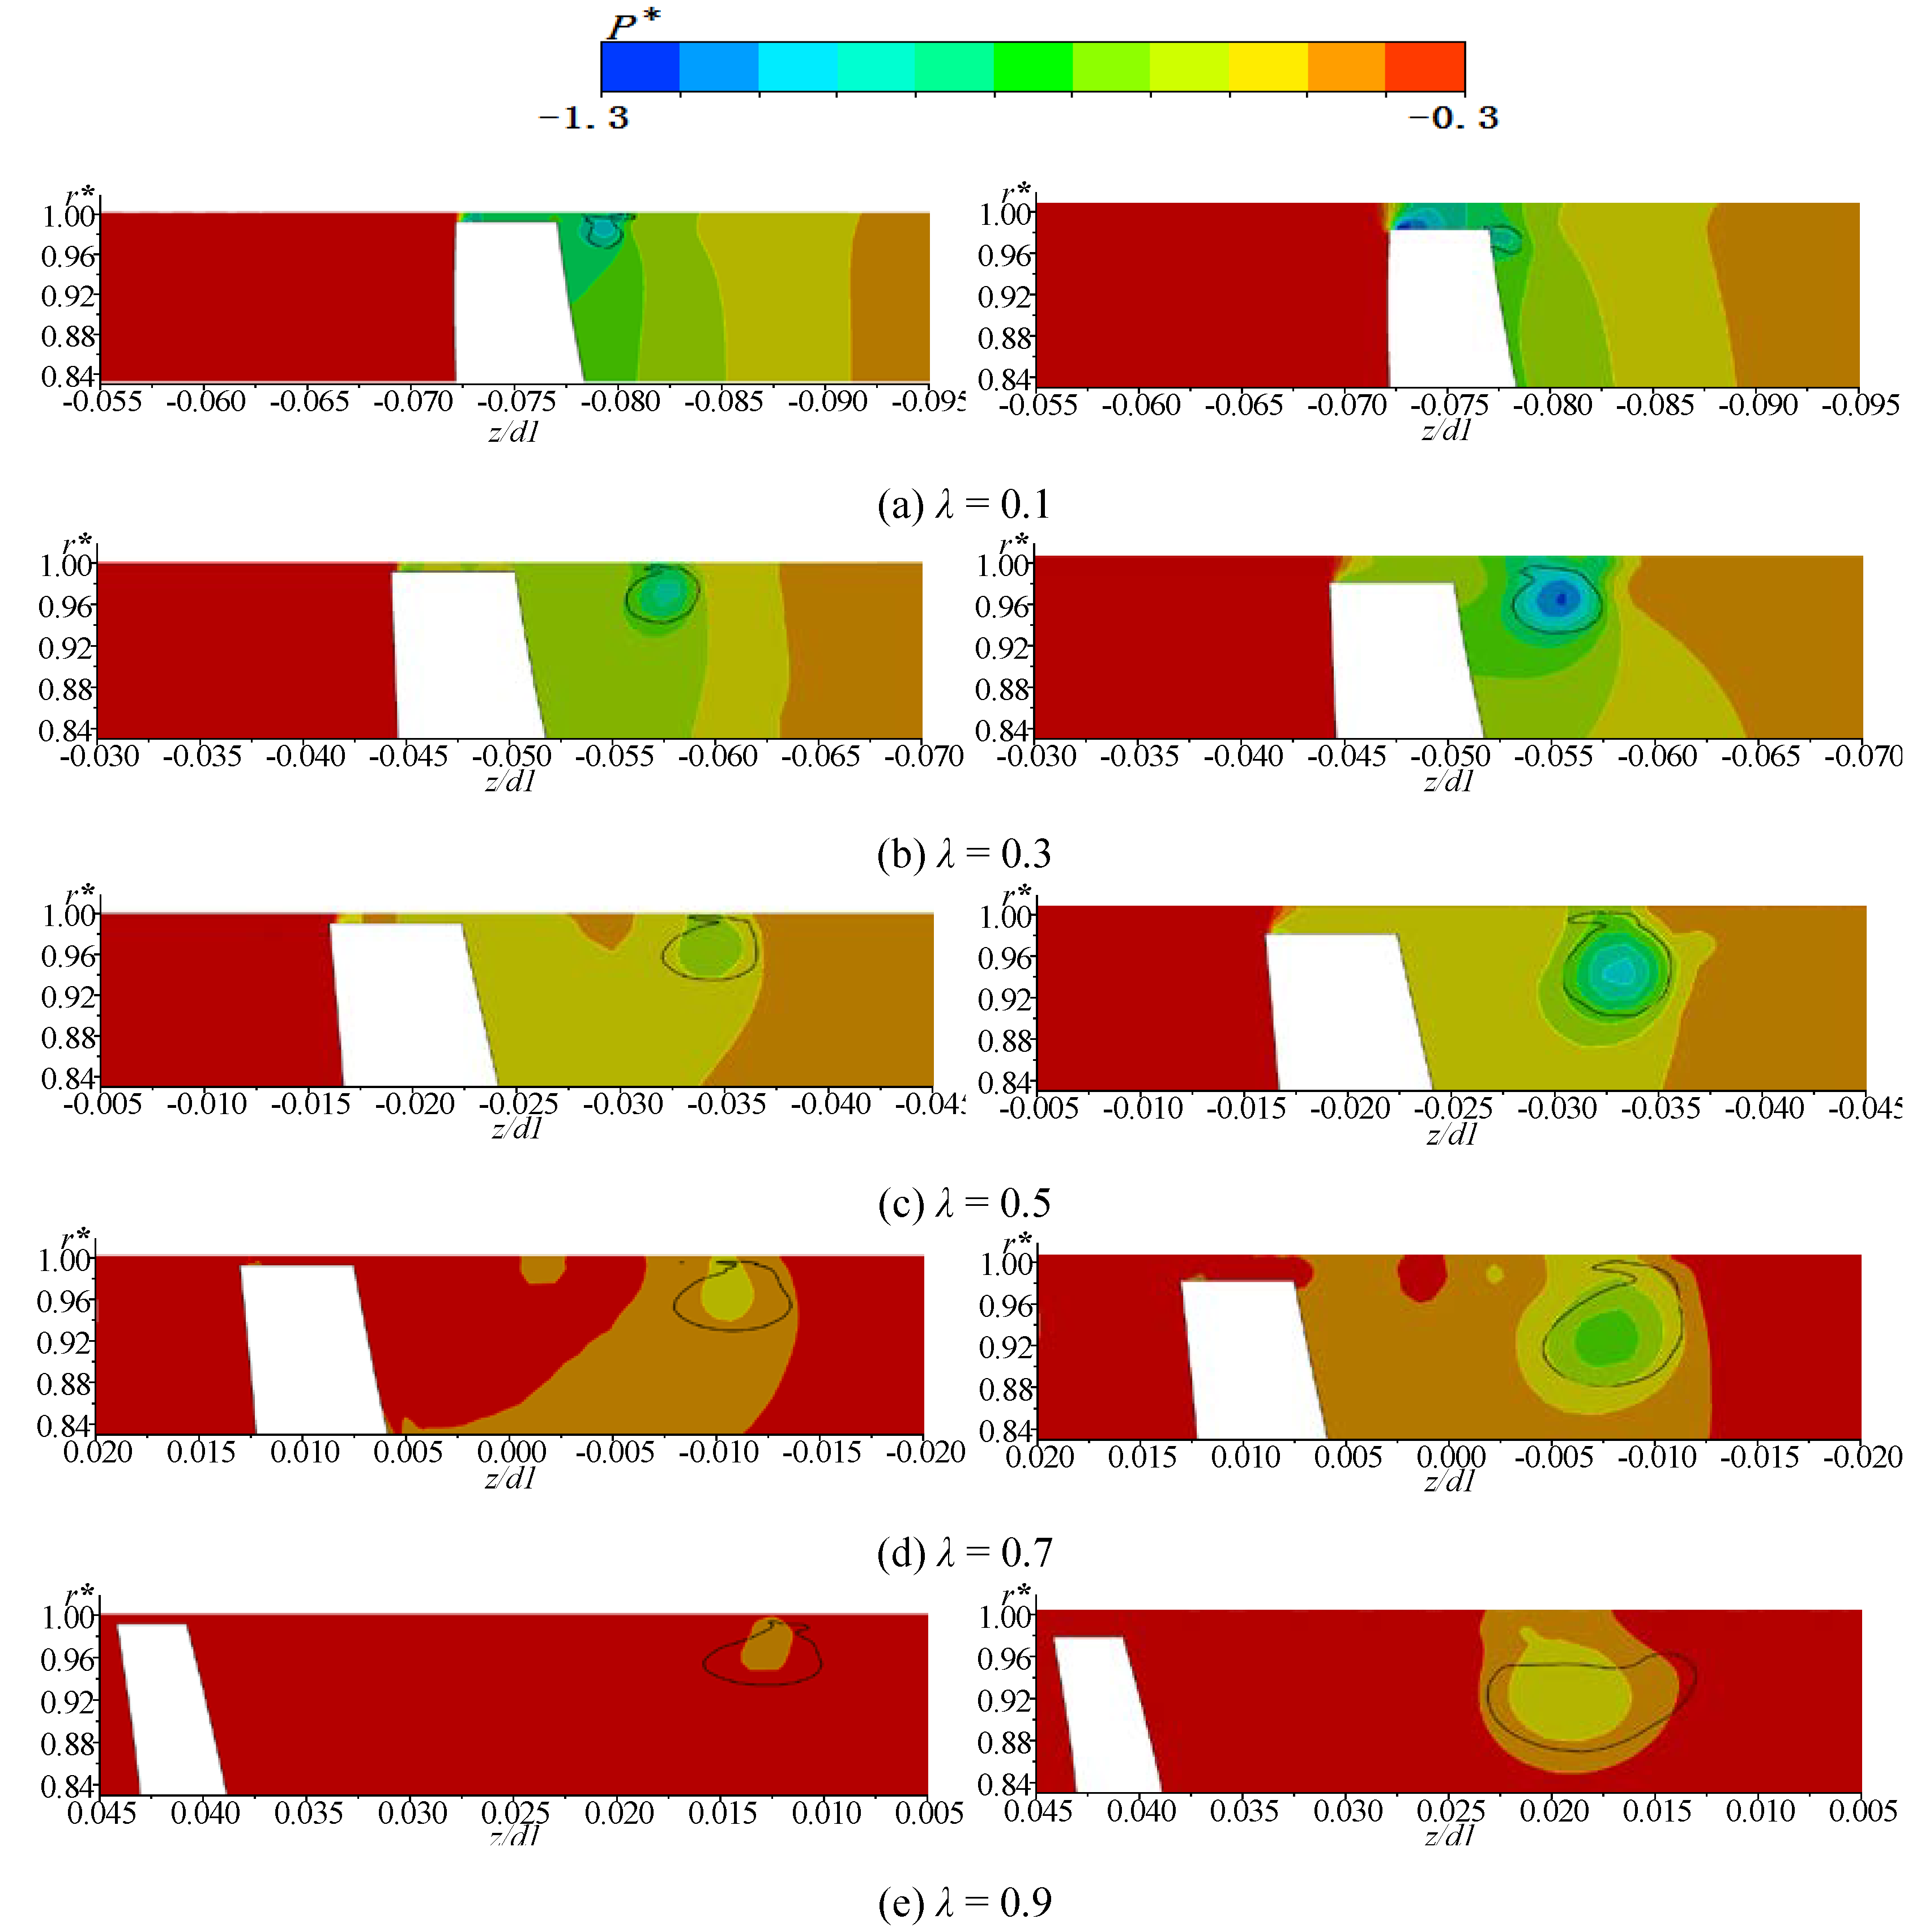
Figure 15 shows the pressure distribution in the tip region with different blade chord coefficients ranging from 0.1 to 0.9. The contour of the leakage vortex core is illustrated in the black line, corresponding to the region of the vortex structure, as shown in Figure 10. In the tip region, the internal pressure of the vortex core was much smaller than that of the surrounding region. For a gap of 0.5 mm, the internal pressure of the vortex core increases gradually, and the size of the vortex core increases accordingly when the leakage vortex develops from the leading edge to the trailing edge. For the gap of 1.5 mm, the lowest pressure coefficient of the vortex core appeared on the section λ = 0.3. As the size of the vortex core increases, the pressure in the vortex core region increases continuously, and the variation trend was consistent with that of the vortex core pressure coefficient as shown in Figure 14. On the section λ = 0.1, the internal pressure coefficient with a small gap is slightly lower than that with a large gap. On the section λ = 0.3, the size of the vortex core increases sharply and the vortex core region pressure coefficient is much less than that with a small gap. With the increase of the blade chord coefficient, the size of the vortex core with a large gap is bigger and the pressure coefficient of the vortex core region is lower.
5. Conclusions
The effects of tip clearance on the TLV cavitation behavior of an axial flow pump were studied experimentally and numerically. The numerical pump head showed good agreement with the experimental pump head. Two different flow patterns of TLV cavitation under different tip clearance sizes were obtained by experiments. The effects of the tip clearance size on the tip flow field, generation of vorticity, pressure distribution in the blade passage, and the vortex core pressure were studied systematically. The conclusions were obtained as follows:
(1) There are mainly two obvious leakage vortex structures in the tip region with the consideration of the tip clearance. The larger the size of the tip clearance, the larger the size of the vortex structure. By comparing the direction and value of the leakage velocity in the tip region, it was found that the strength of the leakage vortex can be suppressed by inhibiting the direction and velocity of leakage flow in the flow passage. The pressure distribution of the different radial coefficient sections shows that with the increase of the tip clearance, the influence range of TLV on the pressure distribution in the tip region increases, resulting in a decrease of the work capacity of the impeller in the tip region.
(2) Based on the experimental results, it was found that the inception of TLV cavitation occurs in the TLV of the axial flow pump. By comparing the pressure of the TLV core under different gaps numerically, it was found that the position and intensity of TLV cavitation are different. From the experimental image, we can see that with the decrease of the cavitation number, the size of the strength of TLV under tip clearance gradually increases. In the tip region, the thin leakage vortex band becomes a triangular cavitation cloud. It also becomes unstable with the increase of the blade chord coefficient. Under a large gap, the TLV is larger in size and stronger in strength when the leakage vortex fully develops.
The present research revealed the effect of the tip gap on the pump performance, strength of the tip leakage vortex, and induced cavitation, as well as the pressure in the tip region. The results provide a more detailed insight on the tip leakage flow in an axial flow pump with different tip clearances, and a deeper understanding of the process of the design of axial flow pumps. Generally speaking, a smaller tip gap results in better efficiency. The exact correspondence between the gap size and the induced pump performance needs to be carried out through an optimization design in future work.
Author Contributions
B.X. developed models, analyzed data and wrote the manuscript. X.S. revised models and helped in developing models. D.Z. designed the study, reviewed results and edited the manuscript. W.Z. reviewed results and edited the manuscript.
Funding
This research was funded by National Natural Science Foundation of China [Grant number 51776087, 51579118], National Key Research and Development Program of China [Grant number 2017YFC0404201], 333 Project of Jiangsu Province [Grant number 2016III-2731], Six Talent Peaks Project in Jiangsu Province [Grant number HYGC-008] and Qing Lan Project, Senior Talent Foundation of Jiangsu University [Grant number 18JDG034], Open Research Subject of Key Laboratory (Fluid Machinery and Engineering Research Base) of Sichuan Province [Grant number szjj2019-028] and Jiangsu Planned Projects for Postdoctoral Research Funds [Grant number 2018K102C].
Acknowledgments
The authors appreciate Jiangsu University, key laboratory (Fluid Machinery and Engineering Research Base) of Sichuan province, Jiangsu province and National Natural Science Foundation for their funding and support.
Conflicts of Interest
The authors declare no conflict of interest.
References
- Li, S. China’s water resources and hydropower development policy. Int. J. Hydropower Dams 2000, 7, 58–62. [Google Scholar]
- Zhang, J.-J.; Mao, G.-H.; Cheng, W.-P.; Hu, Y.-J. Hydraulic shape optimization on lateral inlet/outlet of pump-storage plant. J. Zhejiang Univ. Eng. Sci. 2008, 42, 188–192. [Google Scholar]
- Lu, X.; Sun, W.; Li, J. Special problems of engineering geology and rock mechanics in the west route of south-to-north water transfer project. Chin. J. Rock Mech. Eng. 2003, 22, 829–833. [Google Scholar]
- Li, Z.; Fan, H.; Li, J. Seismic response analysis based on dynamic artificial boundaries for nuclear power engineering. Nucl. Power Eng. 2016, 37, 47–50. [Google Scholar]
- Cao, P.; Wang, Y.; Li, G.; Qian, K.X. Research on the performance of shaftless water-jet propulsion. In Proceedings of the ASME 2014 4th Joint US-European Fluids Engineering Division Summer Meeting, FEDSM 2014, Collocated with the ASME 2014 12th International Conference on Nanochannels, Microchannels, and Minichannels, Chicago, IL, USA, 3–7 August 2014; American Society of Mechanical Engineers (ASME): Chicago, IL, USA, 2014. [Google Scholar]
- Cui, N.-G.; Cao, C.-Q.; Wei, C.-Z. Simulation analysis of underwater motion process of submarine launched missile. J. Ballist. 2009, 21, 95–99. [Google Scholar]
- Zhang, D.; Shi, L.; Shi, W.; Zhao, R.; Wang, H.; van Esch, B.B. Numerical analysis of unsteady tip leakage vortex cavitation cloud and unstable suction-side-perpendicular cavitating vortices in an axial flow pump. Int. J. Multiph. Flow 2015, 77, 244–259. [Google Scholar] [CrossRef]
- Cristea, A.; Gonnella, G.; Lamura, A.; Sofonea, V. A Lattice Boltzmann Study of Phase Separation in Liquid-vapor Systems with Gravity. Commun. Comput. Phys. 2010, 7, 350–361. [Google Scholar] [CrossRef]
- Kähler, G.; Bonelli, F.; Gonnella, G.; Lamura, A. Cavitation inception of a van der Waals fluid at a sack-wall obstacle. Phys. Fluids 2015, 27, 123307. [Google Scholar] [CrossRef] [Green Version]
- Li, Z.; Yang, M.-G.; Ji, K.; Gao, B. Visualization research on cavitating flow in tip clearance of axial-flow pump. J. Eng. Thermophys. 2011, 32, 1315–1318. [Google Scholar]
- Liu, Y.; Tan, L.; Hao, Y.; Xu, Y. Energy performance and flow patterns of a mixed-flow pump with different tip clearance sizes. Energies 2017, 10, 191. [Google Scholar] [CrossRef]
- Liu, Y.; Tan, L. Tip clearance on pressure fluctuation intensity and vortex characteristic of a mixed flow pump as turbine at pump mode. Renew. Energy 2018, 129, 606–615. [Google Scholar] [CrossRef]
- Kim, D.J.; Min, Y.U.; Kim, J.Y.; Chung, K.N. A study of tip clearance effect for a mixed-flow pump on performance. In Proceedings of the ASME 2013 Fluids Engineering Division Summer Meeting, FEDSM 2013, Incline Village, NV, USA, 7–11 July 2013; American Society of Mechanical Engineers (ASME): Incline Village, NV, USA, 2013. [Google Scholar]
- Kim, M.-C.; Chun, H.-H. Experimental Investigation into the performance of the Axial-Flow-Type Waterjet according to the Variation of Impeller Tip Clearance. Ocean. Eng. 2007, 34, 275–283. [Google Scholar] [CrossRef]
- Wernet, M.P.; Van Zante, D.; Strazisar, T.J.; John, W.T.; Prahst, P.S. Characterization of the tip clearance flow in an axial compressor using 3-D digital PIV. Exp. Fluids 2005, 39, 743–753. [Google Scholar] [CrossRef]
- Zhang, Z.; Yu, X.; Liu, B. Characteristics of the Tip Leakage Vortex in a Low-Speed Axial Compressor with Different Rotor Tip Gaps. In Proceedings of the ASME Turbo Expo 2012: Turbine Technical Conference and Exposition, Copenhagen, Denmark, 11–15 June 2012; Volume 8: Turbomachinery, Parts A, B, and C, pp. 311–322. [Google Scholar]
- Yu, X.J.; Liu, B.J. Stereoscopic PIV measurement of unsteady flows in an axial compressor stage. Exp. Therm. Fluid Sci. 2007, 31, 1049–1060. [Google Scholar] [CrossRef]
- Fu, Y.; Yuan, J.; Yuan, S.; Pace, G.; D’Agostino, L. Effect of Tip Clearance on the Internal Flow and Hydraulic Performance of a Three-Bladed Inducer. Int. J. Rotating Mach. 2017, 1, 1–10. [Google Scholar] [CrossRef]
- Weidong, S.; Hua, Z.; Bin, C.; Desheng, Z.; Lei, Z. Numerical simulation of internal flow field in axial-flow pump with different blade tip clearance sizes. J. Drain. Irrig. Mach. Eng. 2010, 28, 374–377, 406. [Google Scholar]
- Wu, Y.-H.; Li, Q.-P.; Zhang, Z.-X.; Chu, W.-L.; Zhang, H.-G. Unsteady behavior of tip clearance flow in an axial flow compressor rotor at near stall condition. J. Propuls. Technol. 2010, 31, 562–566, 586. [Google Scholar]
- Zhou, B.; You, B.; Wu, K.-Q. Internal flow investigation and noise reduction of the cross-flow fan using the variable tip clearance tongue. J. Eng. Thermophys. 2008, 29, 2043–2045. [Google Scholar]
- Rains, D.A. Tip Clearance Flows in Axial Compressors and Pumps. In Division of Engineering and Applied Science; California Institute of Technology: Pasadena, CA, USA, 1954. [Google Scholar]
- Zierke, W.C.; Straka, W.A. Flow visualization and the three-dimensional flow in an axial-flow pump. J. Propuls. Power 1996, 12, 250–259. [Google Scholar] [CrossRef]
- Miorini, R.L.; Wu, H.; Katz, J. The Internal Structure of the Tip Leakage Vortex within the Rotor of an Axial Waterjet Pump. In Proceedings of the ASME Turbo. Expo. 2010: Power for Land, Sea, and Air, GT 2010, Glasgow, UK, 14–18 June 2010; American Society of Mechanical Engineers (ASME): Glasgow, UK, 2010. [Google Scholar]
- Tan, D.; Li, Y.; Wilkes, I.; Vagnoni, E.; Miorini, R.L.; Katz, J. Experimental Investigation of the Role of Large Scale Cavitating Vortical Structures in Performance Breakdown of an Axial Waterjet Pump. J. Fluids Eng. 2015, 137, 111301. [Google Scholar] [CrossRef]
- You, D.; Mittal, R.; Wang, M.; Moin, P. Computational Methodology for Large-Eddy Simulation of Tip-Clearance Flows. AIAA J. 2004, 42, 271–279. [Google Scholar] [CrossRef]
- You, D.; Wang, M.; Moin, P.; Mittal, R. Large-eddy simulation analysis of mechanisms for viscous losses in a turbomachinery tip-clearance flow. J. Fluid Mech. 2007, 586, 177–204. [Google Scholar] [CrossRef] [Green Version]
- Shi, L.; Zhang, D.; Jin, Y.; Shi, W.; van Esch, B.P.M. A study on tip leakage vortex dynamics and cavitation in axial-flow pump. Fluid Dyn. Res. 2017, 49, 035504. [Google Scholar] [CrossRef]
- Shi, L.; Zhang, D.; Zhao, R.; Shi, W.; Jin, Y. Effect of blade tip geometry on tip leakage vortex dynamics and cavitation pattern in axial-flow pump. Sci. China Technol. Sci. 2017, 60, 1480–1493. [Google Scholar] [CrossRef]
- Zhang, D.; Shao, P.; Shi, W.; Pan, D.; Wang, H. Numerical simulation of tip leakage vortex hydrodynamics characteristics in axial flow pump. Trans. Chin. Soc. Agric. Mach. 2014, 45, 72–76. [Google Scholar]
- Zhang, D.; Shi, W.; Wu, S.; Pan, D.; Shao, P.; Wang, H. Numerical and experimental investigation of tip leakage vortex trajectory in an axial flow pump. In Proceedings of the ASME 2013 Fluids Engineering Division Summer Meeting, FEDSM 2013, Incline Village, NV, USA, 7–11 July 2013; American Society of Mechanical Engineers: Incline Village, NV, USA, 2013. [Google Scholar]
- Spalart, P.R.; Shur, M.L. On the sensitization of turbulence models to rotation and curvature. Aerosp. Sci. Technol. 1997, 1, 297–302. [Google Scholar] [CrossRef]
- Barnosa Pola, F.P.; Venturini Pola, I.R. Optimizing computational high-order schemes in finite volume simulations using unstructured mesh and topological data structures. Appl. Math. Comput. 2019, 342, 1–17. [Google Scholar] [CrossRef]
- Geyer, P.E.; Haynes, B.S.; Fletcher, D.F. Assessment of the SST and omega-based reynolds stress models for the prediction of flow and heat transfer in a square-section u-bend. Comput. Therm. Sci. 2009, 1, 385–403. [Google Scholar] [CrossRef]
- Li, X.; Chen, B.; Luo, X.; Zhu, Z. Effects of flow pattern on hydraulic performance and energy conversion characterisation in a centrifugal pump. Renew. Energy 2019. [Google Scholar] [CrossRef]
Figure 1.
Schematic illustration of the model pump structure.

Figure 2.
Schematic illustration of the axial flow pump loop.

Figure 3.
High-speed imaging system setup.

Figure 4.
Mesh of the axial flow pump. (a) Computational domain; (b) Surface mesh of the components; (c) Mesh distribution around tip clearance; (d) Mesh distribution around the blade surface.
Figure 4.
Mesh of the axial flow pump. (a) Computational domain; (b) Surface mesh of the components; (c) Mesh distribution around tip clearance; (d) Mesh distribution around the blade surface.

Figure 5.
Comparison of the external performance.

Figure 6.
Comparison of tip cavitation patterns at different cavitation numbers: (a) τ = 0.5 mm; (b) τ = 1.5 mm.
Figure 6.
Comparison of tip cavitation patterns at different cavitation numbers: (a) τ = 0.5 mm; (b) τ = 1.5 mm.

Figure 7.
Definition of the chord parameters.

Figure 8.
Pressure distributions on the blade tip.

Figure 9.
Schematic of streamline at plane λ = 0.5.

Figure 10.
Mean streamline at different chordwise planes: (a) λ = 0.1; (b) λ = 0.5; (c) λ = 0.9. (r* is the dimensionless radial location of the blade).
Figure 10.
Mean streamline at different chordwise planes: (a) λ = 0.1; (b) λ = 0.5; (c) λ = 0.9. (r* is the dimensionless radial location of the blade).

Figure 11.
Mean streamline in the tip gap region at different tip gap sizes. (a) τ = 0.5 mm, r* = 0.995; (b) τ = 1.5 mm, r* = 0.985.
Figure 11.
Mean streamline in the tip gap region at different tip gap sizes. (a) τ = 0.5 mm, r* = 0.995; (b) τ = 1.5 mm, r* = 0.985.

Figure 12.
Distribution of radial planes.

Figure 13.
Contours of the mean pressure at different radial planes. (a1) r* = 0.9, τ = 0.5 mm, (a2) r* = 0.9, τ = 1.5 mm; (b1) r* = 0.75, τ = 0.5 mm, (b2) r* = 0.75, τ = 1.5 mm; (c1) r* = 0.5, τ = 0.5 mm, (c2) r* = 0.5, τ = 1.5 mm. (P* is the mean pressure coefficient).
Figure 13.
Contours of the mean pressure at different radial planes. (a1) r* = 0.9, τ = 0.5 mm, (a2) r* = 0.9, τ = 1.5 mm; (b1) r* = 0.75, τ = 0.5 mm, (b2) r* = 0.75, τ = 1.5 mm; (c1) r* = 0.5, τ = 0.5 mm, (c2) r* = 0.5, τ = 1.5 mm. (P* is the mean pressure coefficient).

Figure 14.
Pressure coefficient of the vortex core with different blade chord coefficients. (P* is the mean pressure coefficient).
Figure 14.
Pressure coefficient of the vortex core with different blade chord coefficients. (P* is the mean pressure coefficient).

Figure 15.
Pressure distribution at different chordwise planes. (a) λ = 0.1; (b) λ = 0.3; (c) λ = 0.5; (d) λ = 0.7; (e) λ = 0.9. (P* is the mean pressure coefficient; r* is the dimensionless radial location of the blade).
Figure 15.
Pressure distribution at different chordwise planes. (a) λ = 0.1; (b) λ = 0.3; (c) λ = 0.5; (d) λ = 0.7; (e) λ = 0.9. (P* is the mean pressure coefficient; r* is the dimensionless radial location of the blade).


Table 1.
Mesh information.
| Tip Clearence | Total Mesh Nodes | Impeller Mesh Nodes | Gap Mesh Nodes | Mean y+ of Blades | Mean y+ of Out Wall |
|---|---|---|---|---|---|
| τ = 0.5 mm | 10,081,811 | 5,534,874 | 30 | 3.07 | 25.63 |
| τ = 1.5 mm | 10,498,773 | 5,951,796 | 40 | 2.10 | 26.80 |
© 2019 by the authors. Licensee MDPI, Basel, Switzerland. This article is an open access article distributed under the terms and conditions of the Creative Commons Attribution (CC BY) license (http://creativecommons.org/licenses/by/4.0/).
Share and Cite
MDPI and ACS Style
Xu, B.; Shen, X.; Zhang, D.; Zhang, W. Experimental and Numerical Investigation on the Tip Leakage Vortex Cavitation in an Axial Flow Pump with Different Tip Clearances. Processes 2019, 7, 935. https://doi.org/10.3390/pr7120935
AMA Style
Xu B, Shen X, Zhang D, Zhang W. Experimental and Numerical Investigation on the Tip Leakage Vortex Cavitation in an Axial Flow Pump with Different Tip Clearances. Processes. 2019; 7(12):935. https://doi.org/10.3390/pr7120935
Chicago/Turabian StyleXu, Bin, Xi Shen, Desheng Zhang, and Weibin Zhang. 2019. "Experimental and Numerical Investigation on the Tip Leakage Vortex Cavitation in an Axial Flow Pump with Different Tip Clearances" Processes 7, no. 12: 935. https://doi.org/10.3390/pr7120935
Note that from the first issue of 2016, this journal uses article numbers instead of page numbers. See further details here.