Article

Accurate Insulating Oil Breakdown Voltage Model Associated with Different Barrier Effects

by
Sherif S. M. Ghoneim
1,
Sobhy S. Dessouky
2,
Ahmed Boubakeur
3,
Adel A. Elfaraskoury
4,
Ahmed B. Abou Sharaf
5,
Karar Mahmoud
6,7,
Matti Lehtonen
6 and
Mohamed M. F. Darwish
6,8,*
1
Department of Electrical Engineering, College of Engineering, Taif University, P.O. Box. 11099, Taif 21944, Saudi Arabia
2
Electrical Engineering Department, Faculty of Engineering, Port Said University, Port Said 42526, Egypt
3
Laboratoire de Recherche en Electrotechnique L.R.E, Ecole Nationale Polytechnique (ENP), BP 182, El-Harrach, Algiers 16200, Algeria
4
Extra High Voltage Research Centre, Egyptian Electricity Holding Company, Cairo 11517, Egypt
5
Mataria Technical College, Ministry of Higher Education, Cairo 11735, Egypt
6
Department of Electrical Engineering and Automation, School of Electrical Engineering, Aalto University, FI-00076 Espoo, Finland
7
Department of Electrical Engineering, Faculty of Engineering, Aswan University, Aswan 81542, Egypt
8
Department of Electrical Engineering, Faculty of Engineering at Shoubra, Benha University, Cairo 11629, Egypt
*
Author to whom correspondence should be addressed.
Processes 2021, 9(4), 657; https://doi.org/10.3390/pr9040657
Submission received: 7 March 2021 / Revised: 4 April 2021 / Accepted: 7 April 2021 / Published: 9 April 2021
(This article belongs to the Section Energy Systems)

Abstract

:
In modern power systems, power transformers are considered vital components that can ensure the grid’s continuous operation. In this regard, studying the breakdown in the transformer becomes necessary, especially its insulating system. Hence, in this study, Box–Behnken design (BBD) was used to introduce a prediction model of the breakdown voltage (VBD) for the transformer insulating oil in the presence of different barrier effects for point/plane gap arrangement with alternating current (AC) voltage. Interestingly, the BBD reduces the required number of experiments and their costs to examine the barrier parameter effect on the existing insulating oil VBD. The investigated variables were the barrier location in the gap space (a/d)%, the relative permittivity of the barrier materials (εr), the hole radius in the barrier (hr), the barrier thickness (th), and the barrier inclined angle (θ). Then, only 46 experiment runs are required to build the BBD model for the five barrier variables. The BBD prediction model was verified based on the statistical study and some other experiment runs. Results explained the influence of the inclined angle of the barrier and its thickness on the VBD. The obtained results indicated that the designed BBD model provides less than a 5% residual percentage between the measured and predicted VBD. The findings illustrated the high accuracy and robustness of the proposed insulating oil breakdown voltage predictive model linked with diverse barrier effects.

1. Introduction

A transformer is a crucial piece of equipment in the power system networks. The transformer’s primary failure comes from the insulating system’s deterioration, which consists of insulating oil and paper [1,2]. The transformer oil remains the most suitable liquid used in high-voltage apparatus as an insulating medium, but it still breaks under electrical and thermal stresses [3,4,5,6,7,8]. In the presence of a barrier in the insulating oil, the risk of the breakdown is reduced due to the stopping of the charge carriers by the barrier; then, these charge carriers accumulate on the barrier surface, constituting the barrier surface charge. Moreover, the barrier plays a significant role in impeding the discharge in the insulating oil of power transformers by encountering particle movement [9]. The breakdown voltage (VBD) of homogeneous and non-homogeneous field gaps is affected mainly by inserting thin dielectric barriers in the gaps; this phenomenon is called the barrier effect. This effect is characterized by the electric field’s uniformity between the barrier and the plane electrode, increasing the VBD. Thus, studying the influence of such barrier effect on the VBD of the transformer oil is essential [10].
The barrier effect was observed first in 1920 by C.P. Steinmetz in the point/plane air gaps [11]. Some former studies have directed to investigate the consequence of the barrier set, e.g., the location of the barrier concerning the barrier diameter (D), the space of gap (a/d)%, and the gap space among the electrodes (d) under different applied voltages and gap space configurations [11,12,13]. The influence of surface conductivity of the barrier system on the VBD was presented in [14]. A rod/plane arrangement with the 80 mm distance between the high-voltage electrode (rod) and a grounded plane electrode was used. A single barrier was placed in the arrangement, and its surface resistivity was decreased systematically. A decrease in the VBD arrangement with a reduction in surface resistivity was observed for positive, negative lightning impulse and alternating current (AC) voltage. The effect of barriers at early discharge and the failure stages for different field arrangements (homogenous and non-homogenous) was presented in [15]. The barrier location influences the failure stress, not the onset discharges. The effect of the barrier on the contaminated particle movements was investigated with the oil volume variation. The kraft paper’s influence on preventing the bridging of the pressboard fiber particles in the insulating oil through experimental works was illustrated. Three different kraft pressboard paper types under different AC and DC voltages were examined in [16]. Recently, artificial intelligence and machine learning techniques have been employed in several applications with promising performance in power system applications with renewables [17,18,19,20,21,22,23,24,25,26,27,28]. Specifically, an artificial neural network (ANN) was presented in [29] to study the barrier effect parameters on the VBD of the transformer insulating oil for the point/plane and plane/plane gaps under AC high voltage. The results showed the ANN model’s capability to predict the VBD with the barrier parameters’ variation.
A mathematical and statistical model using the response surface methodology (RSM) includes some techniques such as the center composite face (CCF) and Box–Behnken design (BBD). They have been used to model and analyze the relationship between specific experiments’ responses and their variable influence. In these techniques, a minimum number of experiment runs is required to reduce the experiment cost [30]. A second-order model was constructed using CCF and BBD in [13,31] to inspect the influence of different barrier parameters, such as barrier place in the gap spacing, the gap spacing, and the barrier diameter of point/plane electrode arrangement under AC voltage. The conclusion was that the type of RSM technique affects the constructed model’s accuracy and the cost of experimental works [31].
Previous works have studied the effect of some barrier variables on the strength of the insulating oil and its VBD, e.g., the barrier location and its diameter and the gap space between the electrodes [3,9,12,13,31]. In the current work, the effect of some new barrier variables is investigated. These variables are the barrier holes that may develop from the faults, whether intentional or accidental, and the barrier thickness, dielectric constant, and inclination angle. Moreover, mathematical modeling was used to construct a model linking the relation between the VBD and the barrier variables, such as a CCF design [13]. It shows a significant deviation in some cases between the measured and predicted VBD (17.17% deviation is a maximum). The proposed BBD technique was used to reduce this deviation. The number of experiments runs required for a given number of BBD factors is less than that for CCF. For five experiment factors, BBD requires 46 experiment runs, and CCF requires 52 experiment runs. In general, the greater number of variables in the model leads to many laboratory experiments. More efforts in the modeling process will be needed to create the model. All the previous reasons refer to the novelty of the current work.
Investigating the influence of more than three variables and their interaction on a particular experiment response is complicated and requires many experiments. Therefore, reducing the number of experiments with variables of more than three is a great challenge. Therefore, BBD is a technique used to reduce the number of experiments and then reduce the experiment cost. The number of experiments to build the relationship between the response based on the experiment variables depends on the number of variables; that is, 15 experiment runs are required for three experimental variables, 27 runs for four experiment variables, and 46 experiment runs for five experiments variables.
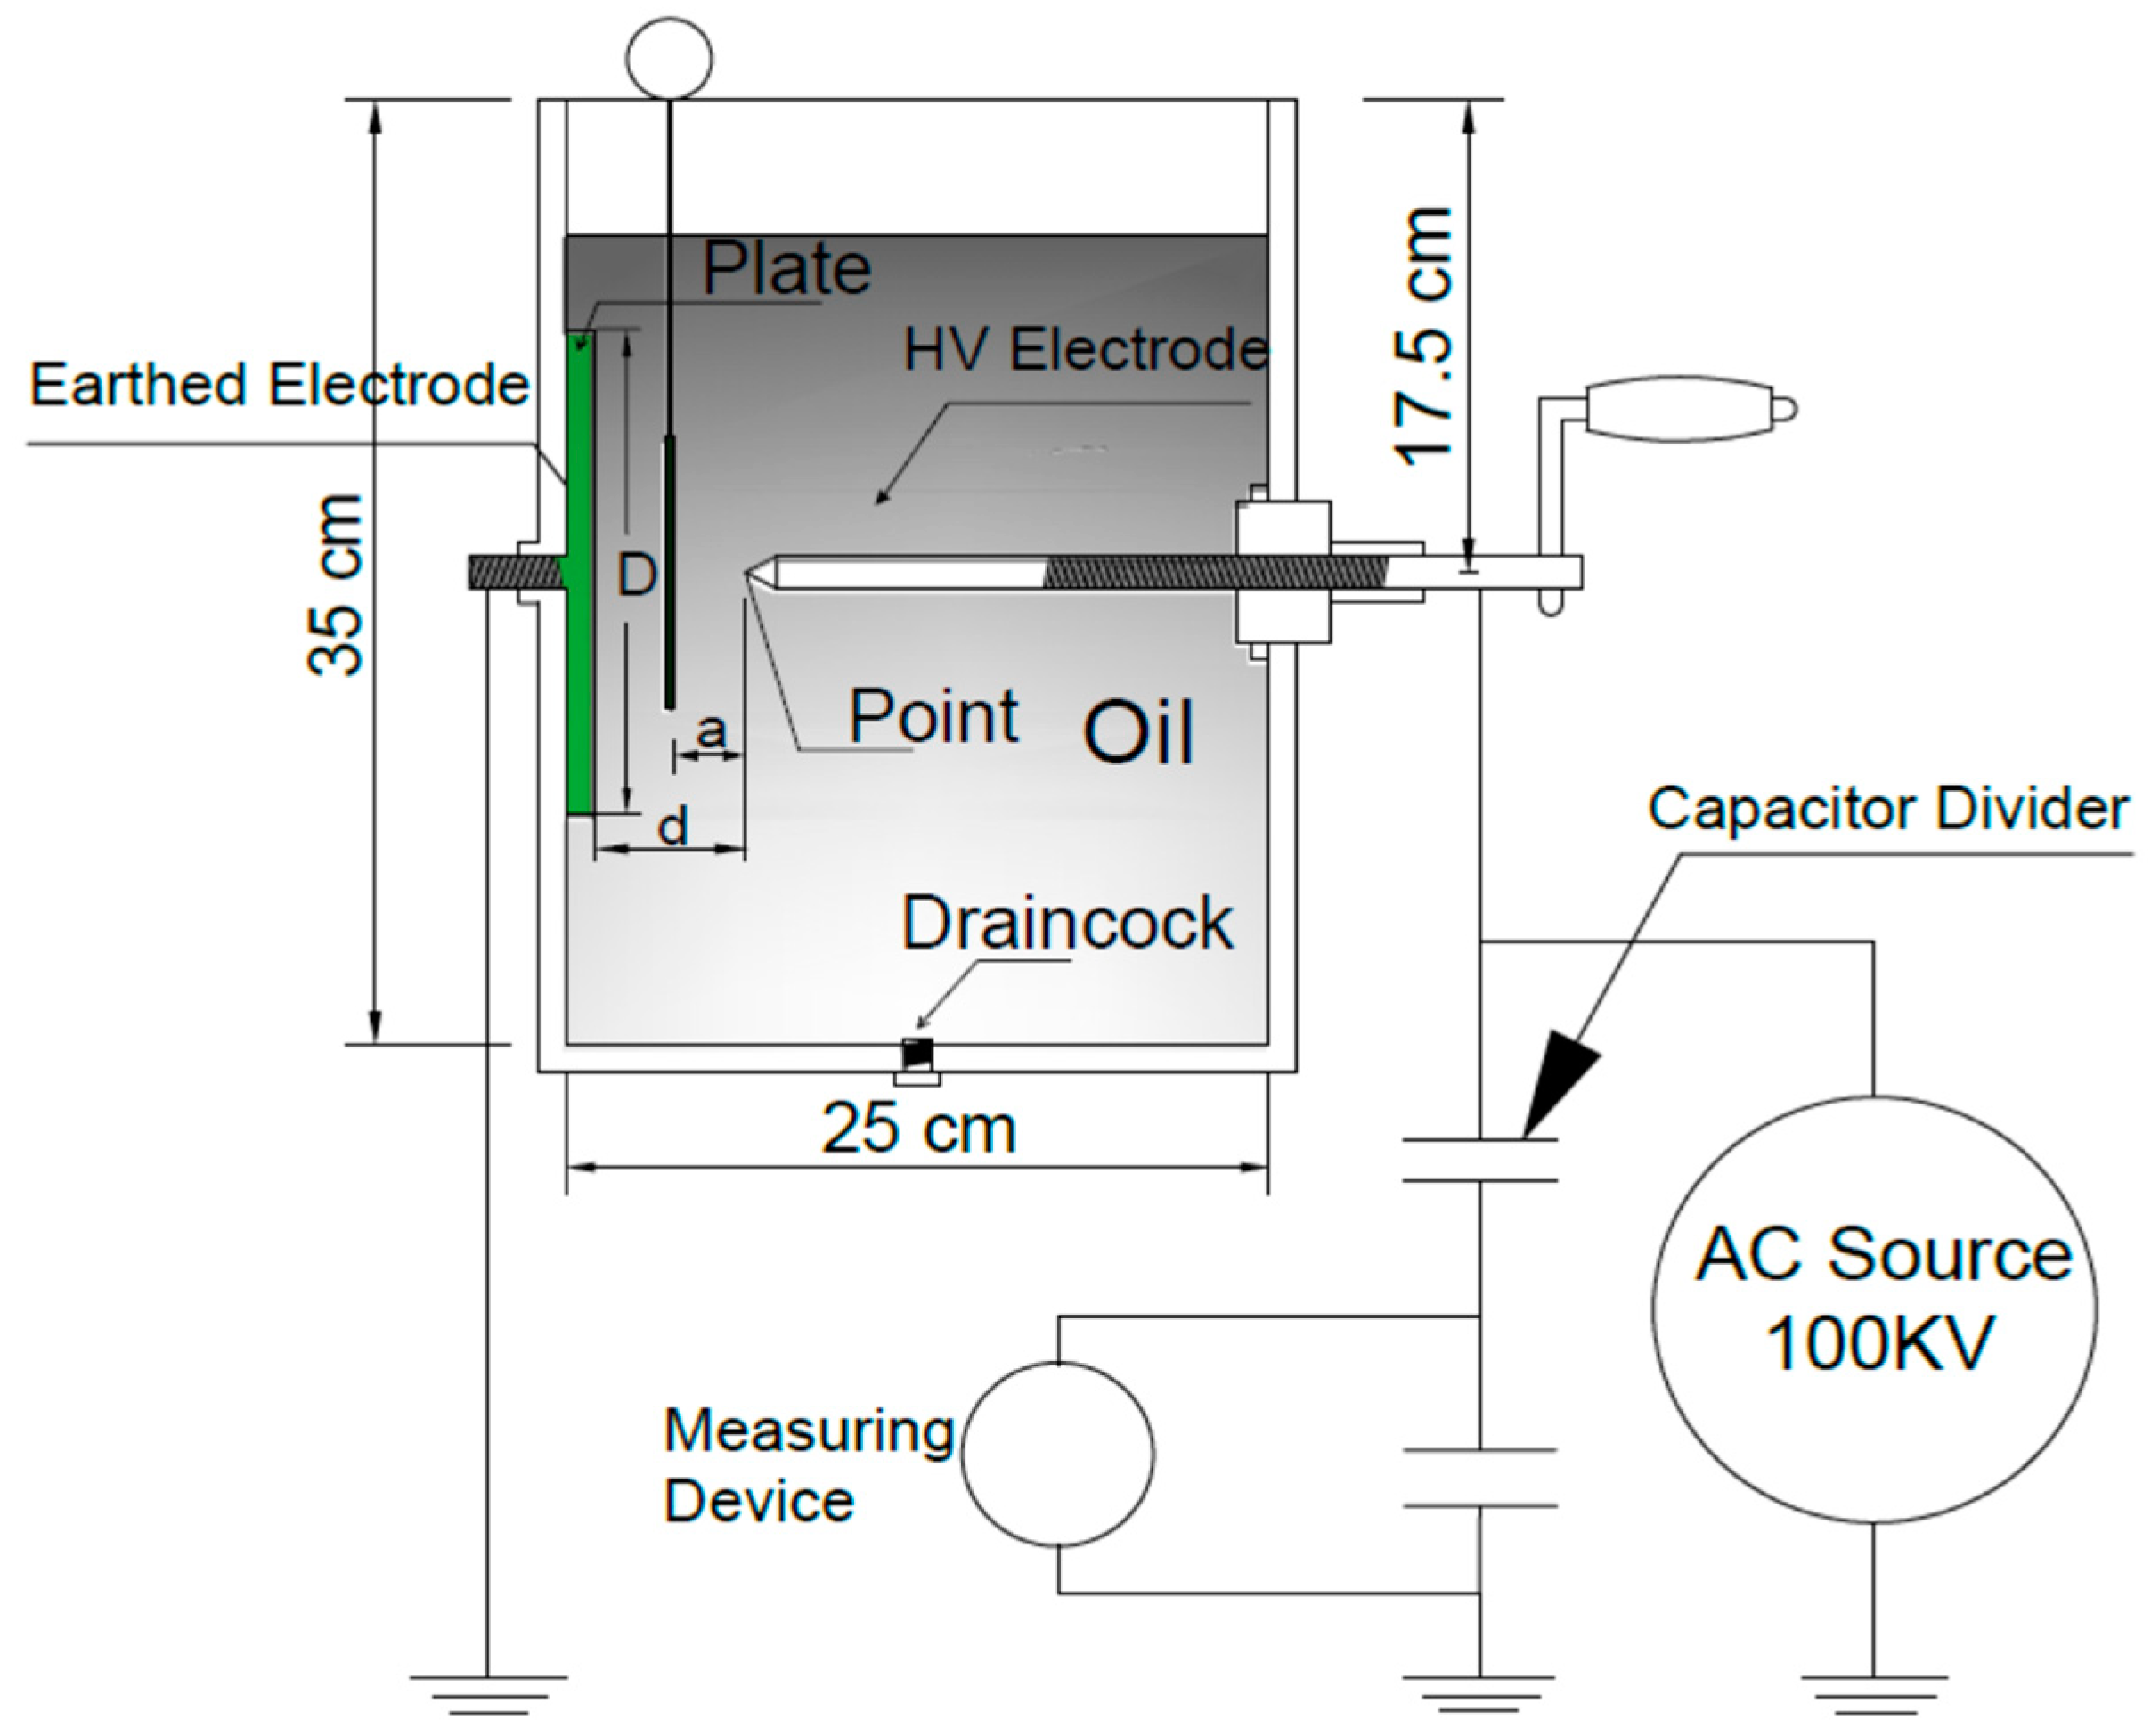
In this study, new barrier variables are considered to investigate their effects on the VBD of insulating oils with point /plane gap configuration under alternating current (AC) voltage based on BBD. These barrier variables are the barrier location in the gap space (a/d)%, the dielectric constant of barrier material (εr), the hole radius in the barrier (hr), the barrier thickness (th), and the inclined angle of the barrier in the gap space (θ). The advantage of using the BBD technique in treating the difficulties of practical limits is avoiding risky mixtures because the sharp edges and star points are evaded [31]. Then, altogether points nominated to build the BBD model lie on the anticipated region (i.e., studied data region). The BBD declines the chosen number of experiment runs for the constructed model. A total of 46 experiment runs are required to simulate the relation between the VBD as a response and five barrier variables. A prediction equation is developed based on BBD, and the significance of each term in this equation is investigated with the statistical study to obtain the approximated equation. The results of the predicted equation and its approximation provide minimum errors with 20 new experiment runs. In all cases, the errors are always less than 5%.

2. Experimental Works and Results

2.1. Experimental Setup

The BBD model is built based on the experimental work results established in the Extra High-Voltage Research Center of the Egyptian Electricity Holding Company. The experiments are developed using a plexiglass tank with 25 × 25 × 35 cm filled with 18.75 L of insulating oil. A 100 kV AC source is used with a capacitor divider for applying the AC high voltage on the point/plane gap configuration, as shown in Figure 1. Three types of barrier material are used (mica with a dielectric constant (εr) 2.5, pressboard with 3, and acrylic with 3.5). The gap space is constant at 4 cm, and the circular barrier diameter is fixed at 7 cm for all barriers. An earthed electrode is a plane with 17 cm in a diameter ring shape. The barrier is suspended in the gap space with the help of an acrylic bar. The transformer insulating oil kind is Diala D, where its dielectric strength is above 30 kV/cm (without treatment) as well as greater than 70 kV/cm (with treatment) based on both IEC 60296 and IEC 60156 [32,33]. The characteristics of the insulating oil shell Diala D are illustrated in Table 1. Note that the treatment of the original oil increases the breakdown voltage to more than 70 kV. Figure 2 explains the experimental arrangement of the point/plane gap configuration with the inclined barrier. The barrier location ((a/d)%) is varied from 25% to 100% in the gap space d. Different barrier materials are used with different dielectric constants that range from 2.5 to 3.5. The hole radius (hr) made in the barrier varies with values of 0.75, 1.25, and 1.75 mm. The holes were also made in the center of the barrier. The thickness (th) of the barrier also varies between 2 and 4 mm. The inclined angle of the barrier is considered 0°, 45°, and 90°. The barrier is in a horizontal position at 0°, and it is in a vertical one for 90°. Based on the IEC 60156, the average value of six sequences runs on the insulating oil is considered. Then, each value of breakdown voltage is the average value of the applied voltage’s six consecutive runs.

2.2. Results for Barrier Location (a/d)% and Barrier Material (εr)

The first barrier variable that influences the VBD is the location of the barrier in the gap space. The variation in the VBD with (a/d)% is illustrated in Figure 3, where the VBD is recorded when the barrier location varies from 25 to 100% of the gap space, and three types of barrier material are used with different dielectric constants. The maximum breakdown voltage occurs when the barrier is closing to the high voltage electrode. The breakdown voltage diminishes when the barrier is approaching the grounded electrode. When we construct the mathematical model, it is not convenient to put the variable (a/d)% equal to zero since (a/d)% minimum value is considered 25%. Figure 3 illustrated the experiments investigating the effect of barrier location were conducted at th = 2 mm, without a hole, and with a vertical barrier position. Figure 3 demonstrates that the VBD decreases with the increase in the (a/d)%. When the (a/d)% is 100%, the barrier’s effect is reduced, and the VBD reaches the gap’s VBD value without barrier. Moreover, the VBD increases with a high dielectric constant as in acrylic.

2.3. Results for Barrier Thickness (th)

Figure 4 depicts the barrier thickness’s impact on the insulating oil VBD at diverse barrier locations in the gap space. The experiments’ parameters are acrylic material, without a hole in the barrier, and vertical barrier position (θ = 90°). An increase in the barrier thickness results in an increase in the VBD at a similar barrier position in the gap space.

2.4. Results for Barrier Hole Radius (hr)

Figure 5 shows that the barrier without any hole significantly affects VBD. With a hole in the barrier, the VBD of the point/plane oil gap decreases. In such a case, the barrier has a negative effect. Meanwhile, an increase in the hole radius leads to a reduction in the VBD at the exact barrier location. When (a/d)% is 100%, the barrier does not affect, and the VBD reaches one of the gaps without the barrier. The experiments are conducted at the barrier thickness th equal to 2 mm, acrylic barrier material, and the inclined angle (θ) equivalent to 90°.

2.5. Results for Barrier Inclined Angle (θ)

Figure 6 explains the relation between the VBD and the barrier inclined angle (θ). The vertical position (θ = 90°) of the barrier plays an imperative role in increasing the VBD of the power transformer insulating oil rather than any other inclined barrier angle or the barrier with a horizontal position. A decrease in VBD is observed when the location of the barrier increases until (a/d) reaches 100%. Then, the effect of the barrier decreases, and the VBD becomes close to that of the gap without barrier. The experiments’ parameters are an acrylic barrier made of acrylic, without a hole in the barrier, and the barrier thickness (th) of 2 mm.
The experimental results indicated that the breakdown voltage values were of low values because there is no physical mechanism consideration. It is unclear if they can be applied to other fluids.

3. Box–Behnken Design (BBD)

The design of experiments (DOE) is considered a feature of the RSM and has numerous practices. The CCF and BBD are considered the most known DOE methods [34]. BBD is recently viewed in many applications to investigate the effect of the experimental parameters on these experiments’ responses, as in [13,31,35,36,37,38,39,40]. Further, it is lying on the division of applied statistics for analyzing, planning, and interpreting the controlled test for determining the parameters that regulate the reaction of practical experiments. Before conducting the investigation, two concepts must be considered: the experiment domain and the experiments’ mathematical model [13]. The quadratic formula of the BBD model of the designed experiment is given by Equation (1) [41]:
Y   =   α 0   +   i = 1 N v α i X i   +   i = 1 N v j = 1 N v α ij X i X j   +   i = 1 N v α ii X i 2   +   ε
where Y is the response, and Xi refers to the input variables that influence the experiment response. XiXj is the two-way (interaction) terms; the number is calculated as k(k − 1)/2, where k is the number of input variables. The X i 2 refers to the second-order of the variables. ( α 0 , α ij , α ii ) is the coefficient of all terms in the quadratic equation. The ε expresses the error of the equation, and Nv is the number of experiment variables.
In the BBD, the input parameters (i.e., considered factors) are categorized into three different levels for each factor. These levels involve the minimum, mean, and maximum variable values. Note that the three levels are coded by −1, 0, and 1, respectively. For example, the barrier thickness variable th is regarded as 2, 3, and 4 mm, which correspond to the coded values of −1, 0, and 1, respectively. The coding of other variables is explained in the study, as in Table 2. The coded value of the five barrier variables is described in Table 2.
BBD is considered a rotatable or nearly rotatable second-order design that needs three levels of each variable that influence a specific experiment response. It is recently widely used in many applications of the research environment [35,36,37,38,39,40]. These experiment variable levels are categorized into minimum, mean, and maximum levels, and they are coded as −1, 0, and 1, respectively. The required number of experiments runs (Nr) for BBD design is determined as follows [42]:
Nr = 2Nv(Nv − 1) + CP0
Nv represents the counting number of factors (i.e., input parameters), and CP0 refers to the number of repetitions tests at the center point. Note that the coded values of the input variables of the experimental are clarified in Table 2.
The authors of [42] presented only the fundamentals, advantages, and limitations of the BBD for the optimization of analytical methods. They showed an example for three parameters only with 15 experiments runs where CP0 is three. A total of 46 experiment runs are required according to Equation (2) with six points in the center values of the five variables to apply the BBD to the designed experiments to investigate the effect of five variables on the response of these experiments (VBD). Table 3 illustrates the coded values, the values of the variables, and the response of the 46 experiments. A total of six points are repeated at the zero code of the variables to provide a CP0-1 degree of freedom for determining the experiment errors and enhancing the response’s precision at these zero codes of the variables [43]. A total of 46 experiment runs are conducted to investigate the effect of the previous barrier variables on the VBD, as the BBD technique’s requirement is illustrated in Table 3. Each experiment run is performed to satisfy the particular need of BBD. The first experiment run in Table 3 indicates that the VBD is measured at the following conditions: the barrier location is minimum at 25% of the gap space, the dielectric strength (εr) is minimum at 2.5 for mica barrier material, the radius of the hole in the barrier is at the mean value of 1.25 mm, the barrier thickness is at 3 mm as a mean value of the thickness variable, and the inclined angle of the barrier is at a mean value of 45°. The remaining 46 experiment runs are conducted as illustrated in Table 3.
Equation (1) is used to build the BBD model for determining the relation between the experiment input variables and the response of the designed experiments. The number of coefficients (Nc) of Equation (1) can be computed as follows:
Nc = (Nv + 1) (Nv + 2)/2
Nc is the number of coefficients (α0, αi, αij, and αii), and Nv is the number of experiment variables. From Equation (3), 21 coefficients of Equation (1) are developed.
The Matlab software calculates Equation (1) coefficients, while the equivalent BBD model of the predicted formula of VBD can be explained as in Equation (4).
V B D =   38.75     2.1875 · ( a d )   +   1.9375 · ( ε r )     0.625 · h r   +   3 · t h     8.75 · θ   +   0.25 · ( a d ) · ( ε r )   +   0.5 · ( a d ) · h r   0.25 · ( a d ) · th     0.25 · ( a d ) · θ     0.25 · ( ε r ) · h r     0.25 · ( ε r ) · θ     0.25 · ( h r ) · θ   +   1.75 · t h · θ   0.4792 · ( a d ) 2     0.3125 ( ε r ) 2     0.3958 · ( h r ) 2   +   0.2708 · ( t h ) 2   +   9.1042 · ( θ ) 2
Figure 7 shows αi magnitude of the 2-order equation (Equation (4)) for every input variable. In the statistical section, the significant terms of Equation (4) will be identified and their influence on the response value (VBD). Equation (4) is applicable only for the electrode configuration point/plane gap and not for point/point or plane/plane gap.

4. Statistical Analyses

The approximate solution for Equation (4) can be developed using statistical analysis to explain the significant terms. The statistical analysis provides the regression analysis to evaluate the descriptive model quality [13]. The hypothesis test (p-value) and critical value approach (tcrit) can assess the significant terms in Equation (4). The t-test (tstat) is compared with tcrit to determine the essential terms in the predicted equation. When tstat is greater than tcrit, this term is considered an effective term; otherwise, the term can be removed from the predicted equation. The p-value uses the possible probability to decide whether the null hypothesis is rejected by evaluating the p-value risk interval of β = 0.05. The tstat can be assessed using SEi parameter. The SEi in Table 4 denotes the modification of residue coefficients that are computed by [13]:
S E i 2   =   ( 1 N r     N c e i 2 ) N r
Nr represents the experiment number, while Nc denotes the number of used variable coefficients. Note that the variance between them, formulated by NrNc, is named the number of degrees of freedom. In turn, ei denotes the residues that rapid the alteration between the measured and forecast values of the response (VBD).
The tstat represents the coefficient of t-test model. In Table 4, tstat can be assessed by the ratio of the mathematical model’s coefficients to the SE at each variable coefficient αi, as in Equation (6).
t s t a t   =   α i S E i
The t-test is used to examine the vital result of every input variable. The critical t-test value (tcrit) can be calculated in Equation (7) as in [13].
t c r i t   =   ( β   , N r     N c )
Based on the parameters of Equation (7), where the risk interval β is equal to 0.05 and Nr − Nc is equal to 25, then tcrit is equal to 1.708. As shown in Table 3, the tstat values corresponding to each α coefficient indicate that the most significant terms of Equation (4) on the VBD are the shaded rows in Table 3. The value of p-value sustains this fact, where every shaded row has a p-value less than 0.005. The low p-value of each shaded row designates that the sample data can provide a productive indication to discard the null theory from the whole population of the experimental runs.
Note that the p-value (see Table 4) exemplifies which forecast variable significantly affects the response. Consequently, as for the t-test, the variables (a/d)%, εr, hr, th, θ, (th × θ), and θ2 are significant terms of Equation (4) in the model, given that its p-value is less than 0.05.
The other statistical parameters that assess the designed model’s evocative excellence, such as the R-squared (R-sq), adjusted R-squared, and the F-statistic, can be determined in Table 5. As shown in Table 5, the R-squared is 0.993, which indicates the strong relation between the experiment variables and the experiment response. The adjusted R-squared is 0.983, which refers to the compatibility between the response’s measured and predicted value. The F-statistic is 175, which indicates the significant predictive capability of the designed model. The root means squared error of the developed model is very low (0.832), which means fewer differences between the measured and predicted response values.
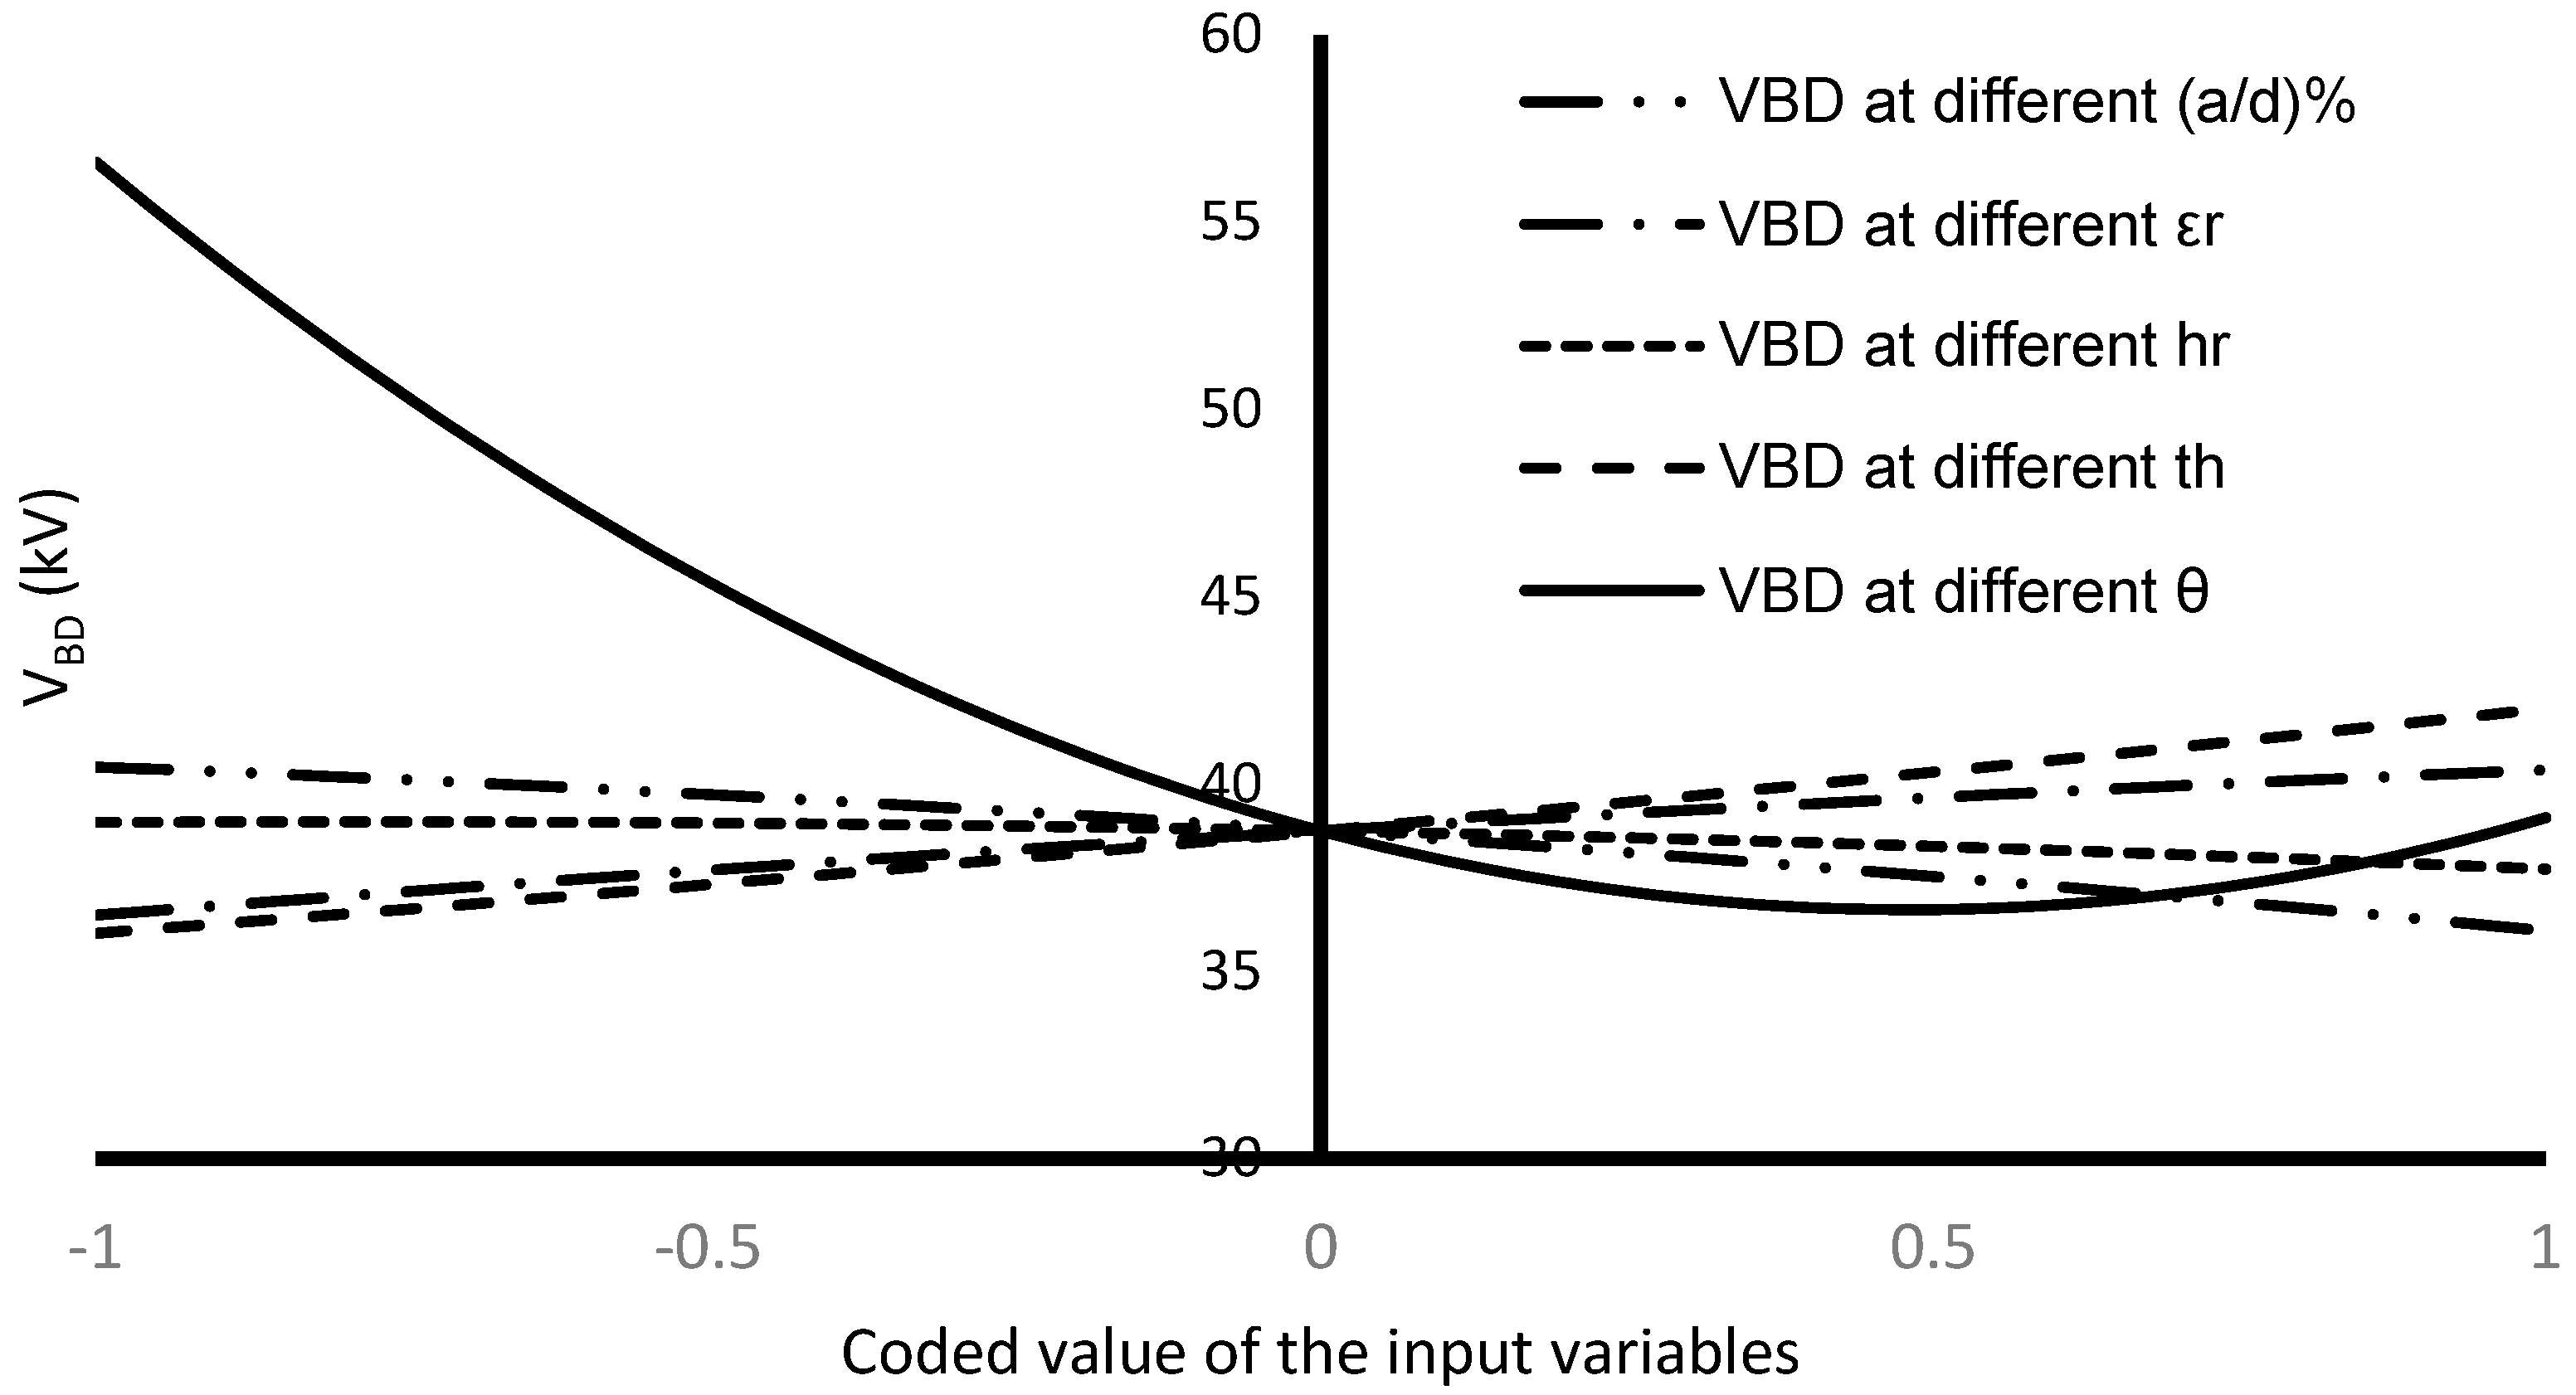
Figure 8 illustrates the variation in the experiment variables with the variation in the experiment response. As observed, the barrier thickness and the barrier’s inclined angle are essential variables that influence the magnitude of the experiment response (VBD). The absolute variation percentage of the VBD to the barrier thickness variation is ((36.0208−42.0208)/42.0208) × 100 = 14.27%, while the absolute deviation of the VBD according to the inclined angle of the barrier is ((56.6042−39.1042)/56.6042) × 100) = 30.9%.
Equation (4) can be approximated to Equation (8) by eliminating the variables that insignificantly affect the response, according to Table 4. The approximation equation is explained as follows:
V B D   =   38.75     2.1875 · ( a d )   +   1.9375 · ( ε r )     0.625 · h r   +   3 · t h     8.75 · θ   +   1.75 · t h · θ   +   9.1042 · ( θ ) 2
Table 6 illustrates the residual percentage between the measured value of VBD and the predicted value from Equations (4) and (8). The residual percentage refers to the percentage difference between the measured VBD (actual) and the predicted VBD using the BBD technique (simulation) at certain experiment conditions as in Table 6 and Table 7. As shown in Table 6, the maximum residual percentage from Equation (4) is 3.81% at the run number of 18, and the maximum residual percentage from Equation (8) is 5.19% at the run number of 36. All other residual percentages are within acceptable limits.

5. Validation of the Predictive Mathematical Model

Some other random experimental works are accomplished to evaluate the robustness of the predictive model. Table 7 explains 20 random experiment results with the measured VBD and the predicted VBD based on Equations (4) and (8). The obtained results demonstrate that the designed BBD model can predict the VBD based on Equations (4) and (8). As shown in Table 7, the maximum residual percentage is 5.12% at the run number 15. All other residual results are in the acceptable range (<5%).

6. Conclusions

New barrier variables were presented to investigate their consequence on the insulating oil VBD. These new variables are barrier location (a/d)%, dielectric constant (εr) of the barrier material, barrier hole radius (hr), barrier thickness (th), and the barrier inclined angle (θ). The experimental work results indicated that two parameters significantly affect the VBD of the insulating oil: the first one is the thickness of the barrier (th), and the second is the barrier inclined angle (θ). BBD design was used to develop a predicted model to identify the VBD with the barrier variables’ variation. The designed DDB model is constructed for the five barrier variables with 46 experiment runs with specified forms. The BBD model results generate low residual errors between the measured VBD and predicted VBD based on Equations (4) and (8). The residual percentage of the predicted VBD from Equation (4) is less than 5% for all 46 experiment runs.
The mathematical model is constructed based on the coded values (−1, 0, 1), where –1 refers to the minimum value of the variable x, 0 refers to the mean of the variable x, and 1 refers to the maximum value of x. Therefore, the constructed model can be validated using the input parameters’ coded values (−1, 0, 1).
New 30 random experiment cases were used to measure the robustness and quality of the designed model to validate the BBD model with other experiment cases. All the residual percentages of all cases for Equation (4) are less than 5%. The approximation predicted VBD equation is developed on the basis of the statistical analysis using t-test and p-value. Then, the approximated Equation (8) is developed. The results show that only one case in the 46 experiment runs generates a residual percentage of 5.19%, and the other 20 validation experiment runs also generate one case with a residual percentage of 5.12%. Consequently, Equations (4) and (8) can predict the VBD of the insulating oil for any other new cases.
In future work, the application of nanotechnology for enhancing the breakdown voltage strength of various insulating materials [44,45,46,47,48,49,50,51,52] in the presence of different barrier effects will be investigated, specifically in the transformer insulating oil.

Author Contributions

All authors have contributed to the preparation of this manuscript. S.S.M.G., A.B.A.S. and A.A.E. designed the idea strategy, studied the data, conduct the experiments, and wrote the manuscript. M.M.F.D. and K.M. revised and proofread the manuscript. Finally, S.S.D., A.B. and M.L. reviewed, edited, funded, and supported different improvements for the manuscript. All authors have read and agreed to the published version of the manuscript.

Funding

This research was funded by Taif University Researchers Supporting Project Number (TURSP-2020/34), Taif University, Taif, Saudi Arabia, and the Department of Electrical Engineering and Automation, School of Electrical Engineering, Aalto University, Espoo, Finland.

Institutional Review Board Statement

Not applicable.

Informed Consent Statement

Not applicable.

Data Availability Statement

The data presented in this study are available on request from the corresponding author.

Acknowledgments

The authors would like to acknowledge the financial support received from Taif University Researchers Supporting Project Number (TURSP-2020/34), Taif University, Taif, Saudi Arabia. The authors also thank the Extra High-Voltage Research Center of the Egyptian Electricity Holding Company, Egypt, for support on the experimental works as well as the Department of Electrical Engineering and Automation, School of Electrical Engineering, Aalto University, Espoo, Finland. Finally, the authors dedicate this research to the memory of the coauthor Sobhy S. Dessouky who passed suddenly away on 18 March 2021, during the revision process of this paper.

Conflicts of Interest

The authors declare no conflict of interest.

References

  1. Ghoneim, S.S.M.; Taha, I.B.M.; Elkalashy, N.I. Integrated ANN-Based Proactive Fault Diagnostic Scheme for Power Transformers Using Dissolved Gas Analysis. IEEE Trans. Dielectr. Electr. Insul. 2016, 23, 1838–1845. [Google Scholar] [CrossRef]
  2. Ghoneim, S.S.M.; Mahmoud, K.; Lehtonen, M.; Darwish, M.M.F. Enhancing Diagnostic Accuracy of Transformer Faults Using Teaching-Learning Based Optimization. IEEE Access 2021, 9, 30817–30832. [Google Scholar] [CrossRef]
  3. Guerbas, F.; Zitouni, M.; Boubakeur, A.; Beroual, A. Barrier effect on breakdown of point–plane oil gaps under alternating current voltage. IET Gener. Transm. Distrib. 2010, 4, 1245–1250. [Google Scholar] [CrossRef]
  4. Alshehawy, A.M.; Mansour, D.M.; Ghali, M.; Lehtonen, M.; Darwish, M.M.F. Photoluminescence Spectroscopy Measurements for Effective Condition Assessment of Transformer Insulating Oil. Processes 2021, 9. under review. [Google Scholar]
  5. Ward, S.A.; El-Faraskoury, A.; Badawi, M.; Ibrahim, S.A.; Mahmoud, K.; Lehtonen, M.; Darwish, M.M.F. Towards Precise Interpretation of Oil Transformers via Novel Combined Techniques Based on DGA and Partial Discharge Sensors. Sensors 2021, 21, 2223. [Google Scholar] [CrossRef]
  6. Ghoneim, S.S.M. Determination of Transformers’ Insulating Paper State Based on Classification Techniques. Processes 2021, 9, 427. [Google Scholar] [CrossRef]
  7. Abouelatta, M.A.; Ward, S.A.; Sayed, A.M.; Mahmoud, K.; Lehtonen, M.; Darwish, M.M.F. Fast Corona Discharge Assessment Using FDM integrated with Full Multigrid Method in HVDC Transmission Lines Considering Wind Impact. IEEE Access 2020, 8, 225872–225883. [Google Scholar] [CrossRef]
  8. Mansour, D.-E.A.; Abdel-Gawad, N.M.K.; El Dein, A.Z.; Ahmed, H.M.; Darwish, M.M.F.; Lehtonen, M. Recent Advances in Polymer Nanocomposites Based on Polyethylene and Polyvinylchloride for Power Cables. Materials 2021, 14, 66. [Google Scholar] [CrossRef]
  9. Dessouky, S.; Ghoneim, S.; Elfaraskoury, A.; Abosharaf, A.B. Barrier Effect on the Dielectric Strength of the Transformer Insulating Oils. In Proceedings of the 20th International Symposium on High Voltage Engineering, Buenos Aires, Argentina, 27 August–1 September 2017. [Google Scholar]
  10. Mohd, A.; Khan, W. Breakdown Characteristics of Ambient Medium in Presence of Barrier under Varying Field Conditions. Int. J. Adv. Res. Electr. Electron. Instrum. Eng. 2016, 5, 6. [Google Scholar]
  11. Beroual, A.; Boubakeur, A. Influence of barriers on the lightning and impulse strength of mean air gaps in point/plane arrangements. IEEE Trans. Electr. Insul. 1991, 26, 1130–1139. [Google Scholar] [CrossRef]
  12. Guerbas, F. Influence des Barrières sur la Rigidité Diélectrique de L’huile Minérale’. Ph.D. Thesis, Department of Electrical Engineering, Ecole National Polytechnique, Algiers, Algeria, June 2011. [Google Scholar]
  13. Zitouni, M.; Guerbas, F.; Boukezzi, L.; Boubakeur, A. Modelling by design of experiments method of the AC breakdown voltage of transformer oil point–plane gaps with insulating barrier. IET Gener. Transm. Distrib. 2016, 10, 232–239. [Google Scholar] [CrossRef]
  14. Schueller, M.; Blaszczyk, A.; Krivda, A.; Smajic, J. Influence of the surface conductivity of a single glass barrier on the breakdown voltage in an air insulated rod plane arrangement. In Proceedings of the 2016 IEEE Conference on Electrical Insulation and Dielectric Phenomena (CEIDP), Toronto, ON, Canada, 16–19 October 2016. [Google Scholar]
  15. Studniarz, S.A. The Effect of Barriers in the Low Field Regions of Non-Uniform Fields on Oil Breakdown. IEEE Trans. Power Appar. Syst. 1981, 4, 1568–1573. [Google Scholar] [CrossRef]
  16. Mahmud, S.; Golosnoy, I.O.; Chen, G.; Wilson, G.; Jarman, P. Effect of Kraft Paper Barriers on Bridging in Contaminated Transformer Oil. In Proceedings of the 2014 IEEE Conference on Electrical Insulation and Dielectric Phenomena (CEIDP), Des Moines, IA, USA, 19–22 October 2014; pp. 110–113. [Google Scholar]
  17. Ali, M.N.; Mahmoud, K.; Lehtonen, M.; Darwish, M.M.F. An Efficient Fuzzy-Logic Based Variable-Step Incremental Conductance MPPT Method for Grid-Connected PV Systems. IEEE Access 2021, 9, 26420–26430. [Google Scholar] [CrossRef]
  18. Ali, M.N.; Mahmoud, K.; Lehtonen, M.; Darwish, M.M.F. Promising MPPT Methods Combining Metaheuristic, Fuzzy-Logic and ANN Techniques for Grid-Connected Photovoltaic. Sensors 2021, 21, 1244. [Google Scholar] [CrossRef]
  19. Ali, E.S.; El-Sehiemy, R.A.; Abou El-Ela, A.A.; Mahmoud, K.; Lehtonen, M.; Darwish, M.M.F. An Effective Bi-Stage Method for Renewable Energy Sources Integration into Unbalanced Distribution Systems Considering Uncertainty. Processes 2021, 9, 471. [Google Scholar] [CrossRef]
  20. Bayoumi, A.S.; El-Sehiemy, R.A.; Mahmoud, K.; Lehtonen, M.; Darwish, M.M.F. Assessment of an Improved Three-Diode against Modified Two-Diode Patterns of MCS Solar Cells Associated with Soft Parameter Estimation Paradigms. Appl. Sci. 2021, 11, 1055. [Google Scholar] [CrossRef]
  21. Abbas, A.S.; El-Sehiemy, R.A.; Abou El-Ela, A.; Ali, E.S.; Mahmoud, K.; Lehtonen, M.; Darwish, M.M.F. Optimal Harmonic Mitigation in Distribution Systems with Inverter Based Distributed Generation. Appl. Sci. 2021, 11, 774. [Google Scholar] [CrossRef]
  22. Elsisi, M.; Mahmoud, K.; Lehtonen, M.; Darwish, M.M.F. An Improved Neural Network Algorithm to Efficiently Track Various Trajectories of Robot Manipulator Arms. IEEE Access 2021, 9, 11911–11920. [Google Scholar] [CrossRef]
  23. Elsisi, M.; Tran, M.-Q.; Mahmoud, K.; Lehtonen, M.; Darwish, M.M.F. Deep Learning-Based Industry 4.0 and Internet of Things towards Effective Energy Management for Smart Buildings. Sensors 2021, 21, 1038. [Google Scholar] [CrossRef] [PubMed]
  24. Elsisi, M.; Mahmoud, K.; Lehtonen, M.; Darwish, M.M.F. Reliable Industry 4.0 Based on Machine Learning and IoT for Analyzing, Monitoring, and Securing Smart Meters. Sensors 2021, 21, 487. [Google Scholar]
  25. Abaza, A.; El-Sehiemy, R.A.; Mahmoud, K.; Lehtonen, M.; Darwish, M.M.F. Optimal Estimation of Proton Exchange Membrane Fuel Cells Parameter Based on Coyote Optimization Algorithm. Appl. Sci. 2021, 11, 252. [Google Scholar] [CrossRef]
  26. Said, M.; Shaheen, A.M.; Ginidi, A.R.; El-Sehiemy, R.A.; Mahmoud, K.; Lehtonen, M.; Darwish, M.M.F. Estimating Parameters of Photovoltaic Models Using Accurate Turbulent Flow of Water Optimizer. Processes 2021, 9, 627. [Google Scholar] [CrossRef]
  27. Bendary, A.F.; Abdelaziz, A.Y.; Ismail, M.M.; Mahmoud, K.; Lehtonen, M.; Darwish, M.M.F. Proposed ANFIS Based Approach for Fault Tracking, Detection, Clearing and Rearrangement for Photovoltaic System. Sensors 2021, 21, 2269. [Google Scholar] [CrossRef]
  28. Elsisi, M.; Tran, M.Q.; Mahmoud, K.; Lehtonen, M.; Darwish, M.M. Robust Design of ANFIS-Based Blade Pitch Controller for Wind Energy Conversion Systems Against Wind Speed Fluctuations. IEEE Access 2021, 9, 37894–37904. [Google Scholar] [CrossRef]
  29. Ghoneim, S.S.; Dessouky, S.S.; Elfaraskoury, A.A.; Sharaf, A.B.A. Prediction of insulating transformer oils breakdown voltage considering barrier effect based on artificial neural networks. Electr. Eng. 2018, 100, 2231–2242. [Google Scholar] [CrossRef]
  30. Krishna, D.; Krishna, K.S.; Sree, R.P. Response Surface Modeling and Optimization of Chromium (Vi) Removal from Aqueous Solution Using Borasus Flabellifer Coir Powder. Int. J. Appl. Sci. Eng. 2013, 11, 213–226. [Google Scholar]
  31. Ghoneim, S.S.; Dessouky, S.S.; Elfaraskoury, A.A.; Abou Sharaf, A.B. Modelling and Experimental Verification of Barrier Effect on Breakdown Voltage of Transformer Oil Using Box-Behnken Design. Measurement 2019, 147, 2–9. [Google Scholar] [CrossRef]
  32. IEC 60156. Insulating Liquids-Determination of the Breakdown Voltage at Power Frequency-Test Method. Available online: https://webstore.iec.ch/publication/63770 (accessed on 1 March 2021).
  33. IEC 60296. Fluids for Electrotechnical Applications—Mineral Insulating Oils for Electrical Equipment. Available online: https://webstore.iec.ch/publication/61025 (accessed on 1 March 2021).
  34. Cavazzuti, M. Optimization Methods: From Theory to Design; Springer: Berlin/Heidelberg, Germany, 2013; p. 25. [Google Scholar]
  35. Demirçivi, P.; Saygılı, G.N. Response surface modeling of boron adsorption from aqueous solution by vermiculite using different adsorption agents: Box-Behnken experimental design. Water Sci. Technol. 2017, 76, 515–530. [Google Scholar] [CrossRef]
  36. Fukuda, I.M.; Pinto, C.F.F.; Moreira, C.D.S.; Saviano, A.M.; Lourenço, F.R. Design of Experiments (DoE) applied to Pharmaceutical and Analytical Quality by Design (QbD). Braz. J. Pharm. Sci. 2018, 54, 1–16. [Google Scholar] [CrossRef]
  37. Tayeb, A.M.; Tony, M.A.; Mansour, S.A. Application of Box–Behnken factorial design for parameters optimization of basic dye removal using nano-hematite photo-Fentontool. Appl. Water Sci. 2018, 8, 1–9. [Google Scholar] [CrossRef] [Green Version]
  38. Hsu, Y.-T.; Su, C.-S. Application of Box–Behnken Design to Investigate the Effect of Process Parameters on the Microparticle Production of Ethenzamide through the Rapid Expansion of the Supercritical Solutions Process. Pharmaceutics 2020, 12, 42. [Google Scholar] [CrossRef] [Green Version]
  39. Zaky, R.R.; Hessien, M.M.; El-Midany, A.A.; Khedr, M.H.; Abdel-Aal, E.A.; El-Barawy, K.A. Preparation of silica nanoparticles from semi-burned rice straw ash. Powder Technol. 2008, 185, 31–35. [Google Scholar] [CrossRef]
  40. Shu, G.; Dai, C.; Chen, H.; Wang, X. (Application of Box-Behnken design in optimization for crude polysaccharides from fruits of Tribulus terristris L. J. Chem. Pharm. Res. 2013, 5, 342–350. [Google Scholar]
  41. Montgomerry, D.C. Design and Analysis of Experiments, 5th ed.; John Wiley Sons: New York, NY, USA, 2001. [Google Scholar]
  42. Ferreira, S.C.; Bruns, R.E.; Ferreira, H.S.; Matos, G.D.; David, J.M.; Brandão, G.C.; Silva, E.G.P.; Portugal, L.A.; Dos Reis, P.S.; Souza, A.S.; et al. Box-Behnken design: An alternative for the optimization of analytical methods. Anal. Chim. Acta 2007, 597, 179–186. [Google Scholar] [CrossRef]
  43. George, P.M. Machinability Analysis of Carbon Carbon Composites Using EDM. Ph.D. Thesis, Production Engineering, Sardar Patel University, Gujarat, India, December 2004. [Google Scholar]
  44. Abdel-Gawad, N.M.; El Dein, A.Z.; Mansour, D.A.; Ahmed, H.M.; Darwish, M.M.; Lehtonen, M. Development of industrial scale PVC nanocomposites with comprehensive enhancement in dielectric properties. IET Sci. Meas. Technol. 2019, 13, 90–96. [Google Scholar] [CrossRef]
  45. Abdel-Gawad, N.M.; El Dein, A.Z.; Mansour, D.A.; Ahmed, H.M.; Darwish, M.M.F. Effect of functionalized TiO2 nanoparticles on dielectric properties of PVC nanocomposites used in electrical insulating cables. In Proceedings of the IEEE Eighteenth International Middle East Power Systems Conference (MEPCON), Cairo, Egypt, 27–29 December 2016; pp. 693–698. [Google Scholar] [CrossRef]
  46. Abdel-Gawad, N.M.; El Dein, A.Z.; Mansour, D.A.; Ahmed, H.M.; Darwish, M.M.F.; Lehtonen, M. PVC nanocomposites for cable insulation with enhanced dielectric properties, partial discharge resistance and mechanical performance. High Volt. 2020, 5, 463–471. [Google Scholar] [CrossRef]
  47. Abdel-Gawad, N.M.K.; Shaalan, E.M.; Darwish, M.M.F.; Basuny, M.A.M. Influence of Fault Locations on the Pipeline Induced Voltages Near to Power Transmission Lines. In Proceedings of the IEEE 21st International Middle East Power Systems Conference (MEPCON), Cairo, Egypt, 17–19 December 2019; pp. 761–767. [Google Scholar] [CrossRef]
  48. Karaman, H.S.; Ahmed, H.M.; Darwish, M.M.F.; Mansour, D.A. The Effect of Geraphene on the Thermal and Dielectric Properties of Epoxy Resin. In Proceedings of the IEEE International Symposium on Electrical Insulating Materials (ISEIM), Tokyo, Japan, 13–17 September 2020; pp. 103–106. [Google Scholar]
  49. Abdel-Gawad, N.M.K.; El-Kady, E.Y.; El Dein, A.Z.; Mansour, D.A.; Ahmed, H.M.; Darwish, M.M.F. Dielectric Response of PVC and LDPE Nanocomposites Upon Functionalization of Their Containing Nanoparticles. In Proceedings of the IEEE Twentieth International Middle East Power Systems Conference (MEPCON), Cairo, Egypt, 18–20 December 2018; pp. 1081–1086. [Google Scholar] [CrossRef]
  50. Darwish, M.M.F.; Ahmed, H.M.; Mansour, D.A. Thermo-Mechanical Properties of LDPE/SiO2 Nanocomposites based on Chemically Functionalized SiO2 Nanoparticles. In Proceedings of the IEEE International Symposium on Electrical Insulating Materials (ISEIM), Tokyo, Japan, 13–17 September 2020; pp. 241–244. [Google Scholar]
  51. Abdel-Gawad, N.M.; El Dein, A.Z.; Mansour, D.A.; Ahmed, H.M.; Darwish, M.M.F.; Lehtonen, M. Impact of Nanoparticles Functionalization on Partial Discharge Activity within PVC/SiO2 Nanocomposites. In Proceedings of the IEEE 2nd International Conference on Dielectrics (ICD), Budapest, Hungary, 1–5 July 2018; pp. 1–4. [Google Scholar] [CrossRef]
  52. Abdel-Gawad, N.M.; El Dein, A.Z.; Mansour, D.A.; Ahmed, H.M.; Darwish, M.M.F.; Lehtonen, M. Experimental measurements of partial discharge activity within LDPE/TiO2 nanocomposites. In Proceedings of the IEEE Nineteenth International Middle East Power Systems Conference (MEPCON), Cairo, Egypt, 19–21 December 2017; pp. 811–816. [Google Scholar] [CrossRef]
Figure 1. Schematic of the oil tank with point/plane gap configuration.
Processes 09 00657 g001
Figure 2. Arrangement of point/plane gap with an inclined barrier.
Processes 09 00657 g002
Figure 3. Effect of the barrier location on the breakdown voltage at different barrier materials.
Processes 09 00657 g003
Figure 4. Effect of the barrier thickness on the breakdown voltage.
Processes 09 00657 g004
Figure 5. Effect of barrier hole radius on the breakdown voltage.
Processes 09 00657 g005
Figure 6. Effect of barrier inclined angle (θ) on the breakdown voltage.
Processes 09 00657 g006
Figure 7. Value of αi of the BBD model for Equation (4).
Processes 09 00657 g007
Figure 8. Impact of the adopted variables on VBD.
Processes 09 00657 g008
Table 1. Characteristics of insulating oil shell Diala D.
ItemUnitIEC 60296 RequirementsDiala D
Density at 20 °CK g/m3<895877
Kinematic viscosity at 20 °Cmm2/s16.6
Breakdown voltage (after treatment)kVMin 70 kV>30 (>70 upon treatment)
Dielectric dissipation factor at 90 °C---0.005 max (after treatment)0.0005
Water contentppm<40 drams/IBC, <30 bulk
Oxidation Stability (164 h/120 °C) Total aciditymg KOH/gMax. 0.30.26
Table 2. Coded and actual values of the input parameters of the barrier.
Input VariablesCoded Value
Minimum (−1)Mean (0)Maximum (1)
(a/d)%255075
εr (f/m)2.533.5
hr (mm)0.751.251.75
th (mm)234
θ45°90°
Table 3. Coded and actual numbers for five Box–Behnken design (BBD) input parameters.
Coded VariablesActual Variables
(a/d)%εrhrthθ(a/d)%εrhr (mm)th (mm)θ(°)VBD (kV)
1−1−1000252.51.2534538
2−11000253.51.2534542
31−1000752.51.2534533
411000753.51.2534538
500−1−105030.7524536
600−1105030.7544543
7001−105031.7524534
8001105031.7544541
90−100−1502.51.253054
100−1001502.51.2539038
110100−1503.51.253058
1201001503.51.2539041
13−10−1002530.7534541
14−101002531.7534539
1510−1007530.7534536
16101007531.7534536
17000−1−15031.252057
18000−115031.2529036
190001−15031.254057
20000115031.2549043
210−1−100502.50.7534537
220−1100502.51.7534536
2301−100503.50.7534541
2401100503.51.7534539
25−100−102531.2524537
26−100102531.2544544
27100−107531.2524534
28100107531.2544540
2900−10−15030.753056
3000−1015030.7539039
310010−15031.753056
32001015031.7539038
33−1000−12531.253059
34−100012531.2539041
351000−17531.253054
36100017531.2539035
370−10−10502.51.2524533
380−1010502.51.2544540
39010−10503.51.2524537
4001010503.51.2544544
41000005031.2534539
42000005031.2534538.5
43000005031.2534538
44000005031.2534538.5
45000005031.2534539
46000005031.2534539.5
Table 4. Statistical parameters and model coefficients using coded values (see Table 1).
CoefficientSETstatp-Value
(Intercept)38.750.33953114.136.54 × 10−17
(a/d)%−2.18750.20792−10.5219.96 × 10−7
εr1.93750.207929.31873.02 × 10−6
hr−0.6250.20792−3.0060.013207
th30.2079214.4295.07 × 10−8
θ−8.750.20792−42.0841.38 × 10−12
(a/d)%: εr0.250.415830.60120.56108
(a/d)%: hr0.50.415831.20240.2569
(a/d)%: th−0.250.41583−0.60120.56108
(a/d)%: θ−0.250.41583−0.60120.56108
εr: hr−0.250.41583−0.60120.56108
εr: th1.78 × 10−150.415834.27 × 10−151
εr: θ−0.250.41583−0.60120.56108
hr: th5.32 × 10−150.415831.28 × 10−141
hr: θ−0.250.41583−0.60120.56108
th: θ1.750.415834.20840.001804
(a/d)%2−0.479170.28152−1.70210.11957
εr2−0.31250.28152−1.110.29296
hr2−0.395830.28152−1.40610.19001
th20.270830.281520.962040.35872
θ29.10420.2815232.3391.88 × 10−11
Table 5. Quality coefficients for model expressive.
Observation number46
Freedom degree25
Root mean squared error0.832
R-squared0.993
Attuned R-squared0.987
F-statistic vs. constant model175
p-value4.88 × 10−22
Table 6. Residual % between the measured VBD and predicted VBD based on Equations (4) and (8).
Measured VBDEquation (4)Equation (8)
Predicted VBDResidualResidual %Predicted VBDResidualResidual %
13838.45830.45831.2060533912.564103
24241.83330.16670.39690542.8750.8752.040816
33333.58330.58331.76757634.6251.6254.693141
43837.95830.04170.10973738.50.51.298701
53636.250.250.69444436.3750.3751.030928
64342.250.751.74418642.3750.6251.474926
7343512.94117635.1251.1253.202847
841410041.1250.1250.303951
95454.35420.35420.65592654.66670.66671.219572
103836.85421.14583.01526337.16670.83332.242061
115858.22920.22920.39517258.54170.54170.925323
124140.72920.27080.66048841.04170.04170.101604
134141.18750.18750.45731741.56250.56251.353383
143938.93750.06250.16025640.31251.31253.255814
153635.81250.18750.52083337.18751.18753.193277
163635.56250.43751.21527835.93750.06250.173913
175755.6251.3752.41228155.35421.64582.973216
183634.6251.3753.81944434.35421.64584.790681
195758.1251.1251.97368457.85420.85421.47647
204344.1251.1252.61627943.85420.85421.947818
213736.47920.52081.40756837.43750.43751.168614
223635.72920.27080.75222236.18750.18750.518135
234140.85420.14580.3556141.31250.31250.75643
243939.10420.10420.26717940.06251.06252.652106
253737.47910.47911.29486537.93750.93752.47117
264443.97910.02090.047543.93750.06250.142248
273433.60410.39591.16441233.56250.43751.303538
284039.10410.89592.2397539.56250.43751.105845
295656.58340.58341.04178657.22921.22922.147855
303939.58340.58341.49589739.72920.72921.835426
315655.83340.16660.297555.97920.02080.037157
323837.83340.16660.43842138.47920.47921.245348
335958.06250.93751.58898358.79170.20830.354302
344141.06250.06250.15243941.29170.29170.706437
355454.18750.18750.34722254.41670.41670.765758
363536.18751.18753.39285736.91671.91675.191959
373333.77080.77082.33575833.81250.81252.402957
384039.77080.22920.57339.81250.18750.470958
393737.64580.64581.74540537.68750.68751.824212
404443.64580.35420.80543.68750.31250.715308
413938.750.250.64102638.750.250.645161
4238.538.750.250.64935138.750.250.645161
433838.750.751.97368438.750.751.935484
4438.538.750.250.64935138.750.250.645161
453938.750.250.64102638.750.250.645161
4639.538.750.751.89873438.750.751.935484
Table 7. Residuals % of Equations (4) and (8) according to the measured VBD for additional random experiments.
(a/d)%εrhrthθMeasured VBDPredicted VBD from Equation (4)Predicted VBD from Equation (8)
VBDResidualResidual %VBDResidualResidual %
1011104442.3751.6253.69318243.06250.93752.177068
201−1104644.1251.8754.07608744.31251.68753.808181
3011−103736.3750.6251.68918937.06250.06250.168634
40−1110383912.63157939.18751.18753.030303
5101013535.41670.41671.19057136.29171.29173.559216
610−10−15353.66670.66671.25792555.04172.04173.709369
710−1013636.16670.16670.46305637.54171.54174.106633
8−111104543.58331.41673.14822245.250.250.552486
9−11−1104746.33330.66671.41851146.50.51.075269
10−11−1−104039.83330.16670.4167540.50.51.234568
11−1001−15959.83330.83331.41237360.04171.04171.734961
12−100−1−15956.83332.16673.67237357.54171.45832.534336
13001114342.85420.14580.3390743.22920.22920.530197
140011−15757.35420.35420.62140457.22920.22920.400495
15001−113233.35421.35424.23187533.72921.72925.126715
16001−1−15754.85422.14583.76456154.72922.27084.149156
171−1−1−1−15250.18751.81253.48557751.85420.14580.281173
180101−15859.751.753.01724159.79171.79172.99657
1911−1−1−15455.06251.06251.96759355.72921.72923.102862
2011−1114443.06250.93752.13068244.22920.22920.51821
Publisher’s Note: MDPI stays neutral with regard to jurisdictional claims in published maps and institutional affiliations.

