Article

Application of Multi-Sensor Satellite Data for Exploration of Zn–Pb Sulfide Mineralization in the Franklinian Basin, North Greenland

1
Korea Polar Research Institute (KOPRI) Songdomirae-ro, Yeonsu-gu, Incheon 21990, Korea
2
Department of Geology, Faculty of Science, Benha University, Benha 13518, Egypt
3
Institute of Geosciences, University of Kiel, Ludewig-Meyn Str. 10, 24118 Kiel, Germany
4
Centre for Advanced Modelling and Geospatial Information Systems (CAMGIS), Faculty of Engineering and Information Technology, University of Technology Sydney, Ultimo, New South Wales 2007, Australia
5
Department of Energy and Mineral Resources Engineering, Choongmu-gwan, Sejong University, 209 Neungdong-ro Gwangjin-gu, Seoul 05006, Korea
6
Remote Sensing and Environmental Sciences Department, East Water and Environmental Research Institute, Mashhad, Razavi Khorasan Province, Iran
7
Geoscience and Digital Earth Centre (INSTeG), Research Institute for Sustainable Environment, Universiti Teknologi Malaysia, Johor Bahru 81310, Malaysia
*
Author to whom correspondence should be addressed.
Remote Sens. 2018, 10(8), 1186; https://doi.org/10.3390/rs10081186
Submission received: 26 June 2018 / Revised: 24 July 2018 / Accepted: 25 July 2018 / Published: 27 July 2018
(This article belongs to the Section Remote Sensing in Geology, Geomorphology and Hydrology)

Abstract

:
Geological mapping and mineral exploration programs in the High Arctic have been naturally hindered by its remoteness and hostile climate conditions. The Franklinian Basin in North Greenland has a unique potential for exploration of world-class zinc deposits. In this research, multi-sensor remote sensing satellite data (e.g., Landsat-8, Phased Array L-band Synthetic Aperture Radar (PALSAR) and Advanced Spaceborne Thermal Emission and Reflection Radiometer (ASTER)) were used for exploring zinc in the trough sequences and shelf-platform carbonate of the Franklinian Basin. A series of robust image processing algorithms was implemented for detecting spatial distribution of pixels/sub-pixels related to key alteration mineral assemblages and structural features that may represent potential undiscovered Zn–Pb deposits. Fusion of Directed Principal Component Analysis (DPCA) and Independent Component Analysis (ICA) was applied to some selected Landsat-8 mineral indices for mapping gossan, clay-rich zones and dolomitization. Major lineaments, intersections, curvilinear structures and sedimentary formations were traced by the application of Feature-oriented Principal Components Selection (FPCS) to cross-polarized backscatter PALSAR ratio images. Mixture Tuned Matched Filtering (MTMF) algorithm was applied to ASTER VNIR/SWIR bands for sub-pixel detection and classification of hematite, goethite, jarosite, alunite, gypsum, chalcedony, kaolinite, muscovite, chlorite, epidote, calcite and dolomite in the prospective targets. Using the remote sensing data and approaches, several high potential zones characterized by distinct alteration mineral assemblages and structural fabrics were identified that could represent undiscovered Zn–Pb sulfide deposits in the study area. This research establishes a straightforward/cost-effective multi-sensor satellite-based remote sensing approach for reconnaissance stages of mineral exploration in hardly accessible parts of the High Arctic environments.

Graphical Abstract

1. Introduction

Greenland is known for its untapped mineral resources and significant exploration achievements (Figure 1) [1,2,3]. Because of its large area, only a few places have been studied, leaving most of its parts largely underexplored [3]. Greenland has a unique potential for discoveries of world-class zinc deposits [4]. The sedimentary basin environments constitute approximately 40% of Greenland’s 410,000 km2 ice-free land area, and many of these basins are known to host zinc sulfide mineralization [4]. The Palaeozoic Franklinian Basin in North Greenland (Figure 1) hosts a number of occurrences of zinc mineralization [4]. The Global Mineral Resource Assessment Project (GMRAP) workshop held in 2011 by the Geological Survey of Denmark and Greenland (GEUS) highlighted the need to study undiscovered sediment-hosted zinc sulfide deposits and challenging exploration programs in Greenland [4].
The Franklinian Basin extends for more than 2500 km E–W over the Canadian Arctic Islands and northern Greenland (Figure 2). Occurrences of clastic-dominated (CD) and Mississippi Valley-type (MVT) zinc-lead mineralization were reported in the trough sequences and shelf-platform carbonate of the Palaeozoic Franklinian Basin [5]. The Citronen Fjord Zn–Pb deposit (78 Mt @ 5.2 wt % Zn and 0.5 wt % Pb) is well known and has received detailed exploration campaigns [6,7]; however, many known anomalies and indications of Zn–Pb mineralization within the Franklinian Basin are still underexplored and deserve further exploration [8,9].
The remote nature and the challenges posed by the Arctic environment reduce the capacity of traditional techniques to economically explore and locate mineral resources. Satellite remote sensing data are capable of providing key information for mineral exploration community by investigating large areas, delineate the lithological units and structural features and focus on key hydrothermal alteration mineral assemblages that are associated with different types of ore deposits. Remote sensing applications for geological mapping have been proven efficient in the Arctic environment, particularly in the Low Arctic environment with possible accessibility for fieldwork [10,11,12,13].
The High Arctic environment has relatively little tundra vegetation and lichen cover compared to the Low Arctic environment due to the limited precipitation and dry Arctic climate conditions. Oxidation and acid weathering of sulfides, especially pyrite (FeS2), can, therefore, produce massive gossan zones with large volumes of hydrated iron sulfates preserved in the dry regions [14,15]. Almost all of these alteration minerals contain Fe3+, Fe2+, or a combination thereof, or Al. Some also incorporate K, Na, or Mg [16]. Hydroxide and sulfate minerals produced by acid weathering are hydrated and highly soluble in water; most of them persist in large volumes due to the High Arctic climate conditions that limit their dissolution by rainfall or percolating meteoric waters [16]. In the remote sensing based study, the reflectance spectrum of these minerals in the visible to near infrared (VNIR) and short-wave infrared (SWIR) wavelength regions (0.45 to 2.5 μm) can provide mineralogical information for exploration purposes based on analysis of electronic absorption features in transitional metals (Fe2+, Fe3+ and REE), absorption bands due to SO bending overtones and of molecular absorption features in carbonate (CO3), hydrate (H2O) and hydroxide (OH) minerals [17,18,19,20].
Gossan alteration was considered the most important indicator for sulfide mineralization during regional reconnaissance of the Citronen Fjord Zn–Pb deposit [7]. Sulfide mineralization was also reported in limestone conglomerates south of the Citronen Fjord in association with splays of the NW–SE-trending Trolle Land Fault Zone (TLFZ) [7]. Several occurrences of hydrate sulfate were reported along the Navarana Fjord in the northeastern part of Freuchen Land, at the bottom of J. P. Koch Fjord, the south side of Frederick E. Hyde Fjord and both sides of Jorgen Bronlund Fjord in Peary Land [14,15]. Consequently, major key geological criteria for zinc exploration in the Franklinian Basin using satellite remote sensing data include specific alteration mineral zones and geological structural (lineaments) trends, which can be acquired by remote sensing exploration. However, comprehensive remote sensing investigation has not been executed for zinc exploration in the Franklinian Basin, which is necessary for future systematic exploration projects. In this research, Landsat-8, PALSAR and ASTER satellite remote sensing data were processed using a series of robust image processing algorithms for zinc exploration in the Franklinian Basin. The main objectives of image processing techniques are: (i) to detect pixels/sub-pixels contain spectral features related to key alteration minerals and assemblages (gossan, hydrated sulfate, clay and carbonates) that may represent potential undiscovered Zn–Pb mineralization zones using Landsat-8 and ASTER spectral bands; (ii) to inspect the major lineaments, intersections, curvilinear structures and sedimentary formations using PALSAR data; and (iii) to establish a straightforward/cost-effective multi-sensor satellite-based remote sensing approach for mineral exploration objectives in hardly accessible parts of the High Arctic environments.

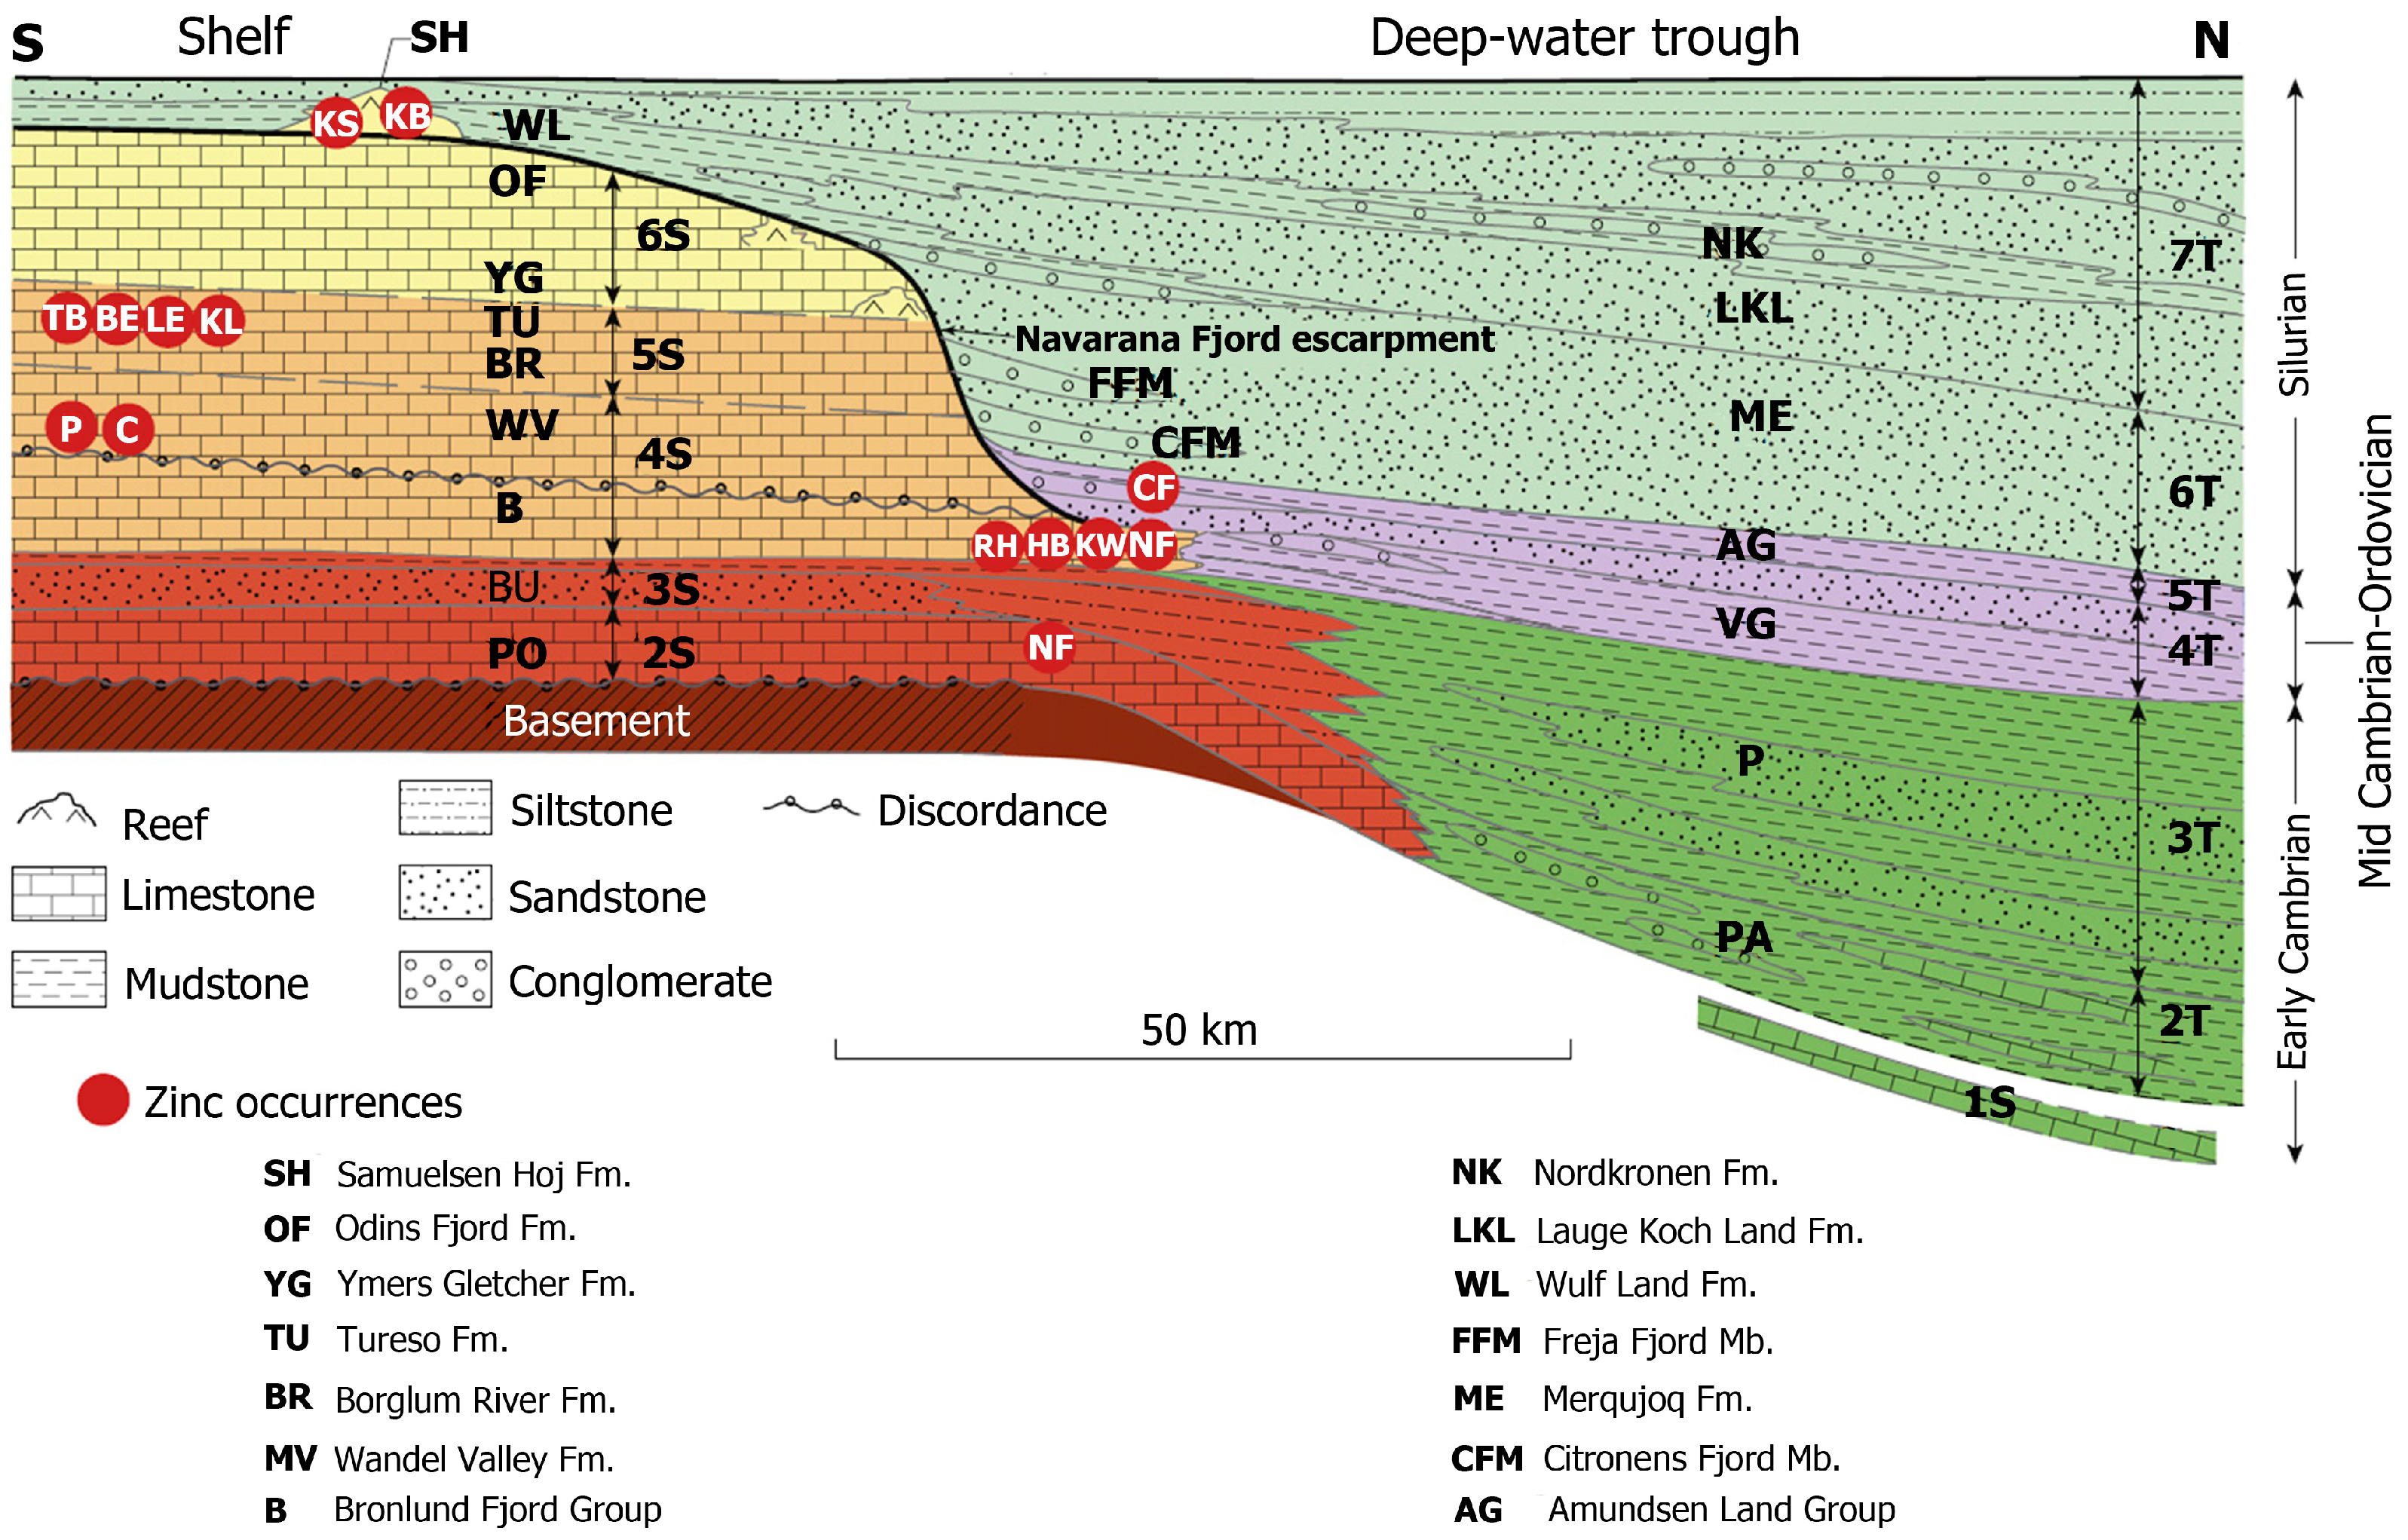
2. Geological Setting of the Franklinian Basin

Greenland was part of Laurentia from the Precambrian to the Cambrian in the southern hemisphere [21,22,23,24]. It was surrounded by two oceans, the Iapetus Ocean in the east of present-day Greenland, and some unnamed oceanic zone between the Panthalassic Ocean and the Iapetus Ocean in the north [25]. The Franklinian Basin in North Greenland and Canada (Figure 2) developed at the margin of Laurentia and was probably initiated by rifting in the late Proterozoic [25,26]. Deposition in the Franklinian Basin probably occurred along a passive continental margin, evolved in two discrete environments until the Early Silurian; namely: a broad marine shelf flanking the Precambrian craton in the southern part, and a deep-water basin or trough in the northern part [26,27]. The shelf-trough boundary was controlled by deep-seated faults (Navarana Fjord escarpment) (Figure 3). The shelf-basin system broke down in the Early Silurian when the shelf foundered and the basinal strata expanded southwardly, which was caused by the onset of the Ellesmerian orogeny in the north [27,28,29]. The evolution of the Franklinian Basin has been described by seven development stages with significant changes linked to the southward expansion of the basin margin [1,2,4] (Figure 3), which are summarized in Table 1.
The post-sedimentary evolution of the Franklinian Basin is related to two orogenic events, namely: the Caledonian and Ellesmerian orogenies. The Caledonian orogeny (c. 430–410 Ma) was mainly an east–west compressional regime that deformed the eastern part of the Franklinian Basin sequence and is now manifested by the northern part of the East Greenland Caledonides [26]. The Ellesmerian orogeny (Middle Devonian to Lower Carboniferous) included an N–S compressional deformation which led to the formation of a fold-and-thrust belt in North Greenland. The Ellesmerian fold belt is characterized by E–W to NE–SW-trending chains of folds, parallel to the main metamorphic facies boundaries, and is mostly confined to the trough succession of the Franklinian Basin [26,28].
Several Zn–Pb sulfide occurrences were reported in the trough sequence and the shelf-platform carbonate of the Franklinian Basin [3,5] (Figure 3). The trough sequence hosts clastic-dominated (CD) Zn–Pb deposits (referred to as sedimentary exhalative (SEDEX) deposits), while the carbonate-platform hosts Mississippi Valley-type (MVT) deposits, highly prospective for Zn–Pb sulfide ores [5].

3. Materials and Methods

3.1. Remote Sensing Data and Characteristics

Landsat-8, PALSAR and ASTER datasets were used to map lithological-mineralogical-structural features hosting CD and MVT Zn–Pb mineralization in the trough sequences and shelf-platform carbonate of the Franklinian Basin. Numerous ore deposits have been successfully prospected and discovered using Landsat-8, PALSAR and ASTER remote sensing satellite imagery in arid and semi-arid, temperate, tropical and Antarctic environments [30,31,32,33,34,35,36]. The technical characteristics of the Landsat-8, PALSAR and ASTER data are listed in Table 2.
For regional scale lithological-mineralogical mapping, two Landsat-8 level 1T (terrain corrected) images covering the trough sequences and carbonate shelf-platform of the eastern part of the Franklinian Basin were obtained through the U.S. Geological Survey Earth Resources Observation and Science Center (EROS). The images (LC80402442016199LGN00; Path/Row 040/244) and (LC80402452016199LGN00; Path/Row 040/245) covering Peary Land, Amundsen Land, Johannes V. Jensen Land, Nansen Land and Freuchen Land were acquired on 17 July 2016. Scene cloud cover was 17.55% and 9.15% for the Landsat-8 images, respectively. During acquisition time (19:44:49 to 19:45:44) of the images, sun elevation recorded as 21.380 and 22.680 and sun azimuth were −91.670 and −103.265, respectively.
Several available scenes of PALSAR Fine mode Level 1.5 with dual polarization (HH + HV polarization) and ASTER surface reflectance VNIR-SWIR data (Level-2B07 or AST-07) were used for detailed structural and mineralogical mapping. PALSAR Fine mode Level 1.5 scenes were obtained from the Earth and Remote Sensing Data Analysis Center (ERSDAC) Japan. The Level 1.5 product used for this study has a high-resolution mode with 6.25 m pixel spacing and dual polarization (HH + HV), which is georeferenced and geo-coded. ASTER (AST-07) scenes contain atmospherically corrected data were obtained on-demand from USGS Earth Resources Observation and Science (EROS) center (https://earthdata.nasa.gov/). They acquired under favorable conditions of nominal cloud cover. The ENVI (Environment for Visualizing Images, http://www.exelisvis.com) version 5.2 and ArcGIS version 10.3 software (Esri, Redlands, CA, USA) packages were used to process the remote sensing datasets.

3.2. Pre-Processing of the Satellite Imagery Data

The Landsat-8 L1T product is defined in the Universal Transverse Mercator (UTM) map projection with World Geodetic System 84 (WGS84) datum, which is pre-georeferenced to Polar Stereographic projection for reducing polar map projection distortions [37]. The Fast Line-of-sight Atmospheric Analysis of Spectral Hypercube (FLAASH) algorithm was used in this study for the atmospheric correction of Landsat-8 data [40]. For running the FLAASH, the Sub-Arctic Summer (SAS) atmospheric and the Maritime aerosol models were applied [41]. The ASTER On-Demand L2 Surface Reflectance was used, which includes atmospherically corrected visible and near-infrared and shortwave infrared bands [38]. The ASTER images were pre-georeferenced to UTM zone 24, 25 and 26 North projection using the WGS-84 datum. Crosstalk correction [42] was also applied to ASTER SWIR data.
The radar images are commonly degraded by speckle, which can be treated by filtering the data before using for various applications [43,44]. However, the main distortions such as foreshortening, layover and shadowing in a Synthetic Aperture Radar (SAR) image are related to the side looking architecture, which should be considered and minimized by ortho-rectification [45,46]. Ortho-rectification of the data used in this study was carried out using digital elevation data provided by Greenland Mapping Project (GIMP) Digital Elevation Model [47]. The dataset was georeferenced to UTM zone 24, 25 and 26 North projection using the WGS-84 datum. The adaptive Lee filter was applied to the PALSAR images to accomplish speckle reduction and preserving both edges and features in this analysis [48].

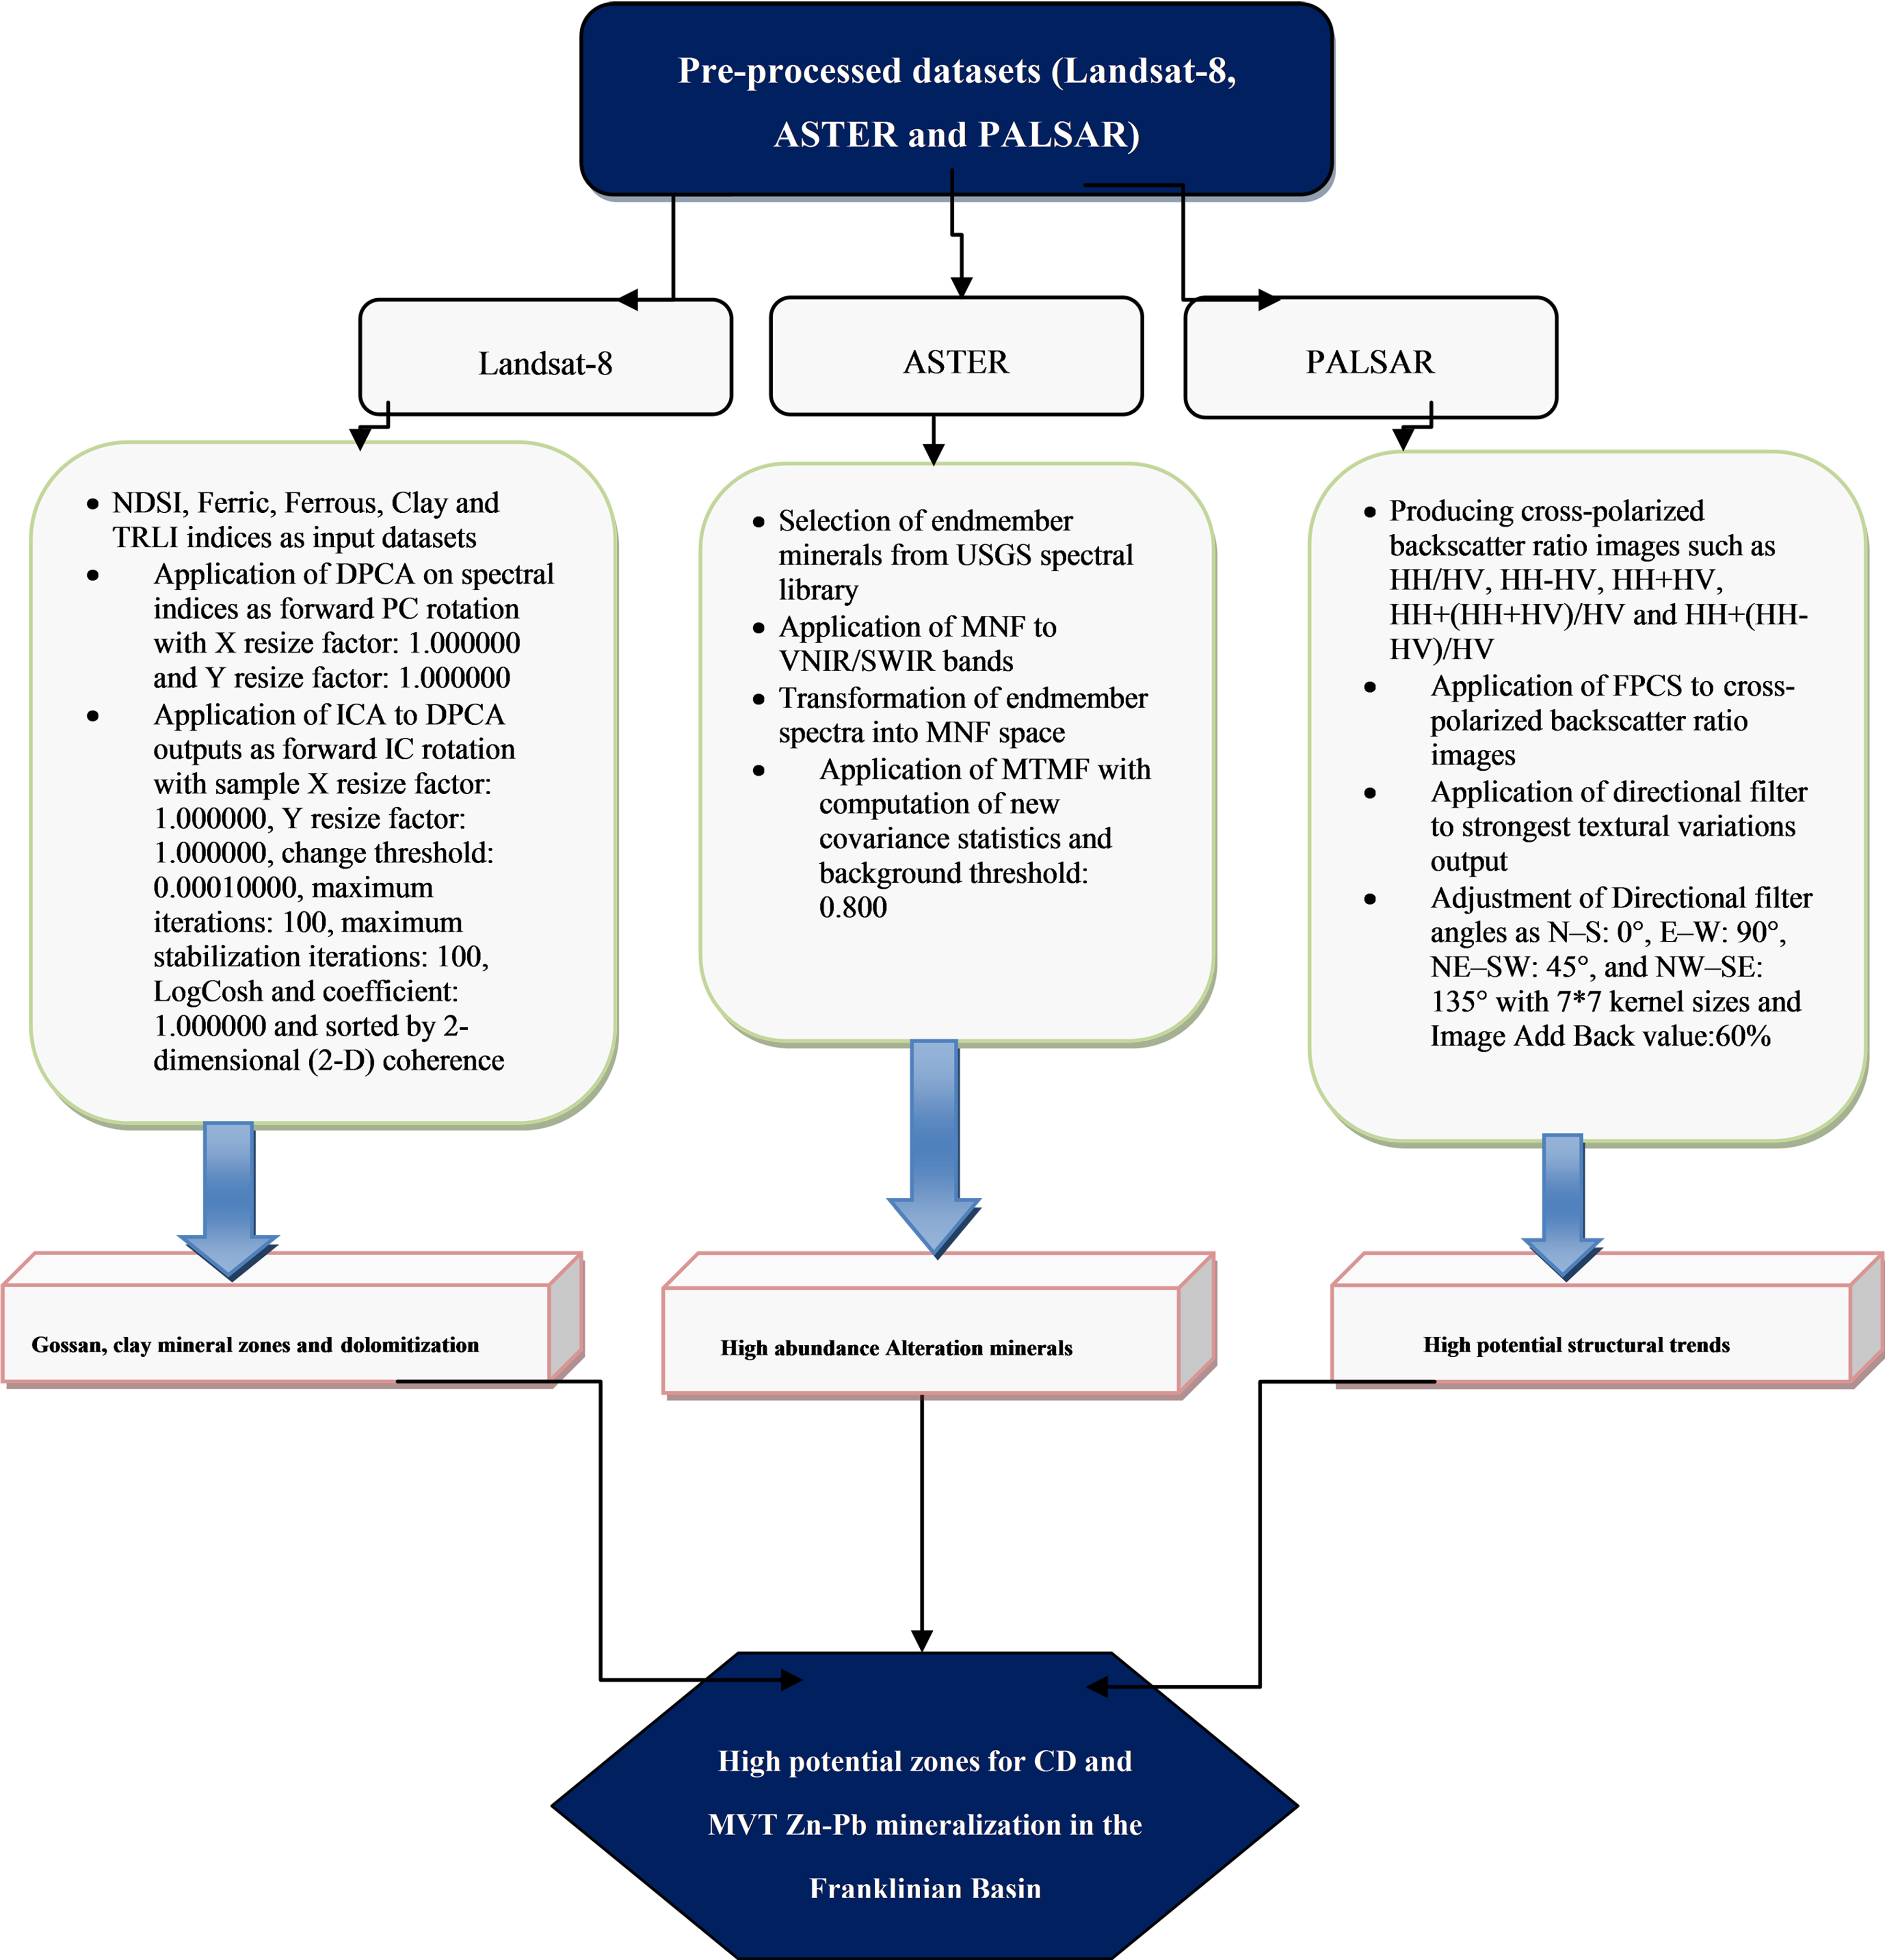
3.3. Image Processing Techniques

For extracting significant information from the pre-processed datasets, a series of robust image processing algorithms were adopted and implemented. Figure 4 shows an overview of the methodological flowchart and performance characteristics of image processing analysis used in this study.

3.3.1. Spectral Information Extraction

Significant information and spectral signatures related to the surface distribution of gossan, hydrated sulfate minerals and hydrothermal alteration clay and carbonate minerals using Landsat-8 and ASTER data was possible through a specialized image processing analysis. The latter is proficiently illuminating the concealed linear mixing spectra in pixel and sub-pixel levels related to the target alteration minerals. A fusion of Directed Principal Components analysis (DPCA, [49]) and Independent Component Analysis (ICA, [50]) was applied to Landsat-8 data for mapping the target alteration minerals and assemblages at the pixel level.
The PCA is a multivariate statistical technique that selects uncorrelated linear combinations (Eigenvector loadings) of variables in such a way that each component successively extracts linear combination with a smaller variance [51,52,53]. The independent component analysis (ICA) is a statistical and computational technique for revealing hidden factors that underlie sets of random variables, measurements or signals [50]. The ICA objective is to find components that are maximally independent and non-Gaussian [54,55]. It can be used to investigate the structure of the data when suitable hypotheses are not available, or they are considered too constrained or simplistic [56]. Accordingly, the PCA is an appropriate way to whiten components and reducing correlation and ICA analysis is capable of removing correlation and address higher order dependence. As a result, a fusion of PCA and ICA has high performance to detect interesting components (target alteration minerals and assemblages) at the pixel level.
The use of band ratio transformation can enhance the contribution of minor components (spectral response of mineral constituents of alteration zones) in the PCA analysis, which is called Directed Principal Components analysis (DPCA) [49,57]. According to [58], the DPCA, which has loadings of similar signs on input band ratio images, explains the variance due to similarities in the spectral responses of the interfering component and the component of interest. The other DPCA contains loadings of different signs on the input band ratio images highlight the contributions unique to each of the component. The sign of the loadings dictates whether the component of interest is represented as bright or dark pixels in the DPCA image. Subsequently, a positive loading implies bright pixels while a negative loading implies dark pixels [59,60].
In this analysis, several band ratio-based mineralogical indices derived from the Landsat-8 were selected on the basis that one band ratio index contains information related to the component of interest (e.g., target alteration minerals). The indices were considered input image datasets for implementing DPCA in this analysis. Normalised Difference Snow Index (NDSI) (band ratio of 3 − 6/3 + 6), ferric iron oxide index (band ratio of 4/2), ferrous iron oxide index (band ratio of 6/5), clay minerals index (band ratio of 6/7) and thermal radiance lithology index (TRLI) (band ratio of 10 + 11 × 11) were used [31,61,62,63]. NDSI attends as a significant snow/ice indicator whereas band ratios of 4/2, 6/5, 6/7 and 10 + 11 × 11 were used to enhance ferric and ferrous iron oxide/hydroxide, clay/carbonate minerals and lithological units using Landsat-8 spectral bands, respectively. The image eigenvectors and eigenvalues were obtained from the DPCA analysis using a covariance matrix of the mineralogical indices (Table 3). Then, a forward ICA rotation was implemented to the resultant DPCA images. Selected ICA images from these transformations were reproduced in figures.
Correspondingly in this analysis for sub-pixel detection and classification of the key alteration minerals, the Mixture Tuned Matched Filtering (MTMF) algorithm [64,65,66] was applied to VNIR/SWIR spectral bands of ASTER surface reflectance data. This method combines the strength of the Matched Filter (MF) method (no requirement to know all the endmembers) with physical constraints imposed by mixing theory (the signature at any given pixel is a linear combination of the individual components contained in that pixel). MTMF maximizes the response of a known endmember and suppresses the response of the composite unknown background [64,65]. This method provides a rapid means of detecting specific minerals based on matches to the specific library without the requirement to know all the end members. It results in two sets of images, (i) MF score images with values from 0 to 1.0, estimating the relative degree of match to the reference spectrum and approximate sub-pixel abundance (where 1.0 is a perfect match), and (ii) Infeasibility images, where highly infeasible numbers indicate that mixing between the composite background and the target is not feasible [41]. In this analysis, the reference spectra of hematite, goethite, jarosite, alunite, gypsum, chalcedony (hydrous-silica), kaolinite, muscovite, chlorite, epidote, calcite and dolomite endmember minerals were selected and extracted from the USGS spectral library version 7.0 [67] (Figure 5) for performing MTMF.
Minimum Noise Fraction (MNF) statistics is required [65] for implementing MTMF to VNIR/SWIR ASTER surface reflectance data. Hence, forward MNF to spectra was applied to transform endmember spectra into MNF space. New covariance statistics were computed. Subspace background was enabled for removing anomalous pixels before calculating background statistics. Background threshold was adjusted 0.800 in this analysis for the fraction of the background in the anomalous image. The MTMF output is a set of rule images equivalent to both the MF score and the infeasibility score for each pixel matched to each endmember spectrum.

3.3.2. Synthetic Aperture Radar (SAR) Information Extraction

For extracting radar information to map the major lineament trends, intersections, curvilinear structures and sedimentary formations in the Franklinian Basin using PALSAR data a developed image processing technique using the combination of HH (co-polarized) and HV (cross-polarized) polarizations is required. As different polarizations are sensitive to ground surface features of different dimensions, they collectively bring out greater geological-geomorphological-structural detail. Most theories predict domination of cross-polarized returns by subsurface volume scattering [68,69]. Therefore, cross polarization is more suitable for mapping geological features and lineaments. In a region with rock outcrops and exposed bedrock, HH backscattering is high and contains strong surface reflections, but HV returns are moderate to low [69,70]. Therefore, the inverse relationship of HH and HV polarizations can optimize geological features with different orientations, contrast and textural variability, which is particularly useful for the identification of topographic features related to structural patterns in the underlying bedrock. The combination of HH and HV polarizations can produce several cross-polarized backscatter ratio images. In this analysis, HH/HV, HH − HV, HH + HV, HH + (HH + HV)/HV and HH + (HH − HV)/HV cross-polarized backscatter ratio images were adopted [34]. On the basis of cross-polarized backscatter ratio images, more information for mapping the major lineament trends, intersections, curvilinear structures and sedimentary formations can be obtained by considering tonal variations, textural variations and brightness contrasts. These images highlight the variation in intensity information related to radar backscattering in response to surface roughness, physical and chemical characteristics of the surface and environmental factors, which are key criteria to map lithological units and geological structures using PALSAR data.
Backscatter variability could be more emphasized in the principal component images [70], as they are a linear combination of all input data. Consistent improvements in image enhancement and signal to noise ratio (SNR) produce using correlation matrix in the principal component analysis [52,71]. The use of correlation matrix implies scaling of the axes so that each feature has unit variance [72]. Consequently, the Feature-oriented Principal Components Selection (FPCS) technique [73,74,75] was applied to analyze the information content of the backscatter ratio images adopted herein. The objective was to examine the PCA eigenvector loadings, based on the correlation matrix, to select the most suitable principal component that highlights the most significant information regarding the backscattering signatures and variability of specific surface targets. The sign of eigenvector loadings indicates whether a surface feature is characterized by a dark or a bright pixel, and additionally how well the latter affects the topographic perception in relation to the radar backscattering response [74,75].
In this analysis, the Band Math dialog of ENVI Classic’s was used to define the cross-polarized backscatter ratios as the input dataset for FPCS. ENVI Classic’s Band Math function accesses data spatially by mapping user-defined variables to bands or files [66]. Statistical factors were calculated for the dataset, and correlation eigenvector values are shown in Table 4(A)–(D). On the basis of eigenvector loadings analysis and considering tonal variations, textural variations and brightness contrasts, PCs were selected to generate false color composites (FCC). Thus, differences in the polarization response of different targets can be viewed simultaneously. Additionally, PC image with the strongest textural variations was selected as input band for directional filtering to enhance image features having specific direction components (gradients) [74]. The result is that areas with uniform pixel values are zeroed in the output image, while those that are variable are presented as bright edges [76]. Four principal directional filters: N–S, E–W, NE–SW, and NW–SE with 7 × 7 kernel sizes were applied to the PALSAR scenes. Directional filter angles were adjusted as N–S: 0°, E–W: 90°, NE–SW: 45°, and NW–SE: 135°. North (up) is zero degrees and the other angles are measured in the counterclockwise direction. Image Add Back value was entered at 60%.

3.3.3. Virtual Verification

Virtual verification could be applied to the spectral remote sensing data directly if sufficient spatial and/or spectral resolution is available to positively identify the target objects [77]. The identification of specific minerals in the Earth’s surface is promoted by the spectroscopy imaging with appropriate spectral resolution, based on the shape of distinctive absorption characteristics and wavelength position [67]. The detection of distinctive mineral spectral absorption characteristics allows the identification of the mineral and the capability to map its spatial distribution. Hence, in situ field checking is not required since the spectra are of appropriate resolution to be certain of their detection [77]. Accordingly, the derived mineral maps can be verified by examining spectra from the imaging spectrometer data, which is a form of virtual field verification. Due to logistical constraints in North Greenland, virtual verification could be implemented to the spectral mapping results of this investigation for the accuracy assessment. It seems that the spectral resolution of Landsat-8 and ASTER bands for the identification of specific alteration minerals and assemblages allows virtual verification for this study. The statistical factors for virtual verification are shown in Table 5.

4. Results

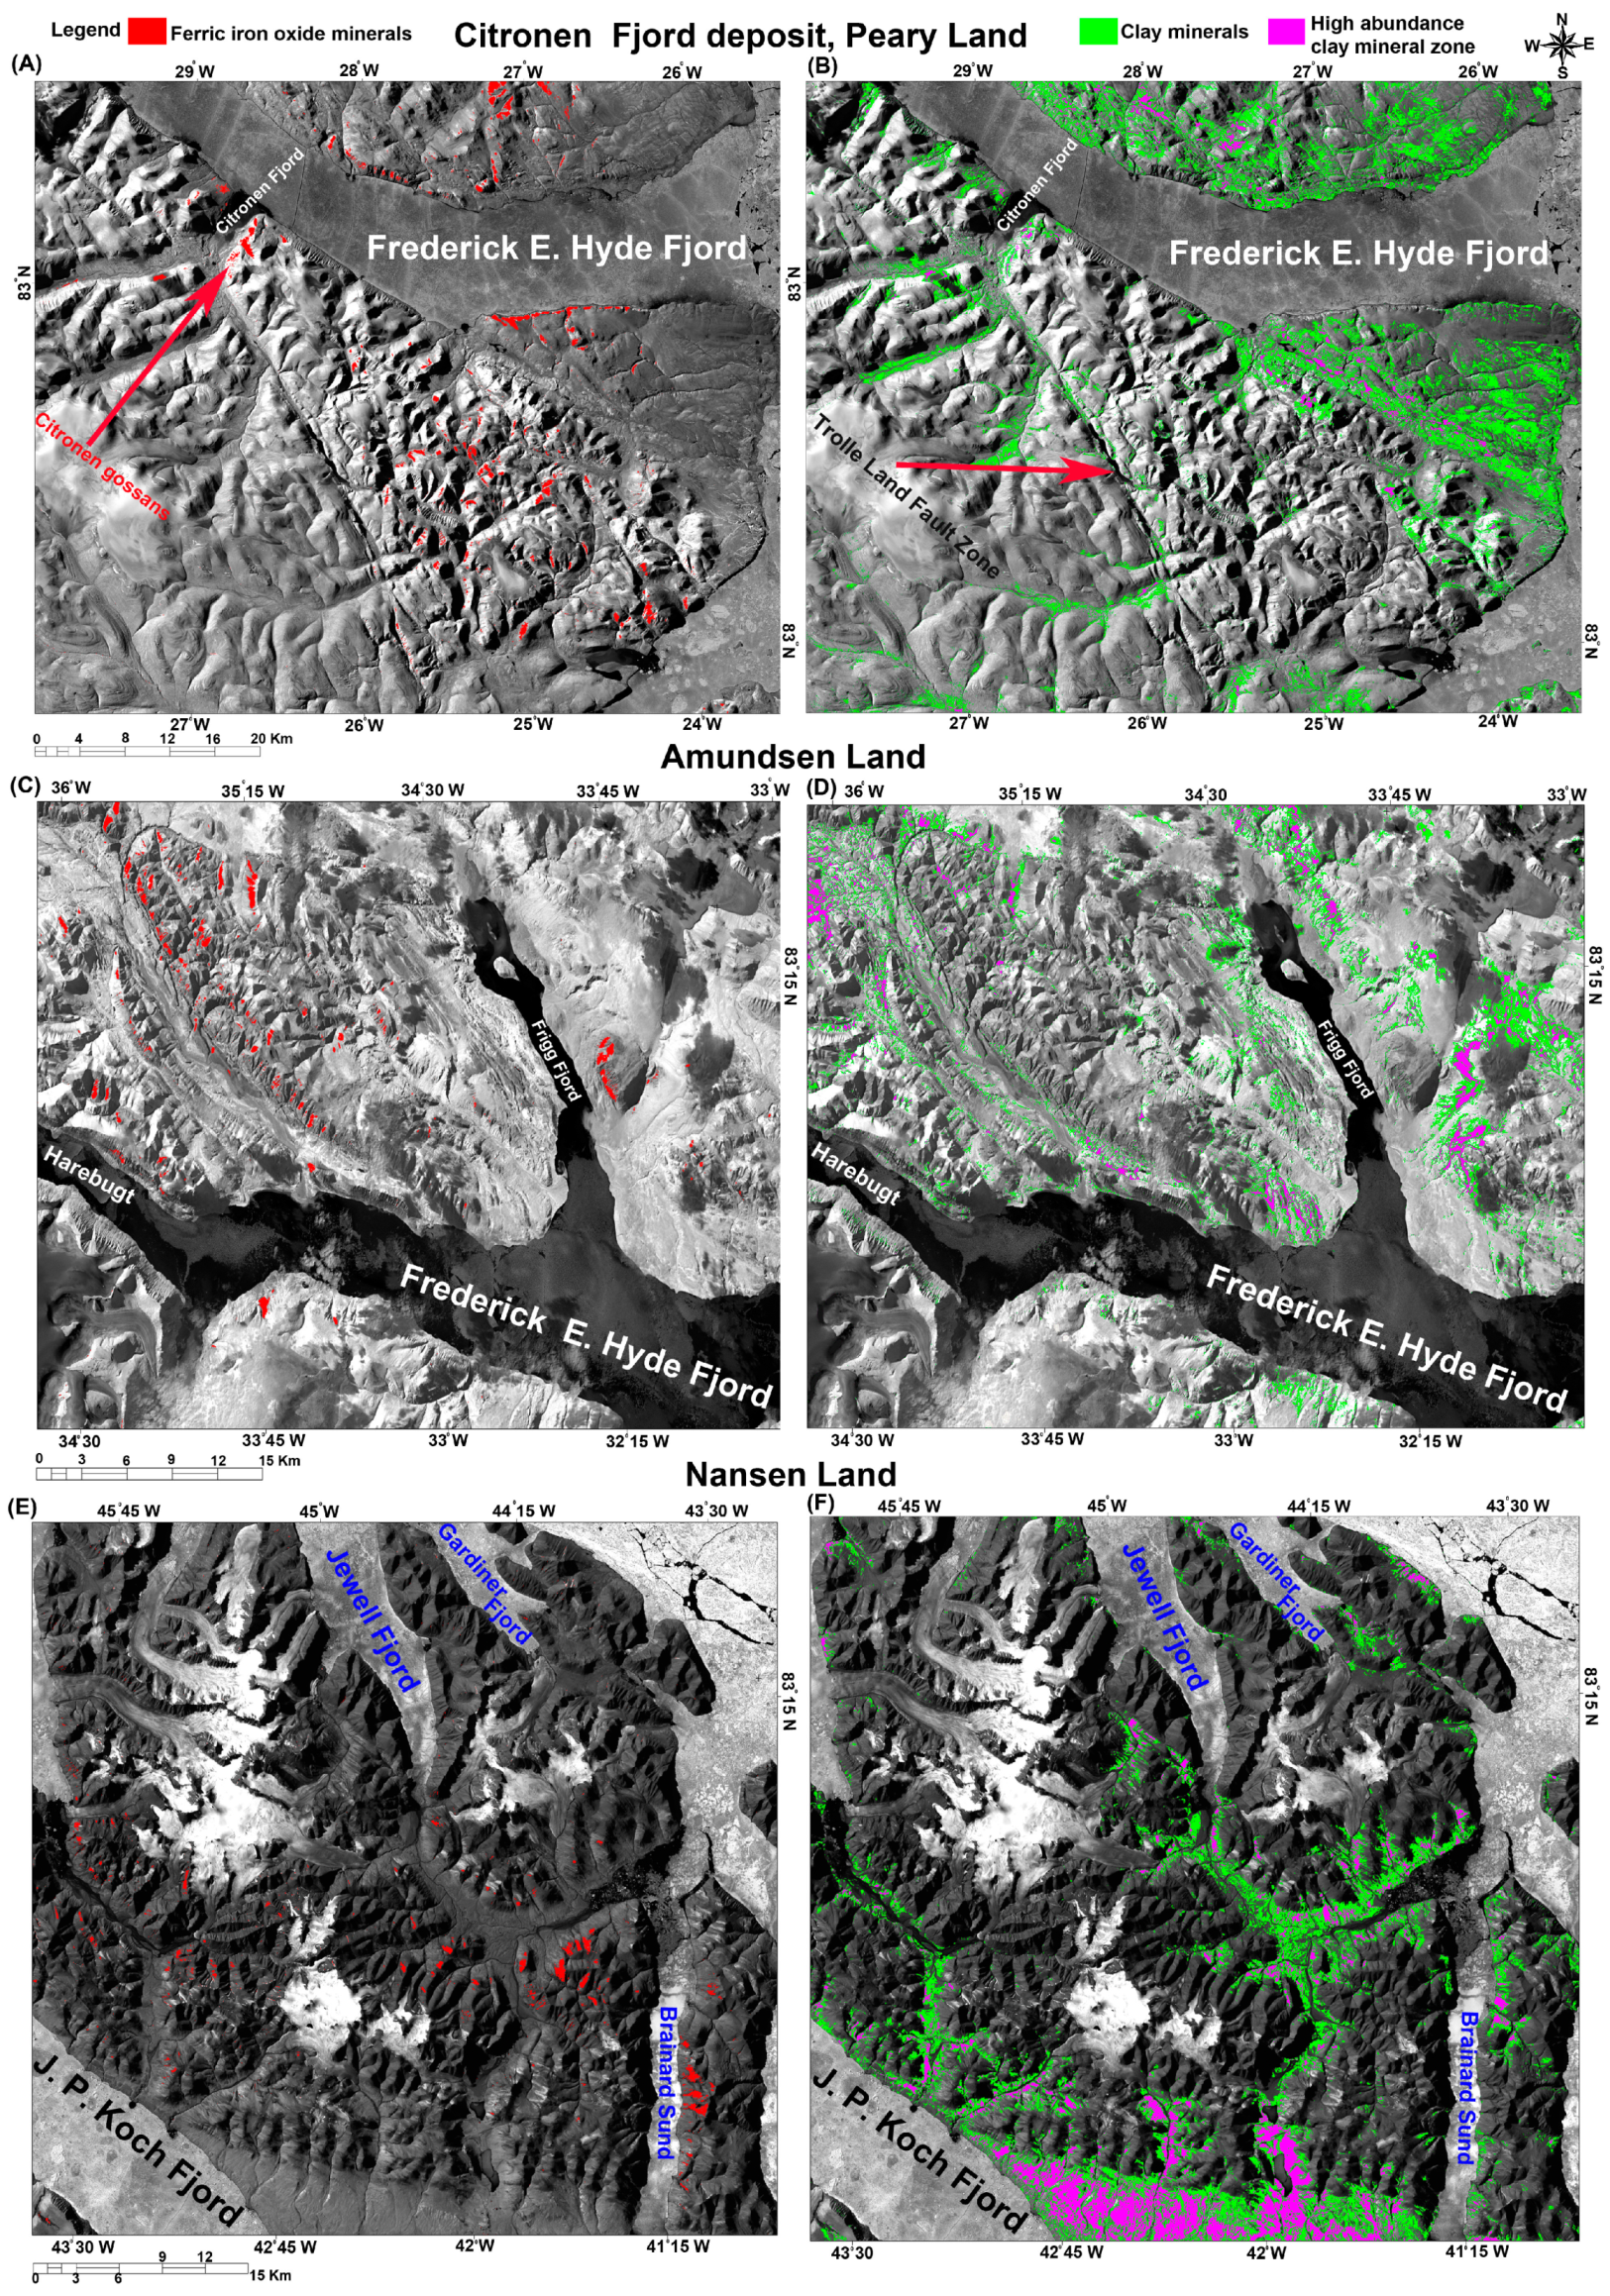
4.1. Regional Lithological-Mineralogical Mapping Using Lansat-8 Data

An overview image of the eastern part of the Franklinian Basin was produced using a mosaic of the Landsat-8 ratio images assigned to NDSI (b3 − b6/b3 + b6), ferric iron oxide index (b4/b2) and clay minerals index (b6/b7) in Red-Green-Blue (RGB) channels, respectively (Figure 6). This image provides a false color-based composite of pixels that shows snow/ice in dark orange to gold colors, surface distribution of ferric iron oxide/hydroxide minerals in light green to green and clay and/or carbonate minerals in blue. The areas with a mixture of iron oxide/hydroxide, clay and/or carbonate minerals appear as cyan colored domains (Figure 6). The NDSI allows the discriminating snow/ice from exposed lithologies due to the fact that snow reflects visible radiation in 0.544–0.565 μm more strongly than the middle-infrared region (1.628–1.652 μm) [78]. Rock exposure produces very low or negative NDSI values as rocks are generally less reflective in the visible and near-infrared region [58]. For mineral constituents, hydroxo-bridged Fe3+ results in absorption bands in the 0.43 to 0.9 μm regions [19] coinciding with bands 2 and 4 of Landsat-8. Combinations and overtones of H2O or OH fundamentals and CO3 in mineral compounds can produce absorption features in the 2.1 μm to 2.5 μm [17,18], which coincide with band 7 (2.11–2.29 µm) of Landsat-8. Therefore, the combination of NDSI, ferric iron oxide and clay minerals indices as RGB color composites enhances the target geologic materials contain distinctive spectral characteristics.
Considering the availability of the remote sensing datasets in this investigation, some spatial extents covering the potential regions for CD and MVT Zn–Pb mineralization were selected for detailed mapping of target alteration minerals and related lithologies. Spatial subsets of trough sequences covering the Citronen Fjord Zn–Pb deposit (northeastern part of the Peary Land and southeastern part of Johannes V. Jensen Land), the southern part of the Amundsen Land and the central part of the Nansen Land were selected as potential regions for CD mineralization (see Figure 6). Three spatial subsets of the southern part of Peary Land (the shelf-platform carbonate), namely the Erlandsen Land (SW Peary Land), the Melville Land (1) (SE Peary Land) and the Melville Land (2) (SE Peary Land) contain MVT Zn–Pb mineralization [6] were also selected (see Figure 6). A fusion of DPCA/ICA analysis was implemented to the NDSI, ferric iron oxide, ferrous iron oxide, clay minerals and TRLI indices of the selected Landsat-8 subset scenes. Statistical analysis has been applied and limited to the selected subset scenes to evaluate the resultant images. The statistical results are presented in Table 3(A)–(F) for the selected Landsat-8 subset scenes, separately.
Statistical results for the subset of Citronen Fjord deposit (Table 3(A)) show that whiten components in the DPCA1 does not contain unique contribution of iron oxide/hydroxide and clay alteration minerals due to weak to moderate loadings of similar signs for the ferric iron (0.022359), ferrous iron (0.270383) and clay minerals (0.026084) band ratio images. It emphasizes the variance due to similarities in the spectral responses of the interfering component and the component of interest (alteration minerals) in the DPCA1 for the subset of Citronen Fjord deposit. The eigenvector loading for the TRLI shows strong contribution (0.929362), while the NDSI loading is moderate (−0.248995) (Table 3(A)). Therefore, the DPCA1 represents background lithology with some ice/snow interference and the alteration minerals cannot be differentiated. In fact, whiten components of subtle spectral differences between alteration minerals are not sufficient in the DPCA1 for removing their correlation and addressing higher order dependence using consequent ICA analysis.
The eigenvector loadings for the DPCA2 in the Citronen Fjord deposit subset show the strong contribution of ferric iron (−0.954622) and the NDSI (−0.449862) and weak loadings of ferrous iron (0.087607), clay minerals (−0.020442) and the TRLI (−0.076644), respectively (Table 3(A)). Therefore, the DPCA2 image is statistically dominated by highest loading of ferric iron with a negative sign (dark pixels), but the NDSI has also high negative contribution in this image as dark pixels. Iron oxide/hydroxide minerals (limonite, goethite, jarosite and hematite) contain distinctive absorption characteristics due to charge transfer and crystal-field processes in the VNIR region (0.4–1.1 μm) (see Figure 5) [79,80]. They show charge transfer absorption features between 0.48–0.72 μm, and crystal-field absorption properties between 0.63–0.72 μm and 0.85–1.0 μm due to the presence of Fe3+ [79,80]. In ice, overtone and combination bands are identified in transmission and reflectance spectra at 1.04 μm, 1.25 μm, 1.50–1.66 μm, and 1.96–2.05 μm [81,82]. For isolated H2O molecules, overtones and combinations of the absorption features are near 0.94 μm, 1.13 μm, 1.38 μm, 1.45 μm, and 1.88 μm [83]. Accordingly, the interference of ice/snow/water component in the spectral responses may have some similarities with ferric iron component within the near infrared (NIR) region in the DPCA2 image. The ICA analysis is able to remove this correlation of whiten components for the spectral responses of ice/snow/water and ferric iron components in the DPCA2 image. Thus, a maximally independent component of ferric iron can be differentiated from ice/snow/water component in the ICA2.
Figure 7A shows the ICA2 resultant image for the subset of Citronen Fjord Zn–Pb deposit. Ferric iron oxide/hydroxide minerals (gossan) depict by red pixels. Sulfide-bearing gossans associated with the Citronen Fjord Zn–Pb deposit [7] are mapped in the ICA2 image (red arrow in Figure 7A). The DPCA3 has a low negative contribution for the NDSI (−0.139884), ferric iron (−0.142827), ferrous iron (−0.147766), very small negative contribution for clay minerals (−0.051519) and moderate positive contribution of TRLI (0.243142) in the Citronen Fjord subset (Table 3(A)). The analysis of magnitude and sign of the eigenvector loadings indicates that this DPCA does not have any unique contribution for mapping the target alteration minerals. By looking at DPCA4 eigenvector loadings, the strong negative contribution of ferrous iron (−0.938332) and low negative weighting of the NDSI (−0.126912) is obvious. The strong positive contribution of ferric iron (0.678411) can also be considered as strong whiten component. The eigenvector loadings for clay minerals (weak positive weighting) and the TRLI (very weak negative loadings) are (0.084164) and (−0.019658), respectively.
Considering the magnitude and sign of the eigenvector loadings in the DPCA5 for the Citronen Fjord subset (Table 3(A)), it is evident that clay minerals can be particularly mapped due to great contribution (strong negative contribution (−0.994567)) of the component in the DPCA5. The eigenvector loadings for the NDSI, ferric iron, ferrous iron and TRLI are positive and very low, which are (0.009499), (0.093138), (0.042679) and (0.015802), respectively (Table 3(A)). Thus, the contribution of these components in the DPCA5 image is very low. The implementation of ICA analysis to the DPCA5 image produced the ICA5 image (Figure 7B). It illustrates the surface distribution of clay minerals (green and magenta pixels) in the Citronen Fjord subset. After analyzing the eigenvector values for the Amundsen Land subset scene (Table 3(B)), it could be predicted that the DPCA2 and DPCA5 contain a significant contribution of the ferric iron and clay mineral components. The DPCA2 has a strong negative weighting of ferric iron (−0.816547) and DPCA5 contains high negative loading (−0.630491) of clay minerals (Table 3(B)). Therefore, these DPCAs were selected for ICA analysis. Considering the magnitude of the eigenvector loadings for the alteration minerals in the Nansen Land subset scene (Table 3(C)), it is evident that the DPCA3 has a significant contribution (−0.926717) for mapping the clay mineral component and DPCA5 contains high weighting (0.767534) of the ferric iron component. Therefore, the ICA3 image holds clay mineral information, while the ICA5 image has high contribution of ferric iron.
Table 3(D)–(F) shows the statistical results for three spatial subsets of the Peary Land (carbonate platform) encompass MVT Zn–Pb mineralization. In the subset of Erlandsen Land (SW Peary Land), the DPCA3 contain a unique contribution of ferrous iron (−0.929786). The DPCA4 shows a high contribution of ferric iron (0.920551) and DPCA5 has a great loading of clay minerals (−0.942232) (Table 3(D)). Hence, the ICA3, ICA4 and ICA5 images are considered for classification of pixels as RGB color composites (Figure 8A).
The ICA3 image contains ferrous iron information was used to identify the Tureso Formation (dolostones) and/or dolomitization in the Erlandsen Land (SW Peary Land) subset. Figure 8B shows the resultant ICA3 image. Red pixels depict the Tureso Formation (dolostones) and/or dolomitization. Analyzing the statistical results for the Melville Land (1), SE Peary Land subset (Table 3(E)) indicate the high negative loading (−0.986442) for ferrous iron in the DPCA3, great positive contribution (0.803323) of clay minerals in the DPCA4 and high negative weighting (−0.798485) of ferric iron in the DPCA5, respectively. Thus, ICA3, ICA4 and ICA5 images were used for producing RGB color composites for the Melville Land (1) subset. Considering the magnitude of the whiten components for the alteration mineral in the subset of the Melville Land (2), SE Peary Land (Table 3(F)), it is clear that ferrous iron can be mapped in the DPCA3 due to high eigenvector loading (−0.967840). Clay minerals show great contribution (0.989881) in the DPCA4, and ferric iron has high weighting (0.983940) in the DPCA5. Hence, ICA3, ICA4 and ICA5 images were selected for generating RGB color composites (Figure 8E).

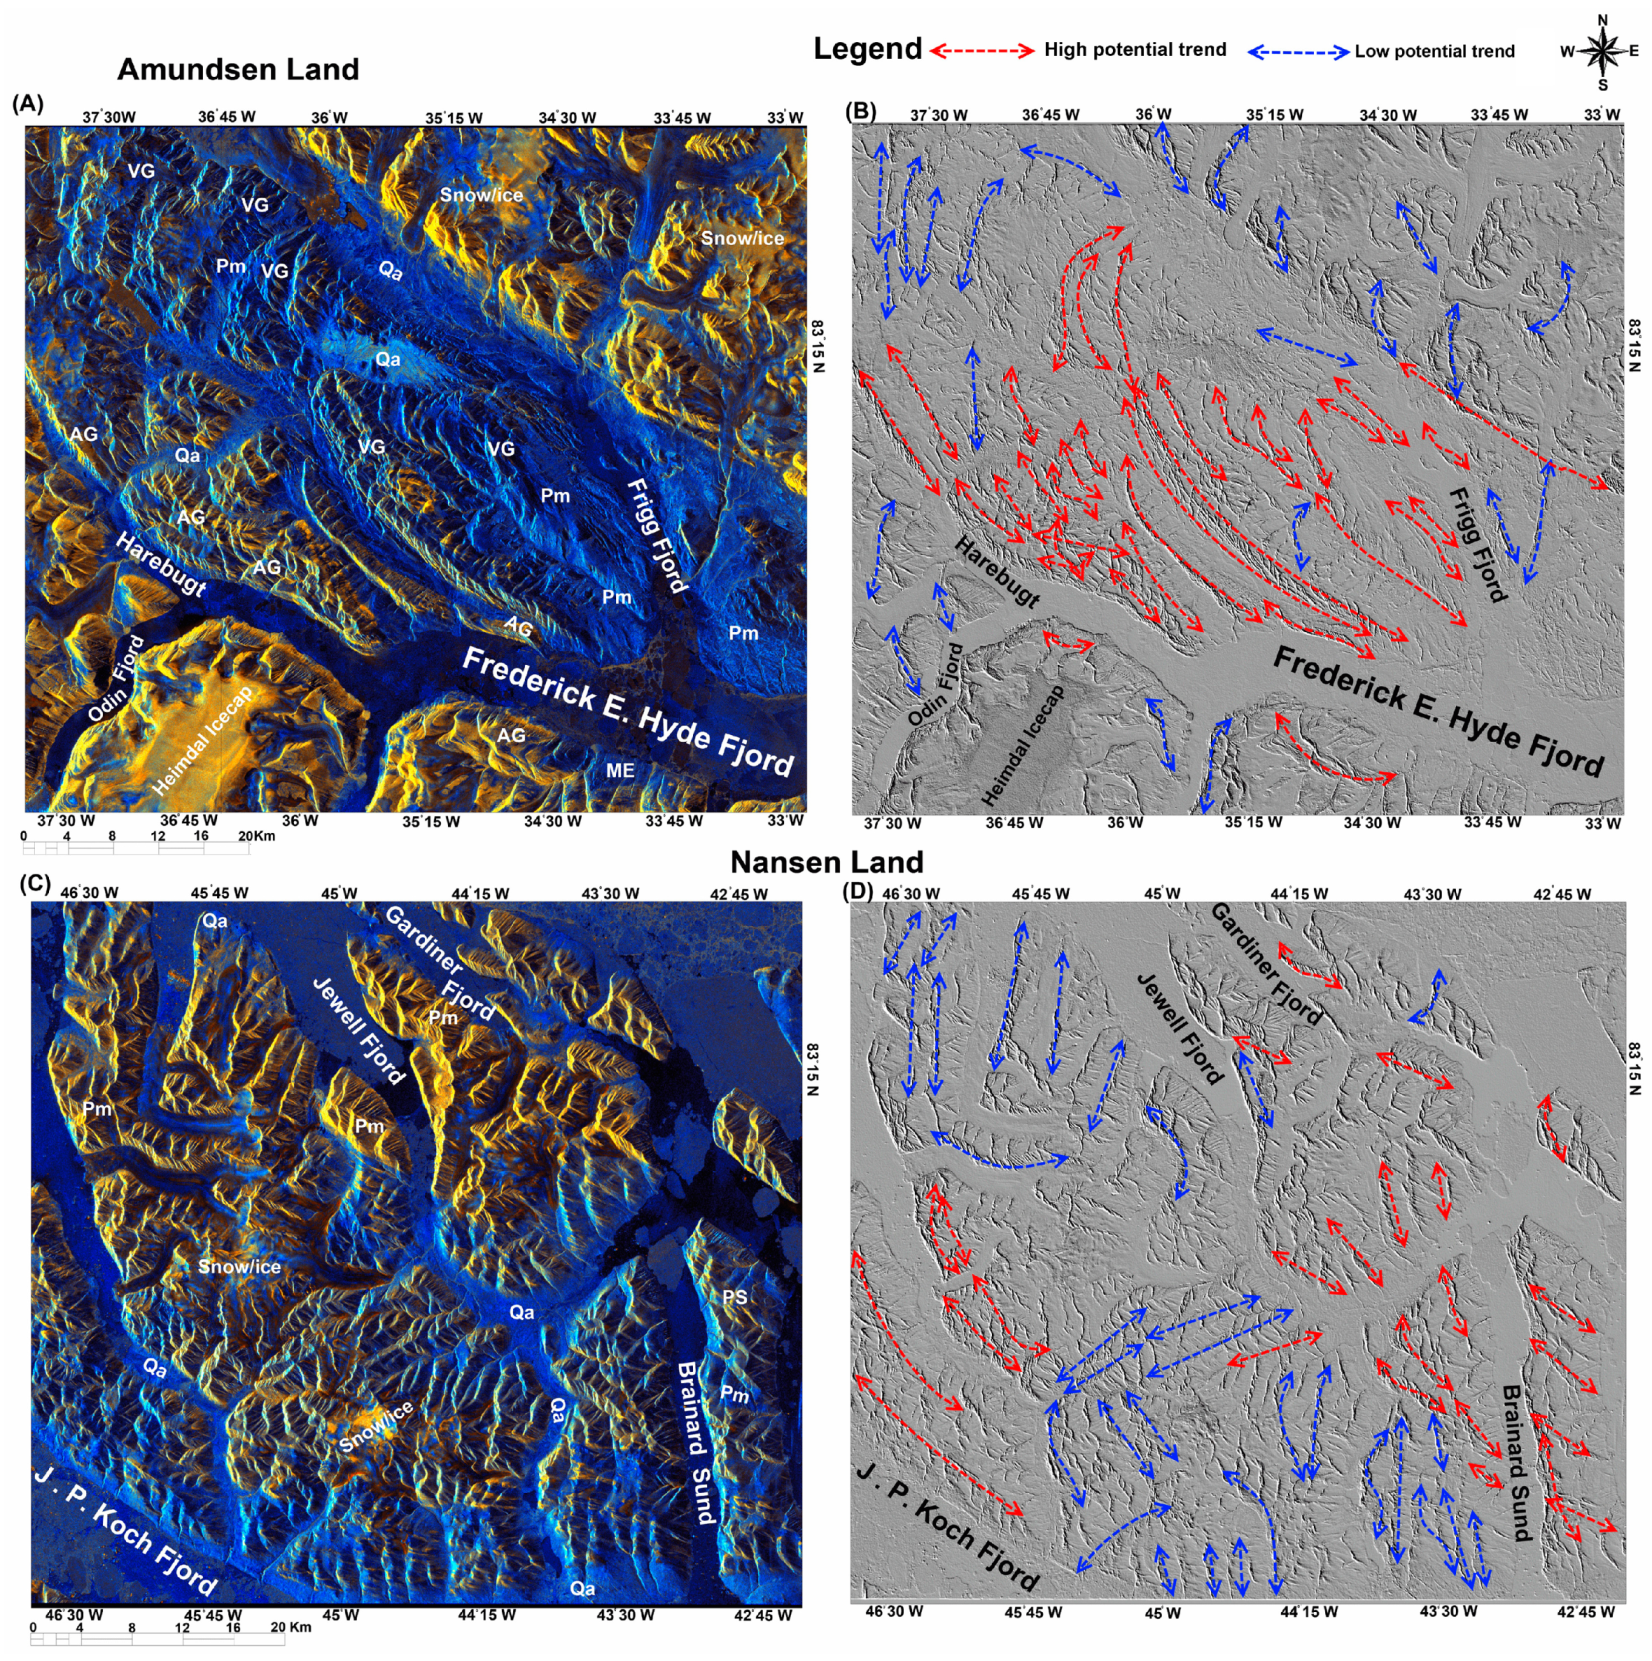
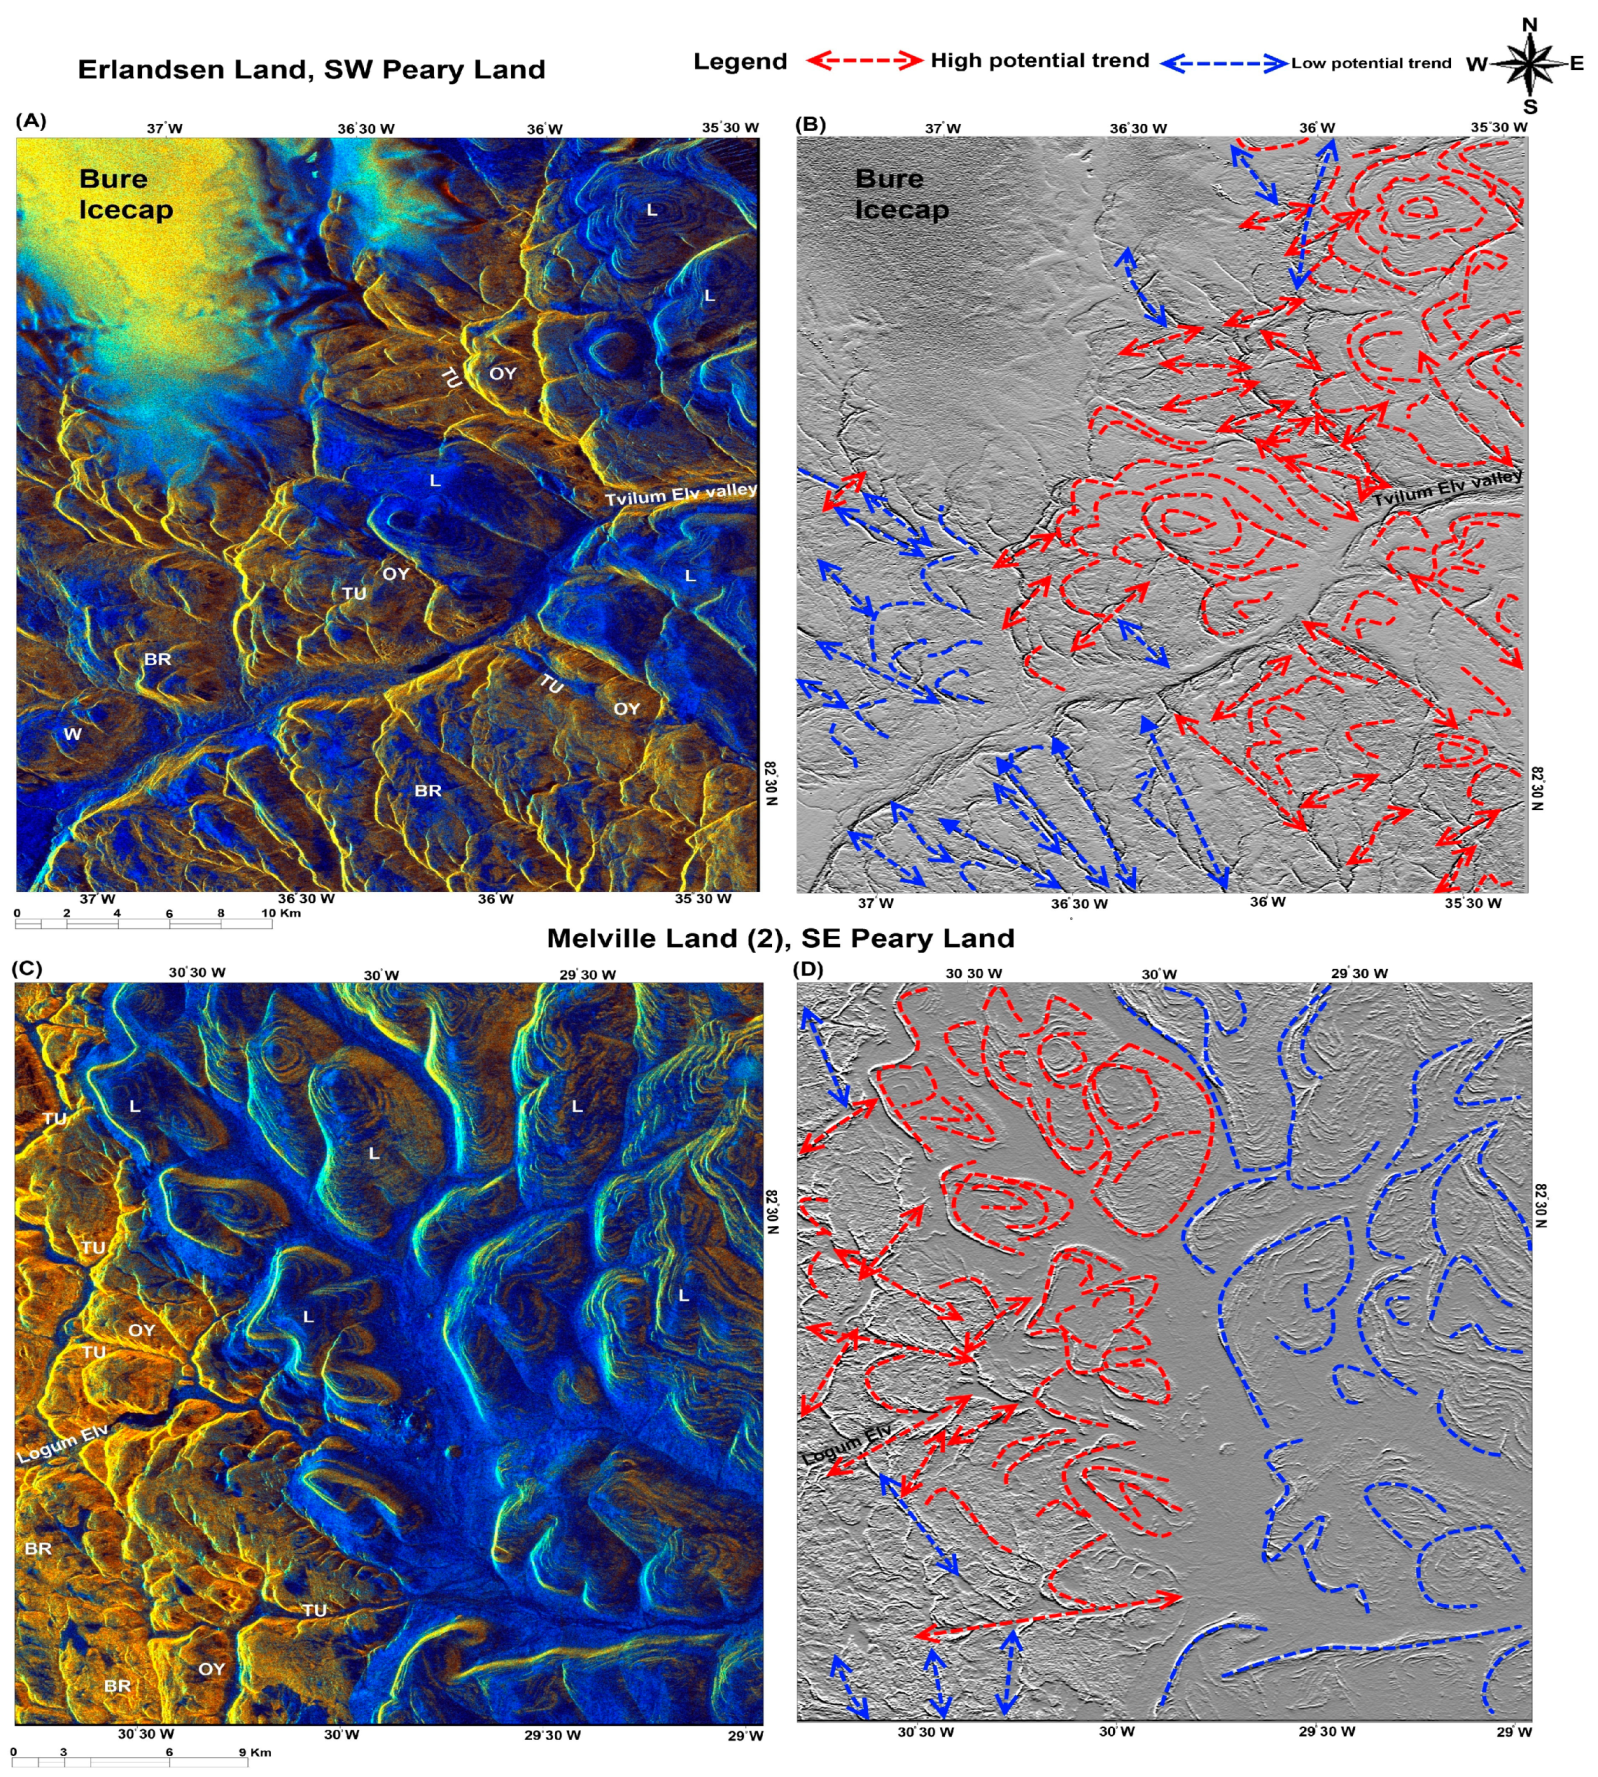
4.2. Lineament Feature Mapping Using PALSAR Data

The available PALSAR scenes were selected and delimited as spatial subsets in similar size with the Landsat-8 subsets. Statistical factors were calculated for the cross-polarized backscatter ratio images, namely HH/HV, HH + HV, HH − HV, HH + (HH + HV)/HV and HH + (HH − HV)/HV. Correlation eigenvector values for the selected spatial subset scenes are shown in Table 4(A)–(D). The analysis of eigenvector loadings for the PCA1 indicate a significant negative mixture of all the cross-polarized backscatter ratio images for the Amundsen Land subset (Table 4(A)), it highlights intensity information and tone variation attributed to radar backscattering in response to surface roughness variations [74]. The PCA1 also contributes the high percentage of total variance. In fact, it represents the overall combination (albedo) of all the input cross-polarized backscatter bands. PCAs contain high variance may not essentially comprehend the geological information required, or the information needed may have been distributed by the presence of strong contrary factors [75].
In the PCA2, the strong positive contribution of the HH − HV band (0.915559) and negative loading of the HH + HV band (−0.392227) dominate this PCA. The other bands do not contain any significant contribution in the PCA2 (Table 4(A)). It is the second PCA for the Amundsen Land subset and has the second largest variance. Cross polarization (HV) is highly sensitive to geologic lineaments [84,85]. For instance, surface roughness results in strong surface reflection and high HH backscatter, while moderate HV returns by surface roughness. Therefore, the inverse relationship of HH + HV and HH − HV loadings in the PCA2 optimizes topographic enhancement of surface features with different orientations, contrast and textural variability. The PCA2 of the Amundsen Land subset has a high potential for mapping topographic features related to structural patterns in the underlying bedrock.
The PCA3 is dominated by HH + HV (0.660001) and HH + (HH + HV)/HV (−0.510181) with opposite signs (Table 4(A)). It probably indicates the information related to image brightness contrasts in the PCA3. The magnitude and sing of HH + (HH + HV)/HV (0.690400) and HH + (HH − HV)/HV (−0.691847) are strong and opposite in sing for the PCA4 (Table 4(A)). Some texture variations might be dominated in the PCA4. Eigenvector loadings for the PCA5 show very strong negative contribution of HH/HV (−0.977395), very low loadings of HH + HV (−0.001243) and HH − HV (0.000105), and low weighting of HH + (HH + HV)/HV (0.150336) and HH + (HH − HV)/HV (−0.148649), respectively (Table 4(A)). PCA5 contains image tone information with dark pixel due to the negative contribution of HH/HV band in the Amundsen Land subset. Subsequently, PCA2, PCA3 and PCA5 were selected for producing FCC color composites by assigning red, green and blue colors, respectively. PCA2 image with the strongest textural variations was also selected as an input band for directional filtering.
Analysis of eigenvector loadings for the Nansen Land subset (Table 4(B)) shows that the PCA2 contains topographic enhancement because of strong weighting of the HH − HV band (0.927380) and negative loading of the HH + HV band (−0.287470). The PCA3 is dominated by the HH + HV band (0.719735) and HH + (HH + HV)/HV (−0.490343), which shows image contrasts information. The PCA4 has the strong contribution of HH/HV band (0.993023) and very low contribution of other cross-polarized backscatter bands, which represents image tone information. The PCA5 might show some textural variations due to the weighting of HH + (HH + HV)/HV (−0.701918) and HH + (HH − HV)/HV (0.702431). Therefore, the FCC image map for the Nansen Land subset was produced by assigning the PCA2, PCA3 and PCA4 to the FCC color composites (Figure 9C). Table 4(C) shows the statistical results for the Erlandsen Land subset (SW Peary Land). The PCA2 has a strong topographic contribution by virtue of HH − HV (0.942540) and HH + HV (−0.319880) bands eigenvector loadings. Image brightness contrasts and texture variations are dominated in the PCA3 and PCA4, respectively. The PCA5 contains a strong contribution of image tone information HH/HV band (−0.856968). Therefore, the FCC image map was generated for the Erlandsen Land subset using PCA2, PCA3 and PCA5, respectively (Figure 10A). Directional filter with E–W (90°) angle adjustment was applied to the PCA2 image for highlighting important lineament trends (N70 and N110) associated with MVT Zn–Pb mineralization in the selected region (Figure 10B).
For the Melville Land (2), SE Peary Land, eigenvector loadings contribute to the overall brightness for the PCA1 as a result of a significant positive mixture of all the input bands (Table 4(D)). The PCA2 contains strong negative eigenvector loading (−0.893032) of the HH − HV band and moderate positive loading (0.449737) of the HH + HV band. In the PCA2 image, the topographic enhancement is dominated because of inverse relationship with the strong negative loading of the HH − HV band and positive loading of the HH + HV band, which results in an overall darker image tone. Analyzing eigenvector loadings in the PCA3, PCA4 and PCA5 emphasize the image brightness contrasts, image tone information and texture variations in the PCAs’ images, respectively.

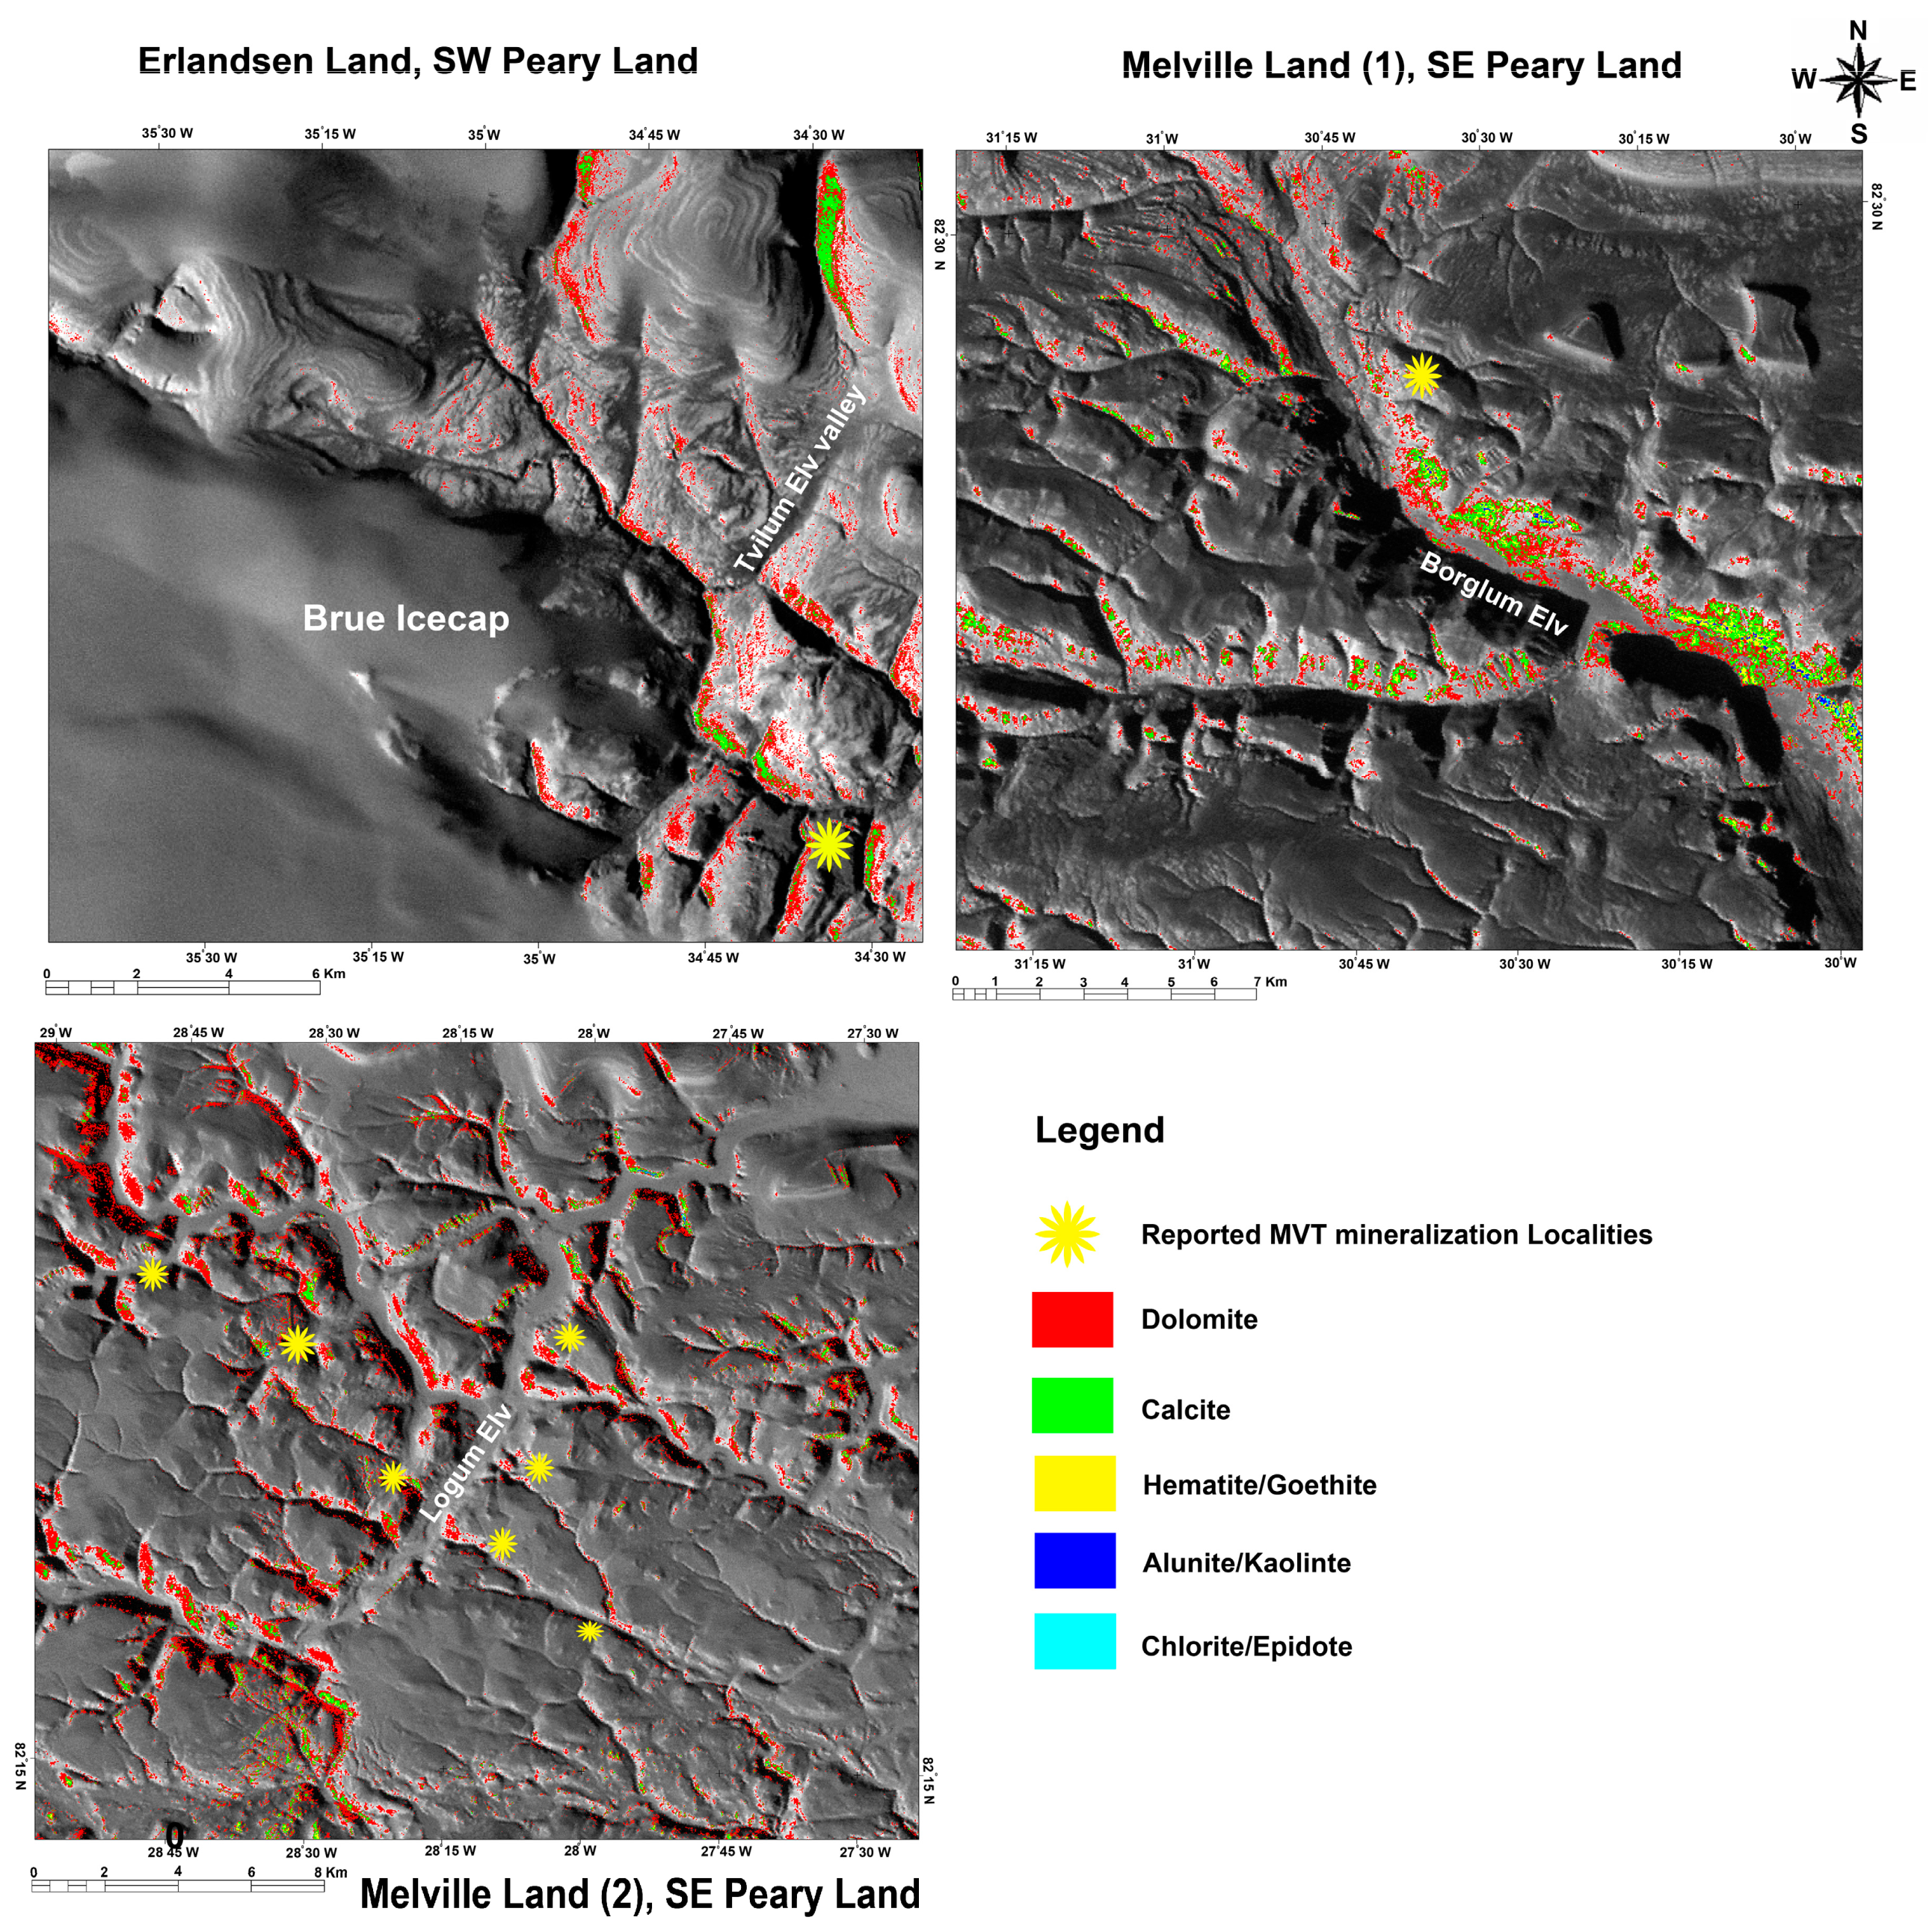
4.3. Alteration Mineral Detection and Targeting High Potential Zones Using ASTER Data

Hematite and goethite contain absorption features due to charge transfer and crystal-field processes [17], which correspond with ASTER bands 1 and 3 (Figure 11A,B). Jarosite has absorption features attribute to hydroxo-bridged Fe3+ and vibration of S-O groups [19,86], which result in absorption bands in the 0.43, 0.5, 0.9 μm regions (equivalent with ASTER band 1 and 3) and 2.3 μm region (equivalent with ASTER band 7) (Figure 11C).
Alunite shows absorption characteristics in ASTER bands 1 and 5 caused by vibrations of S-O groups, Al-O-H groups, metal-oxygen bonds and lattice vibrations [86] (Figure 11D). Gypsum exhibits absorption features attributed to H-O-H and O-H combinations along with overtones of S-O groups [19], which coincide with ASTER bands 1, 5, 6 and 7 (Figure 11E). Chalcedony contains absorption characteristics in ASTER bands 6 and 7 as a result of Si–O–H vibrations (Figure 11F). Kaolinite has strong absorption features in ASTER bands 5 and 6 because of combinations and overtones of Al-O-H groups (Figure 11G). Muscovite displays distinctive absorption properties caused by the presence Fe2+ and/or Fe3+ and Al-O-H groups, which correspond with ASTER bands 1, 2, 3 and 6 (Figure 11H). Chlorite and epidote show absorption characteristics in ASTER bands 1, 2, 3 and 8 caused by the presence Fe2+ and/or Fe3+ and Fe-Mg-O-H combinations and vibrations [17,18] (Figure 11I,J). Calcite and dolomite contain absorption properties in ASTER bands 1, 6, 7 and 8 due to vibrational processes of the CO3 radical [87], but the presence of Fe2+ in dolomite caused a broad absorption in the 0.9–1.2 μm interval that can aid in identifying calcite and dolomite [88]. Moreover, dolomite exhibits more strong absorption in ASTER bands 6 and 7 than the equivalent bands in calcite spectra (Figure 11K,L). It is due to the fact that cation substitutions (replacement of Ca by Mg) can cause shifts in band position (shifts on the 2.3 μm absorption) due to their effects on bond lengths of adjacent molecular groups [19,88,89]. Subsequently, using the endmember spectra of the alteration minerals extracted from the s0ASTER USGS spectral library [90], MTMF method has an appropriate capability for detecting and discriminating sub-pixel abundance of alteration minerals associated with CD and MVT Zn–Pb mineralization. However, the spectral and spatial limitations of ASTER VNIR/SWIR bands should also be considered.
Figure 12A–C shows resultant alteration mineral maps derived from the MF score rule images for the SE Citronen Fjord deposit (Hans Egede Land), SW Amundsen Land and SW Nansen Land that contain high potential for CD Zn–Pb mineralization. Large areas of the alteration zones in the selected regions exhibit a high sub-pixel abundance of chlorite and/or epidote and hematite and/or goethite, while muscovite and alunite and/or kaolinite have low surface distribution. Gypsum shows very low surface abundance among the detected minerals in the selected subsets, which only detected in some small zones in Citronen Fjord deposit subset (Figure 12A–C). It is discernible that the association of iron oxide minerals (hematite/goethite) and clay mineral assemblages (chlorite/epidote, muscovite and alunite/kaolinite) possibly pointed to numerous target zones for CD Zn–Pb mineralization in the selected regions.
Dolomite, calcite, hematite/goethite, alunite/kaolinite and chlorite/epidote alteration mineral assemblages were detected in the Erlandsen Land and the Melville Land (1) and (2) of the shelf-platform carbonate (Figure 13A–C). Dolomite and calcite show high sub-pixel abundance, while hematite/goethite, alunite/kaolinite and chlorite/epidote display low to very low sub-pixel abundance in the alteration mineral assemblages. Comparison of the resultant alteration maps with the geospatial locations of reported MVT mineralization [6] indicates the association of dolomite, calcite and hematite/goethite alteration assemblages with the mineralization localities. These alteration mineral assemblages could be attributed to the alteration products of Tureso Formation dolostones or maybe due to the influence of the dolomitization on primary carbonate minerals.

4.4. Virtual Verification Assessment

To evaluate the accuracy of the alteration mapping results, 400 pixels were selected inside the areas with high scores (Digital Number (DN) value) in the ICA (Landsat-8, 200 pixels) and MF (ASTER, 200 pixels) rule images, which were produced by DPCA+ICA fusion and MTMF processing for the target mineral indices and alteration minerals. The statistical results derived from virtual verification for the target mineral indices (ICA, Landsat-8) show that the overall accuracy and Kappa Coefficient are 81.5% and 0.74, respectively. The results for detected alteration minerals (MF, ASTER) indicate the overall accuracy of 80% and the Kappa Coefficient of 0.64 (Table 5). Accordingly, the virtual verification emphasizes that the detected alteration zones in the selected subsets of Landsat-8 and ASTER can be considered as potential target zones for future systematic exploration projects in the eastern part of the Franklinian Basin, North Greenland.

5. Discussion

The application of a combined satellite-based remote sensing approach using Landsat-8, PALSAR and ASTER data was investigated for zinc exploration in the trough sequences and carbonate shelf-platform of the Franklinian Basin. The trough clastic sediments of Amundsen Land Group (Lower Ordovician to Lower Silurian) host CD Zn–Pb mineralization of Citronen Fjord deposit [7]. The CD deposits tend to occur in clusters within their host stratigraphy and in second-order structures that could have focused on circulating hydrothermal fluids [91]. Thus, the Amundsen Land Group and time-equivalent horizons associated with synsedimentary faults could be considered as highly prospective strata in the trough sequences. Moreover, the CD mineralization is pyrite rich and yields iron oxide/hydroxide and clay alteration minerals due to the oxidation and acid weathering. Tureso Formation (Upper Ordovician to Lower Silurian-Morris Bugt Group) of the carbonate platform was documented as a favorable stratigraphic horizon for MVT Zn–Pb mineralization [6]. It is characterized by pale and dark-weathering dolostones with 150–180 m thickness that is distinctly burrow-mottled [92]. Accordingly, potential regions for CD and MVT Zn–Pb mineralization contain exposures of Amundsen Land Group, time-equivalent horizons and Tureso Formation. Significant anomalies in stream sediment have been reported in the Peary Land, Amundsen Land, Johannes V. Jensen Land, Freuchen Land and Nansen Land by [15].
A number of ferric iron oxide/hydroxide concentrations are identified in the Hans Egede Land, the southeastern part of Johannes V. Jensen Land and the northeastern segment of Peary Land (see Figure 7A (central and northern parts of the scene)). The Hans Egede Land region is a subtidal basin inward setting with very tectonized nature of limestones adjacent to Trolle Land Fault Zone (TLFZ). Some anomalous samples from limonite float were reported by [6]. However, they identified several rust zones attributed to terra rossa clay from karstification processes during fieldwork in the Hans Egede Land. The identified ferric iron locations in Figure 7A warrant further investigation for possible mineralization in this zone. The southeastern part of Johannes V. Jensen Land and the northeastern segment of Peary Land consist of the Paradisfjeld Group lime mudstones (trough succession) on both sides of Frederick E. Hyde Fjord. The ferric iron oxide/hydroxide concentrations in this zone may reflect CD Zn–Pb mineralization.
ICA analysis specifically mapped ferrous iron component in a particular DPCA (for example, DPCA4 in the Citronen Fjord subset (see Table 1(A))) and remove the correlation with whiten components derived from ferric iron and ice/snow/water. Intensities of absorption features due to transition metal cations (e.g., Fe2+, Fe3+ and REE) in minerals are affected by the concentration of the cation in the crystal [90]. For instance, Fe2+ can produce broad absorption features near 0.9–1.2 μm (see Figure 5) and intensity increases with increasing Fe2+ concentration. Absorption features near 0.45–0.9 μm is due to Fe3+ in Fe oxides formed by weathering (see Figure 5) [19,88,90]. The capability of ICA analysis to specifically map ferrous iron minerals and Fe2+ substitutions is very useful for mapping dolostones (Tureso Formation) in terms of MVT Zn–Pb prospecting in the shelf succession.
Clay mineral assemblages are mostly mapped in and around the streams draining systems in the Hans Egede Land as well as along fault splays of the NW–SE Trolle Land Fault Zone (TLFZ) in the Citronen Fjord subset (see Figure 7B). The southeastern part of Johannes V. Jensen Land and the northeastern segment of Peary Land on both sides of Frederick E. Hyde Fjord display the high surface distribution of clay minerals (green pixels) attributed to sand-and silt-dominated deposits of the Paradisfjeld and Skagen Groups in these parts of North Greenland (Figure 7B). Mudstone, shale and litharenite sandstones comprise large amounts of detrital clays, which could be falsely detected by SWIR bands of optical satellite sensors as hydrothermal alteration clay mineral assemblages [93,94]. In view of that, only high abundance clay mineral zones (magenta pixels) in the study area could be considered as possible hydrothermal alteration clay mineral assemblages. Furthermore, high abundance clay mineral zones (magenta pixels) are mapped in the vicinity of main sulfide gossans of Citronen Fjord Zn–Pb deposit. Therefore, some zones contain the association of iron oxide/hydroxide and clay minerals may suggest the presence of potential undiscovered CD Zn–Pb deposits in the Citronen Fjord subset scene (Figure 7A,B).
The ICA2 image shows the surface distribution of ferric iron oxide/hydroxide minerals in the Amundsen Land subset (see Figure 7C). This image displays the distribution of ferric iron oxide/hydroxide minerals as red pixels (Figure 7C). Surface distribution of clay minerals (green and magenta pixels) is manifested in the ICA5 image of the Amundsen Land subset (Figure 7D). The trough succession in the Amundsen Land subset consists of Polkorridoren Group, Volvedal Group, Amundsen Land Group, Merqujoq and Wulff Formations [95]. This region is structurally complex with a number of fold-and-thrust sheets, likely formed during Ellesmerian orogeny [26,96]. Ferric iron oxide/hydroxide (gossan) zones in the Amundsen Land Group can be considered high potential for the CD Zn–Pb mineralization, especially where they are in the vicinity of clay mineral assemblages (Figure 7C,D). Several ferric iron zones are situated within the Cambrian rocks of Volvedal Group, which may contain CD Zn–Pb mineralization in association with synsedimentary faults. A few ferric iron zones are mapped in Cambrian mudstones of the Polkorridoren Group. High concentrations of zinc were reported in stream sediment collected from the Ordovician Amundsen Land Group and the Cambrian Volvedal Group [6,15].
With reference to the geology map of the Amundsen Land [95], high surface distribution of clay minerals is mostly detected within Cambrian mudstones of the Polkorridoren Group. However, the Quaternary alluvium sediments also appear as high abundance zones of clay mineral (magenta pixels) in the Amundsen Land subset especially in the eastern, northeastern and northwestern parts of the scene (Figure 7D). The Midtkap Igneous Complex (a set of intrusions between Frigg Fjord and Midtkap; the eastern part of the scene) encompasses few alteration zones of ferric iron and clay minerals. It is possible that the igneous complex has potential for metallogenic ores [6]. Exploration camps for CD Zn–Pb mineralization conducted by Geological Survey of Denmark and Greenland (GEUS) in the Amundsen Land were unsuccessful to yield any possible showings [6]. It was because of logistical constraints, false ferric iron and clay alteration zones related to bedded chert sequence, mafic dykes and variegated mudstones derived from ASTER data processing. In this study, the results derived from ICA2 and ICA5 images (Figure 7C,D) show potential targets for more investigation in the Amundsen Land. The identified alteration zones in this analysis are more adequate targets than previous GEUS remote sensing study due to implementation of DPCA/ICA fusion technique and suitable optical factors (sun illumination angle) during acquisition time of Landsat-8 for the study area. Numerous exposures of ferric iron zones are mapped in the central and southeastern parts of the Nansen Land subset scene especially on both sides of Brainard Sund Fjord (see Figure 7E). With reference to the geology map of the study area, clay mineral concentration zones (green and magenta) generally represent in the Quaternary alluvium sediments (Figure 7F). However, some of them are in association with ferric iron zones in western, central and on both sides of Brainard Sund Fjord (Figure 7F), which could be considered potential zones for further investigation.
Lithostratigraphic units were mapped in the selected zones for MVT Zn–Pb mineralization (see Figure 8A-F) due to distinct assemblages of minerals that exhibit diagnostic spectral characteristics of ferrous iron minerals (e.g., rozenite, melanterite, clinopyroxenes (hedenbergite/jervisite), amphibole and chlorite (chamosite/clinochlore)), ferric iron minerals (e.g., hematite, goethite, jarosite, illite, smectite and epidote), and hydroxyl and carbonate minerals (e.g., kaolinite, sericite, calcite and dolomite). Figure 8A displays the RGB image map of the Erlandsen Land (SW Peary Land) subset. With reference to geology map of the study area [95], the Tureso Formation, Odins Fjord and Ymers Gletcher Formations, Lauge Koch Land Formation, Børglum River Formation and Wulff Land Formation are exposed in the selected subset. They appear in different tones using RGB color composites of ICA3, ICA4 and ICA5 (Figure 8A). The Tureso Formation has been documented as host stratigraphic horizon for MVT Zn–Pb mineralization [6]. In addition, dolomitization can also play an important role in controlling the porosity and permeability, which is needed for the flow of mineralizing fluids. ICA image capable of detecting ferrous iron minerals and/or Fe2+ substitutions is valuable for identification of dolostones (Tureso Formation) and/or dolomitization in the carbonate platform. Fe2+ in calcites and dolomites produces a broad double absorption band in their spectra near 1.2 µm, the exact shapes and positions of these bands are not the same for the two minerals (see Figure 5K,J)). Cations in dolomites and calcites are surrounded by six oxygons forming an octahedron which is slightly elongated in the direction of the C-axis [97]. The energy of absorption is inversely proportional to the fifth power of the metal-ligand distance [98]. The metal-ligand distance in calcite is larger than that in the B-site (generally considered to be the site occupied by Fe2+) in dolomites [99]. This difference is reflected in the fact that the Fe2+ absorption in the dolomite spectrum occurs at shorter wavelengths (higher energies) than the Fe2+ band in the calcite spectrum. Moreover, carbonate bands in dolomite spectra occur at shorter wavelengths than equivalent bands in calcite spectra [88] (see Figure 5K,J).
Comparison with the geology map of the study area indicates that the spatial distribution of the red pixels in the Erlandsen Land subset (see Figure 8B) matches the exposures of the Tureso Formation. MVT Zn mineralization was reported in the main Tvilum Elv valley (close to the Bure Icecap) where the Tureso Formation exposed [6]. The mineralization comprises caramel sphalerite with some pyrite within brecciated pale dolostones of the lowermost part of the Tureso Formation [6]. The location of Zn mineralization is pointed by the red arrow in Figure 8B. Therefore, the detected pixels (red pixels) warrant further investigation for MVT Zn–Pb exploration in the Erlandsen Land (SW Peary Land) subset. Figure 8C shows the RGB image map of the Meville Land (1), SE Peary Land subset. Børglum River Formation, Odins Fjord and Ymers Gletcher Formations, Wulff Land Formation and Buen Formation are exposed lithostratigraphic units in the selected subset (Figure 8C). The exposures of Tureso Formation appear in the light bluish green shade, which could be mostly seen in the bank of the Børglum Elv. The ICA3 resultant image shows Tureso Formation (dolostones) and/or dolomitization as red color pixels in the Meville Land (1) subset (Figure 8D). Three Zn mineralized localities have been reported by [6], which are hosted in the dark dolostone of Upper Tureso Formation. These localities pointed by the red arrow in the Meville Land (1) subset (Figure 8D). It seems that several potential target points for MVT Zn–Pb mineralization could be considered in the Børglum Elv and surrounding area (Figure 8D).
Numerous lithostratigraphic units exposed in the Meville Land (2), SE Peary Land subset (Figure 8E), namely Lauge Koch Land Formation, Odins Fjord and Ymers Gletcher Formations, Tureso Formation, Børglum River Formation and Wulff Land Formation appear in different colors (Figure 8E). Tureso Formation extensively exposed in this region, which depicts as bluish green tone within the image (Figure 8E). A number of Zn–Pb mineralization localities have been discovered in the lowermost dark-weathering dolostone unit of the Tureso Formation adjacent to Løgum Elv [6]. Tureso Formation (dolostones) and/or dolomitization represents in the ICA3 image of Meville Land (2) subset as red pixels (Figure 8F). The southern part of Løgum Elv encompasses several exposures of Tureso Formation and/or dolomitization that can be considered high potential zones for hosting MVT Zn–Pb mineralization.
In the trough sequences of the Franklinian Basin, sulfide mineralization is associated with faults and fault splays with specific trends such as NW–SE TLFZ mineralization trend in Citronen Fjord deposit and E–W fractures in the Navarana Fjord Zn occurrence [6,7]. Structurally, CD Zn–Pb mineralization is the product of local development in a sub-basin controlled by syn-genetic faults and metal-bearing fluids derived from underlying fractures in the seafloor [91]. Important lineaments for MVT Zn–Pb mineralization in the Franklinian Basin are long lasting structures such as Central Peary Land Fault Zone (CPLFZ) striking N70 and other parallel structures. Moreover, structures related to strike-slip movements and extensional domains such as synclines with negative flower structure and lineaments strike N110 can be considered among important structural groups [6]. MVT Zn–Pb mineralization produces from basinal brine (mineralizing fluids) could have ascended and precipitated metals in extensional fault systems within the carbonate platform [91]. Consequently, the identification of lineament trends with high potential for CD and MVT Zn–Pb mineralization in the Franklinian Basin is very important.
Figure 9A shows the resultant FCC PALSAR image map for the Amundsen Land subset. Lithostratigraphic units portray in some recognizable colors due to variation in the image tone, contrast and texture. Surface roughness, physical and chemical characteristics of the lithological units, terrain relief and environmental effects are the main parameters for different textures and hues in the image map [100]. Considering the geology map of the study area, the Polkorridoren Group appears in blue, the Volvedal Group depicts in dark blue, the Amundsen Land Group manifests as mustard color and Quaternary alluvium exhibits whitish blue, respectively. The similar appearance of the Merqujoq Formation and the Polkorridoren Group is probably due to their analog in physical and chemical characteristics. The Heimdal Icecap and inland ice/snow zones appear in gold tone with the plane pattern. Water represents in black color and ice as blue/gray hue with angular texture in the Fjords. Water bodies represent dark in radar images due to the fact that no returning radar signal could be detected in a receiving antenna from smooth surfaces [100,101]. In the PCA2 image of the Amundsen Land subset, the NW–SE-trending and E–W-trending lineaments (high potential trends for the CD mineralization) were more pronounced using a directional filter with NW–SE (135°) angle adjustment (Figure 9B). Red arrows show the NW–SE-trending and E–W-trending lineaments may contain feasible synsedimentary fault systems. Blue arrows indicate low potential trend lineaments for CD Zn–Pb mineralization. Comparison of lineament image map (Figure 9B) with alteration mineral maps (Figure 7C,D) of the Amundsen Land subset verified that NW–SE-trending lineaments are associated with notable iron oxide/hydroxides and alteration clay minerals. Therefore, the southwestern part of the Amundsen Land encompasses several prospective zones, which deserve more field investigation for exploring CD Zn–Pb mineralization.
Figure 9C display lithostratigraphic units, snow/ice and water in some distinguishable shades for the Nansen Land subset. With reference to geology map of the Nansen Land, the Paradisfjeld Group mostly appears as mustard color and the Polkorridoren Group in the dark blue tone, respectively. Inland ice/snow zones, water and Fjord ice and Quaternary alluvium show similar appearance and patterns to Amundsen Land subset. The NW–SE high potential lineaments are mostly concentrated on both sides of the Brainard Sund Fjord (Figure 9D). However, some of the high potential trend lineaments are detected in the southwestern part of the Nansen Land subset in the vicinity of the J.P.Koch Fjord (Figure 9D). With reference to alteration maps of the study area (see Figure 7E,F); it is discernable that these zones have a high probability for hosting CD Zn–Pb mineralization due to the association of the alteration minerals with high potential trend lineaments.
Figure 10A shows the FCC PALSAR resultant image map for the Erlandsen Land subset. Bure Icecap appears in gold color. The Lauge Koch Land Formation, Børglum River Formation and Wulff Land Formation represent as blue color, while the Tureso Formation, Odins Fjord and Ymers Gletcher Formations map in a mustard hue. Synclines with negative flower structure and lineaments strike N110 and N70 characterize in Figure 10B, which highlight by dashed red lines and arrows, respectively. Maximum curvilinear features are concentrated in the central and northeastern parts of the Erlandsen Land subset, which are associated with N110 and N70 trend lineaments. MVT Zn–Pb mineralization was reported and documented with high potential lineament trends in the central part of the Erlandsen Land near to Brue Icecape [6]. Moreover, the southeastern part of the study area encompasses high potential lineament trends (N110 and N70). Comparison with the alteration image maps of the region (see Figure 8B), this zone shows the spatial distribution of dolomitization/Tureso Formation, which warrants high possibility of MVT Zn–Pb mineralization in the southeastern part of the Erlandsen Land.
FCC PALSAR image map was produced for the Melville Land (2) subset (see Figure 10C) by assigning PCA2, PCA3 and PCA4 to the FCC color composites. Lithostratigraphic units depict mostly in blue (Lauge Koch Land Formation) and strong gold colors (Tureso Formation and Odins Fjord and Ymers Gletcher Formations) in the FFC image (Figure 10C). Curvilinear features such as synclines with negative flower structure and lineaments strike N110 and N70 are apparent in the northwestern and western parts of the scene (Figure 10D). Several MVT Zn–Pb mineralization localities associated with the Tureso Formation were reported in the western part of the Melville Land (2) [6]. With reference to alteration maps of the study area, some of the high potential trends (N110 and N70) (see Figure 10D) in association with dolomitization/Tureso Formation (see Figure 8F) are worthy of MVT Zn–Pb mineralization, particularly northwestern part of the Melville Land (2) subset.
For detecting specific alteration mineral assemblages associated with CD and MVT Zn–Pb mineralization, MTMF method was applied to some available spatial subsets of ASTER data covering the high potential zones in the study area. Three subsets covering the SE Citronen Fjord deposit (Hans Egede Land), SW Amundsen Land and SW Nansen Land of the trough sequences were selected for mapping alteration minerals associated with CD Zn–Pb mineralization. Three subsets of the carbonate shelf succession contain high potential zones and reported MVT Zn–Pb mineralization [6] were also selected, including the Erlandsen Land and the Melville Land (1) and (2). Several reference spectra of alteration minerals contain fundamental absorptions of transition elements (Fe2+, Fe3+ and REE), and Al-O-H, Fe-Mg-O-H, Si-O-H, S-O and CO3 were selected from ASTER USGS spectral library version 7 (spectra resampled to response functions of ASTER VNIR and SWIR bands from 0.50 to 2.5 μm) [67]. Hematite, goethite, jarosite, alunite, gypsum, chalcedony (hydrous-silica), kaolinite, muscovite, chlorite, epidote, calcite and dolomite were selected (see Figure 11A–L) for detecting the sub-pixel abundance of specific alteration mineral assemblages associated with CD and MVT Zn–Pb mineralization. Several alteration zones in the vicinity of Trolle Land Fault Zone (TLFZ) in the Citronen Fjord deposit subset (Hans Egede Land) (Figure 12A), a strip between the Odin Fjord and Heimedal Icecap, some alteration zones in the northwestern and central parts of the Amundsen Land subset (Figure 12B) and the northeastern corner and southern part (adjacent to the J.P. Koch Fjord) of the Nansen Land subset (Figure 12C) could be considered as target zones for CD Zn–Pb mineralization. Numerous high potential zones for MVT Zn–Pb mineralization could be considered in the Erlandsen Land and the Melville Land (1) and (2), which deserve detailed field checking. In particular, several dolomite and calcite zones near to Tvilum Elv valley (Figure 13A) and dolomite, calcite and hematite/goethite alteration zones adjoining to Børglum Elv and Løgum Elv in the Melville Land (Figure 13B,C)) warrant MVT Zn–Pb mineralization.
This research is the first multi-sensor remote sensing investigation that has been conducted for Zn–Pb exploration in the Franklinian Basin, North Greenland. Because of there being no available fieldwork data for this research, virtual verification was used to validate image processing results (see Table 5). High overall accuracy of the results show that the approach used in this study could be broadly applicable to other parts of Franklinian Basin and High Arctic environments for mineral exploration purposes.

6. Conclusions

The results of this research demonstrate that the application of multi-sensor remote sensing satellite data has great capability as an exploration tool for mapping potential occurrences of Zn–Pb deposits in the Franklinian Basin, North Greenland. Numerous potential zones for CD and MVT Zn–Pb deposits were identified using the combined remote sensing techniques. Several zones of gossan and clay mineral assemblages were identified in the trough sequences of the Citronen Fjord, Amundsen Land and Nansen Land that may represent potential undiscovered CD Zn–Pb deposits. A number of potential target points for MVT Zn–Pb mineralization were detected within Tureso Formation (dolostones) and/or dolomitization zones in the Erlandsen Land (SW Peary Land) and Melville Land (SE Peary Land) in the shelf-platform carbonate. These mapping results were obtained using a fusion of DPCA/ICA analysis to ferric iron, ferrous iron and clay minerals indices derived from Landsat-8 spectral bands. Using PALSAR data and implementation of the FPCS method to cross-polarized backscatter ratio images, NW–SE-trending and E–W-trending lineaments contain the high potential to host/trap CD Zn–Pb mineralization in the trough sequences were detected. Synclines with negative flower structure and lineaments strike N110 and N70 were also characterized for MVT Zn–Pb mineralization in the carbonate platform. The high potential trends in association with alteration mineral assemblages were considered as highly prospective zones in the study area. The sub-pixel abundance of hematite/goethite, chlorite/epidote, muscovite and alunite/kaolinite was detected in the CD Zn–Pb potential zones by applying MTMF method to ASTER VNIR/SWIR bands, which possibly pointed to numerous target zones for the mineralization. The association of dolomite, calcite and hematite/goethite alteration assemblages with MVT Zn–Pb mineralization was also mapped in the carbonate platform. Since this research had only used remote sensing information and virtual verification for Zn–Pb sulfide exploration in the eastern part of the Franklinian Basin, North Greenland, it is recommended that further field investigations be carried out in the highly prospective zones and other parts of the Basin with similar geologic conditions that may have potential for the mineralization. This research indicates that combined remote sensing mapping techniques can aid in identifying undiscovered Zn–Pb sulfide deposits in the High Arctic Franklinian Basin by targeting the location of alteration mineral zones and geological structures that are favorable locations and/or traps for mineral occurrences. This investigation developed a multi-sensor satellite-based remote sensing technique for mineral exploration in remote and hardly accessible zones of the High Arctic regions.

Author Contributions

A.B.P. designed the study, performed experiments, writing and analysis the data; T.-Y.S.P. supervision and funding acquisition; Y.P. supervision; J.K.H. supervision; B.Z. and B.P. writing-review, editing and providing satellite data; I.A. validation the image analysis, and M.H. supervision.

Funding

This study was conducted as a part of KOPRI research grants PE17160 and PE17050.

Acknowledgments

We are thankful to the Korea Polar Research Institute (KOPRI) for providing all the facilities for this investigation. Faculty of Engineering and Information Technology, the University of Technology Sydney, and Department of Geology, Benha University, Egypt as well as Universiti Teknologi Malaysia are also acknowledged.

Conflicts of Interest

The authors declare no conflicts of interest.

References

  1. Henriksen, N. Geological History of Greenland. Four Billion Years of Earth Evolution; Geological Survey of Denmark and Greenland: Copenhagen, Denmark, 2008; p. 272.
  2. Henriksen, N.; Higgins, A.K.; Kalsbeek, F.; Pulvertaft, T.C.R. Greenland from Archaean to Quaternary. Geol. Surv. Den. Greenl. Bull. 2009, 18, 126. [Google Scholar]
  3. Kolb, J.; Keiding, J.K.; Steenfelt, A.; Secher, K.; Keulen, N.; Rosa, D.; Stengaard, B.M. Metallogeny of Greenland. Ore Geol. Rev. 2016, 78, 493–555. [Google Scholar] [CrossRef]
  4. Sorensen, L.; Stensgaard, B.M.; Thrane, K.; Rosa, D.; Kalvig, P. Sediment-Hosted Zinc in Greenland—Reporting the Mineral Resource Assessment Workshop 29 November–1 December 2011. Dan. Grønlands Geol. Unders. Rapp. 2013, 56, 184. [Google Scholar]
  5. Rosa, D.; Schneider, J.; Chiaradia, M. Timing and metal sources for carbonate-hosted Zn-Pb mineralization in the Franklinian Basin (North Greenland): Constraints from Rb-Sr and Pb isotopes. Ore Geol. Rev. 2016, 79, 392–407. [Google Scholar] [CrossRef]
  6. Rosa, D.; Rasmussen, J.A.; Sørensen, E.V.; Kalvig, P. Reconnaissance for Mississippi Valley-Type and SEDEX Zn-Pb Deposits in the Franklinian Basin, Eastern North Greenland—Results of the 2013 Season, 2014/6; Geological Survey of Denmark and Greenland Report; Geological Survey of Denmark and Greenland: Copenhagen, Denmark, 2014; p. 41.
  7. Van der Stijl, F.W.; Mosher, G.Z. The Citronen Fjord massive sulphide deposit, Peary Land, North Greenland: Discovery, stratigraphy, mineralization and structural setting. Geol. Greenl. Surv. Bull. 1998, 179, 40. [Google Scholar]
  8. Ironbark Zinc Ltd. 2016. Available online: http://ironbark.gl/projects/greenland/washington-land/ (accessed on 24 November 2017).
  9. Ironbark Zinc Ltd. 2016. Available online: http://ironbark.gl/projects/greenland/mestersvig/ (accessed on 24 November 2017).
  10. Leverington, D.W.; Moon, W.M. Landsat-TM-Based discrimination of Lithological units associated with the Purtuniq ophiolite, Quebec, Canada. Remote Sens. 2012, 4, 1208–1231. [Google Scholar] [CrossRef]
  11. Rogge, D.; Rivard, B.; Segl, B.; Grant, B.; Feng, J. Mapping of NiCu-PGE ore hosting ultramafic rocks using airborne and simulated EnMAP hyperspectral imagery, Nunavik, Canada. Remote Sens. Environ. 2014, 152, 302–317. [Google Scholar] [CrossRef]
  12. He, J.; Harris, J.R.; Sawada, M.; Behnia, P. A comparison of classification algorithms using Landsat-7 and Landsat-8 data for mapping lithology in Canada’s Arctic. Int. J. Remote Sens. 2015, 36, 2252–2276. [Google Scholar] [CrossRef]
  13. Feng, J.; Rogge, D.; Rivard, B. Comparison of lithological mapping results from airborne hyperspectral VNIR-SWIR, LWIR and combined data. Int. J. Appl. Earth Obs. Geoinf. 2018, 64, 340–353. [Google Scholar] [CrossRef]
  14. Jakobsen, U.H. Hydrated iron sulphate occurrences at Navarana fjord, Central North Greenland. Bull. Geol. Soc. Den. 1989, 37, 175–180. [Google Scholar]
  15. Jakobsen, U.H. Geochemical stream sediment and overburden surveys of a zinc and barium-mineralized area, Freuchen Land, central North Greenland. J. Geochem. Explor. 1989, 31, 117–134. [Google Scholar] [CrossRef]
  16. Joeckel, R.M.; Wally, K.D.; Fischbein, S.A.; Hanson, P.R. Sulfate Mineral Paragenesis in Pennsylvanian Rocks and the Occurrence of Slavikite in Nebraska. Great Plains Res. 2007, 17, 17–33. [Google Scholar]
  17. Hunt, G.R.; Ashley, R.P. Spectra of altered rocks in the visible and near-infrared. Econ. Geol. 1979, 74, 1613–1629. [Google Scholar] [CrossRef]
  18. Hunt, G.R. Spectral signatures of particulate minerals in the visible and near-infrared. Geophysics 1977, 42, 501–513. [Google Scholar] [CrossRef] [Green Version]
  19. Cloutis, E.A.; Hawthorne, F.C.; Mertzman, S.A.; Krenn, K.; Craig, M.A.; Marcino, D.; Methot, M.; Strong, J.; Mustard, J.F.; Blaney, D.L.; et al. Detection and discrimination of sulfate minerals using reflectance spectroscopy. Icarus 2006, 184, 121–157. [Google Scholar] [CrossRef]
  20. Huntington, J.F. The Role of Remote Sensing in Finding Hydrothermal Mineral Deposits on Earth. Evolution of Hydrothermal Ecosystems on Earth (and Mars?); Wiley: Chichester, UK, 1996; pp. 214–234. [Google Scholar]
  21. McCausland, P.J.A.; Van der Voo, R.; Hall, C.M. Circum-Iapetus paleogeography of the Precambrian-Cambrian transition with a new paleomagnetic constraint from Laurentia. Precambrian Res. 2007, 156, 125–152. [Google Scholar] [CrossRef]
  22. Cocks, L.R.M.; Torsvik, T.H. The Palaeozoic geography of Laurentia and western Laurussia: A stable craton with mobile margins. Earth Sci. Rev. 2011, 106, 1–51. [Google Scholar] [CrossRef]
  23. Le Boudec, A.; Ineson, J.; Rosing, M.; Dossing, L.; Martineau, F.; Lecuyer, C.; Albarede, F. Geochemistry of the Cambrian Sirius Passet Lagerstatte, Northern Greenland. Geochem. Geophys. Geosyst. 2014, 15, 886–904. [Google Scholar] [CrossRef]
  24. Smith, M.P.; Rasmussen, J.A. Cambrian–Silurian development of the Laurentian margin of the Iapetus Ocean in Greenland and related areas. Geol. Soc. Am. 2008, 202, 137–167. [Google Scholar]
  25. Dawes, P.R. Precambrian–Palaeozoic geology of Smith Sound, Canada and Greenland: Key constraint to palaeogeographic reconstructions of northern Laurentia and the North Atlantic region. Terra Nova 2009, 21, 1–13. [Google Scholar] [CrossRef]
  26. Higgins, A.K.; Soper, N.J.; Leslie, A.G. The Ellesmerian and Caledonian Orogenic belts of Greenland. Polarforschung 2000, 68, 141–151. [Google Scholar]
  27. Ineson, J.R.; Peel, J.S. Geological and depositional setting of the Sirius Passet Lagerstätte (Early Cambrian), North Greenland. Can. J. Earth Sci. 2011, 48, 1259–1281. [Google Scholar] [CrossRef]
  28. Higgins, A.K. Descriptive Text to the Geological Map of Greenland, 1:500,000, Lambert Land, Sheet 9, 7; Geological Survey of Denmark and Greenland Map Series; Geological Survey of Denmark and Greenland: Copenhagen, Denmark, 2015; p. 29.
  29. Higgins, A.K.; Ineson, J.R.; Peel, J.S.; Surlyk, F.; Sønderholm, M. Lower Palaeozoic Franklinian Basin of North Greenland. Geol. Surv. Greenl. Bull. 1991, 160, 71–139. [Google Scholar]
  30. Pour, A.B.; Park, Y.; Park, T.S.; Hong, J.K.; Hashim, M.; Woo, J.; Ayoobi, I. Evaluation of ICA and CEM algorithms with Landsat-8/ASTER data for geological mapping in inaccessible regions. Geocarto Int. 2018. [Google Scholar] [CrossRef]
  31. Pour, A.B.; Park, Y.; Park, T.S.; Hong, J.K.; Hashim, M.; Woo, J.; Ayoobi, I. Regional geology mapping using satellite-based remote sensing approach in Northern Victoria Land, Antarctica. Polar Sci. 2018, 16, 23–46. [Google Scholar] [CrossRef]
  32. Pour, A.B.; Hashim, M.; Park, Y.; Hong, J.K. Mapping alteration mineral zones and lithological units in Antarctic regions using spectral bands of ASTER remote sensing data. Geocarto Int. 2017. [Google Scholar] [CrossRef]
  33. Pour, A.B.; Hashim, M.; Hong, J.K.; Park, Y. Lithological and alteration mineral mapping in poorly exposed lithologies using Landsat-8 and ASTER satellite data: North-eastern Graham Land, Antarctic Peninsula. Ore Geol. Rev. 2017. [Google Scholar] [CrossRef]
  34. Pour, B.A.; Hashim, M.; Makoundi, C.; Zaw, K. Structural Mapping of the Bentong-Raub Suture Zone Using PALSAR Remote Sensing Data, Peninsular Malaysia: Implications for Sediment-hosted/Orogenic Gold Mineral Systems Exploration. Resour. Geol. 2016, 66, 368–385. [Google Scholar] [CrossRef]
  35. Testa, F.J.; Villanueva, C.; Cooke, D.R.; Zhang, L. Lithological and hydrothermal alteration mapping of epithermal, porphyry and tourmaline breccia districts in the Argentine Andes using ASTER imagery. Remote Sens. 2018, 10, 203. [Google Scholar] [CrossRef]
  36. Safari, M.; Maghsodi, A.; Pour, A.B. Application of Landsat-8 and ASTER satellite remote sensing data for porphyry copper exploration: A case study from Shahr-e-Babak, Kerman, south of Iran. Geocarto Int. 2017. [Google Scholar] [CrossRef]
  37. Roy, D.P.; Wulder, M.A.; Loveland, T.A.; Woodcock, C.E.; Allen, R.G.; Anderson, M.C.; Helder, D.; Irons, J.R.; Johnson, D.M.; Kennedy, R.; et al. Landsat-8: Science and product vision for terrestrial global change research. Remote Sens. Environ. 2014, 145, 154–172. [Google Scholar] [CrossRef]
  38. Abrams, M.; Hook, S.; Ramachandran, B. ASTER User Handbook, Version 2. Jet Propulsion Laboratory, California Institute of Technology. 2004. Available online: http://asterweb.jpl.nasa.gov/content/03_data/04_Documents/aster_ guide_ v2.pdf (accessed on 16 October 2015).
  39. Igarashi, T. ALOS Mission requirement and sensor specifications. Adv. Space Res. 2001, 28, 127–131. [Google Scholar] [CrossRef]
  40. Cooley, T.; Anderson, G.P.; Felde, G.W.; Hoke, M.L.; Ratkowski, A.J.; Chetwynd, J.H.; Gardner, J.A.; Adler-Golden, S.M.; Matthew, M.W.; Berk, A.; et al. FLAASH, a MODTRAN4-based atmospheric correction algorithm, its application and validation. In Proceedings of the 2002 Geoscience and Remote Sensing Symposium, Toronto, ON, Canada, 24–28 June 2002; pp. 1414–1418. [Google Scholar]
  41. Research Systems, Inc. ENVI Tutorials; Research Systems, Inc.: Boulder, CO, USA, 2008. [Google Scholar]
  42. Iwasaki, A.; Tonooka, H. Validation of a crosstalk correction algorithm for ASTER/SWIR. IEEE Trans. Geosci. Remote Sens. 2005, 43, 2747–2751. [Google Scholar] [CrossRef]
  43. Sveinsson, J.R.; Benediktsson, J.A. Speckle reduction and enhancement of SAR image in the wavelet domain. In Proceedings of the 1996 International Geoscience and Remote Sensing Symposium, Lincoln, NE, USA, 31 May 1996; pp. 63–66. [Google Scholar]
  44. Sheng, Y.; Xia, Z.G. A comprehensive evaluation of filters for radar speckle suppression. In Proceedings of the 1996 International Geoscience and Remote Sensing Symposium, Lincoln, NE, USA, 31 May 1996; pp. 1559–1561. [Google Scholar]
  45. Gelautz, M.; Frick, H.; Raggam, J.; Burgstaller, J.; Leberl, F. SAR image simulation and analysis of alpine terrain. ISPRS J. Photogramm. Remote Sens. 1998, 53, 17–38. [Google Scholar] [CrossRef]
  46. Franceschetti, G.; Lanari, R. Synthetic Aperture Radar Processing; CRC Press: Boca Raton, FL, USA, 1999. [Google Scholar]
  47. Howat, I.M.; Negrete, A.; Smith, B.E. The Greenland Ice Mapping Project (GIMP) land classification and surface elevation datasets. Cryosphere 2014, 8, 1509–1518. [Google Scholar] [CrossRef]
  48. Lee, J.S. Digital Image Enhancement and Noise Filtering by Use of Local Statistics. IEEE Trans. Pattern Anal. Mach. Intell. 1980, PAMI-2, 165–168. [Google Scholar] [CrossRef]
  49. Fraser, S.J.; Green, A. A software defoliant for geological analysis of band ratios. Int. J. Remote Sens. 1987, 8, 525–532. [Google Scholar] [CrossRef]
  50. Hyvärinen, A. Independent component analysis: Recent advances. Philos. Trans. R. Soc. A 2013, 371, 20110534. [Google Scholar] [CrossRef] [PubMed]
  51. Cheng, Q.; Jing, L.; Panahi, A. Principal component analysis with optimum order sample correlation coefficient for image enhancement. Int. J. Remote Sens. 2006, 27, 3387–3401. [Google Scholar]
  52. Gupta, R.P. Remote Sensing Geology, 3rd ed.; Springer: Berlin, Germany, 2017; pp. 180–190, 235–240, 332–336. [Google Scholar]
  53. Schowengerdt, R.A. Remote Sensing: Models and Methods for Image Processing, 3rd ed.; Elsevier: Burlington, MA, USA, 2007; pp. 193–202, 229–243. [Google Scholar]
  54. Shimizu, S. Joint estimation of linear non-Gaussian acyclic models. Neurocomputing 2012, 81, 104–107. [Google Scholar] [CrossRef] [Green Version]
  55. Hyvärinen, A.; Zhang, K.; Shimizu, S.; Hoyer, P.O. Estimation of a structural vector autoregression model using non-Gaussianity. J. Mach. Learn. Res. 2010, 11, 1709–1731. [Google Scholar]
  56. Hyvärinen, A.; Karhunen, J.; Oja, E. Independent Component Analysis; John Wiley & Sons, Inc.: Hoboken, NJ, USA, 2001; pp. 1–12. [Google Scholar]
  57. Carranza, E.J.; Hale, M. Mineral mapping with Landsat Thematic Mapper data for hydrothermal alteration mapping in heavily vegetated terrain. Int. J. Remote Sens. 2002, 23, 4827–4852. [Google Scholar] [CrossRef]
  58. Gupta, R.P.; Tiwari, R.K.; Saini, V.; Srivastava, N. A simplified approach for interpreting principal component images. Adv. Remote Sens. 2013, 2, 111–119. [Google Scholar] [CrossRef]
  59. Crosta, A.P.; Souza Filho, C.R.; Azevedo, F.; Brodie, C. Targeting key alteration minerals in epithermal deposits in Patagonia, Argentina, Using ASTER imagery and principal component analysis. Int. J. Remote Sens. 2003, 24, 4233–4240. [Google Scholar] [CrossRef]
  60. Loughlin, W.P. Principal components analysis for alteration mapping. Photogramm. Eng. Remote Sens. 1991, 57, 1163–1169. [Google Scholar]
  61. Gupta, R.P.; Haritashya, U.K.; Singh, P. Mapping dry/wet snow cover in the Indian Himalayas using IRS multispectral imagery. Remote Sens. Environ. 2005, 97, 458–469. [Google Scholar] [CrossRef]
  62. Pour, B.A.; Hashim, M. Hydrothermal alteration mapping from Landsat-8 data, Sar Cheshmeh copper mining district, south-eastern Islamic Republic of Iran. J. Taibah Univ. Sci. 2015, 9, 155–166. [Google Scholar] [CrossRef]
  63. Noda, S.; Yamaguchi, Y. Estimation of surface iron oxide abundance with suppression of grain size and topography effects. Ore Geol. Rev. 2017, 83, 312–320. [Google Scholar] [CrossRef]
  64. Boardman, J.W. Leveraging the high dimensionality of AVIRIS data for improved sub-pixel target unmixing and rejection of false positives: Mixture tuned matched filtering. In Proceedings of the Summaries of the Seventh Annual JPL Airborne Geoscience Workshop, Pasadena, CA, USA, 12–16 January 1998; p. 55. [Google Scholar]
  65. Boardman, J.W.; Kruse, F.A. Analysis of imaging spectrometer data using N-dimensional geometry and a mixture-tuned matched filtering approach. IEEE Trans. Geosci. Remote Sens. 2011, 49, 4138–4152. [Google Scholar] [CrossRef]
  66. Chang, C.I. Hyperspectral Imaging: Techniques for Spectral Detection and Classification; Springer Science & Business Media: Berlin/Heidelberg, Germany, 2003; Volume 1. [Google Scholar]
  67. Kokaly, R.F.; Clark, R.N.; Swayze, G.A.; Livo, K.E.; Hoefen, T.M.; Pearson, N.C.; Wise, R.A.; Benzel, W.M.; Lowers, H.A.; Driscoll, R.L.; et al. USGS Spectral Library Version 7: U.S. Geological Survey Data Series 1035; United States Geological Survey (USGS): Reston, VA, USA, 2017; p. 61. [CrossRef]
  68. Blanchard, A.J.; Rouse, J.W. Depolarization of electromagnetic waves scattered from an inhomogeneous half space bounded by a rough surface. Radio Sci. 1980, 15, 773–779. [Google Scholar] [CrossRef]
  69. Fung, A.K.; Eom, H.J. Note on the Kirchoff rough surface solution in backscattering. Radio Sci. 1981, 16, 299–302. [Google Scholar] [CrossRef]
  70. Price, M.H. Integration of Landsat TM and SIR-C polarimetric radar for lithological mapping near Goldfield, Nevada. In Proceedings of the 13th International Conference on Applied Geologic Remote Sensing, Vancouver, BC, Canada, 1–3 March 1999; Volume 1, pp. 452–459. [Google Scholar]
  71. Eklundh, L.; Singh, A. A comparative analysis of standardised and unstandardised Principal Components Analysis in remote sensing. Int. J. Remote Sens. 1993, 14, 1359–1370. [Google Scholar] [CrossRef]
  72. Duda, R.O.; Hart, P.E. Pattern Classification and Scene Analysis, 1st ed.; John Wiley: New York, NY, USA, 1973. [Google Scholar]
  73. Crosta, A.; Moore, J. Enhancement of Landsat Thematic Mapper imagery for residual soil mapping in SW Minais Gerais State, Brazil: A prospecting case history in Greenstone belt terrain. In Proceedings of the 7th ERIM Thematic Conference: Remote Sensing for Exploration Geology, Calgary, AB, Canada, 2–6 October 1989; pp. 1173–1187. [Google Scholar]
  74. Paganelli, F.; Grunsky, E.C.; Richards, J.P.; Pryde, R. Use of RADARSAT-1 principal component imagery for structural mapping: A case study in the Buffalo Head Hills area, northern central Alberta, Canada. Can. J. Remote Sens. 2003, 29, 111–140. [Google Scholar] [CrossRef]
  75. Pal, S.K.; Majumdar, T.J.; Bhattacharya, A.K. ERS-2 SAR and IRS-1C LISS III data fusion: A PCA approach to improve remote sensing based geological interpretation. ISPRS J. Photogramm. Remote Sens. 2007, 61, 281–297. [Google Scholar] [CrossRef]
  76. Hashim, M.; Ahmad, S.; Johari, M.A.M.; Pour, A.B. Automatic lineament extraction in a heavily vegetated region using Landsat Enhanced Thematic Mapper (ETM+) imagery. Adv. Space Res. 2013, 51, 874–890. [Google Scholar] [CrossRef]
  77. King, T.V.V.; Clark, R.N. Verification of remotely sensed data. In Remote Sensing for Site Characterization; Kuehn, F., King, T., Hoerig, B., Pieters, D., Eds.; Springer: Berlin, Germany, 2000; pp. 59–61. [Google Scholar]
  78. Hall, D.K.; Riggs, G.A.; Salomonson, V.V.; DiGirolamo, N.E.; Bayr, K.J. MODIS snow-cover products. Remote Sens. Environ. 2002, 83, 1181–1194. [Google Scholar] [CrossRef]
  79. Morris, R.V.; Lauer, H.V.; Lawson, C.A.; Girson, E.K.; Nace, G.A.; Stewart, C. Spectral and other physicochemical properties of submicron powders of hematite (á-Fe2O3), maghemite (ã-Fe2O3), magnetite (Fe3O4), goethite (á-FeOOH), and lepidocrocite (ã-FeOOH). J. Geophys. Res. 1985, 90, 3126–3144. [Google Scholar] [CrossRef] [PubMed]
  80. Sherman, D.M.; Waite, T.D. Electronic spectra of Fe3+ oxides and oxide-hydroxides in the near IR to near UV. Am. Mineral. 1985, 70, 1262–1269. [Google Scholar]
  81. Yamatera, H.; Fitzpatrick, B.; Gordon, G. Near-infrared spectra of water and aqueous solutions. J. Mol. Spectrosc. 1964, 14, 268–278. [Google Scholar] [CrossRef]
  82. Thomas, M.R.; Scheraga, H.A.; Schrier, E.E. A near-infrared study of hydrogen bonding in water and deuterium oxide. J. Phys. Chem. 1965, 69, 3722–3726. [Google Scholar] [CrossRef]
  83. Buijs, K.; Choppin, G.R. Near-infrared studies of the structure of water. I. Pure water. J. Chem. Phys. 1963, 39, 2035–2041. [Google Scholar] [CrossRef]
  84. Kusky, T.M.; Ramadan, T.M. Structural controls on Neoproterozoic mineralization in the South Eastern Desert, Egypt: An integrated field, Landsat TM, and SIR-C/X SAR approach. J. Afr. Earth Sci. 2002, 35, 107–121. [Google Scholar] [CrossRef]
  85. Pour, B.A.; Hashim, M. Integrating PALSAR and ASTER data for mineral deposits exploration in tropical environments: A case study from Central Belt, Peninsular Malaysia. Int. J. Image Data Fusion 2015, 6, 170–188. [Google Scholar] [CrossRef]
  86. Bishop, J.L.; Murad, E. The visible and infrared spectral properties of jarosite and alunite. Am. Mineral. 2005, 90, 1100–1107. [Google Scholar] [CrossRef]
  87. Hunt, G.R.; Salisbury, J.W. Visible and near-infrared spectra of mineral and rocks: II. Carbonates. Mod. Geol. 1971, 2, 23–30. [Google Scholar]
  88. Gaffey, S.J. Spectral reflectance of carbonate minerals in the visible and near-infrared (0.35–2.55 microns): Calcite, aragonite, and dolomite. Am. Mineral. 1986, 71, 151–162. [Google Scholar]
  89. Crowley, J.K. Visible and near-infrared (0.4–2.5 μm) reflectance spectra of playa evaporate minerals. J. Geophys. Res. 1991, 96, 16231–16240. [Google Scholar] [CrossRef]
  90. Holmes, O.G.; McClure, D.S. Optical spectra of hydrated ions of the transition metals. J. Chem. Phys. 1957, 26, 1686–1694. [Google Scholar] [CrossRef]
  91. Leach, D.L.; Bradley, D.C.; Houston, D.; Pisarevsky, S.A.; Taylor, R.D.; Gardoll, S.J. Sediment-hosted lead-zinc deposits in earth history. Econ. Geol. 2010, 105, 593–625. [Google Scholar] [CrossRef]
  92. Christie, R.L.; Peel, J.S. Cambrian-Silurian stratigraphy of Børglum Elv, Peary Land, eastern North Greenland. Rapp. Grønlands Geol. Unders. 1977, 82, 48. [Google Scholar]
  93. Mars, J.C.; Rowan, L.C. Regional mapping of phyllic- and argillic-altered rocks in the Zagros magmatic arc, Iran, using Advanced Spaceborne Thermal Emission and Reflection Radiometer (ASTER) data and logical operator algorithms. Geosphere 2006, 2, 161–186. [Google Scholar] [CrossRef]
  94. Pour, B.A.; Hashim, M. Identifying areas of high economic-potential copper mineralization using ASTER data in Urumieh-Dokhtar Volcanic Belt, Iran. Adv. Space Res. 2012, 49, 753–769. [Google Scholar] [CrossRef]
  95. Bengaard, H.J.; Henriksen, N. Geology 1:500000 Peary Land; Geological Survey of Greenland: Copenhagen, Denmark, 1984.
  96. Pedersen, S.A.S. Regional geology and thrust fault tectonics in southern part of the North Greenland Fold Belt, North Peary Land. Rapp. Grønlands Geol. Unders. 1980, 99, 79–87. [Google Scholar]
  97. Efenberger, H.; Mereiter, K.; Znmalllr, J. Crystal structure refinements of magnesite, calcite, rhodochrosite, siderite, smithonite, and dolomite, with discussion of some aspects of the stereochemistry of calcite type carbonates. Z. Kristaltogr. 1981, 156, 233–243. [Google Scholar]
  98. Burns, R.G. Mineralogical Applications of Crystal Field Theory; Cambridge University Press: London, UK, 1970. [Google Scholar]
  99. Reeder, R.J. Crystal chemistry of the rhombohedral carbonates. In Carbonates: Mineralogy and Chemistry, Mineralogical Society of America Reviews in Mineralogy; Reeder, R.J., Ed.; Mineralogical Society of America: Chantilly, VA, USA, 1983; Volume 11, pp. 1–47. [Google Scholar]
  100. Thurmond, A.K.; Abdelsalam, M.G.; Thurmond, J.B. Optical-radar-DEM remote sensing data integration for geological mapping in the Afar Depression, Ethiopia. J. Afr. Earth Sci. 2006, 44, 119–134. [Google Scholar] [CrossRef]
  101. Muskett, R.R. L-Band InSAR penetration depth experiment, North Slope Alaska. J. Geosci. Environ. Prot. 2017, 5, 14–30. [Google Scholar] [CrossRef]
Figure 1. Geological map of Greenland showing the locations of different types of mineralization (modified from [2,3]). The magenta rectangle locates the area of the study.
Remotesensing 10 01186 g001
Figure 2. Simplified geological map of the Greenlandic part of the Franklinian Basin showing the distribution of known Zn–Pb occurrences. Inset: location of the Franklinian Basin within the wider context of Greenland and Arctic Canada. Abbreviations to zinc occurrences: BE = Børglum Elv; CF = Citronen Fj; C = Cass Fj; HB = Hand Bugt; KB = Kayser Bjerg; KL = Kronprins Christian Land; KS = Kap Schuchert; KW = Kap Wohlgemuth; LE = Løgum Elv; NF = Navarana Fj; P = Petermann; RH = Repulse Havn; TE = Tvillum Elv (modified from [3]).
Remotesensing 10 01186 g002
Figure 3. Stratigraphic N–S section of the Franklinian Basin showing transition from shallow-water carbonate shelf to deep-water, sand-and silt-dominated in the trough (Early Cambrian to Silurian) and stratigraphic positions of Zn–Pb occurrences (abbreviations in Figure 2). The development of the basin divided into seven stages; (S) indicates shelf deposits and (T) trough deposits (modified from [3,5,27]).
Remotesensing 10 01186 g003
Figure 4. An overview of the methodological flowchart used in this study and performance characteristics of image processing analysis.
Remotesensing 10 01186 g004
Figure 5. Laboratory reflectance spectra of the selected endmember minerals in the wavelength region from 0.4–2.5 μm extracted from the USGS spectral library version 7.0 [67] for performing MTMF. (A) hematite; (B) goethite; (C) jarosite; (D) alunite; (E) gypsum; (F) chalcedony (hydrous-silica); (G) kaolinite; (H) muscovite; (I) chlorite; (J) epidote; (K) calcite; and (L) dolomite. Absorption features of the spectra annotate for the endmember minerals.
Remotesensing 10 01186 g005aRemotesensing 10 01186 g005b
Figure 6. Mosaic of the Landsat-8 (b3 − b6/b3 + b6), (b4/b2) and (b6/b7) ratio images as RGB color composites. It shows a regional view of the eastern part of the Franklinian Basin and selected spatial subsets for detailed mineralogical mapping.
Remotesensing 10 01186 g006
Figure 7. ICA images of Landsat-8 spatial subset scenes considered for CD Zn–Pb mineralization. (A) ICA2 image showing ferric iron oxide/hydroxide minerals (gossan) for the subset of Citronen Fjord Zn–Pb deposit; (B) ICA5 image showing clay minerals for the subset of Citronen Fjord Zn–Pb deposit; (C) ICA2 image showing ferric iron oxide/hydroxide minerals (gossan) for the subset of the Amundsen Land; (D) ICA5 image showing clay minerals for the subset of the Amundsen Land; (E) ICA5 image showing ferric iron oxide/hydroxide minerals (gossan) for the subset of the Nansen Land; (F) ICA3 image showing clay minerals for the subset of the Nansen Land.
Remotesensing 10 01186 g007
Figure 8. ICA image maps of Landsat-8 spatial subset scenes considered for MVT Zn–Pb mineralization. (A) RGB image map of ICA5, ICA4 and ICA3 for the subset of the Erlandsen Land, SW Peary Land; (B) ICA3 image showing dolostones (Tureso Formation) for the subset of the Erlandsen Land, SW Peary Land; (C) RGB image map of ICA5, ICA4 and ICA3 for the subset of the Melville Land (1), SE Peary Land; (D) ICA3 image showing dolostones (Tureso Formation) for the subset of the Melville Land (1), SE Peary Land; (E) RGB image map of ICA5, ICA4 and ICA3 for the subset of the Melville Land (2), SE Peary Land; (F) ICA3 image showing dolostones (Tureso Formation) for the Melville Land (2), SE Peary Land. Lithostratigraphic units are abbreviated as TU = Tureso Formation, OY = Odins Fjord and Ymers Gletcher Formations, L = Lauge Koch Land Formation, BI = Bistrup and Bronlund Formations, BR = Børglum River Formation, BU = Buen Formation, M = Merqujoq Formation, and W = Wulff Land Formation. Zn mineralization localities point by red arrows.
Remotesensing 10 01186 g008
Figure 9. (A) FCC image map of PCA2, PCA3 and PCA5 for the PALSAR subset of the Amundsen Land; (B) NW–SE (135°) directional filter image derived from PCA2 for the subset of the Amundsen Land; (C) FCC image map of PCA2, PCA3 and PCA4 for the PALSAR subset of the Nansen Land; (D) NW–SE (135°) directional filter image derived from PCA2 for the subset of the Amundsen Land. Lithostratigraphic units are abbreviated as Pm = Polkorridoren Group, VG = Volvedal Group, ME = Merqujoq Formation; AG = Amundsen Land Group, Qa = Quaternary alluvium, and PS = Paradisfjeld Group.
Remotesensing 10 01186 g009
Figure 10. (A) FCC image map of PCA2, PCA3 and PCA5 for the PALSAR subset of the Erlandsen Land; (B) E–W (90°) directional filter image derived from PCA2 for the subset of the Erlandsen Land; (C) FCC image map of PCA2, PCA3 and PCA4 for the PALSAR subset of the Melville Land (2); (D) E–W (90°) directional filter image derived from PCA2 for the subset of the Melville Land (2). Referee to Figure 8 for lithostratigraphic unit abbreviations.
Remotesensing 10 01186 g010
Figure 11. Laboratory reflectance spectra of the selected alteration minerals resampled to response functions of ASTER VINR/SWIR bands (0.50–2.5 μm) [67]. (A) hematite; (B) goethite; (C) jarosite; (D) alunite; (E) gypsum; (F) chalcedony (hydrous-silica); (G) kaolinite; (H) muscovite; (I) chlorite; (J) epidote; (K) calcite; and (L) dolomite. Cubes show the location of the ASTER VINR/SWIR bands (B1 to B9) from 0.50–2.5 μm.
Remotesensing 10 01186 g011
Figure 12. Alteration mineral maps derived from the Matched Filter (MF) score rule images for selected ASTER spatial subsets in the trough sequences. (A) SE Citronen Fjord deposit (Hans Egede Land); (B) SW Amundsen Land; and (C) SW Nansen Land.
Remotesensing 10 01186 g012
Figure 13. Alteration mineral maps derived from the MF score rule images for selected ASTER spatial subsets in the carbonate shelf platform. (A) Erlandsen Land; (B) the Melville Land (1); and (C) the Melville Land (2).
Remotesensing 10 01186 g013
Table 1. The evolution stages of the Franklinian Basin, North Greenland [1,2,4,27,28,29].
Stages and TimeDescription of the Events
(Stage 1): Basin initiation, Late Proterozoic-Early Cambrian shelfThe first stage records the initial subsidence and transgression of the Proterozoic basement in North Greenland. The earliest known phase of Franklinian Basin development was manifested by the Skagen Group, the Portfjeld Formation, and its basinal equivalent, the Paradisfjeld Group.
(Stage 2): Early Cambrian platform and incipient troughIn the second stage, a clear differentiation into the shelf and deep-water sequences took place. The shelf is represented by the Portfjeld Formation and the Paradisfjeld Group represents the trough sequence.
(Stage 3): Early Cambrian siliciclastic shelf and turbidite troughThe third stage is characterized by siliciclastic shelf sediments of the Buen Formation and the contemporaneous deep-water basinal facies of the Polkorridoren Group.
(Stage 4): Late Early Cambrian-Middle Ordovician shelf and starved troughDuring the fourth stage, the shelf area was influenced by differential subsidence and uplift in eastern North Greenland. A progradational shelf occurred in the eastern part (Bronlund Fjord and Tavsens Iskappe Groups), while the western part was characterized by aggradational shelf with uniform subsidence (Ryder Gletscher Group). The trough expanded southward during this stage with deposition of the Volvedal Group, which is a sequence of alternating dark mudstone and turbiditic sandstones.
(Stage 5): Middle Ordovician-Early Silurian aggradational carbonate platform, starved slope and troughIn the fifth stage, carbonate deposition continued on the platform in the south with Morris Bugt Group in western areas and with the Børglum River, Tureso and Ymers Gletscher Formations in eastern areas. The Navarana Fjord escarpment pronounced the shelf-slope boundary with E–W trending lineament in this stage. A very thin sequence of siliciclastic sediments containing cherts and cherty shales with units of siltstones and mudstones accumulated on the slope. A thick sequence of mainly fine-grained sediments (mudstones, cherts and thin turbiditic units) was deposited in the trough to the north that is called the Amundsen Land Group.
(Stage 6): Early Silurian ramp and rimmed shelf, and turbidite troughDuring the sixth stage, the trough sedimentation changed abruptly by vast amounts of incoming sandy turbidites of the Peary Land Group (the Sydgletscher and Merqujoq Formations), which were derived from the rising Caledonian mountains to the east. Carbonate beds in the southeastern areas are Odins Fjord Formation and Merqujoq Formation consisting of turbidites, mudstones and conglomerates that are accumulated in the trough.
(Stage 7): Final drowning of the platformThe seventh stage was manifested by a dramatic southward expansion of the trough. Onlapping turbidites buried the Navarana Fjord escarpment and widespread subsidence affected former shelf areas. The shelf areas of the previous stage were inundated by trough mudstones and siltstones, which formed the middle and upper part of the Peary Land Group. Carbonate deposition such as Samuelsen Hoj and Hauge Bjerge Formations was preserved solitary nearby major mound complexes.
Table 2. The technical characteristics of Landsat-8 and ASTER (A) [37,38] and PALSAR (B) [39].
(A)
SensorsSubsystemBand NumberSpectral Range (μm)Ground Resolution (m)Swath Width (km)
Landsat-8 OLIVNIR1–50.433–0.45330185
0.450–0.515
0.530–0.590
0.640–0.670
0.850–0.880
SWIR6–71.570–1.650
2.100–2.290
Pan0.500–0.68015
9-cirus1.360–1.380
Landsat-8 TIRSTIR10–1110.60–11.19100
11.50–12.51
ASTERVNIR1–30.52–0.601560
0.63–0.69
0.78–0.86
SWIR4–91.600–1.70030
2.145–2.185
2.185–2.225
2.235–2.285
2.295–2365
2.360–2.430
TIR10–148.125–8.47590
8.475–8.825
8.925–9.275
10.25–10.95
10.95–11.65
(B)
SensorModePolarizationResolution (m)Swath Width (km)Incident Angle
PALSARFineHH or VV/HH + HV or VV + VH10708–60°
ScanSarHH or VV100250–35018–43°
PolarimetricHH + HV + VH + VV30308–30°
The Operational Land Imager (OLI), the Thermal Infrared Sensor (TIRS), the visible near-infrared (VNIR), the shortwave infrared (SWIR) and the thermal-infrared (TIR) are abbreviated. PALSAR is L-band Synthetic Aperture Radar (SAR) sensor with 1270 MHz frequency and 28/14 MHz bandwidth. Polarizations are abbreviated as HH, horizontally transmitted and horizontally received; HV, horizontally transmitted and vertically received; VV, vertically transmitted and vertically received; VH, vertically transmitted and horizontally received.
Table 3. Eigenvector matrix of the band ratio indices derived from the principal component analysis to Landsat-8 datasets, selected spatial subset scene covering (A) Citronen Fjord deposit, Peary Land, (B) Amundsen Land, (C) Nansen Land, (D) Erlandsen Land, SW Peary Land, (E) Melville Land (1), SE Peary Land, and (F) Melville Land (2), SE Peary Land.
(A): Citronen Fjord Deposit
EigenvectorNDSIFerric IronFerrous IronClay MineralsTRLI
PCA 1−0.2489950.0223590.2703830.0260840.929362
PCA 2−0.449862−0.9546220.087607−0.020442−0.076644
PCA 3−0.139884−0.142827−0.147766−0.0515190.243142
PCA 4−0.1269120.678411−0.9383320.084164−0.019658
PCA 50.0094990.0931380.042679−0.9945670.015802
(B): Amundsen Land
EigenvectorNDSIFerric IronFerrous IronClay MineralsTRLI
PCA 1−0.1446740.0260920.1400850.0214510.978930
PCA 2−0.310738−0.8165470.046363−0.022945−0.047966
PCA 3−0.060980−0.041690−0.087255−0.0427860.134313
PCA 4−0.0891310.622405−0.7595370.074379−0.038210
PCA 5−0.0745640.072406−0.003048−0.630491−0.017355
(C): Nansen Land
EigenvectorNDSIFerric IronFerrous IronClay MineralsTRLI
PCA 1−0.313084−0.0011320.2771890.0215110.908119
PCA 2−0.884485−0.0916980.251914−0.013363−0.381626
PCA 3−0.334195−0.018621−0.028886−0.9267170.168310
PCA 4−0.0675840.6341410.769234−0.018707−0.035021
PCA 5−0.0584020.7675340.023479−0.637811−0.011237
(D): Erlandsen Land
EigenvectorNDSIFerric IronFerrous IronClay MineralsTRLI
PCA 1−0.4463690.0114870.3058150.0207380.840636
PCA 2−0.871682−0.1001850.044474−0.023256−0.477090
PCA 3−0.164212−0.179254−0.929786−0.1040610.256069
PCA 4−0.1177480.920551−0.1954000.316859−0.011834
PCA 5−0.0097700.3320910.042610−0.942232−0.001983
(E): Melville Land (1)
EigenvectorNDSIFerric IronFerrous IronClay MineralsTRLI
PCA 1−0.483910−0.083361−0.158394−0.034662−0.855916
PCA 2−0.858643−0.1310550.031143−0.0297880.493659
PCA 30.055166−0.015630−0.986442−0.0114250.153344
PCA 4−0.1252320.581423−0.0275810.803323−0.013253
PCA 50.099180−0.7984850.0106510.593677−0.004319
(F): Melville Land (2)
EigenvectorNDSIFerric IronFerrous IronClay MineralsTRLI
PCA 1−0.646158−0.101926−0.163191−0.029627−0.737958
PCA 2−0.719106−0.112894−0.128019−0.0014280.673610
PCA 30.1872190.092925−0.9678400.1363390.031790
PCA 4−0.0505110.0096670.1297620.989881−0.025543
PCA 5−0.1666280.9839400.058537−0.025834−0.001908
Table 4. Eigenvector matrix of the cross-polarized backscatter ratio images provides to the principal component analysis for PALSAR datasets, selected spatial subset scene covering (A) Amundsen Land, (B) Nansen Land, (C) Erlandsen Land, SW Peary Land, and (D) Melville Land (2), SE Peary Land.
(A): Amundsen Land
EigenvectorHH/HVHH + HVHH − HVHH + (HH + HV)/HVHH + (HH − HV)/HV
PCA1−0.000060−0.640746−0.341302−0.486288−0.486294
PCA 20.000412−0.3922270.915559−0.063139−0.062639
PCA 3−0.0019120.6600010.212755−0.510181−0.508769
PCA 40.2114120.0008040.0005280.690400−0.691847
PCA 5−0.977395−0.0012430.0001050.150336−0.148649
(B): Nansen Land
EigenvectorHH/HVHH + HVHH − HVHH + (HH + HV)/HVHH + (HH − HV)/HV
PCA1−0.000058−0.631934−0.371496−0.480953−0.480972
PCA20.000054−0.2874700.927380−0.169570−0.169034
PCA3−0.0016810.7197350.044229−0.490343−0.489476
PCA40.9930230.0012210.0000490.082493−0.084251
PCA50.117907−0.000199−0.000381−0.7019180.702431
(C): Erlandsen Land
EigenvectorHH/HVHH + HVHH − HVHH + (HH + HV)/HVHH + (HH − HV)/HV
PCA1−0.000014−0.673859−0.297858−0.478121−0.478116
PCA 20.000179−0.3198800.942540−0.068286−0.068059
PCA 3−0.0011150.6660260.151323−0.516741−0.516225
PCA 40.5153690.0005700.0001740.605502−0.606434
PCA 5−0.856968−0.0005800.0001090.364806−0.364036
(D): Melville Land (2)
EigenvectorHH/HVHH + HVHH − HVHH + (HH + HV)/HVHH + (HH − HV)/HV
PCA10.0000010.6448670.3363940.4852750.485276
PCA 2−0.0007250.449737−0.8930320.0107670.010643
PCA 3−0.0020580.6179640.298885−0.514441−0.513940
PCA 40.9999050.001601−0.0000290.008562−0.010667
PCA 50.013597−0.000159−0.000184−0.7068730.707210
Table 5. Confusion matrix for the detected pixel spectra versus image processing results.
Image AnalysisDetected Pixel Spectra
GosClayDolomiG/HKao/AluCaMuCh/EpDoGypAccuracyCommissionOmission
Gos (Landsat-8)6374 84.1417.4621.25
Clay (Landsat-8)13506 72.4638.0016.70
Dolomi (L-8)4350 87.7214.0016.70
G/H (ASTER) 2401060080.0029.1720.00
Kao/Alu (ASTER) 1253300083.3328.0016.70
Ca (ASTER) 1422100073.3327.2726.70
Mu (ASTER) 0122501083.3316.0016.70
Ch/Ep (ASTER) 4020222173.3340.9126.66
Do (ASTER) 0001021284.0014.2916.00
Gyp (ASTER) 0000212288.0013.6412.00
Total8060 6030303030302525
Landsat-8: Overall accuracy = 81.50% and Kappa Coefficient = 0.74; Gos = gossan, Clay = clay minerals, Dolomi = dolomitization. ASTER: Overall accuracy = 80.00% and Kappa Coefficient = 0.64; G/H = goethite/hematite, Kao/Alu = kaolinite/alunite, Ca = calcite, Mu = muscovite, Ch/Ep = chlorite/epidote, Do = dolomite, Gyp = gypsum.

