Air Pollution Scenario over China during COVID-19


1
Department of Geography, School of Global Studies, University of Sussex, Brighton BN19RH, UK
2
School of Marine Sciences, Nanjing University of Information Science and Technology, Nanjing 210044, China
*
Author to whom correspondence should be addressed.
Remote Sens. 2020, 12(13), 2100; https://doi.org/10.3390/rs12132100
Submission received: 4 June 2020
/
Revised: 25 June 2020
/
Accepted: 29 June 2020
/
Published: 30 June 2020
Abstract
:The unprecedented slowdown in China during the COVID-19 period of November 2019 to April 2020 should have reduced pollution in smog-laden cities. However, moderate resolution imaging spectrometer (MODIS) satellite retrievals of aerosol optical depth (AOD) show a marked increase in aerosols over the Beijing–Tianjin–Hebei (BHT) region and most of Northeast and Central China, compared with the previous winter. Fine particulate (PM2.5) data from ground monitoring stations show an increase of 19.5% in Beijing during January and February 2020, and no reduction for Tianjin. In March and April 2020, a different spatial pattern emerges, with very high AOD levels observed over 50% of the Chinese mainland, and including peripheral regions in the northwest and southwest. At the same time, ozone monitoring instrument (OMI) satellite-derived NO2 concentrations fell drastically across China. The increase in PM2.5 while NO2 decreased in BTH and across China is likely due to enhanced production of secondary particulates. These are formed when reductions in NOx result in increased ozone formation, thus increasing the oxidizing capacity of the atmosphere. Support for this explanation is provided by ground level air quality data showing increased volume of fine mode aerosols throughout February and March 2020, and increased levels of PM2.5, relative humidity (RH), and ozone during haze episodes in the COVID-19 lockdown period. Backward trajectories show the origin of air masses affecting industrial centers of North and East China to be local. Other contributors to increased atmospheric particulates may include inflated industrial production in peripheral regions to compensate loss in the main population and industrial centers, and low wind speeds. Satellite monitoring of the extraordinary atmospheric conditions resulting from the COVID-19 shutdown could enhance understanding of smog formation and attempts to control it.
1. Introduction
The Beijing–Tianjin–Hebei (BTH) region of Northern China is one of the most economically productive regions in China, generating over 10% of GDP. It comprises the cities of Beijing and Tianjin, and one province, Hebei, and had a total population of 111 M in 2015. Its wealth is founded upon coal production and fossil fuel-based industries. The six provinces around Beijing burn 30% of China’s coal, which is more than the EU and the USA put together [1], and coal comprised 64% of China´s fuel mix in 2018 [2]. The rapid economic growth of the BTH region has come at the expense of pervasive air pollution, which is a well-known threat to society and the economy. The number of motor vehicles increased from 1.1 M in 1996 to 5.61 M in 2020 [1]. The wearing of facemasks on the streets of Beijing during frequent heavy pollution episodes is a common sight, and vehicular traffic has been cited as a major cause of the frequent heavy smog suffered by pedestrians. In 2013 the Chinese government announced new driving restrictions to tackle air pollution. Li et al. [3] examined air quality relative to subway density in Beijing and found a 7.7% reduction in Beijing’s air quality index (AQI) in areas surrounding new subway lines, due to reduced car commuting, and Zhang et al. [4] found mobile sources to be the greatest contributor to regional haze events in Beijing. These studies suggest the major role of vehicular traffic in air quality control. While government pollution control policies appear to have improved air quality in Beijing and Tianjin [5,6,7], pervasive pollution is still evident across a much larger surrounding region, as demonstrated by Yuan and Yang’s [8] report of significant worsening in other cities of the BTH region.
This study investigates regional air quality indicators over the BTH region and other parts of China during the winter of 2019–2020, when the COVID-19 outbreak in China caused greatly reduced transport and economic activity from November 2019 to February 2020. The lockdown in Wuhan, the epicenter of the virus, began on January 23, while those in Beijing and other parts of China started approximately two weeks later, with easing of restrictions toward the end of March. In Beijing, unusually light vehicle traffic and reduced industrial and economic activities were observed in February [9] as people stayed at home due to the virus. Many sources reported few cars on the usually congested streets, and the volume of truck traffic fell by 77% and bus travel by 39% [9]. Coal usage following the Chinese New Year in late February 2020 was reported to be 25% lower for several weeks and did not recover to normal levels for over two months [1]. During this period, air quality would be expected to have significantly improved. This study uses satellite-based observations to investigate the impact of COVID-19 control measures on air quality over Beijing and other parts of China. The satellite products used were tropospheric retrievals of aerosol optical depth (AOD) from the MODIS DT/DB product, and NO2 from the ozone monitoring instrument (OMI), showing seasonal, weekly, and monthly concentrations over China. The periods covered are the 2018–2019 winter of normal economic activity and that of 2019–2020, corresponding to the COVID-19 period. Apart from vehicle and industrial emissions, another cause of high AOD levels across Northern China including the BHT region is dust storms, which are most common between March and June. Only one dust storm in the Taklimakan desert of Northwest China on March 20 2020 was reported during the study periods in 2018, 2019, and 2020 [10]. HYSPLIT backward trajectory data over China, for days of high AOD and PM2.5 levels in February and March 2020 (Figure S1), show air flows to be mainly local.
In an 18-year study of AOD levels over China during the period of operation of the MODIS sensor, Filonchyk et al. [11] report high annual average values in the high population centers of Eastern China, with a decrease westwards. Three main regions of frequently high AOD values above 0.6 (550 nm) are reported as the North China Plain including the BTH region, and the Yangtze and Pearl River Delta (PRD) regions. In comparison, annual average AOD at 550 nm from AERONET ground stations for other world regions are reported as 0.38 for Paris, 0.51 for Hong Kong [12], 0.14 for North America, and 0.2 for Northern Europe [13].
2. Data Used and Methodology
Evaluation of air quality over BTH during the COVID-19 economic slowdown of 2019–2020 was conducted by comparison of tropospheric aerosol and NO2 concentrations with the same months of the previous winter of 2018–2019. The satellite data products used were the DTB aerosol optical depth (AOD) products (MYD04) from the aqua moderate resolution imaging spectrometer (MODIS) and OMI AOD (OMIARUV v003) from the ozone monitoring instrument (OMI). The OMI NO2 (OMNO2d V003) product was also used. The MODIS combined DTB AOD retrievals were used, as they are generated using high quality assured AOD retrievals, and they combine the dark target (DT) [14] and deep blue (DB) retrievals [15]. The DTB algorithm was developed to increase the spatial coverage as the DT retrieves best over dark surfaces, performing poorly over bright urban areas [16,17].
In the present study, the MODIS Level 3 daily aerosol product at 1-degree resolution was used to generate maps of monthly spatial distributions from GIOVANNI (https://giovanni.gsfc.nasa.gov/giovanni/). Accuracy of the DTB AOD retrievals depends on the performance of the DT and DB AOD retrievals [16,17]. As a preliminary enquiry, to evaluate the performance and reliability of the MODIS DTB AOD product for indicating ground level aerosols over Beijing, we compared the DTB AOD retrieval with PM2.5 ground station data for February and March 2020 (Figure S2). The scatterplot shows an R value of 0.81, indicating a high correlation between MODIS DTB and ground-level fine particulate (PM2.5) levels. In addition, Table S1 shows that AOD levels recorded by both AERONET and MODIS were significantly higher in February and March 2020 than in 2019.
Ground-level data on fine particulate (PM2.5) levels in Beijing (average of 12 stations), Tianjin (average of 15 stations), Nanning (average of 8 stations), and Urumqi (average of 7 stations) were obtained from the China National Environmental Monitoring Center (CNEMC). The land cover type surroundings of the stations are given in Table 1.
3. Results
3.1. Changes in AOD Levels across China for the Whole COVID-19 Period, November 2019 to April 2020
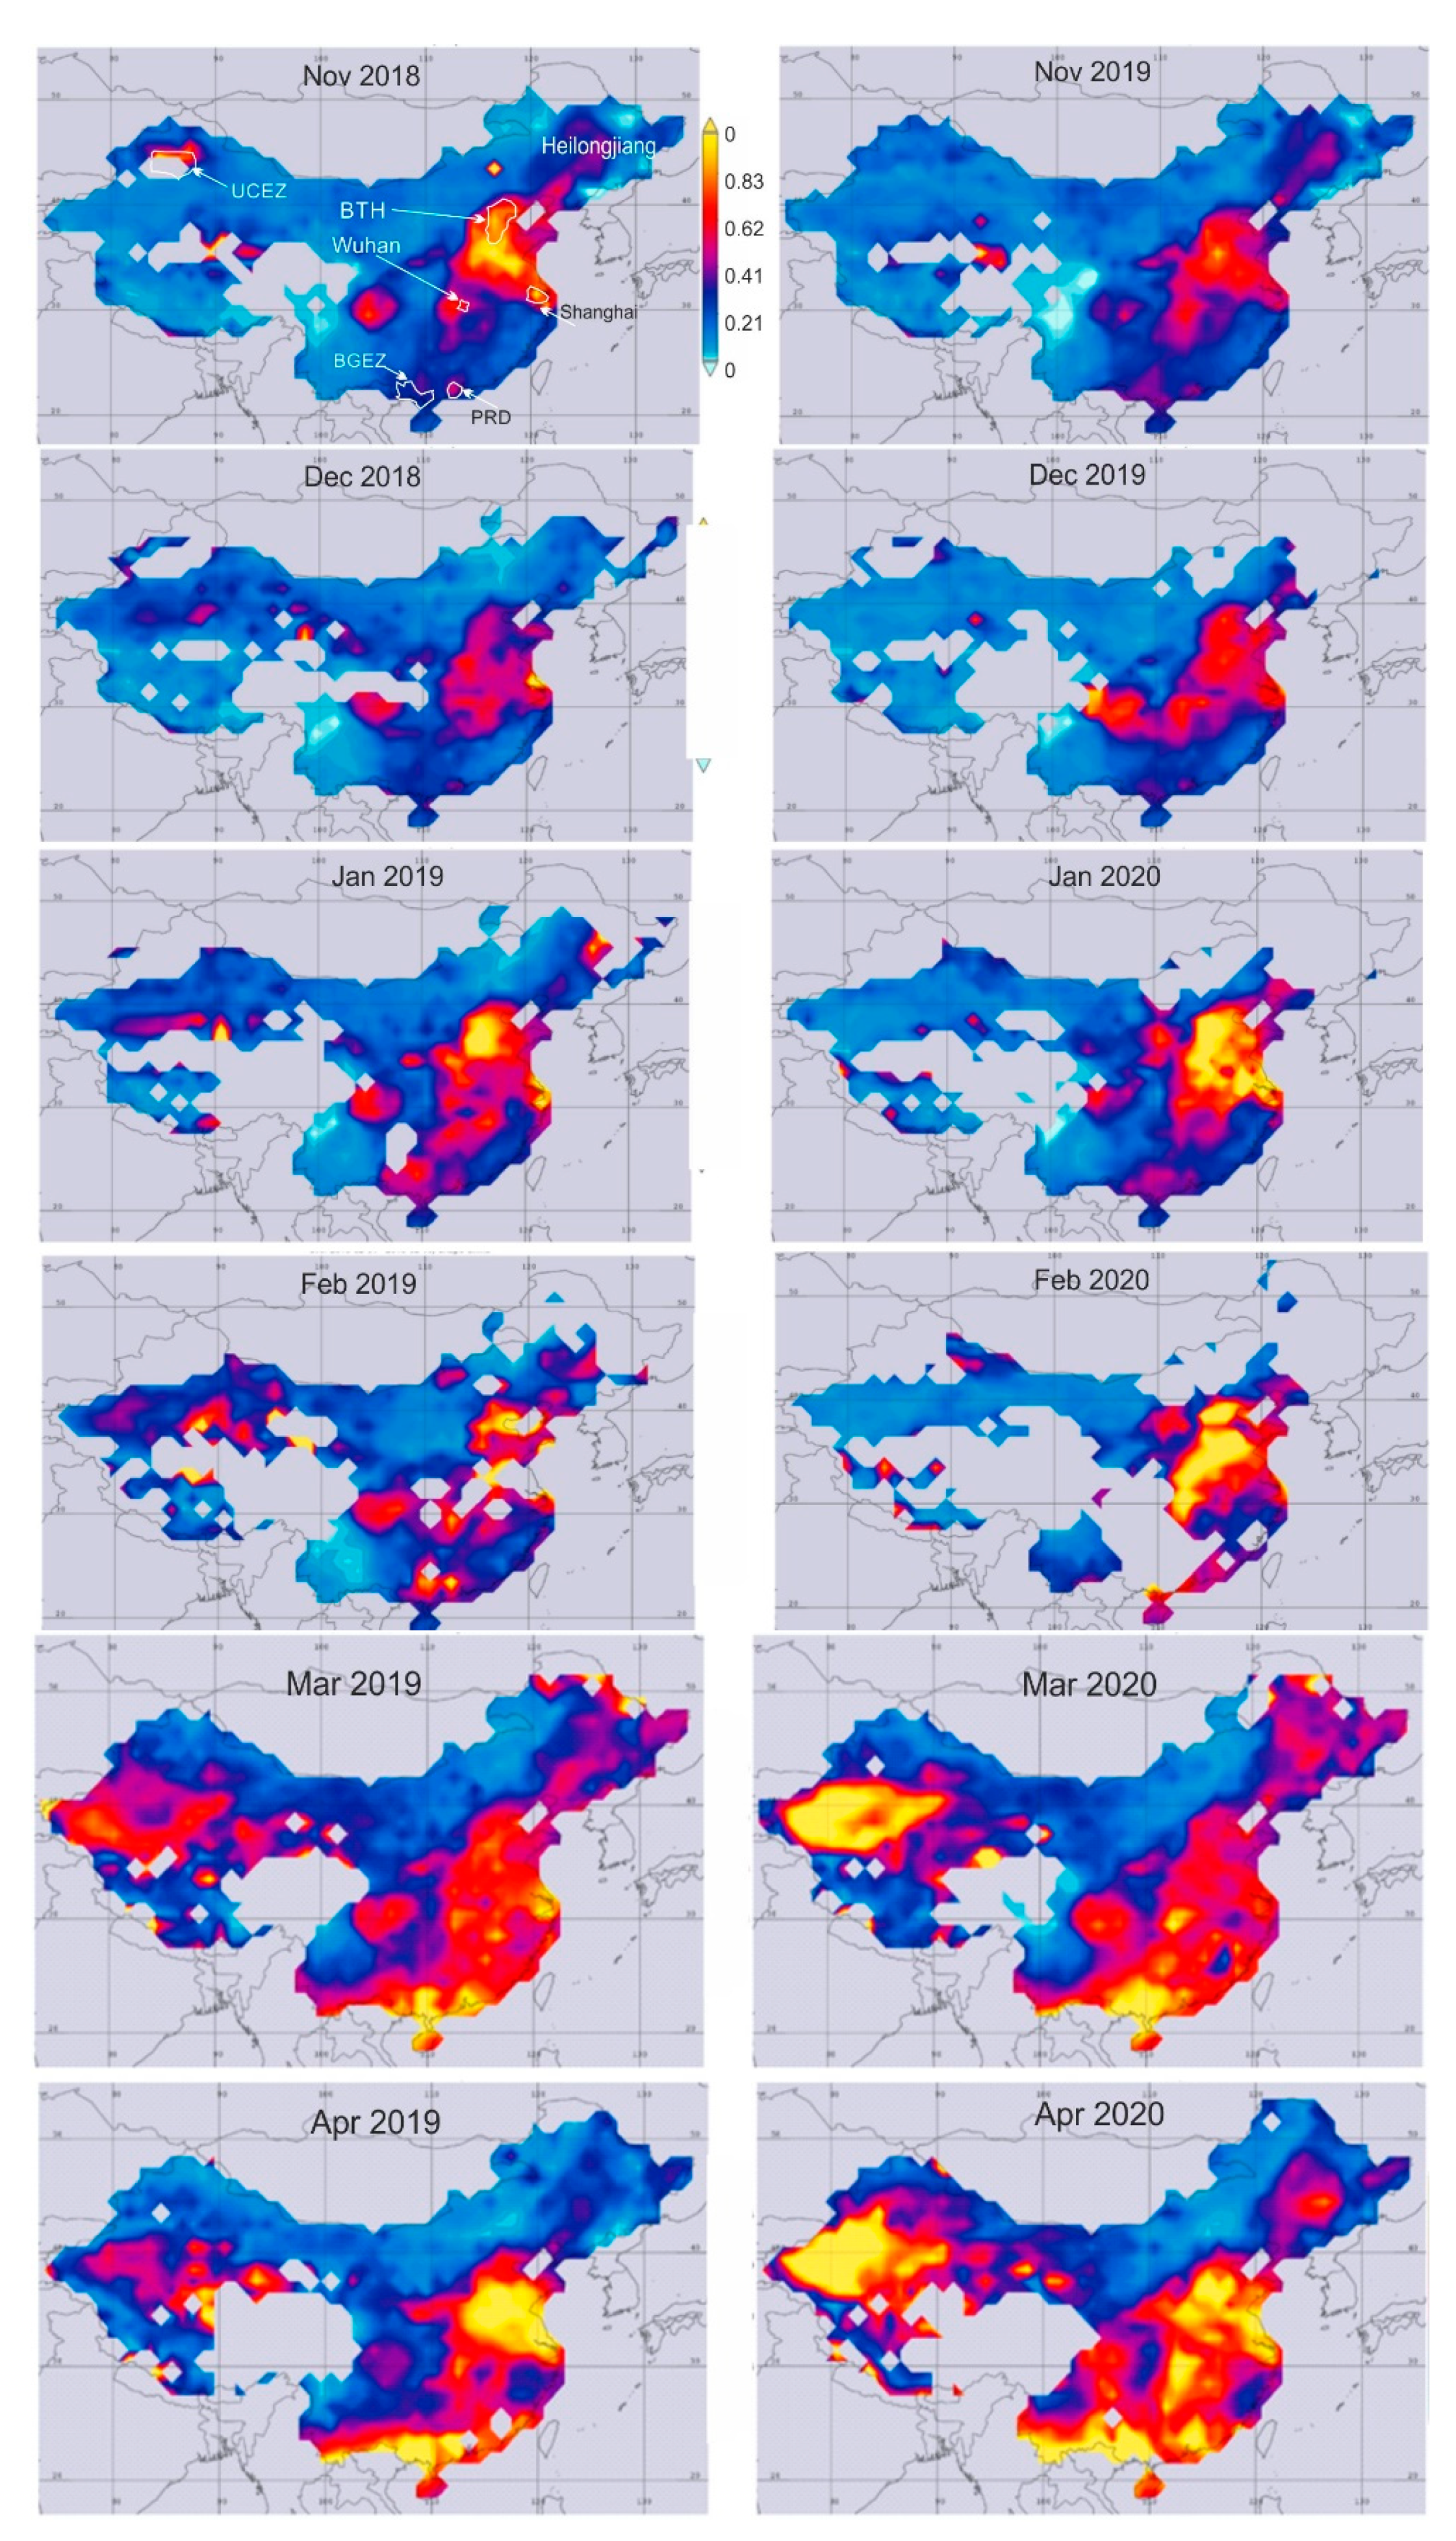
Figure 1 shows the monthly AOD from Aqua MODIS for the four months of November to February, comparing the winters of 2018–2019 (left) and 2019–2020 (right). All images show a wide range of AOD levels across China, from near zero in the west to above 0.8 in the east, mirroring the increase in population and industrial activity from west to east. Particularly high levels consistently above 0.6 occur over a large area of Northeastern China corresponding to the North China Plain and incorporating the BTH region. The top two images showing November of 2018 (left) and 2019 (right) indicate a slight decline in AOD from significantly above 0.6 to around 0.6 in 2019. However, for December 2019 a marked increase is observed compared with December 2018. This increase continues into January and February 2020, where AOD levels increase to above 0.8, and over a much larger area, than in the previous corresponding months. This area of very high AOD extends to cover most of Eastern China including Shanghai and the Yangtze estuary, extending approximately 1500 km north-south, and 1000 km east-west. A different pattern of AOD across China emerged in March 2020. In March, a slight decline in AOD levels is seen over the BTH region compared to the previous year (Figure 1), but very significant increases in AOD are seen over other very large peripheral regions, including the Urumqi–Chiangji Economic Zone (UCEZ) in Xinjiang Province in China´s northwest, in the Beibu Gulf Economic Zone (BGEZ) in the far south, and some increase is observed in the northeastern province of Heilongjiang (Figure 1 top left sub-figure). In April these trends of increasing AOD levels over peripheral regions of China accelerated, compared with the previous year, as well as with previous months of 2020. Thus, in April, even higher AOD levels were observed, and over much larger areas, such that AOD above approximately 0.6 was observable over most of China, and AOD > 0.8 was seen over approximately 15–20% of the country.
Table 2 summarizes the fine particulate (PM2.5) and NO2 concentrations from 12, 15, 8, and 7 air quality monitoring stations in Beijing, Tianjin, Nanning, and Urumqi respectively, comparing between January to March 2019 and January to March 2020. At the time of writing, no data were available for April 2020. Overall, fine particulate (PM2.5) concentrations increased slightly in Beijing, and showed very small and insignificant declines in Tianjin and Nanning. Urumqi showed a substantial decline of 20%, although even with a 20% decline, Urumqi´s PM2.5 levels were still approximately four times EU health guidelines. The Table shows substantial declines in March for all stations. If March is excluded from the changes, a substantial relative percentage increase of 19.5% was reported for Beijing during January and February, no change in Tianjin and Nanning, and only a small decrease (−8.7%) in Urumqi. These PM2.5 data to a large extent follow the trends for satellite AOD levels (Figure 1), which represent total tropospheric particulate concentrations. Increased AOD over BTH region in January and February 2020, especially, was supported by PM2.5 ground measurements, as well as the slight decline in March. However, for the UCEZ in Northeast China, with extremely high, and much increased AOD levels in March 2020 compared to 2019, the PM2.5 ground data showed a substantial decline from March 2019 to March 2020, perhaps suggesting dust as the main AOD source.
3.2. Changes in NO2 Levels across China for the Whole COVID-19 Period, November 2019 to April 2020
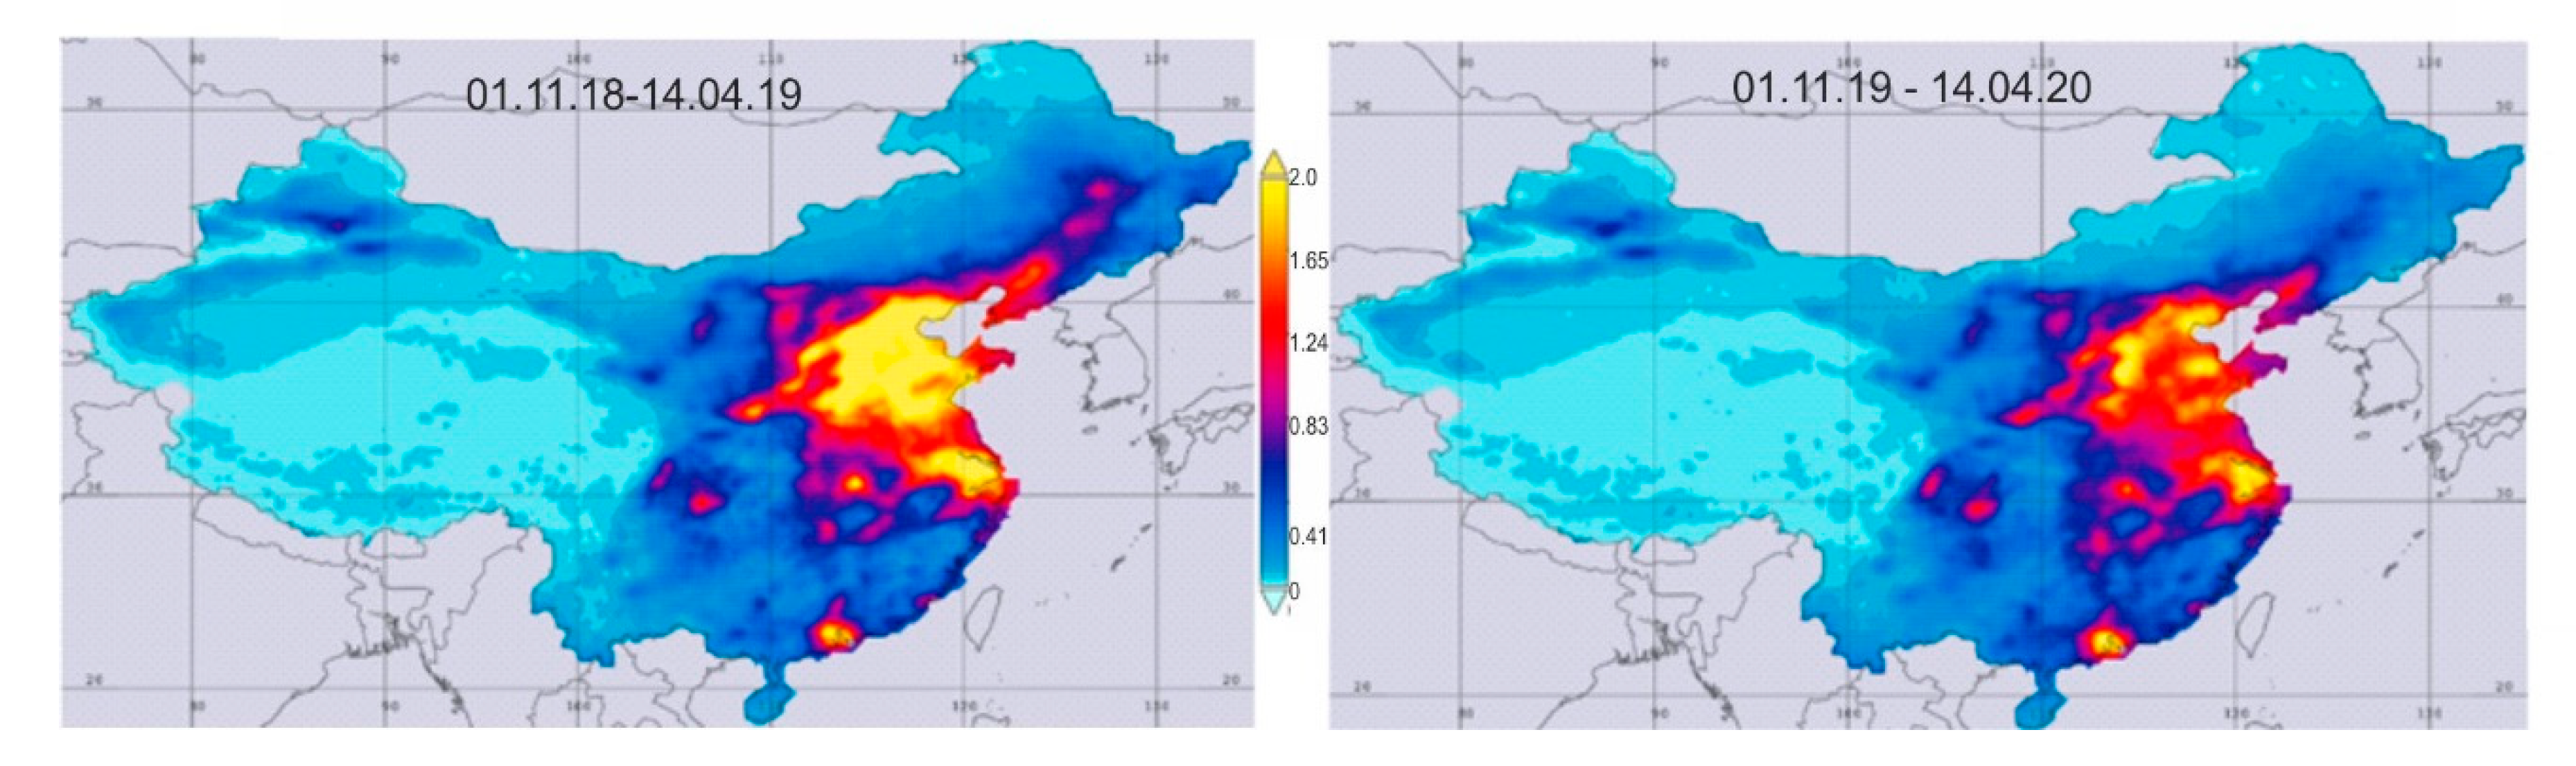
Figure 2 compares the OMI NO2 images across the whole 5-month COVID-19 period, with the previous winter period. These show an opposite trend to the AOD images, with a general decrease in NO2 concentrations between the winters of 2018–19 and 2019–2020 (Figure 3). There is an outlier, i.e., the PRD region in the south, which shows no apparent decline, but inspection of the monthly images (Figure 3) shows this to be an artefact of the temporal-compositing process. It is due to persistent cloud cover in the south, thus no data of PRD were available from February to April 2020.
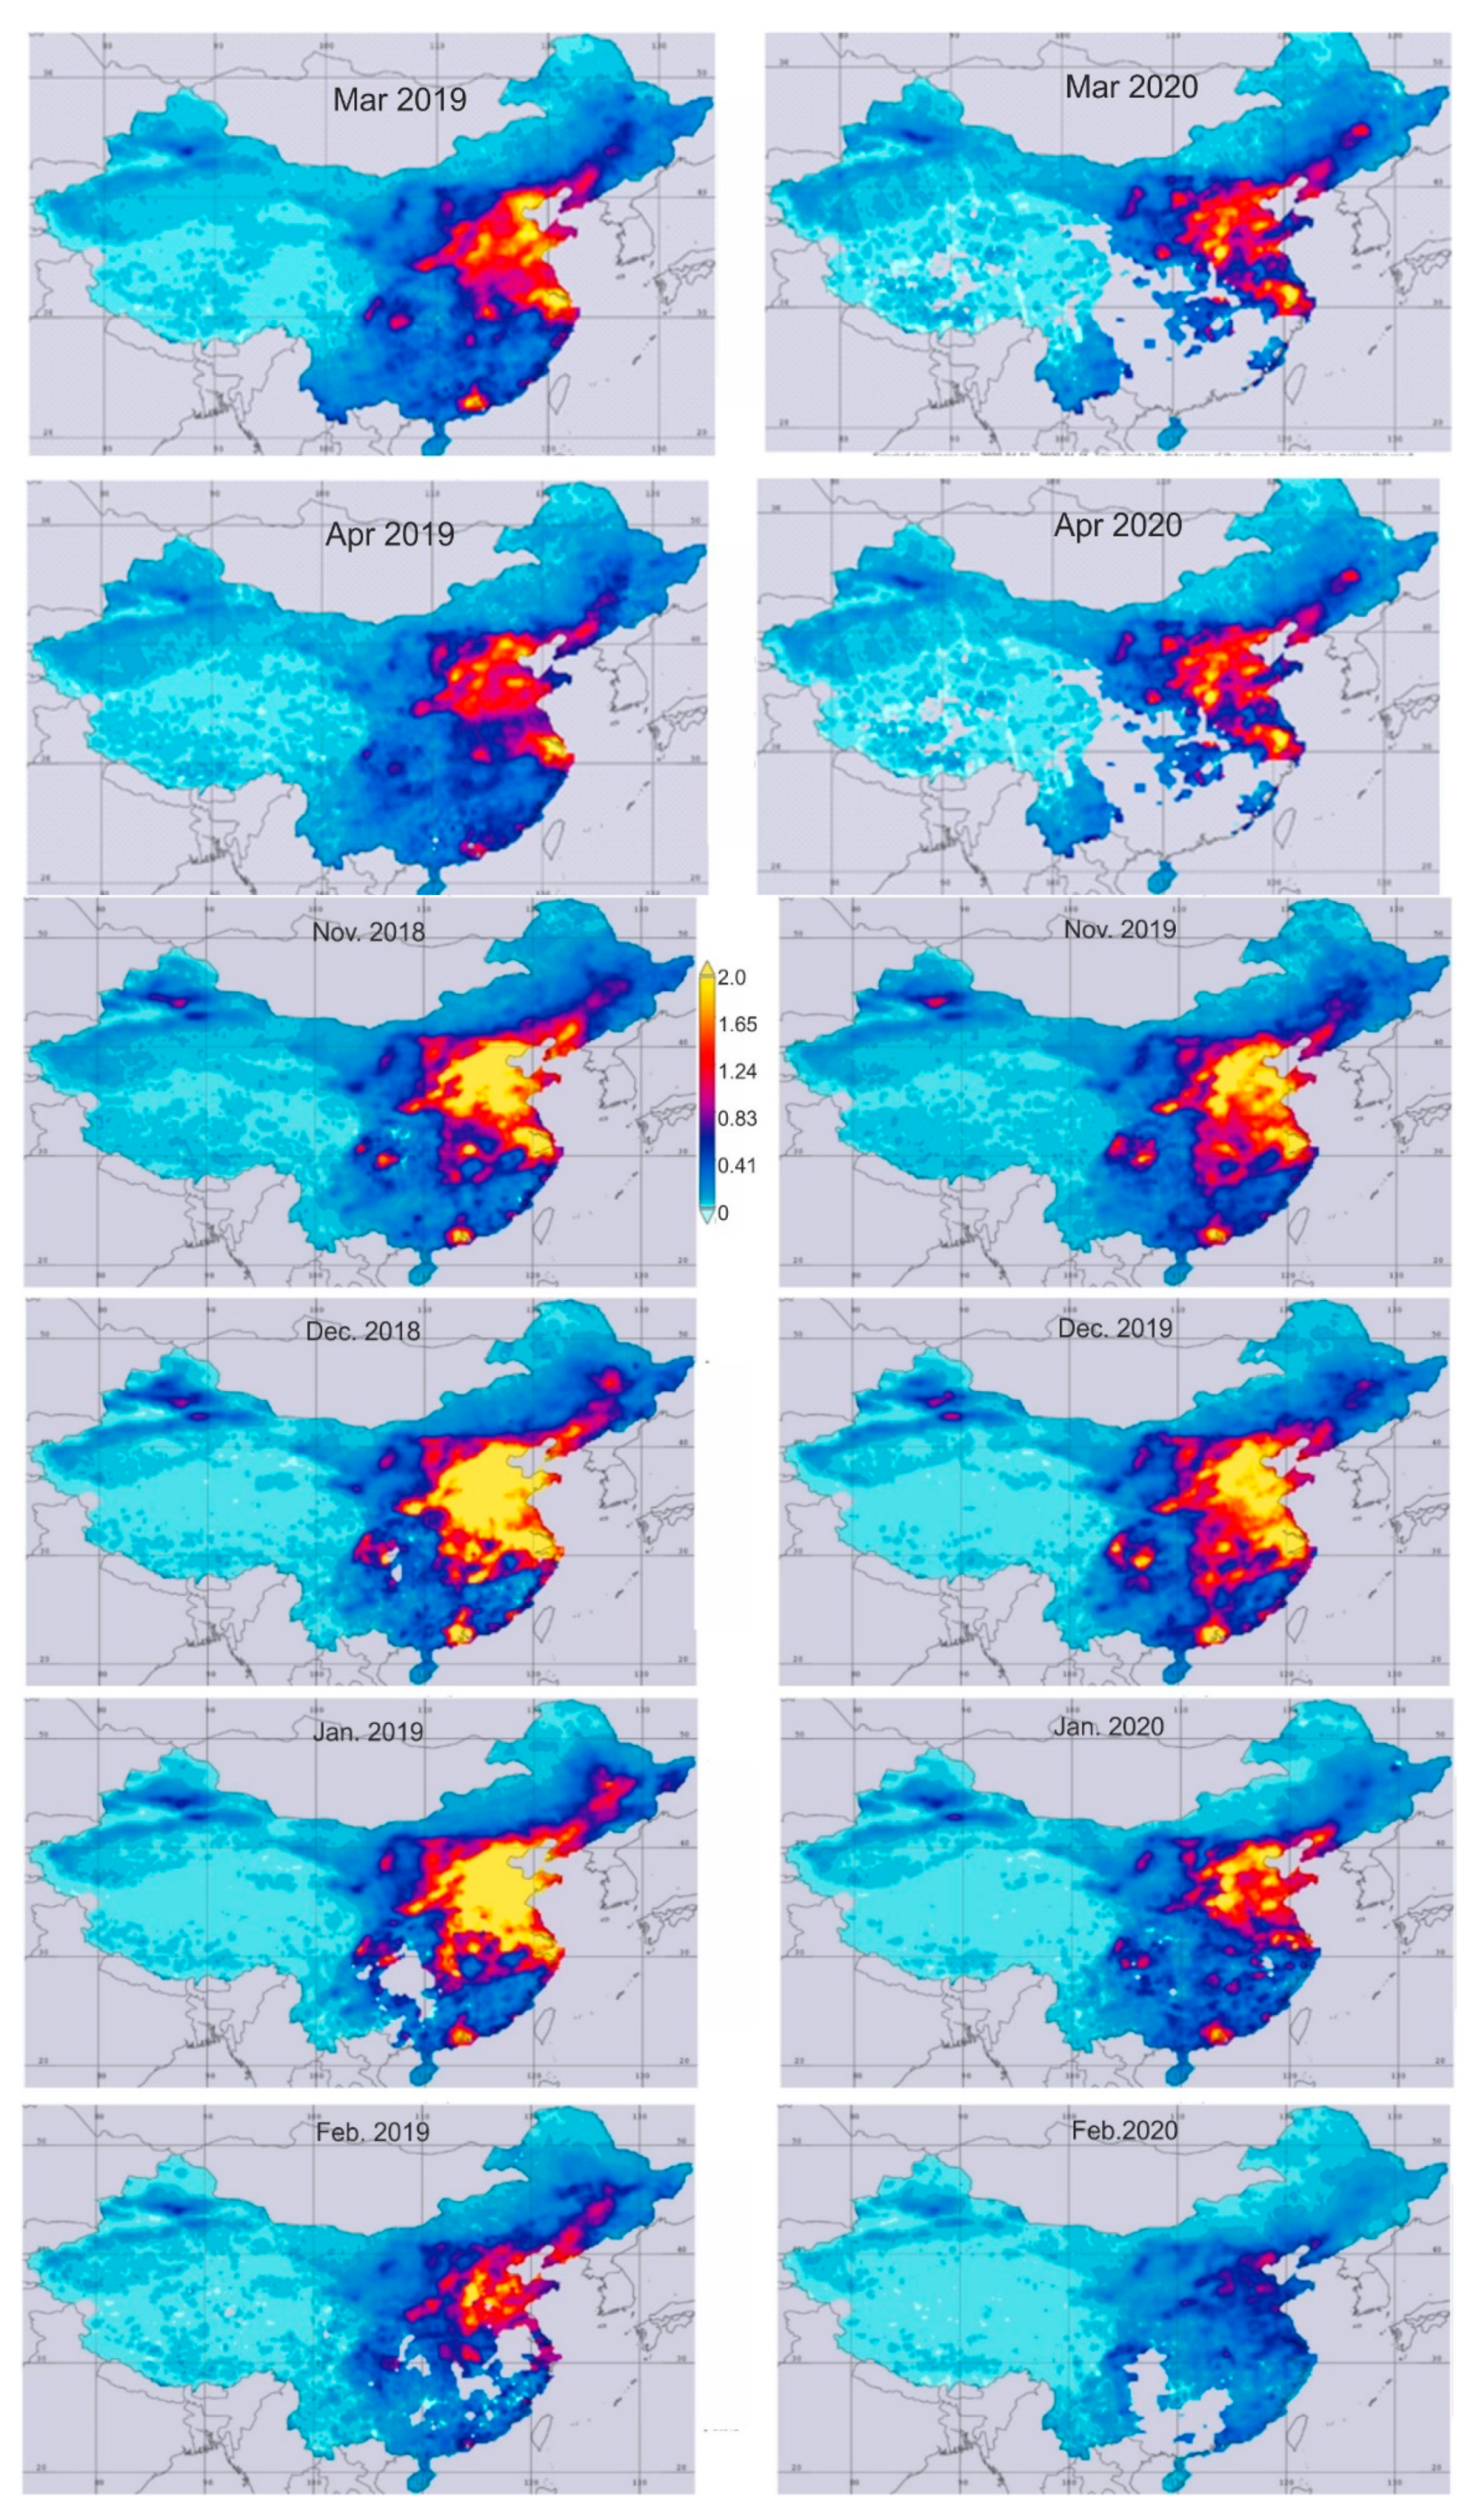
The individual monthly images (Figure 3) show the monthly trend during the period. A marked decline in tropospheric NO2 concentrations was seen in the BTH region since the beginning of 2020, with an approximate 60% decrease during January, and an 80% decrease in February 2020, compared with 2019. This decrease was seen across the whole of the BTH to the Shanghai region of Eastern China. However, March and April saw a progressive and strong recovery back to approximately normal levels.
Table 3 generally supports the satellite-retrieved NO2 observations, with greatly reduced NO2 at ground level between January to March 2019 and the same period in 2020. The greatest reduction (of −45%) was seen in Wuhan.
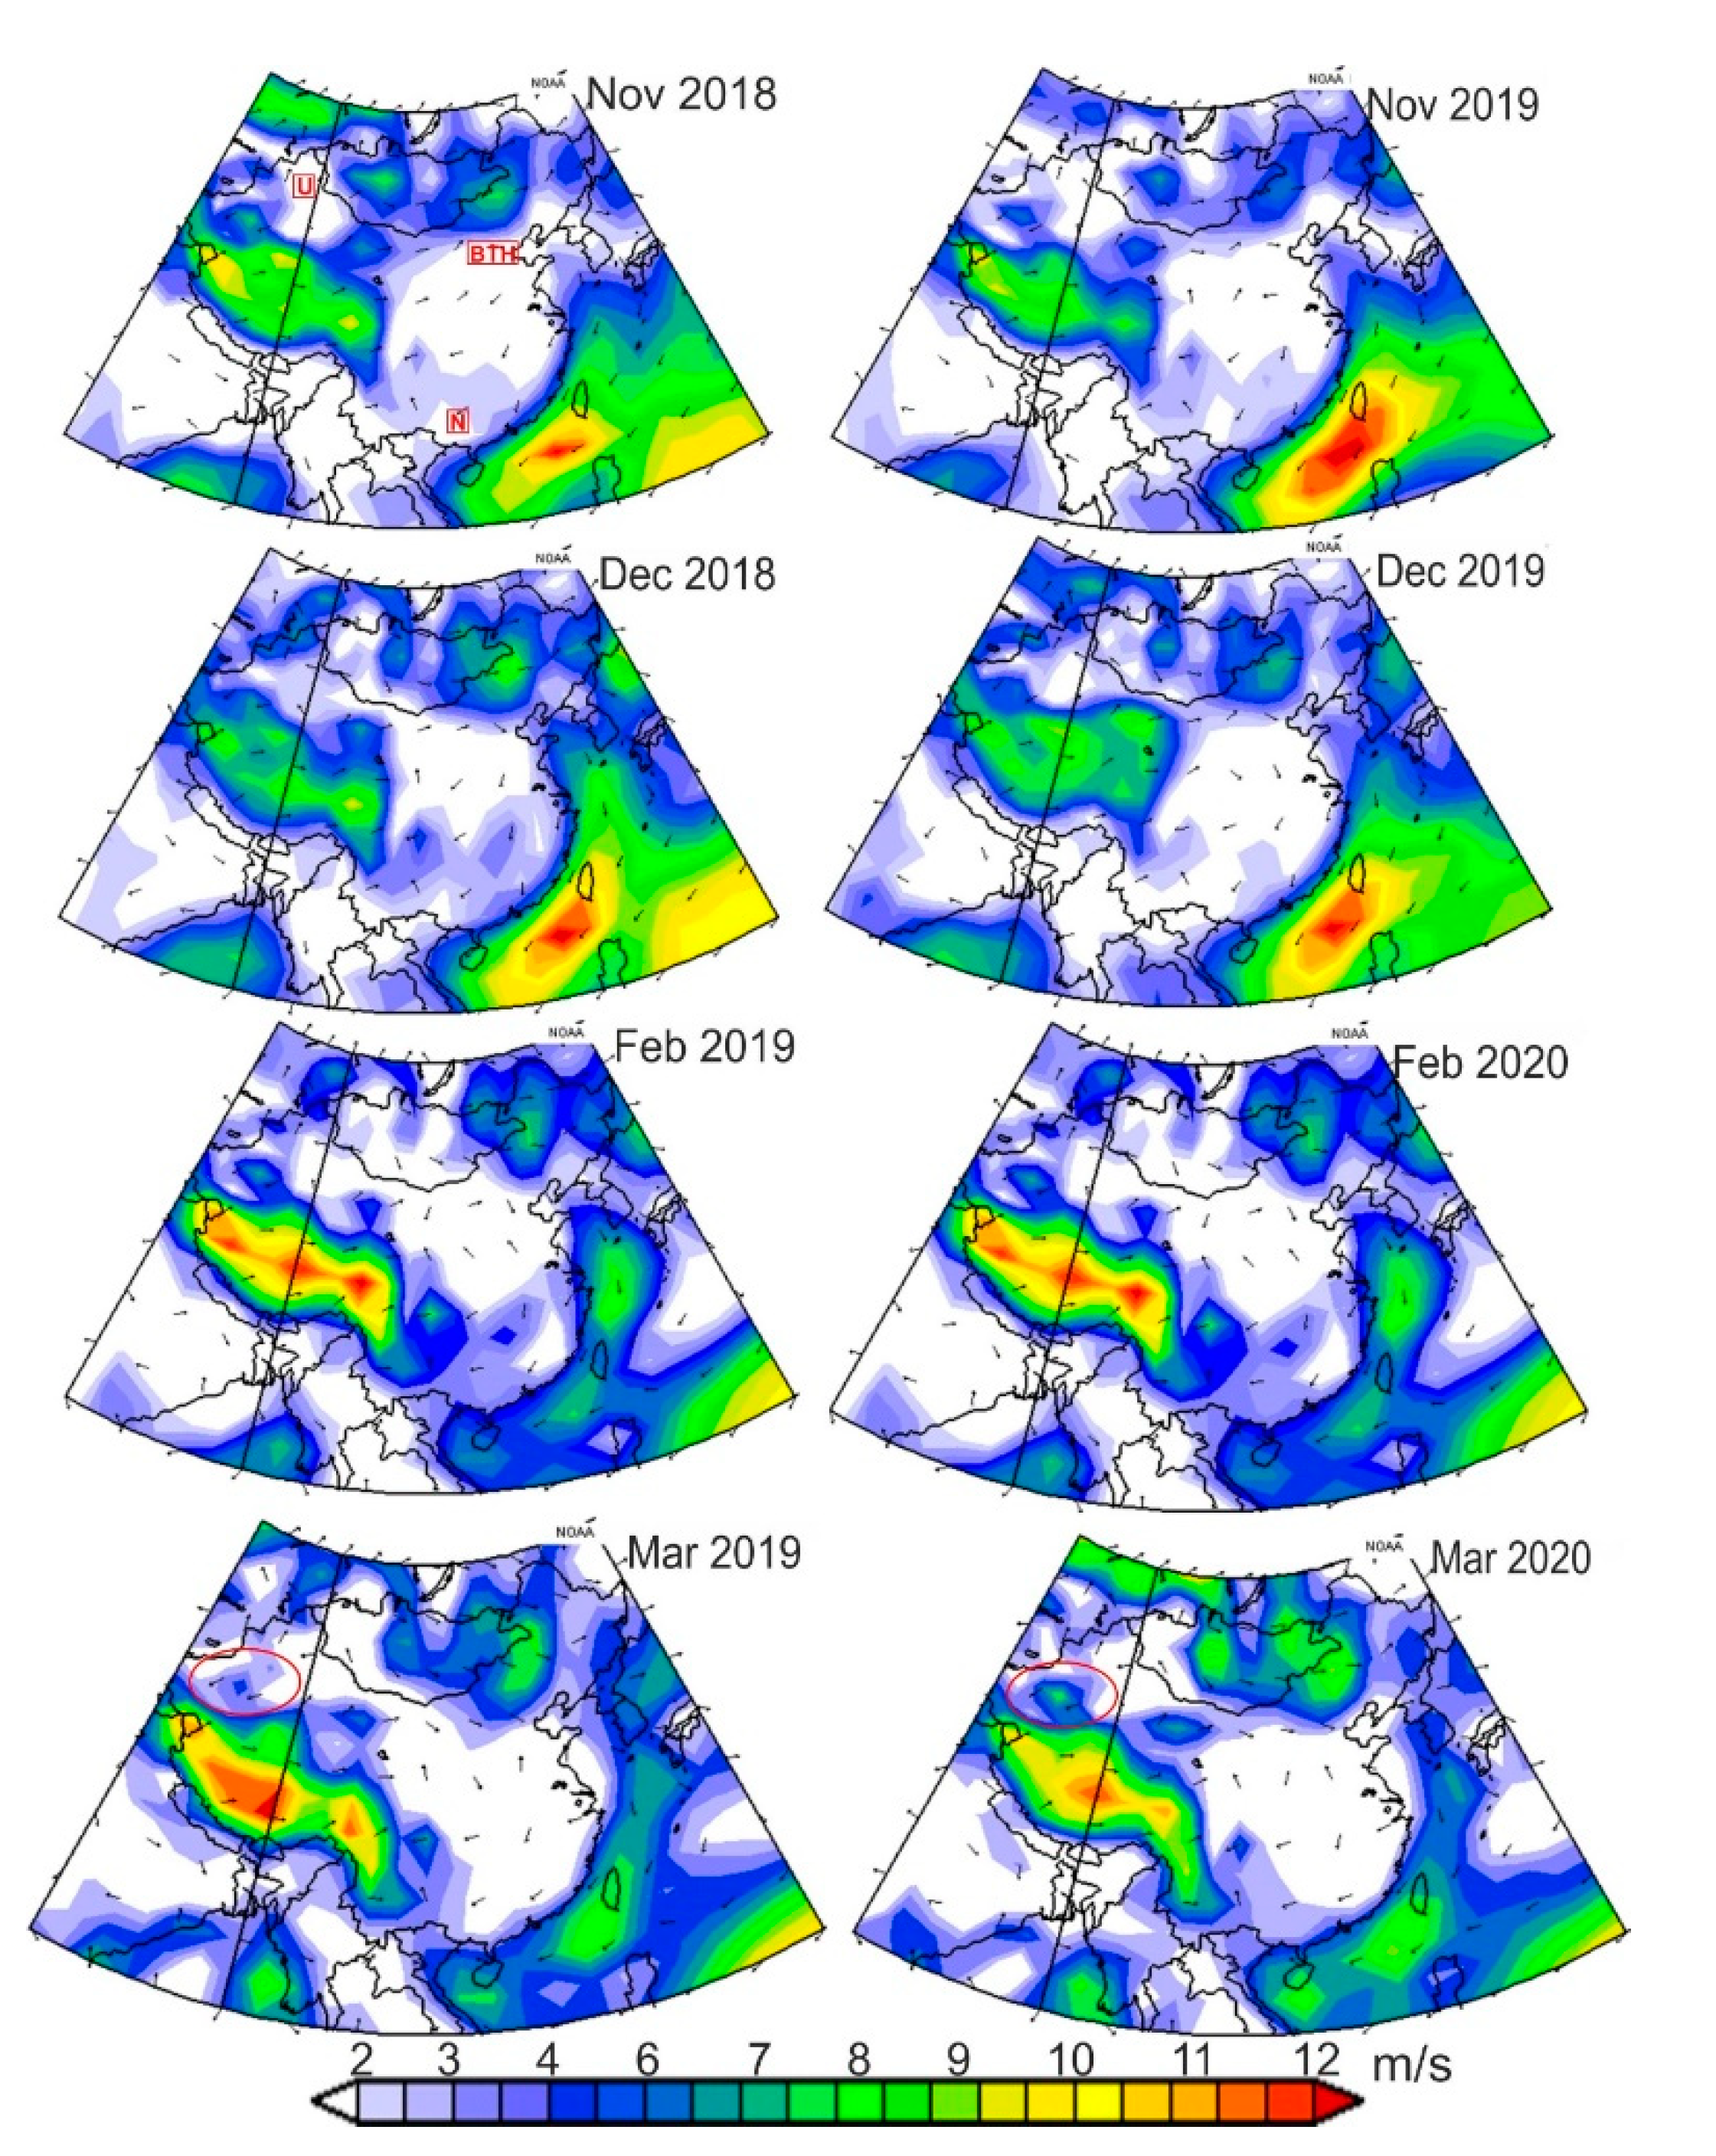
Since air quality is closely linked to large scale air circulation patterns, Figure 4 shows the mean surface wind speeds over China during the COVID-19 period and the previous winter. It indicates that winter is dominated by outward air flow due to a static high-pressure system. White areas on Figure 4 are classified as “calm” to “light air” on the Beaufort scale, defined as “smoke rises vertically (calm)”, or “direction is shown by smoke drift but not by wind vanes (light air)”. Comparison of surface wind speeds with corresponding months in the previous year, showed negligible differences in all four months shown. Taking February as an example, wind speeds were similar in 2019 and 2020, although significantly higher AOD levels were seen over BTH region and extensive parts of Northeast China. The only significant difference was seen over the Taklimakan desert areas of Northwest China in March, where average wind speeds over the month increased from 2–5 m/s in 2019 to 3–8 m/s in 2020.
4. Discussion
The data presented here indicate an increase in columnar aerosol (AOD) levels in the BTH region during the COVID-19 period from December 2019 to February 2020, and similar levels in March and April. The January and February images actually showed increase in the spatial extent of very high AOD levels above 0.8, despite reports of greatly reduced economic activity during the COVID-19 period. As wind speeds appeared similar to those of the previous year, it appears unlikely that differences in long-range transport could explain the increased AOD. Backward trajectory data for February and March 2020 (Figure S2) also showed mainly local air flows on days of high particulate concentrations over BHT. The satellite observations of vastly increased, very high levels of AOD during the COVID-19 slowdown were supported by ground station data showing a marked fine particulate (PM2.5) increase in Beijing and Tianjin in the BTH region. Furthermore, the high correlation between MODIS AOD and PM2.5 suggests that ground level PM2.5 and AOD tended to have similar sources and contributors during the lockdown, and that MODIS AOD could well represent the surface-level pollution over the region.
The OMI satellite observations showed a sharp 70–80% decrease in tropospheric NO2 levels between December 2019 and February 2020, and by approximately 40% compared with February 2019. This is consistent with reports from around the world of improved air quality during COVID-19, which are based largely on satellite observations of NO2 [18,19]. They are accounted for by reductions in road and air traffic which account for approximately 80% of NOx [20], with industry and power plants contributing the rest. During this period, internal, domestic, and international flights departing Mainland China reduced by 60–70% and 80–90%, respectively [20]. Across China, 780 M people were under travel restrictions [21] and empty streets were reported in Beijing and other cities [22]. The very high particulate levels across North and East China during this period observed from both satellite AOD and ground station data suggests that vehicular restrictions may have little effect in controlling street-level pollution, as well as the heavy smog pervasive over many Chinese cities.
Our satellite-based observations of increased particulate levels of AOD and PM2.5 centered on the BTH region of Northern China were supported by media reports of a spike in smog levels in Beijing in the third week of February 2020. An air quality index of 222, which is 22 points above the threshold for very unhealthy pollution was reported [8]. The US Embassy in Beijing measured PM2.5 levels of 240 µg/m3, almost 10 times the WHO recommended healthy levels [9], and the highest level since February 2017 [23].
The reason for the increase in particulate pollution during COVID-19 is not immediately obvious, as local governments encouraged businesses to stay closed following the week-long Chinese New Year holiday on January 24. Media reports, quoting data from industry surveys and power firms, maintain that industrial production fell, with a 25% fall in coal consumption by major power firms since the holiday. A combination of factors is likely responsible, the foremost of which may be enhanced production of secondary particulates. These are formed when reductions in NOx result in increased ozone formation, thus increasing the oxidizing capacity of the atmosphere [24] allowing the production of secondary particulates such as nitrates, sulphates, and organic compounds. This production involves condensation around existing particles or new particles, and the resulting particulate compounds comprise mainly sulphates, nitrates, and organic compounds [25] which are less absorbing in nature [26]. It is also known that, although high atmospheric humidity promotes secondary particulate formation [4], relative humidity (RH) rarely exceeds 40% in the winter dry season. In spite of this, severe winter haze events are common in Beijing and surrounding cities. Nevertheless, 2020 saw significantly higher RH than in the previous year in Beijing (Table 4), as well as across Northern China. In a study on the formation of secondary aerosols during haze episodes in Beijing, Zhang et al. [4] reported higher RH levels, averaging around 40%, than on clean days, which is similar to our observations for haze events during February and March 2020 (Table 4). Table 4 also shows that on those same days, with PM2.5 levels far exceeding the EU air quality standard of 25 µm−3, significantly increased O3 levels were also observed, giving support to the theory of secondary aerosol as explained above. The dates correspond to the trajectory maps (Figure S1) which suggest particulate sources to be local. A recent study in Shanghai during the Chinese New Year holiday in late February 2020 [24] also reports severe haze despite reduced NO2 levels, where measurements of atmospheric chemistry and physics demonstrated that the increase in fine particulates was due to secondary aerosol formation, predominantly nitrate aerosols.
Although ozone, required for the enhancement of atmospheric oxidation processes, is produced less in winter under lower sunlight, weaker incident solar radiation, at the same time, makes the nitrate−ozone photochemistry more sensitive to the reduced NO2 [27]. Further evidence for the formation of secondary aerosols is given in Figure S3, which shows that hourly PM2.5 concentrations for Beijing throughout February and March 2020 exceeded air quality standards, suggesting persistent haze at ground level. There are many studies attributing haze pollution in the Beijing region with formation of secondary fine aerosols of sulphates, nitrates, and ammonium [28,29,30,31]. A tipping point for the cessation of secondary particulate formation may be around 60–70% reduction in NOx [27] and this was not achieved even in Wuhan (Table 3), which experienced almost 3 months of shutdown.
Other factors possibly contributing to the observed increase in particulates across China during COVID-19 include: (i) Below freezing temperatures in the BTH region meant that power plants needed to stay open to supply home heating as people stayed home, (ii) low wind speeds, often blamed for urban smog episodes, are also significant when combined with other causative factors. The observed higher AOD over BTH in November 2018 compared to 2019 may be attributed to the economic slowdown of 2018–2019, when industrial production increased as many local governments ignored emission controls, such that China’s increase in coal consumption in the winter of 2018–2019 was more than Poland´s total coal consumption [1].
In the Taklimakan desert area of Northwest China, the higher wind speeds in March 2020 compared to 2019 correspond to press reports of dust storms in Northeast China on March 20 2020 [10]. In this case, the observed increased AOD is interpreted as being due to dust storms.
5. Conclusions
Satellite retrievals of atmospheric particulates in the form of aerosol optical depth (AOD) surprisingly indicated extremely high particulate levels in the BTH region of Northeast China during the COVID-19 slowdown. The observations are supported by ground station data on fine particulates (PM2.5), which showed an increase of 20% for Beijing and no change for Tianjin during January and February compared with the previous year. At the same time, satellite retrievals of tropospheric NO2 showed a dramatic decline over Northern and Eastern China, which is attributed to COVID-19 reductions in air and road travel. An explanation for the high and increased aerosol levels over the BTH region is difficult, in view of reported drastic cut-backs in industrial production, but likely resulted largely from the increased oxidizing capacity of the atmosphere when NOx is reduced. The study shows that on polluted days, two key ingredients in the atmospheric chemistry of secondary particulate formation, ozone and water vapor, were much higher than normal. Other factors contributing to the observed increase in atmospheric particulates during the COVID-19 period included demand from domestic heating, as well as the possibility that some firms may have evaded government guidelines during the shutdown, thus resulting in some continued industrial emissions. These then underwent enhanced oxidation to form secondary particulates. Low wind speeds, often blamed for poor air quality, were also a likely contributing factor.
Both the AOD images and ground station PM2.5 data support the explanation of secondary particulate formation. This is because AOD levels either increased or showed only small reductions, while NO2 decreased significantly at all ground stations. The very high AOD levels observed across over 50% of the Chinese mainland in April, with AOD ≥ 0.6, may thus be an indirect consequence of extensive transport restrictions, thus reducing NOx across China. Ozone, a facilitating intermediate product of enhanced secondary particulate formation, can be transported long distances by wind, and can be found in high levels in rural areas, thus explaining the large spatial extent of high AOD over China. Increased industrial production in peripheral regions to compensate economic losses in the main population and industrial centers may have also contributed to the high AOD levels. These peripheral regions with significantly increased AOD levels include the Beibu Gulf Economic Zone in the southwest, and the Heilongjiang Province in the northeast. In Beijing, Tianjin, and BGEZ in January to March 2020, levels of PM2.5 were still well above WHO and EU recommended levels. A major implication of the findings is that government policies of restrictions on motor vehicles in BTH cities during smog episodes may do little to mitigate, and may perhaps even exacerbate the problem of particulate air pollution.
Supplementary Materials
The following are available online at https://www.mdpi.com/2072-4292/12/13/2100/s1, Figure S1: HYSPLIT backward trajectory data over China, for days of high AOD and PM2.5 levels in February and March 2020 showing air flows near ground level (<1000 m) to be mainly local, Figure S2: Comparison between MODIS DBT product and PM2.5 ground station data for February and March 2020. Hourly PM2.5 data were obtained from 12 air quality stations located in Beijing and mean PM2.5 concentrations between 12:00 and 14:00 h were used to match with Aqua MODIS overpass time. The MODIS DT and DB (DTB) AOD retrievals at 550 nm were generated for Aqua-MODIS data using the new customized Method-1 (Bilal et al. 2017), Figure S3: Daily average PM2.5 data from 12 ground stations in Beijing for February and March 2020, showing levels exceeding EU air quality standards (PM2.5 = 25 µg/m3) for most of the period, Table S1: AERONET and MODIS AOD data, average monthly values calculated from daily available values, for February and March 2019 and 2020, at Beijing_CAMS and Beijing_RADI AERONET sites.
Author Contributions
Conceptualization, J.E.N., M.B., and M.A.A.; methodology, J.E.N. and M.B.; software, M.A.A. and Z.Q.; validation, J.E.N.; formal analysis, J.E.N. and M.A.A.; investigation, J.E.N.; resources, M.B. and Z.Q.; data curation, M.A.A. and Z.Q.; writing—original draft preparation, J.E.N.; writing—review and editing, J.E.N. and M.B.; funding acquisition, M.B., and Z.Q. All authors have read and agreed to the published version of the manuscript.
Funding
This research was funded by the Special Project of Jiangsu Distinguished Professor (1421061901001), the National Natural Science Foundation of China (Grant No. 41976165), and the Start−up Foundation for Introduction Talent of NUIST (2017r107). The third author (Md. Arfan Ali) is grateful to the China Scholarship Council (CSC) and NUIST for the fellowship and support.
Acknowledgments
The authors acknowledge GIOVANNI for MODIS and OMI data, the Principal Investigators of Beijing AERONET site, and the China National Environmental Monitoring Center for air quality data. Supporting data can be obtained from https://giovanni.gsfc.nasa.gov/giovanni/, https://aeronet.gsfc.nasa.gov/, and https://disc.gsfc.nasa.gov/datasets/OMNO2_V003/summary.
Conflicts of Interest
The authors declare no conflict of interest. The funders had no role in the design of the study; in the collection, analyses, or interpretation of data; in the writing of the manuscript; or in the decision to publish the results.
References
- Myllivyrta, L. Air Pollution around Beijing Rebounds as Coal Consumption Rises by 13%. Unearthed, Greenpeace. Available online: https://unearthed.greenpeace.org/2019/05/22/air−pollution−china−beijing−coal−2018/ (accessed on 22 May 2019).
- USIEA. International Energy Outlook with Projections to 2050. Available online: https://www.eia.gov/outlooks/ieo/pdf/ieo2019.pdf (accessed on 25 June 2020).
- Li, S.; Liu, Y.; Purevjav, A.-O.; Yang, L. Does subway expansion improve air quality? J. Environ. Econ. Manag. 2019, 96, 213–235. [Google Scholar] [CrossRef]
- Zhang, R.; Sun, X.; Shi, A.; Huang, Y.; Yan, J.; Ni, T.; Yan, X.; Li, X. Secondary inorganic aerosols formation during haze episodes at an urban site in Beijing, China. Atmos. Environ. 2018. [Google Scholar] [CrossRef]
- Ma, Z.; Liu, R.; Liu, Y.; Bi, J. Effects of air pollution control policies on PM2.5 pollution improvement in China from 2005 to 2017: A satellite−based perspective. Atmos. Chem. Phys. 2019, 19, 6861–6877. [Google Scholar] [CrossRef] [Green Version]
- Liu, F.; Beirle, S.; Zhang, Q.; van der A, R.J.; Zheng, B.; Tong, D.; He, K. NOx emission trends over Chinese cities estimated from OMI observations during 2005 to 2015. Atmos. Chem. Phys. 2017, 17, 9261–9275. [Google Scholar] [CrossRef] [Green Version]
- Wang, Y.; Trentmann, J.; Pfeifroth, U.; Yuan, W.; Wild, M. Improvement of Air Pollution in China Inferred from Changes between Satellite−Based and Measured Surface Solar Radiation. Remote Sens. 2019, 11, 2910. [Google Scholar] [CrossRef] [Green Version]
- Yuan, G.; Yang, W. Evaluating China’s Air Pollution Control Policy with Extended AQI Indicator System: Example of the Beijing−Tianjin−Hebei Region. Sustainability 2019, 11, 939. [Google Scholar] [CrossRef] [Green Version]
- Wang, O. China’s capital shrouded in air pollution despite reduced emissions from coronavirus economic slowdown. South China Morning Post, 14 February 2020. [Google Scholar]
- WMO. Sand Dust Storm Occurs in North China, Inner Mongolia, China. World Meteorological Cnetre, Beijing. Available online: http://www.wmc−bj.net/publish/cms/view/836da450ddd74c98b5ca6ef6aa01a31f.html (accessed on 13 May 2020).
- Filonchyk, M.; Yan, H.; Zhang, Z.; Yang, S.; Li, W.; Li, Y. Combined use of satellite and surface observations to study aerosol optical depth in different regions of China. Sci. Rep. 2019, 9, 6174. [Google Scholar] [CrossRef] [PubMed]
- Nichol, J.; Bilal, M. Validation of MODIS 3 km Resolution Aerosol Optical Depth Retrievals Over Asia. Remote Sens. 2016, 8, 328. [Google Scholar] [CrossRef] [Green Version]
- Ruiz-Arias, J.A.; Dudhia, J.; Gueymard, C.A.; Pozo-Vazquez, D. Assessment of the Level−3 MODIS daily aerosol optical depth in the context of surface solar radiation and numerical weather modelling. Atmos. Chem. Phys. 2013, 13, 675–692. [Google Scholar] [CrossRef] [Green Version]
- Levy, R.C.; Mattoo, S.; Munchak, L.A.; Remer, L.A.; Sayer, A.M.; Patadia, F.; Hsu, N.C. The Collection 6 MODIS aerosol products over land and ocean. Atmos. Meas. Tech. 2013, 6, 2989–3034. [Google Scholar] [CrossRef] [Green Version]
- Hsu, N.C.; Jeong, M.-J.; Bettenhausen, C.; Sayer, A.M.; Hansell, R.; Seftor, C.S.; Huang, J.; Tsay, S.-C. Enhanced Deep Blue aerosol retrieval algorithm: The second generation. J. Geophys. Res. Atmos. 2013, 118, 9296–9315. [Google Scholar] [CrossRef]
- Bilal, M.; Nichol, J.; Wang, L. New customized methods for improvement of the MODIS C6 Dark Target and Deep Blue merged aerosol product. Remote Sens. Environ. 2017, 197, 115–124. [Google Scholar] [CrossRef]
- Sayer, A.M.; Munchak, L.A.; Hsu, N.C.; Levy, R.C.; Bettenhausen, C.; Jeong, M.J. MODIS Collection 6 aerosol products: Comparison between Aqua’s e−Deep Blue, Dark Target, and “merged” data sets, and usage recommendations. J. Geophys. Res. Atmos. 2014, 119, 13965–13989. [Google Scholar] [CrossRef]
- Monks, P. Coronavirus: Lockdown´s Effect on Air Pollution Provides Rare Glimpse of Low−Carbon Future. Available online: https://airqualitynews.com/2020/04/17/coronavirus−lockdowns−effect−on−air−pollution−provides−rare−glimpse−of−low−carbon−future/ (accessed on 19 April 2020).
- Shrestha, A.M.; Shrestha, U.B.; Sharma, R.; Bhattarai, S.; Tran, H.N.T.; Rupakheti, M. Lockdown caused by COVID−19 pandemic reduces air pollution in cities worldwide. Eartharxiv 2020. [Google Scholar] [CrossRef]
- O.A.G. Corinavirus Week 6: Capacity Recovers Slightly—or Does It? Available online: https://www.oag.com/blog/coronavirus−week−six (accessed on 26 February 2020).
- CNN. 780 Million People in China Are Living under Travel Restrictions Due to the Coronavirus Outbreak. Available online: https://edition.cnn.com/2020/02/16/asia/coronavirus−covid−19−death−toll−update−intl−hnk/index.html (accessed on 26 February 2020).
- Xin, Z.; Wang, O.; Tang, F. China coronavirus: Fears of economic contagion grow as cities turn into ghost towns. South China Morning Post, 29 January 2020. [Google Scholar]
- Bloomberg. China Pollution Levels Are Worst in Three Years. Bloomberg News, 13 February 2020. Available online: http://www.bloomberg.com/news/articles/2020−02−12/china−s−economic−shutdown−hasn−t−brought−blue−skies−to−beijing(accessed on 26 February 2020).
- Chang, Y.; Huang, R.-.J.; Ge, X.; Huang, X.; Hu, J.; Duan, Y.; Zou, Z.; Liu, X.; Lehmann, M.F. Puzzling haze events in China during the coronavirus (COVID−19) shutdown. Nat. Sci. Rev. 2020. [Google Scholar] [CrossRef]
- Ervens, B.; Turpin, B.J.; Weber, R.J. Secondary organic aerosol formation in cloud droplets and aqueous particles (aqSOA): A review of laboratory, field and model studies. Atmos. Chem. Phys. 2011, 11. [Google Scholar] [CrossRef]
- Kim, J.; Lee, J.; Lee, H.C.; Higurashi, A.; Takemura, T.; Song, C.H. Consistency of the aerosol type classification from satellite remote sensing during the Atmospheric Brown Cloud–East Asia Regional Experiment campaign. J. Geophys. Res. 2007. [Google Scholar] [CrossRef]
- Huang, X.; Ding, A.; Gao, J.; Zheng, B.; Zhou, D.; Qi, X.; Tang, R.; Ren, C.; Nie, W.; Chi, X.; et al. Enhanced secondary pollution offset reduction of primary emissions during COVID−19 lockdown in China. EarthArXiv 2020. [Google Scholar] [CrossRef]
- Sun, Y.; Zhuang, G.; Tang, A.; Wang, Y.; An, Z. Chemical characteristics of PM2.5 and PM10 in haze_fog episodes in Beijing. Environ. Sci. Technol. 2006, 40, 3148–3155. [Google Scholar] [CrossRef]
- Tan, J.; Duan, J.; Chen, D.; Wang, X.; Guo, S.; Bi, X.; Sheng, G.; He, K.; Fu, J. Chemical characteristics of haze during summer and winter in Guangzhou. Atmos. Res. 2009, 94, 238–245. [Google Scholar] [CrossRef]
- Wang, Y.; Zhuang, G.; Sun, Y.; An, Z. The variation of characteristics and formation mechanisms of aerosols in dust, haze, and clear days in Beijing. Atmos. Environ. 2006, 40, 6579–6591. [Google Scholar] [CrossRef]
- Wang, X.; Wang, W.; Yang, L.; Gao, X.; Nie, W.; Yu, Y.; Xu, P.; Zhou, Y.; Wang, Z. The secondary formation of inorganic aerosols in the droplet mode through heterogeneous aqueous reactions under haze conditions. Atmos. Environ. 2012, 63, 68–76. [Google Scholar] [CrossRef]
Figure 1.
Aqua moderate resolution imaging spectrometer (Aqua MODIS) DTB monthly aerosol optical depth (AOD) at 550 nm from November 2018 to April 2019 (Column 1), and November 2019 to April 2020 (Column 2). Monthly averages are generated from the average value of all available pixels over the month. Blank areas represent no data satisfying the quality control threshold. Locations of Beijing–Tianjin–Hebei (BTH), Wuhan, Beibu Gulf Economic Zone (BGEZ), Urumqi–Chiangji Economic Zone (UCEZ), Shanghai, and Pearl River Delta (PRD) are outlined on top left (November 2018) sub-figure.

Figure 2.
OMI-based seasonal mean tropospheric NO2 (1015 molec/cm−2), from November 2018 to April 14 2019, and November 2019 to April 14 2020.
Figure 2.
OMI-based seasonal mean tropospheric NO2 (1015 molec/cm−2), from November 2018 to April 14 2019, and November 2019 to April 14 2020.

Figure 3.
OMI-based monthly mean tropospheric NO2 (1015 molec/cm−2), from November 2018 to April 14 2019, and November 2019 to April 14 2020.
Figure 3.
OMI-based monthly mean tropospheric NO2 (1015 molec/cm−2), from November 2018 to April 14 2019, and November 2019 to April 14 2020.

Figure 4.
NCEP/NCAR reanalysis composite mean surface wind speed (m/s). Source: NOAA Physical Sciences Laboratory. Locations of Beijing−Tianjin−Hubei (BTH), Nanning (N), and Urumqi (U) are given in top left figure. Red ellipse on March figures highlights change in wind speeds over Taklimakan desert.


Table 1.
Details of surface air quality monitoring stations.
| Station Name | No of Stations | Dense Urban | Sub-Urban | Industrial | Rural Background |
|---|---|---|---|---|---|
| Beijing | 12 | 5 | 5 | 2 | |
| Tianjin | 15 | 11 | 1 | 3 | |
| Nanning | 7 | 4 | 2 | 1 | 1 |
| Urumqi | 8 | 6 | 2 |
Table 2.
Average daily fine particulate (PM2.5) (µg/m3) and NO2 data (µg/m3) from street-level air sampling stations in Beijing, Tianjin, Nanning, and Urumqi. Source: China National Environmental Monitoring Center (CNEMC). NO2 data are collected with a Model 42i Chemiluminescence Analyzer following the United States Environmental Protection Agency (US EPA) guidelines. EU recommended an air quality guideline (AQG) level for 24-h mean PM2.5 = 25 µg/m3 and NO2 = 50 µg/m3.
| Station | January 2019 | February 2019 | March 2019 | January 2020 | February 2020 | March 2020 | Relative% Change 2019–2020 | ||
|---|---|---|---|---|---|---|---|---|---|
| January–March | January–February | ||||||||
| Beijing | PM2.5 NO2 | 50.6 47.7 | 50.9 33.4 | 51.8 37.6 | 58.6 39.2 | 62.7 25.8 | 34.8 23.7 | 1.8 –25.2 | 19.5 –19.8 |
| Tianjin | PM2.5 NO2 | 82.0 61.8 | 82.1 44.7 | 54.4 45.1 | 102.6 60.0 | 61.6 33.1 | 43.1 37.3 | −5.1 –14.0 | 0 –12.6 |
| Nanning (BGEZ) | PM2.5 NO2 | 36.3 35.4 | 31.0 21.6 | 31.7 32.6 | 31.5 23.2 | 35.3 16.5 | 25.5 22.7 | −6.8 –30.4 | 0 –30.3 |
| Urumqi (UCSZ) | PM2.5 NO2 | 135.5 65.2 | 112.9 56.9 | 77.4 50.8 | 142.0 68.0 | 84.8 39.4 | 32.9 31.3 | −20.3 –19.8 | −8.7 –12.0 |
Table 3.
Relative percentage change in NO2 from 2019 to 2020. Source: CNEMC.
| City | January–March | January–February |
|---|---|---|
| Beijing | −25.2 | −19.8 |
| Tianjin | −14.0 | −12.6 |
| Nanning | −30.4 | −30.3 |
| Urumqi | −19.8 | −12.0 |
| Wuhan | −45–1 | −36–7 |
Table 4.
Air quality parameters for days of high AOD and PM2.5 levels in February and March 2020 compared with the same days in 2019. PM2.5 and O3 data are from 12 CNEM air quality monitoring stations in Beijing. Relative humidity (RH) data are from http://weather.uwyo.edu/surface/meteorogram/seasia.shtml.
| Date | PM2.5 (µm−3) | RPC | O3 (µm−3) | RPC | RH (%) | RPC | |||
|---|---|---|---|---|---|---|---|---|---|
| 2019 | 2020 | 2019 | 2020 | 2019 | 2020 | ||||
| 2/10 | 25.48 | 122.86 | 382.14 | 63.77 | 82.32 | 29.08 | 17.4 | 37.8 | 117.24 |
| 2/11 | 36.68 | 181.23 | 394.08 | 64.27 | 103.93 | 61.72 | 16.2 | 48.8 | 201.23 |
| 2/12 | 29.10 | 208.39 | 616.07 | 71.80 | 126.91 | 76.77 | 47.2 | 47.2 | 0.00 |
| 2/13 | 22.65 | 203.40 | 798.07 | 63.31 | 124.15 | 96.09 | 12.4 | 80.4 | 548.39 |
| 3/8 | 56.65 | 100.13 | 76.75 | 89.08 | 100.25 | 12.54 | 19.6 | 93 | 374.49 |
| 3/25 | 22.72 | 120.34 | 429.64 | 95.16 | 129.83 | 36.43 | 6.4 | 37.8 | 490.63 |
| 3/30 | 5.20 | 70.07 | 1248.11 | 82.52 | 111.35 | 34.94 | 12.8 | 36.8 | 187.50 |
| 3/31 | 8.56 | 65.41 | 664.52 | 83.79 | 119.43 | 42.54 | 11.2 | 41.2 | 267.86 |
© 2020 by the authors. Licensee MDPI, Basel, Switzerland. This article is an open access article distributed under the terms and conditions of the Creative Commons Attribution (CC BY) license (http://creativecommons.org/licenses/by/4.0/).
Share and Cite
MDPI and ACS Style
Nichol, J.E.; Bilal, M.; Ali, M.A.; Qiu, Z. Air Pollution Scenario over China during COVID-19. Remote Sens. 2020, 12, 2100. https://doi.org/10.3390/rs12132100
AMA Style
Nichol JE, Bilal M, Ali MA, Qiu Z. Air Pollution Scenario over China during COVID-19. Remote Sensing. 2020; 12(13):2100. https://doi.org/10.3390/rs12132100
Chicago/Turabian StyleNichol, Janet E., Muhammad Bilal, Md. Arfan Ali, and Zhongfeng Qiu. 2020. "Air Pollution Scenario over China during COVID-19" Remote Sensing 12, no. 13: 2100. https://doi.org/10.3390/rs12132100
Note that from the first issue of 2016, this journal uses article numbers instead of page numbers. See further details here.