Automatic Evaluation of Wheat Resistance to Fusarium Head Blight Using Dual Mask-RCNN Deep Learning Frameworks in Computer Vision

 ,
,  , and
, and
Abstract
:1. Introduction
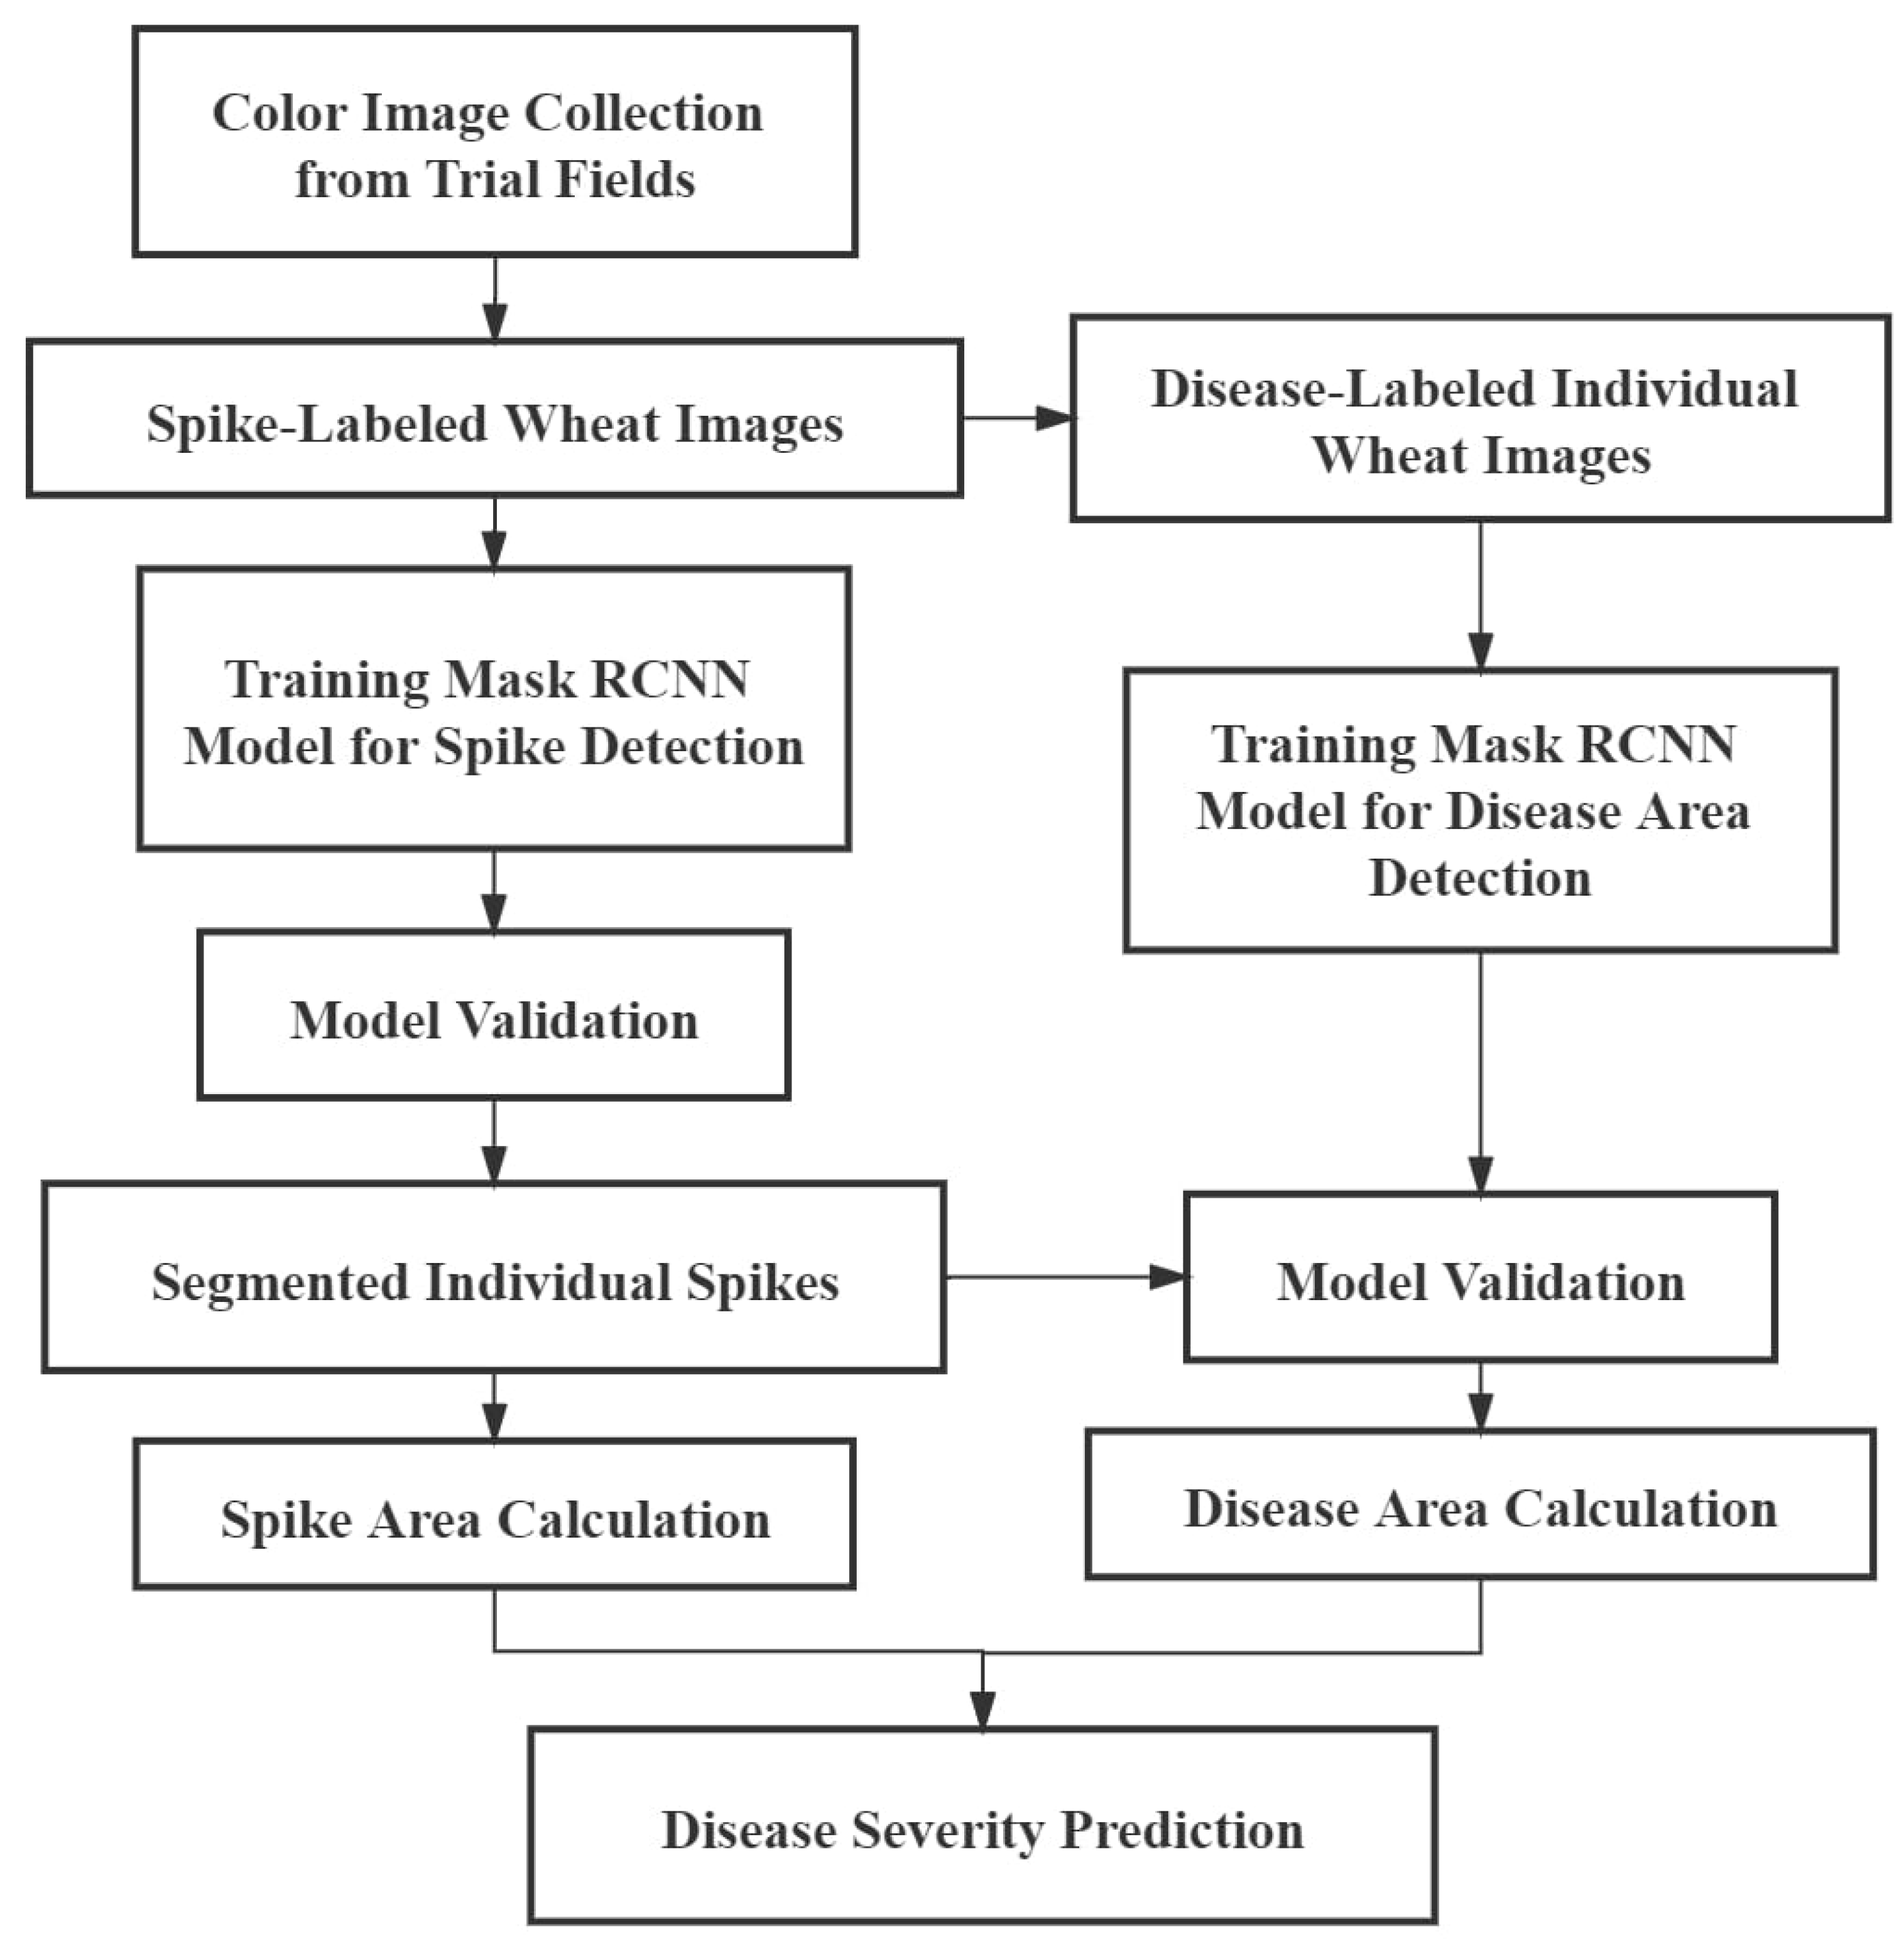
2. Materials and Methods
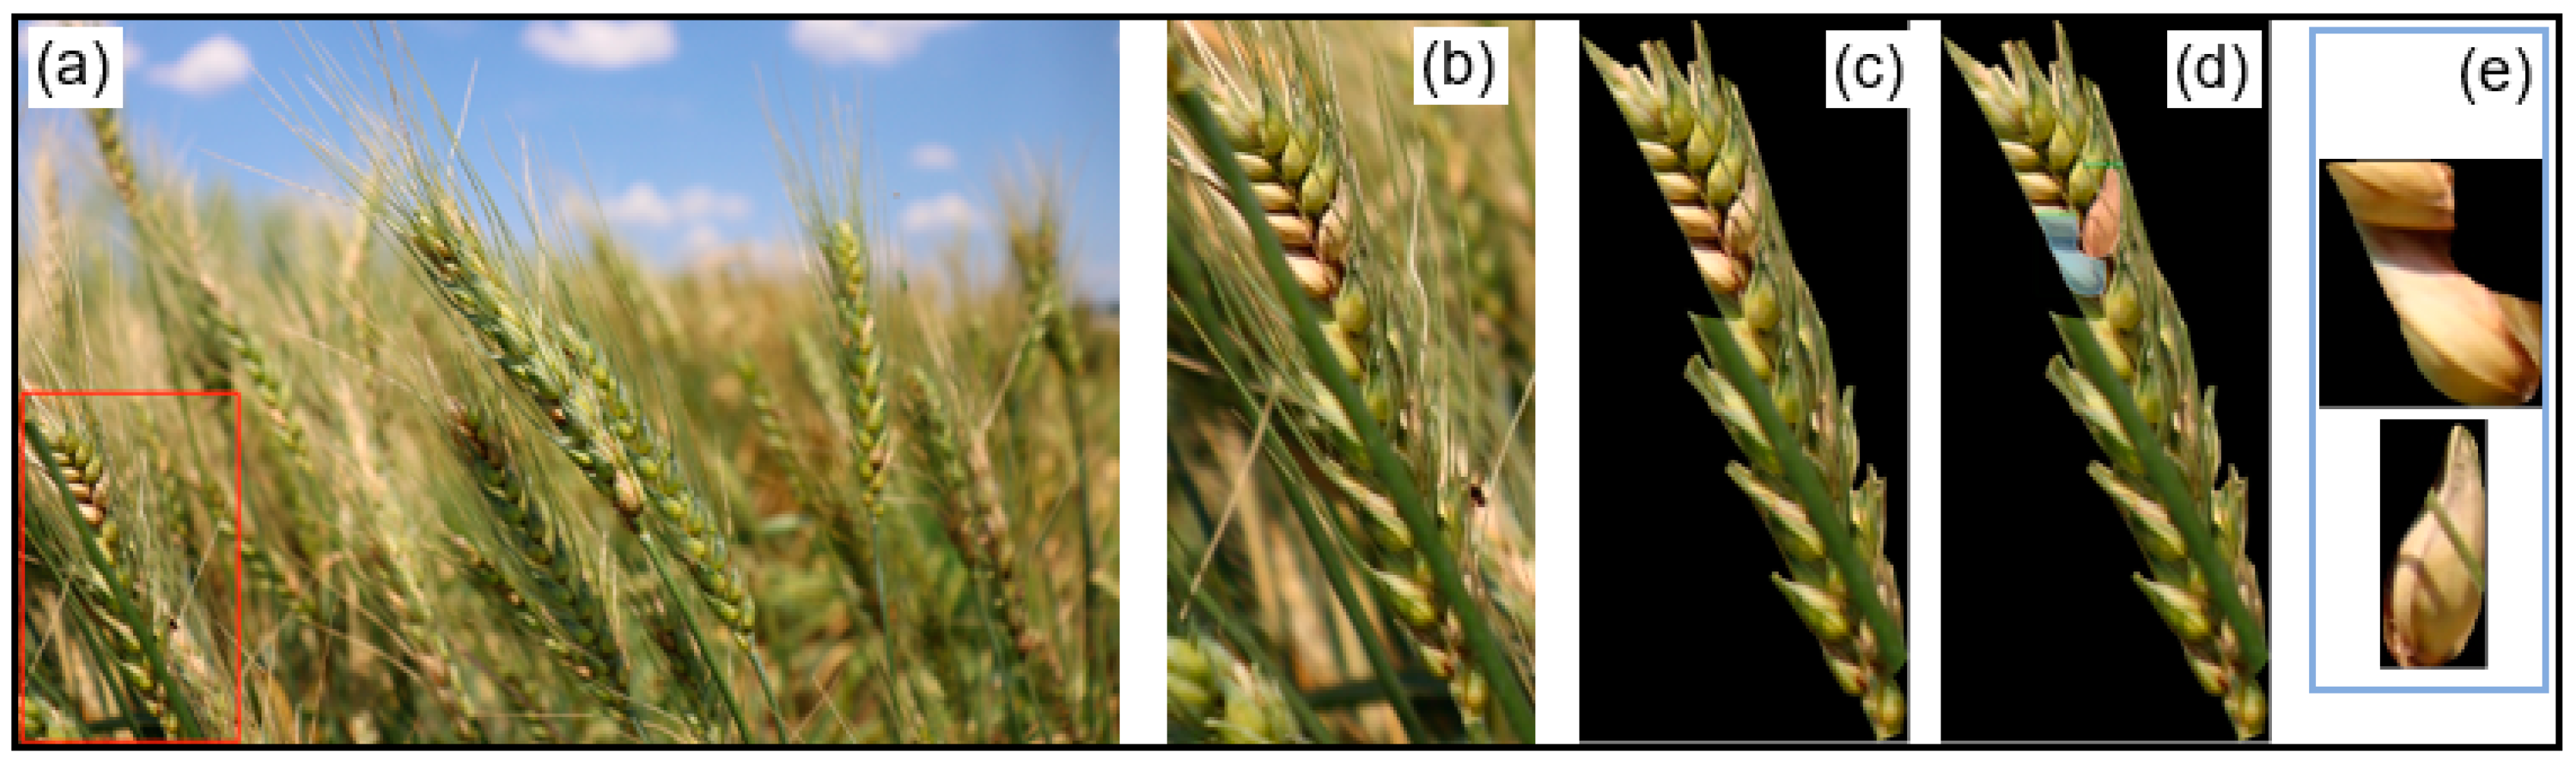
2.1. Data Collection
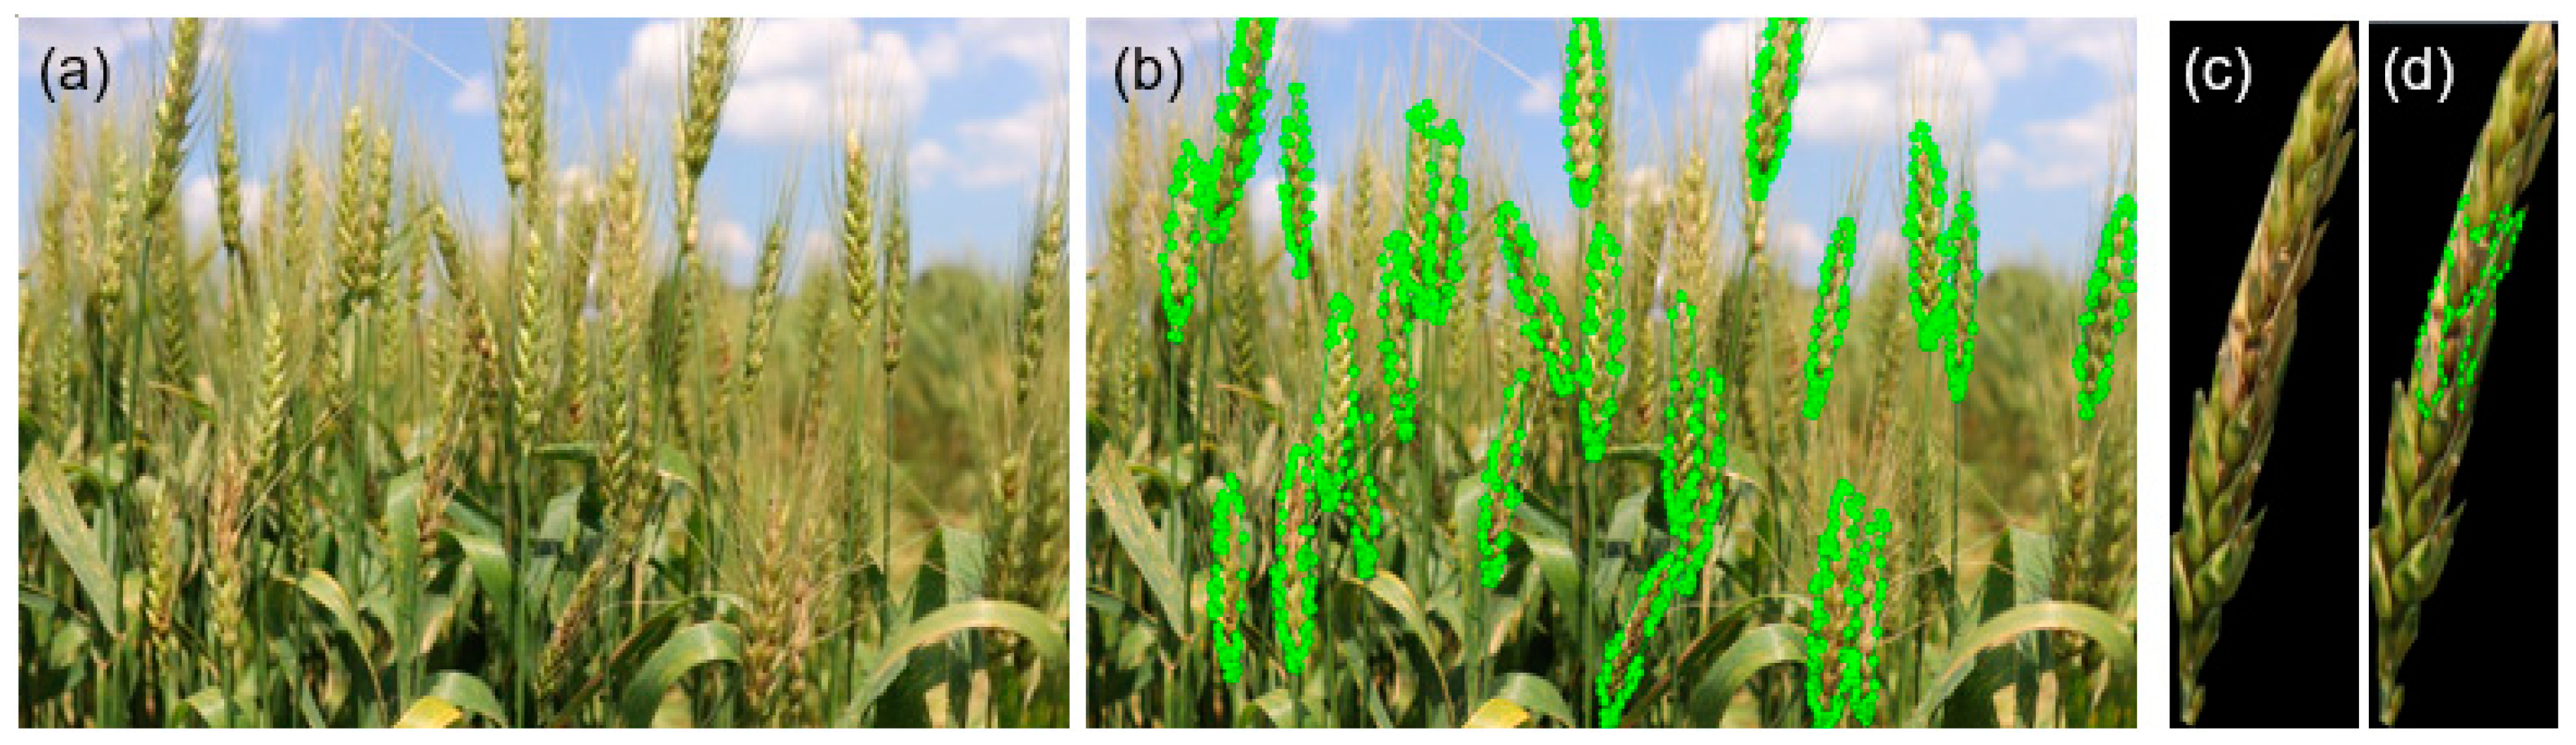
2.2. Data Annotation and Examination
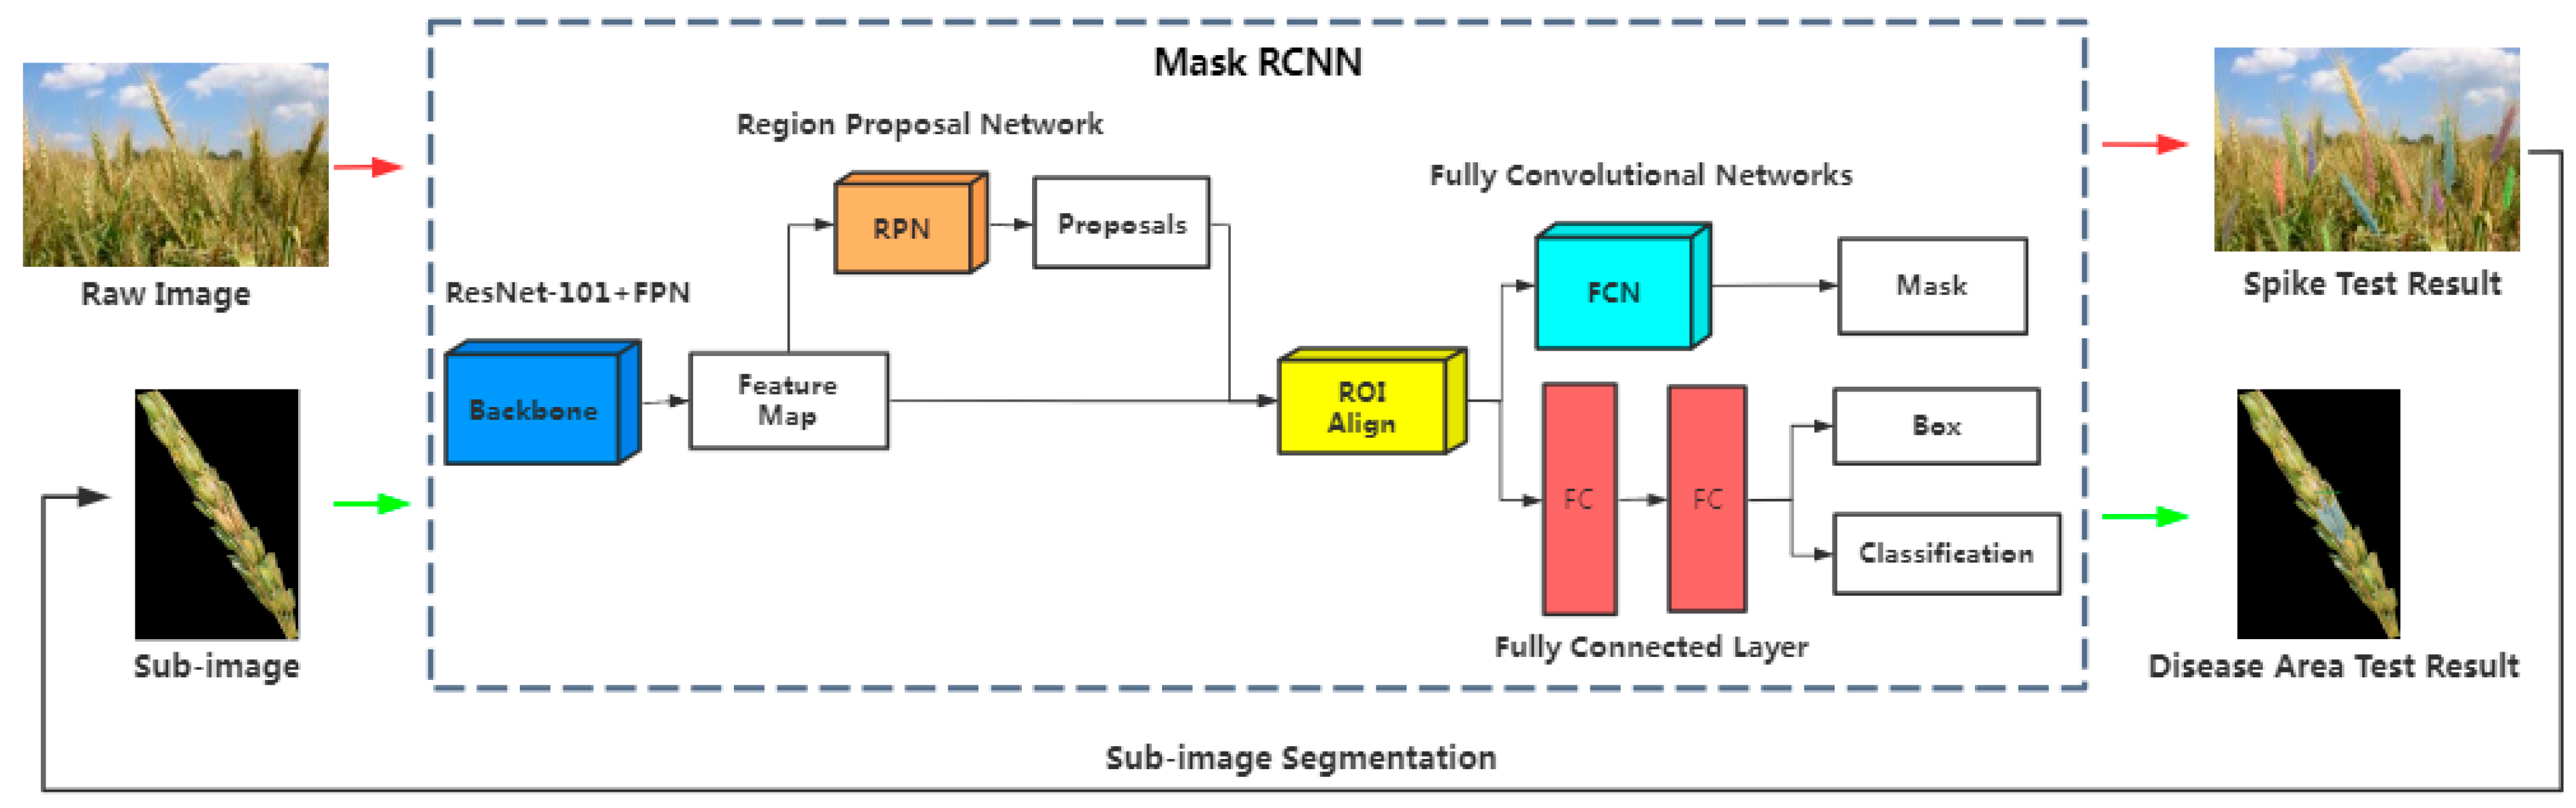
2.3. Mask-RCNN
2.4. Evaluation Metrics
2.5. Equipment
3. Results
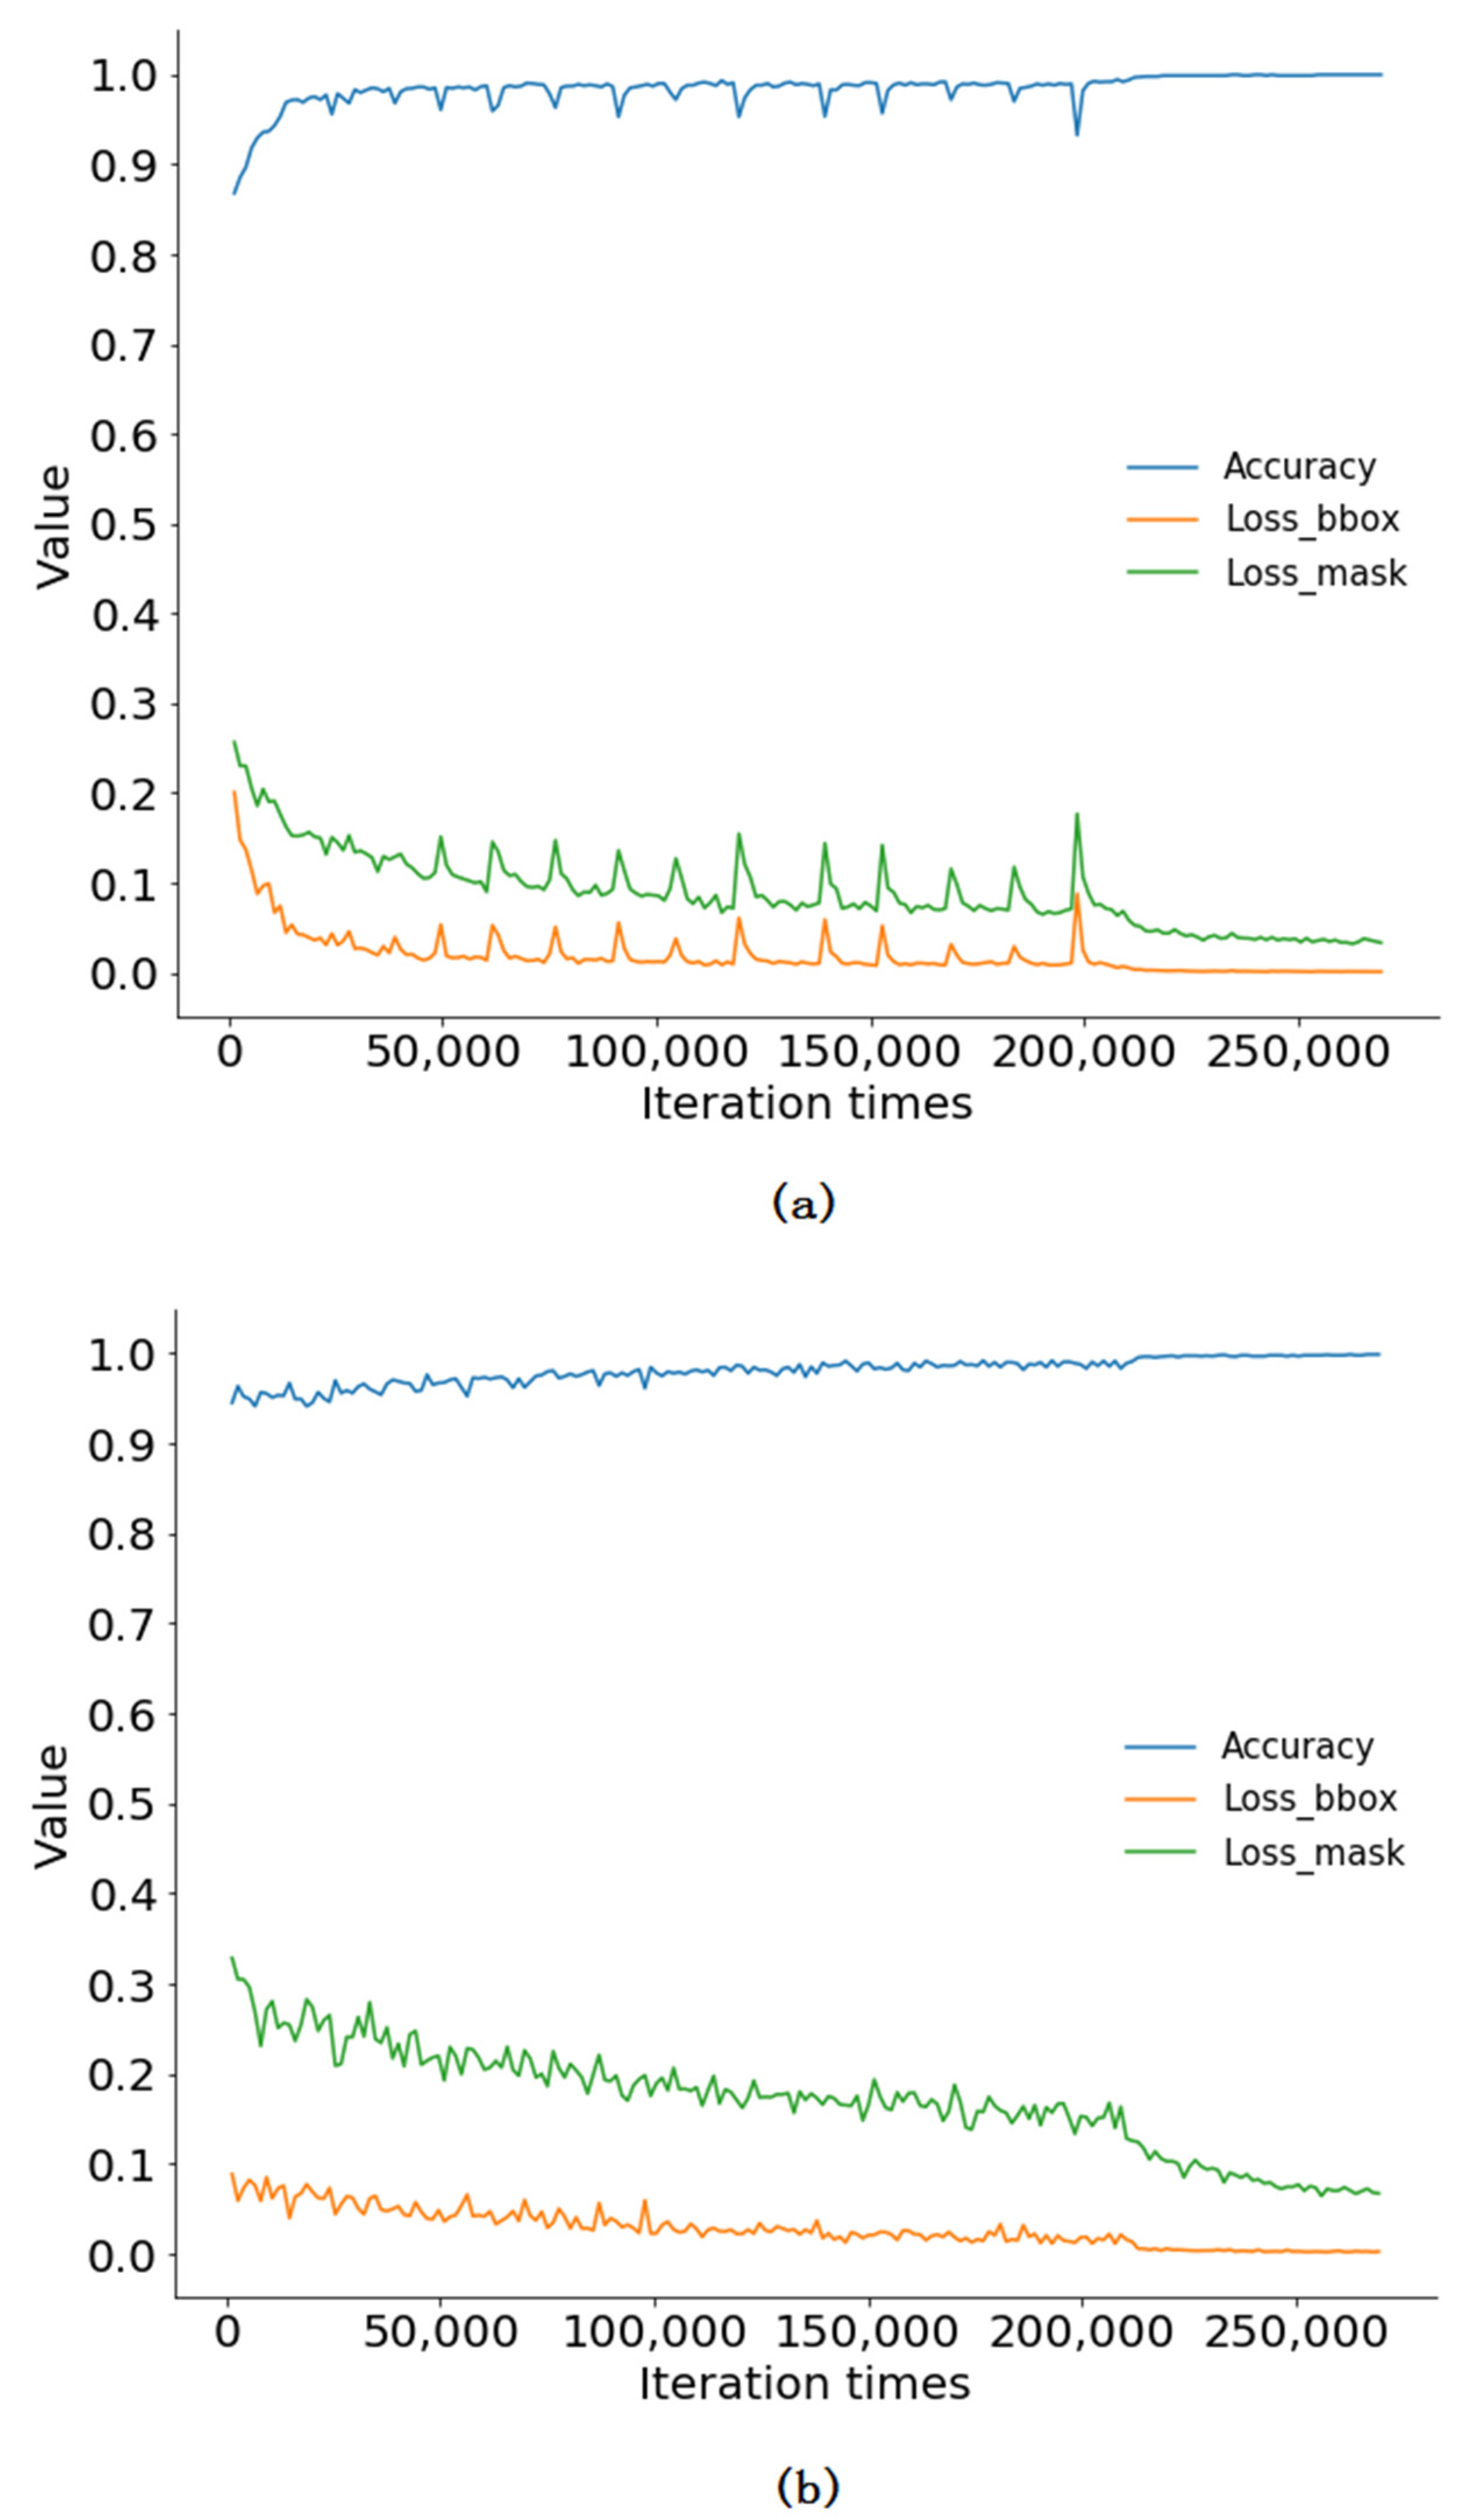
3.1. Model Training
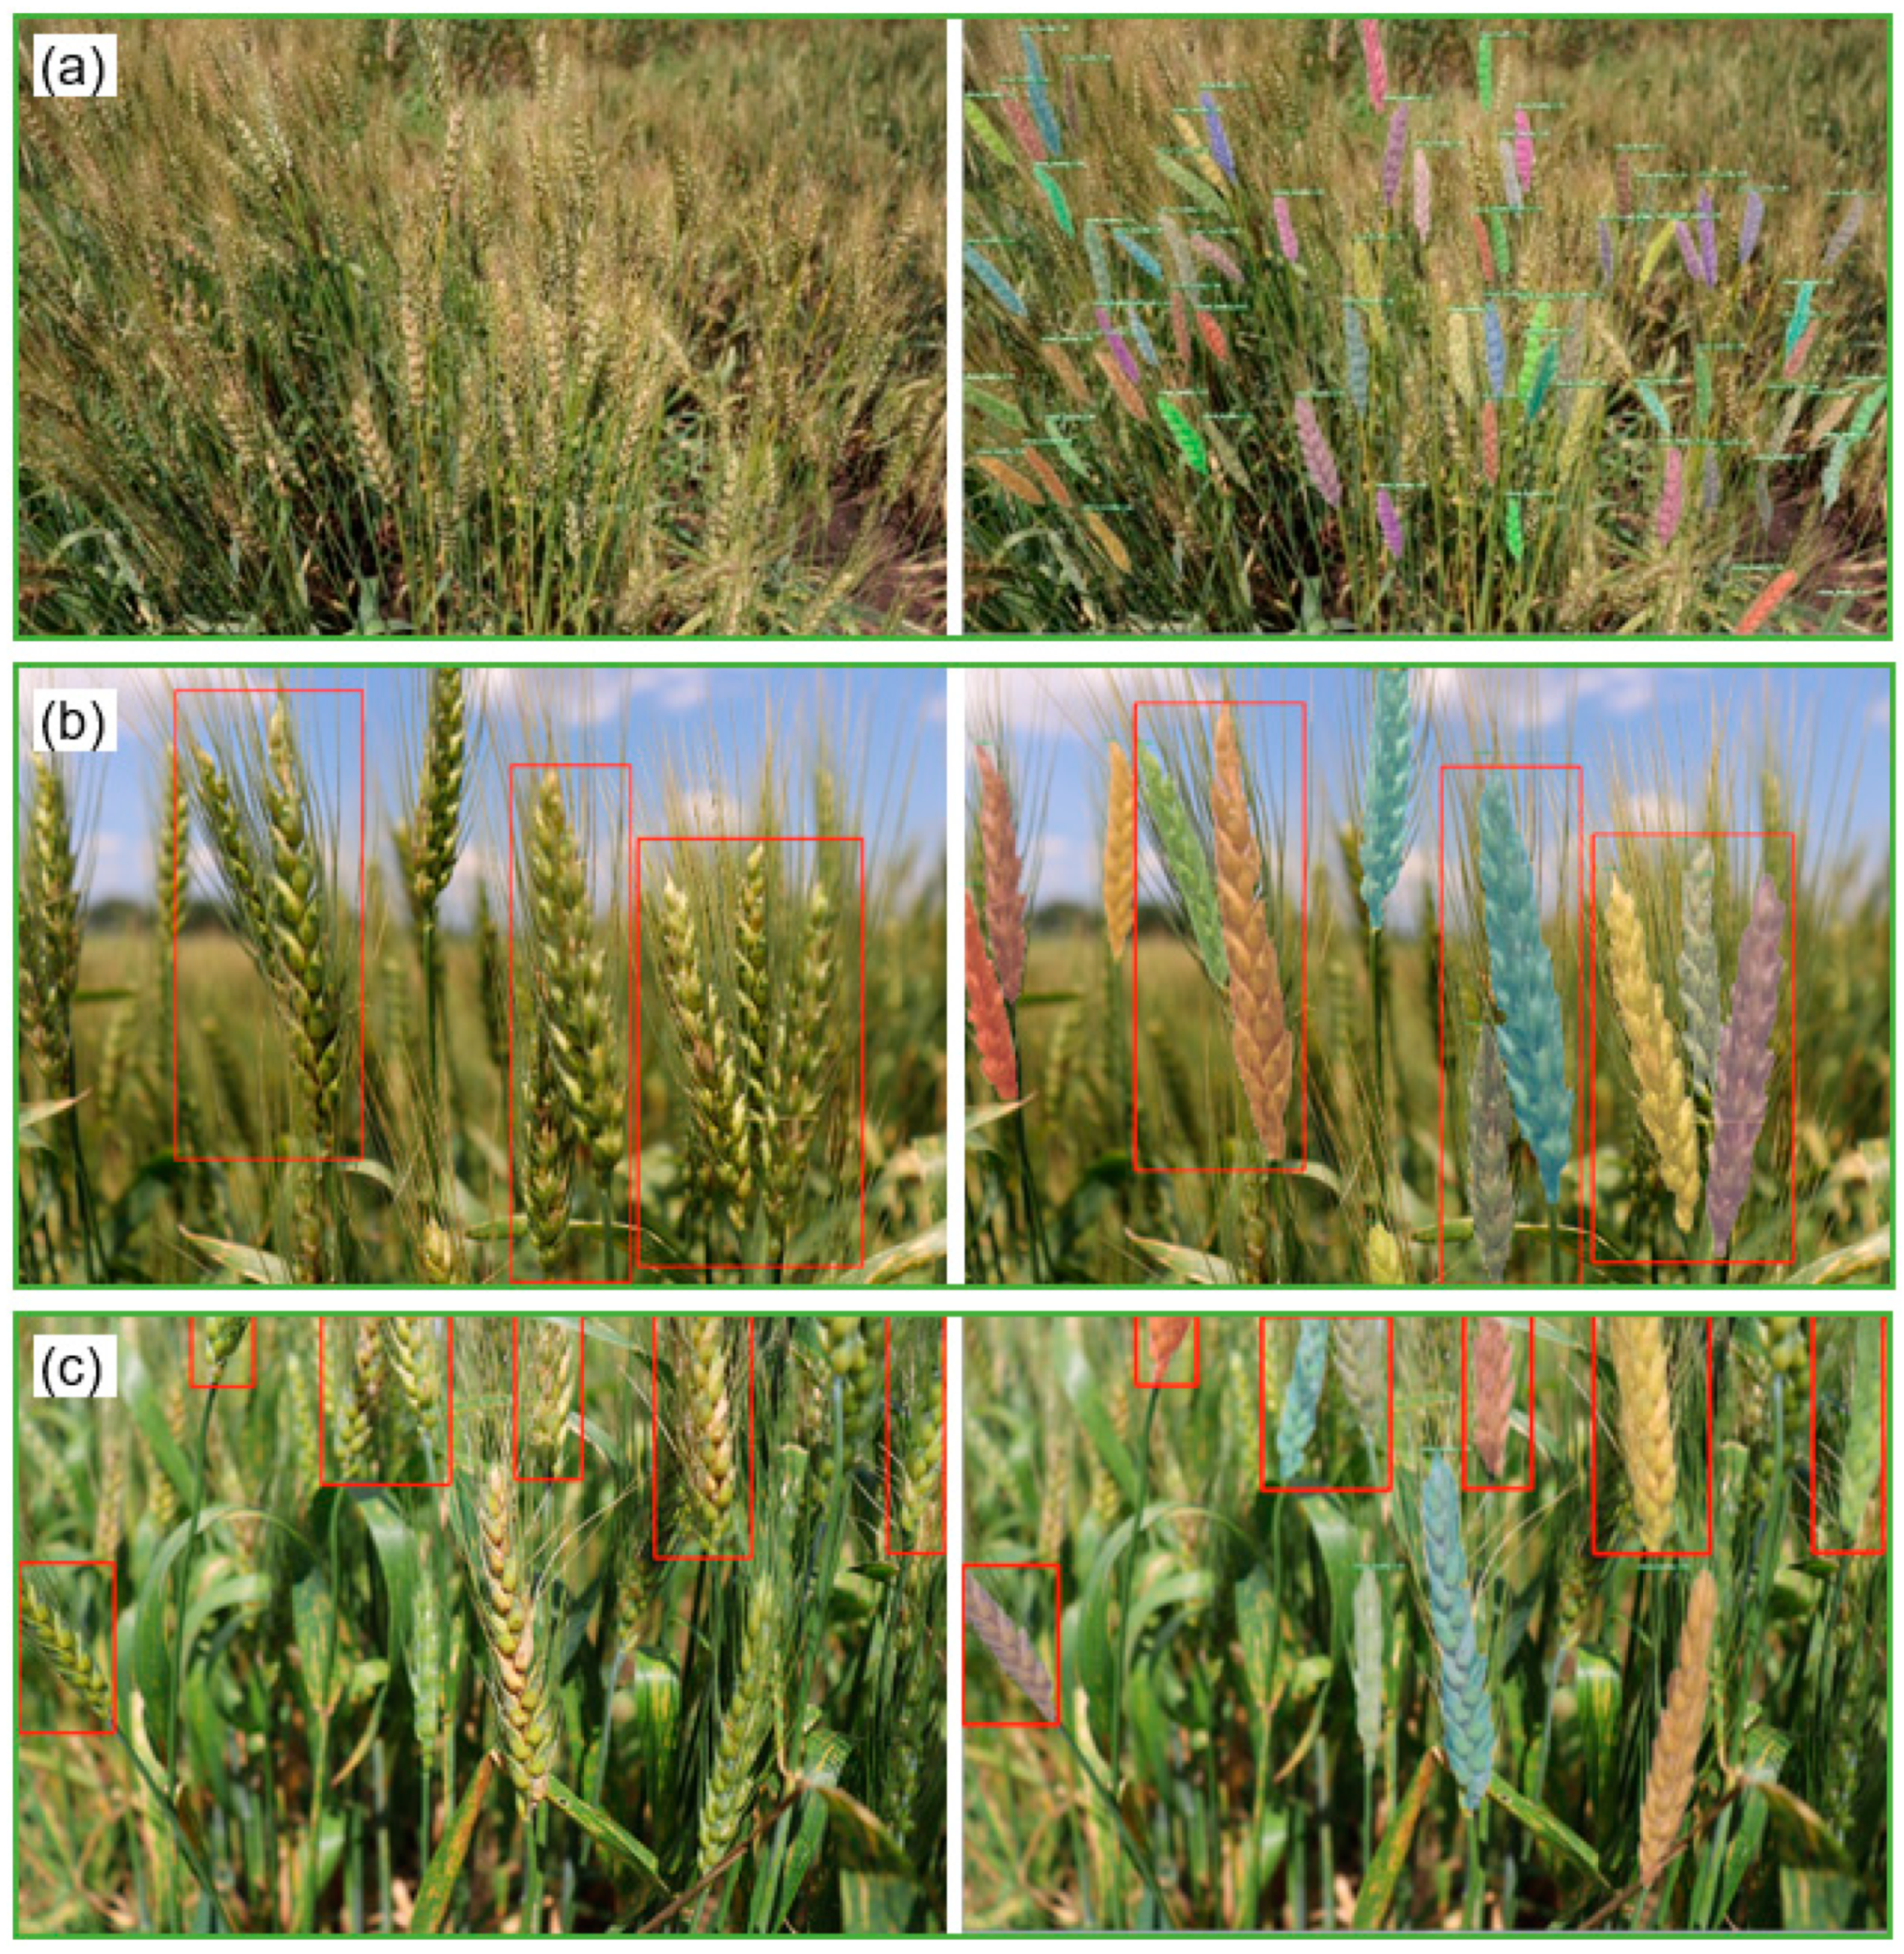
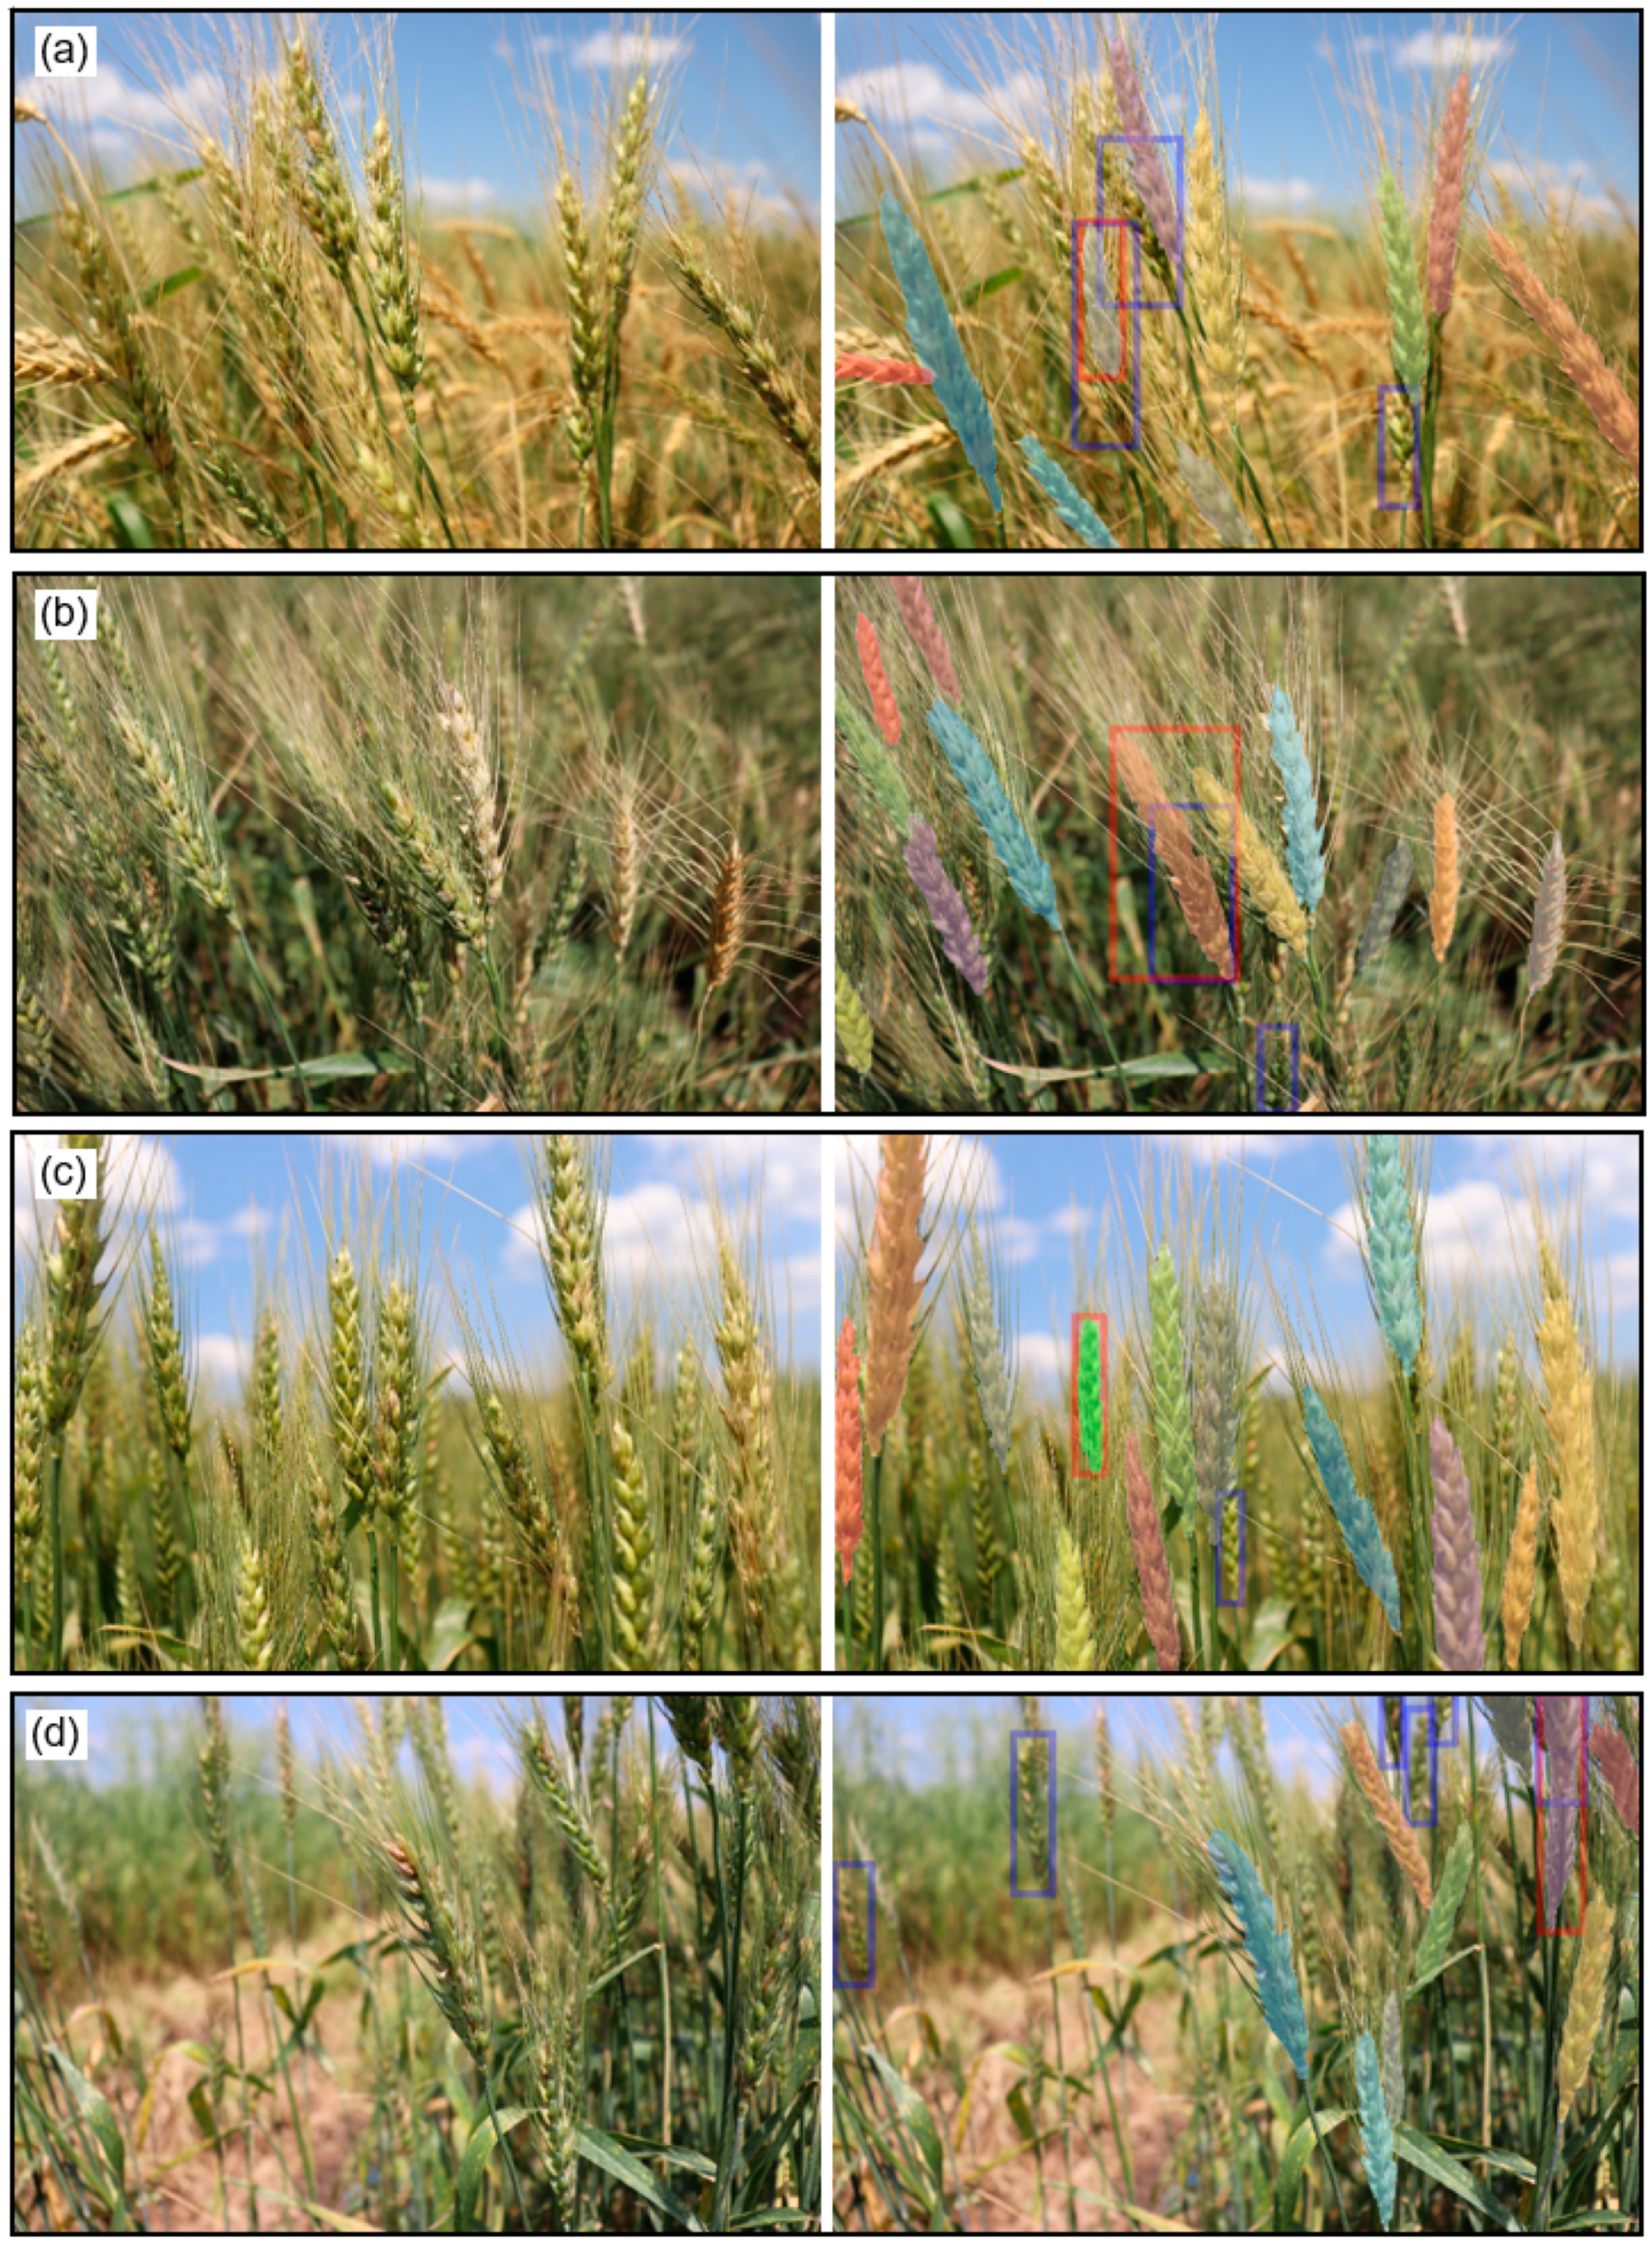
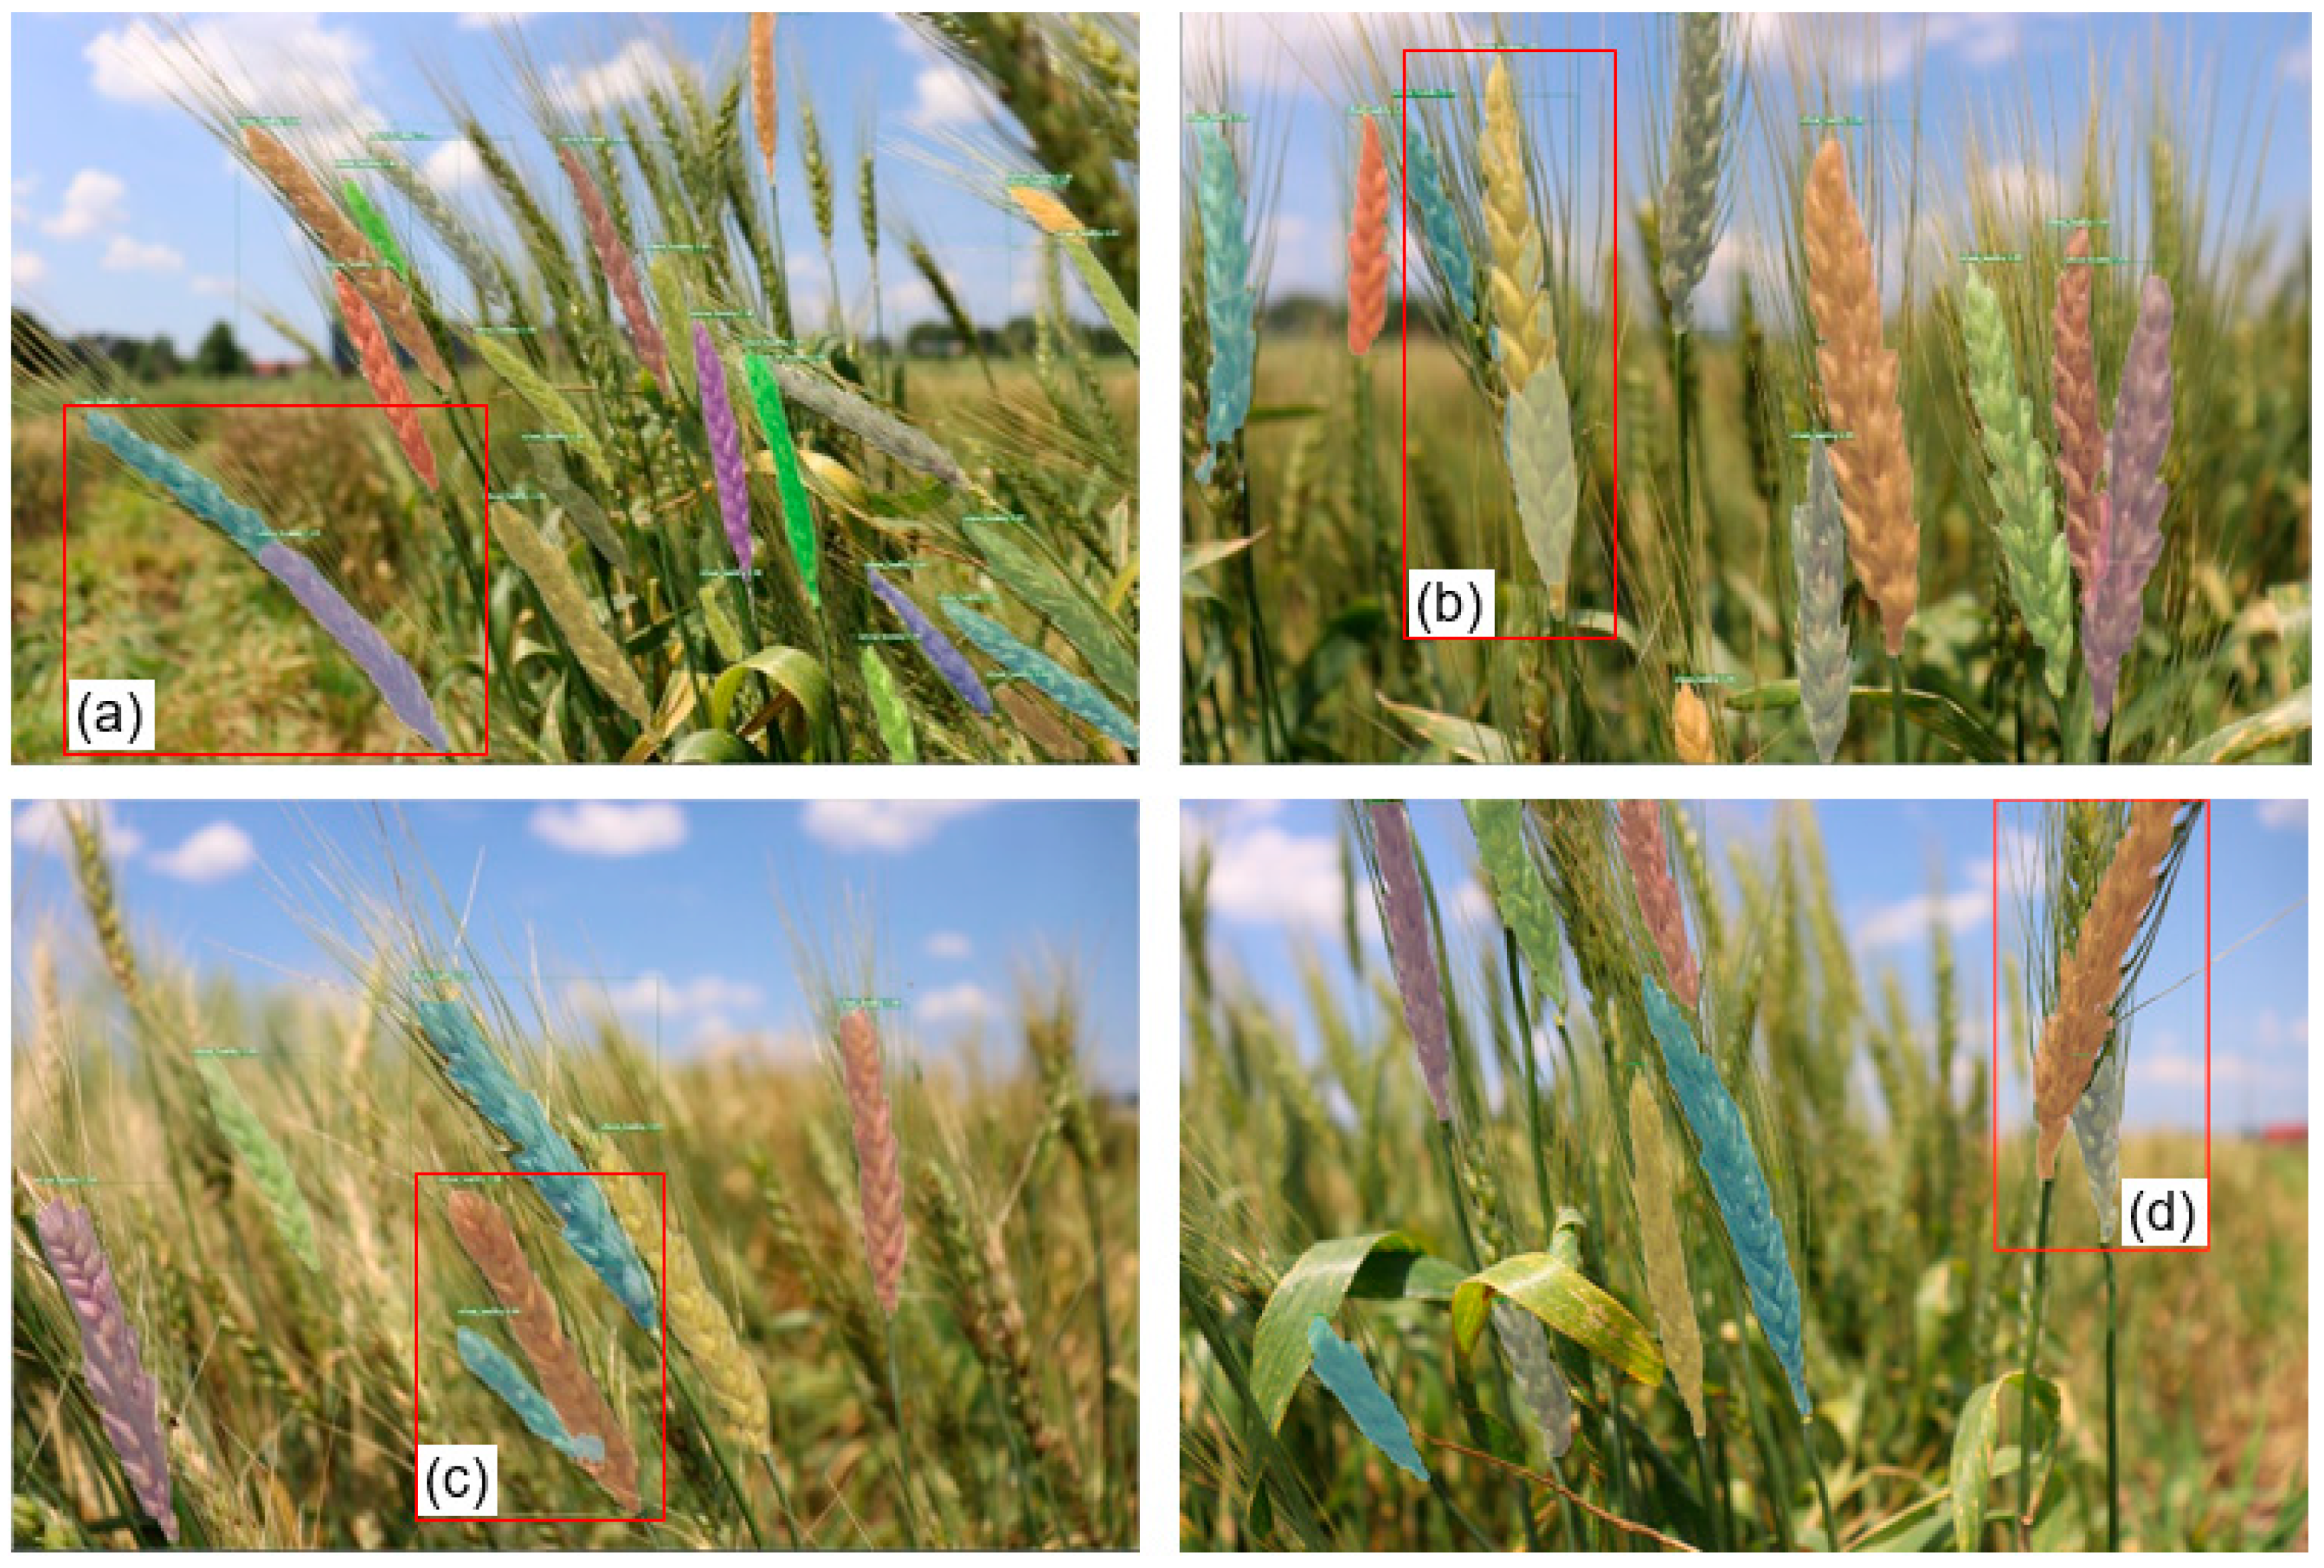
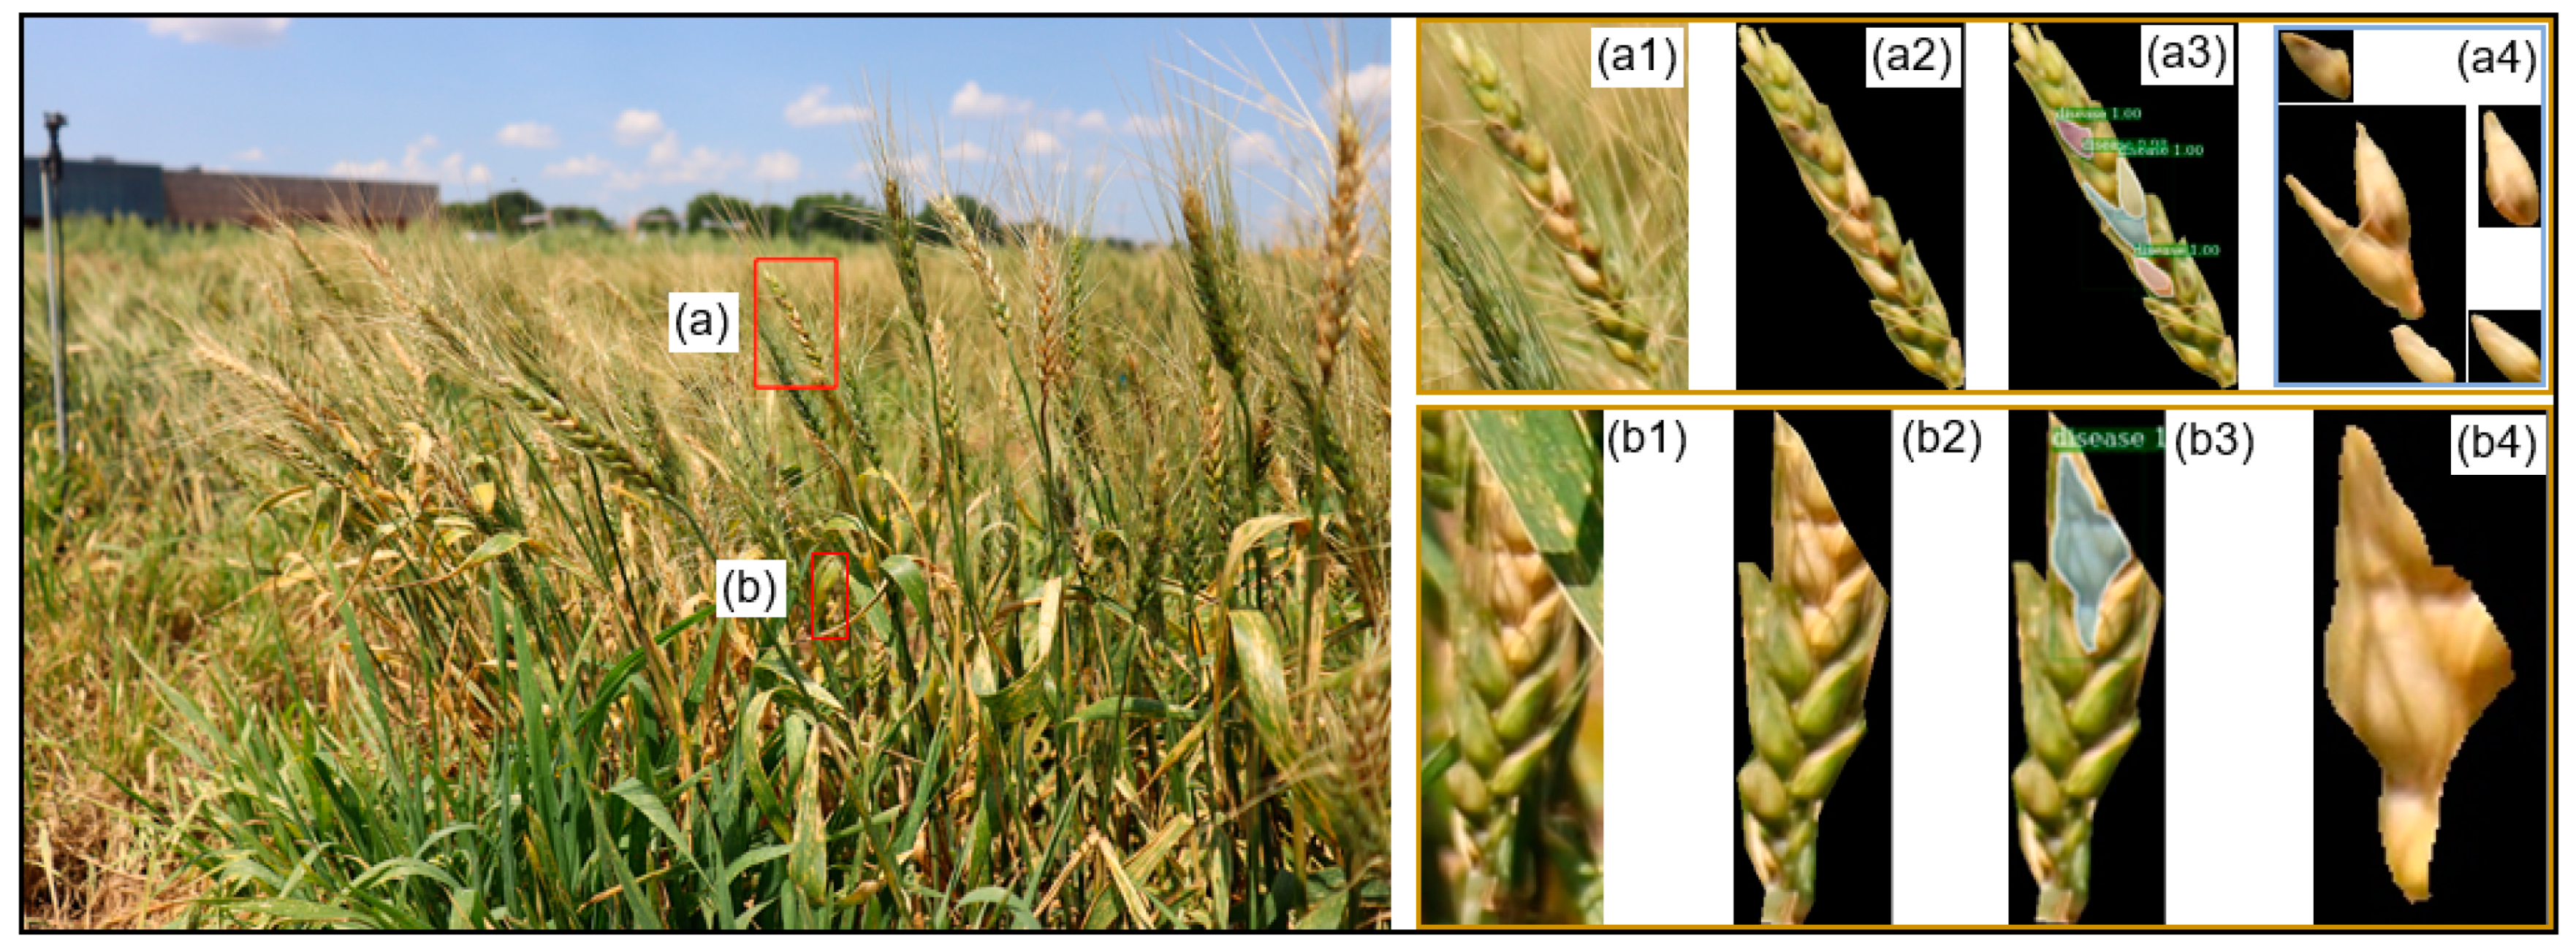
3.2. Wheat Spike Identification
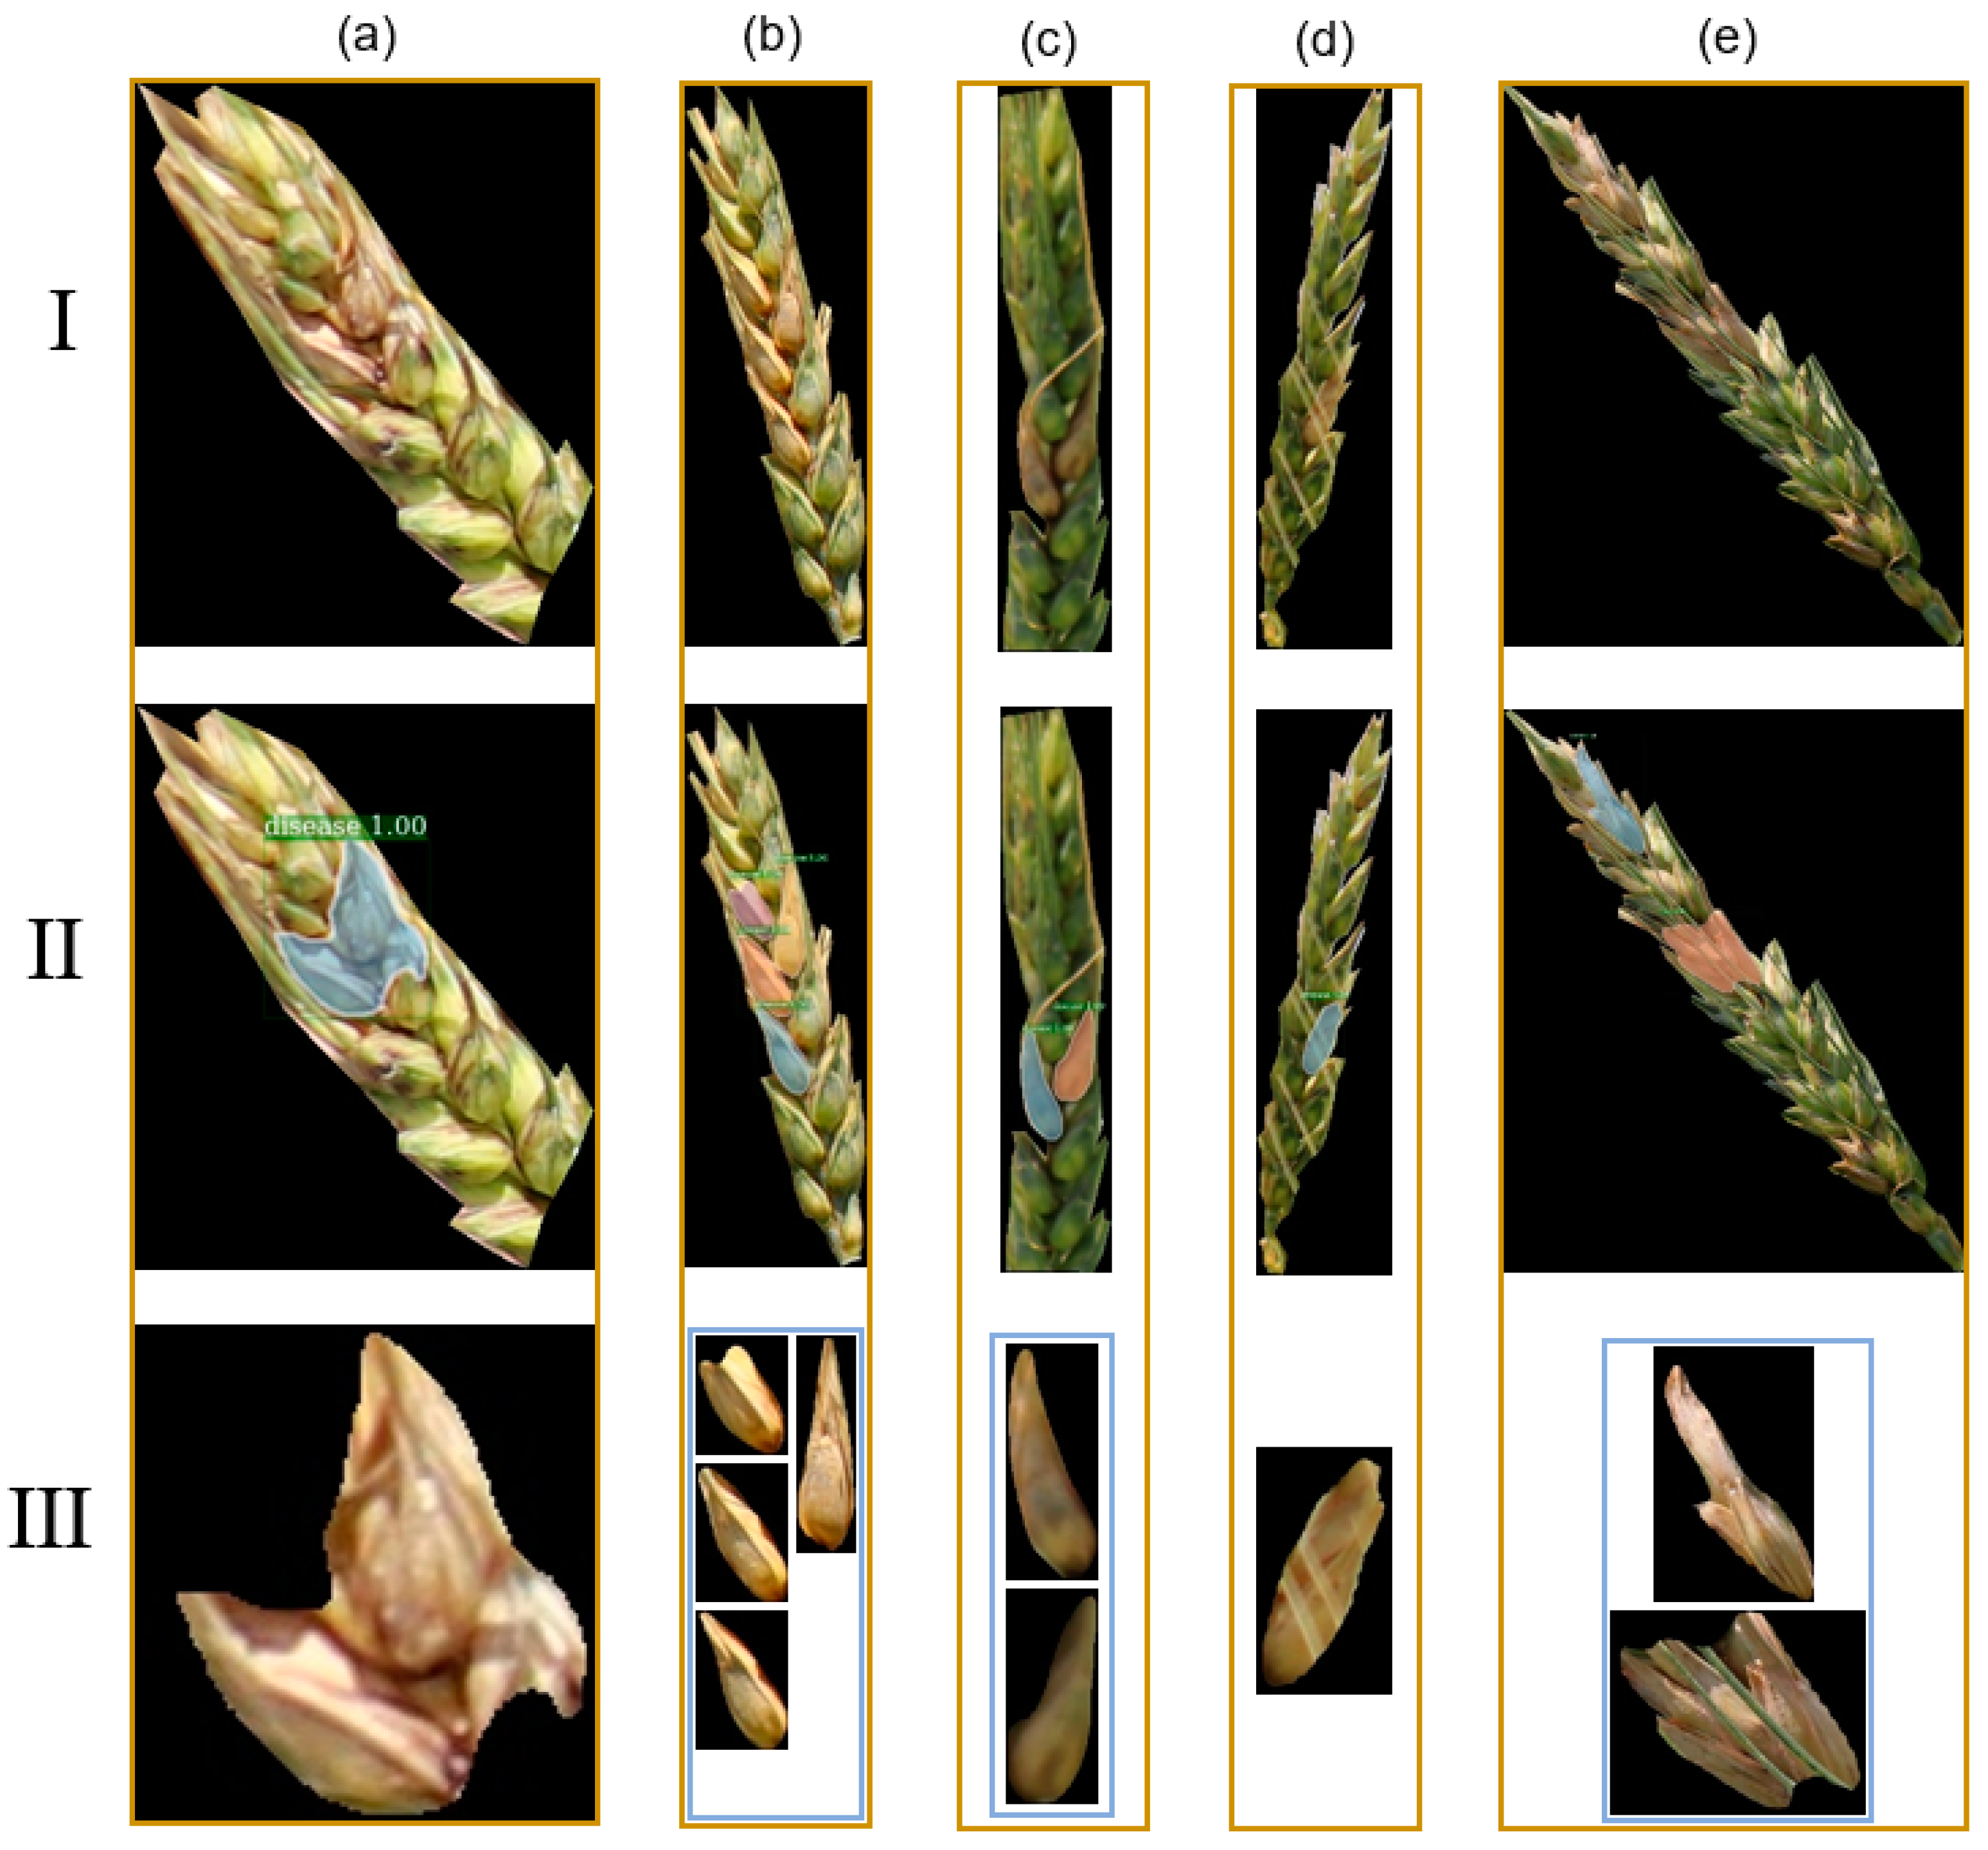
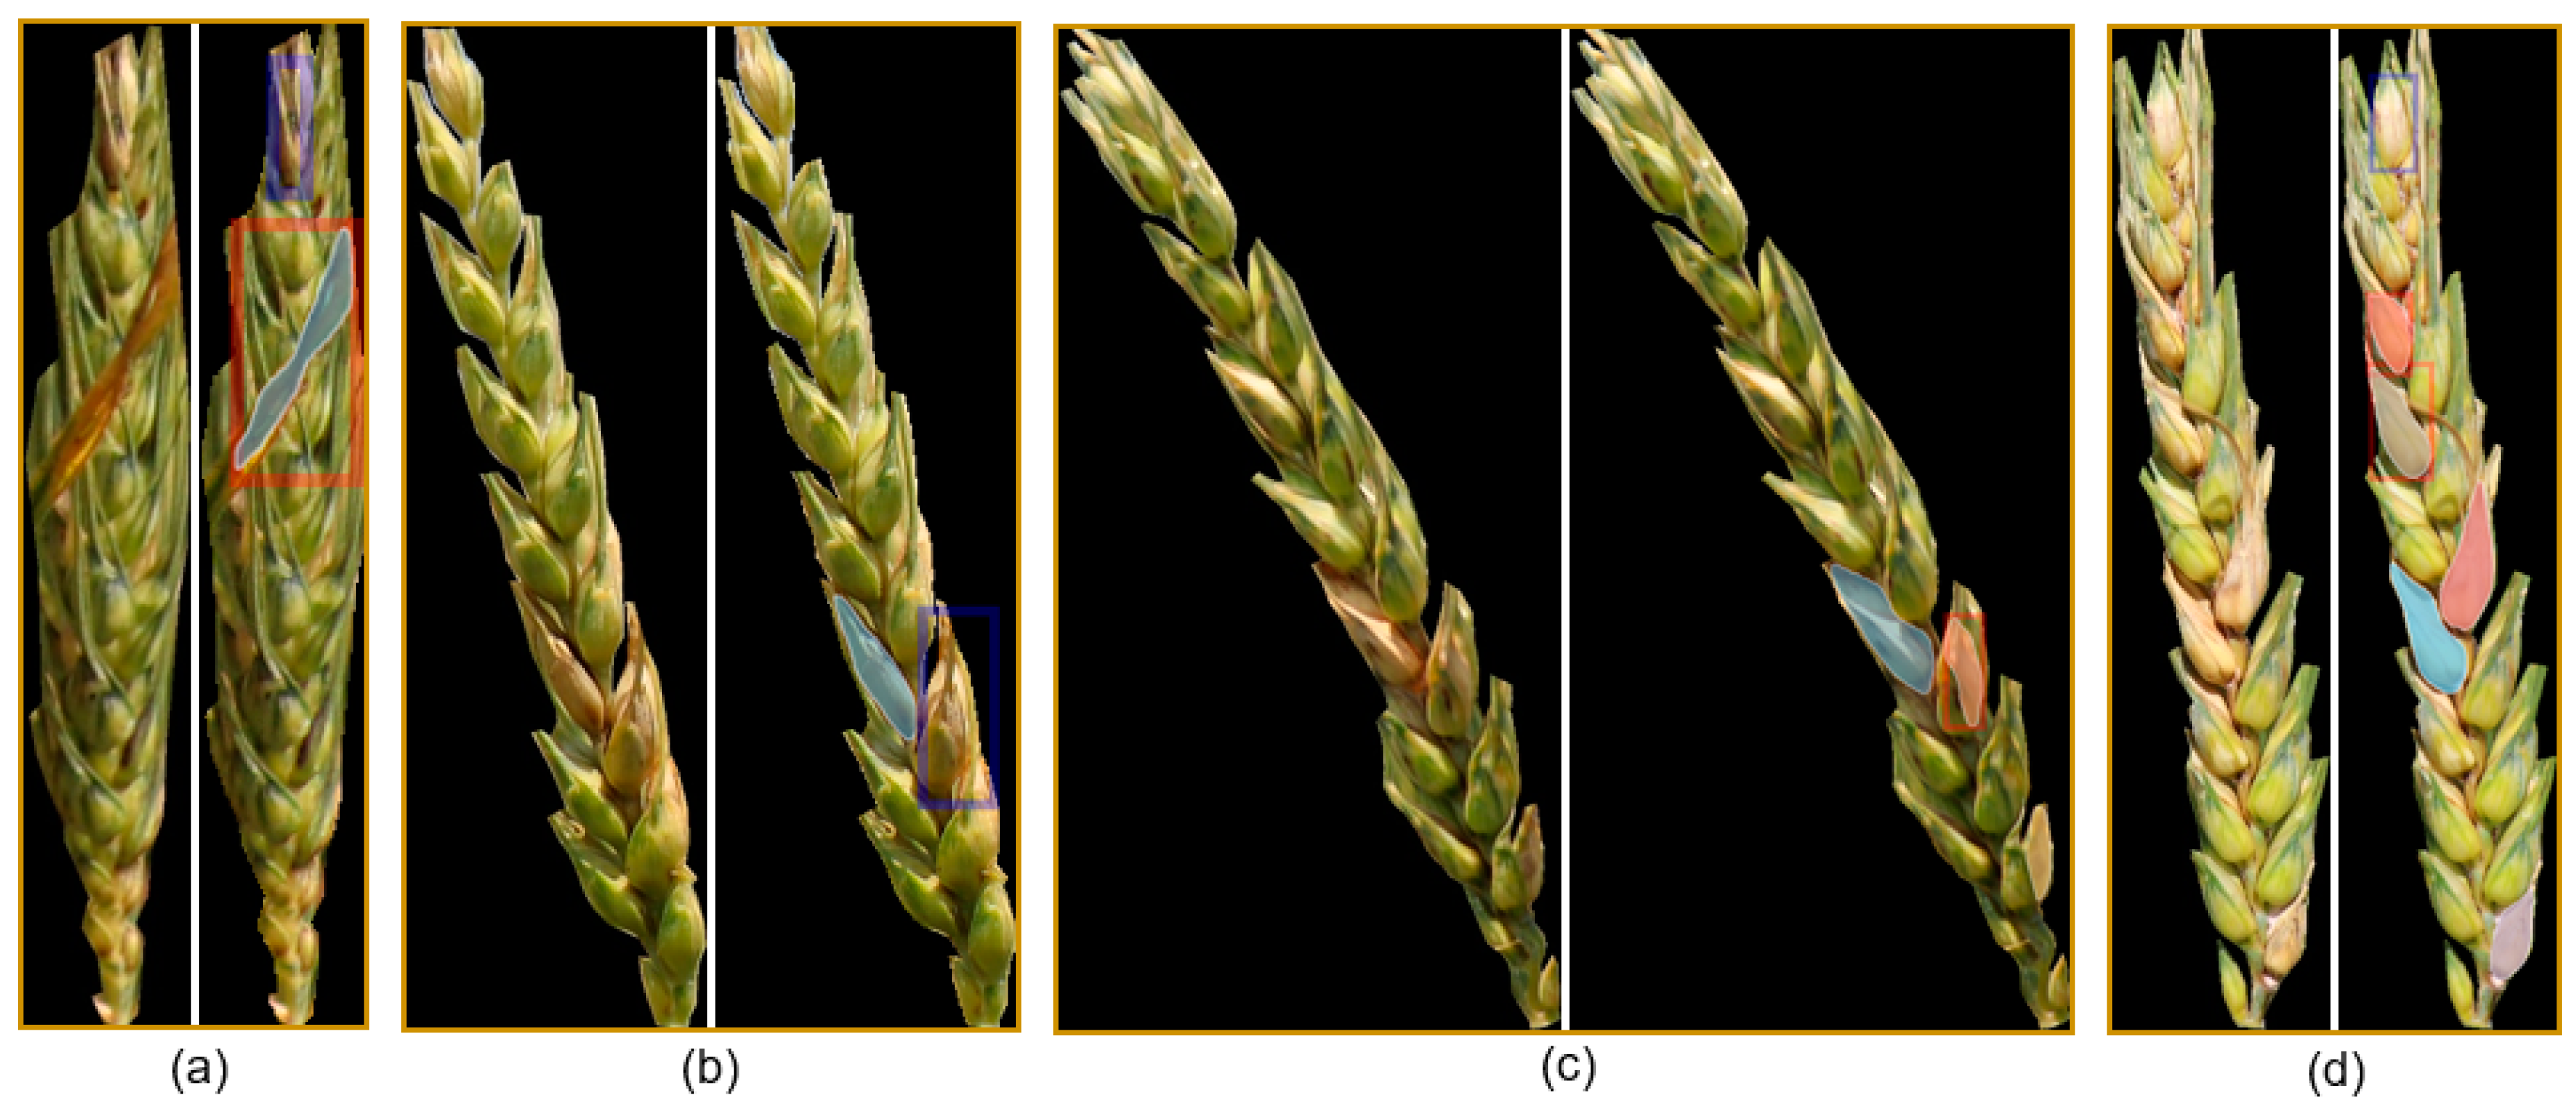
3.3. FHB Disease Evaluation
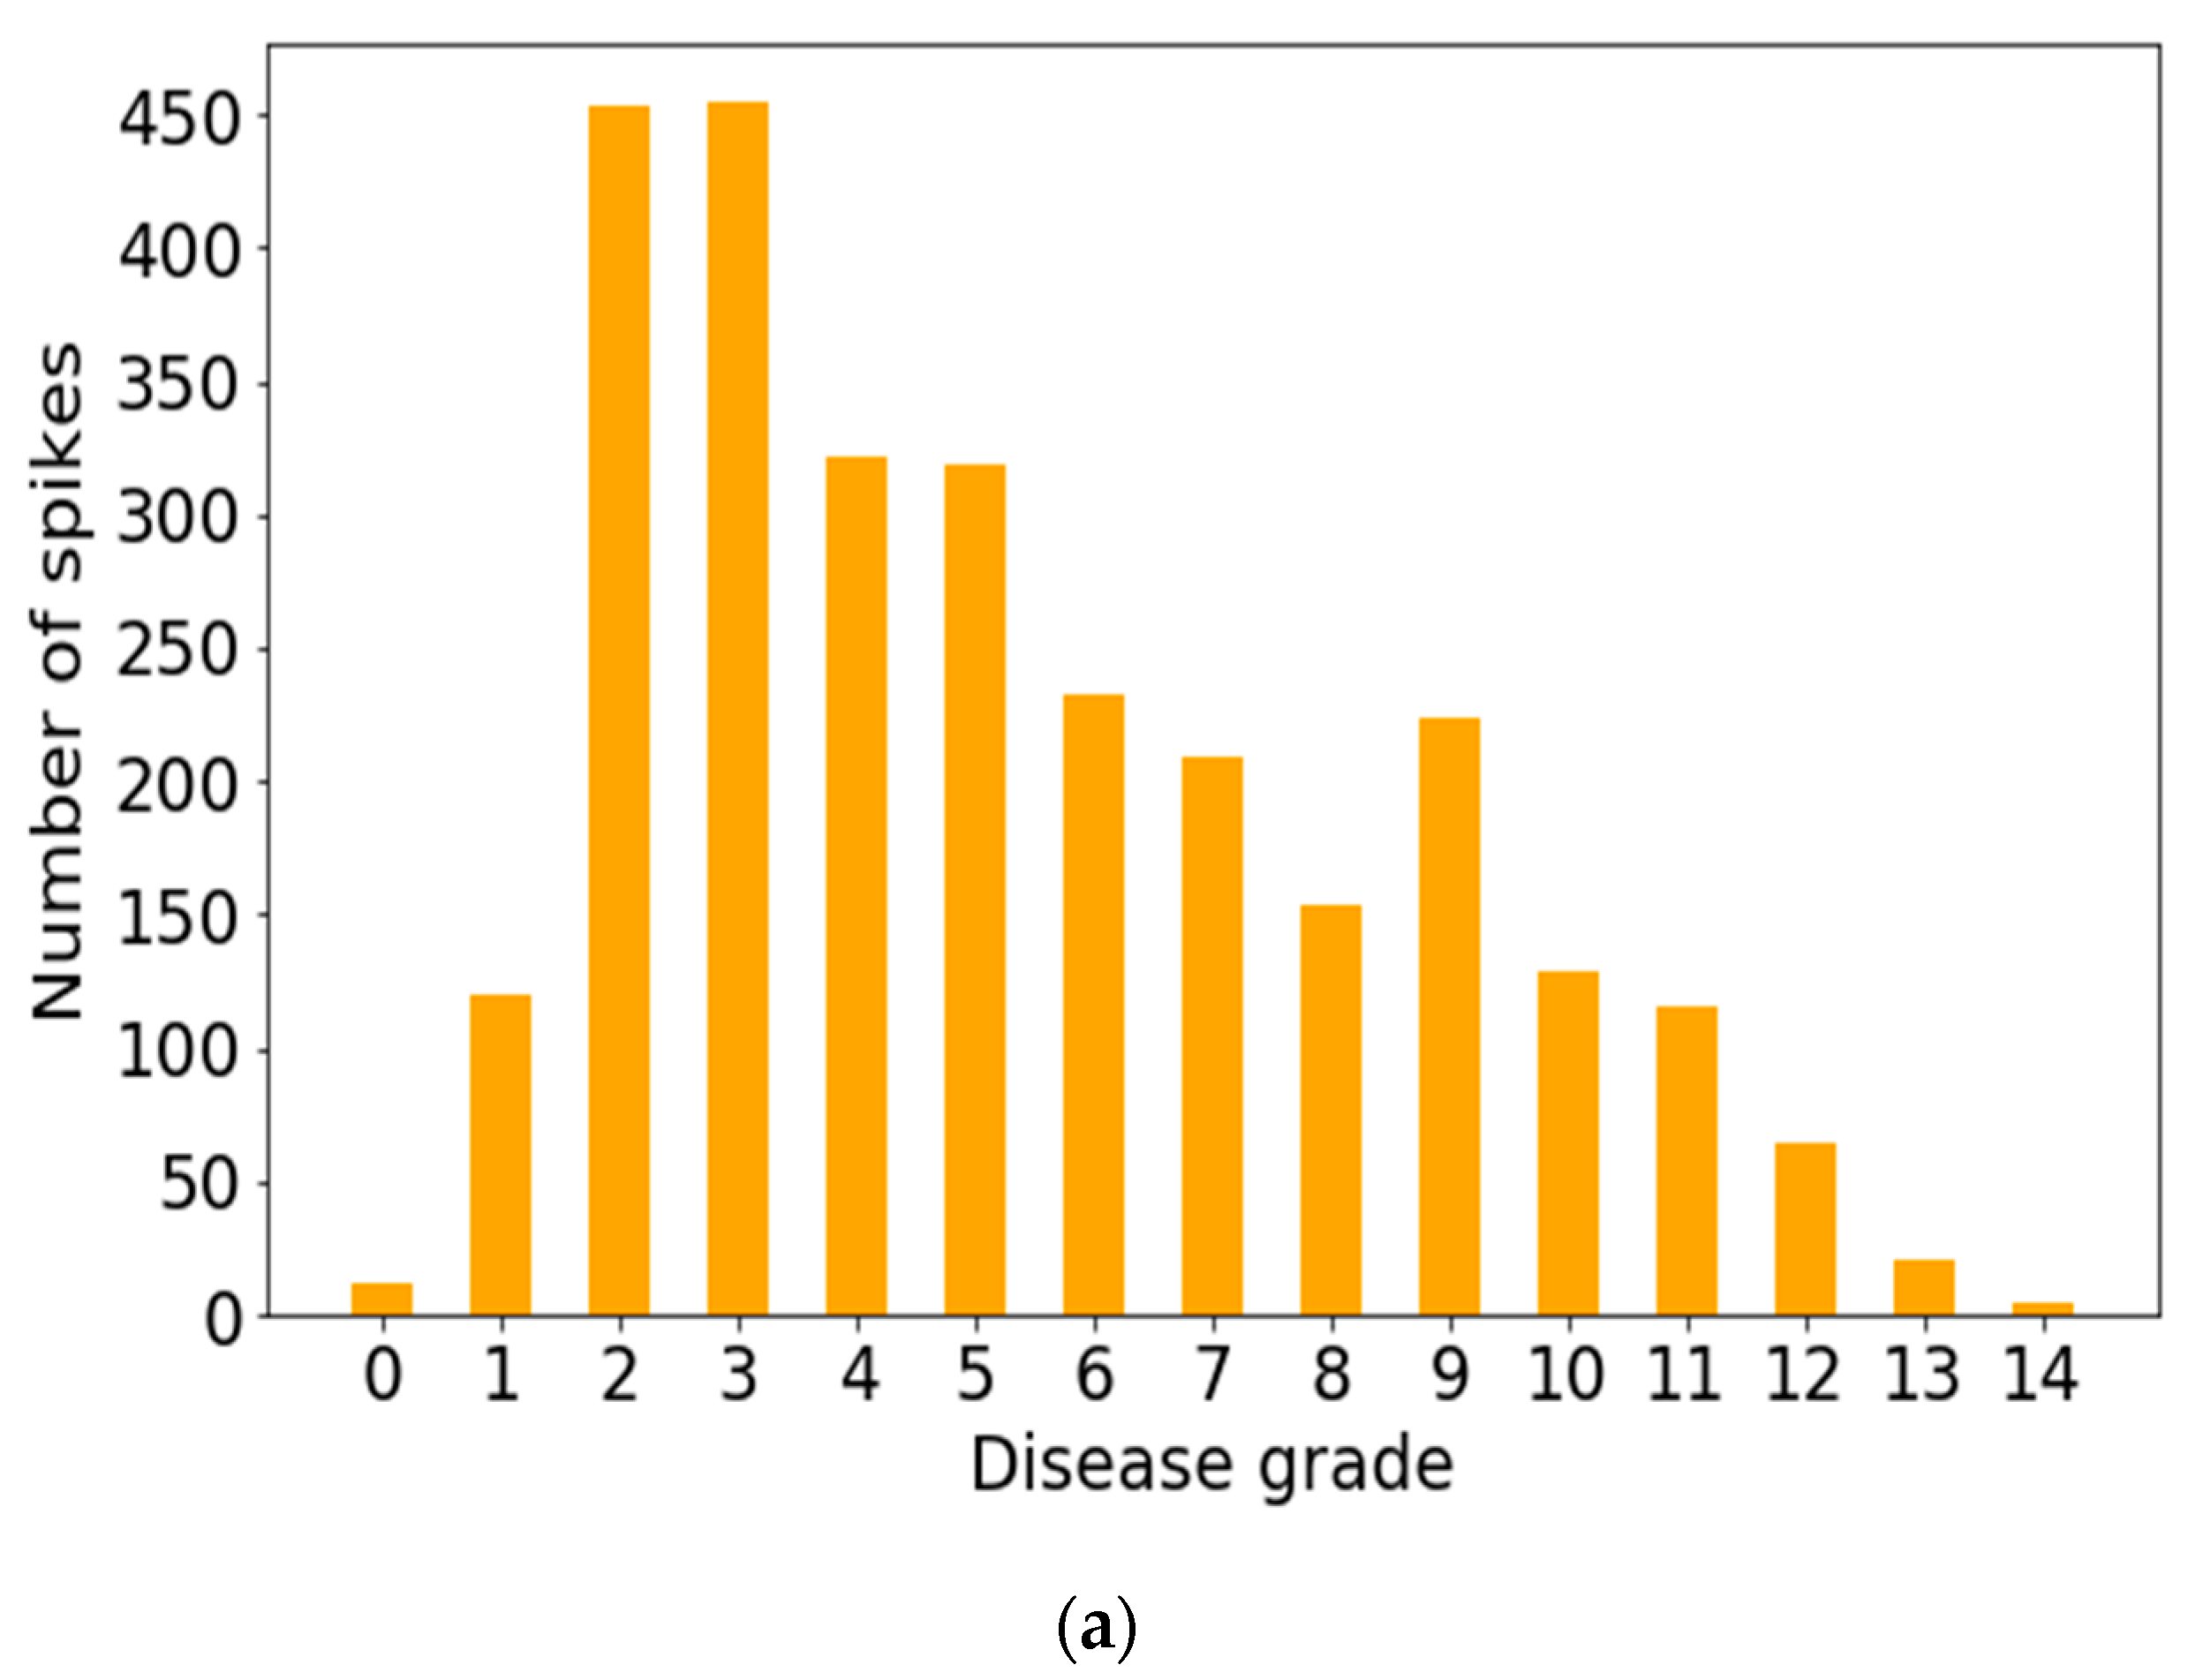
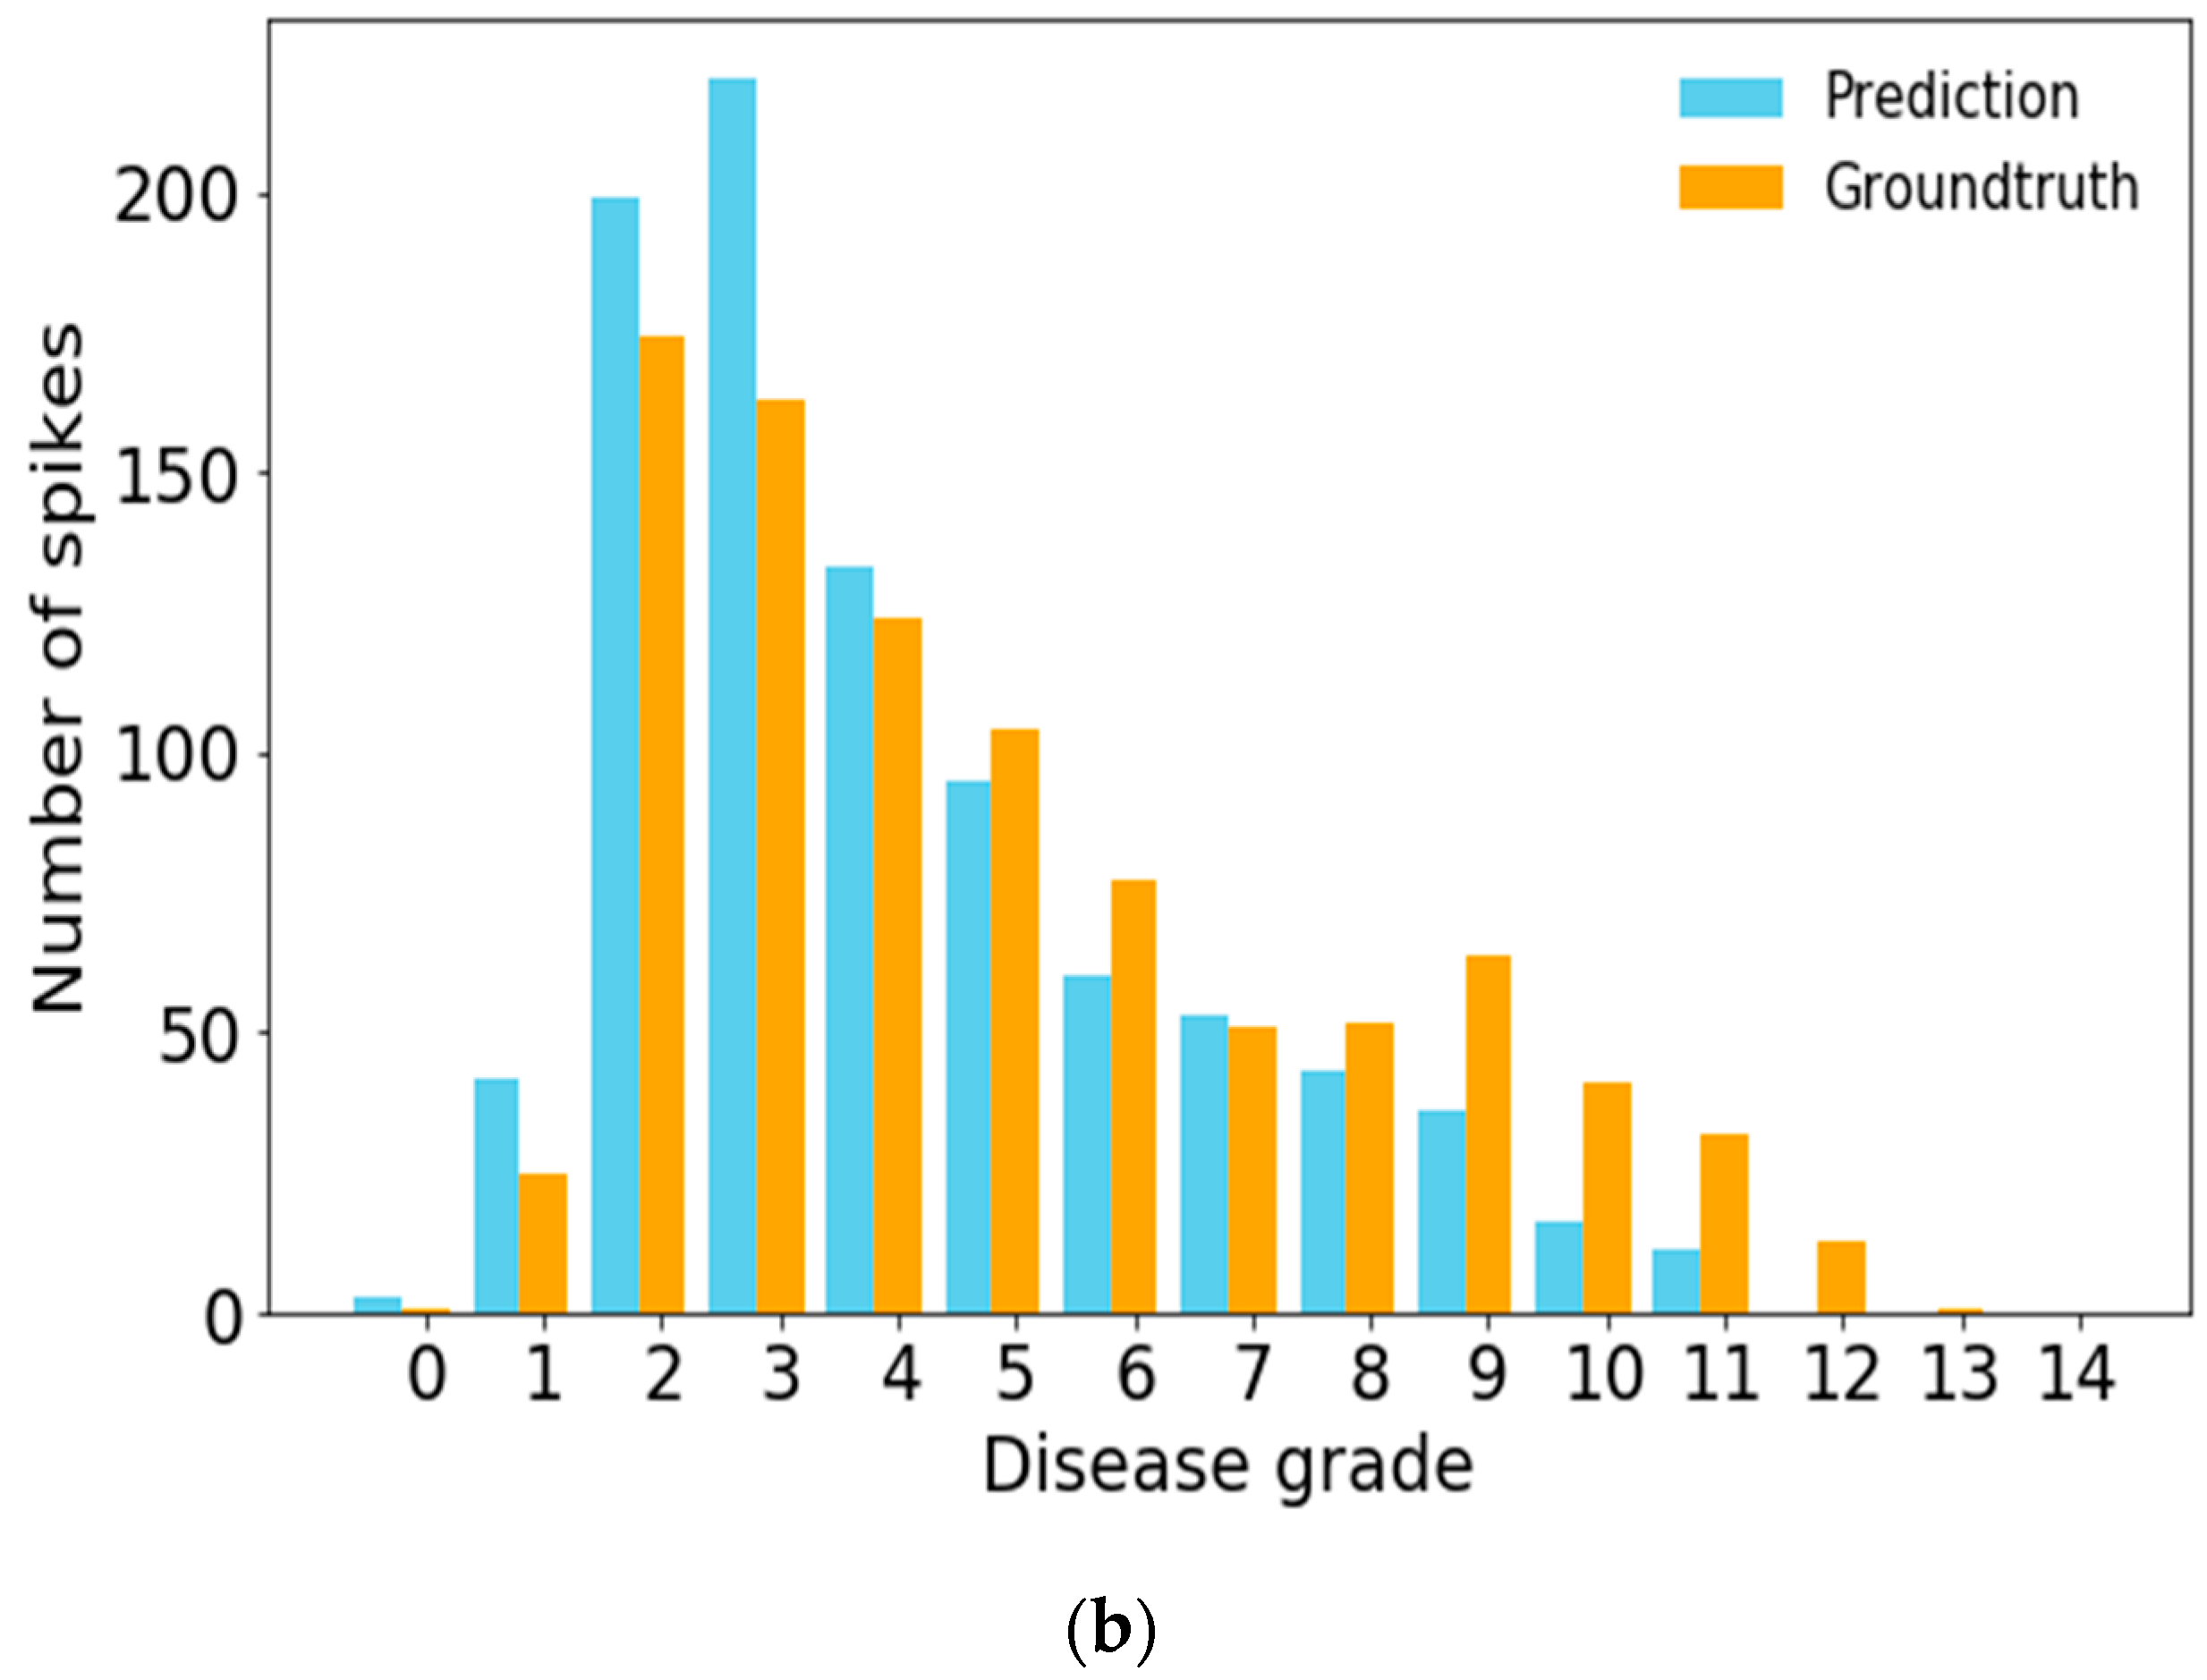
3.4. Examination of Wheat FHB Severity
4. Discussion
5. Conclusions
Author Contributions
Funding
Institutional Review Board Statement
Informed Consent Statement
Data Availability Statement
Acknowledgments
Conflicts of Interest
References
- McMullen, M.; Bergstrom, G.; De Wolf, E.; Dill-Macky, R.; Hershman, D.; Shaner, G.; Van Sanford, D. A unified effort to fight an enemy of wheat and barley: Fusarium head blight. Plant Dis. 2012, 96, 1712–1728. [Google Scholar] [CrossRef] [PubMed] [Green Version]
- Su, W.-H.; Yang, C.; Dong, Y.; Johnson, R.; Page, R.; Szinyei, T.; Hirsch, C.D.; Steffenson, B.J. Hyperspectral imaging and improved feature variable selection for automated determination of deoxynivalenol in various genetic lines of barley kernels for resistance screening. Food Chem. 2020, 128507. [Google Scholar] [CrossRef]
- Su, W.-H.; Arvanitoyannis, I.S.; Sun, D.-W. Trends in food authentication. In Modern Techniques for Food Authentication; Elsevier: Amsterdam, The Netherlands, 2018; pp. 731–758. [Google Scholar]
- Pedersen, J. Distribution of deoxynivalenol and zearalenone in milled fractions of wheat. Cereal Chem. 1996, 73, 388–391. [Google Scholar]
- Stenglein, S. Fusarium poae: A pathogen that needs more attention. J. Plant Pathol. 2009, 91, 25–36. [Google Scholar]
- Buerstmayr, H.; Ban, T.; Anderson, J.A. QTL mapping and marker-assisted selection for Fusarium head blight resistance in wheat: A review. Plant Breed. 2009, 128, 1–26. [Google Scholar] [CrossRef]
- Horsley, R.D.; Schmierer, D.; Maier, C.; Kudrna, D.; Urrea, C.A.; Steffenson, B.J.; Schwarz, P.; Franckowiak, J.; Green, M.; Zhang, B. Identification of QTLs associated with Fusarium head blight resistance in barley accession CIho 4196. Crop Sci. 2006, 46, 145–156. [Google Scholar] [CrossRef]
- Stack, R.W.; McMullen, M.P. A Visual Scale to Estimate Severity of Fusarium Head Blight in Wheat; North Dakota State University: Dakota, NE, USA, 1998. [Google Scholar]
- Fetch, T.G., Jr.; Steffenson, B.J. Rating scales for assessing infection responses of barley infected with Cochliobolus sativus. Plant Dis. 1999, 83, 213–217. [Google Scholar] [CrossRef] [Green Version]
- Su, W.-H.; Bakalis, S.; Sun, D.-W. Potato hierarchical clustering and doneness degree determination by near-infrared (NIR) and attenuated total reflectance mid-infrared (ATR-MIR) spectroscopy. J. Food Meas. Charact. 2019, 13, 1218–1231. [Google Scholar] [CrossRef]
- Su, W.-H.; Bakalis, S.; Sun, D.-W. Fingerprinting study of tuber ultimate compressive strength at different microwave drying times using mid-infrared imaging spectroscopy. Dry. Technol. 2019, 37, 1113–1130. [Google Scholar] [CrossRef]
- Su, W.-H.; Bakalis, S.; Sun, D.-W. Fourier transform mid-infrared-attenuated total reflectance (FTMIR-ATR) microspectroscopy for determining textural property of microwave baked tuber. J. Food Eng. 2018, 218, 1–13. [Google Scholar] [CrossRef] [Green Version]
- Su, W.-H.; Zhang, J.; Yang, C.; Page, R.; Szinyei, T.; Hirsch, C.D.; Steffenson, B.J. Evaluation of mask RCNN for learning to detect fusarium head blight in wheat images. In Proceedings of the 2020 ASABE Annual International Meeting, Omaha, NE, USA, 12–15 July 2020; American Society of Agricultural and Biological Engineers: Saint Joseph, MI, USA, 2020; p. 1. [Google Scholar]
- Su, W.-H.; Slaughter, D.C.; Fennimore, S.A. Non-destructive evaluation of photostability of crop signaling compounds and dose effects on celery vigor for precision plant identification using computer vision. Comput. Electron. Agric. 2020, 168, 105155. [Google Scholar] [CrossRef]
- Su, W.-H.; Fennimore, S.A.; Slaughter, D.C. Development of a systemic crop signaling system for automated real-time plant care in vegetable crops. Biosyst. Eng. 2020, 193, 62–74. [Google Scholar] [CrossRef]
- Su, W.-H.; Fennimore, S.A.; Slaughter, D.C. Fluorescence imaging for rapid monitoring of translocation behavior of systemic markers in snap beans for automated crop/weed discrimination. Biosyst. Eng. 2019, 186, 156–167. [Google Scholar] [CrossRef]
- Su, W.-H. Systemic crop signaling for automatic recognition of transplanted lettuce and tomato under different levels of sunlight for early season weed control. Challenges 2020, 11, 23. [Google Scholar] [CrossRef]
- Su, W.-H.; Sun, D.-W. Facilitated wavelength selection and model development for rapid determination of the purity of organic spelt (Triticum spelta L.) flour using spectral imaging. Talanta 2016, 155, 347–357. [Google Scholar] [CrossRef]
- Su, W.-H. Advanced Machine Learning in Point Spectroscopy, RGB- and hyperspectral-imaging for automatic discriminations of crops and weeds: A review. Smart Cities 2020, 3, 767–792. [Google Scholar] [CrossRef]
- Moghimi, A.; Yang, C.; Miller, M.E.; Kianian, S.F.; Marchetto, P.M. A novel approach to assess salt stress tolerance in wheat using hyperspectral imaging. Front. Plant Sci. 2018, 9, 1182. [Google Scholar] [CrossRef]
- Li, L.; Zhang, Q.; Huang, D. A review of imaging techniques for plant phenotyping. Sensors 2014, 14, 20078–20111. [Google Scholar] [CrossRef]
- Enders, T.A.; St. Dennis, S.; Oakland, J.; Callen, S.T.; Gehan, M.A.; Miller, N.D.; Spalding, E.P.; Springer, N.M.; Hirsch, C.D. Classifying cold-stress responses of inbred maize seedlings using RGB imaging. Plant Direct 2019, 3, e00104. [Google Scholar] [CrossRef] [Green Version]
- Whetton, R.L.; Hassall, K.L.; Waine, T.W.; Mouazen, A.M. Hyperspectral measurements of yellow rust and fusarium head blight in cereal crops: Part 1: Laboratory study. Biosyst. Eng. 2018, 166, 101–115. [Google Scholar] [CrossRef] [Green Version]
- Alisaac, E.; Behmann, J.; Kuska, M.; Dehne, H.-W.; Mahlein, A.-K. Hyperspectral quantification of wheat resistance to Fusarium head blight: Comparison of two Fusarium species. Eur. J. Plant Pathol. 2018, 152, 869–884. [Google Scholar] [CrossRef]
- Mahlein, A.-K.; Alisaac, E.; Al Masri, A.; Behmann, J.; Dehne, H.-W.; Oerke, E.-C. Comparison and combination of thermal, fluorescence, and hyperspectral imaging for monitoring fusarium head blight of wheat on spikelet scale. Sensors 2019, 19, 2281. [Google Scholar] [CrossRef] [PubMed] [Green Version]
- Ma, H.; Huang, W.; Jing, Y.; Pignatti, S.; Laneve, G.; Dong, Y.; Ye, H.; Liu, L.; Guo, A.; Jiang, J. Identification of Fusarium head blight in winter wheat ears using continuous wavelet analysis. Sensors 2020, 20, 20. [Google Scholar] [CrossRef] [PubMed] [Green Version]
- Huang, L.; Li, T.; Ding, C.; Zhao, J.; Zhang, D.; Yang, G. Diagnosis of the severity of fusarium head blight of wheat ears on the basis of image and spectral feature fusion. Sensors 2020, 20, 2887. [Google Scholar] [CrossRef] [PubMed]
- Xiao, Y.; Dong, Y.; Huang, W.; Liu, L.; Ma, H.; Ye, H.; Wang, K. dynamic remote sensing prediction for wheat fusarium head blight by combining host and habitat conditions. Remote Sens. 2020, 12, 3046. [Google Scholar] [CrossRef]
- Su, W.-H.; Sun, D.-W. Potential of hyperspectral imaging for visual authentication of sliced organic potatoes from potato and sweet potato tubers and rapid grading of the tubers according to moisture proportion. Comput. Electron. Agric. 2016, 125, 113–124. [Google Scholar] [CrossRef]
- Zhang, D.-Y.; Chen, G.; Yin, X.; Hu, R.-J.; Gu, C.-Y.; Pan, Z.-G.; Zhou, X.-G.; Chen, Y. Integrating spectral and image data to detect Fusarium head blight of wheat. Comput. Electron. Agric. 2020, 175, 105588. [Google Scholar] [CrossRef]
- Su, W.-H.; Sun, D.-W. Advanced analysis of roots and tubers by hyperspectral techniques. Adv. Food Nutr. Res. 2019, 87, 255–303. [Google Scholar]
- Su, W.-H.; Bakalis, S.; Sun, D.-W. Chemometric determination of time series moisture in both potato and sweet potato tubers during hot air and microwave drying using near/mid-infrared (NIR/MIR) hyperspectral techniques. Dry. Technol. 2020, 38, 806–823. [Google Scholar] [CrossRef]
- Su, W.H.; Sun, D.W. Multispectral imaging for plant food quality analysis and visualization. Compr. Rev. Food Sci. Food Saf. 2018, 17, 220–239. [Google Scholar]
- Su, W.-H.; Sun, D.-W. Evaluation of spectral imaging for inspection of adulterants in terms of common wheat flour, cassava flour and corn flour in organic Avatar wheat (Triticum spp.) flour. J. Food Eng. 2017, 200, 59–69. [Google Scholar] [CrossRef]
- Su, W.-H.; Sun, D.-W. Chemical imaging for measuring the time series variations of tuber dry matter and starch concentration. Comput. Electron. Agric. 2017, 140, 361–373. [Google Scholar] [CrossRef]
- Su, W.-H.; He, H.-J.; Sun, D.-W. Non-destructive and rapid evaluation of staple foods quality by using spectroscopic techniques: A review. Critical Rev. Food Sci. Nutr. 2017, 57, 1039–1051. [Google Scholar] [CrossRef] [PubMed]
- Su, W.-H.; Sun, D.-W. Multivariate analysis of hyper/multi-spectra for determining volatile compounds and visualizing cooking degree during low-temperature baking of tubers. Comput. Electron. Agric. 2016, 127, 561–571. [Google Scholar] [CrossRef]
- Su, W.-H.; Sun, D.-W. Comparative assessment of feature-wavelength eligibility for measurement of water binding capacity and specific gravity of tuber using diverse spectral indices stemmed from hyperspectral images. Comput. Electron. Agric. 2016, 130, 69–82. [Google Scholar] [CrossRef]
- Dammer, K.-H.; Möller, B.; Rodemann, B.; Heppner, D. Detection of head blight (Fusarium ssp.) in winter wheat by color and multispectral image analyses. Crop Prot. 2011, 30, 420–428. [Google Scholar] [CrossRef]
- Zhang, D.; Wang, Z.; Jin, N.; Gu, C.; Chen, Y.; Huang, Y. Evaluation of efficacy of fungicides for control of wheat fusarium head blight based on digital imaging. IEEE Access 2020, 8, 109876–109890. [Google Scholar] [CrossRef]
- Fu, J.; Zheng, H.; Mei, T. Look closer to see better: Recurrent attention convolutional neural network for fine-grained image recognition. In Proceedings of the 2017 IEEE Conference on Computer Vision and Pattern Recognition (CVPR), Honolulu, HI, USA, 21–26 July 2017; pp. 4438–4446. [Google Scholar]
- Lawrence, S.; Giles, C.L.; Tsoi, A.C.; Back, A.D. Face recognition: A convolutional neural-network approach. IEEE Trans. Neural Netw. 1997, 8, 98–113. [Google Scholar] [CrossRef] [Green Version]
- Zhou, L.; Gu, X. Embedding topological features into convolutional neural network salient object detection. Neural Netw. 2020, 121, 308–318. [Google Scholar] [CrossRef]
- Hasan, M.M.; Chopin, J.P.; Laga, H.; Miklavcic, S.J. Detection and analysis of wheat spikes using convolutional neural networks. Plant Methods 2018, 14, 100. [Google Scholar] [CrossRef] [Green Version]
- Pound, M.P.; Atkinson, J.A.; Wells, D.M.; Pridmore, T.P.; French, A.P. Deep learning for multi-task plant phenotyping. In Proceedings of the 2017 IEEE International Conference on Computer Vision Workshops (ICCVW), Venice, Italy, 22–29 October 2017; pp. 2055–2063. [Google Scholar]
- Zhang, D.; Wang, D.; Gu, C.; Jin, N.; Zhao, H.; Chen, G.; Liang, H.; Liang, D. Using neural network to identify the severity of wheat fusarium head blight in the field environment. Remote Sens. 2019, 11, 2375. [Google Scholar] [CrossRef] [Green Version]
- Qiu, R.; Yang, C.; Moghimi, A.; Zhang, M.; Steffenson, B.J.; Hirsch, C.D. Detection of fusarium head blight in wheat using a deep neural network and color imaging. Remote Sens. 2019, 11, 2658. [Google Scholar] [CrossRef] [Green Version]
- Prakash, R.M.; Saraswathy, G.; Ramalakshmi, G.; Mangaleswari, K.; Kaviya, T. Detection of leaf diseases and classification using digital image processing. In Proceedings of the 2017 International Conference on Innovations in Information, Embedded and Communication Systems (ICIIECS), Coimbatore, India, 17–18 March 2017; pp. 1–4. [Google Scholar]
- He, K.; Gkioxari, G.; Dollár, P.; Girshick, R. Mask r-CNN. In Proceedings of the IEEE International Conference on Computer Vision, Venice, Italy, 22–29 October 2017; pp. 2961–2969. [Google Scholar]
- Ganesh, P.; Volle, K.; Burks, T.; Mehta, S. Deep orange: Mask R-CNN based orange detection and segmentation. IFAC PapersOnLine 2019, 52, 70–75. [Google Scholar] [CrossRef]
- Jia, W.; Tian, Y.; Luo, R.; Zhang, Z.; Lian, J.; Zheng, Y. Detection and segmentation of overlapped fruits based on optimized mask R-CNN application in apple harvesting robot. Comput. Electron. Agric. 2020, 172, 105380. [Google Scholar] [CrossRef]
- Yang, K.; Zhong, W.; Li, F. Leaf segmentation and classification with a complicated background using deep learning. Agronomy 2020, 10, 1721. [Google Scholar] [CrossRef]
- Tian, Y.; Yang, G.; Wang, Z.; Li, E.; Liang, Z. Instance segmentation of apple flowers using the improved mask R–CNN model. Biosyst. Eng. 2020, 193, 264–278. [Google Scholar] [CrossRef]
- Steffenson, B. Fusarium head blight of barley: Impact, epidemics, management, and strategies for identifying and utilizing genetic resistance. In Fusarium Head Blight of Wheat and Barley; American Pytopathology Press: St. Paul, MN, USA, 2003. [Google Scholar]
- Bauriegel, E.; Giebel, A.; Geyer, M.; Schmidt, U.; Herppich, W. Early detection of Fusarium infection in wheat using hyper-spectral imaging. Comput. Electron. Agric. 2011, 75, 304–312. [Google Scholar] [CrossRef]
- Cai, L.; Long, T.; Dai, Y.; Huang, Y. Mask R-CNN based detection and segmentation for pulmonary nodule 3D visualization diagnosis. IEEE Access 2020, 8, 44400–44409. [Google Scholar] [CrossRef]
- He, K.; Zhang, X.; Ren, S.; Sun, J. Deep residual learning for image recognition. In Proceedings of the 2016 IEEE Conference on Computer Vision and Pattern Recognition (CVPR), Las Vegas, NV, USA, 27–30 June 2016; pp. 770–778. [Google Scholar]
- He, K.; Zhang, X.; Ren, S.; Sun, J. Identity mappings in deep residual networks. In Proceedings of the 14th European Conference on Computer Vision, Amsterdam, The Netherlands, 11–14 October 2016; Springer: Cham, Switzerland, 2016; pp. 630–645. [Google Scholar]
- Dai, J.; He, K.; Sun, J. Instance-aware semantic segmentation via multi-task network cascades. In Proceedings of the 2016 IEEE Conference on Computer Vision and Pattern Recognition (CVPR), Las Vegas, NV, USA, 27–30 June 2016; pp. 3150–3158. [Google Scholar]
- Lin, T.-Y.; Dollár, P.; Girshick, R.; He, K.; Hariharan, B.; Belongie, S. Feature pyramid networks for object detection. In Proceedings of the 2017 IEEE Conference on Computer Vision and Pattern Recognition (CVPR), Honolulu, HI, USA, 21–26 July 2017; pp. 2117–2125. [Google Scholar]
- Ioffe, S.; Szegedy, C. Batch normalization: Accelerating deep network training by reducing internal covariate shift. arXiv 2015, arXiv:1502.03167. Available online: https://arxiv.org/abs/1502.03167 (accessed on 21 December 2020).
- Powers, D.M. Evaluation: From Precision, Recall and F-Measure to ROC, Informedness, Markedness and Correlation; School of Informatics and Engineering Flinders University: Adelaide, AUS, Australia, 2011. [Google Scholar]
- Zhang, X.; Graepel, T.; Herbrich, R. Bayesian online learning for multi-label and multi-variate performance measures. In Proceedings of the Thirteenth International Conference on Artificial Intelligence and Statistics, Sardinia, Italy, 13–15 May 2010; pp. 956–963. [Google Scholar]
- Hsu, K.-J.; Tsai, C.-C.; Lin, Y.-Y.; Qian, X.; Chuang, Y.-Y. Unsupervised CNN-based co-saliency detection with graphical optimization. In Proceedings of the European Conference on Computer Vision (ECCV), Munich, Germany, 8–14 September 2018; pp. 485–501. [Google Scholar]
- Shi, J.; Chang, Y.; Xu, C.; Khan, F.; Chen, G.; Li, C. Real-time leak detection using an infrared camera and Faster R-CNN technique. Comput. Chem. Eng. 2020, 135, 106780. [Google Scholar] [CrossRef]
- Garcia-Garcia, A.; Orts-Escolano, S.; Oprea, S.; Villena-Martinez, V.; Garcia-Rodriguez, J. A review on deep learning techniques applied to semantic segmentation. arXiv 2017, arXiv:1704.06857. Available online: https://arxiv.org/abs/1704.06857 (accessed on 21 December 2020).
- Leplat, J.; Mangin, P.; Falchetto, L.; Heraud, C.; Gautheron, E.; Steinberg, C. Visual assessment and computer–assisted image analysis of Fusarium head blight in the field to predict mycotoxin accumulation in wheat grains. Eur. J. Plant Pathol. 2018, 150, 1065–1081. [Google Scholar] [CrossRef]
- Zhang, D.; Wang, D.; Du, S.; Huang, L.; Zhao, H.; Liang, D.; Gu, C.; Yang, X. A rapidly diagnosis and application system of fusarium head blight based on smartphone. In Proceedings of the 2019 8th International Conference on Agro-Geoinformatics (Agro-Geoinformatics), Istanbul, Turkey, 16–19 July 2019; pp. 1–5. [Google Scholar]
- Williams, H.A.; Jones, M.H.; Nejati, M.; Seabright, M.J.; Bell, J.; Penhall, N.D.; Barnett, J.J.; Duke, M.D.; Scarfe, A.J.; Ahn, H.S. Robotic kiwifruit harvesting using machine vision, convolutional neural networks, and robotic arms. Biosyst. Eng. 2019, 181, 140–156. [Google Scholar] [CrossRef]
- Li, D.; Wang, R.; Xie, C.; Liu, L.; Zhang, J.; Li, R.; Wang, F.; Zhou, M.; Liu, W. A recognition method for rice plant diseases and pests video detection based on deep convolutional neural network. Sensors 2020, 20, 578. [Google Scholar] [CrossRef] [Green Version]
- Yu, Y.; Zhang, K.; Yang, L.; Zhang, D. Fruit detection for strawberry harvesting robot in non-structural environment based on Mask-RCNN. Comput. Electron. Agric. 2019, 163, 104846. [Google Scholar] [CrossRef]
- Kiratiratanapruk, K.; Temniranrat, P.; Kitvimonrat, A.; Sinthupinyo, W.; Patarapuwadol, S. Using deep learning techniques to detect rice diseases from images of rice fields. In Proceedings of the 33rd International Conference on Industrial, Engineering and Other Applications of Applied Intelligent Systems, Kitakyushu, Japan, 21–24 July 2020; Springer: Cham, Switzerland, 2020; pp. 225–237. [Google Scholar]
- Kang, H.; Chen, C. Fast implementation of real-time fruit detection in apple orchards using deep learning. Comput. Electron. Agric. 2020, 168, 105108. [Google Scholar] [CrossRef]


| Modelling Parameters | Values |
|---|---|
| Base learning rate | 0.02 |
| Image input batch size | 2 |
| Gamma | 0.1 |
| Number of classes | 2 |
| Maximum iterations | 2,700,000 |
| Application | Training Time | Validation Time |
|---|---|---|
| Wheat spike identification | 45 h 23 min 26 s | 16 min 30 s |
| FHB disease detection | 23 h 46 min 58 s | 1 min 28 s |
| Type | P (%) | R (%) | F1-Score (%) | IoU (%) | AP of Bbox (%) | AP of Mask (%) | MIoU (%) |
|---|---|---|---|---|---|---|---|
| Wheat spike | 81.52 | 71.00 | 74.78 | 46.41 | 56.69 | 57.16 | 52.49 |
| FHB disease | 72.10 | 76.16 | 74.04 | 51.24 | 63.38 | 65.14 | 51.18 |
| Dataset | Type | No. of Spikes | Severity (%) | ||
|---|---|---|---|---|---|
| Mean ± SD | Max | Min | |||
| Training | Ground truth | 2382 | 13.23 ± 10.44 | 85.51 | 0.50 |
| Validation | Ground truth | 922 | 12.01 ± 8.81 | 50.16 | 0.89 |
| Prediction | 911 | 9.27 ± 6.15 | 34.68 | 0.86 | |
Publisher’s Note: MDPI stays neutral with regard to jurisdictional claims in published maps and institutional affiliations. |
© 2020 by the authors. Licensee MDPI, Basel, Switzerland. This article is an open access article distributed under the terms and conditions of the Creative Commons Attribution (CC BY) license (http://creativecommons.org/licenses/by/4.0/).
Share and Cite
Su, W.-H.; Zhang, J.; Yang, C.; Page, R.; Szinyei, T.; Hirsch, C.D.; Steffenson, B.J. Automatic Evaluation of Wheat Resistance to Fusarium Head Blight Using Dual Mask-RCNN Deep Learning Frameworks in Computer Vision. Remote Sens. 2021, 13, 26. https://doi.org/10.3390/rs13010026
Su W-H, Zhang J, Yang C, Page R, Szinyei T, Hirsch CD, Steffenson BJ. Automatic Evaluation of Wheat Resistance to Fusarium Head Blight Using Dual Mask-RCNN Deep Learning Frameworks in Computer Vision. Remote Sensing. 2021; 13(1):26. https://doi.org/10.3390/rs13010026
Chicago/Turabian StyleSu, Wen-Hao, Jiajing Zhang, Ce Yang, Rae Page, Tamas Szinyei, Cory D. Hirsch, and Brian J. Steffenson. 2021. "Automatic Evaluation of Wheat Resistance to Fusarium Head Blight Using Dual Mask-RCNN Deep Learning Frameworks in Computer Vision" Remote Sensing 13, no. 1: 26. https://doi.org/10.3390/rs13010026