Article

Impacts of the Kuroshio Intrusion through the Luzon Strait on the Local Precipitation Anomaly

1
Department of Earth Science, National Taiwan Normal University, No. 88, Sec. 4, Tingzhou Rd., Wenshan District, Taipei 11677, Taiwan
2
Climate Atmospheric Science and Physical Oceanography, Scripps, Institution of Oceanography, La Jolla, CA 92093, USA
3
Department of Marine Environmental Informatics, National Taiwan Ocean University, No. 2, Beining Rd., Zhongzheng District, Keelung 20224, Taiwan
4
Department of Atmospheric and Oceanic Science, University of Maryland, College Park, MD 20742, USA
5
Institute of Oceanography, National Taiwan University, No. 1, Sec. 4, Roosevelt Rd., Taipei 10617, Taiwan
*
Author to whom correspondence should be addressed.
Remote Sens. 2021, 13(6), 1113; https://doi.org/10.3390/rs13061113
Submission received: 4 March 2021 / Revised: 10 March 2021 / Accepted: 11 March 2021 / Published: 15 March 2021

Abstract

:
The Kuroshio Current has its origin in the northwestern Pacific, flowing northward to the east of Taiwan and the northern part of Luzon Island. As the Kuroshio Current flows northward, it quasi-periodically intrudes (hereafter referred to as Kuroshio intrusion (KI)) into the northern South China Sea (SCS) basin through the Luzon Strait. Despite the complex generation mechanisms of KI, the purpose of this study is to improve our understanding of the effects of KI through the Luzon Strait on the regional atmospheric and weather variations. Long-term multiple satellite observations, including absolute dynamic topography, absolute geostrophic currents, sea surface winds by ASCAT, multi-scale ultra-high resolution sea surface temperature (MURSST) level-four analysis, and research-quality three-hourly TRMM multi-satellite precipitation analysis (TMPA), was used to systematically examine the aforementioned scientific problem. Analysis indicates that the KI is interlinked with the consequential anomalous precipitation off southwestern Taiwan. This anomalous precipitation would lead to ~560 million tons of freshwater influx during each KI event. Subsequently, independent moisture budget analysis suggests that moisture, mainly from vertical advection, is the possible source of the precipitation anomaly. Additionally, a bulk formula analysis was applied to understand how KI can trigger the precipitation anomaly through vertical advection of moisture without causing an evident change in the low-level flows. These new research findings might reconcile the divisiveness on why winds are not showing a synchronous response during the KI and consequential anomalous precipitation events.

Graphical Abstract

1. Introduction

The Kuroshio Current is a western boundary current in the northwestern Pacific that is characterized by higher temperature and salinity than the surrounding ocean waters at its latitude. The westward flowing North Equatorial Current (NEC) runs into the Philippine coast and bifurcates around 12°N into northward-flowing Kuroshio Current and southward flowing Mindanao Current [1]. The Kuroshio Current flows northward to the east of northern Luzon Island and passes through an open channel of Luzon Strait, between northern Luzon Island and Taiwan, and reaches the southeast coast of Taiwan (as shown in Figure 1). As Kuroshio Current progresses through the Luzon Strait, it generally flows northwestward into the South China Sea (SCS) through mainly the Balintang Channel. Most of the Kuroshio waters that intruded into the SCS forms a loop and flows back into northwestern Pacific through the Bashi Channel. While, occasionally, some water surrounding the northern Luzon Strait might turn further westward and intrude into the northern SCS [2]. This looping of the Kuroshio Current and its intrusion through the Luzon Strait affects the temperature, salinity, currents, and eddy generation and distribution in the SCS [3,4,5], in particular in the northern basin. In this study, we attempt to clarify the possible atmospheric responses triggered by the unusual warm Kuroshio intrusion (KI) into the northeastern SCS, in addition to the impact of KI on the surrounding oceanic environment.
The impact of the regional oceanic features on the overlying marine-atmospheric boundary layer has been well documented in numerous previous studies. For example, Frenger et al. [6] examined more than 600,000 individual eddies and their associated atmospheric responses in the Southern Ocean using satellite data. Their results showed that cyclonic eddies would trigger a weakening of sea surface winds (SSWs), a decline of cloud fraction and water content, and a reduction in rainfall through the mechanism in which sea surface temperature (SST) anomalies associated with the oceanic eddies modify turbulence in the atmospheric boundary layers. Based on high-resolution satellite measurements, co-variability of SST and surface wind speed was observed in the eastern Pacific tropical instability waves [7]. Nonaka and Xie [8] indicated that surface wind speed increases over the warm meanders of Kuroshio Extension based on Tropical Rainfall Measuring Mission (TRMM) Microwave Imager (TMI) observations. Meanwhile, previous investigations also indicated that changes in local winds may have an important role in determining the climate in the coastal regions, because they influence the characteristic air flow, precipitation, humidity and even pollutant transports [9,10,11,12]. Modulated vertical momentum flux within the boundary layer and pressure gradient force was usually considered as the key mechanisms between wind modulation and SST change [13,14]. Lindzen and Nigam [13] proposed that the SST variation induces direct changes to the air temperature above and thus changes the pressure in the atmosphere. Subsequently, low-level winds would converge (diverge) onto warm (cold) SST patches due to hydrostatic balance. Wallace et al. [14] indicated that the meridional component of the trade wind was correlated with the SST in the cold tongue in the eastern tropical Pacific because the high winds aloft were decoupled from surface winds in the presence of more stable stratification over cold SST. The increased stratification in the boundary layer limits the transfer of vertical momentum and heat flux. Consequentially, the lower layer becomes less aware of the variation in the layer aloft, resulting in a “decoupling” condition.
Nevertheless, relative to classical theory, studying low-level wind anomaly forced by abnormal SST pattern [13,14,15,16], somewhat different scenarios were also proposed in previous studies. For example, Inatsu et al. [17] indicated that SST variations might lead to a deeper atmosphere response through modulating the growth of extratropical storms. Small et al. [18] suggested that sea level pressure anomalies are not collocated with SST anomalies in the particular case of TIWs because air-temperature and water vapor anomalies lagged downstream of the SST anomalies, due to the effect of advection by the mean wind. Liu and Xie [19] investigated double intertropical convergence zones and indicated that most of the investigators attempted to relate the existence and location of the intertropical convergence zone south of the equator (SITCZ) to SST distribution through the pressure gradient hypothesis proposed by Lindzen and Nigam [13], however, in their study, QuickSCAT data do not support such inferences. Zheng et al. [20] analyzed the influence of coastal upwelling off southeast Vietnam (CUEV) on local wind field using numerical simulations by the atmospheric model of Weather Research and Forecasting (WRF). Based on numerical simulations, the CUEV feedback resulted in a local wind speed reduction of greater than 30% with the influence of a typical cold patch (with a temperature drop of about 3 to 5 °C). The mechanism of the wind modulation in their study was shown to be an enhancement of sea-breeze. Those aforementioned studies consistently indicate that there might be different mechanisms that can be responsible for linking upper ocean features and overlying atmospheric response in addition to well-documented theories.
Based on above reasons, it seems to be more than essential to clarify the relationship between those distinct oceanic features and consequential atmospheric responses. However, it is somewhat surprising that, in addition to a series of studies focused on the mechanisms leading to KI [21,22,23,24,25], studies on possible atmospheric response triggered by the distinct oceanic features like KI were less explored. Thus, possible feedbacks resulted from the dynamic KI to the regional weather system surrounding the Luzon Strait and northeast SCS basin remain unclear and should be examined carefully. On the other hand, there are different types of KI in the northern SCS. Nan et al. [2] identified three typical paths of looping, leaking, and leaping, based on Kuroshio SCS Index (KSI, defined by the integral of geostrophic vorticity from 118° to 121° E and from 19° to 23°N) derived from weekly satellite absolute dynamic topography. Relative to leaping and leaking paths, the occurrence of looping accompanies the most distinct high SST front intrusion. Thus, KI in the form of looping is taken as a typical KI event and is used for the following analyses in this study. In this work, the main goal is to clarify the effects of KI through the Luzon Strait on the regional atmospheric and weather variations. Because Luzon Strait is the key channel of exchange of momentum, heat, and salinity between the SCS and the western North Pacific, the target of this study on the possible linkages between local weather variations (e.g., wind, precipitation, etc.) and consequential water movement and mass exchanges through adjustments of momentum, heat, density and salinity deserves more attention.
Using observations, especially from multi-satellite missions, this work attempts to clarify the relationship between KI and consequential atmospheric responses. The rest of the paper is organized as follows. Section 2 introduces all the datasets used in this study. They include multi-satellite observational data, ERA-interim reanalysis data, and long-term daily WHOI OAFlux product. Section 3 demonstrates the characteristics of KI. Section 4 presents the impacts of KI to the regional atmospheric system surrounding the Luzon Strait, and discusses the possible mechanism of KI leading to local atmospheric responses. Finally, conclusions and remarks are given in Section 5.

2. Data and Methods

To identify the occurrences and spatial characteristics of KI through the Luzon Strait, satellite altimeter data of absolute dynamic topography (ADT) and absolute geostrophic currents (AGC) on a 0.25° longitude × 0.25° latitude grid and for the period from January 1993 to May 2019 were used. These products were processed by Archiving, Validation and Interpretation of Satellite Oceanographic data (AVISO) by merging altimetry observations from multi-satellite missions of Topex/Poseidon, ERS-1/2, Jason-1/2/3, GFO, Envisat, CryoSat, and SARAL/AltiKa. In addition to the altimeter data (used to determine the occurrence of KI event), satellite-based SSWs, SST, and precipitation were applied to evaluate the atmospheric and oceanic responses to KI through the northern Luzon Strait. SSWs (with a spatial resolution of 0.25° longitude × 0.25° latitude and for the period March 2007 –December 2019) were retrieved from the advanced scatterometer (ASCAT) data product, which was processed by NOAA/NESDIS and provided by REMSS (http://www.remss.com/mission/qscat, last access: 12 July 2020). Multi-scale ultra-high resolution (MUR) SST was processed as a global, gap-free, gridded, daily 1km SST by merging IR data from the advanced very high-resolution radiometer (AVHRR), Moderate Resolution Imaging Spectroradiometers (MODIS), and microwave data from AMSR-E and AMSR-2, and in-situ SST observations from the NOAA iQuam project. The MURSST data were processed and released by NASA JPL PO. DAAC. Table 1 summarizes the multiple satellite products used in this study.
For surface precipitation, we used the Tropical Rainfall Measuring Mission (TRMM) daily 3B42-v7 data. This daily-accumulated precipitation product was generated from the research-quality 3-hourly TRMM multi-satellite precipitation analysis (TMPA), which was derived from TRMM and other satellite observations including geosynchronous infrared radiometers, Special Sensor Microwave Imager (SSM/I), and rain gauges. The product provides a long-term, daily accumulated, high-quality precipitation measurement (available from January 1998 to December 2019), which was accessible through the website: https://disc.gsfc.nasa.gov/datasets/TRMM_3B42_Daily_7/ (accessed on 28 May 2020). To help the interpretation of possible mechanism triggering the local atmospheric responses to KI, zonal and meridional wind, vertical velocity, and specific humidity on 1000–300 hPa surface were derived from ERA-Interim (European Center for Medium-Range Weather Forecast (ECMWF)) reanalysis data, which provided daily or monthly data from January 1979 to August 2019. In this work, daily data from ERA-Interim with a spatial resolution 0.125° × 0.125° were used. The ERA-Interim data were downloaded through http://apps.ecmwf.int/datasets/data/interim-full-daily/levtype=pl/ (accessed on 11 November 2020). Finally, daily latent heat flux and air temperature at 2 m above the surface were adopted from the WHOI (Woods Hole Oceanographic Institute) OAFlux (Objectively Analyzed Air-Sea Fluxes) Project and were converted into evaporation for the moisture budget analysis. WHOI OAFlux provided daily-mean (1985-present) and monthly-mean (1958-present) 1° × 1° latent and sensible heat fluxes and other flux-related surface meteorology over the global oceans. Data downloaded from WHOI OAFlux were interpolated into 0.125° × 0.125° grid with double linear interpolation technique. Methods of accessing WHOI OAFlux data are detailed in http://oaflux.whoi.edu/data.html (accessed on 11 November 2020). The latent heat flux was converted to evaporation via Equation (1):
E = L H / ρ w l e
where E is evaporation, LH is latent heat flux, ρ w   is water density, and l e is latent heat of vaporization. Empirical equations of ρ w (kg m−3) and l e (J kg−1) were computed with air temperature at 2 m (T) [26,27]:
ρ w = 999.84 + 6.794 × 10 2   T 9.095 × 10 3   T 2 + 1.002 × 10 4   T 3   1.120 × 10 6   T 4 + 6.536 × 10 9   T 5   [ 26 ]
l e = 2.5 × 10 6 2.36 × 10 3   T + 1.6   T 2 + 6 × 10 2   T 3   [ 27 ]

3. Kuroshio Intrusion Characteristics

Based on vertical sections of composite shipboard acoustic Doppler current profiler (Sb-ADCP) current velocity measurements across the Luzon Strait along 21°N, Liang et al. [28] presented intruded Kuroshio waters flowed westward with a maximum westward velocity of about 30 cms−1. Thus, 30 cms−1 was chosen as the lower bound for defining the occurrences of westward Kuroshio intrusion through the Luzon Strait. Moreover, in this study, the KI event was defined and detected more strictly using the following conditions: (1) within the area of 19–23°N, 118–123°E, there must be a westward current with a velocity greater than 30 cms−1, and (2) at the same time, there must be another current to the north of the westward current but flowing eastward with velocity also greater than 30 cms−1. A KI event through the Luzon Strait is defined in this study, if the above two circulation features are present. KSI proposed in Nan et al. [2] provides another reference for the recognition of loop current (KI). However, with KSI, different types of KI were defined based on the relative values of mean and standard deviation corresponding to KSI for a certain data period (see Figure 2 in Nan et al. [2]). In other words, the definition of loop current depends on different study data periods. Thus, in this study, in a more direct manner, the aforementioned definition of KI in loop current form was applied.
Here, AGC within the Luzon Strait and an algorithm developed based on the aforementioned definition were used to detect all the KI events. From 1993 to 2019, there are 185 strong KI events in total. A “strong” KI event refers to one that persists for at least four weeks continuously, and was considered as a mature and typical KI event for the following analyses. The criterion of four weeks was decided based mainly on the statistical results derived by Yuan et al. [29]. Their results demonstrated that the anticyclonic intrusions of the Kuroshio in the Luzon Strait with life period of four weeks occur most frequently. Meanwhile, the persistence period was chosen also for avoiding possible influences from synoptic-scale weather features (e.g., tropical depression, tropical cyclones, or regional weather system etc.). Figure 2, showing the characteristics of ADT and AGC corresponding to the occurrence of KI, was obtained by compositing all detected strong KI events during the study period. One can see that, both the features of AGC and ADT show a typical KI pattern with a branch of the Kuroshio Current that flows northwestward entering the SCS mainly through the Balintang Channel and forms a loop current off southwest Taiwan. This loop current that carries most of the Kuroshio waters that intruded into the SCS exits into the northwestern Pacific through the Bashi Channel [2,30]. This composite analysis validates the performance of the KI event detection algorithm developed in this study.
Additionally, the temporal distribution characteristics of strong KI events detected over the period 1993 to 2019 can be retrieved. The seasonal occurrence of all strong KI events from 1993 to 2019 is shown in Figure 3. The KI occurred most frequently from October to March of the next year. This result is generally consistent with the results documented in previous studies, which reported that southwest monsoon over this region in boreal summer provides an unfavorable environment for KI occurrence [21,31,32].

4. Atmospheric Responses to Kuroshio Intrusion

4.1. Composite Analysis

To clarify the relationship between the KI event and the atmospheric state, we made composites of SST, SSWs, and precipitation based on all strong KI events. First, we processed related composite fields based on all KI events identified in the previous section. However, due to different time periods of available data of atmospheric parameters, it is worth noting that different KI events might be combined to generate the composite of certain parameters corresponding to the occurrence of KI. As shown in Figure 4, a composite of SST indicates a typical KI pattern with higher SST along the main path of Kuroshio intruding into the northern SCS. SSWs show a spatially non-uniform distribution. It is evident that winds are relatively stronger over the regions of the southern and northern tip of the Luzon Strait (see Figure 4b). This situation is highly possible due to the wind sheltering effect resulted from the interaction of the topography of Hengchun peninsula (south of Taiwan) and northwest Luzon Island with northeast monsoon prevailing in boreal winter in this region [33]. On the other hand, precipitation composite shows a different pattern. Peaks of precipitation appeared in the offshore region southeast of Taiwan.
Based on the composite pattern of SSWs shown in Figure 4b and the temporal distribution characteristic of all KI events (Figure 3), it suggests that the composites of atmospheric parameters shown in Figure 4 are highly possible due to the contributions of northeast monsoon prevailing in boreal winter in this region. Thus, the above analyses might not demonstrate the possible causal relationship between the intrusion of warm Kuroshio waters and consequential atmospheric responses. To further clarify the direct linkage between KI and consequential atmospheric responses, an improved composite analysis was proposed (refer to Figure 5). Multiple panels (a) to (d) of Figure 5 were retrieved by applying a high-pass filter to the original signal. Before making the corresponding composites, 52 weeks running mean was applied to all variables to remove any high-frequency signal. After that, the filtered low-pass signal was subtracted from the original signal to complete the high-pass filter procedure. Overall, a relatively high-frequency KI signal was extracted from the original signal (see Figure 5).
After removing the contributions from the strong prevailing northeast monsoon, Figure 5a shows an anti-cyclonic circulation anomaly southwest of Taiwan due to intruded Kuroshio loop current. Accordingly, the SST image (Figure 5b) also demonstrates a KI pattern. SSWs show an eastward wind jet at the offshore region of northwest Luzon Island (Figure 5c). On the other hand, precipitation composite shows a positive anomaly of 2 mm per day located at the offshore region of the southwest tip of Taiwan. It is worth noting that 2 mm day−1 precipitation anomaly response would lead to ~560 million tons of freshwater influx corresponding to a typical KI event (based on the assumption that a typical strong KI event persists for more than 4 weeks), which might further modify the local mass, salinity, stratification, and freshwater exchange through the influence of positive buoyancy flux due to rainfall [34].
The aforementioned result suggests an interesting scenario that KI causes not only a positive SST anomaly surrounding the Luzon Strait off southwest Taiwan but also a marked precipitation anomaly (and thus significant amount freshwater influx), which might modify the local mass, heat, and salinity exchange and impacts the regional ecosystem. On the other hand, more interesting is that, in addition to SSH, currents, SST, and precipitation anomalies respond consistently to KI, while SSWs composite shows a very different spatial pattern. The asynchronous response between precipitation and SSWs indicates a contrasting scenario to those reported in previous studies [8,20,33,35] that SST anomalies trigger the local precipitation anomaly through modifying the local convection and thus the low-layer wind variations. Thus, to develop a comprehensive understanding of the above results, more analyses were performed in the following sections to document the relationship and dynamic linkage therein.

4.2. Backward Running Composite Analysis

Figure 6a–d,e–h shows the result of backward running composite analysis, which can demonstrate the complete progression of the occurrences of strong precipitation anomaly and wind forcing anomaly during the KI event, respectively. Here, for backward tracking, we collect SSWs and precipitation data (after applying the high-pass filter) 0 to 3 weeks prior to the occurrence of SSWs and precipitation anomalies corresponding to a KI event. In the meantime, Figure 6i–l shows 0 to 3 weeks backward composites of SST anomaly also corresponding to KI period. As we can see, relative to fast-varying atmospheric responses, during the period of KI occurrence, the SST anomaly does not change with time so much.
Based on the backward propagation of generation of precipitation anomaly, one can see that the marked precipitation anomaly appeared initially at the north tip of Luzon strait off southern Taiwan two weeks prior to the original composite (see Figure 6c, which was composited based on precipitation data for the period one week before and two weeks under the influence of a KI event). At the same time, no anomalous feature can be found in the region where wind jets will occur one week earlier. On the other hand, the initial generation of eastward wind jet can be traced back to one week only (refer to Figure 6f). Again, no linkage between wind jet and precipitation anomaly can be found since their initial occurrences. Overall, the occurrences of precipitation anomaly and wind jet are “independent”. During the complete period of growth of a certain response to KI, we cannot find any linkage between SSWs and precipitation anomaly from their backward propagation composites. Based on the above results, the possible progression of KI leads to local anomalous precipitation through local wind variations was primarily dismissed.

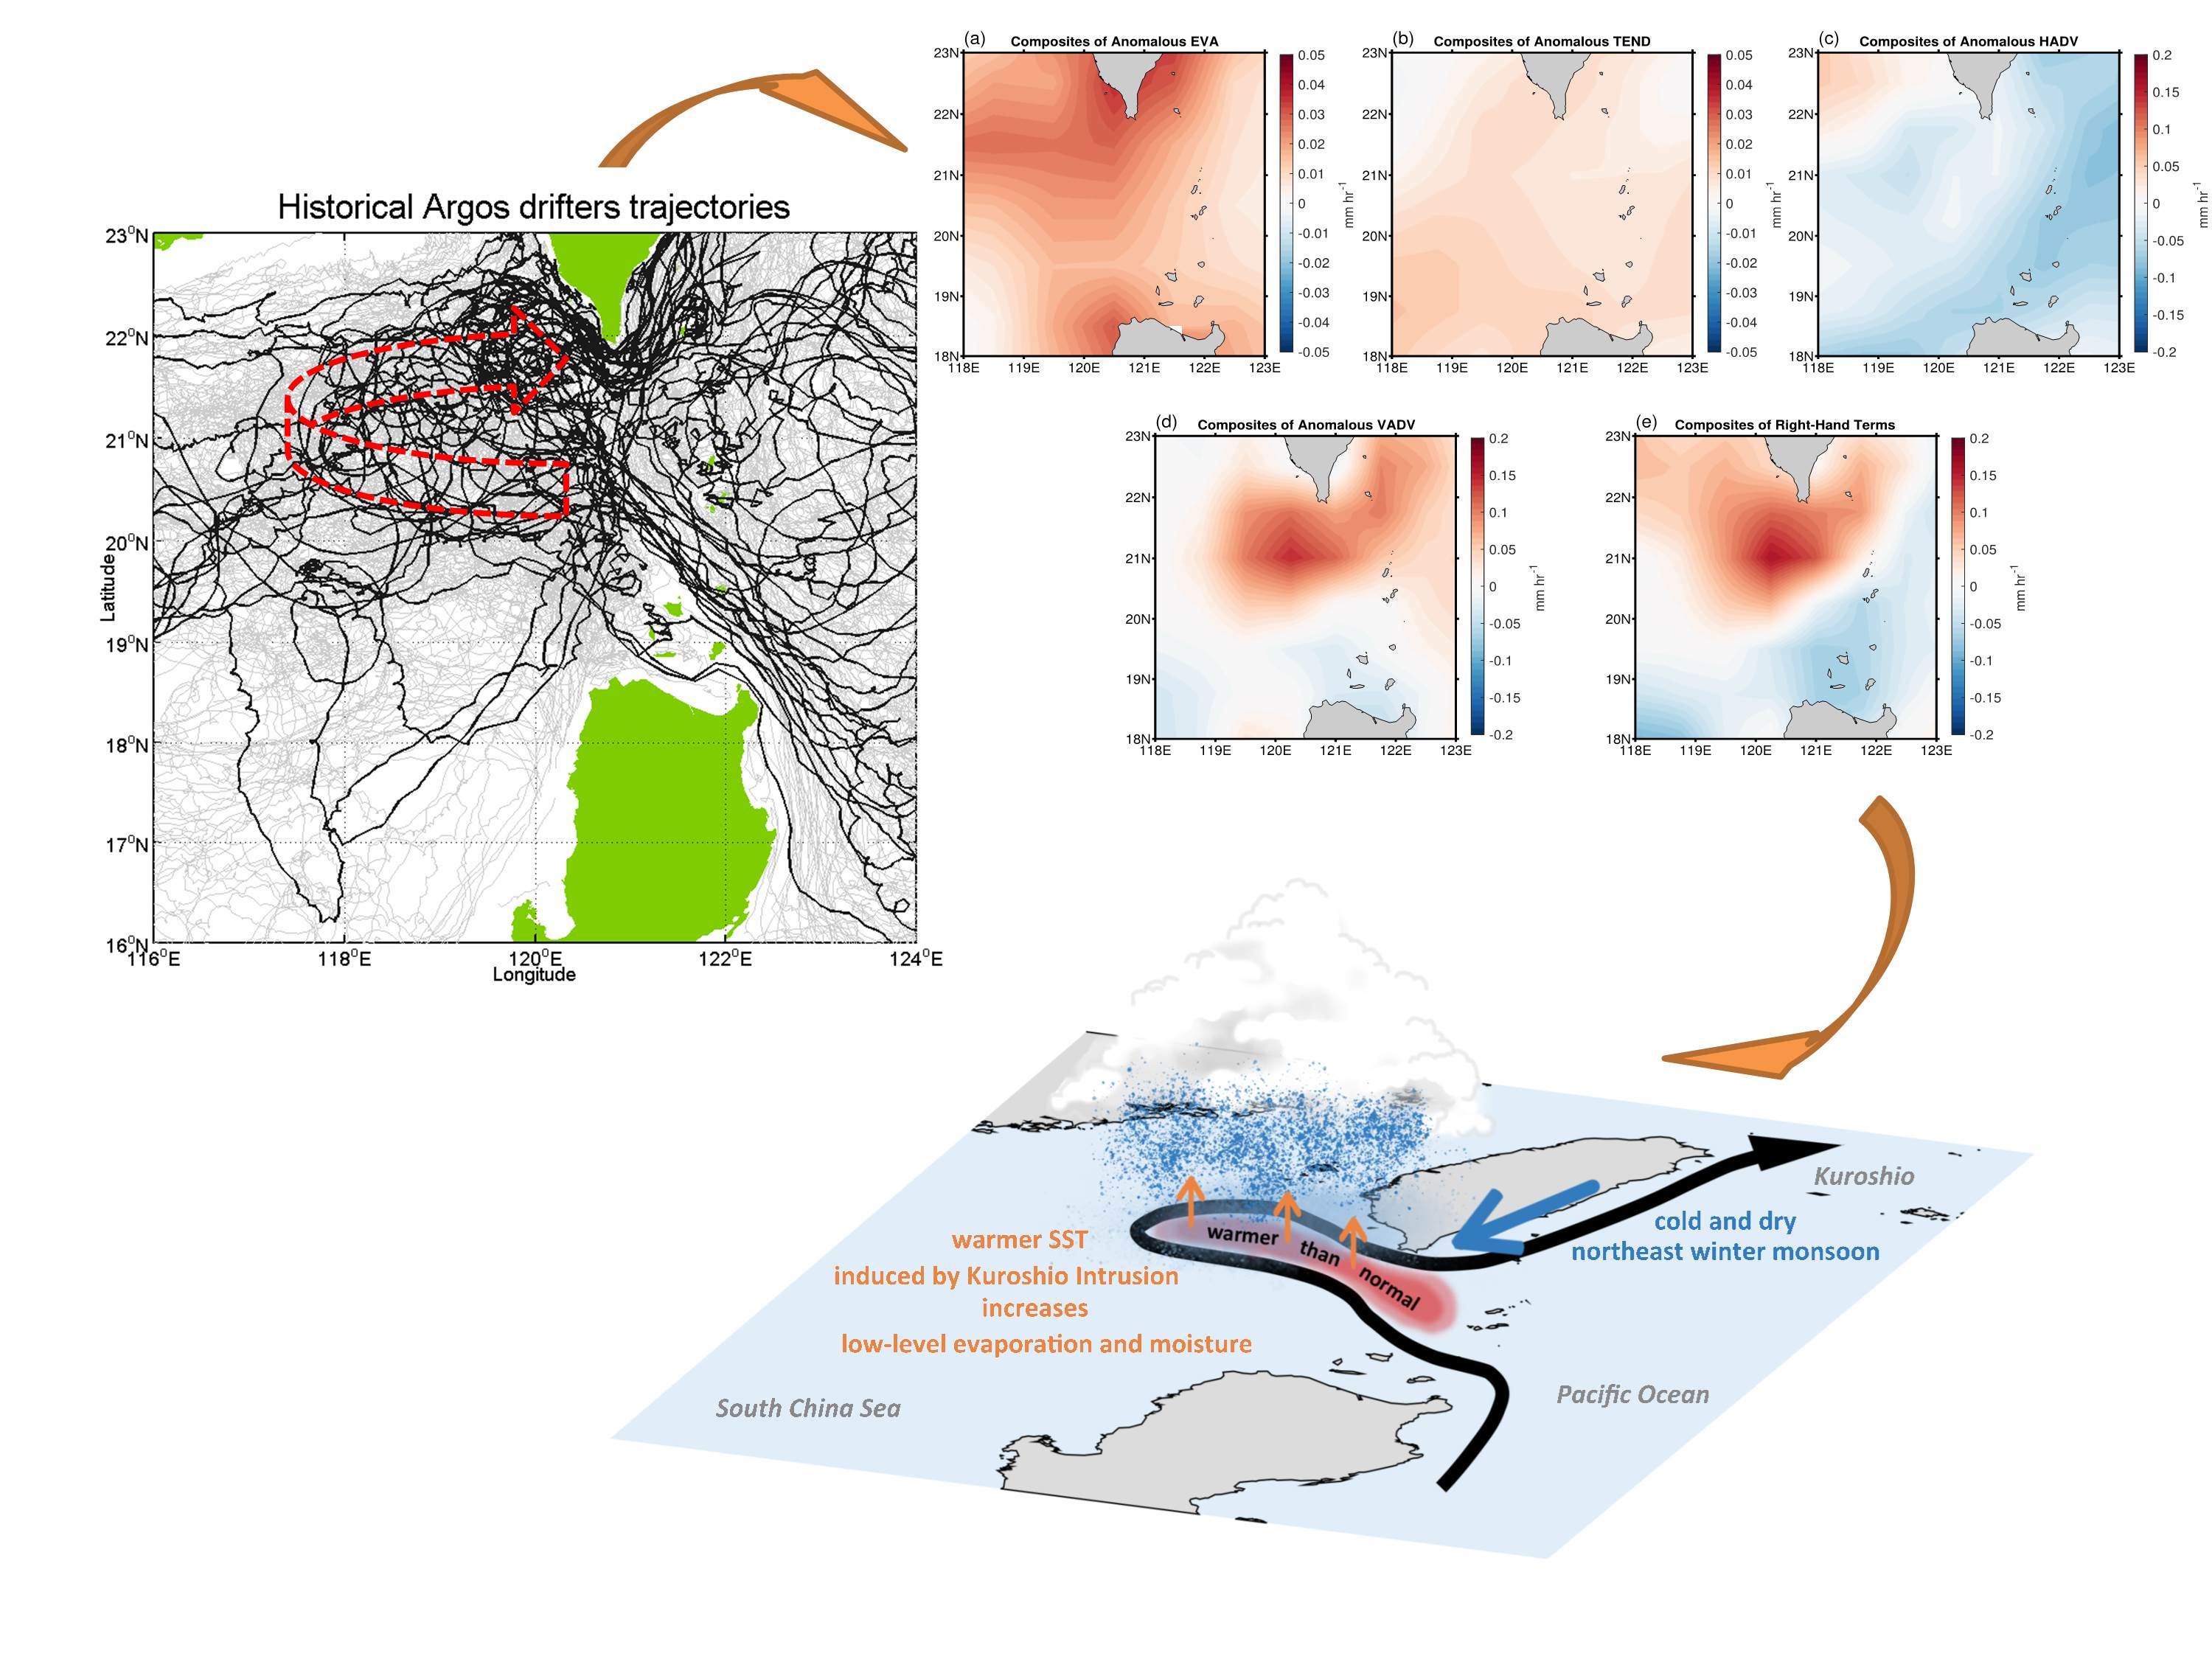
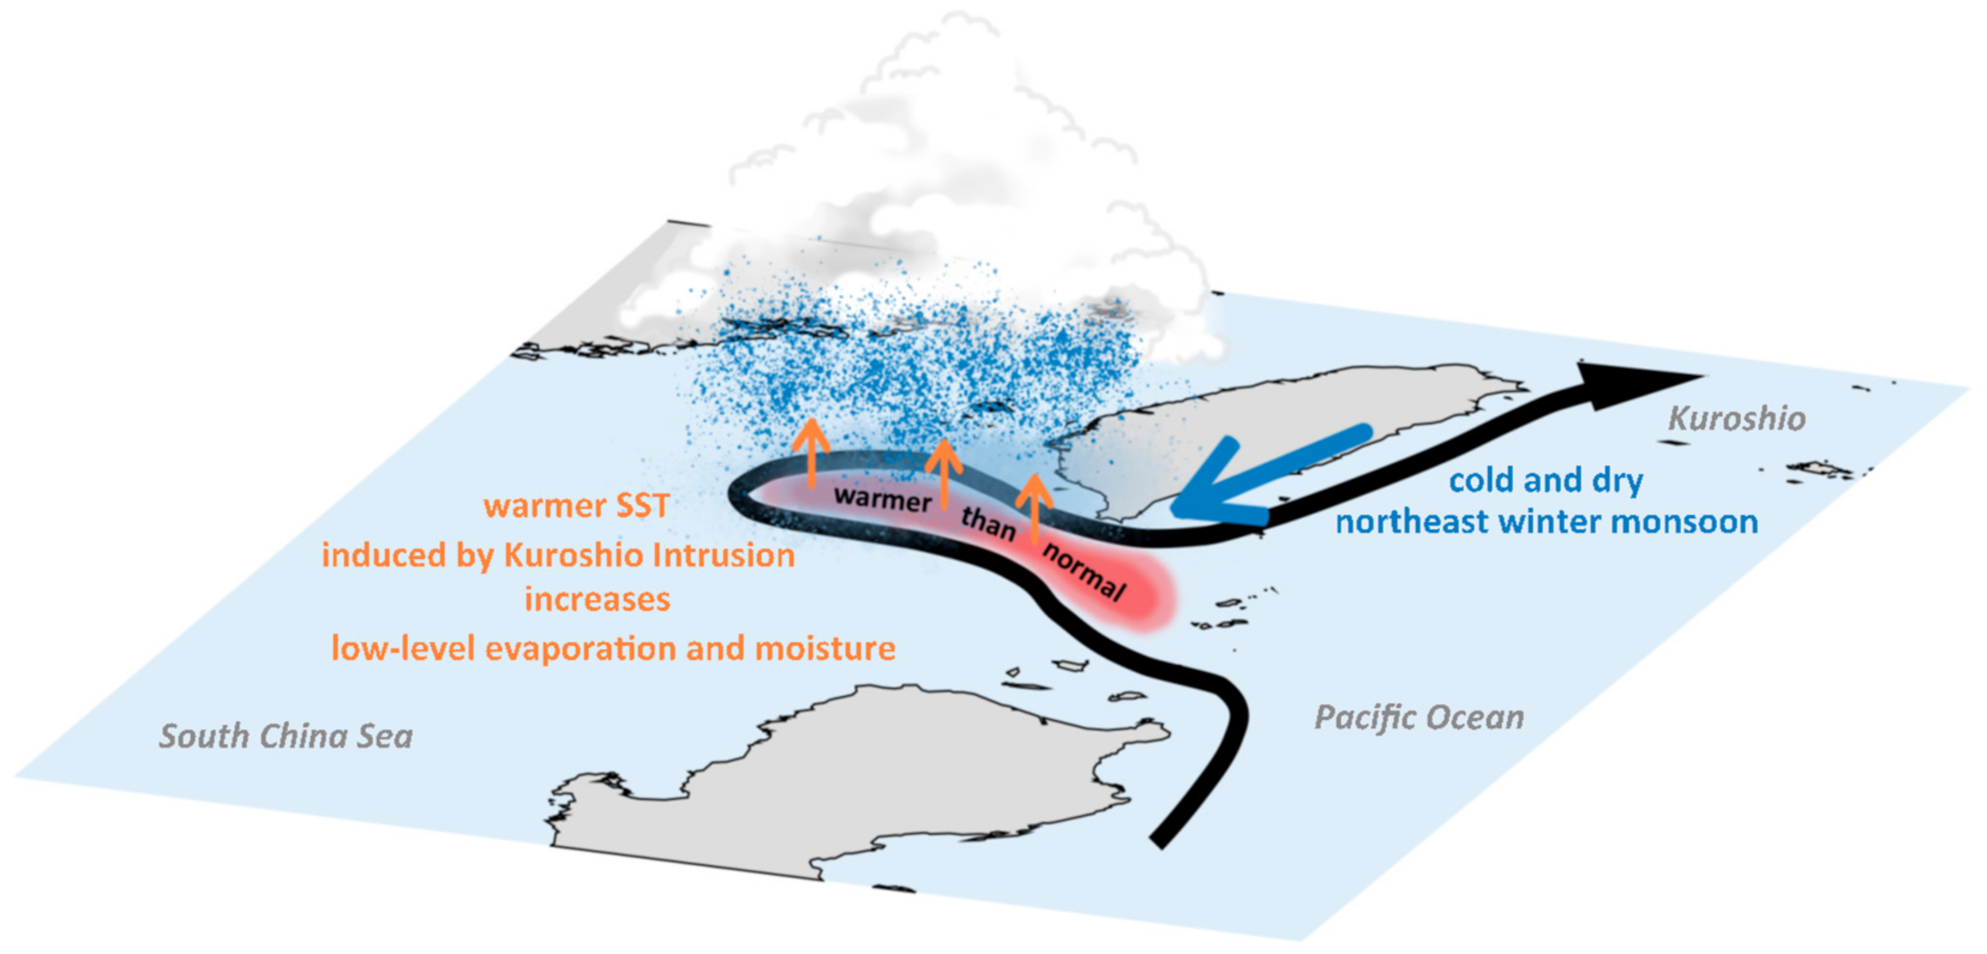
4.3. Mechanism of Kuroshio Intrusion Triggering the Local Precipitation Anomaly

The above analyses bring out a possible linkage between KI and consequential precipitation anomaly. In order to explicitly diagnose the anomalous precipitation induced by KI, the atmospheric vertically integrated moisture budget equation at steady state is examined here (Equation (2)):
P   =   E EVA 1 g p s p t t q   d p TEND 1 g p s p t V   q   d p HADV 1 g p s p t ω p q   d p VADV +   Residual ,
where P is precipitation, E is evaporation, q is specific humidity, V is the horizontal wind, ω is vertical velocity, and g is the gravitational acceleration. p s and p t   denote the pressure at surface and tropopause, which are chosen as 1000 hPa and 300 hPa pressure levels in this study. According to the moisture budget equation, local precipitation is mainly generated by the forcing terms on the right-hand side of the equation. The first term on the right-hand side is evaporation (EVA), the second term is the vertically-integrated time derivative of specific humidity (TEND), the third term is vertically integrated horizontal moisture advection (HADV), and the fourth term is vertically integrated vertical moisture advection (VADV). All the units of moisture budget terms are converted consistently into mm hr−1 for comparison.
Daily EVA is computed from the WHOI OAFlux (from 1985 to 2019), and TEND, HADV, and VADV are from ERA-Interim data (from 1981 to 2019) respectively. To emphasize the anomalous response of the local atmospheric state to KI, the climatological seasonal cycle of each term was removed before the diagnosis. Values on each date of the year of EVA (35-year daily series) and TEND, HADV and VADV (39-year daily series) are averaged to form 365-day climatological daily-mean time series. The climatological seasonal cycle is then defined as the mean and the first two harmonics (annual and semi-annual) of the 365-day climatological daily-mean, which can be derived via Fast Fourier Transform (FFT). Daily anomalous moisture budget terms (i.e., EVA, TEND, HADV, VADV) are then obtained by subtracting climatological seasonal cycles from the original daily value. Figure 7 presents the composites of anomalous (a) EVA, (b) TEND, (c) HADV, (d) VADV, and (e) the sum of these four terms when strong KI occurred. First, the location of the largest increase of total moisture in Figure 7e, which appears at the southern tip of Taiwan, reveals good consistency with anomalous precipitation as shown in Figure 5d. This implies that the source of moisture plays a key role in the generation of the precipitation anomaly corresponding to KI. Furthermore, it is shown that the increase of moisture results mainly from the vertical advection (Figure 7d), while the horizontal advection term creates a negative effect on rainfall (Figure 7c). Anomalous EVA and TEND (Figure 7a,b) are less important than HADV and VADV to precipitation due to their smaller magnitude, however, both terms present positive effects within the study domain.
Lindzen and Nigam [13] examined the importance of pressure gradients due to SST gradients to low-level flow and convergence in the tropics over time scales larger than (or equal to) one month. They demonstrated the role of SST gradients in forcing low-level flows and convergence in the tropics. In particular, the latter plays a crucial role in determining the distribution of cumulonimbus convection and rainfall. However, no corresponding low-level wind circulation to anomalous precipitation arises in our analysis (refer to both Figure 5 and Figure 6), which is apparently unlike the triggering mechanism proposed by the classical theory studying low-level wind anomaly forced by abnormal SST pattern [13,14,15,16]. Nevertheless, as mentioned above, there might be different mechanisms that can be responsible for linking upper ocean features and overlying atmospheric response in addition to well-documented theories [17,18,19,20]. Here we seek bulk formula (Equations (3) and (4)) that formulates the heat fluxes between air-sea interfaces for the explanation of how VADV contributes to local rainfall without an evident change of low-level flows:
S H =   ρ c p C D H U 10 T a T s
L H =   ρ l e C D E U 10 q a q s ,
where SH and LH stand for sensible heat flux and latent heat flux, ρ is the air density, c p is the specific heat of air, l e is the latent heat of vaporization, C D H and C D E are drag coefficients, U 10 is the wind speed at 10 m, T a and q a are the temperature and specific humidity of surface air, and T s and q s are the SST and saturated specific humidity at T s .
Since Kuroshio intrusion often occurs in winter and spring through the Luzon Strait, the surface saturated specific humidity ( q s ) will increase simultaneously due to the warm SST anomaly created by KI. At the same time, low-level air is usually cold and dry; therefore, the difference between q a and q s is supposed to be reasonably far larger when KI occurs other than the normal period. Enlargement of the differences of temperature and specific humidity between atmosphere and ocean not only increase sensible heat flux but also latent heat flux and evaporation subsequently (Figure 7a). One can find that the contribution of evaporation (Figure 7a) to local rainfall anomaly (Figure 5d) is positive yet insufficient by itself. However, an increase in low-level moisture accompanied by evaporation can expand the vertical gradient of moisture. Through the path of thermodynamic change (i.e., increase of vertical moisture gradient), the dominant term of moisture budget, VADV (Figure 7d), is able to enhance without obvious low-level wind field variations.
On the other hand, refer to Figure 7a (EVA) and Figure 7d (anomalous VADV), one can see that the relatively higher evaporation north off the Luzon Island (Figure 7a) also contributes to the relatively positive VADV (color in light red to white) northwest off the Luzon Island to offset the background/surrounding negative values southwest corner of the whole study area (color in blue). This partially supports the statement of evaporation might enhance VADV by increasing the low-layer moisture and thus the vertical gradient of moisture. In addition, please refer to Figure 5c and Figure 7a simultaneously, the colocation of higher evaporation and extreme eastward wind forcing anomaly northwest off the Luzon Island suggests that the higher low-layer moisture due to evaporation might be carried away by the eastward wind forcing anomaly occurred also during the KI period from northwest of the Luzon Island toward north-northeast off the Luzon Island. The same process can be partially observed in the composite of anomalous horizontal advection (HADV) (see Figure 7c). Besides, because VADV is contributed mainly by vertical velocity (w) and vertical gradient of moisture (dq/dp) (see Equation (2)), to further evaluate the relative contributions of w and dq/dp to anomalous VADV, the composites of anomalous vertical velocity (w) and vertical gradient of moisture (dq/dp) responding to KI at 850 hpa, 900 hpa, and 1000 hpa three different altitudes were examined (Figures not shown). For vertical velocity (w), it shows a generally consistent pattern at different altitudes. Compared to the spatial characteristics of w at different altitudes to anomalous VADV (Figure 7d), no marked relationship can be observed. On the other hand, the vertical gradient of moisture shows very different patterns at different altitudes. Nevertheless, the low-layer moisture gradient (at 1000 hpa) shows consistency with the pattern of anomalous evaporation (Figure 7a). These results generally dismiss the possibility of vertical velocity dominates the enhanced VADV responding to KI and partially support the aforementioned progress. Above mentioned processes and analyses provide a more complete understanding for both the moisture budget analysis and the thermodynamic linkage between higher evaporation (due to intruding warm Kuroshio in the Luzon Strait and southwest off Taiwan), stronger vertical advection of moisture, and consequential extra rainfall anomaly, as shown in previous analyses.
Finally, for helping the understanding of the proposed linkage, schematic with related descriptions demonstrating processes about how the injection of water vapor (moisture influx) into the atmosphere during KI leads to the consequential anomalous precipitation (processes mentioned above) are shown in Figure 8. Toy and Johnson [36] examined the response of rainfall to the SST gradient around the south of Taiwan during early summer and indicated that the SST gradient over the northern SCS can have a significant impact on the intensity of rainfall over Taiwan. Nevertheless, as shown in Figure 3, KI occurred most frequently during boreal winter. Thus, moisture budget analysis and bulk formula concept with background environmental characteristics in winter corresponding to KI occurrences provide a different path for explaining the scenario of KI triggering the anomalous precipitation through vertical injection of moisture without causing an evident change of low-level winds.

5. Discussions

Kuroshio waters intruding through the Luzon Strait into the northern SCS is a typical regional ocean phenomenon. Using multi-satellite observations and atmospheric reanalysis products, this study investigates KI through the Luzon Strait that occurred from 1993 to 2019 and demonstrates the relationship between KI and consequential atmospheric responses. First, AGC and ADT composites corresponding to detected strong KI events show a typical KI pattern where a branch of the Kuroshio Current flows northwestward entering the SCS mainly through the Balintang Channel and forms a loop current off southwest Taiwan. Subsequently, most of the intruded Kuroshio water flows out of the SCS into the northwestern Pacific through the Bashi Channel. The AGC and ADT composite analysis primarily validate the KI detection algorithm developed in this study. Besides, the analysis shows that the KI occurred most frequently from October to March of the next year. This result is generally consistent with the results documented in previous studies, which reported that southwest monsoon prevailing in this region in boreal summer provides an unfavorable environment for KI.
Meanwhile, after the high-pass filter, the improved composite analysis suggests an interesting scenario that KI causes not only a positive SST anomaly surrounding the Luzon Strait off southwest Taiwan but also a strong precipitation anomaly. This precipitation anomaly would lead to ~560 tons freshwater influx within the Luzon Strait corresponding to each strong KI event, which is a significant amount of freshwater source that might further modify the local mass, salinity, stratification, and freshwater exchange of the regional ocean through the influence of positive buoyancy flux due to rainfall [34]. Since the Luzon Strait is the key channel for mass, momentum, heat, and salinity exchanges between western North Pacific and northern SCS, the anomalous precipitation deserves more attention. On the other hand, relative to SSH, currents, SST, and precipitation anomalies respond consistently to KI, while SSWs composite shows a very different spatial pattern. It is somewhat surprising that SSWs did not show a synchronous response with that of precipitation during the occurrence of a KI event. Based on the result of the backward running composite analysis, the physical linkage between SSWs variations and precipitation anomaly was primarily dismissed. Furthermore, to diagnose the possible source of the precipitation anomaly accompanied with KI, the atmospheric vertically integrated moisture budget is used. First, the pattern of the sum of four moisture terms (EVA+TEND+HADV+VADV) shows great consistency with the location of precipitation anomaly (refer to Figure 7e,d). This implies that the source of moisture plays a key role in the generation of the precipitation anomaly during the KI event. It is evident that the increase of moisture was contributed mainly by the vertical advection term (VADV, Figure 7d).
Following the bulk formula, it is shown that, because KI occurs frequently in winter and early spring within the Luzon strait, KI can lead to a source of higher evaporation (see Figure 7a) due to the increased differences of temperature (t) and specific humidity (q) between the atmosphere and the ocean. Although the contribution of evaporation to local rainfall anomaly is positive, yet insufficient by itself, an increase in the low-level moisture accompanied with evaporation precisely strengthens the vertical gradient of moisture. Consequentially, enhancement of moisture gradient in the vertical would lead to stronger vertical advection of water vapor (VADV) through thermodynamic effects without obvious low-level wind field variations.

6. Conclusions

This newly-proposed mechanism reconciles the divisiveness of why SSWs failed to show a synchronous response with the linkage between KI and consequential precipitation anomaly, compared to the results shown in previous studies. Nevertheless, further dynamical analyses are needed to elucidate the ocean-atmospheric interaction during the KI event. Numerical modeling work as shown in Zheng et al. [20] might be useful for further studies.
On the other hand, one step forward of this work also brings out a few key issues that remain unresolved adequately. These include (1) different atmospheric responses to different types of KI, (2) the decoupling of SSWs variations and precipitation anomalies, (3) consequential impacts resulted from the strong precipitation anomaly to the regional oceanic environment, weather, circulation, and even climate. Again, given the positive precipitation anomaly (and thus the huge amount of freshwater influx) due to KI, it seems to modify the local mass, salinity, freshwater exchanges and impact the regional ecosystem. Therefore, more observations and dynamic analyses are needed to further clarify the interlinked processes. Numerical modeling, including a coupled ocean-atmospheric model and more Earth-monitoring parameters from a multi-platform might be utilized.

Author Contributions

W.-P.F., D.-R.W. and Z.-W.Z. conceived and designed the study. G.G. helped writing and provided a throughout editing. C.-F.H., C.-R.H. and Q.Z. contributed to the writing and data interpretation. Data analyses were conducted by D.-R.W., M.-C.W., and H.H. All authors have read and agreed to the published version of the manuscript.

Funding

This research was funded by Taiwan’s Ministry of Science and Technology (MOST) under 108-2628-M-003-001-MY3.

Acknowledgments

The authors would like to thank the three anonymous reviewers and editor for their very constructive comments. Their valuable comments and suggestions largely improve the presentation of this work. Thanks to AVISO, JPL, REMSS, GSFC scientific teams for processing and providing the essential data sets.

Conflicts of Interest

The authors declare no conflict of interest.

References

  1. Nitani, H. Beginning of the Kuroshio. In Kuroshio, Its Physical Aspects; Stommel, H., Yoshida, K., Eds.; University of Tokyo Press: Tokyo, Japan, 1972; pp. 129–163. [Google Scholar]
  2. Nan, F.; Xue, H.; Chai, F.; Shi, L.; Shi, M.; Guo, P. Identification of different types of Kuroshio intrusion into the South China Sea. Ocean Dyn. 2011, 61, 1291–1304. [Google Scholar] [CrossRef]
  3. Xu, J.P.; Su, J.L. Hydrological analysis of Kuroshio water intrusion into the South China Sea. Acta Oceanol. Sin. 2000, 19, 1–21. [Google Scholar]
  4. Wu, C.R.; Chiang, T.L. Mesoscale eddies in the northern South China Sea. Deep Sea Res. Part II 2007, 54, 1575–1588. [Google Scholar] [CrossRef]
  5. Xiu, P.; Chai, F.; Shi, L.; Xue, H.J.; Chao, Y. A census of eddy activities in the South China Sea during 1993–2007. J. Geophys. Res. 2010, 115, C03012. [Google Scholar] [CrossRef] [Green Version]
  6. Frenger, I.; Gruber, N.; Knutti, R.; Münnich, M. Imprint of Southern Ocean eddies on winds, clouds and rainfall. Nat. Geosci. 2013, 6, 608–612. [Google Scholar] [CrossRef]
  7. Hashizume, H.; Xie, S.P.; Liu, W.T.; Takeuchi, K. Local and remote atmospheric response to tropical instability waves: A global view from space. J. Geophys. Res. Atmos. 2001, 106, 10173–10185. [Google Scholar] [CrossRef]
  8. Nonaka, M.; Xie, S.P. Covariations of sea surface temperature and wind over the Kuroshio and its extension: Evidence for ocean-to-atmospheric feedback. J. Clim. 2003, 16, 1404–1413. [Google Scholar] [CrossRef]
  9. Anthes, R.A. The height of the planetary boundary layer and production of the circulation in a sea-breeze model. J. Atmos. Sci. 1987, 35, 1231–1239. [Google Scholar] [CrossRef] [Green Version]
  10. Kousky, V.E. Diurnal rainfall variability in Northeast Brazil. Mon. Weather Rev. 1980, 108, 488–498. [Google Scholar] [CrossRef] [Green Version]
  11. Lu, R.; Turco, R.P. Air pollutant transport in a coastal environment. Part 1: Two-dimensional simulations of sea-breeze and mountain effects. J. Atmos. Sci. 1994, 51, 2285–2308. [Google Scholar] [CrossRef] [Green Version]
  12. Franchito, S.H.; Rao, V.B.; Stech, J.L.; Lorenzzetti, J.A. The effect of coastal upwelling on the sea-breeze circulation at Cabo Frio, Brazil: A numerical experiment. Ann. Geophys. 1998, 16, 866–871. [Google Scholar] [CrossRef]
  13. Lindzen, R.S.; Nigam, S. On the Role of Sea Surface Temperature Gradients in Forcing Low-Level Winds and Convergence in the Tropics. J. Atmos. Sci. 1987, 44, 2418–2436. [Google Scholar] [CrossRef] [Green Version]
  14. Wallace, J.M.; Mitchell, T.P.; Deser, C. The Influence of Sea-Surface Temperature on Surface Wind in the Eastern Equatorial Pacific—Seasonal and Interannual Variability. J. Climate 1989, 2, 1492–1499. [Google Scholar] [CrossRef]
  15. Hayes, S.P.; McPhaden, M.J.; Wallace, J.M. The influence of sea surface temperature on surface wind in the eastern equatorial Pacific. J. Clim. 1989, 2, 1500–1506. [Google Scholar] [CrossRef] [Green Version]
  16. Hashizume, H.; Xie, S.-P.; Fujiwara, M.; Shiotani, M.; Watanabe, T.; Tanimoto, Y.; Liu, W.T.; Takeuchi, K. Direct observations of atmospheric boundary layer response to slow SST variations over the eastern equatorial Pacific. J. Clim. 2002, 15, 3379–3393. [Google Scholar] [CrossRef] [Green Version]
  17. Inatsu, M.; Mukougawa, H.; Xie, S.-P. Tropical and extratropical SST effects on the midlatitude storm track. J. Meteor. Soc. Jpn. 2002, 80, 1069–1076. [Google Scholar] [CrossRef] [Green Version]
  18. Small, R.J.; Xie, S.-P.; Wang, Y. Numerical simulation of atmospheric response to Pacific Tropical Instability Waves. J. Clim. 2003, 16, 3722–3740. [Google Scholar] [CrossRef] [Green Version]
  19. Liu, W.T.; Xie, X. Double intertropical convergence zones—A new look using scatterometer. Geophys. Res. Lett. 2002, 29, 2072. [Google Scholar] [CrossRef] [Green Version]
  20. Zheng, Z.W.; Zheng, Q.; Kuo, Y.C.; Gopalakrishnan, G.; Lee, C.Y.; Ho, C.R.; Kuo, N.J.; Huang, S.J. Impacts of coastal upwelling off east Vietnam on the regional winds system: An air-sea-land interaction. Dyn. Atmos. Oceans 2016, 76, 105–115. [Google Scholar] [CrossRef]
  21. Wang, J.; Chern, C.S. The warm-core eddy in the northern South China Sea, I: Preliminary observations on the warm-core eddy. Acta Oceanogr. Taiwan 1987, 18, 92–103. [Google Scholar]
  22. Farris, A.; Wimbush, M. Wind-induced Kuroshio intrusion into the South China Sea. J. Oceanogr. 1996, 52, 771–784. [Google Scholar] [CrossRef]
  23. Metzger, E.J.; Hurlburt, H.E. The nondeterministic nature of Kuroshio penetration and eddy shedding in the South China Sea. J. Phys. Oceanogr. 2001, 31, 1712–1732. [Google Scholar] [CrossRef]
  24. Kuehl, J.J.; Sheremet, V.A. Identification of a cusp catastrophe in a gap-leaping western boundary current. J. Mar. Res. 2009, 67, 25–42. [Google Scholar] [CrossRef]
  25. Wu, C.R.; Hsin, Y.C. The forcing mechanism leading to the Kuroshio intrusion into the South China Sea. J. Geophys. Res. 2012, 117, C07015. [Google Scholar] [CrossRef] [Green Version]
  26. Gill, A.E. Atmosphere-Ocean Dynamics; Appendix 3; Academic Press: New York, NY, USA, 1982; pp. 599–600. [Google Scholar]
  27. Rogers, R.R.; Yau, M.K. A Short Course in Cloud Physics, 3rd ed.; Pergamon Press: Oxford, UK, 1989; Volume 16. [Google Scholar]
  28. Liang, W.D.; Tang, T.Y.; Yang, Y.J.; Ko, M.T.; Chung, W.S. Upper-ocean current around Taiwan. Deep Sea Res. Part II 2003, 50, 1085–1105. [Google Scholar] [CrossRef]
  29. Yuan, D.; Han, W.; Hu, D. Surface Kuroshio path in the Luzon Strait area derived from satellite remote sensing data. J. Geophys. Res. 2006, 111, C11007. [Google Scholar] [CrossRef] [Green Version]
  30. Zhang, Z.; Zhao, W.; Qiu, B.; Tian, J. Anticyclonic Eddy Sheddings from Kuroshio Loop and the Accompanying Cyclonic Eddy in the Northeastern South China Sea. J. Phys. Oceanogr. 2017, 47, 1243–1259. [Google Scholar] [CrossRef] [Green Version]
  31. Shaw, P.T. The seasonal variation of the intrusion of the Philippine sea water into the South China Sea. J. Geophys. Res. 1991, 96, 821–827. [Google Scholar] [CrossRef]
  32. Nan, F.; Xue, H.; Yu, F. Kuroshio intrusion into the South China Sea: A review. Prog. Oceanogr. 2015, 137, 314–333. [Google Scholar] [CrossRef] [Green Version]
  33. Xie, S.P.; Chang, C.H.; Xie, Q.; Wang, D. Intraseasonal variability in the summer South China Sea: Wind jet, cold filament, and recirculations. J. Geophys. Res. 2007, 112, C10008. [Google Scholar] [CrossRef]
  34. Jourdain, N.; Lengaigne, M.; Vialard, J.; Madec, G.; Menkes, C.; Vincent, E.; Jullien, S.; Barnier, B. Observation based estimates of surface cooling inhibition by heavy rainfall under tropical cyclones. J. Phys. Oceanogr. 2012, 43, 205–221. [Google Scholar] [CrossRef] [Green Version]
  35. Chow, C.H.; Liu, Q.; Xie, S.P. Effects of Kuroshio Intrusions on the atmosphere northeast of Taiwan Island. Geophys. Res. Lett. 2015, 42, 1465–1470. [Google Scholar] [CrossRef]
  36. Toy, M.; Johnson, R. The Influence of an SST Front on a Heavy Rainfall Event over Coastal Taiwan during TiMREX. J. Atmos. Sci. 2014, 71, 3223–3249. [Google Scholar] [CrossRef] [Green Version]
Figure 1. Long-term (2000–2020) historical Argos drifter trajectories passing through the study area (trajectories in gray), trajectories in black denote drifter trajectories passing through the Luzon Strait, which outline the path of Kuroshio intrusion into the northern South China Sea (SCS) and (occasionally) back to the western North Pacific. Data were obtained from Atlantic Oceanographic and Meteorological Laboratory (AOML), through https://www.aoml.noaa.gov/phod/gdp/hourly_data.php (last access: 10 April 2020).
Remotesensing 13 01113 g001
Figure 2. Composite of all detected Kuroshio intrusion events (in total 185 events) surrounding the Luzon Strait from 1993 to 2019. Color shading denotes ADT (unit: m) and vectors denote according to absolute geostrophic currents (AGC) (unit: ms−1).
Remotesensing 13 01113 g002
Figure 3. Temporal distribution of all detected strong Kuroshio intrusion (KI) events occurred during January 1993–May 2019. Blue (orange) bars denote number (percentage) of KI that occurred in a certain month.
Remotesensing 13 01113 g003
Figure 4. Composites of (a) sea surface temperature (SST) (°C), (b) sea surface winds (SSWs) (ms−1), and (c) precipitation (unit: mm day−1) corresponding to coherent detected strong KI events occurred from January 1993 to May 2019. Vectors in (a,c) denote AGC (unit: ms−1) composite corresponding to all detected Kuroshio intrusion events from 1993 to 2019. Vectors in (b) show the corresponding wind directions.
Remotesensing 13 01113 g004
Figure 5. (a) Anomalies of AGC (unit: ms−1) and ADT (unit: m) corresponding to strong Kuroshio intrusion events (by removing seasonal signal), (bd) same as Figure 4 (ac), but for improved composites corresponding to KI by filtering out the effect of strong prevailing northeast monsoon.
Remotesensing 13 01113 g005
Figure 6. (ad) Data of 0 to 3 weeks of backward composites corresponding to occurrences of strong precipitation anomaly (unit: mm day−1) at the offshore region of southwest tip of Taiwan. (eh) 0 to 3 weeks’ backward composites of wind forcing anomaly (ms−1) corresponding to occurrences of KI. (il) 0 to 3 weeks’ backward composites of SST anomaly (°C) also corresponding to the KI period. Vectors denote the current anomaly (for top and bottom panels) and SSWs anomaly (for middle panels) during the KI occurrence.
Remotesensing 13 01113 g006aRemotesensing 13 01113 g006b
Figure 7. Composites of anomalous (a) EVA, (b) TEND, (c) HADV, (d) VADV, and (e) the sum of 185. strong Kuroshio intrusion events during January 1993–May 2019. Units of all budget terms have been converted to mm hr−1. Limits of colorbar scale for (a,b) are ± 0.05, and (c) to (e) are ± 0.2.
Remotesensing 13 01113 g007aRemotesensing 13 01113 g007b
Figure 8. Illustration of KI and the possible mechanism for subsequent regional anomalous rainfall triggered by westward-intruding warm water. Black arrow indicates the general path of the Kuroshio Current when intrusion occurs. Orange arrows represent the local increase of surface moisture due to warmer-than-normal SST induced by KI (red shading). Blue arrow depicts the prevailing northeast monsoon over the western North Pacific during winter. Intense contrast between cold/dry low-level atmosphere and warm/moist ocean surface constructs a favorable circumstance for evaporation, which generates the moisture supply for regional rainfall over the offshore region, southwest of Taiwan.
Remotesensing 13 01113 g008
Table 1. Information of multiple satellite products used in this study.
ProductSourceSpatial ResolutionTemporal SolutionPeriod
Absolute dynamic topography (ADT)http://apdrc.soest.hawaii.edu/ (accessed on 12 July 2020)0.25°weeklyJanuary 1993–May 2019
Absolute geostrophic currents (AGC)http://apdrc.soest.hawaii.edu/ (accessed on 18 June 2020)0.25°weeklyJanuary 1993–May 2019
ASCAT sea surface winds (SSWs)http://www.remss.com/mission/qscat.0.25°dailyMarch 2007–December 2019
MURSST level 4 analysis (SST)https://podaac.jpl.nasa.gov/dataset/MUR-JPL-L4-GLOB-v4.10.01°dailyJune 2002–May 2019
TRMM daily 3B42-v7 (Precipitation)https://disc.gsfc.nasa.gov/datasets/TRMM_3B42_Daily_7/0.25°dailyJanuary 1998–December 2019
Publisher’s Note: MDPI stays neutral with regard to jurisdictional claims in published maps and institutional affiliations.

