
Spatiotemporal Patterns in Data Availability of the Sentinel-5P NO2 Product over Urban Areas in Norway


NILU—Norwegian Institute for Air Research, P.O. Box 100, 2027 Kjeller, Norway
*
Author to whom correspondence should be addressed.
Remote Sens. 2021, 13(11), 2095; https://doi.org/10.3390/rs13112095
Submission received: 23 April 2021
/
Revised: 21 May 2021
/
Accepted: 26 May 2021
/
Published: 27 May 2021
(This article belongs to the Section Atmospheric Remote Sensing)
Abstract
:Due to its comparatively high spatial resolution and its daily repeat frequency, the tropospheric nitrogen dioxide product provided by the TROPOspheric Monitoring Instrument (TROPOMI) onboard the Sentinel-5 Precursor platform has attracted significant attention for its potential for urban-scale monitoring of air quality. However, the exploitation of such data in, for example, operational assimilation of local-scale dispersion models is often complicated by substantial data gaps due to cloud cover or other retrieval limitations. These challenges are particularly prominent in high-latitude regions where significant cloud cover and high solar zenith angles are often prevalent. Using the example of Norway as a representative case for a high-latitude region, we here evaluate the spatiotemporal patterns in the availability of valid data from the operational TROPOMI tropospheric nitrogen dioxide () product over five urban areas (Oslo, Bergen, Trondheim, Stavanger, and Kristiansand) and a 2.5 year period from July 2018 through November 2020. Our results indicate that even for relatively clean environments such as small Norwegian cities, distinct spatial patterns of tropospheric are visible in long-term average datasets from TROPOMI. However, the availability of valid data on a daily level is limited by both cloud cover and solar zenith angle (during the winter months), causing the fraction of valid retrievals in each study site to vary from 20% to 50% on average. A temporal analysis shows that for our study sites and the selected period, the fraction of valid pixels in each domain shows a clear seasonal cycle reaching a maximum of 50% to 75% in the summer months and 0% to 20% in winter. The seasonal cycle in data availability shows the inverse behavior of pollution in Norway, which typically has its peak in the winter months. However, outside of the mid-winter period we find the TROPOMI product to provide sufficient data availability for detailed mapping and monitoring of pollution in the major urban areas in Norway and see potential for the use of the data in local-scale data assimilation and emission inversions applications.
1. Introduction
Satellite data provided by the latest generation of earth observation satellites such as Sentinel-5 Precursor (S5P) with its TROPOspheric Monitoring Instrument (TROPOMI) allow for unprecedented opportunities to monitor air quality [1] and particularly, nitrogen dioxide () pollution at global, regional, and even local scales [2,3,4,5,6]. In particular, the relatively fine spatial resolution of the instrument, in contrast to previous such instruments, offers for the first time the potential for monitoring air quality even at urban scales [7]. It is therefore conceivable to use such data for monitoring urban-scale air quality as well as exploiting them for improving the output from urban scale dispersion models [8]. At this point, however, it is unclear to what extent such data can realistically be used in conjunction with local-scale dispersion models, particularly in often cloudy high-latitude regions such as Norway, where data availability can be a challenge. For this reason we study here the spatiotemporal patterns in data availability of useful, i.e., valid, high-quality, and cloud-free TROPOMI observations of over the largest urban areas in Norway.
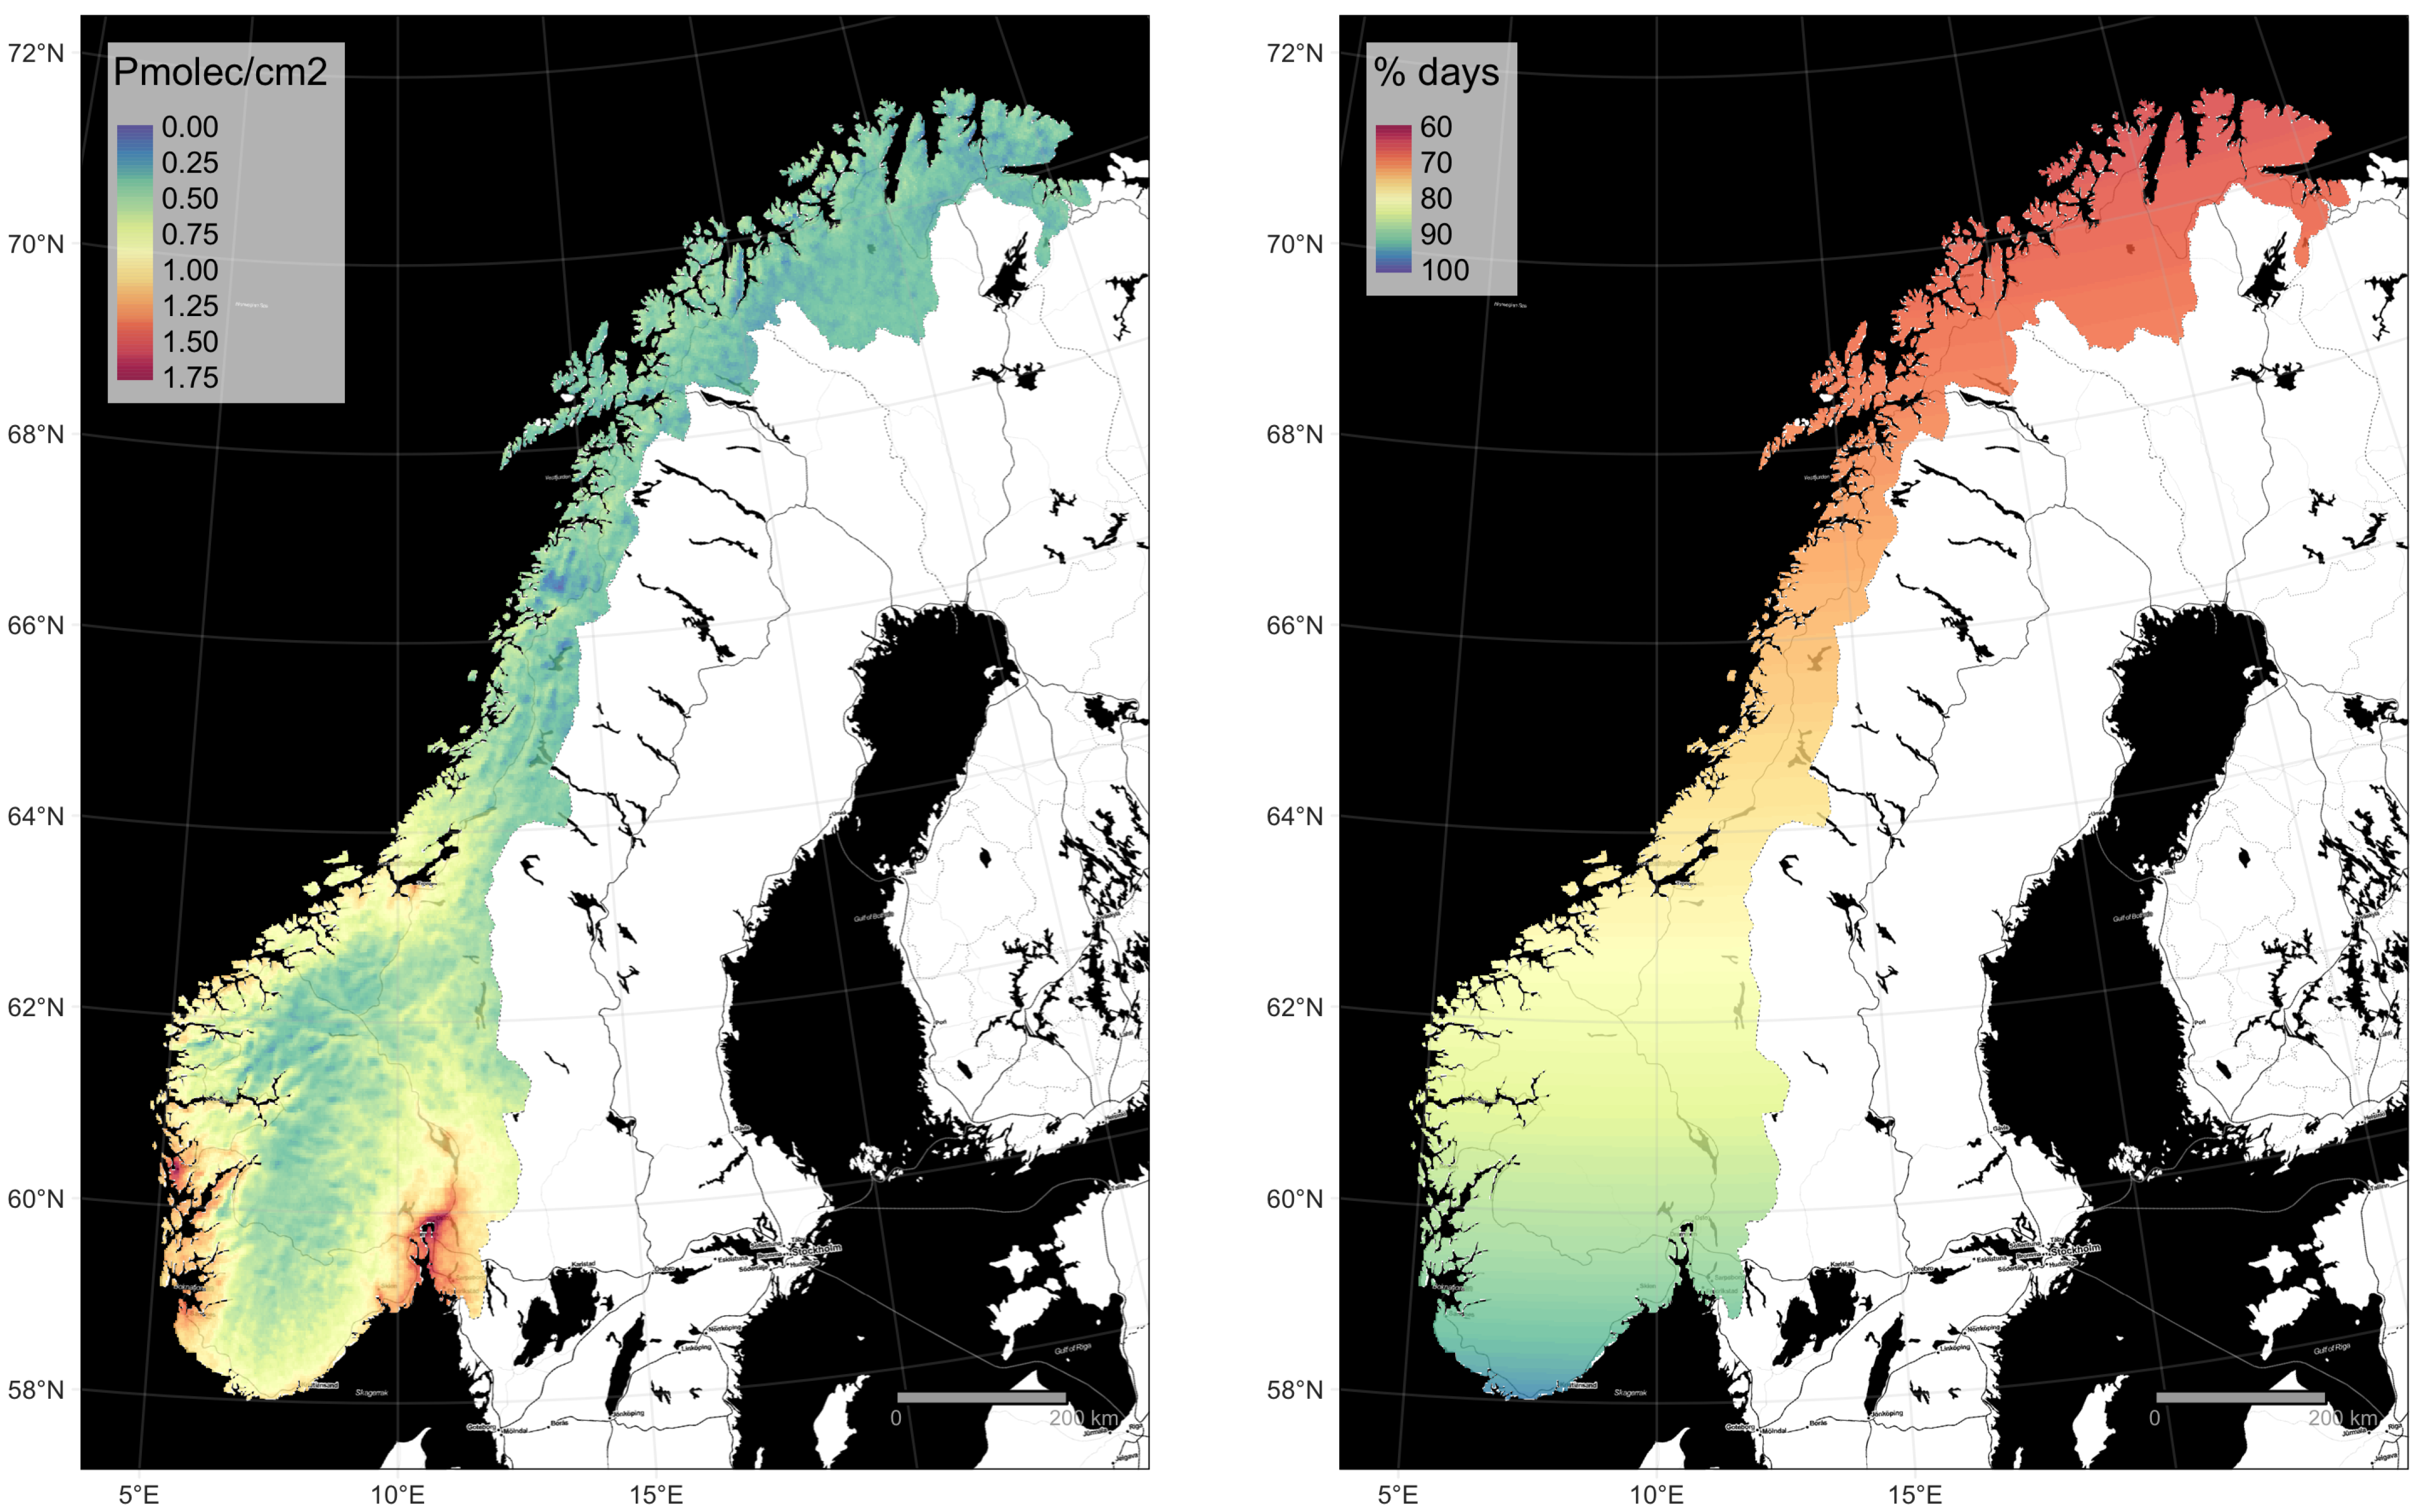
Norway not only has ubiquitous cloud cover, which severely limits the possibilities for valid retrievals of the tropospheric column but it generally has very low pollution levels at the spatial scale measured by the TROPOMI instrument (see Figure 1 left panel). Further, the pollution levels are often close to the detection limit of the instrument (approximately 0.6 ×10¹⁵ molecules cm−2 for the slant column density [7]). While there are observed exceedances of the regulatory limit values in Norway, they tend to be very localized and are typically only found in proximity to roadside air quality monitoring stations. Such high concentrations thus tend to be not visible at the spatial resolution of TROPOMI. In addition to comparatively low pollution levels, another potential limitation of satellite data for some applications is data availability. Users of the TROPOMI data typically filter the data by quality assurance value in order to analyze only high-quality retrievals or retrievals that are of appropriately high quality for the application at hand [9,10]. These quality assurance values allow for robust filtering of cloudy scences, invalid scenes over snow and ice, and situations with an excessively high solar zenith angle. A cutoff value of 0.75 on the continuous scale from zero to one is recommended for most applications [10].
The objective of this study is to investigate the spatial and temporal patterns of pollution and data availability of the operational TROPOMI product over five urban areas in Norway, then, based on these results, to evaluate to what extent the TROPOMI product can be used for urban-scale applications in Norway. Potential applications to be considered are data assimilation [11,12,13,14] and inverse modeling [15] with dispersion models running at the urban scale [8], i.e., at horizontal spatial resolution of hundreds of meters up to ca. 1 km. To our knowledge no previous studies have specifically analyzed the spatiotemporal patterns in data availability of the TROPOMI product and this paper contributes toward mitigating this gap and discussing the potential implications for exploiting such data for the case of cloudy high-latitude regions using Norwegian urban areas as a case study.
2. Methodology
In the following subsections, we describe the study sites that were selected for analysis and provide an overview of the data used along with the data-processing performed.
2.1. Study Sites
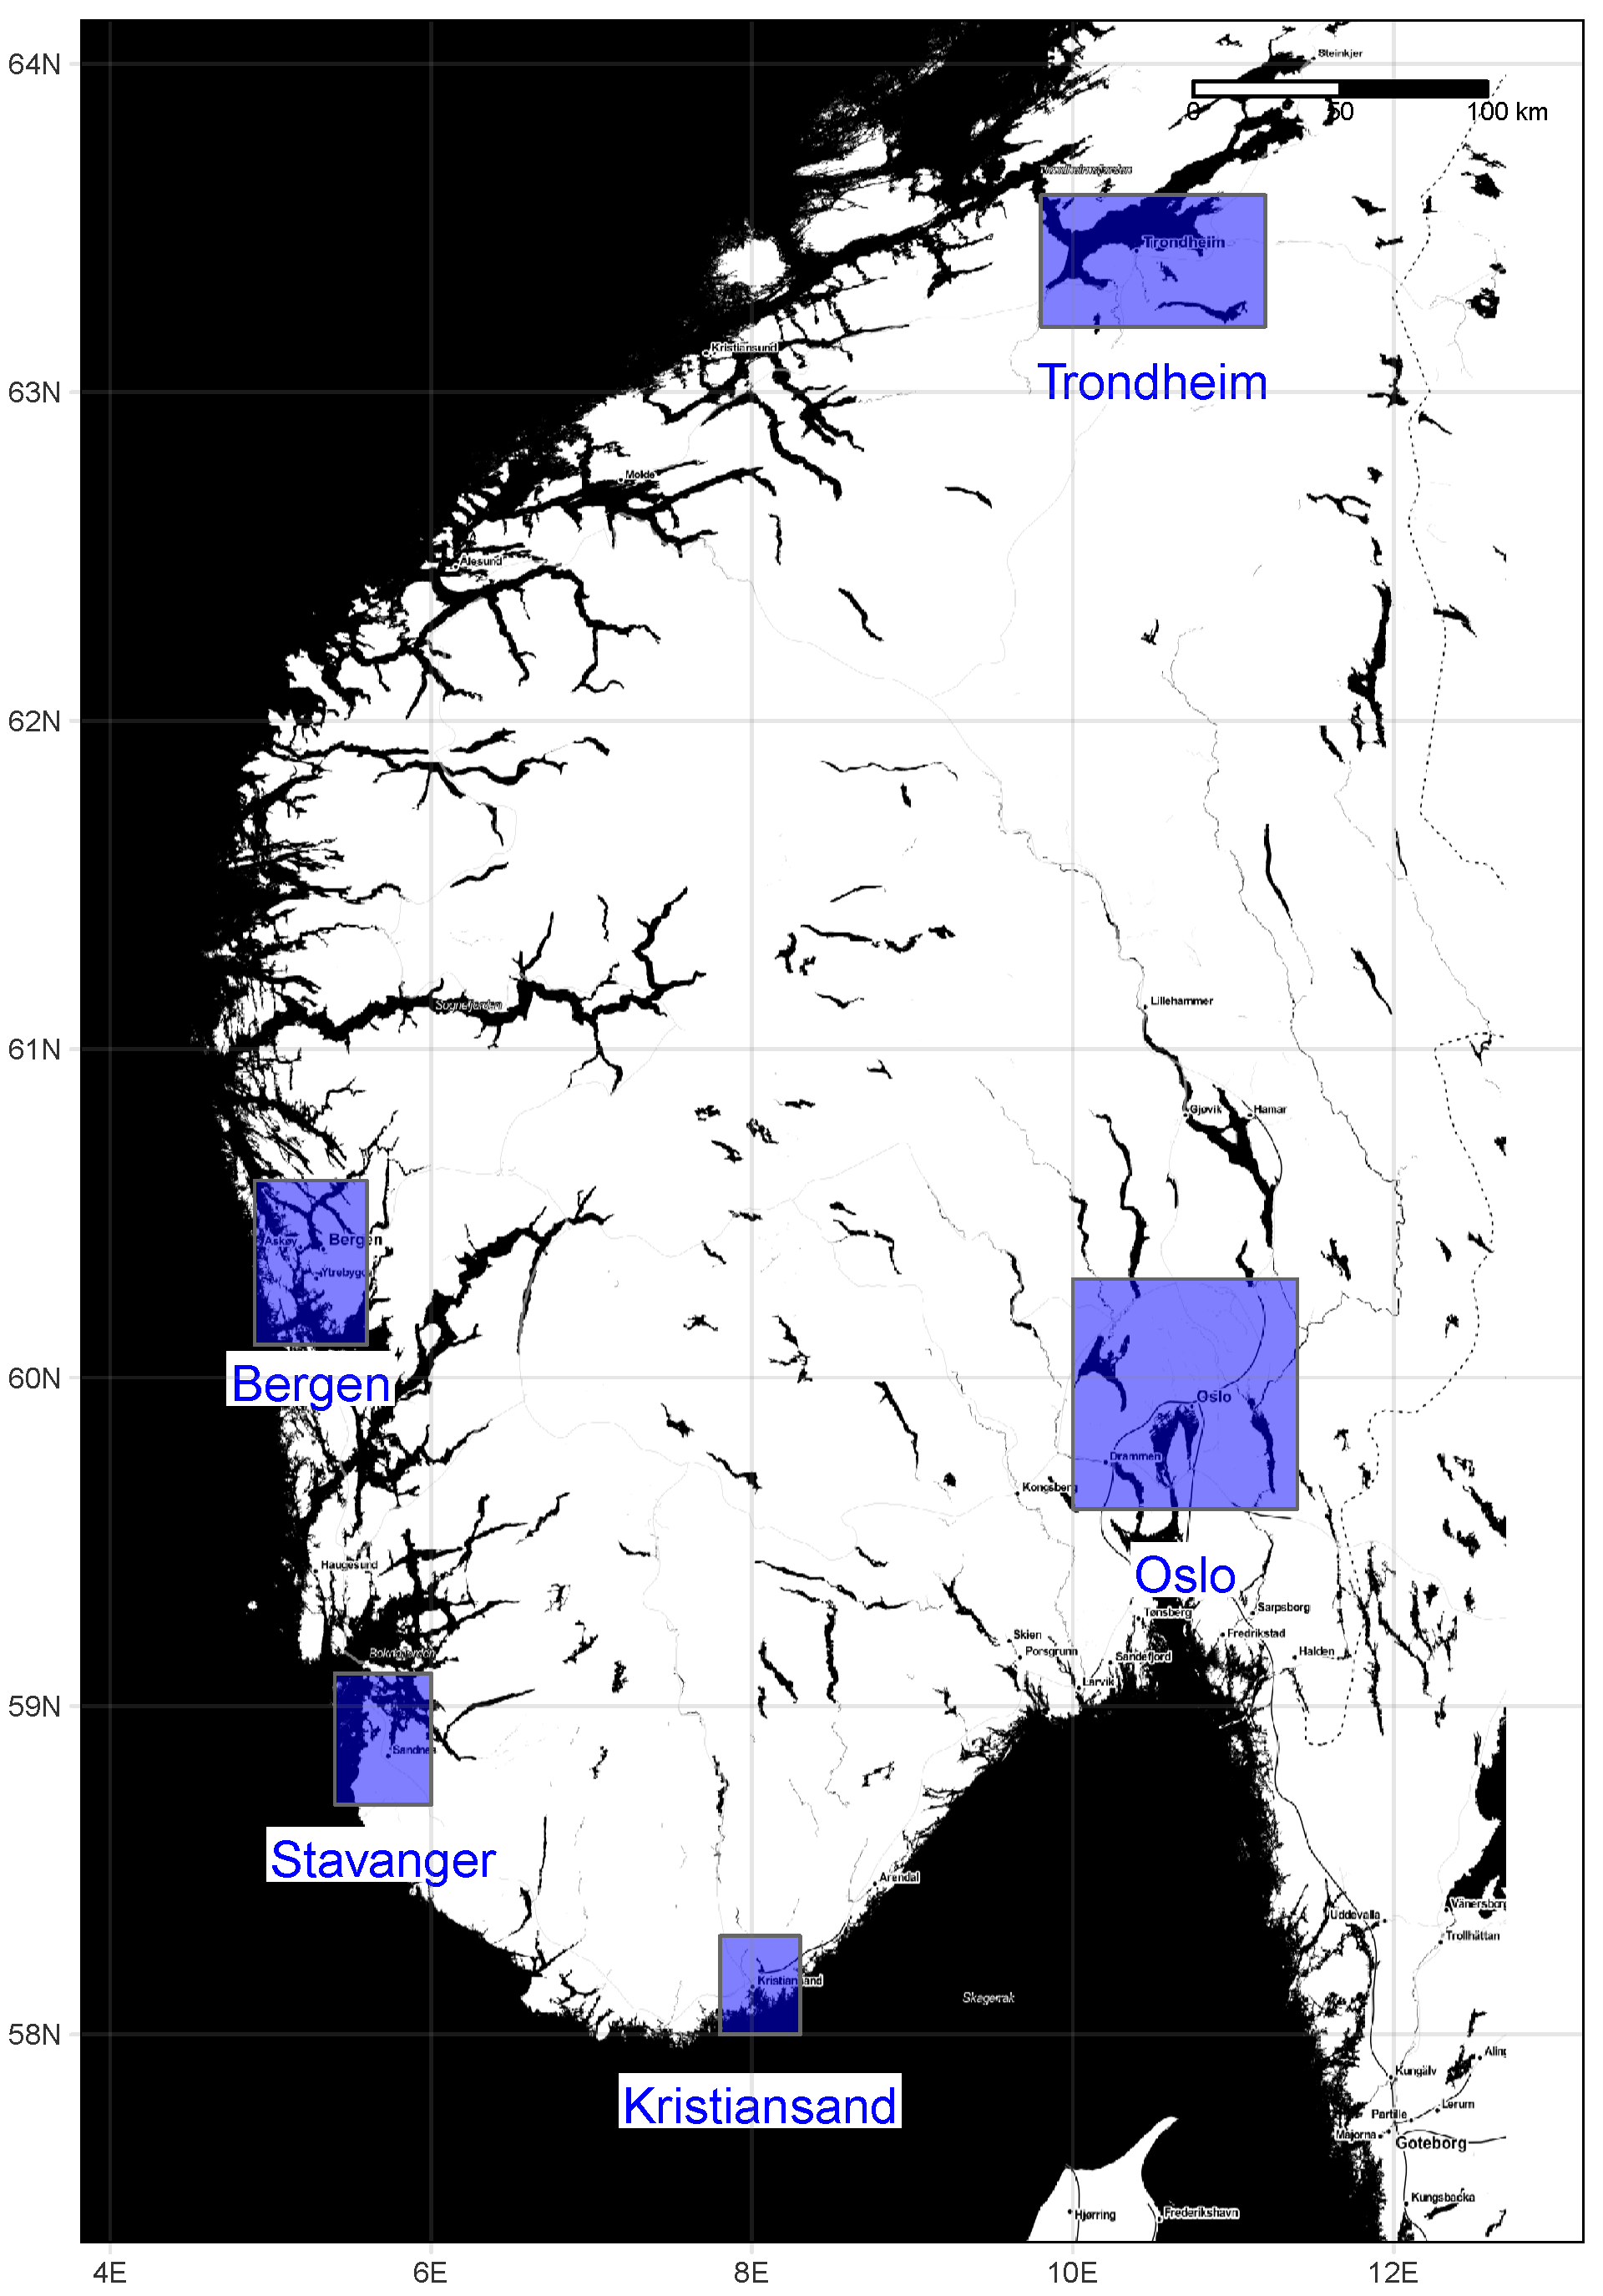
The five largest urban areas in the southern part of Norway were selected as study sites. This includes the capital city of Oslo with a population of approximately 1.5 million inhabitants in the entire metropolitan area, the greater Bergen region (420,000 inhabitants), the region of greater Stavanger and Sandnes (ca. 320,000 inhabitants), the greater Trondheim region (ca. 280,000 inhabitants), and the greater Kristiansand region (ca. 155,000 inhabitants). Figure 2 shows the location and the extent of the domains of the study sites in a geographical context. In addition, Table 1 shows details of the selected study areas.
2.2. Satellite Data and Processing
The offline Level-2 product for acquired by the TROPOMI instrument was used. This product is one of the standard operational products generated by the Sentinel-5P science team [10,16]. We acquired all data from the S5P_OFFL_L2_NO2 product available from the Copernicus Open Access Hub for the period ranging from 11 July 2018, i.e., the beginning of the operational availability of the data, through 27 November 2020, i.e., before the introduction of the wide-ranging algorithm changes by processor version 01.04.00. Therefore, in total, close to 2.5 years of data were available for the study. The data were produced by processor versions ranging from 01.02.00 through 01.03.02 [17].
We extracted the tropospheric vertical column density field from each dataset and only used retrievals that were flagged with a retrieval quality of at least 0.75 out of the continuous 0 to 1 quality flag range. This ensures the removal of (a) all cloud-covered scenes with a cloud radiance fraction greater than 0.5, (b) some scenes covered by snow and ice, and (c) other problematic retrievals from the dataset. The quality threshold used here is a very common filtering threshold and recommended by the retrieval team for most applications [9]. It is further a relatively realistic scenario as most end users of this data are likely to perform the same type of filtering. It should be noted that the quality assurance value for retrievals with solar zenith angles greater 81.2° is reduced signficantly (multiplied by 0.3) and for solar zenith angles greater than 84.5° is set entirely to zero. [10]. This retrieval limitation in conjunction with filtering the data by quality assurance value results for high-latitude regions such as Norway in practice in a short period of no valid retrievals around winter solstice even during clear-sky conditions (Figure 1 right panel).
The dataset was first converted from a swath-based Level-2 product with irregular pixel geometry to a regular gridded Level-3 product at a spatial resolution of 0.025 degrees by 0.025 degrees. This regridding was carried out using the HARP tools (https://github.com/stcorp/harp, accessed 26 May 2021). The chosen resolution roughly corresponds to the highest achievable spatial resolution of TROPOMI at nadir (note that an increase in along-track ground pixel resolution from 7 km to 5.5 km was carried out on 6 August 2019, resulting in an improved nadir resolution of 5.5 km by 3.5 km). Subsequently, the areas corresponding to the five domains described earlier were directly extracted from the dataset for the entire time period and stored as raster stacks on which all calculations required by the analysis were carried out.
3. Results and Discussion
3.1. Overall Statistics
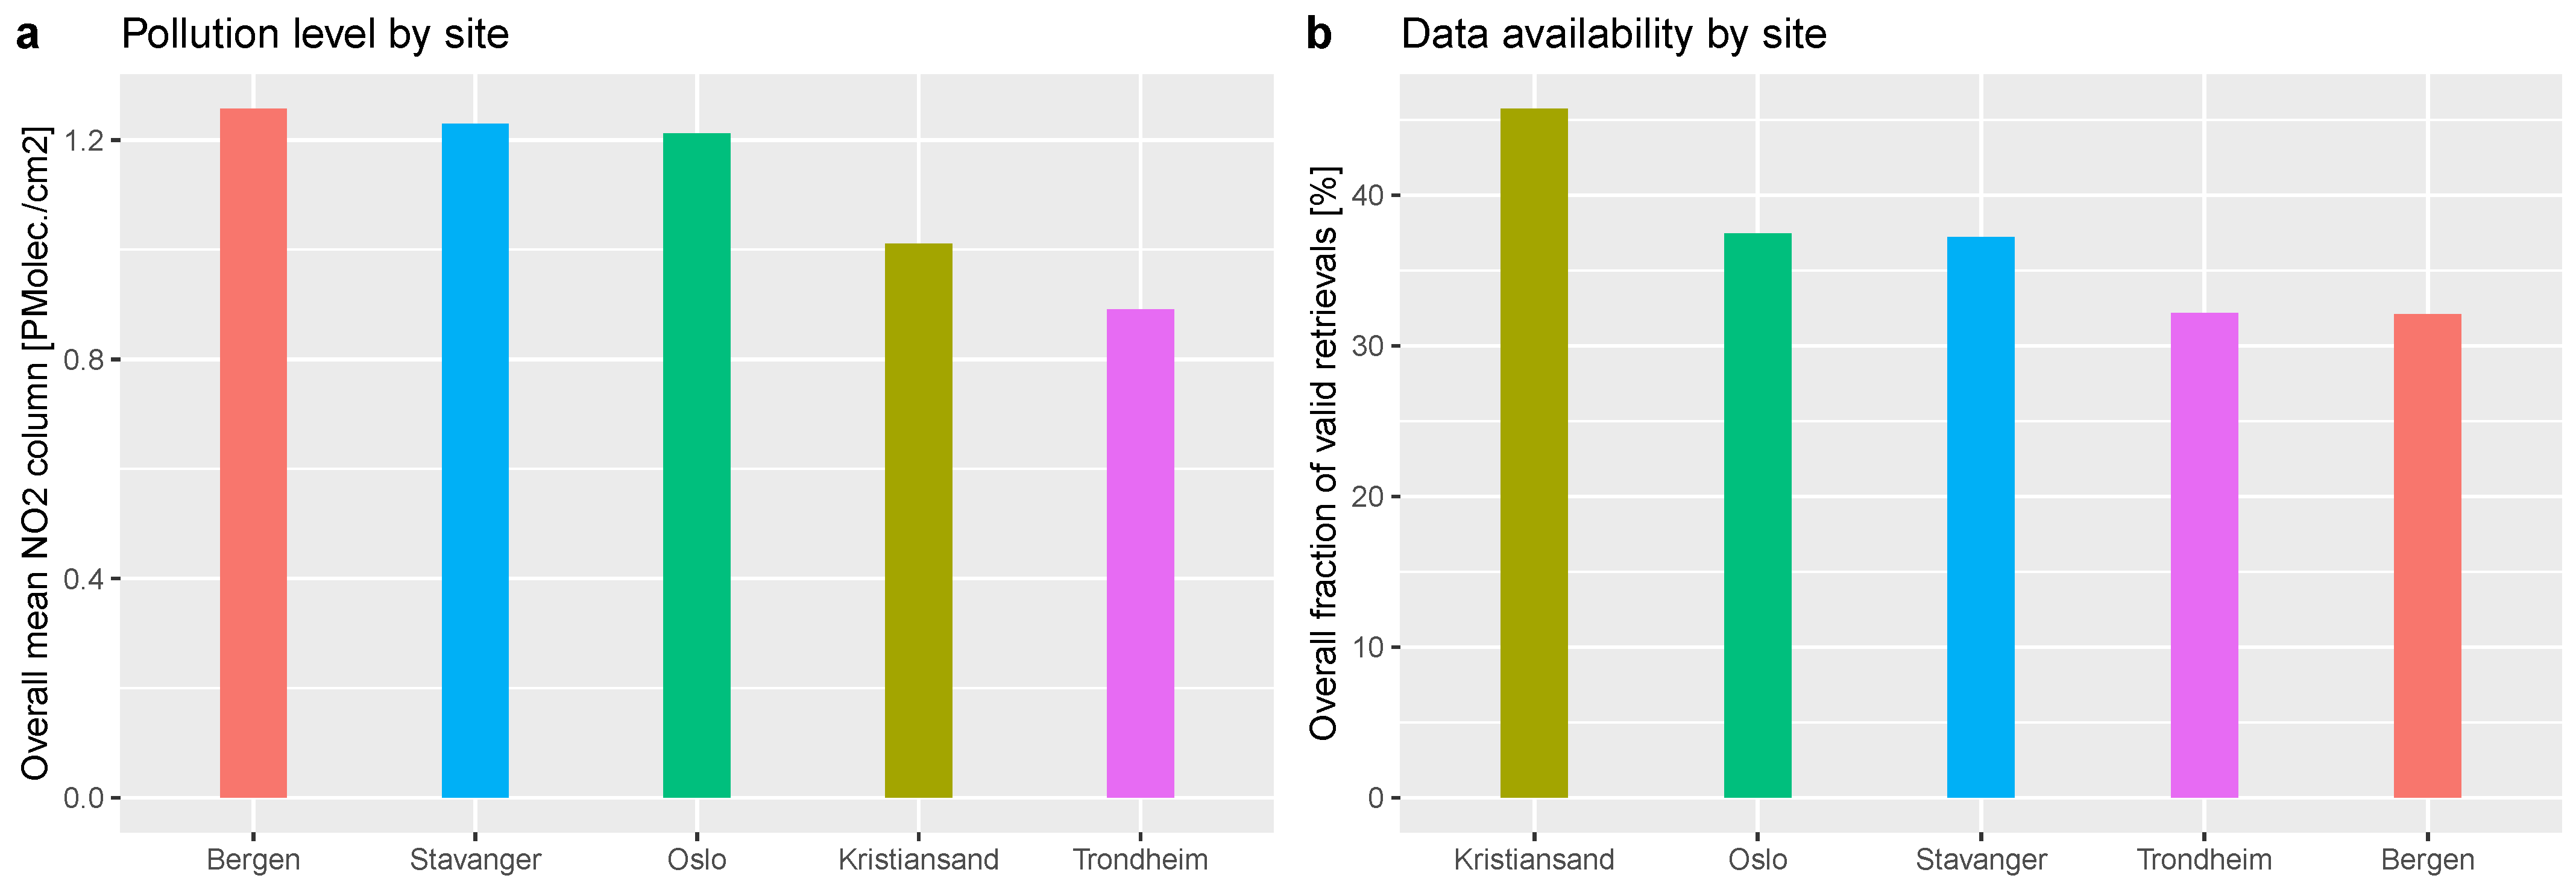
Figure 3 shows the overall summary statistics of pollution level and data availability for each site calculated over the entire study period. The average tropospheric column shown in Panel (a) depicts very similar average pollution levels for the greater regions of Bergen, Stavanger, and Oslo with values of around 1.2 ×10¹⁵ molecules cm−2. This is followed by Kristiansand with values of around 1.0 ×10¹⁵ molecules cm−2. Trondheim exhibits somewhat lower average levels with ca. 0.85 ×10¹⁵ molecules cm−2 throughout the study period. It should be noted, however, that these long-term average pollution levels can be somewhat affected by the different data availability between the study regions, which is shown in Panel (b) of Figure 3. It can be seen there that Trondheim and Bergen have by far the lowest overall availability of valid retrievals with an average of just above 30% valid pixels within the domain per day over the entire study period. In contrast, Kristiansand has the highest average data availability with approximately 45% valid retrievals. A clear latitudinal gradient is visible for the data availability in the study sites (see also Table 1), suggesting that the amount of valid retrievals is driven not only by the cloud cover statistics but also by solar zenith angle effects, thus possibly limiting the quantity of possible retrievals in the winter months.
3.2. Spatial Analysis
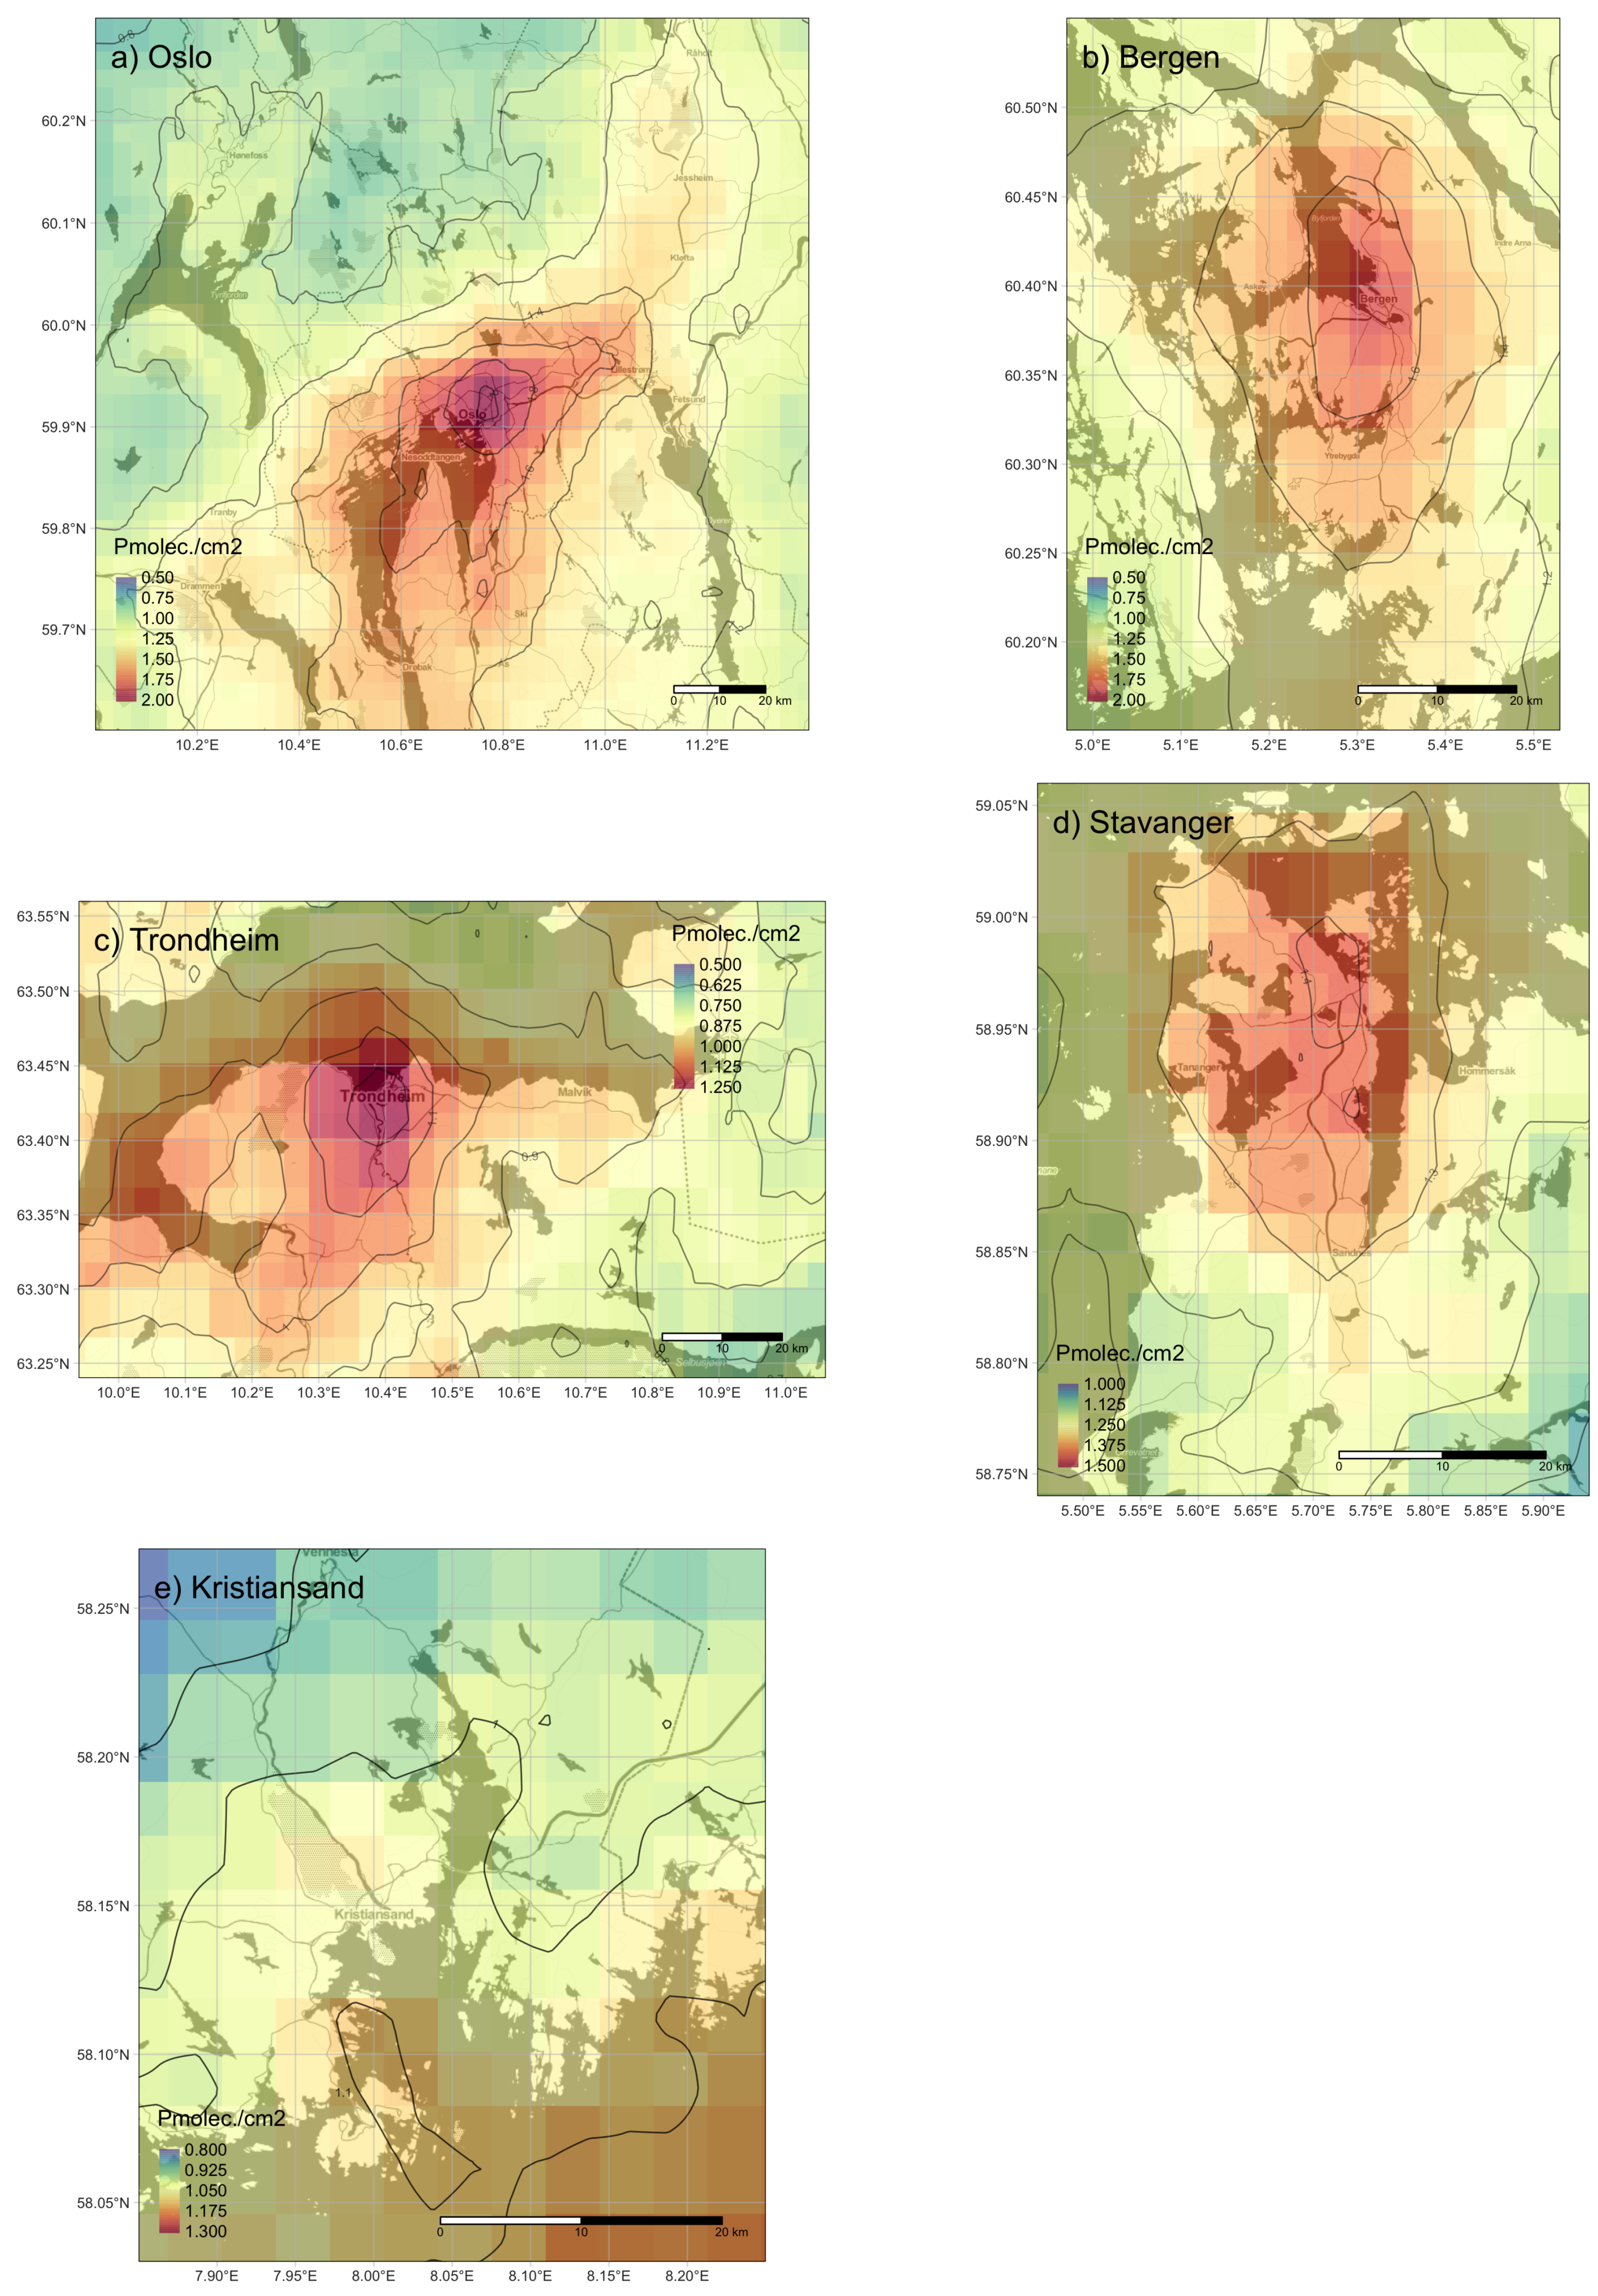
In order to evaluate the spatial patterns of tropospheric column within the five study domains, Figure 4 shows the long-term average column over the entire study period. In all study domains except Kristiansand, a clear hotspot of is visible, with some of the study sites such as Oslo even showing the typical spatial pattern of pollution that we also see from other data sources, for example high-resolution urban air quality models such as EPISODE [8]. This typical pattern involves high pollution in the center of the city with a hotspot shifted slightly east of the Oslo downtown area. In addition it includes increased concentrations along the coasts of the Oslo Fjord as well as an arm of increased pollution levels from downtown towards the northeast reaching all the way to Oslo airport.
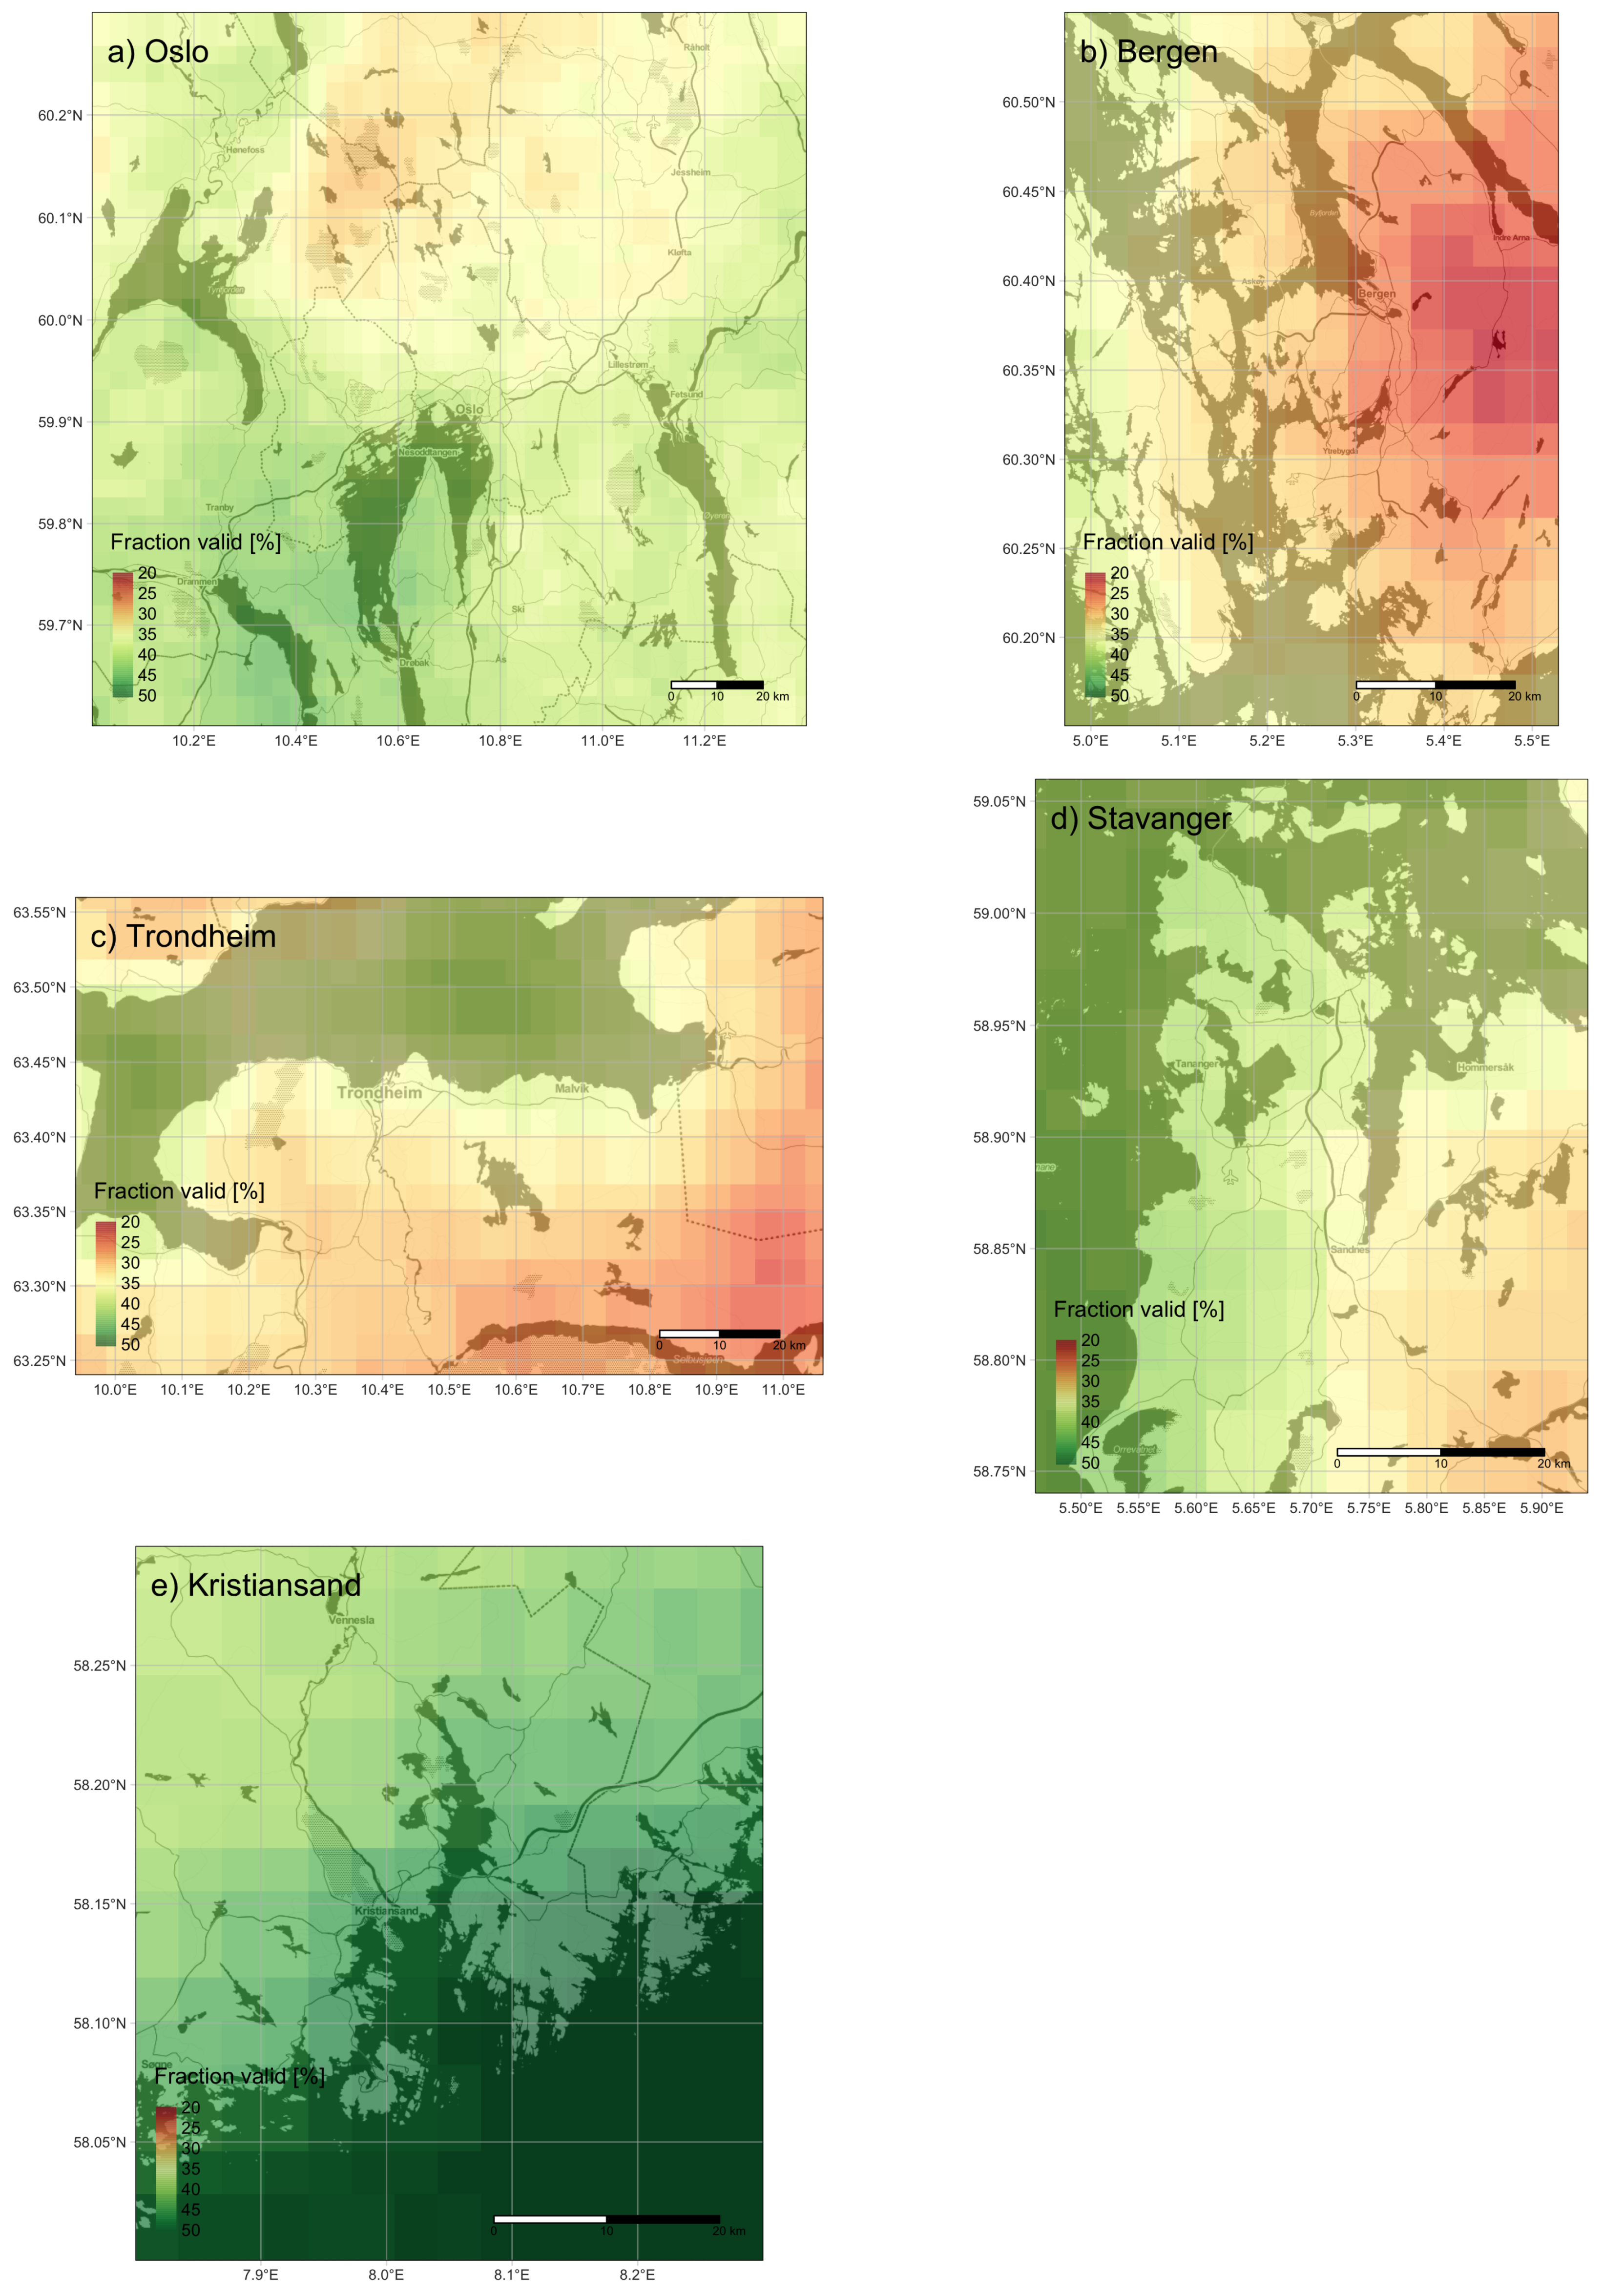
We subsequently carried out a spatial analysis to evaluate the spatial patterns in overall average valid pixel fraction for each domain, i.e., the overall proportion of retrievals for each grid cell in each domain that had a quality assurance value of 0.75 or higher. Figure 5a shows the fraction of valid TROPOMI retrievals over the greater Oslo area. The highest amount of valid retrievals during the study period was associated with areas in the south of the domain over or in close proximity to the Oslo fjord (south of center). Here we typically see valid observations on about 50% of the days. The situation is somewhat worse north of the domain center where only around 30% to 35% of the days valid pixels can be observed. The latter is likely related to more hilly terrain and the associated increase in cloud and snow cover. For Bergen (Figure 5b), the situation is similar in the sense that the pixels with the highest fraction of valid retrievals are located over the ocean and the coastal areas, whereas inland in the mountainous eastern part of the domain the number of valid retrievals is lower, reaching values of only 20% on average. In general the overall fraction of valid retrievals in Bergen is slightly lower than for Oslo. This is related to the typically higher cloud cover and precipitation over the west coast of Norway. Figure 5c for Trondheim shows once again similar spatial patterns, where the fractions range from approximately 45% along the coast to nearly as low as 20% in some of the mountain regions in the southeastern part of the domain. The situation is similar also for the Stavanger area (Figure 5d), where coastal regions including the city itself exhibit valid retrievals at about 40% of the days, whereas the inland regions have lower fractions of valid retrievals of around 30%. In the Kristiansand domain (Figure 5e) some of the highest valid retrieval fractions overall can be the seen over the ocean and coastal areas, with values reaching over 50%. The lowest values in the Kristiansand domain in the inland area are still comparatively high with valid retrievals on approximately 40% of the days.
3.3. Temporal Analysis
In addition to an analysis of the spatial patterns of pixel validity, we carried out an analysis of the temporal patterns. Figure 6 shows the time series of the fraction of pixels that are valid for each domain and for each day. We can observe significant variability throughout the year with the highest amount of 100% values valid in the summer months and typically several week long periods of 0% days in December and January. The length of the winterly period with no data has a slight dependence on latitude (shortest in the more southerly Kristiansand, longest in the more northerly Trondheim) suggesting that in addition to cloud cover, low light levels (i.e., very high solar zenith angles) around the winter solstice do play a substantial role in data availability.
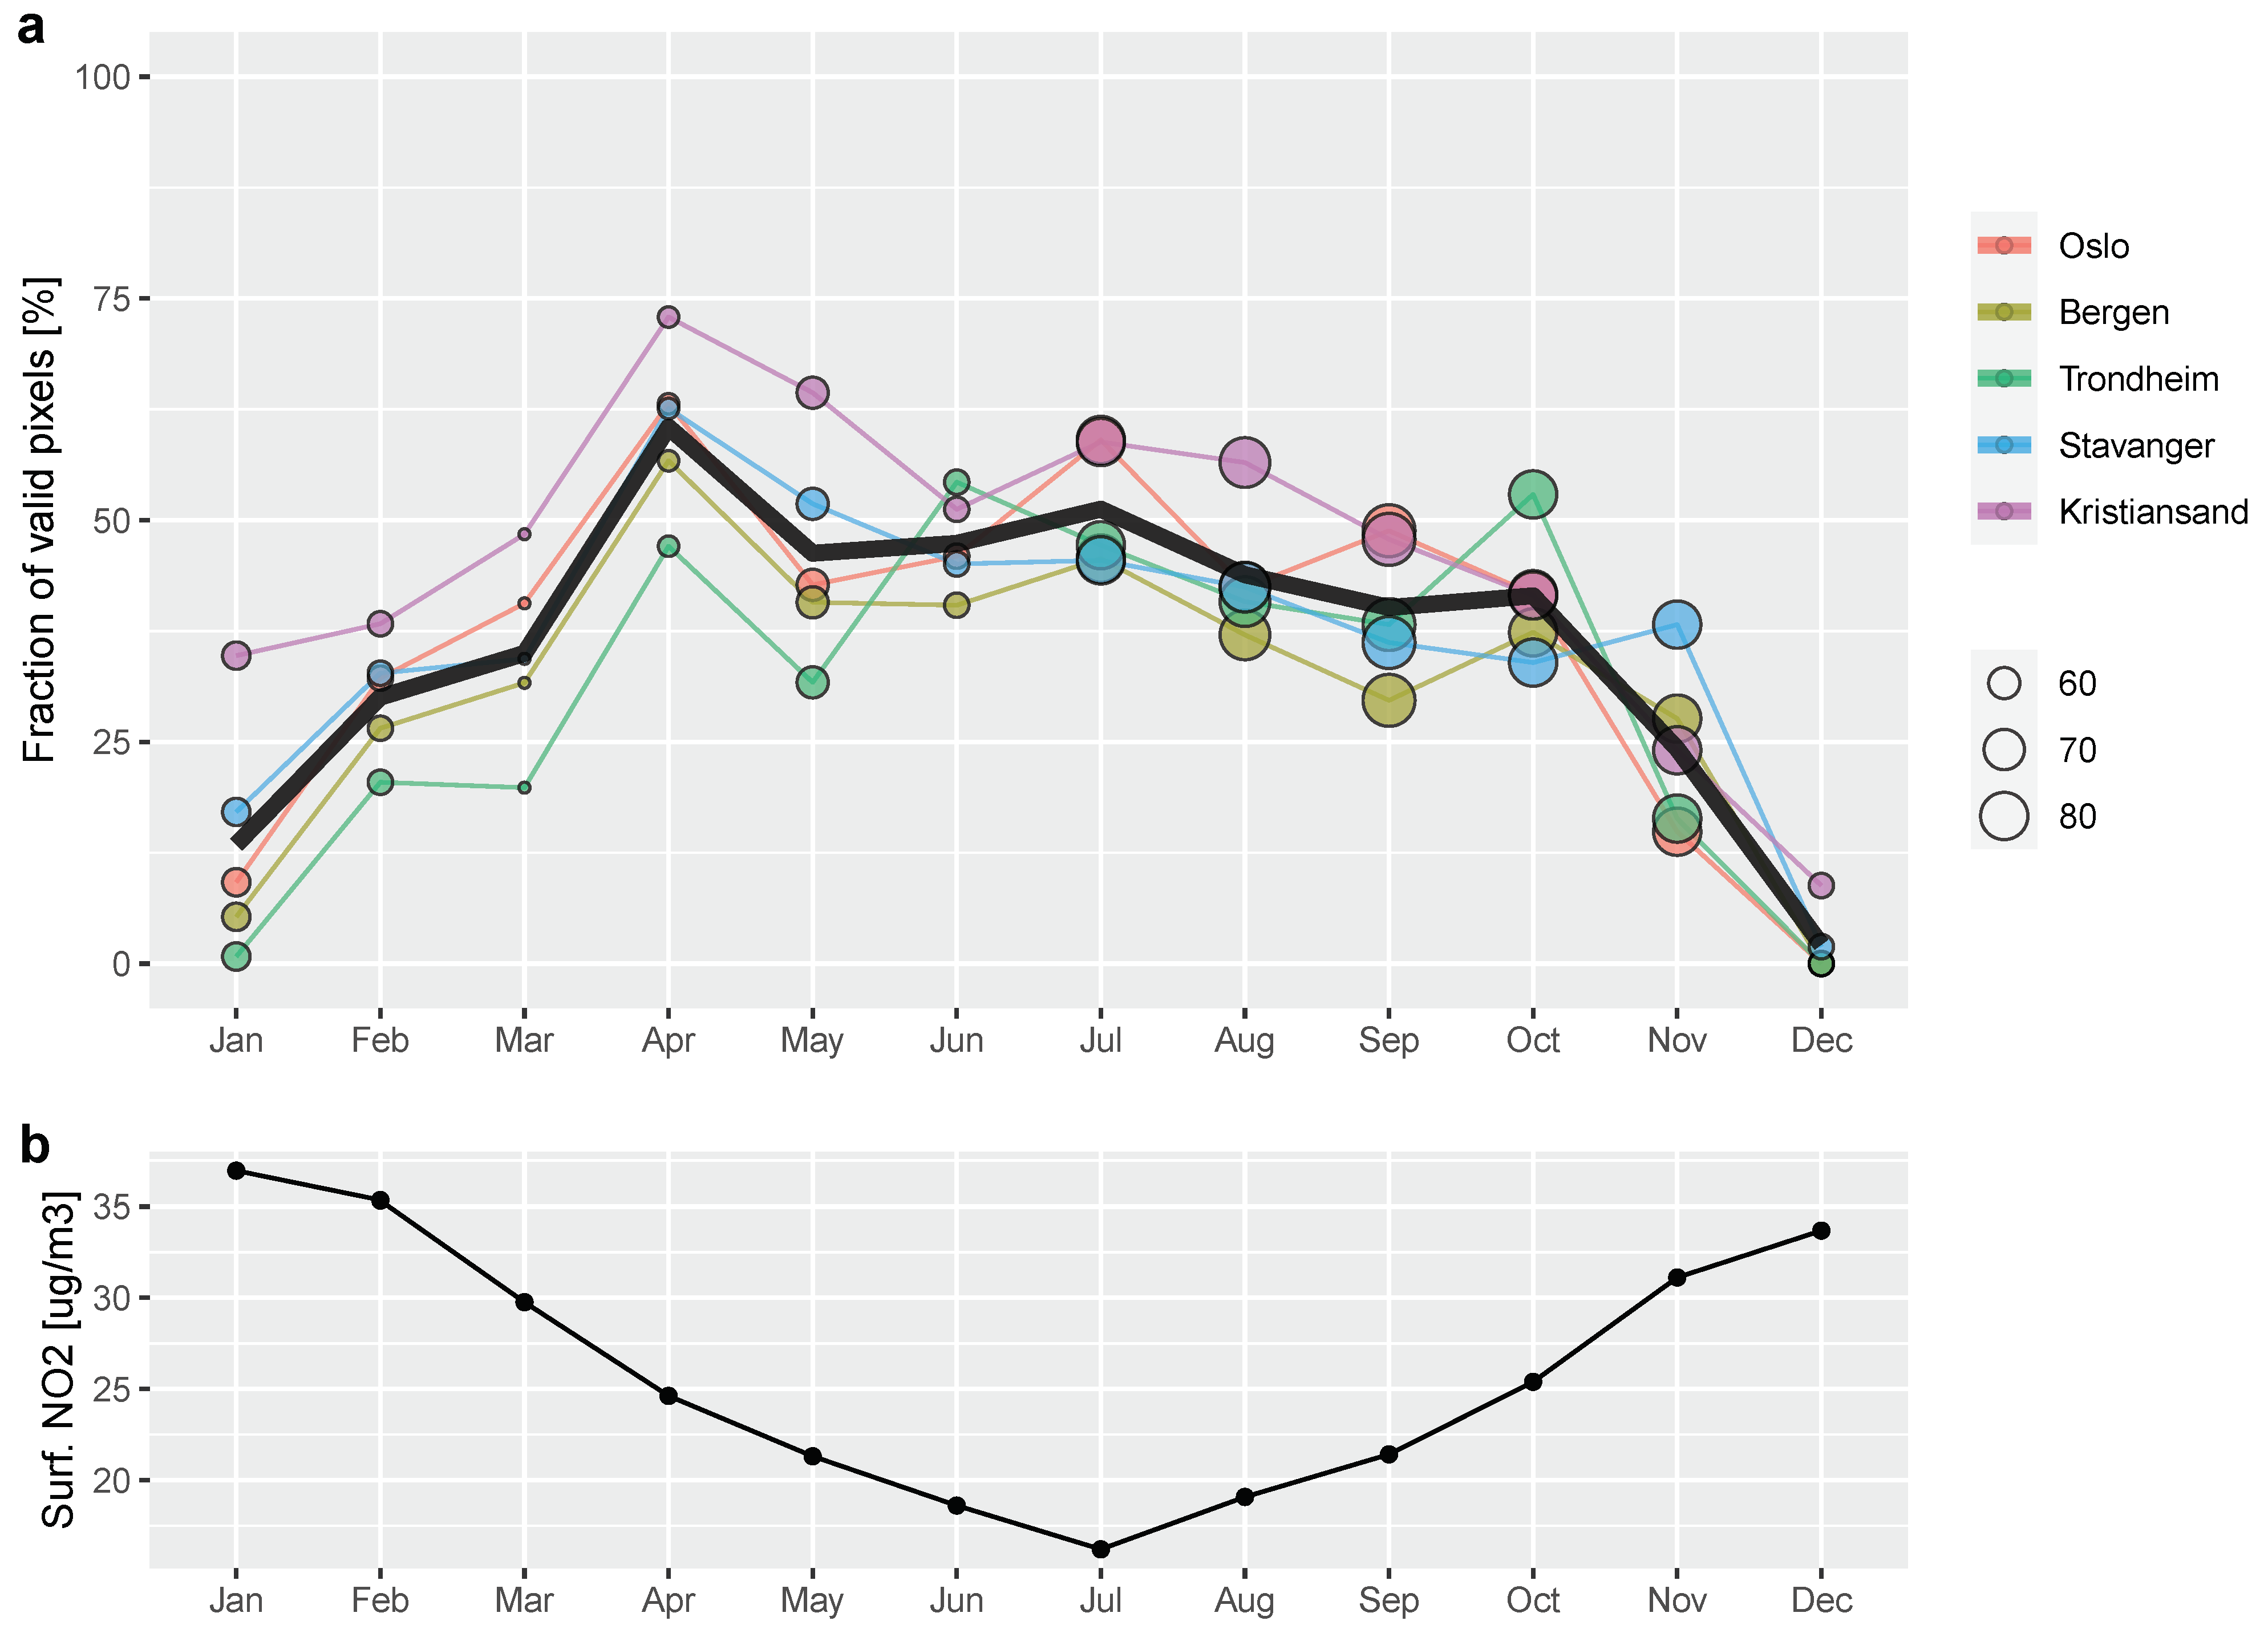
Figure 7a shows the average fraction of valid pixels per domain and month. We can observe a clear seasonal cycle with the lowest fraction of valid retrievals in December and the highest fraction in spring and summer. This figure also shows once again that overall the most valid retrievals are found for the Kristiansand domain, whereas Trondheim and to some extent Bergen depending on season show the lowest number of retrievals. To contrast this, Figure 7b shows the average annual cycle of surface as measured by the official air quality monitoring stations equipped with reference instrumentation (here calculated over hourly observations from all reporting Norwegian stations for the years 2013 through 2019). We can observe a strong maximum of pollution during the winter months, when inversion episodes and lack of sunlight typically result in increased pollution levels, and a clear minimum during the summer months. This is the inverse behavior of the annual cycle of available TROPOMI data and as such this clear disconnect between data availability and actual need for monitoring unfortunately limits the usefulness of TROPOMI for operational air quality monitoring in Norway during the high pollution episodes of the winter months.
Data assimilation techniques such as the ensemble Kalman filter or variational methods [12] can in principle benefit from and make use of relatively small amounts of data if the corresponding uncertainties are properly quantified. They are thus excellent tools for filling gaps in the satellite data. However, multiple weeks of zero data availability, as we see around the winter solstice at all study sites (see Figure 6), in combination with the fact that typically has a short lifetime of several hours (and up to approximately a day in Norwegian winter conditions) means in practice that no satellite signal is being used during these periods when the signal is assimilated directly (since increments from previous observations do not propagate over more than several days due to chemical loss, transport, and dilution effects). Using the satellite data indirectly by, for example, inferring general corrections in a priori emissions used in the model can therefore be beneficial in such cases.
It should be noted, however, that data availability issues related to solar zenith angle and cloud cover apply to all existing satellite instruments operating with similar technology and is not limited to just TROPOMI. When interpreting these results it should be kept in mind that the study period used here was only from July 2018 to November 2020 and thus, although slightly more than two years in length, is not long enough to be representative in terms of entirely removing the effect of interannual meteorological variability and thus cloud cover.
4. Conclusions
Close to 2.5 years of TROPOMI data were acquired, processed, and evaluated with respect to average pollution levels and spatiotemporal data availability over the major urban areas of southern Norway (Oslo, Bergen, Trondheim, Stavanger, and Kristiansand). The results indicate that despite significant cloud cover and overall very low pollution levels, clear hotspots of tropospheric column with distinct spatial shapes to some extent are visible in long-term averages maps over all the study sites with an exception of Kristiansand. This highlights the clear strength of TROPOMI data to perform relatively high-resolution mapping of pollution over urban areas. We can expect this strength to be of particular use in applications related to very large conurbations where many TROPOMI pixels will be present within the spatial domain of interest.
A spatial analysis of the fraction of valid retrievals for each study domain showed that typically on a per-pixel level between 20% and 50% of the TROPOMI tropospheric column retrievals are valid over the five domains studied here. In general, coastal areas exhibit a slightly higher frequency of valid retrievals than inland and mountainous areas, which are affected by more extensive cloud cover and pixels with fractional snow cover. A temporal analysis showed a very clear seasonal cyle of data availability with a minimum of often less than 20% valid retrievals in the winter months and a maximum of typically over 50% valid retrievals in the summer months. While this is to some extent due to the substantial seasonal changes in cloud cover, the solar zenith angle also plays a role and causes substantial gaps in data coverage several weeks before and after the winter solstice. This seasonal cycle follows the exact inverse behavior of the typical seasonal urban pollution pattern in Norway, which is highest during the winter months and less prominent during the summer months. As a result, the use of TROPOMI data for urban areas in Norway is challenging during very high episodes as, for example, associated with typical inversion conditions during the peak winter months. This is because there likely will not be enough valid observations to sufficiently quantify the spatiotemporal patterns during such periods. A potential mitigation measure could be to lower the acceptable retrieval quality threshold from 0.75 to 0.5 and thus accept also slightly lower-quality retrievals but with the advantage of somewhat higher data availability. A threshold of 0.5 includes good-quality retrievals above clouds and over scenes covered by snow/ice and can be relevant for data assimilation and similar applications where the averaging kernel of the product is applied [9]. We will carry out more research along these lines to better understand the best compromise between retrieval quality and quantity (e.g., by comparing monthly mean fields with strict and relaxed filtering criteria) with a specific focus on urban areas in Norway and how this affects the various applications. We are further planning to scale up the analysis both spatially and temporally and will work towards a differentiation of rejected retrievals by underlying cause (solar zenith angle, cloud cover, and snow/ice).
The results of this study nonetheless indicate that the TROPOMI dataset provides sufficiently high data availability and thus very valuable spatiotemporal information on pollution for urban areas in Norway during spring, summer, and fall. During these periods, the TROPOMI data have significant potential even in a challenging environment such as Norway for, e.g., local-scale mapping and monitoring, including applications relevant for human exposure such as surface-level mapping, which converts the column-based retrievals from TROPOMI or similar satellite instruments to surface concentrations based on additional information obtained from either chemistry transport models [18] or statistical relationships between satellite-based column information and surface monitoring stations [19,20,21].
In addition, more advanced techniques such as correcting emission inventories through inverse modeling methods or data assimilation of the data into urban-scale dispersion models are available. Indeed, data assimilation of concentrations for the purpose of air quality mapping could be an attractive strategy. Models when combined with observations in data assimilation can play a role of gap-filling in the time periods when the availability of satellite observations is limited, which would help to mitigate a key weakness of the TROPOMI dataset identified in this study. Furthermore, inversion modeling methods to estimate emissions can help even more in this regard since this technique can improve model parameters even during periods when the satellite observations are unavailable.
Author Contributions
Conceptualization, P.S.; methodology, P.S., P.D.H., A.K., S.S., and K.S.; software, P.S. and A.K.; validation, P.S.; formal analysis, P.S.; investigation, P.S., P.D.H., A.K., S.S., and K.S.; resources, P.S. and K.S.; data curation, P.S.; writing—original draft preparation, P.S.; writing—review and editing, P.S., P.D.H., A.K., S.S., and K.S.; visualization, P.S.; supervision, P.S.; project administration, P.S. and K.S.; funding acquisition, P.S. and K.S. All authors have read and agreed to the published version of the manuscript.
Funding
This research was funded by a grant provided by the Norwegian Space Agency under contract number NIT.05.16.5 (PRETROP).
Acknowledgments
The authors gratefully acknowledge the free use of Sentinel-5P/TROPOMI data. The presented material contains modified Copernicus Sentinel data (2018, 2019, 2020). The OpenStreetMap project and its contributors are acknowledged for providing and allowing free use of the cartographic base layers in the maps. Map tiles by Stamen Design, under CC BY 3.0. Data by OpenStreetMap, under ODbL.
Conflicts of Interest
The authors declare no conflict of interest.
References
- European Environment Agency. Air Quality in Europe: 2020 Report; Technical Report; Publications Office of the European Union: Luxembourg, 2020. [Google Scholar]
- Beirle, S.; Borger, C.; Dörner, S.; Li, A.; Hu, Z.; Liu, F.; Wang, Y.; Wagner, T. Pinpointing nitrogen oxide emissions from space. Sci. Adv. 2019, 5, eaax9800. [Google Scholar] [CrossRef] [PubMed] [Green Version]
- Bauwens, M.; Compernolle, S.; Stavrakou, T.; Müller, J.F.; van Gent, J.; Eskes, H.; Levelt, P.F.; van der A, R.; Veefkind, J.P.; Vlietinck, J.; et al. Impact of Coronavirus Outbreak on NO2 Pollution Assessed Using TROPOMI and OMI Observations. Geophys. Res. Lett. 2020, 47, e2020GL087978. [Google Scholar] [CrossRef] [PubMed]
- Georgoulias, A.K.; Boersma, K.F.; Vliet, J.V.; Zhang, X.; van der A, R.; Zanis, P.; Laat, J.D. Detection of NO2 pollution plumes from individual ships with the TROPOMI/S5P satellite sensor. Environ. Res. Lett. 2020, 15, 124037. [Google Scholar] [CrossRef]
- Goldberg, D.L.; Anenberg, S.C.; Kerr, G.H.; Mohegh, A.; Lu, Z.; Streets, D.G. TROPOMI NO2 in the United States: A detailed look at the annual averages, weekly cycles, effects of temperature, and correlation with surface NO2 concentrations. Earth’s Future 2021, 9, e2020EF001665. [Google Scholar] [CrossRef] [PubMed]
- Griffin, D.; Zhao, X.; McLinden, C.A.; Boersma, F.; Bourassa, A.; Dammers, E.; Degenstein, D.; Eskes, H.; Fehr, L.; Fioletov, V.; et al. High-Resolution Mapping of Nitrogen Dioxide With TROPOMI: First Results and Validation Over the Canadian Oil Sands. Geophys. Res. Lett. 2019, 46, 1049–1060. [Google Scholar] [CrossRef] [Green Version]
- Tack, F.; Merlaud, A.; Iordache, M.D.; Pinardi, G.; Dimitropoulou, E.; Eskes, H.; Bomans, B.; Veefkind, P.; Van Roozendael, M. Assessment of the TROPOMI tropospheric NO2 product based on airborne APEX observations. Atmos. Meas. Tech. 2021, 14, 615–646. [Google Scholar] [CrossRef]
- Hamer, P.D.; Walker, S.E.; Sousa-Santos, G.; Vogt, M.; Vo-Thanh, D.; Lopez-Aparicio, S.; Schneider, P.; Ramacher, M.O.P.; Karl, M. The urban dispersion model EPISODE v10.0—Part 1: An Eulerian and sub-grid-scale air quality model and its application in Nordic winter conditions. Geosci. Model Dev. 2020, 13, 4323–4353. [Google Scholar] [CrossRef]
- Eskes, H.; van Geffen, J.; Sneep, M.; Apituley, A.; Veefkind, J.P. Sentinel-5 Precursor/TROPOMI Level-2 Product User Manual Nitrogen Dioxide; Technical Report S5P-KNMI-L2-0021-MA; Royal Netherlands Meteorological Institute (KNMI): De Bilt, The Netherlands, 2019. [Google Scholar]
- Van Geffen, J.H.G.M.; Boersma, K.F.; Eskes, H.J.; Maasakkers, J.D.; Veefkind, J.P. TROPOMI ATBD of the Total and Tropospheric NO2 Data Products; Technical Report S5P-KNMI-L2-0005-RP; Royal Netherlands Meteorological Institute (KNMI): De Bilt, The Netherlands, 2019. [Google Scholar]
- Lahoz, W.; Khattatov, B.; Menard, R. (Eds.) Data Assimilation: Making Sense of Observations; Springer: Berlin/Heidelberg, Germany, 2010. [Google Scholar] [CrossRef]
- Lahoz, W.A.; Schneider, P. Data assimilation: Making sense of Earth Observation. Front. Environ. Sci. 2014, 2, 16. [Google Scholar] [CrossRef] [Green Version]
- Kalnay, E. Atmospheric Modeling, Data Assimilation, and Predictability; Cambridge University Press: Cambridge, UK, 2013. [Google Scholar]
- Fletcher, S.J. Data Assimilation for the Geosciences: From Theory to Application, 1st ed.; Elsevier: Amsterdam, The Netherlands, 2017. [Google Scholar]
- Rodgers, C.D. Inverse Methods for Atmospheric Sounding: Theory and Practice; World Scientific: Singapore, 2000. [Google Scholar]
- van Geffen, J.; Boersma, K.F.; Eskes, H.; Sneep, M.; ter Linden, M.; Zara, M.; Veefkind, J.P. S5P TROPOMI NO2 slant column retrieval: Method, stability, uncertainties and comparisons with OMI. Atmos. Meas. Tech. 2020, 13, 1315–1335. [Google Scholar] [CrossRef] [Green Version]
- Eskes, H.J.; Eichmann, K.U. S5P Mission Performance Centre Nitrogen Dioxide [L2_NO2___] Readme; Technical Report 1.6; European Space Agency: Paris, France, 2020. [Google Scholar] [CrossRef]
- Lamsal, L.N.; Martin, R.V.; van Donkelaar, A.; Steinbacher, M.; Celarier, E.A.; Bucsela, E.; Dunlea, E.J.; Pinto, J.P. Ground-level nitrogen dioxide concentrations inferred from the satellite-borne Ozone Monitoring Instrument. J. Geophys. Res. 2008, 113, D16308. [Google Scholar] [CrossRef] [Green Version]
- Wu, S.; Huang, B.; Wang, J.; He, L.; Wang, Z.; Yan, Z.; Lao, X.; Zhang, F.; Liu, R.; Du, Z. Spatiotemporal mapping and assessment of daily ground NO2 concentrations in China using high-resolution TROPOMI retrievals. Environ. Pollut. 2021, 273, 116456. [Google Scholar] [CrossRef] [PubMed]
- Chan, K.L.; Khorsandi, E.; Liu, S.; Baier, F.; Valks, P. Estimation of Surface NO2 Concentrations over Germany from TROPOMI Satellite Observations Using a Machine Learning Method. Remote Sens. 2021, 13, 969. [Google Scholar] [CrossRef]
- Cooper, M.J.; Martin, R.V.; McLinden, C.A.; Brook, J.R. Inferring ground-level nitrogen dioxide concentrations at fine spatial resolution applied to the TROPOMI satellite instrument. Environ. Res. Lett. 2020, 15, 104013. [Google Scholar] [CrossRef]
Figure 1.
Spatial patterns of tropospheric column from TROPOMI over Norway (in units of ×1015 molecules cm−2 ), averaged over the entire study period between July 2018 and November 2020 (left panel) and the proportion of days where the noon solar zenith angle is less than 81.2°, i.e., the solar zenith angle treshold above which no valid retrievals with a quality assurance value of 0.75 can be made [9,10], thus providing an upper constraint for the theoretically possible number of days with valid retrievals at this quality threshold under clear-sky conditions (right panel, see Section 2.2 for more details).

Figure 2.
Location and extent of the five study sites in Norway.

Figure 3.
Overall summary statistics of pollution level and data availability for all study sites computed over the entire study period. Panel (a) shows the average tropospheric column by site sorted from high to low, whereas panel (b) shows the overall average fraction of valid TROPOMI retrievals calculated over each study domain, again sorted from high to low. The colors represent each study site and allow cross-referencing between the two panels.

Figure 4.
Spatial patterns of the average tropospheric column for all five sites, calculated over the entire study period. In addition to the color scale, column values are also indicated as black isolines. Note that the upper limit of the color scales varies slightly from panel to panel to better highlight the spatial patterns despite the differences in absolute levels.

Figure 5.
Spatial patterns of the fraction of valid tropospheric column for all five sites, calculated over the entire study period. Note that in this case the lower and upper limits are consistent throughout all five panels but that the color scale is inverted with respect to Figure 4, i.e., areas with poor coverage are represented as red whereas regions with a relatively high fraction of valid retrievals are green.

Figure 6.
Time series of the fraction (in percent) of valid tropospheric retrievals in each domain for all daily data acquisitions throughout the entire study period. Solid lines indicate a 30-day moving average.
Figure 6.
Time series of the fraction (in percent) of valid tropospheric retrievals in each domain for all daily data acquisitions throughout the entire study period. Solid lines indicate a 30-day moving average.

Figure 7.
(a) Average monthly fraction of valid pixels per month for all study domains. The size of the markers indicates the number of days that went into each monthly average. The thick black lines shows the average over all domains. (b) Average monthly surface concentration calculated over all air quality monitoring stations in Norway for the years 2013 through 2019.


Table 1.
Metadata of the selected study sites. The Valid Days column describes the absolute number of days per year for which the given location has a noon solar zenith angle less than 81.2°, thus indicating an upper constraint for favorable conditions for retrieval at a quality assurance value of 0.75 or higher under clear-sky conditions (see also Figure 1 right panel).
| Site | Min. Long. [°] | Max. Long. [°] | Min. Lat. [°] | Max. Lat. [°] | Area [km2] | Valid Days |
|---|---|---|---|---|---|---|
| Oslo | 10.00 | 11.40 | 59.60 | 60.30 | 6101.20 | 317 |
| Bergen | 4.90 | 5.60 | 60.10 | 60.60 | 2152.93 | 313 |
| Trondheim | 9.80 | 11.20 | 63.20 | 63.60 | 3119.52 | 287 |
| Stavanger | 5.40 | 6.00 | 58.70 | 59.10 | 1541.00 | 332 |
| Kristiansand | 7.80 | 8.30 | 58.00 | 58.30 | 983.79 | 344 |
Publisher’s Note: MDPI stays neutral with regard to jurisdictional claims in published maps and institutional affiliations. |
© 2021 by the authors. Licensee MDPI, Basel, Switzerland. This article is an open access article distributed under the terms and conditions of the Creative Commons Attribution (CC BY) license (https://creativecommons.org/licenses/by/4.0/).
Share and Cite
MDPI and ACS Style
Schneider, P.; Hamer, P.D.; Kylling, A.; Shetty, S.; Stebel, K. Spatiotemporal Patterns in Data Availability of the Sentinel-5P NO2 Product over Urban Areas in Norway. Remote Sens. 2021, 13, 2095. https://doi.org/10.3390/rs13112095
AMA Style
Schneider P, Hamer PD, Kylling A, Shetty S, Stebel K. Spatiotemporal Patterns in Data Availability of the Sentinel-5P NO2 Product over Urban Areas in Norway. Remote Sensing. 2021; 13(11):2095. https://doi.org/10.3390/rs13112095
Chicago/Turabian StyleSchneider, Philipp, Paul D. Hamer, Arve Kylling, Shobitha Shetty, and Kerstin Stebel. 2021. "Spatiotemporal Patterns in Data Availability of the Sentinel-5P NO2 Product over Urban Areas in Norway" Remote Sensing 13, no. 11: 2095. https://doi.org/10.3390/rs13112095
Note that from the first issue of 2016, this journal uses article numbers instead of page numbers. See further details here.