
Advancing Floating Macroplastic Detection from Space Using Experimental Hyperspectral Imagery


1
Hydrology and Quantitative Water Management Group, Wageningen University and Research, 6708 PB Wageningen, The Netherlands
2
Plant Sciences Group, Wageningen University and Research, 6708 PB Wageningen, The Netherlands
3
Plymouth Marine Laboratory, Prospect Place, Plymouth PL1 3DH, UK
*
Author to whom correspondence should be addressed.
Remote Sens. 2021, 13(12), 2335; https://doi.org/10.3390/rs13122335
Submission received: 11 May 2021
/
Revised: 8 June 2021
/
Accepted: 9 June 2021
/
Published: 15 June 2021
(This article belongs to the Special Issue Remote Sensing of Plastic Pollution)
Abstract
:Airborne and spaceborne remote sensing (RS) collecting hyperspectral imagery provides unprecedented opportunities for the detection and monitoring of floating riverine and marine plastic debris. However, a major challenge in the application of RS techniques is the lack of a fundamental understanding of spectral signatures of water-borne plastic debris. Recent work has emphasised the case for open-access hyperspectral reflectance reference libraries of commonly used polymer items. In this paper, we present and analyse a high-resolution hyperspectral image database of a unique mix of 40 virgin macroplastic items and vegetation. Our double camera setup covered the visible to shortwave infrared (VIS-SWIR) range from 400 to 1700 nm in a darkroom experiment with controlled illumination. The cameras scanned the samples floating in water and captured high-resolution images in 336 spectral bands. Using the resulting reflectance spectra of 1.89 million pixels in linear discriminant analyses (LDA), we determined the importance of each spectral band for discriminating between water and mixed floating debris, and vegetation and plastics. The absorption peaks of plastics (1215 nm, 1410 nm) and vegetation (710 nm, 1450 nm) are associated with high LDA weights. We then compared Sentinel-2 and Worldview-3 satellite bands with these outcomes and identified 12 satellite bands to overlap with important wavelengths for discrimination between the classes. Lastly, the Normalised Vegetation Difference Index (NDVI) and Floating Debris Index (FDI) were calculated to determine why they work, and how they could potentially be improved. These findings could be used to enhance existing efforts in monitoring macroplastic pollution, as well as form a baseline for the design of future multispectral RS systems.
1. Introduction
Plastic pollution in natural environments has adverse effects on wildlife, habitats, and human wellbeing. An estimated 19–23 million metric tonnes of plastics enter aquatic ecosystems annually, which is predicted to increase by an order of magnitude in the coming decades [1,2]. Meijer, et al. [3] estimated that 0.8–2.7 million metric tonnes of macroplastic enter the oceans through rivers on an annual basis. Such global model estimates depend on reliable observational data, which has led to many studies on different monitoring techniques to improve the large-scale detection and quantification of riverine macroplastic loads and plastics accumulated on beaches, lakeshores, and riverbanks. Crowd-based observations can be used to estimate riverbank macro-litter abundance over large areas [4,5]. More localised macroplastic assessments have used floating booms [6], bulk water samples [7], and visual counting from bridges, riverbanks, and quay walls [8,9]. Despite these increasing efforts, data collection has been inconsistent over time and space in riverine and coastal environments [10,11]. Furthermore, the current methods to quantify macroplastic abundance are often labour intensive, costly, require additional or specialist equipment, and are geographically limited to local scales [5,12].
Recently, remote sensing (RS) that collects multi- to hyperspectral imagery has started to show far-reaching potential for the detection and monitoring of riverine and marine plastic pollution [13,14]. For example, Topouzelis, et al. [15] and Themistocleous, et al. [16] successfully identified large artificial plastic targets in coastal zones using Sentinel-2 imagery. Biermann, et al. [17], Kikaki, et al. [18], and Garaba, et al. [19] categorised floating litter in marine environments on the basis of the varieties in spectral reflectance of different materials. On a smaller laboratory scale, Goddijn-Murphy and Dufaur [20] showed that the reflectance of plastic targets floating on water surfaces roughly corresponded with the reflectance of similar materials in a controlled laboratory setting. However, this relation is extremely sensitive to the type of plastic, transparency, shape, and surface characteristics [20]. In fact, Martínez-Vicente, et al. [21] emphasised that it is a challenge to confirm whether reflection characteristics observed in the laboratory can be used for detecting plastic litter in natural water systems. Additionally, natural and human-made items each have unique optically active spectral reflectance signatures, hampering the detection of mixed floating litter aggregates.
Several fundamental experiments exploring spectral signatures of virgin and harvested plastics have now been conducted in controlled environments [22,23,24,25]. These studies encourage the establishment of ultraviolet (UV) to shortwave infrared (SWIR) hyperspectral reflectance libraries of plastic items. Garaba and Dierssen [13] presented a large spectral reflectance dataset of wet and dry marine-harvested, washed-ashore, and virgin macroplastics in the UV-SWIR range using a hyperspectral spectroradiometer. The complementary study of Knaeps, Sterckx, Strackx, Mijnendonckx, Moshtaghi, Garaba and Meire [23] extended existing datasets by adding spectral measurements of floating and submerged plastics with varying levels of water turbidity. Another indoor experiment by Corbari, Maltese, Capodici, Mangano, Sarà and Ciraolo [25] focussed on spectrally characterising common plastic polymer types to determine the uniqueness of their spectral signatures in the UV-SWIR range. While the methods of these studies differed, the results were similar and have consistently shown that spectral shapes of plastic items consist of peak reflection and absorption features unique to the material composition [13]. The same has been seen in spectrograph-imaged beach-harvested plastics measured in the 1000–2500 nm SWIR range [26]. Indeed, based on the knowledge that plastics have unique spectral signatures, near-infrared (NIR) spectroscopy is already operationally used in the sorting of plastics in recycling plants [16]. Despite these fundamental studies, the potential of hyperspectral reflectance libraries for macroplastic detection from space has been largely unexplored.
Outside of laboratory settings, multispectral data acquired by airborne or spaceborne remote sensors have been used for the detection of floating debris [15,16,17,19,21,22,27]. As with lab-based studies, the detection algorithms here leveraged absorption features, or spectral signatures, and used different combinations of RS bands to create feature extraction indices. For example, Rokni, et al. [28] proposed various feature extraction indices for floating debris detection, which were complemented and tested by Themistocleous, Papoutsa, Michaelides and Hadjimitsis [16] using multispectral data from the Sentinel-2 satellites and an unmanned aerial vehicle (UAV). In addition, using Sentinel-2 data, Biermann et al. (2020) used a novel Floating Debris Index (FDI) for subpixel detection of floating debris and were able to discriminate plastics from natural materials using their spectral signatures. As opposed to hyperspectral imaging systems, these studies are limited by a given number of bands representing central wavelengths, often with a 20–40 nm range around the central bandwidth.
While rigorous lab-based studies have provided thorough insights into hyperspectral polymer-specific diagnostic absorption features, there has been little reproducibility in natural systems. In an effort to improve the fundamental basis of reflectance-based plastic identification, we present a high-resolution hyperspectral image dataset of a unique mix of plastics and vegetation. We conducted hyperspectral measurements in the visible (VIS, 400 nm) to shortwave infrared (SWIR, 1700 nm) range of the electromagnetic spectrum. Our objectives were threefold: (i) to establish a high-resolution library of spectral signatures of virgin macro plastics; (ii) to identify which wavelengths are most efficient in discriminating between plastics, vegetation, and water; and (iii) to compare the Sentinel-2 and Worldview-3 multispectral bands with our hyperspectral library, because of their global coverage in the VIS-SWIR and the prevalent use of satellites in the remote sensing of mixed floating litter. Our findings support existing efforts in monitoring macroplastic pollution using RS techniques and offer key information for the design of future airborne and spaceborne multispectral RS systems.
2. Materials and Methods
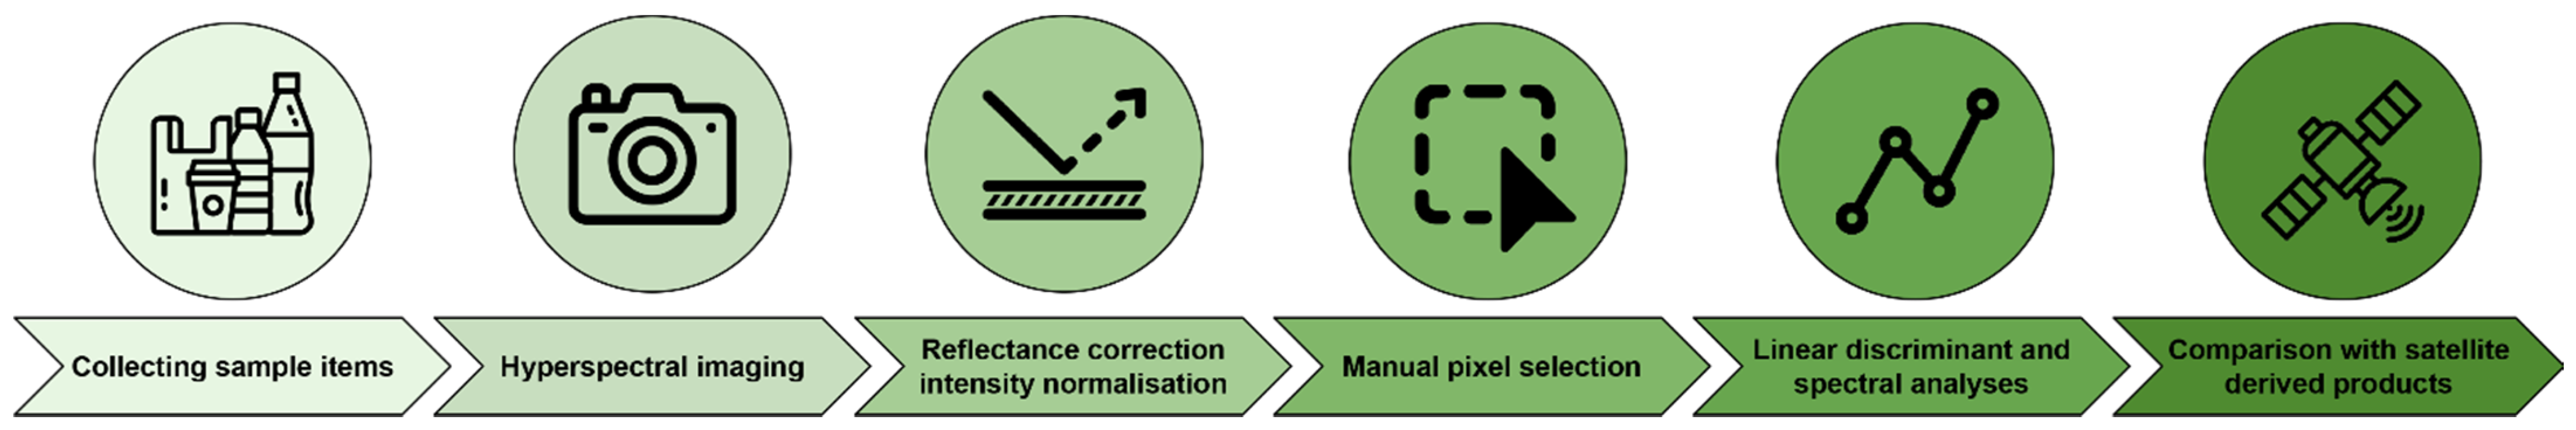
In this section, the materials and methods used in this study are described. Figure 1 depicts a flowchart of the six main steps leading to our results, discussion, and conclusions.
2.1. Plastic Samples Description
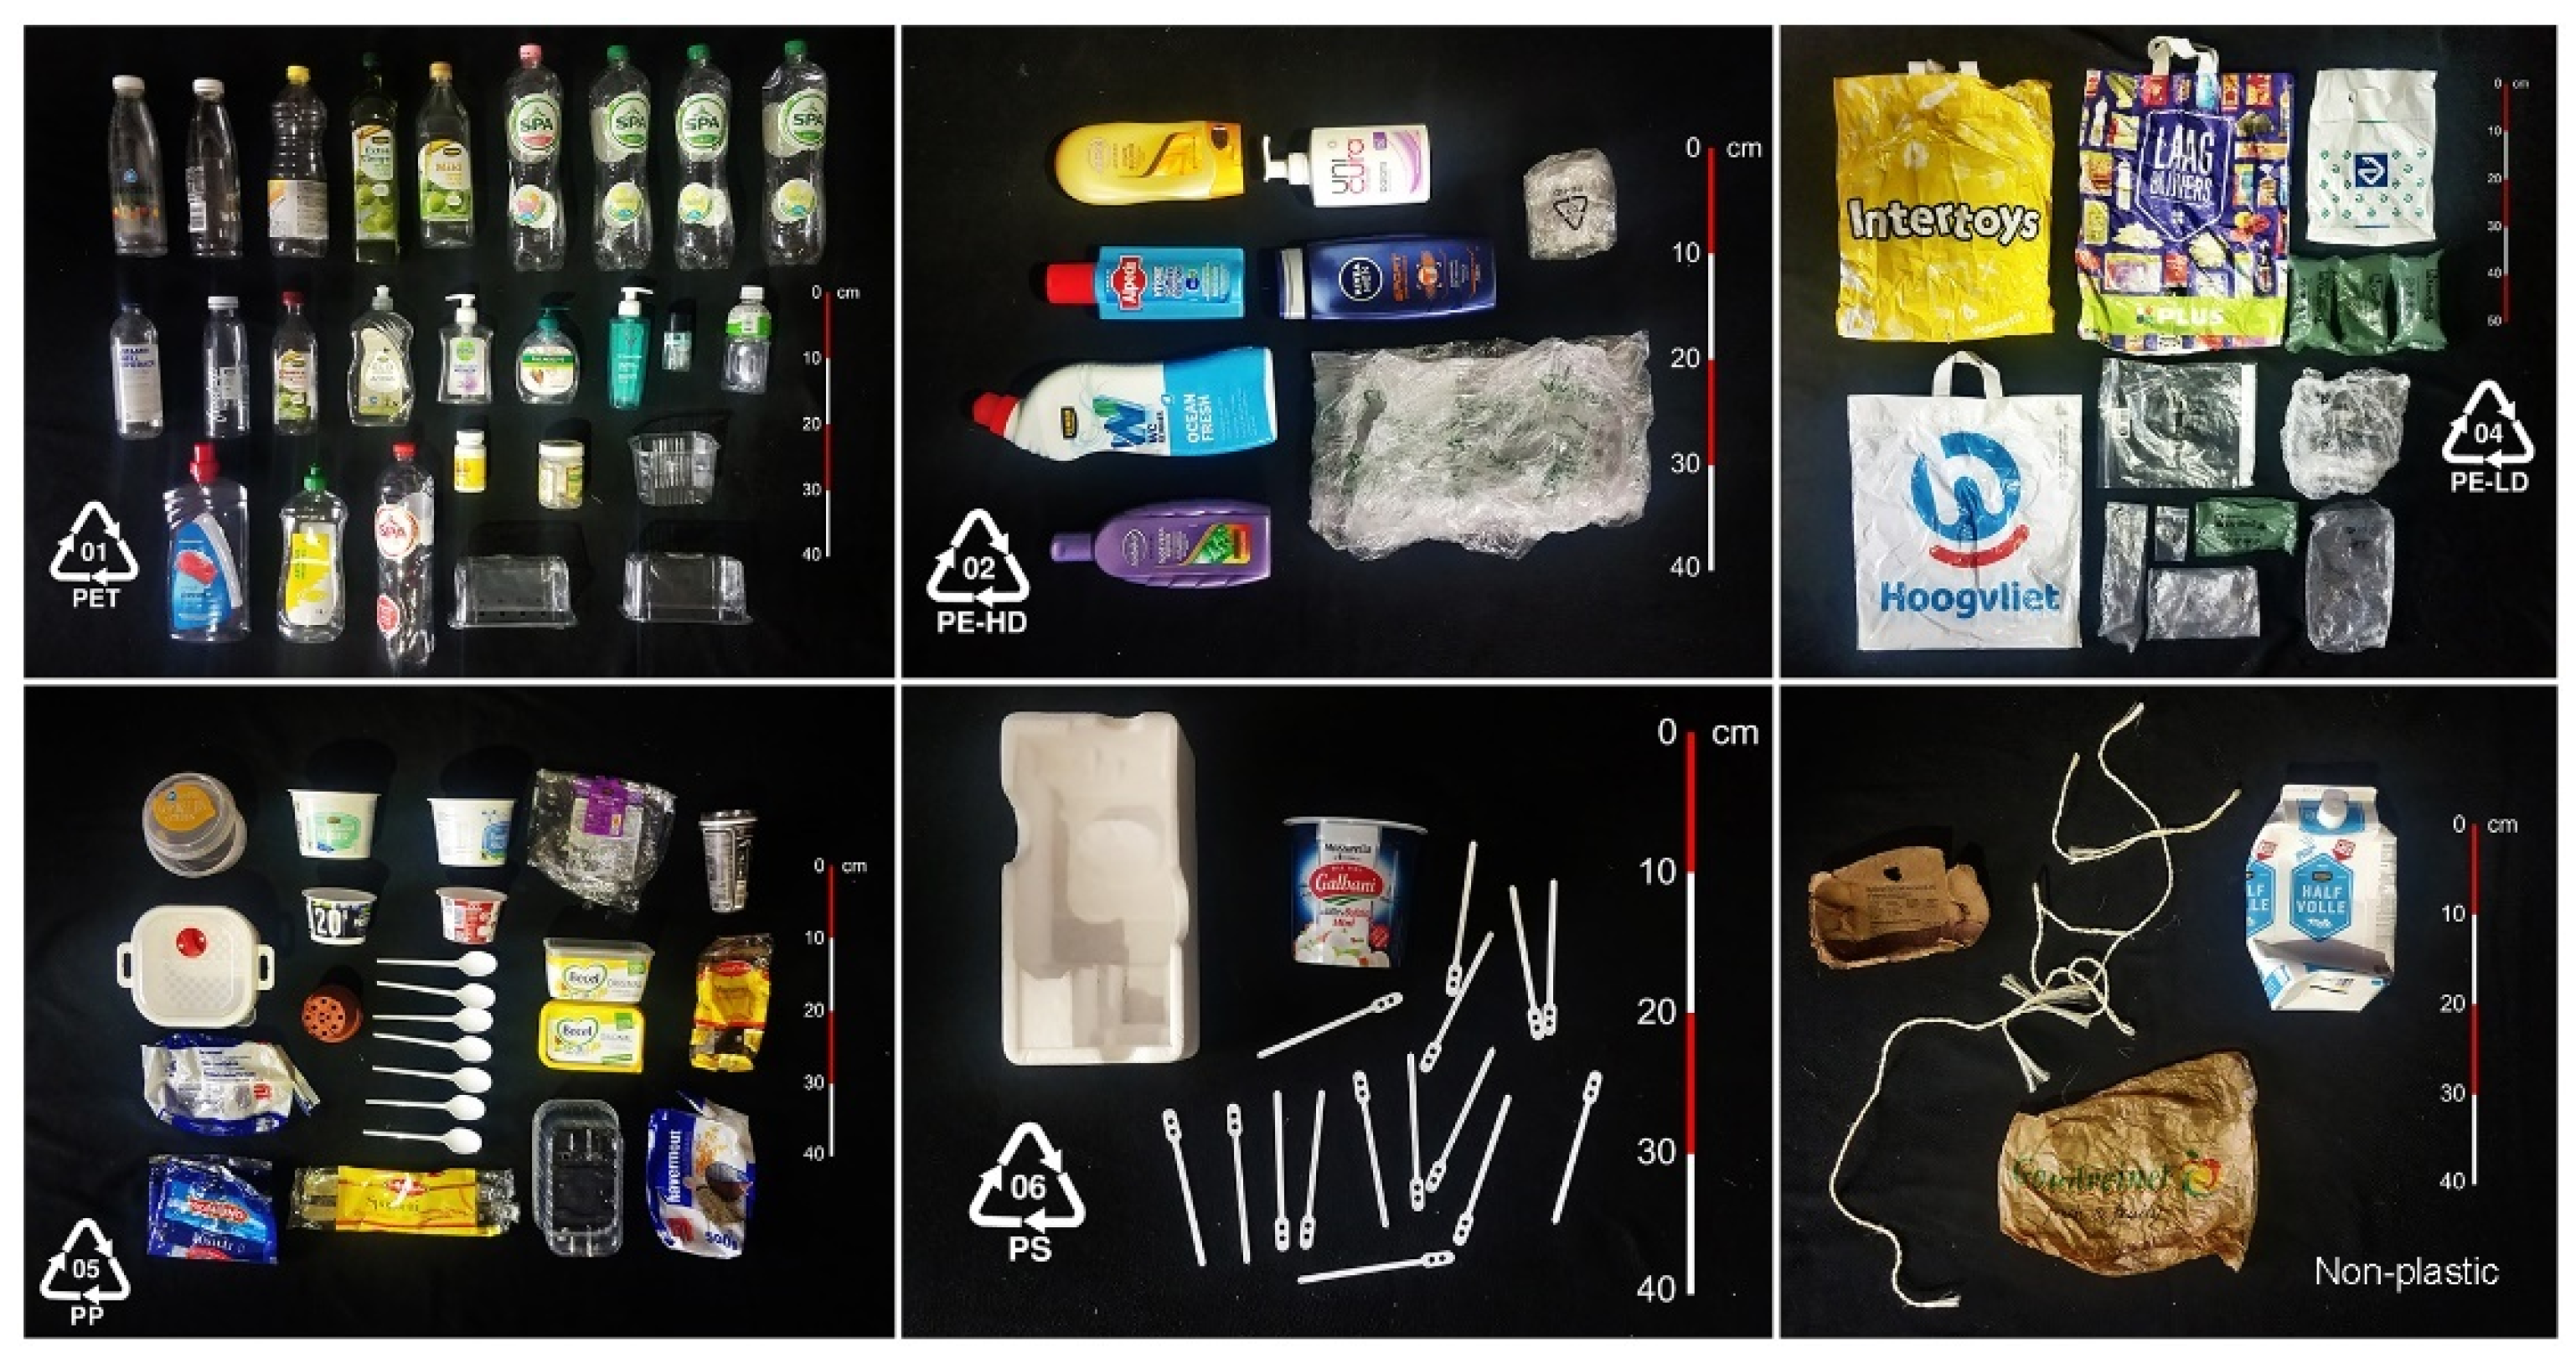
In this study, virgin plastic household items were collected from general household sources. A categorised overview of these plastics is shown in Figure 2. Out of 60,000 different types of plastic polymers, the most produced plastics by mass are low-density polyethene (LDPE), high-density polyethene (HDPE), polystyrene (PS), polyvinyl chloride (PVC), polypropylene (PP), and polyethene terephthalate (PET) [29,30]. These types of plastic are the most abundant in freshwater systems and rivers, even though the distribution, types, and magnitude of plastic waste are variable [31,32,33]. PVC is rarely found floating due to its high density compared to water and is therefore not considered in this paper. Several examples of the remaining categories are summarised in Table 1, as well as their specific gravity relative to water and common optical properties. The distribution of polymer compositions is averaged over multiple freshwater systems, based on findings in Schwarz, Ligthart, Boukris and van Harmelen [32] and van Calcar and van Emmerik [9], who demonstrated the macroplastic distribution can vary greatly for each environmental compartment.
In addition to the virgin plastic collection, the database was complemented by riverbank-harvested macro-litter, including plastics at different degradation states and other anthropogenic debris. In total, 67% of the items were classified as plastics and divided into seven plastic types (PET, PO hard, PO soft, multilayer, PS, PS-E, and other). All information and statistics about the riverbank-harvested macro-litter are found in the Supplementary Materials of this article. The riverbank-harvested items were not used in any of the analyses in this paper but are included in the database for future explorative studies.
2.2. Water and Vegetation Features
In addition to the plastic samples described above, the spectral signatures of water and vegetation were also determined. For vegetation, the leaf of a healthy houseplant (Ficus elastica) and several samples of riparian vegetation were collected (n = 3). The water signature was based on a layer of clear tap water with a depth of approximately 15 cm.
2.3. Experimental Setup
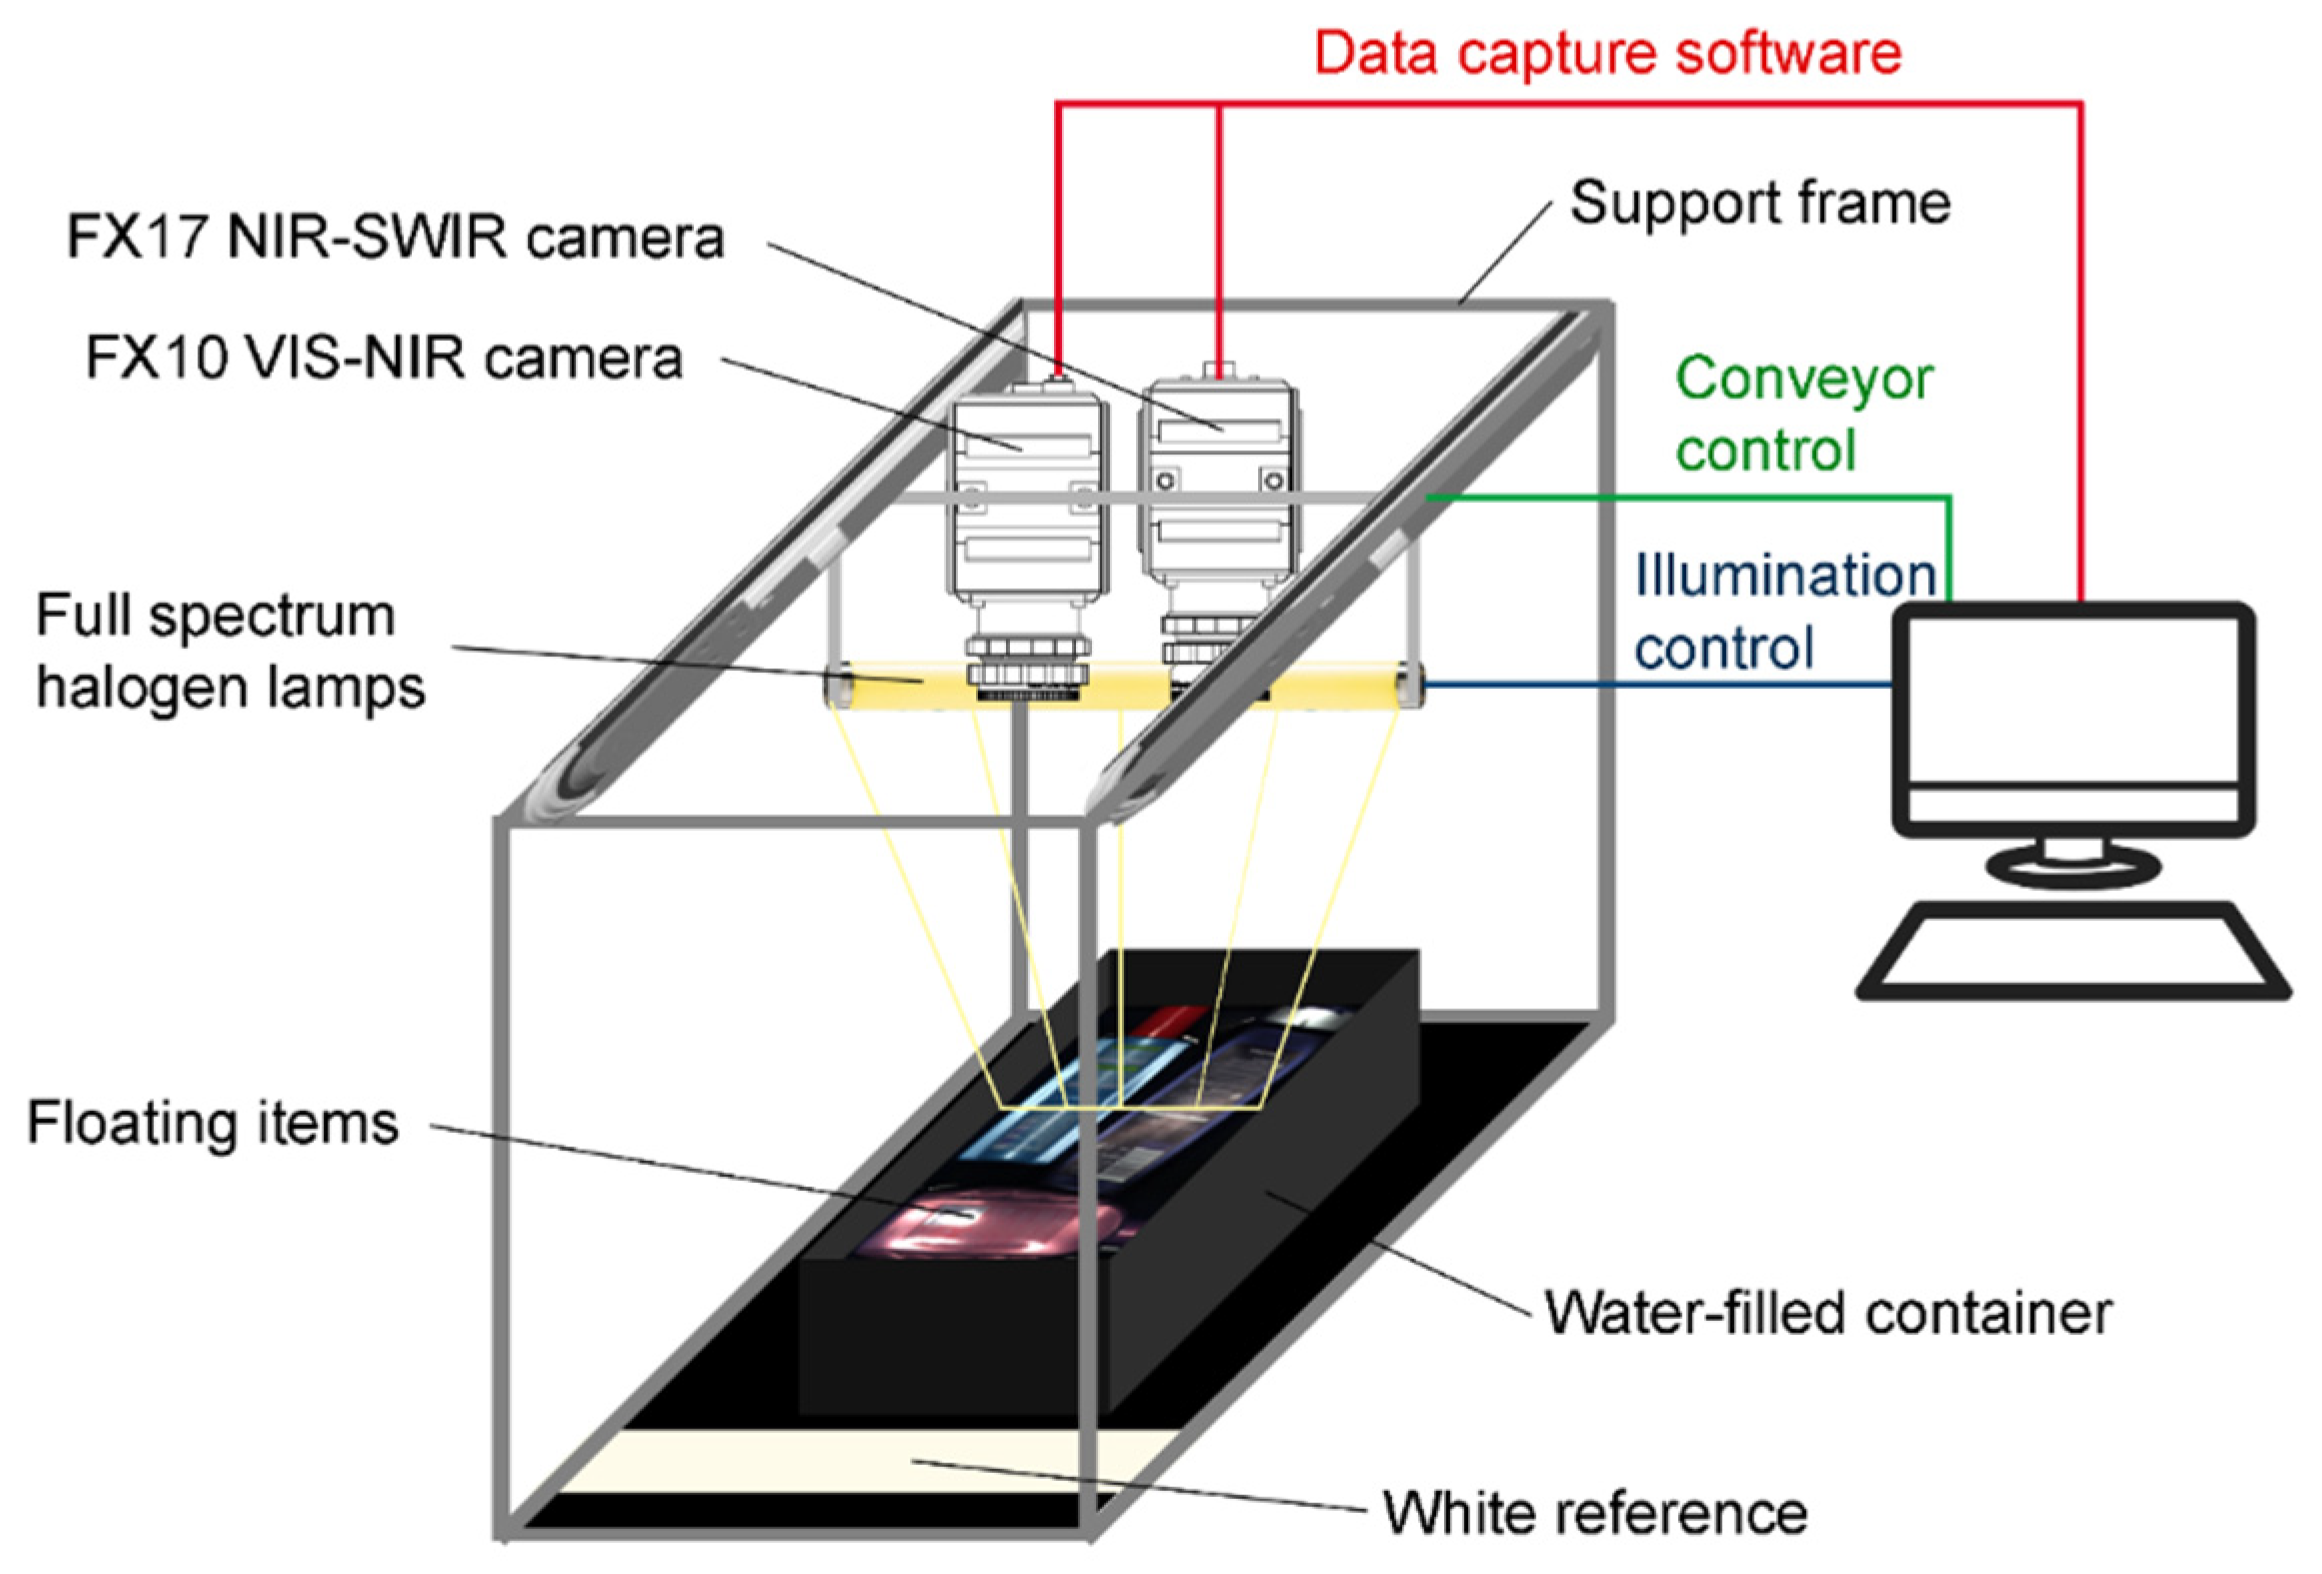
The hyperspectral imaging of plastic items, water, and vegetation was performed using a double camera setup. Together, the two cameras spanned the electromagnetic spectrum from 400 to 1700 nm, covering the visible (VIS) to shortwave infrared (SWIR) range. The cameras were set up in a dark room experiment with controlled illumination.
Figure 3 shows a schematic overview of the system. The imaging in the VIS-NIR range was performed using the Specim FX10 camera (Konica Minolta Company, Oulu, Finland). It captures at a rate of 25 fps in the VIS-NIR range of the spectrum (400–1000 nm) with a resolution of 1024 pixels per line scan in 224 wavelength bands across the camera’s spectral range. The effective pixel size is 20 × 10 µm, and the spectral resolution is 5.5 nm. The imaging in the NIR-SWIR range was performed using one Specim FX17 camera (Konica Minolta Company, Oulu, Finland). It captures at a rate of 25 fps in the NIR to SWIR range of the spectrum (1000–1700 nm) with a resolution of 640 pixels per line scan in 112 wavelength bands across the camera’s spectral range. The effective pixel size is 18.7 × 18.7 µm, and the spectral resolution is 8 nm.
To simulate an aquatic environment, a black polypropylene container was filled with tap water to a surface level of 50 cm below the camera lenses. The black container was used to hold the water and samples since it had negligible reflectance values relative to the reflectance values of the observed items over the entire spectrum. A white sheet of optical grade Spectralon was used as a white reference, having the highest diffuse reflectance of any known material in the range of the spectrum used in this study. The dark reference was captured by completely closing the aperture of the camera, leading to no light striking the sensor, resulting in a true dark reference. To ensure consistent illumination of the items, two full-spectrum halogen lamps illuminated the samples at roughly 15 degrees off-axis of the cameras. Both lamps’ focuses were aligned at the focus point of the line capture of both cameras. A computer with software was used to capture the data, control the integration time and exposure, and operate the motors for the linear scanner. Both cameras captured at a 0°-degree nadir angle perpendicular to the water surface.
For each image, first, the FX10 camera was centred to scan across the scene. After the final line scan, the white and dark references were captured. Next, the FX17 camera was centred and the procedure for capturing data was repeated, resulting in a 3D spatial-spectral dataset of 1024 (pixels) by 760 (lines) by 224 (bands) and 640 (pixels) by 760 (lines) by 112 (bands) for the FX10 and FX17 cameras, respectively. The integration time of the cameras was set to a value between 4 and 8 milliseconds depending on the brightness of the items, minimising overexposure, and maximising the signal-to-noise ratio. Yet, some glare from highly reflective plastic surfaces was inevitable and resulted in small patches of local overexposure. The glare patches were ignored in selecting representative pixels for each item, and the low signal-to-noise ratio did not affect reflections at the lower end of the dataset. Each capture including the white and black reference took approximately 30 seconds per camera, with 5 seconds in between the captures to return to the starting position.
2.4. Data Preparation
To further optimise the signal-to-noise ratio, the raw reflectance data were converted into relative reflectance. This was done by using the mean raw reflectance values of the white and dark reference sheets, following the same approach as Zhao, et al. [35], referring to Equation (1):
where is the corrected relative reflectance dataset, is the raw reflectance dataset, is the mean dark reference reflectance, and is the mean white reference reflectance. Next, to ensure accurate spectral reflectance signatures of the item samples, the lowest and highest bands within the range of both cameras were omitted.
It is important to note that the cameras have lower spectral response values at both extremes of their range. In combination with poorer light from the halogen lamps in the blue and violet range (400–490 nm), this resulted in higher amounts of background noise. An additional data transfer issue at the time of the experiments resulted in a usable spectral range of 500–850 nm and 950–1700 nm.
The next step involved normalising the intensity values of all pixels in the dataset and equalising the darker and lighter pixels belonging to a specific sample item. Equation (2) was applied to normalise the intensity:
where is the normalised intensity dataset, and and are the minimum and the maximum pixel value of all useable wavelengths of that pixel, respectively. As such, illumination differences were removed, getting rid of bright and dark patches, and allowing for the direct comparison of spectral signatures of different item types.
2.5. Data Analysis
After all virgin plastic items (n = 40), vegetation (n = 4), and the water were scanned by the hyperspectral cameras, representative pixels for each item were manually selected, using the PerClass Mira toolbox in MATLAB. Each image was segmented into regions of interest (ROIs) by using a paintbrush tool with various brush sizes based on the size of each sample item. Each ROI was defined according to an item class, either a type of plastic, vegetation, or water. In total, eight classes were established: (1) water, (2) vegetation, (3) PP, (4) HDPE, (5) LDPE, (6) PET, (7) PS, and (8) all plastics combined. For each class, the normalised and averaged spectral signatures were calculated.
An overview of the representative pixel counts per item category and camera is found in the Supplementary Materials. In total, 1.89 million pixels were sampled per wavelength for all categories in the entire range of the spectrum. This resulted in a database with a total of nearly 636 million pixels, each pixel being a single value in the normalised intensity dataset . The standard deviation of each averaged spectral signature was calculated to account for the large number of representative pixels (64–142 million) per item category. The complete spectral library consists of a different number of pixels counts, depending on the item category. Due to the difference in the image dimensions of the two cameras, the representative pixel totals also vary between the VIS-NIR and NIR-SWIR parts of the spectrum.
The resulting eight classes were used in a data pipeline to (i) extract the spectral signatures of each item class, and (ii) conduct Fisher linear discriminant analyses (LDAs) to find diagnostic features in the spectral signatures. First, LDAs were conducted to distinguish between all floating items and water. Subsequent LDAs were conducted to determine the importance of each wavelength for separating vegetation and plastics.
Linear discriminant analyses are widely used in machine learning and object classification models, reducing high-dimensional data to a lower dimensional space, whilst maintaining variation between classes [36,37]. It finds linear discriminants resulting in optimal discrimination between two classes [38]. First, the between-class variance (SB) is calculated, expressed as the differences in mean values ( of the two classes (Equation (3)). Next, the within-class variance (Sw) is computed, which is the difference between each value belonging to that class and the class mean () (Equation (4)). The last step is to combine these two steps, maximising the between-class variance and minimising the within-class variance, resulting in the Fishers linear discriminant (Equation (5)).
After conducting the linear discriminant analyses, comparisons were made between the weights of the LDAs and the reflectance signatures of the eight item classes. It is important to treat the LDAs from the VIS-NIR and the LDAs from the NIR-SWIR as two separate analyses. Thus, the weights in the VIS-NIR part were solely based on data acquired by the VIS-NIR camera, and not influenced by measurements in the NIR-SWIR, and vice versa. By using all wavelengths of two different classes in the normalised intensity dataset as inputs for the LDA, a vector with the relative importance of each wavelength expressed as weights is created. Wavelengths with the largest weights resulting from the LDA are generally considered as diagnostic features, provided the wavelengths align with spectral features characteristic to the item that is analysed. All the materials and MATLAB scripts of the analyses are available in the Supplementary Materials of this paper.
2.6. Satellite Multispectral Indices for Floating Debris
Using Sentinel-2 multispectral data, the Floating Debris Index (FDI) showed that the difference in spectral signatures of floating materials and water results in the ability to distinguish between the two on sub-pixel scales. When used in conjunction with the Normalised Vegetation Difference Index (NDVI), it becomes possible to also detect differences between plastics, vegetation, driftwood, and seafoam [17]. To show how these indices work on high-resolution images, they were applied to two hyperspectral images in our lab. The NDVI and FDI were calculated from the normalised intensity dataset. The following equations describe these indices:
where , , , and are pixel values of the normalised intensity dataset located very close to the central wavelengths of Sentinel-2 bands B4 (665 nm,), B6 (740 nm), B8 (842 nm, ), and B11 (1610 nm, ), respectively. An overview of Sentinel-2 multispectral instrument (MSI) bands and Worldview-3 multispectral-visible near infrared (MS-VNIR) and multispectral-shortwave infrared (MS-SWIR) bands falling within the spectral range of the hyperspectral dataset are summarised in Table 2 and Table 3, respectively.
3. Results and Discussion
In this section, three main findings are presented and discussed. First, we present an in-depth analysis of the spectral signatures to build an understanding of reflectance-based item identification. Second, the results of the linear discriminant analyses are discussed to demonstrate how certain wavelengths are more useful for discriminating between water, vegetation, and plastics. Third, we compare our results with current satellite-based indices used for plastic detection.
3.1. Spectral Analyses
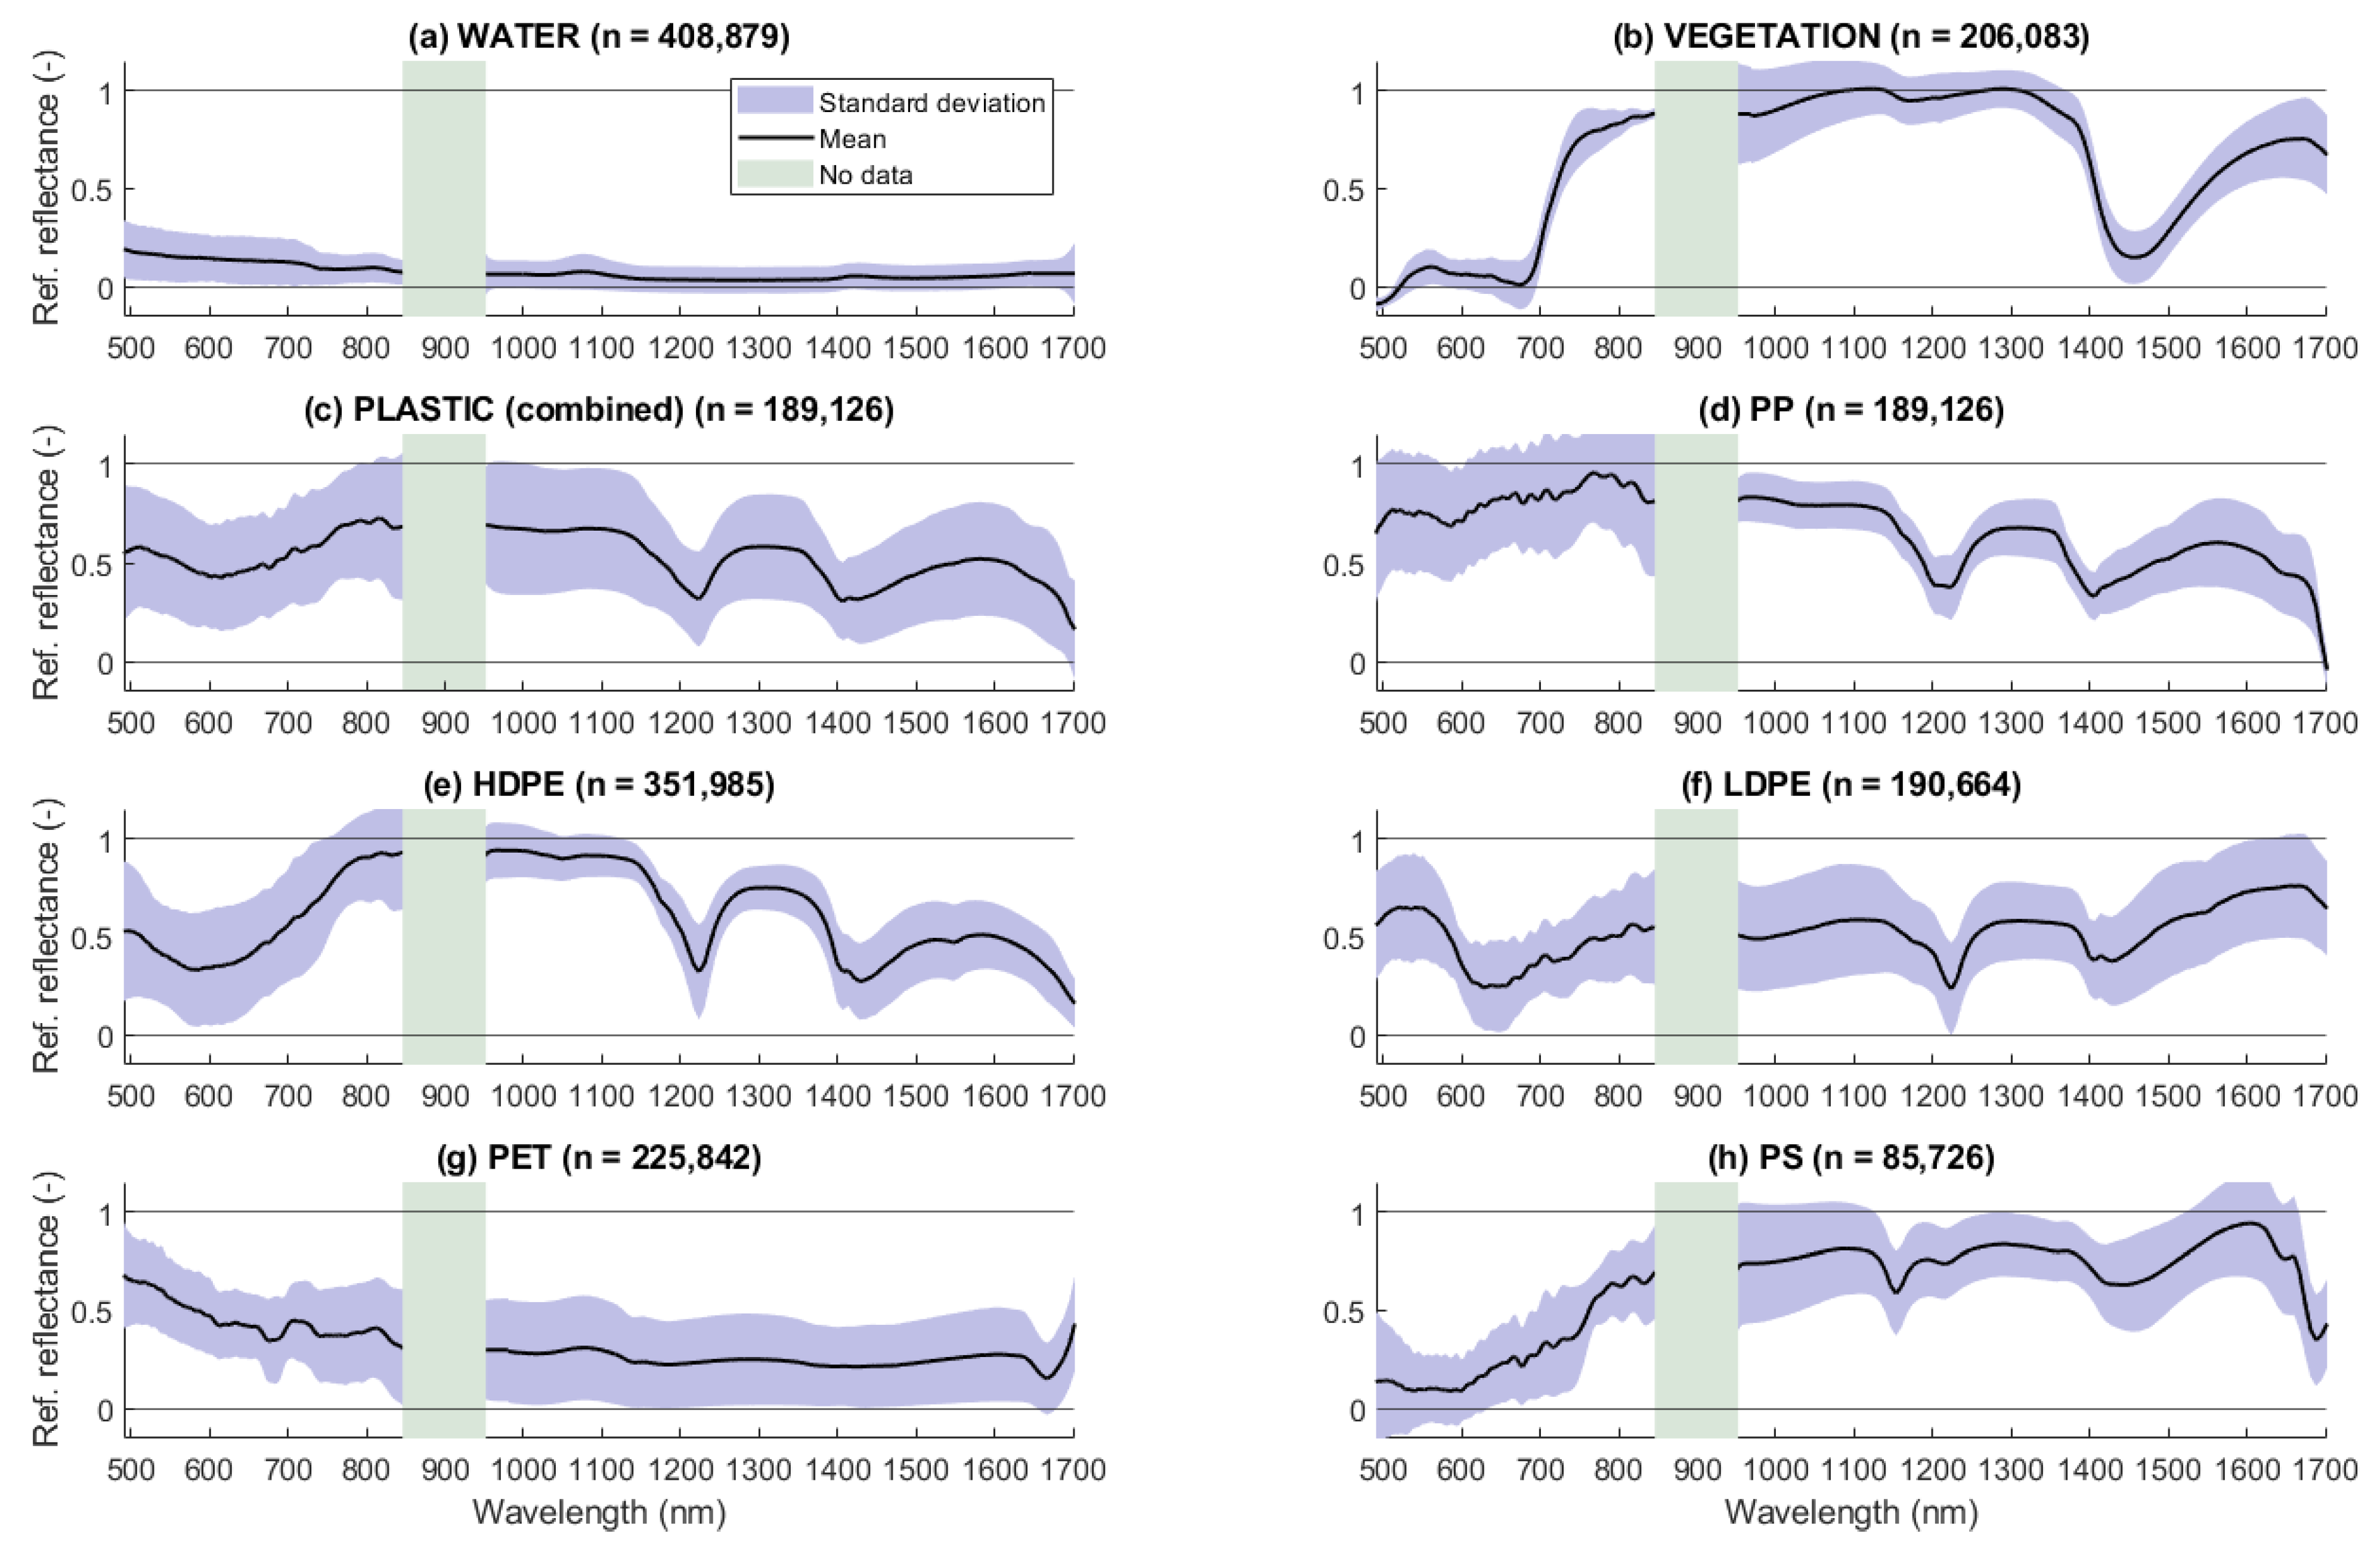
Water, vegetation, and the five types of plastic each showed unique spectral signatures. Unsurprisingly, the reflectance of water in the NIR-SWIR range (950–1700 nm) was consistently close to zero, whereas plastics and vegetation were characterised by higher reflectance values and unique absorption peaks in this range (Figure 4a–h). For instance, the average spectral signature for all plastics combined showed two distinct absorption peaks at 1215 nm and 1410 nm (Figure 4c). As opposed to plastics, vegetation was characterised by a stronger absorption peak at 1450 nm.
The standard deviation of all plastics combined was relatively high in comparison to the standard deviation of vegetation and water, which was likely caused by the large number of pixels (n = 1.27 million) and the differences in the reflection spectra of the individual polymer types (Figure 4). In contrast, water and vegetation had smaller standard deviations across the full spectral range. PP and HDPE showed smaller variability in the NIR-SWIR range than they did in the VIS-NIR range. The other classes of LDPE, PET, PS, and combined plastics (Figure 4c,f–h) showed high variability across the full spectral range. From Figure 4g,f, it is clear that PET and PS do not have strong absorption features at the typical plastic absorption peak around 1215 nm.
High-density and low-density polyethene (HDPE and LDPE) polymers had similar absorption features in the 950–1700 nm range of the spectrum, where reflectance is driven by material properties, rather than the apparent colour of objects [39]. The two absorption features of polyethene (PE) plastics were centred around 1210 and 1430 nm. Polypropylene (PP) plastics showed clear absorption features at 1205 and 1400 nm, which is in close correspondence with Moshtaghi, Knaeps, Sterckx, Garaba and Meire [24]. Polystyrene (PS) was characterised by two distinct absorption features at 1150 and 1450 nm. Moroni, et al. [40] found strong features at 1130 nm, 1170 nm, 1420 nm, and 1660 nm for aggregated opaque PET granules, whereas a nearly flat spectral signature was found for transparent samples. In fact, the spectral shape of the transparent PET samples found by Moroni, Mei, Leonardi, Lupo and Marca [40] is similar to the spectral shape found in this study (Figure 4g). From this, we hypothesised that the lack of characteristic PET absorption features in Figure 4g is due to the transparency of the PET samples, and that spectral signatures of non-transparent PET items might yield different results.
Overall, the absorption features of the polymer types shown in Figure 4 showed good agreement with absorption features of the same reflection signatures documented in other studies [25,26,39]. For plastics, a typical absorption peak was centred around 1215 nm, which has been commonly referred to in other studies [13,39]. On a molecular level, this typical absorption characteristic of the HDPE, LDPE, and PP peak is due to the second overtone of carbon–hydrogen (C-H) stretching [41]. When a plastic sample is illuminated by light, specific atomic groups, such as C-H and oxygen–hydrogen (O-H) groups, can absorb energy, resulting in a change of vibrational energy state. For vegetation, the spectral signature from our lab-based study corresponds well with results found in Meacham-Hensold, et al. [42]. The characteristic rise in spectral reflectance in the 700–720 nm range is caused by the internal cell structure of leaves, while the absorption feature around 1450 nm is caused by leaf water content [43].
At specific wavelengths in the spectrum, overtone bands were present, indicating when a molecule switches from its lowest energy state (ground state) to an excited state with a greater energy level. The first and second overtone occurred in the NIR-SWIR range of the spectrum and were characterised by the largest jumps in the energy level. This implies these overtones were characterised with stronger absorption features than the third, fourth, and fifth overtones, which were positioned in the VIS-NIR range of the spectrum. The second absorption peak at 1410 nm—noticeable for all plastic items except PET—at 1410 nm was also in line with results of other studies and appeared to be caused by the first overtone of O-H stretching vibration, characteristic for multiple plastic polymer configurations [13,25,44].
Just beyond the spectral range used in this study, an absorption peak at 1747 nm was previously found for multiple plastic types, which can be attributed to the first overtone of C-H stretching [44]. Additionally, multiple studies indicated small absorption features for plastics to be present in the missing range used in this study (850–950 nm), which are primarily attributable to the third overtone of C-H stretching [13,23,45]. Further research on the spectral ranges beyond 1700 nm, and between 850–950 nm, are needed to provide a complete overview of the distinct spectral signatures of various plastic items.
3.2. Linear Discriminant Analyses and Comparison with Satellite Remote Sensing Approaches
3.2.1. Separating Floating Debris from Water
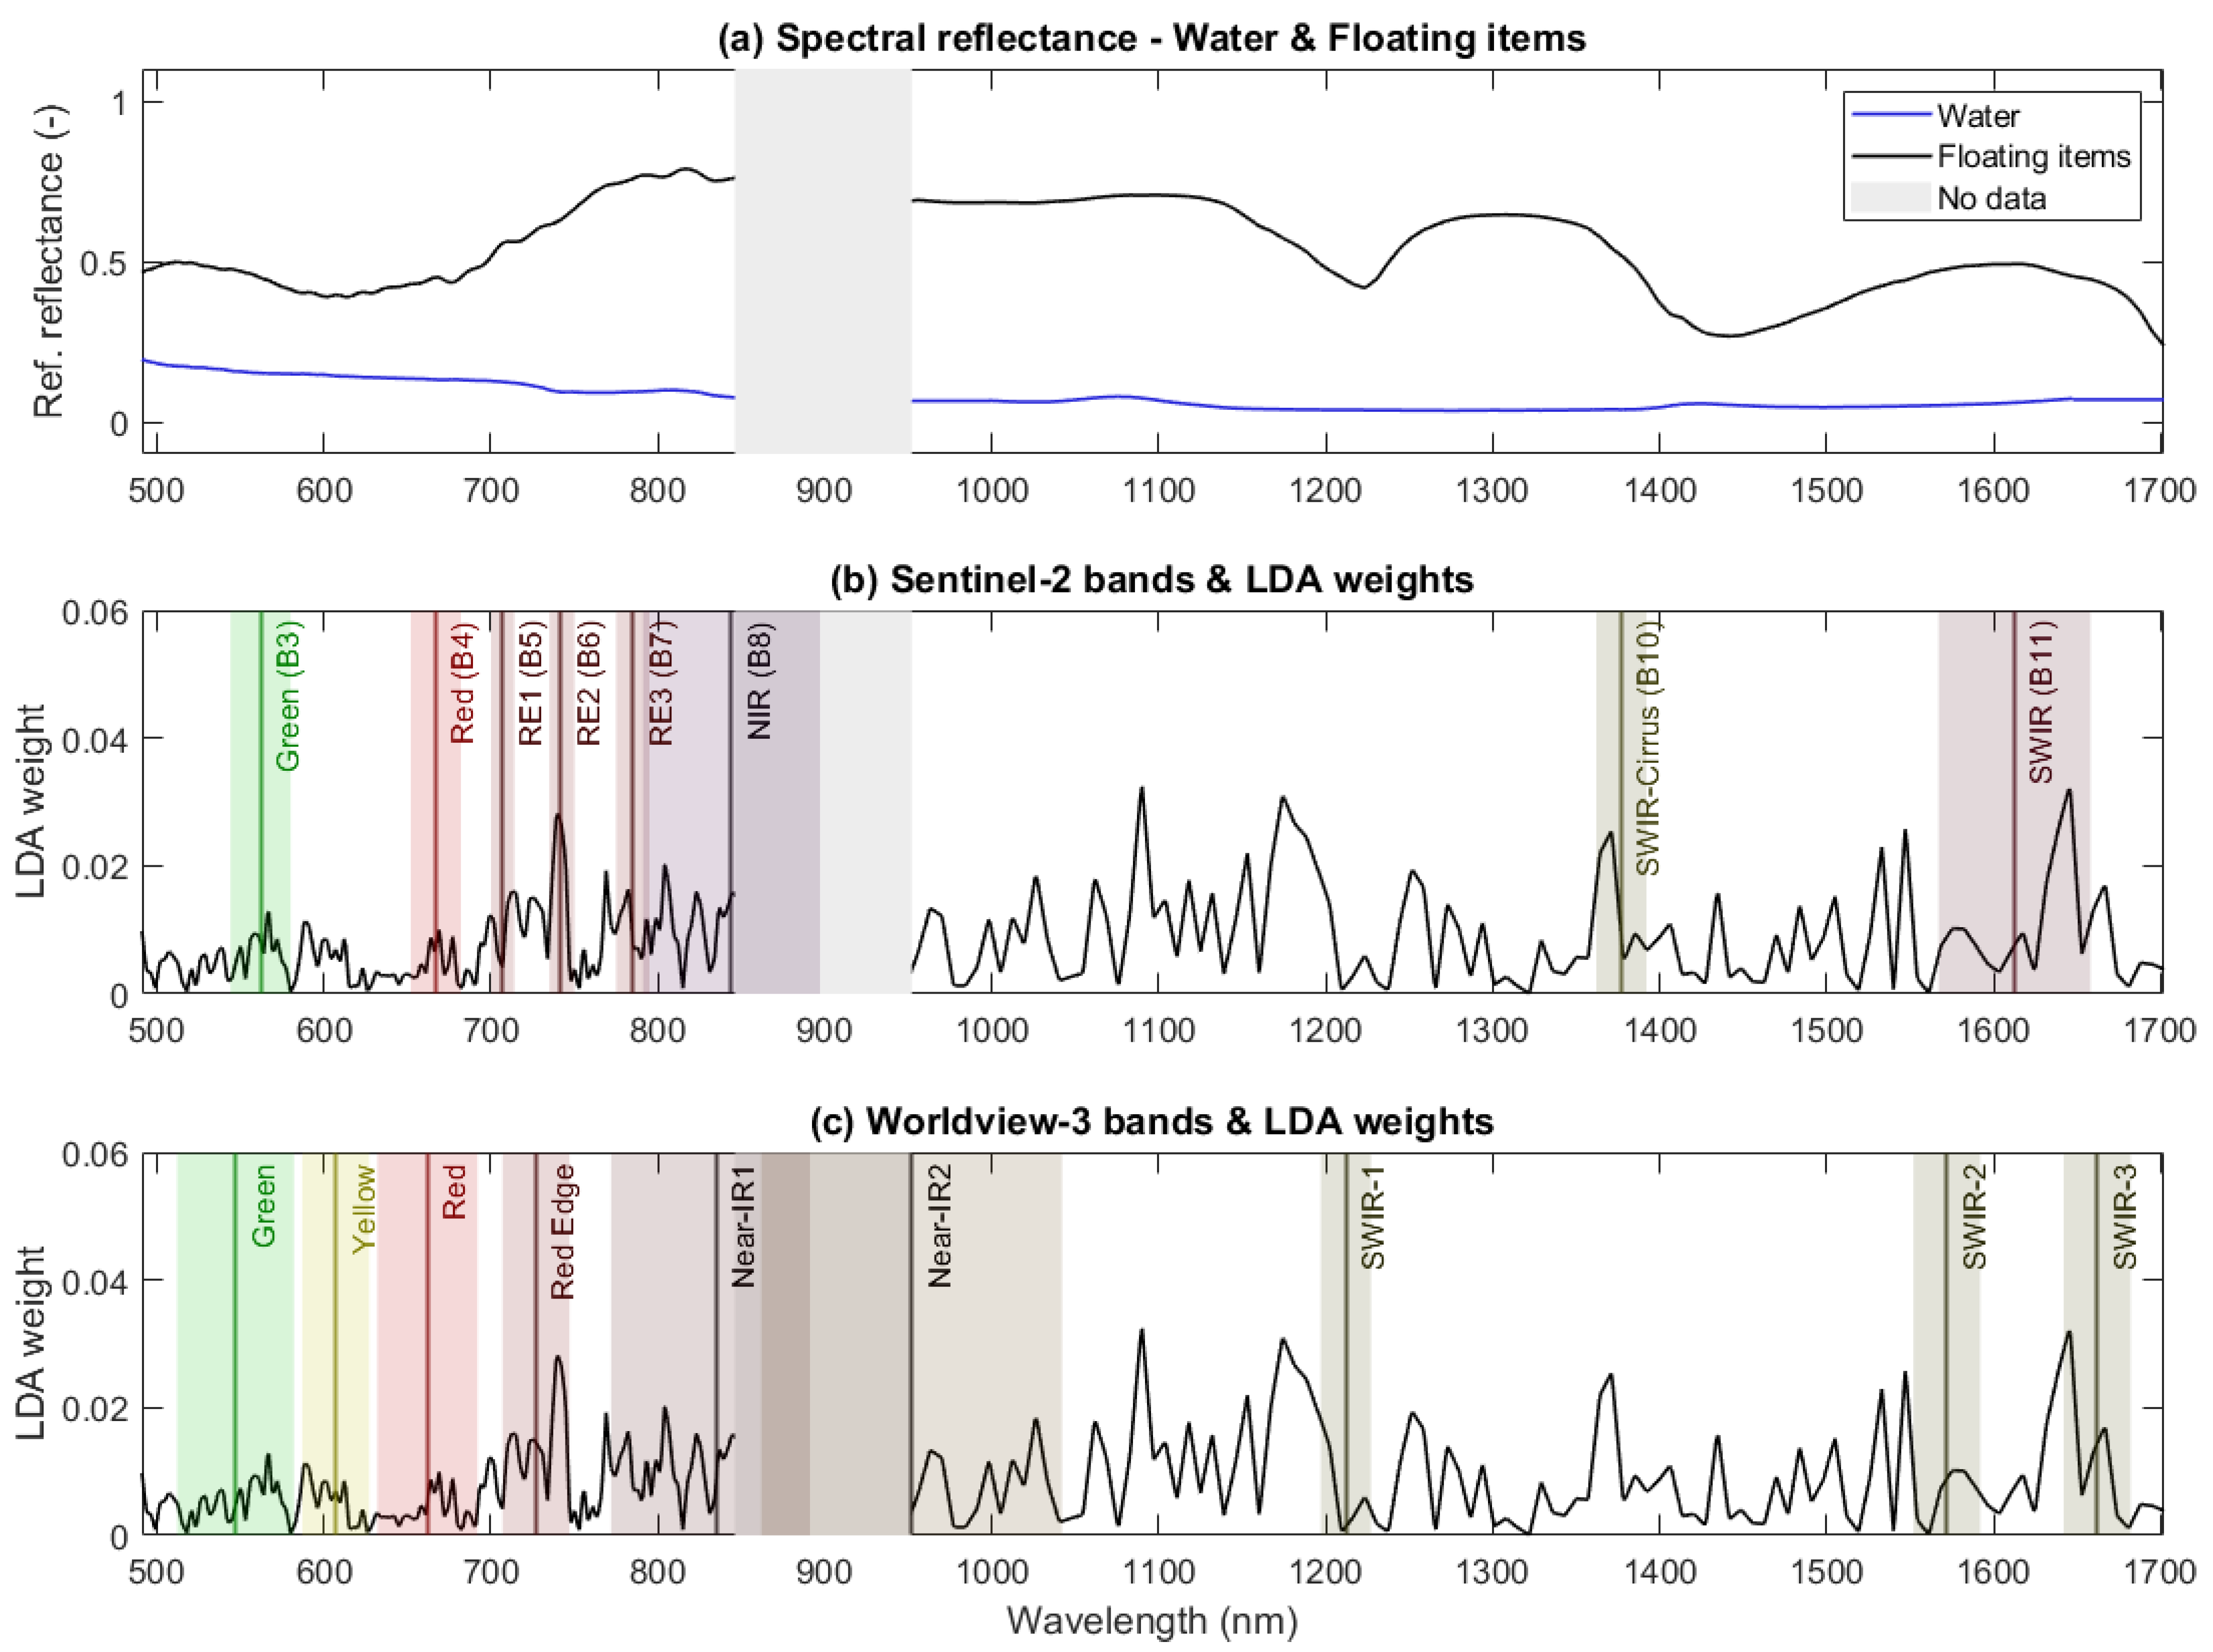
The distinctly different spectral signatures of water and floating items resulted in a range of low and high LDA weights overlapping with multiple satellite bands. Figure 5a shows the spectral signature of all floating items combined compared with the spectral signature of water. The absolute difference between floating item reflectance values and water reflectance values in the SWIR range is notable. Moreover, the reflection signature of water was close to zero and nearly flat over the entire range in the NIR-SWIR. Figure 5b,c show the weights of the LDA describing the power of each wavelength in discriminating between water and floating items. Each wavelength in the spectrum has a different importance for distinguishing between floating items and water (Figure 5). Additionally, the central wavelengths and their bandwidths of the Sentinel-2 satellite (Figure 5b) and the Worldview-3 satellite (Figure 5c) are shown. It is apparent that some of the central wavelengths were overlapping with relatively high LDA weights, whereas other bands seemed to be less important for separating classes.
As is shown in Figure 5b, Sentinel-2 bands B6 (red edge), B10, and B11 (SWIR) were the most powerful for discriminating between water and floating debris, though B10 is a lower spatial resolution band predominantly used for cirrus detection [46]. The data gap in the NIR prevented us from fully observing to what extent Sentinel-2 B8 and B8A are important; however, Biermann, Clewley, Martinez-Vicente and Topouzelis [17] suggested that B8 is key for the detection of floating debris. For Worldview-3, the Red Edge and SWIR-3 overlapped with the highest weights (Figure 5c). There were no clear features in the spectra explaining why these bands had high LDA weights. In their study, Guo and Li [47] suggested SWIR-2, SWIR-3, and SWIR-4 are important for detecting plastic surfaces in urban areas. Since water is much more uniform than diverse urban areas, it is feasible that these bands would also work for the detection of floating plastics.
3.2.2. Separating Plastic from Vegetation
The unique spectral signatures of plastic and vegetation allowed for the identification of several important wavelengths, overlapping with multiple Sentinel-2 and Worldview-3 bands. In Figure 6a, the reflectance spectra of vegetation and plastics are shown. Figure 6b,c shows the LDA results compared with Sentinel-2 bands and Worldview-3 bands, respectively.
In the VIS-NIR part of the spectrum, two wavelengths centred around 615 nm and 710 nm had the highest weights. The high LDA weight at 615 nm lines up with the lowest reflection value of plastic items in the VIS-SWIR range. The importance of the reflection at 615 nm is strongly influenced by the apparent colour of floating objects [39], which makes the importance of this wavelength debatable. A different collection of sample items, in combination with a relatively large standard deviation, could easily result in a different set of wavelengths having high LDA weights. The high weight at 710 nm occurs in the red edge (red-NIR transition of vegetation reflectance). The red edge bandwidth delineates between chlorophyll absorption in the red wavelengths of light, and reflection in the NIR due to the cellular structure of vegetation. Thus, the high weight at this wavelength appears to be driven by vegetation-specific reflectance.
In the NIR-SWIR range of the spectrum, important wavelengths were centred around 1215 nm, 1410 nm, and 1450 nm, which can be attributed to the absorption peaks of both plastic and vegetation. The absorption peak of PS around 1140 nm is barely reflected at all in the relative importance of this wavelength according to the LDA weights. Whilst the reflectance of other plastics was lowest at 1215 nm, the reflectance of PS was already past its absorption peak. This made it so the importance of the rise in PS reflectance between 1140 and 1200 nm was cancelled out by the steadily declining reflectance of the other plastics in this range. The other important wavelengths in the NIR-SWIR range were centred around 1410 nm and 1450 nm, which can be attributed to the absorption peaks of plastic and vegetation, respectively.
For the Sentinel-2 MSI, bands B4 (665 nm), B5 (705 nm), and B6 (740 nm) had high LDA weights, implying these bands are promising for separating vegetation and plastics. The reflection spectrum of plastics in the VIS-NIR (Figure 6c) did not show unique features, but the vegetation spectrum was characterised by the formerly explained chlorophyll absorption and cellular structure in this range. The high LDA weight at 1215 nm caused by the absorption peak of plastics was not captured by any existing Sentinel-2 band. Therefore, new sensors with a band at a central wavelength of 1215 nm would be key for future ESA missions focussed on plastic-specific detection.
For Worldview-3, however, the high LDA weight of the absorption feature at 1215 nm lined up with the bandwidth of SWIR-1. Additionally, the ‘Yellow’, ‘Red’, and ‘Red Edge’ bands of Worldview-3 were also characterised by high weights when distinguishing between plastics and vegetation. Combined with the higher spectral resolution offered by the Worldview satellites (1.24 m for MS-NIR and 3.7 m for MS-SWIR), these low-orbit satellite sensors may prove well suited for detecting plastic, specifically.
3.2.3. Comparison of Satellite-Derived Products with LDA Results
As illustrated in Figure 5 and Figure 6, all the bands used in the NDVI and FDI, referring to Equations (3) and (4), are associated with a range of different LDA weights. It is apparent that Sentinel-2’s B4, B6, B8, and B11 have different weights when separating water and floating items, compared to the weights when separating vegetation and plastics. For example, B4 stood out for vegetation and plastics separation, whereas this band had a much lower weight when separating water and floating debris. This is one of the reasons why the NDVI is suitable for highlighting vegetation. B5 (705 nm) and B6 (740 nm) had high LDA weights when separating plastics and vegetation (Figure 6b). Since these bands were not used in the NDVI, and B8 (842 nm) was important for highlighting all floating items, we suggest that the NDVI is to some extent capable of highlighting certain types of plastic in addition to vegetation, as is seen in Figure 7e.
For the FDI, designed for detecting floating debris, B6 (740 nm) and B8 (842 nm) bands were associated with the high LDA weights of 0.28 and 0.16, respectively (Figure 5b). These bands appear to be the main reason why the FDI performs well, as the difference in reflectance between any floating object and water is large at these wavelengths. Even though the central wavelength and LDA weight of B8 fell within the spectral range of this study, the full bandwidth of B8 was not captured because of the lack of data between 850 and 950 nm. Therefore, the LDA result of B8 could be incomplete when considering its full bandwidth range. The B4 (665 nm) and B11 (1610 nm) bands had significantly lower LDA weights than the other bands. However, it is likely that B11 contributed to the effectiveness of the FDI, as it is a wavelength in which water absorbs over 90% of all light (Figure 4a).
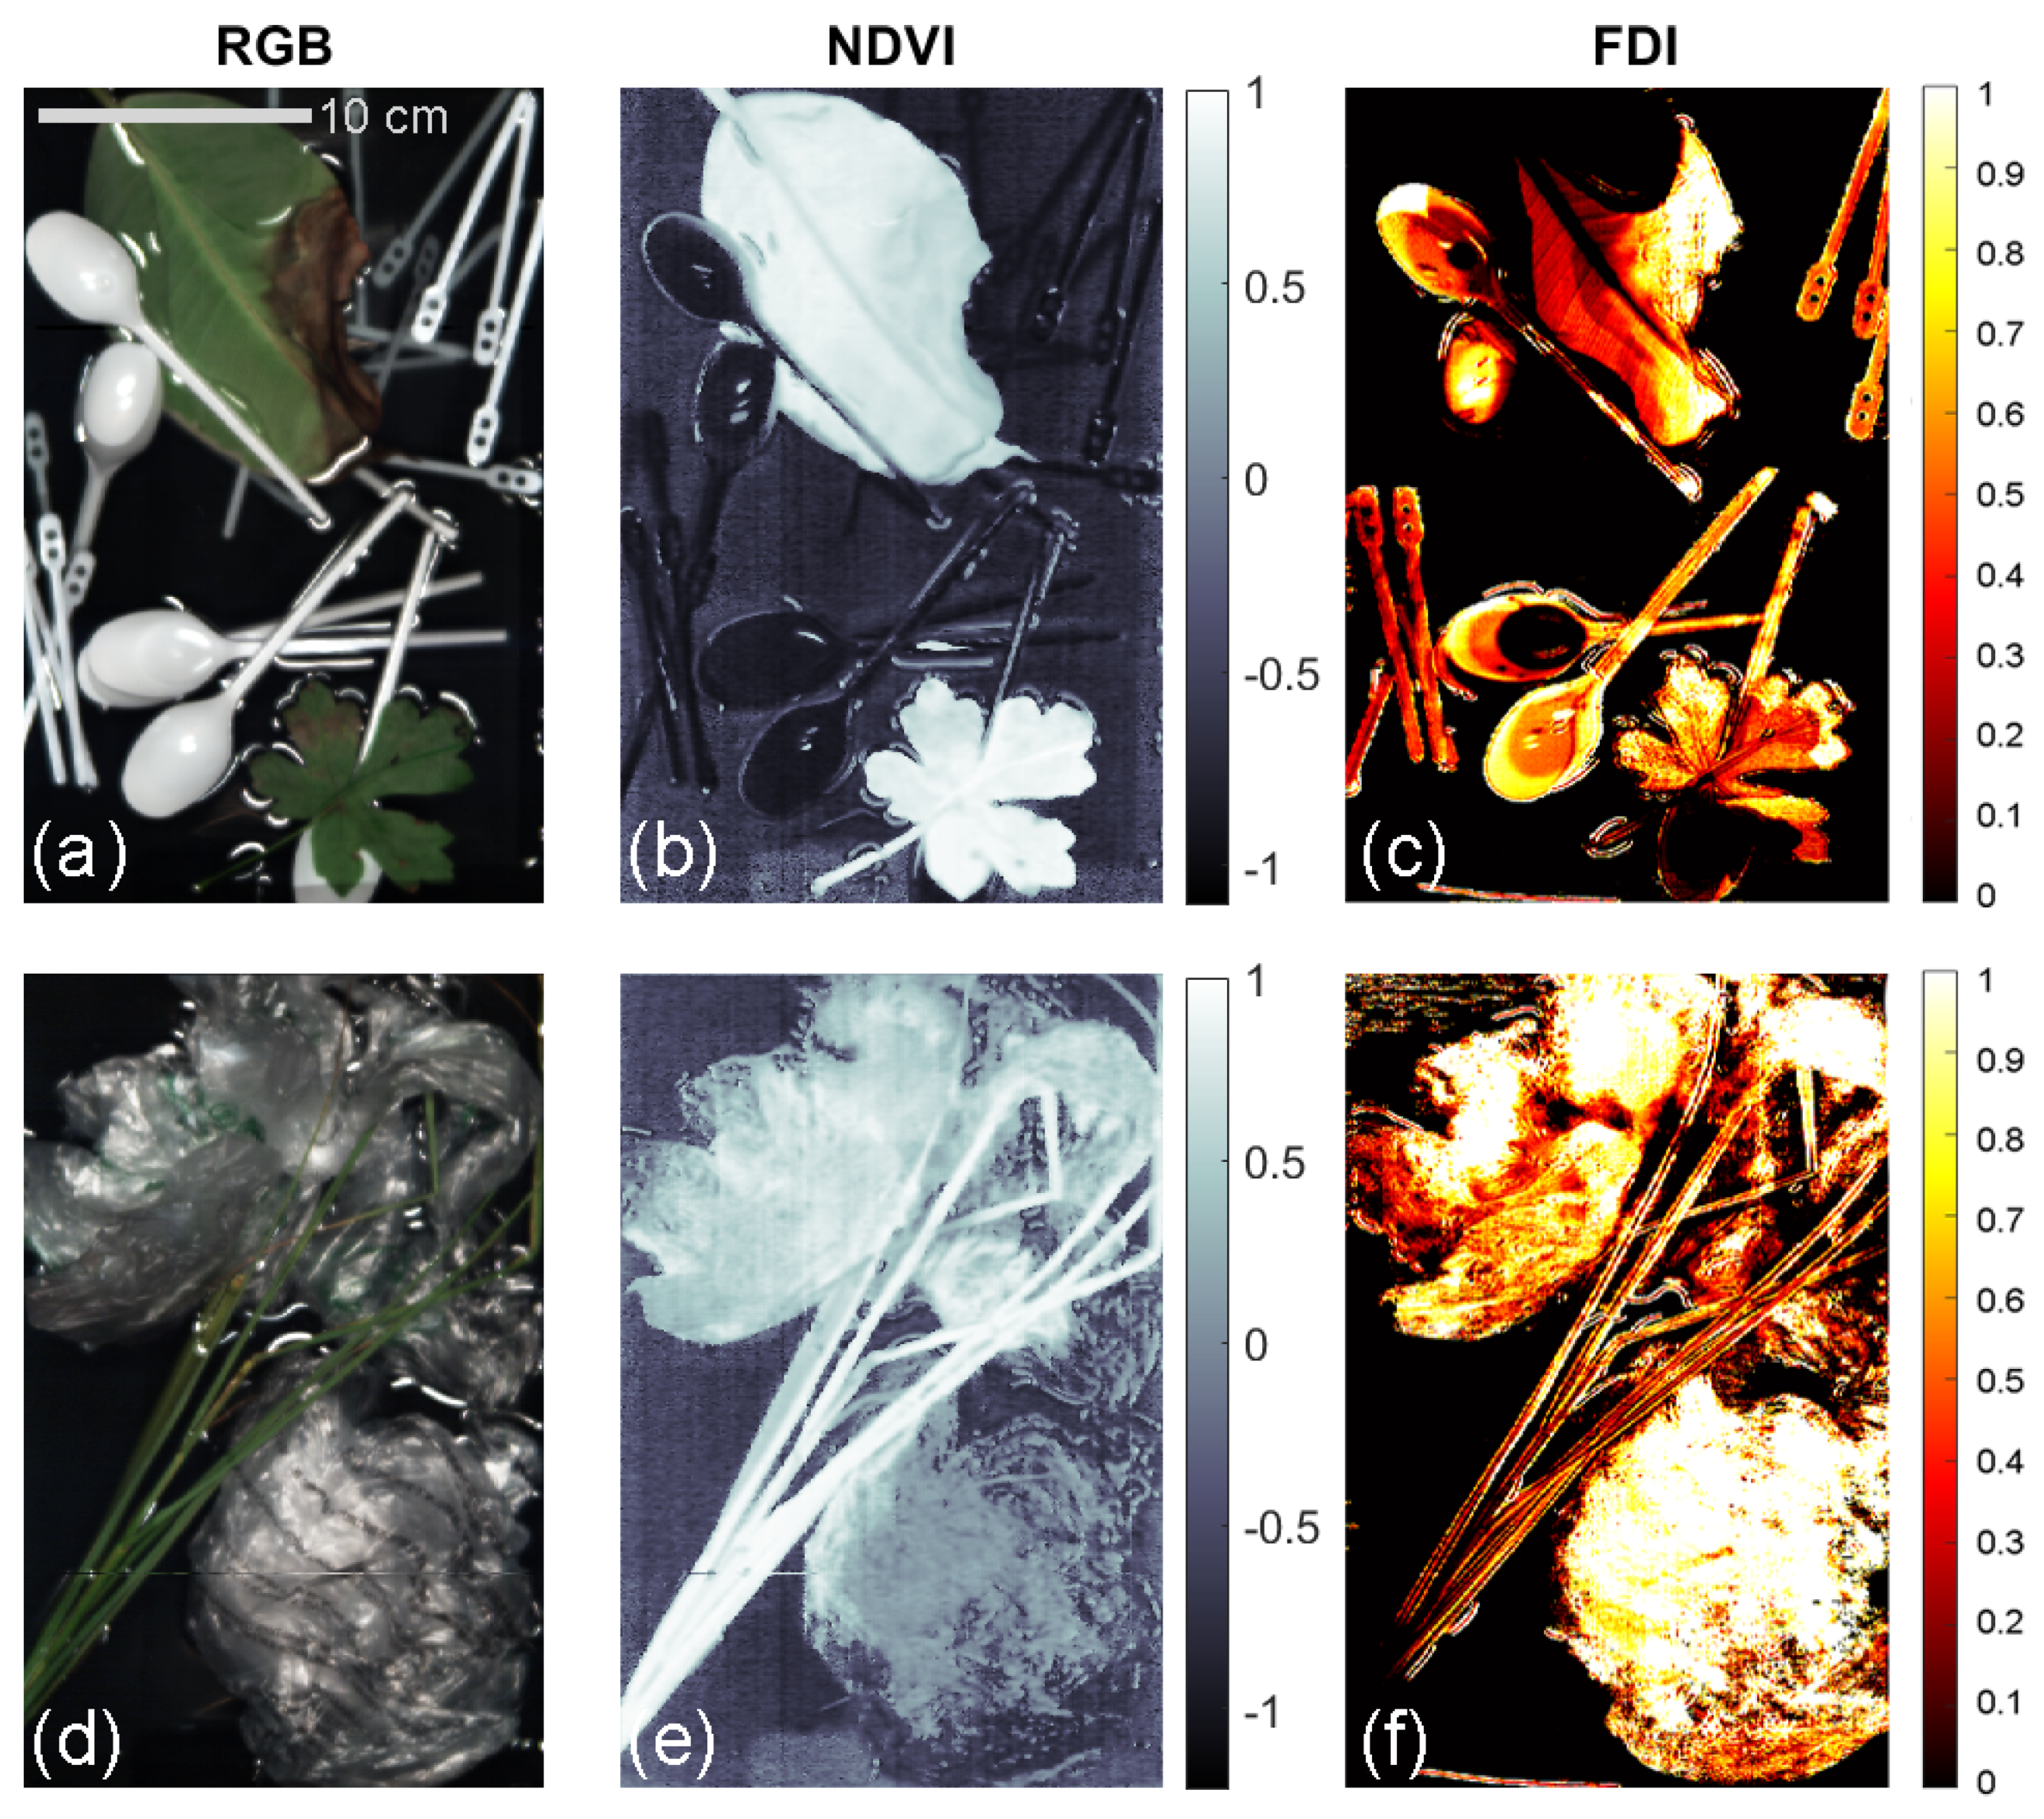
From Figure 7b,e, it is clear that healthy vegetation results in high NDVI values. However, the intensity values are not always high for plastics. Parts of the LDPE bag in Figure 7e were characterised by high-intensity values, but the pixels in the lower right part of the image had much lower values. Moreover, the PP spoons and PS coffee stirrers in Figure 7b were associated with strong negative NDVI values. The FDI, on the other hand, can highlight all three plastic types and vegetation, as seen in Figure 7c,f. A drawback of this index is its response to a thin layer of water covering the floating item. In fact, when a sample is only slightly submerged by water, the FDI approaches zero, as is evident in Figure 7c. This is likely caused by enhanced water absorption in the NIR-SWIR, which results in the apparent disappearance of spectral features when items are submerged [13]. Figure 7 provides just two examples, and we highly encourage future studies to explore all hyperspectral data provided in the Supplementary Materials, using either existing or new indices.
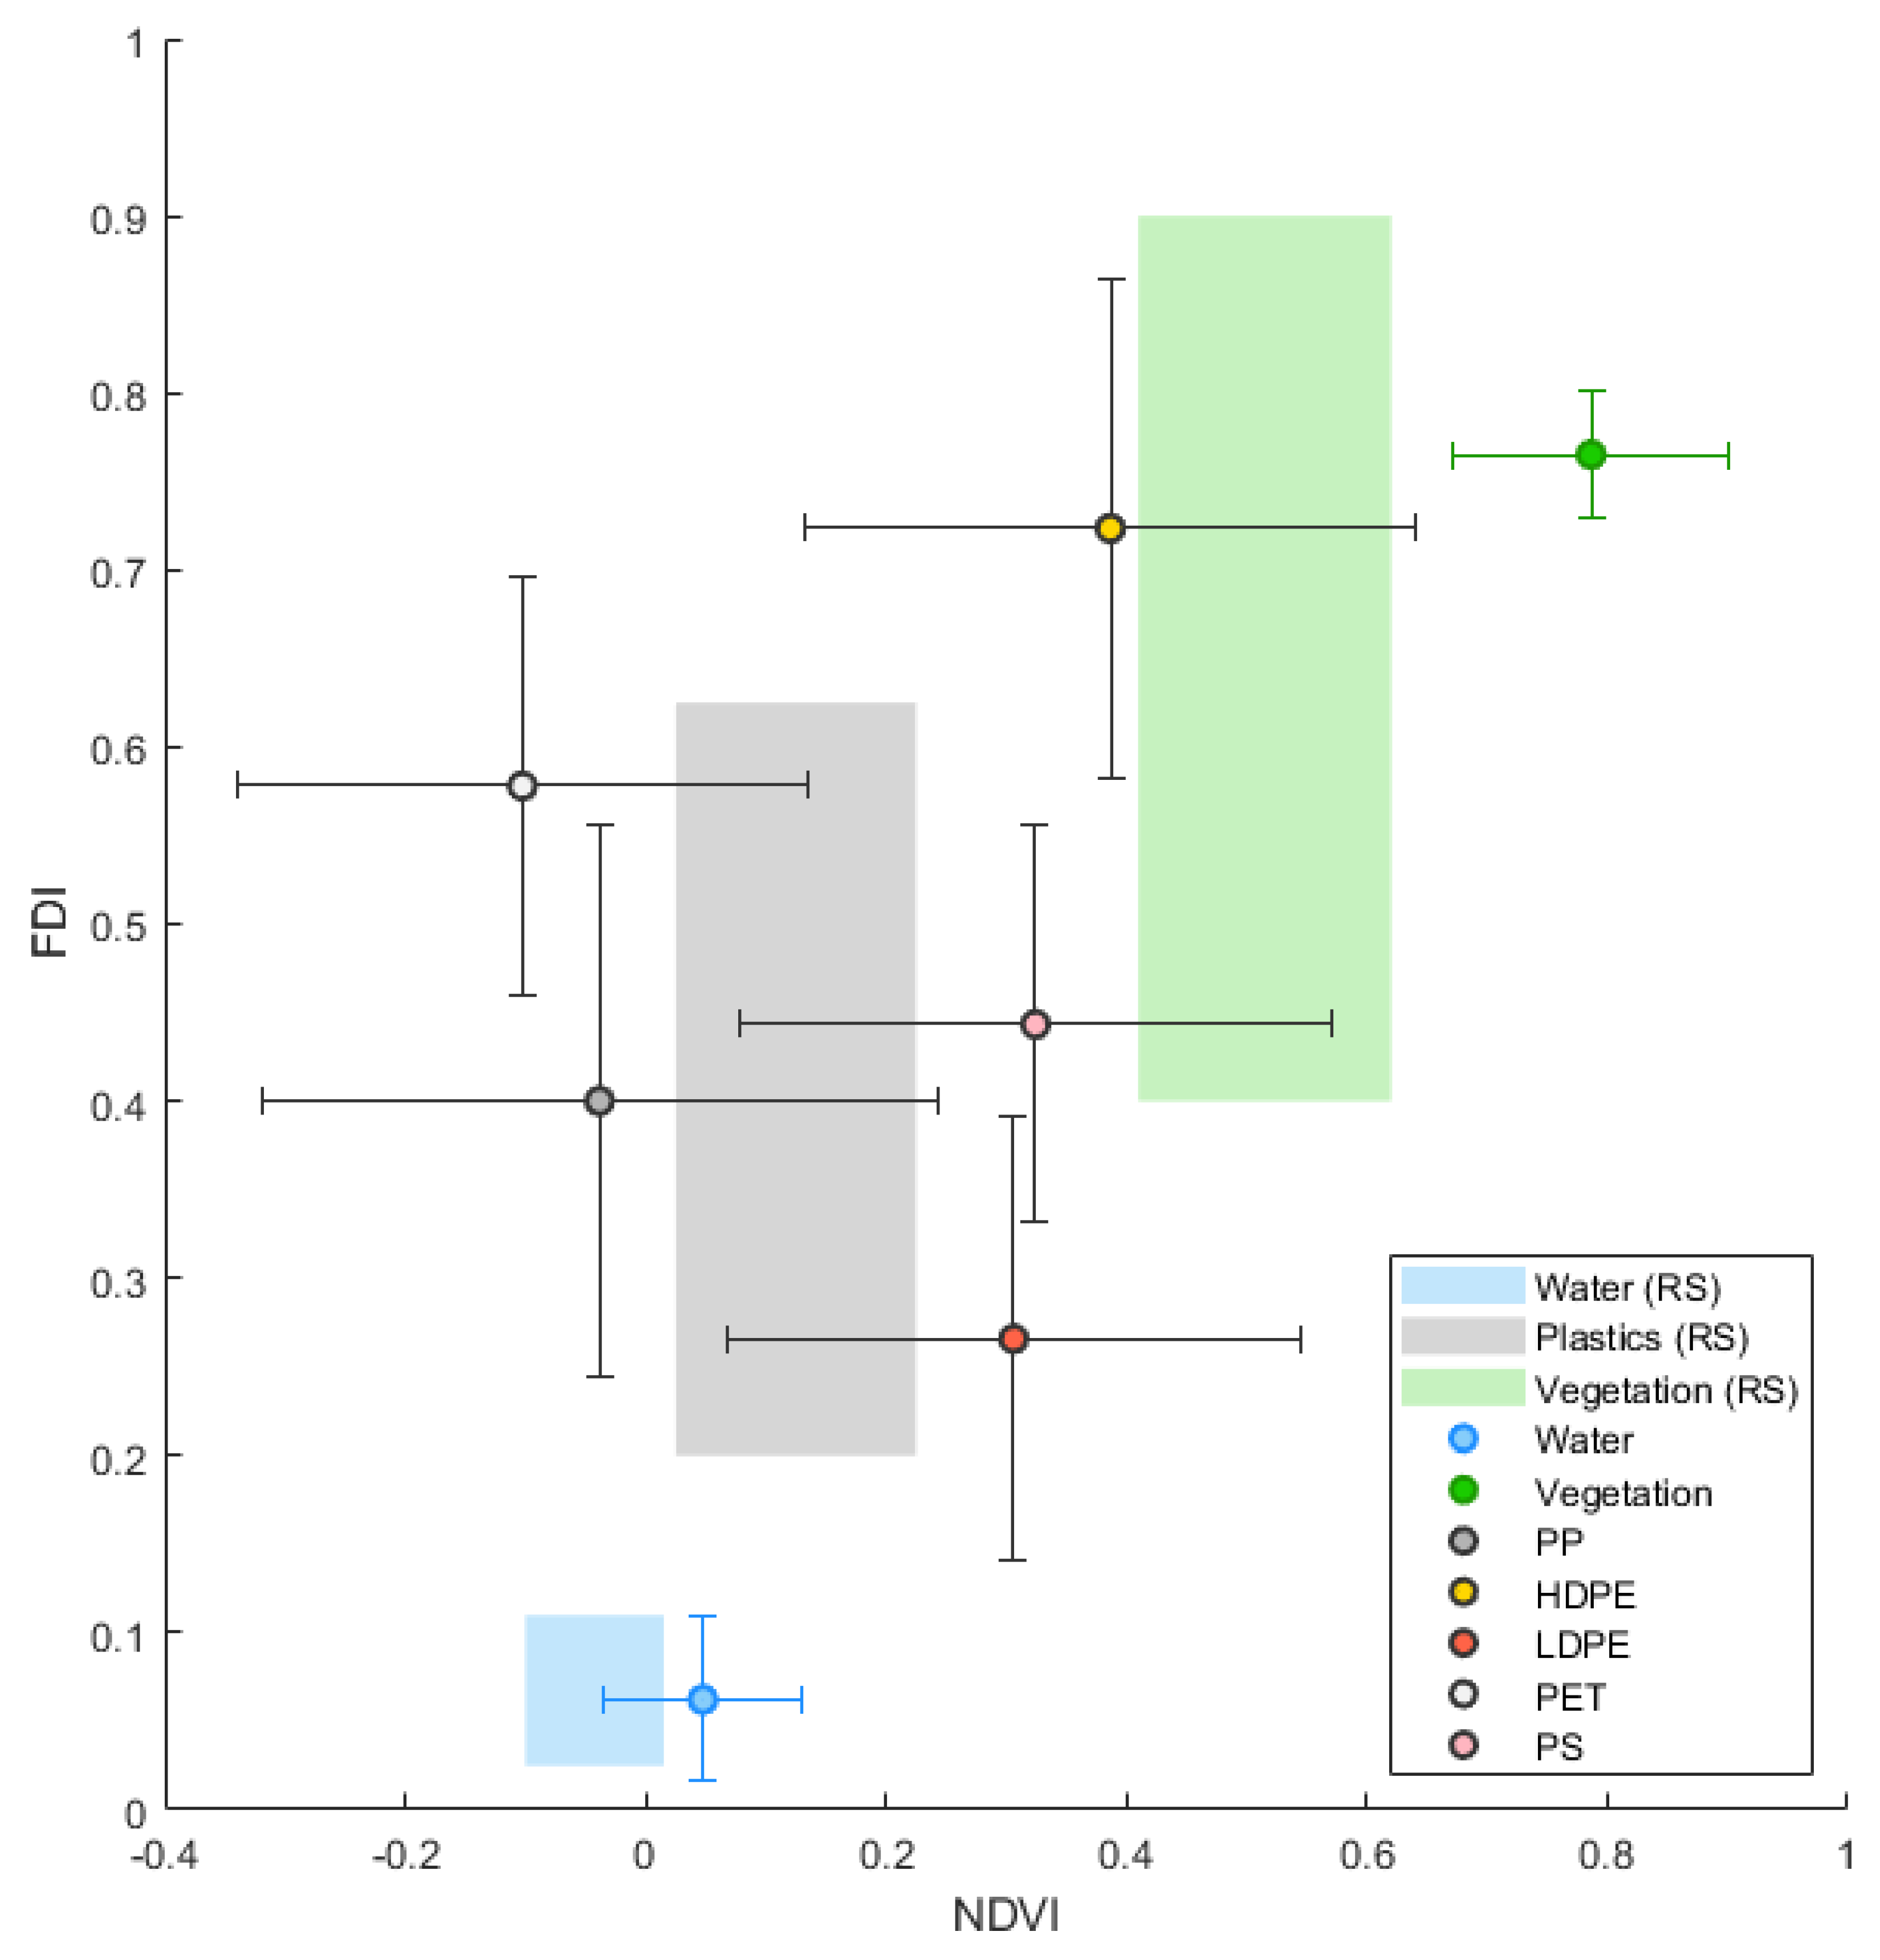
A combination of the NDVI and FDI is perhaps the most robust approach compared with similar approaches for separating plastics and vegetation. Figure 8 shows a scatterplot of the NDVI versus the FDI for water, vegetation, and the five polymer categories. It also shows the range of water, plastic, and vegetation values as found by Biermann, Clewley, Martinez-Vicente and Topouzelis [17]. Water had a low mean value for both indices, whereas healthy vegetation had the highest mean value. The vegetation had a significantly higher mean value in the NDVI compared to Biermann, Clewley, Martinez-Vicente and Topouzelis [17], which was likely caused by the selection of the greenest (healthy) pixels, as opposed to floating seaweed. The different plastic types had overlapping standard deviations but were relatively different from water and vegetation. Floating aquatic vegetation and riverine vegetation typically have lower NDVI values, ranging from 0.4 to 0.7, which results in an overlap with NDVI values of several polymer types [48]. This, in turn, hampers discrimination between the specific polymers and vegetation based on NDVI alone. Using a combination of the NDVI and FDI for Sentinel-2-based detection of debris is a powerful approach for detecting patches of mixed debris with plastics, floating on and just below the surface. The FDI cannot be exactly replicated with the bands offered by the Worldview satellites, but indices that leveraged the red edge and SWIR-3 bands for debris detection, and the yellow and SWIR-1 bands for plastic discrimination, would likely produce promising results.
4. Synthesis and Outlook
Hyperspectral imaging systems have a great potential for reflection-based macroplastic detection and identification. Using these systems in airborne or spaceborne remote sensing tools can help to identify plastic waste in heavily polluted rivers, on beaches, and in remote marine environments. So far, several studies have explored spectral signatures of floating macroplastics, either with spectroradiometers or in combination with high-resolution imagery. Recent efforts mainly include measurements in controlled environments [23,24,25,26], focussing on the full-spectrum characterisation of reflectance signatures. Garaba and Dierssen [13] established an open-access database of spectral signatures of marine-harvested and washed-ashore plastics, identifying absorption features of various plastic samples. Goddijn-Murphy and Dufaur [20] used hyperspectral data in an optical reflectance model as a step towards automatic detection of floating marine plastic litter. Corbari, Maltese, Capodici, Mangano, Sarà and Ciraolo [25] spectrally characterised various polymer types and attempted to quantify optimal band combinations for multispectral monitoring of plastics. Next to these studies, the dataset presented in our study provides some of the first fundamental baselines in the rapidly developing field of hyperspectral imaging.
Similar to other studies, we spectrally characterised various floating macroplastic samples in a controlled environment. We identified absorption features of five plastic polymer types at 1150, 1210, 1215, 1400, 1430, and 1460 nm, which are in line with absorption features documented in similar studies [13,25,26,39]. These wavelengths should be considered in the development of future sensors for plastic detection. A unique addition of our study is the use of in-depth linear discriminant analyses to identify which wavelengths are optimal for separating water and floating objects, and vegetation and plastics.
In addition to Corbari, Maltese, Capodici, Mangano, Sarà and Ciraolo [25], we used high-resolution imagery to validate current multispectral remote sensing techniques, next to identifying which bands are optimal for multispectral plastic monitoring. In doing so, we further support the potential of combining the NDVI and FDI for plastic detection using Sentinel-2 data, as initially explored by Biermann, Clewley, Martinez-Vicente and Topouzelis [17]. Furthermore, our results indicated that the Sentinel B5–B8 and B10 bands play a key role in separating water and floating debris, and plastics and vegetation. For Worldview-3, the ‘Yellow’, ‘Red’, ‘Red Edge’, ‘SWIR-1’, and ‘SWIR-3’ bands showed high importance for separation between the classes, which is in line with the suggestion that ‘SWIR-3’ is essential for plastic detection by Guo and Li [47].
Only a few studies have conducted hyperspectral measurements of plastics on natural surfaces, either UAV-based in coastal and marine environments [49] or in a controlled environment with natural sunlight [13]. However, most studies performed outside are limited to multispectral imaging systems, having between 6 and 12 bands, as opposed to over a hundred in hyperspectral studies. Most of these studies use airborne or spaceborne multispectral data [15,16,17,21], often successfully detecting and identifying plastic targets with satellite-derived feature extraction indices. In our work, we highlighted which bands should be included in the limited 6 to 12 bands of multispectral sensors for better detection and identification of floating plastics.
We present a novel hyperspectral reflectance database of common plastic litter items used to validate current satellite techniques for plastic detection and identification. This open-access database is unique compared to other reference libraries, as it provides high-resolution imagery in over 300 spectral bands. The database can be explored to get a detailed understanding of satellite remote sensing and their derived products, but also where future improvements could be made.
The main limitation of this study is a lack of continuous data in the near infrared between 850 and 950 nm. We were therefore not able to fully explore the spectral signatures of plastics and the role of several Sentinel-2 bands (B8, B8A) and Worldview-3 bands (NIR 1, NIR 2) in the detection of floating debris. Additionally, the extent to which the spectral signatures of degraded or bio-fouled plastics differs from virgin macroplastics remains unexplored in this study, since we merely analysed virgin macroplastic samples. Another limitation concerns the nature of indoor experiments with controlled light conditions. In natural aquatic environments, the detection and identification of macroplastics are influenced by highly variable illumination, clouds, and complex atmospheric effects, requiring atmospheric correction. We highly encourage future studies using hyperspectral imagery to work towards characterising spectral signatures of plastics beyond the spectral range and limitations of this study, to establish their importance for new multispectral sensor setups. As a baseline for future studies, all data and code used for our analyses are available online, as specified in the Supplementary Materials.
Our hyperspectral reference dataset enables multiple future research directions. First, pixels from the dataset could be aggregated to lower resolutions, representing the mixed nature of sampled pixels by satellite sensors. Floating plastic patches smaller than the pixel size of current satellite-acquired imagery can indeed be detected [16]. The latter can be realised by spectral unmixing techniques and algorithms [50,51]. A hyperspectral understanding of these mixed pixels could lead to new insights into highly sensitive wavelengths for the detection of floating plastic debris. The latter may include the development of new airborne or spaceborne multispectral sensors based on the most discriminating bands separating water and floating items, and plastics and vegetation (Figure 5 and Figure 6).
Second, hyperspectral classifiers could be built, enabling accurate detection of floating plastics and subsequent polymer-specific classification. For example, Balsi, Moroni, Chiarabini and Tanda [49] built a classifier algorithm and successfully identified and separated PE and PET plastics. Another application of hyperspectral classifiers is in plastic recycling plants, where mixed plastic waste is sorted using classifier algorithms [52,53]. Since the five plastic polymer types in our study are characterised by slightly different spectral signatures, a large patch of one specific type of plastic could require a different combination of wavelengths for accurate detection than others. By leveraging the current understanding of hyperspectral-based classifiers, existing remote sensing techniques using multispectral-based extraction indices can be optimised. This enables further contribution to the development of advanced floating debris monitoring and classification missions.
5. Conclusions
We present a new hyperspectral database for virgin plastics and vegetation that can be further explored to improve the fundamental understanding of reflectance-based plastic identification. Hyperspectral imaging was done by using a double camera setup spanning from the visible to shortwave infrared range of the spectrum (400–1700 nm). Future work exploring applications of reflectance-based plastic identification can use our hyperspectral dataset as a baseline.
Second, we identified absorption peaks in the reflectance spectrum of plastics at unique positions in the electromagnetic spectrum (1215 nm and 1410 nm). The hyperspectral image database allowed for an in-depth exploration of spectral reflectance signatures of water, vegetation, and five different types of plastic. We found similarities in a comparison with existing literature and provided chemical arguments to build an understanding of the occurrence of these absorption peaks.
Third, we disclosed the importance of each wavelength in the 400–1700 nm range by separating water from mixed floating debris and vegetation from plastic. We conducted linear discriminant analyses of the spectral signatures of plastic, water, and vegetation, and compared the weights of each wavelength with existing bands covered by the Sentinel-2 and Worldview-3 satellites. In doing so, a wider understanding of satellite-derived products such as the NDVI and FDI is created. We found high LDA weights to correspond with the wavelengths of the Sentinel-2 B4, B6, and B8 bands, indicating which components of the NDVI and FDI work best. Using a combination of the NDVI and FDI for Sentinel-2 data or possible indices based on Worldview-3 data is a robust approach for detecting patches of mixed floating debris with plastics.
We leveraged the unique properties of reflectance signatures of plastics, vegetation, and water in linear discriminant analyses. In combination with highlighting the strengths and weaknesses and potential improvements of indices based on satellite imagery, a foundation for the development of future multispectral or hyperspectral plastic monitoring missions is presented in this study.
Supplementary Materials
The hyperspectral plastics database is available online at: 10.4121/14518278 (accessed on 4TU.ResearchData).
Author Contributions
Conceptualization, P.T. and T.v.E.; Data curation, P.T.; Formal analysis, P.T.; Methodology, P.T., T.v.E., and J.P.; Software, J.P.; Supervision, T.v.E. and J.P.; Visualization, P.T., L.S., and L.B.; Writing—original draft, P.T.; Writing—review and editing, all authors. All authors have read and agreed to the published version of the manuscript.
Funding
The work of T.v.E. was supported by the 4TU.Federation Plantenna project, and the Veni research program The River Plastic Monitoring Project with project number 18211, which is (partly) funded by the Dutch Research Council (NWO). The work of L.S. was supported by NWO Open Mind grant 18127. This study is part of the Plastic Plants project, supported by the Discovery Element of the European Space Agency’s Basic Activities (ESA contract no. 4000132682/20/NL/GLC).
Conflicts of Interest
The authors declare no conflict of interest.
References
- Gallo, F.; Fossi, C.; Weber, R.; Santillo, D.; Sousa, J.; Ingram, I.; Nadal, A.; Romano, D. Marine litter plastics and microplastics and their toxic chemicals components: The need for urgent preventive measures. Environ. Sci. Eur. 2018, 30, 13. [Google Scholar] [CrossRef]
- Borrelle, S.B.; Ringma, J.; Law, K.L.; Monnahan, C.C.; Lebreton, L.; McGivern, A.; Murphy, E.; Jambeck, J.; Leonard, G.H.; Hilleary, M.A. Predicted growth in plastic waste exceeds efforts to mitigate plastic pollution. Science 2020, 369, 1515–1518. [Google Scholar] [CrossRef] [PubMed]
- Meijer, L.J.; van Emmerik, T.; van der Ent, R.; Schmidt, C.; Lebreton, L. More than 1000 rivers account for 80% of global riverine plastic emissions into the ocean. Sci. Adv. 2021, 7, eaaz5803. [Google Scholar] [CrossRef]
- Kiessling, T.; Knickmeier, K.; Kruse, K.; Brennecke, D.; Nauendorf, A.; Thiel, M. Plastic Pirates sample litter at rivers in Germany—Riverside litter and litter sources estimated by schoolchildren. Environ. Pollut. 2019, 245, 545–557. [Google Scholar] [CrossRef]
- van Emmerik, T.; Seibert, J.; Strobl, B.; Etter, S.; Den Oudendammer, T.; Rutten, M.; bin Ab Razak, M.S.; van Meerveld, I. Crowd-based observations of riverine macroplastic pollution. Front. Earth Sci. 2020, 8, 298. [Google Scholar] [CrossRef]
- Gasperi, J.; Dris, R.; Bonin, T.; Rocher, V.; Tassin, B. Assessment of floating plastic debris in surface water along the Seine River. Environ. Pollut. 2014, 195, 163–166. [Google Scholar] [CrossRef] [PubMed] [Green Version]
- Lahens, L.; Strady, E.; Kieu-Le, T.-C.; Dris, R.; Boukerma, K.; Rinnert, E.; Gasperi, J.; Tassin, B. Macroplastic and microplastic contamination assessment of a tropical river (Saigon River, Vietnam) transversed by a developing megacity. Environ. Pollut. 2018, 236, 661–671. [Google Scholar] [CrossRef] [Green Version]
- Tasseron, P.; Zinsmeister, H.; Rambonnet, L.; Hiemstra, A.-F.; Siepman, D.; van Emmerik, T. Plastic Hotspot Mapping in Urban Water Systems. Geosciences 2020, 10, 342. [Google Scholar] [CrossRef]
- van Calcar, C.; van Emmerik, T. Abundance of plastic debris across European and Asian rivers. Environ. Res. Lett. 2019, 14, 124051. [Google Scholar] [CrossRef] [Green Version]
- Vriend, P.; van Emmerik, T.; Roebroek, C.T. Same but different: A framework to design and compare riverbank plastic monitoring strategies. Front. Water 2020, 2, 3791. [Google Scholar] [CrossRef]
- Roebroek, C.T.J.; Hut, R.; Vriend, P.; de Winter, W.; Boonstra, M.; van Emmerik, T.H.M. Disentangling Variability in Riverbank Macrolitter Observations. Environ. Sci. Technol. 2021, 55, 4932–4942. [Google Scholar] [CrossRef] [PubMed]
- van Lieshout, C.; van Oeveren, K.; van Emmerik, T.; Postma, E. Automated River Plastic Monitoring Using Deep Learning and Cameras. Earth Space Sci. 2020, 7, e2019EA000960. [Google Scholar] [CrossRef]
- Garaba, S.P.; Dierssen, H.M. Hyperspectral ultraviolet to shortwave infrared characteristics of marine-harvested, washed-ashore and virgin plastics. Earth Syst. Sci. Data 2020, 12, 77–86. [Google Scholar] [CrossRef] [Green Version]
- De Giglio, M.; Dubbini, M.; Cortesi, I.; Maraviglia, M.; Parisi, E.I.; Tucci, G. Plastics waste identification in river ecosystems by multispectral proximal sensing: A preliminary methodology study. Water Environ. J. 2020, 35, 569–579. [Google Scholar] [CrossRef]
- Topouzelis, K.; Papakonstantinou, A.; Garaba, S.P. Detection of floating plastics from satellite and unmanned aerial systems (Plastic Litter Project 2018). Int. J. Appl. Earth Obs. Geoinf. 2019, 79, 175–183. [Google Scholar] [CrossRef]
- Themistocleous, K.; Papoutsa, C.; Michaelides, S.; Hadjimitsis, D. Investigating Detection of Floating Plastic Litter from Space Using Sentinel-2 Imagery. Remote Sens. 2020, 12, 2648. [Google Scholar] [CrossRef]
- Biermann, L.; Clewley, D.; Martinez-Vicente, V.; Topouzelis, K. Finding Plastic Patches in Coastal Waters using Optical Satellite Data. Sci. Rep. 2020, 10, 5364. [Google Scholar] [CrossRef] [Green Version]
- Kikaki, A.; Karantzalos, K.; Power, C.A.; Raitsos, D.E. Remotely Sensing the Source and Transport of Marine Plastic Debris in Bay Islands of Honduras (Caribbean Sea). Remote Sens. 2020, 12, 1727. [Google Scholar] [CrossRef]
- Garaba, S.P.; Aitken, J.; Slat, B.; Dierssen, H.M.; Lebreton, L.; Zielinski, O.; Reisser, J. Sensing Ocean Plastics with an Airborne Hyperspectral Shortwave Infrared Imager. Environ. Sci. Technol. 2018, 52, 11699–11707. [Google Scholar] [CrossRef]
- Goddijn-Murphy, L.; Dufaur, J. Proof of concept for a model of light reflectance of plastics floating on natural waters. Mar. Pollut. Bull. 2018, 135, 1145–1157. [Google Scholar] [CrossRef]
- Martínez-Vicente, V.; Clark, J.R.; Corradi, P.; Aliani, S.; Arias, M.; Bochow, M.; Bonnery, G.; Cole, M.; Cózar, A.; Donnelly, R.; et al. Measuring Marine Plastic Debris from Space: Initial Assessment of Observation Requirements. Remote Sens. 2019, 11, 2443. [Google Scholar] [CrossRef] [Green Version]
- Garaba, S.P.; Dierssen, H.M. An airborne remote sensing case study of synthetic hydrocarbon detection using short wave infrared absorption features identified from marine-harvested macro- and microplastics. Remote Sens. Environ. 2018, 205, 224–235. [Google Scholar] [CrossRef]
- Knaeps, E.; Sterckx, S.; Strackx, G.; Mijnendonckx, J.; Moshtaghi, M.; Garaba, S.P.; Meire, D. Hyperspectral-reflectance dataset of dry, wet and submerged marine litter. Earth Syst. Sci. Data 2021, 13, 713–730. [Google Scholar] [CrossRef]
- Moshtaghi, M.; Knaeps, E.; Sterckx, S.; Garaba, S.; Meire, D. Spectral reflectance of marine macroplastics in the VNIR and SWIR measured in a controlled environment. Sci. Rep. 2021, 11, 1–12. [Google Scholar] [CrossRef]
- Corbari, L.; Maltese, A.; Capodici, F.; Mangano, M.; Sarà, G.; Ciraolo, G. Indoor spectroradiometric characterization of plastic litters commonly polluting the Mediterranean Sea: Toward the application of multispectral imagery. Sci. Rep. 2020, 10, 1–12. [Google Scholar] [CrossRef] [PubMed]
- Serranti, S.; Fiore, L.; Bonifazi, G.; Takeshima, A.; Takeuchi, H.; Kashiwada, S. Microplastics Characterization by Hyperspectral Imaging in the SWIR Range; SPIE: Bellingham, WA, USA, 2019; Volume 11197. [Google Scholar]
- Topouzelis, K.; Papageorgiou, D.; Karagaitanakis, A.; Papakonstantinou, A.; Arias Ballesteros, M. Remote Sensing of Sea Surface Artificial Floating Plastic Targets with Sentinel-2 and Unmanned Aerial Systems (Plastic Litter Project 2019). Remote Sens. 2020, 12, 2013. [Google Scholar] [CrossRef]
- Rokni, K.; Ahmad, A.; Selamat, A.; Hazini, S. Water Feature Extraction and Change Detection Using Multitemporal Landsat Imagery. Remote Sens. 2014, 6, 4173. [Google Scholar] [CrossRef] [Green Version]
- Lechthaler, S.; Waldschläger, K.; Stauch, G.; Schüttrumpf, H. The Way of Macroplastic through the Environment. Environments 2020, 7, 73. [Google Scholar] [CrossRef]
- Barboza, L.G.A.; Cózar, A.; Gimenez, B.C.G.; Barros, T.L.; Kershaw, P.J.; Guilhermino, L. Chapter 17—Macroplastics Pollution in the Marine Environment. In World Seas: An Environmental Evaluation, 2nd ed.; Sheppard, C., Ed.; Academic Press: Cambridge, MA, USA, 2019; pp. 305–328. [Google Scholar]
- van Emmerik, T.; Schwarz, A. Plastic debris in rivers. WIREs Water 2020, 7, e1398. [Google Scholar] [CrossRef] [Green Version]
- Schwarz, A.E.; Ligthart, T.N.; Boukris, E.; van Harmelen, T. Sources, transport, and accumulation of different types of plastic litter in aquatic environments: A review study. Mar. Pollut. Bull. 2019, 143, 92–100. [Google Scholar] [CrossRef] [PubMed]
- van Emmerik, T.; Kieu-Le, T.-C.; Loozen, M.; van Oeveren, K.; Strady, E.; Bui, X.-T.; Egger, M.; Gasperi, J.; Lebreton, L.; Nguyen, P.-D.; et al. A Methodology to Characterize Riverine Macroplastic Emission Into the Ocean. Front. Mar. Sci. 2018, 5. [Google Scholar] [CrossRef] [Green Version]
- Li, W.C.; Tse, H.F.; Fok, L. Plastic waste in the marine environment: A review of sources, occurrence and effects. Sci. Total Environ. 2016, 566–567, 333–349. [Google Scholar] [CrossRef] [PubMed]
- Zhao, X.; Wang, W.; Ni, X.; Chu, X.; Li, Y.-F.; Sun, C. Evaluation of Near-infrared hyperspectral imaging for detection of peanut and walnut powders in whole wheat flour. Appl. Sci. 2018, 8, 1076. [Google Scholar] [CrossRef] [Green Version]
- Balakrishnama, S.; Ganapathiraju, A. Linear discriminant analysis-a brief tutorial. Inst. Signal Inf. Process. 1998, 18, 1–8. [Google Scholar]
- Fisher, R.A. The use of multiple measurements in taxonomic problems. Ann. Eugen. 1936, 7, 179–188. [Google Scholar] [CrossRef]
- Kim, S.-J.; Magnani, A.; Boyd, S. Robust fisher discriminant analysis. In Advances in Neural Information Processing Systems; Stanford University: Stanford, CA, USA; pp. 659–666.
- Garaba, S.P.; Arias, M.; Corradi, P.; Harmel, T.; de Vries, R.; Lebreton, L. Concentration, anisotropic and apparent colour effects on optical reflectance properties of virgin and ocean-harvested plastics. J. Hazard. Mater. 2020, 124290. [Google Scholar] [CrossRef]
- Moroni, M.; Mei, A.; Leonardi, A.; Lupo, E.; Marca, F.L. PET and PVC Separation with Hyperspectral Imagery. Sensors 2015, 15, 2205–2227. [Google Scholar] [CrossRef]
- Bonifazi, G.; Capobianco, G.; Serranti, S. A hierarchical classification approach for recognition of low-density (LDPE) and high-density polyethylene (HDPE) in mixed plastic waste based on short-wave infrared (SWIR) hyperspectral imaging. Spectrochim. Acta Part A: Mol. Biomol. Spectrosc. 2018, 198, 115–122. [Google Scholar] [CrossRef]
- Meacham-Hensold, K.; Montes, C.M.; Wu, J.; Guan, K.; Fu, P.; Ainsworth, E.A.; Pederson, T.; Moore, C.E.; Brown, K.L.; Raines, C.; et al. High-throughput field phenotyping using hyperspectral reflectance and partial least squares regression (PLSR) reveals genetic modifications to photosynthetic capacity. Remote Sens. Environ. 2019, 231, 111176. [Google Scholar] [CrossRef] [PubMed]
- Danson, F.; Steven, M.; Malthus, T.; Clark, J. High-spectral resolution data for determining leaf water content. Int. J. Remote Sens. 1992, 13, 461–470. [Google Scholar] [CrossRef]
- Piarulli, S.; Sciutto, G.; Oliveri, P.; Malegori, C.; Prati, S.; Mazzeo, R.; Airoldi, L. Rapid and direct detection of small microplastics in aquatic samples by a new near infrared hyperspectral imaging (NIR-HSI) method. Chemosphere 2020, 260, 127655. [Google Scholar] [CrossRef]
- Eldin, A.; Akyar, I. Near infra red spectroscopy. Wide Spectra Qual. Control. InTech Rij. Croat. 2011, 237–248. [Google Scholar]
- Richter, R.; Wang, X.; Bachmann, M.; Schläpfer, D. Correction of cirrus effects in Sentinel-2 type of imagery. Int. J. Remote Sens. 2011, 32, 2931–2941. [Google Scholar] [CrossRef]
- Guo, X.; Li, P. Mapping plastic materials in an urban area: Development of the normalized difference plastic index using WorldView-3 superspectral data. ISPRS J. Photogramm. Remote Sens. 2020, 169, 214–226. [Google Scholar] [CrossRef]
- Fu, B.; Burgher, I. Riparian vegetation NDVI dynamics and its relationship with climate, surface water and groundwater. J. Arid Environ. 2015, 113, 59–68. [Google Scholar] [CrossRef]
- Balsi, M.; Moroni, M.; Chiarabini, V.; Tanda, G. High-Resolution Aerial Detection of Marine Plastic Litter by Hyperspectral Sensing. Remote Sens. 2021, 13, 1557. [Google Scholar] [CrossRef]
- Mehrubeoglu, M.; Van Sickle, A.; McLauchlan, L. Borrowing least squares analysis from spectral unmixing to classify plastics in SWIR hyperspectral images. In Hyperspectral Imaging and Applications; International Society for Optics and Photonics: Bellingham, WA, USA.
- Hueni, A.; Bertschi, S. Detection of sub-pixel plastic abundance on water surfaces using airborne imaging spectroscopy. In Proceedings of the 2020 IEEE International Geoscience and Remote Sensing Symposium, Waikoloa, HI, USA, 26 September–2 October 2020; pp. 6325–6328. [Google Scholar]
- Bonifazi, G.; Capobianco, G.; Palmieri, R.; Serranti, S. Hyperspectral imaging applied to the waste recycling sector. Spectrosc. Eur. 2019, 3, 8–11. [Google Scholar]
- Pieszczek, L.; Daszykowski, M. Improvement of recyclable plastic waste detection—A novel strategy for the construction of rigorous classifiers based on the hyperspectral images. Chemom. Intell. Lab. Syst. 2019, 187, 28–40. [Google Scholar] [CrossRef]
Figure 1.
Flowchart of the materials and methods applied in this study, divided into six main processes.
Figure 1.
Flowchart of the materials and methods applied in this study, divided into six main processes.

Figure 2.
Virgin plastic collection subdivided into five polymer categories and non-plastics.

Figure 3.
Schematic of the experimental setup.

Figure 4.
Normalised spectral signatures of the eight classes (a–h). The spectral signatures were calculated separately for both cameras and scaled to match the reflectance values before and after the ‘no data’ zone. The scaling caused reflectance values to appear outside of the 0–1 range, which only occurs in this figure and not in the data used in subsequent analyses.

Figure 5.
Reflection spectra of water and floating items (a); weights of the LDA separating water and floating items overlaid with central wavelengths and bandwidths of the Sentinel-2 MSI (b); and overlaid with central wavelengths and bandwidths of Worldview-3 MS-VNIR and MS-SWIR (c).
Figure 5.
Reflection spectra of water and floating items (a); weights of the LDA separating water and floating items overlaid with central wavelengths and bandwidths of the Sentinel-2 MSI (b); and overlaid with central wavelengths and bandwidths of Worldview-3 MS-VNIR and MS-SWIR (c).

Figure 6.
Reflection spectra of vegetation and plastics (a); weights of the LDA separating vegetation and plastic items overlaid with central wavelengths and bandwidths of the Sentinel-2 MSI (b); and overlaid with central wavelengths and bandwidths of Worldview-3 MS-VNIR and MS-SWIR (c).
Figure 6.
Reflection spectra of vegetation and plastics (a); weights of the LDA separating vegetation and plastic items overlaid with central wavelengths and bandwidths of the Sentinel-2 MSI (b); and overlaid with central wavelengths and bandwidths of Worldview-3 MS-VNIR and MS-SWIR (c).

Figure 7.
Two examples of the Normalised Difference Vegetation Index (NDVI) (b,e), and Floating Debris Index (FDI) (c,f) with their respective RGB images (a,d) of vegetation, PP spoons (a–c), PS coffee stirrers (a–c), and clear LDPE bags (d–f).
Figure 7.
Two examples of the Normalised Difference Vegetation Index (NDVI) (b,e), and Floating Debris Index (FDI) (c,f) with their respective RGB images (a,d) of vegetation, PP spoons (a–c), PS coffee stirrers (a–c), and clear LDPE bags (d–f).

Figure 8.
FDI and NDVI scatter for all seven classes with their mean value (coloured dots) and standard deviation as error bars. The opaque blue, green, and grey boxes represent the range of scattered values as analysed in Biermann, Clewley, Martinez-Vicente and Topouzelis [17].
Figure 8.
FDI and NDVI scatter for all seven classes with their mean value (coloured dots) and standard deviation as error bars. The opaque blue, green, and grey boxes represent the range of scattered values as analysed in Biermann, Clewley, Martinez-Vicente and Topouzelis [17].


Table 1.
Types of plastics in freshwater environments showing density, abundance, and examples of their use. [9,20,30,32,34].
| Type of Plastic | Specific Gravity | Composition Distribution | Optical Properties | Examples |
|---|---|---|---|---|
| low-density polyethene (LDPE) | 0.91–0.93 | 17–42% | (semi)transparent clear/coloured | cling film, garbage bags, shopping bags |
| high-density polyethene (HDPE) | 0.94–0.96 | 17–42% | semi-transparent white/coloured | milk bottles, detergent bottles, sandwich bags |
| polystyrene (PS) | 1.04 | 11–17% | opaque white, grey specks | plastic cutlery, food containers, one-use cups |
| polypropylene (PP) | 0.83–0.85 | 11–30% | semi-transparent and coloured | chip bags, drinking straws, yoghurt containers |
| polyethene terephthalate (PET) | 1.37 | <10% | transparent/clear | soft drink bottles, water bottles, clamshell packages |
Table 2.
Summary of Sentinel-2 bands and the closest wavelengths in the hyperspectral dataset with their band index number.
Table 2.
Summary of Sentinel-2 bands and the closest wavelengths in the hyperspectral dataset with their band index number.
| Sentinel-2 Band Name | B2 Blue | B3 Green | B4 Red | B5 Red Edge 1 | B6 Red Edge 2 | B7 Red Edge 3 | B8 NIR | B9 Water Vapour | B10 SWIR-Cirrus | B11 SWIR |
|---|---|---|---|---|---|---|---|---|---|---|
| Central λ (nm) | 490 | 560 | 665 | 705 | 740 | 783 | 842 | 945 | 1375 | 1610 |
| λ (nm) | 489.3 | 561.2 | 666.2 | 704.2 | 739.6 | 783.5 | 841.28 | 941.1 | 1377.4 | 1610.6 |
| Band number | vis-36 | vis-63 | vis-102 | vis-116 | vis-129 | vis-145 | vis-166 | ir-1 | ir-63 | ir-96 |
Table 3.
Summary of Worldview-3 bands and the closest wavelengths in the hyperspectral dataset with their band index number.
Table 3.
Summary of Worldview-3 bands and the closest wavelengths in the hyperspectral dataset with their band index number.
| Worldview-3 Band Name | Blue | Green | Yellow | Red | Red Edge | Near-IR1 | Near-IR2 | SWIR-1 | SWIR-2 | SWIR-3 |
|---|---|---|---|---|---|---|---|---|---|---|
| Central λ (nm) | 480 | 545 | 605 | 660 | 725 | 833 | 950 | 1219 | 1570 | 1660 |
| λ (nm) | 481.4 | 545.2 | 604.1 | 660.8 | 726.0 | 833.0 | 948.1 | 1222.3 | 1568.1 | 1660.2 |
| Band number | vis-33 | vis-57 | vis-79 | vis-100 | vis-124 | vis-163 | ir-2 | ir-41 | ir-90 | ir-103 |
Publisher’s Note: MDPI stays neutral with regard to jurisdictional claims in published maps and institutional affiliations. |
© 2021 by the authors. Licensee MDPI, Basel, Switzerland. This article is an open access article distributed under the terms and conditions of the Creative Commons Attribution (CC BY) license (https://creativecommons.org/licenses/by/4.0/).
Share and Cite
MDPI and ACS Style
Tasseron, P.; van Emmerik, T.; Peller, J.; Schreyers, L.; Biermann, L. Advancing Floating Macroplastic Detection from Space Using Experimental Hyperspectral Imagery. Remote Sens. 2021, 13, 2335. https://doi.org/10.3390/rs13122335
AMA Style
Tasseron P, van Emmerik T, Peller J, Schreyers L, Biermann L. Advancing Floating Macroplastic Detection from Space Using Experimental Hyperspectral Imagery. Remote Sensing. 2021; 13(12):2335. https://doi.org/10.3390/rs13122335
Chicago/Turabian StyleTasseron, Paolo, Tim van Emmerik, Joseph Peller, Louise Schreyers, and Lauren Biermann. 2021. "Advancing Floating Macroplastic Detection from Space Using Experimental Hyperspectral Imagery" Remote Sensing 13, no. 12: 2335. https://doi.org/10.3390/rs13122335
Note that from the first issue of 2016, this journal uses article numbers instead of page numbers. See further details here.