
Quantifying Marine Plastic Debris in a Beach Environment Using Spectral Analysis
by
 , , , and
Jenna A. Guffogg
1,2,* ,
,
Samantha M. Blades
1,
Mariela Soto-Berelov
1,
Chris J. Bellman
1,
Andrew K. Skidmore
2,3 and
Simon D. Jones
1 1
School of Science, Royal Melbourne Institute of Technology University, 124 La Trobe Street, Melbourne, VIC 3000, Australia
2
ITC, University of Twente, Hengelosestraat 99, 7514 AE Enschede, The Netherlands
3
Department of Environmental Science, Macquarie University, Balaclava Rd., Macquarie Park, Sydney, NSW 2109, Australia
*
Author to whom correspondence should be addressed.
Remote Sens. 2021, 13(22), 4548; https://doi.org/10.3390/rs13224548
Submission received: 20 October 2021
/
Revised: 9 November 2021
/
Accepted: 10 November 2021
/
Published: 12 November 2021
(This article belongs to the Special Issue Remote Sensing for Mapping and Monitoring Anthropogenic Debris)
Abstract
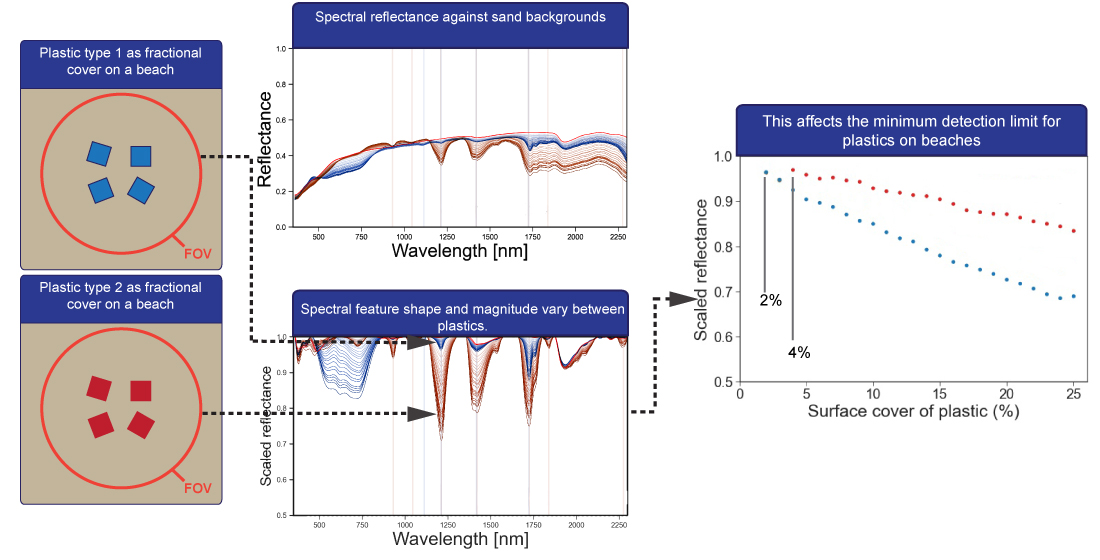
:Marine plastic debris (MPD) is a globally relevant environmental challenge, with an estimated 8 million tons of synthetic debris entering the marine environment each year. Plastic has been found in all parts of the marine environment, including the surface layers of the ocean, within the water column, in coastal waters, on the benthic layer and on beaches. While research on detecting MPD using remote sensing is increasing, most of it focuses on detecting floating debris in open waters, rather than detecting MPD on beaches. However, beaches present challenges that are unique from other parts of the marine environment. In order to better understand the spectral properties of beached MPD, we present the SWIR reflectance of weathered MPD and virgin plastics over a sandy substrate. We conducted spectral feature analysis on the different plastic groups to better understand the impact that polymers have on our ability to detect synthetic debris at sub-pixel surface covers that occur on beaches. Our results show that the minimum surface cover required to detect MPD on a sandy surface varies between 2–8% for different polymer types. Furthermore, plastic composition affects the magnitude of spectral absorption. This suggests that variation in both surface cover and polymer type will inform the efficacy of beach litter detection methods.

1. Introduction
The issue of anthropogenic debris entering the marine and coastal environments has received increased attention in recent years. While anthropogenic marine debris can include a range of materials such as wood, glass and metals, studies from different regions indicate that up to 80% of this debris is petrochemical-based [1,2]. Estimates of the total amount of marine plastic debris (MPD) in the oceans vary, though recent estimates suggest 8 million tons of plastic entered the marine environment in 2010 [3], and that this volume will increase [4]. MPD is now accumulating in all parts of the marine environment; from the Arctic [5] to the Antarctic [6], on the surface of the open ocean [7], suspended in the water column, on the seafloor [8], along coastlines, within estuaries and along beaches [9,10].
The properties that make plastics so useful in modern society, namely their durability, strength, light weight and resistance to corrosion, are also the reason why they are a persistent pollutant once they escape into the environment. MPD ranges from large macroplastic items spanning several metres such as abandoned fishing nets [11] to microplastics (<5 mm), which can result from manufactured debris of this size (primary microplastics) or fragmentation of larger items (secondary microplastics). While policies have been introduced around the world to curb the production of primary microplastics, the large volumes of macroplastics in the marine environment act as a source material; if these are not removed by clean-up operations, they will inevitably fragment into microplastics [12,13].
The origins of MPD in the marine environment vary; however, the majority come from terrestrial sources [3]. Major sources of plastic pollution are coastal population centres [3] and river systems [14], although the exact dynamics of MPD release into the marine environment is still an open question [15]. However, it has been noted for several years now that the amount of MPD documented in oceans, while concerning, is significantly less than expected given the estimated amount of plastics entering the marine environment [8,14,16].
Reasons put forward to explain this disparity include (a) over-estimating the amount of mismanaged debris entering the marine environment and underestimating the amount of floating debris in oceans [17], (b) bio-fouling and degradation of MPD affecting buoyancy and thus sinking within a short time frame [18] and (c) that MPD remain in coastal regions for an extended time, floating in coastal waters [15] or in a cycle of erosion and re-deposition onto beaches [19]. In this last scenario, small-scale weather patterns and tidal forces keep MPD trapped in a cycle near the land and only some move beyond these coastal regions and end up in open oceans. If this is the case, then monitoring of MPD in coastal waters and on beaches will play an important role in MPD management strategies.
In addition to coming from a variety of sources, MPD found in coastal, beach and marine environments are highly varied in their physical and optical properties. On the beaches of the Cocos (Keeling) Islands and Henderson Island, in the Indian and Pacific oceans, respectively, a variety of consumer and industrial plastics are found in high concentrations [9,10]: single-use plastic bottles, containers, unidentified fragments of hard plastics [9], foams, soft plastic films and industrial fishing debris. These items can be composed of several polymers including polypropylene (PP), polystyrene (PS), high and low density polyethylene (HDPE and LDPE) and polyethylene terephthalate (PET).
Remote Sensing is ideal for monitoring large or remote areas like coasts, and over the last decade there has been growing interest in developing remote sensing based methods for monitoring MPD. Through both indirect and direct monitoring, remote sensing techniques can complement other methods used to monitor MPD such as monitoring stations, trawling nets [20] and beach surveys [21]. Information derived from ocean environmental variables (EOVS) and ocean current models can be used to infer the distribution of plastic debris and highlight areas of potential accumulation [22], while direct observation by sensors with appropriate spectral and spatial resolutions can detect the presence of litter [23,24]. Research using airborne data [25], optical satellite imagery [26], remote piloted aerial vehicles (RPAS, also called UAVs) [27] and reflectance models [28] have demonstrated that there is potential for detecting macroplastics over large geographical areas and management catchments [29]. If appropriate models and algorithms can be developed, satellite remote sensing in particular can offer high quality, standardised detection on a global scale.
An advantage to using optical data sources is utilising spectral features in the near and shortwave infrared (SWIR) regions of the electromagnetic spectrum (800–2500 nm) that are unique to plastic polymers. Using such spectral features can circumvent the challenge that comes from the high variability in plastic shape and visible appearance, and the impact this has on detecting plastics using RGB data sources. Garaba and Dierssen [30] showed that, utilising AVIRIS data, SWIR spectral features can be used to identify large terrestrial plastic objects. A similar study conducted over the ’Great Pacific Garbage Patch’ showed that larger plastic items, like tangles of fishing nets, were also separable using plastic-related spectral features [25].
To progress research on detecting MPD in the marine environment, a better understanding of detection limits, and greater access to reference spectral datasets will be required. Garaba and Dierssen [25] showed that, using an airborne hyperspectral sensor, they could detect plastics in some instances where 5% of a pixel contained floating MPD. Similarly, Guffogg et al. [31] showed that, using a handheld spectrometer, plastic debris on a beach could be detected if at least 3% of the target area was covered by plastic. However, both studies highlighted that, while plastics could be detected at these low fractional covers, it was not able to be done consistently.
Factors affecting the spectral reflectance of plastics include polymer type, thickness and the transparency of an item [28]. The effect of estimated pixel cover of virgin plastics with respect to spectral reflectance over water has been reported [28] as have those of plastics viewed at nadir and off-angles in a controlled laboratory environment against dark, low-reflectance backdrops [32]. However, the pixel coverages examined in these studies were limited (25, 50, 75 and 100% for Goddijn-Murphy [28], 0.01, 0.1, 1, 10, 20, 40, 60, 80 and 100% for Garaba et al. [32]). Although these studies have provided early insight into the effect of surface cover on overall change in spectral reflectance, further investigation is needed within the range of fractional covers that are expected to occur in the environment.
The investigation and use of polymer-specific spectral features have been conducted in recycling industries for some time; specific polymer spectral features can be used to sort plastics in waste streams [33]. Because of this, virgin plastic diagnostic spectral features in the SWIR are well documented. The detection of marine plastics, however, may be complicated by bio-films, mechanical and UV degradation changing plastic surface properties, and the co-occurrence of other spectrally distinctive features like wood, spume, seaweed and white caps. Atmospheric and water absorption are also expected to impact the spectral reflectance of plastics in the environment. That being said, recent studies have shown that plastics commonly found in the marine environment have similar SWIR absorption features to their virgin plastic counterparts [34,35,36]. Additionally, several open-access hyperspectral data sets for marine plastics have been published in recent years [34,35,36,37,38]; these are summarised in Table 1.
While knowledge is being generated about the spectral characteristics of marine-harvested plastics [34] and how the spectral characteristics of these plastics can be affected by their interaction with water [35,37], knowledge of the spectral characteristics of plastics when interacting with sand is yet to be investigated. The development of open-access spectral reference libraries for plastic litter in different environmental conditions has the potential to provide the data necessary for the development, testing and validation of appropriate spectral algorithms for MPD, both in coastal waters and also on beaches.
To address this current gap in the literature, in this study, we investigate the impact that plastic polymer type has on the minimum detection limits for proximal remote sensing over sandy substrates. The aim is to determine the minimum surface cover required for the detection of several polymers that are commonly found in marine and coastal environments. A previous study of in-situ MPD on the Cocos (Keeling) Islands found that the surface cover required for detection varied from 3–7% [31]; however, it was unable to establish the cause of the variance. The study also found that, in some instances of higher surface cover, spectral separation from sand was not possible.
This study builds on the knowledge gaps identified in the previous study, and examines the influence of polymers on minimum detection limits. To do this, we present the spectra of virgin plastics of both known polymers and marine harvested specimens of unknown composition, at various fractional covers gradually representing up to 25%. The marine harvested plastics for this experiment come from the Cocos (Keeling) Islands, a coral atoll in the Indian Ocean, noted as an accumulation point for plastic debris [9].
2. Materials and Methods
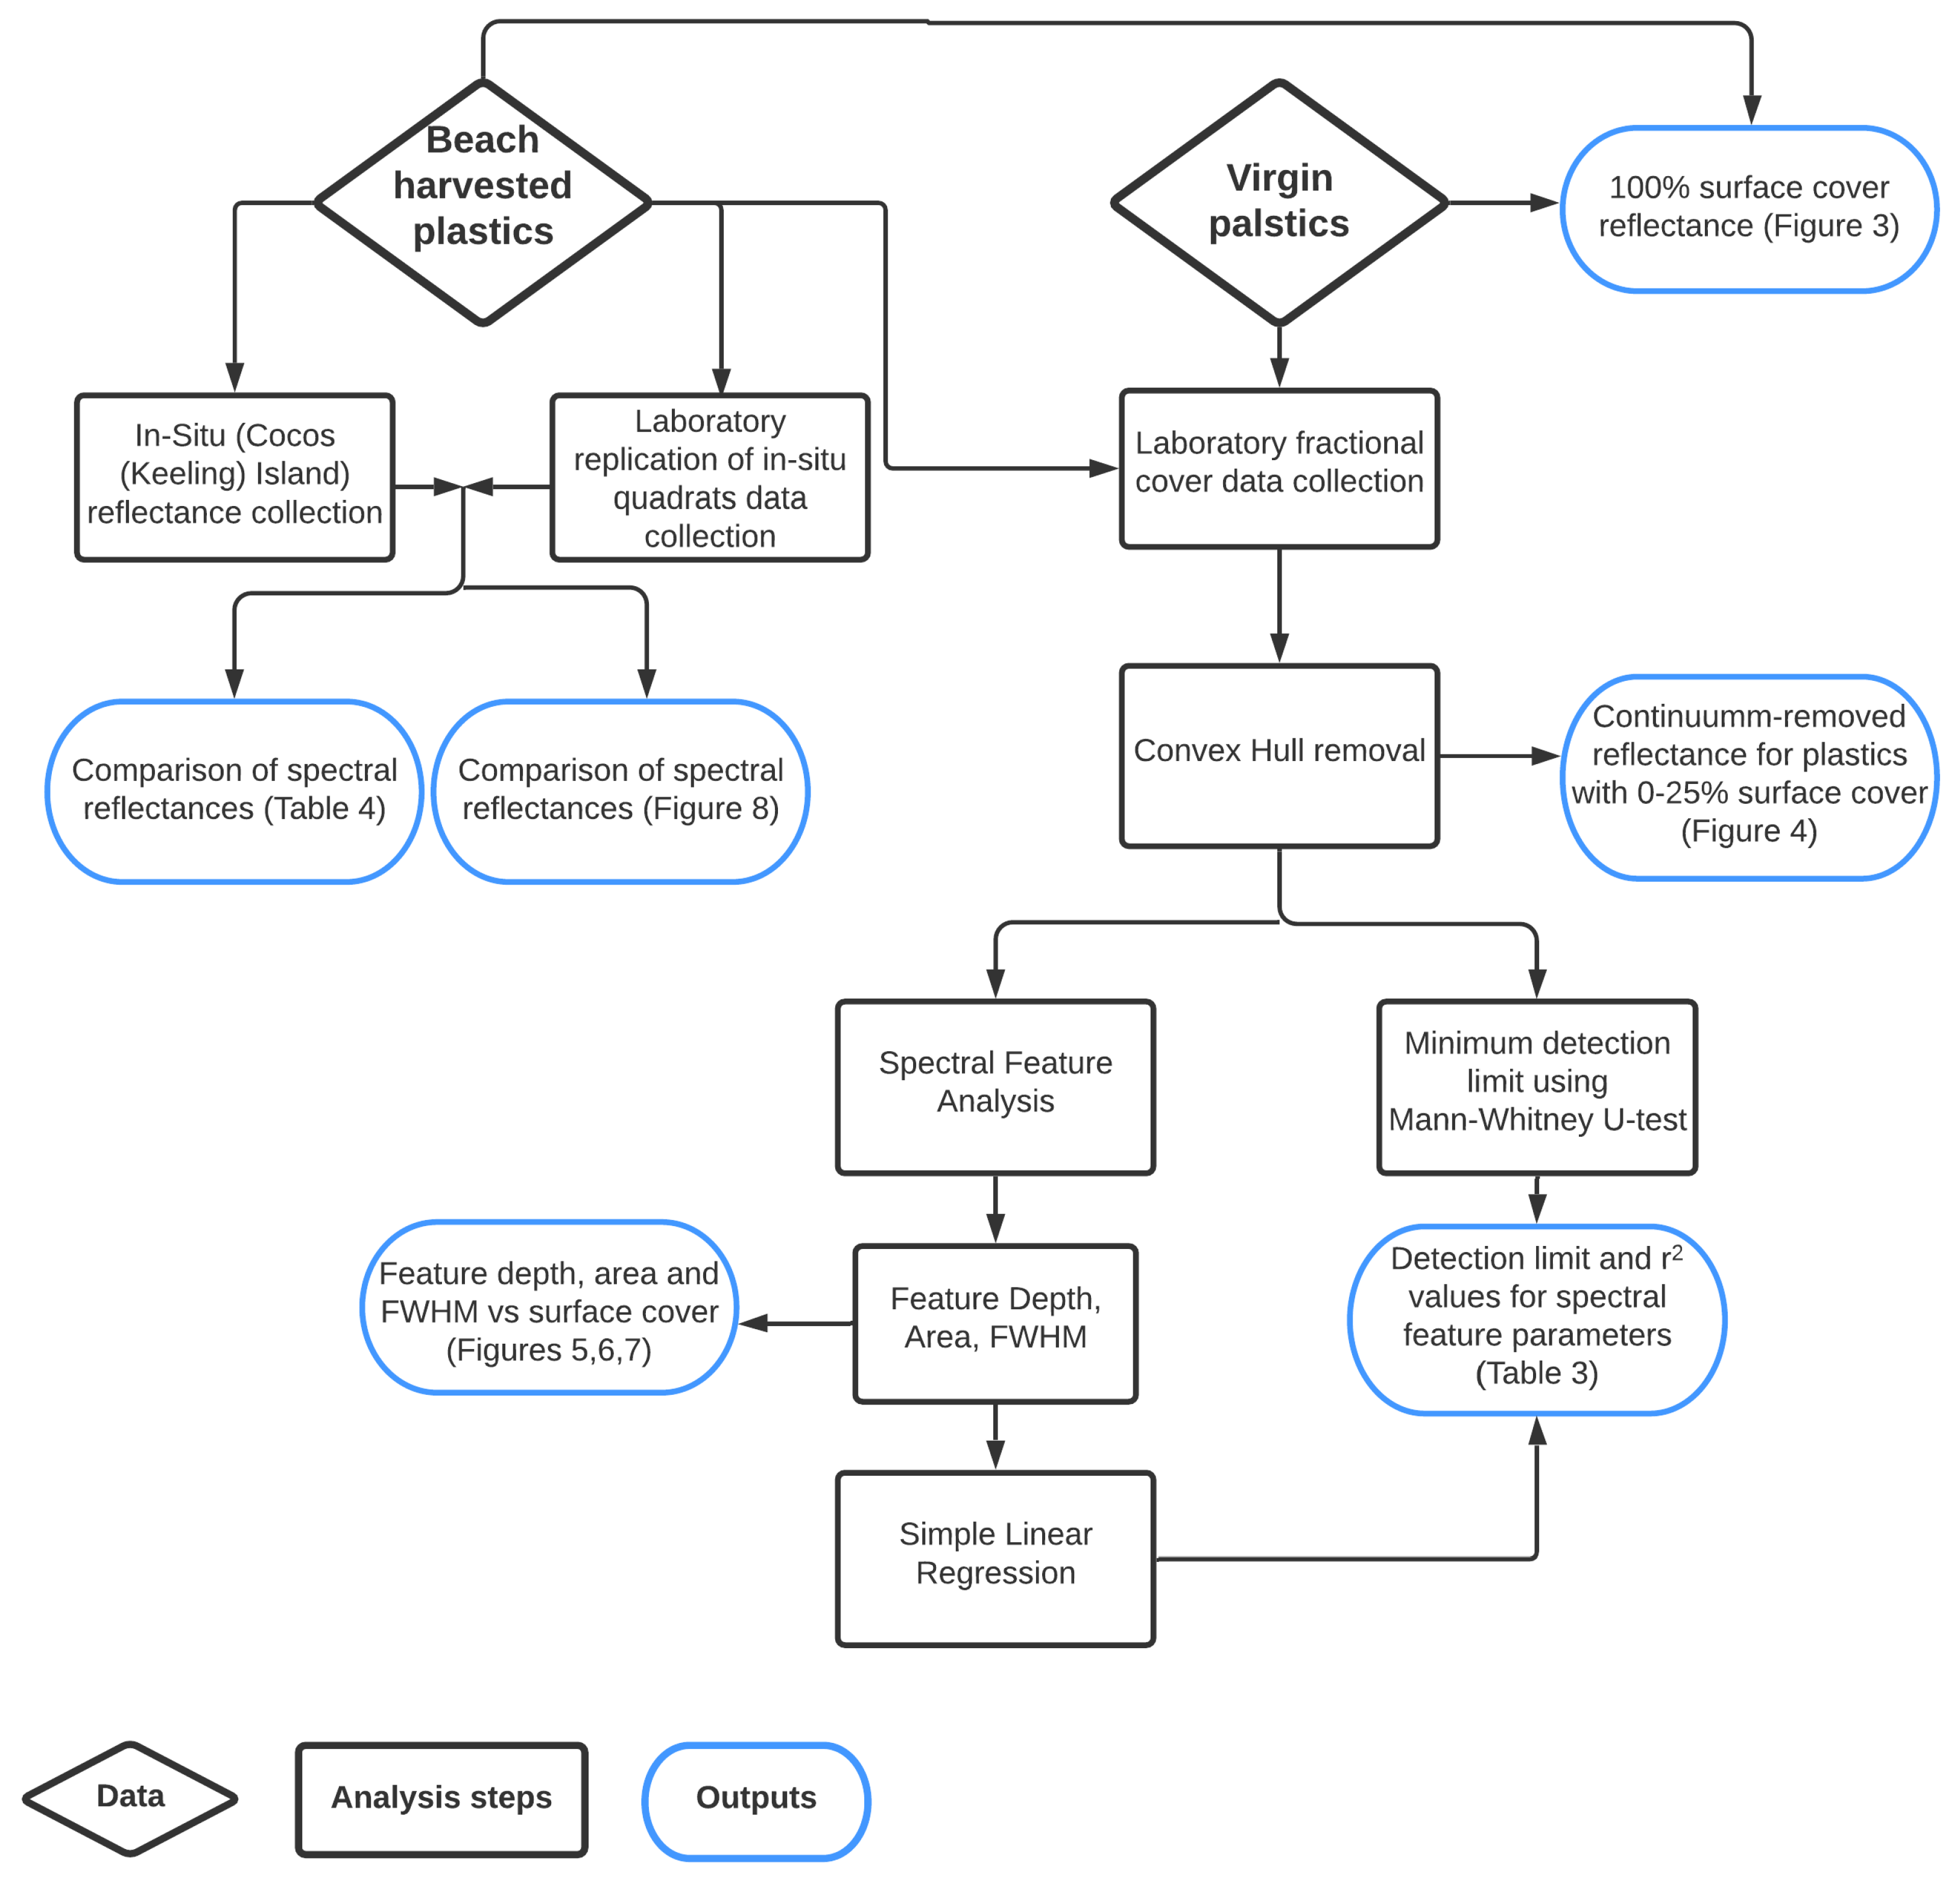
The aim of this research is to investigate the impact of plastic composition on detection limits for MPD. To achieve this, plastics were collected as both weathered samples from the environment and virgin samples from local municipal streams, and spectral data were collected in the field and under controlled laboratory conditions. This dataset was then analysed to determine the minimum surface covers required for spectral separation from sand, and to investigate the relationship between spectral feature parameters and surface cover. These steps are outlined in detail below and a summary of the methodology, including plastic sources and data outputs, is shown in Figure 1.
2.1. Field Work and Sample Collection
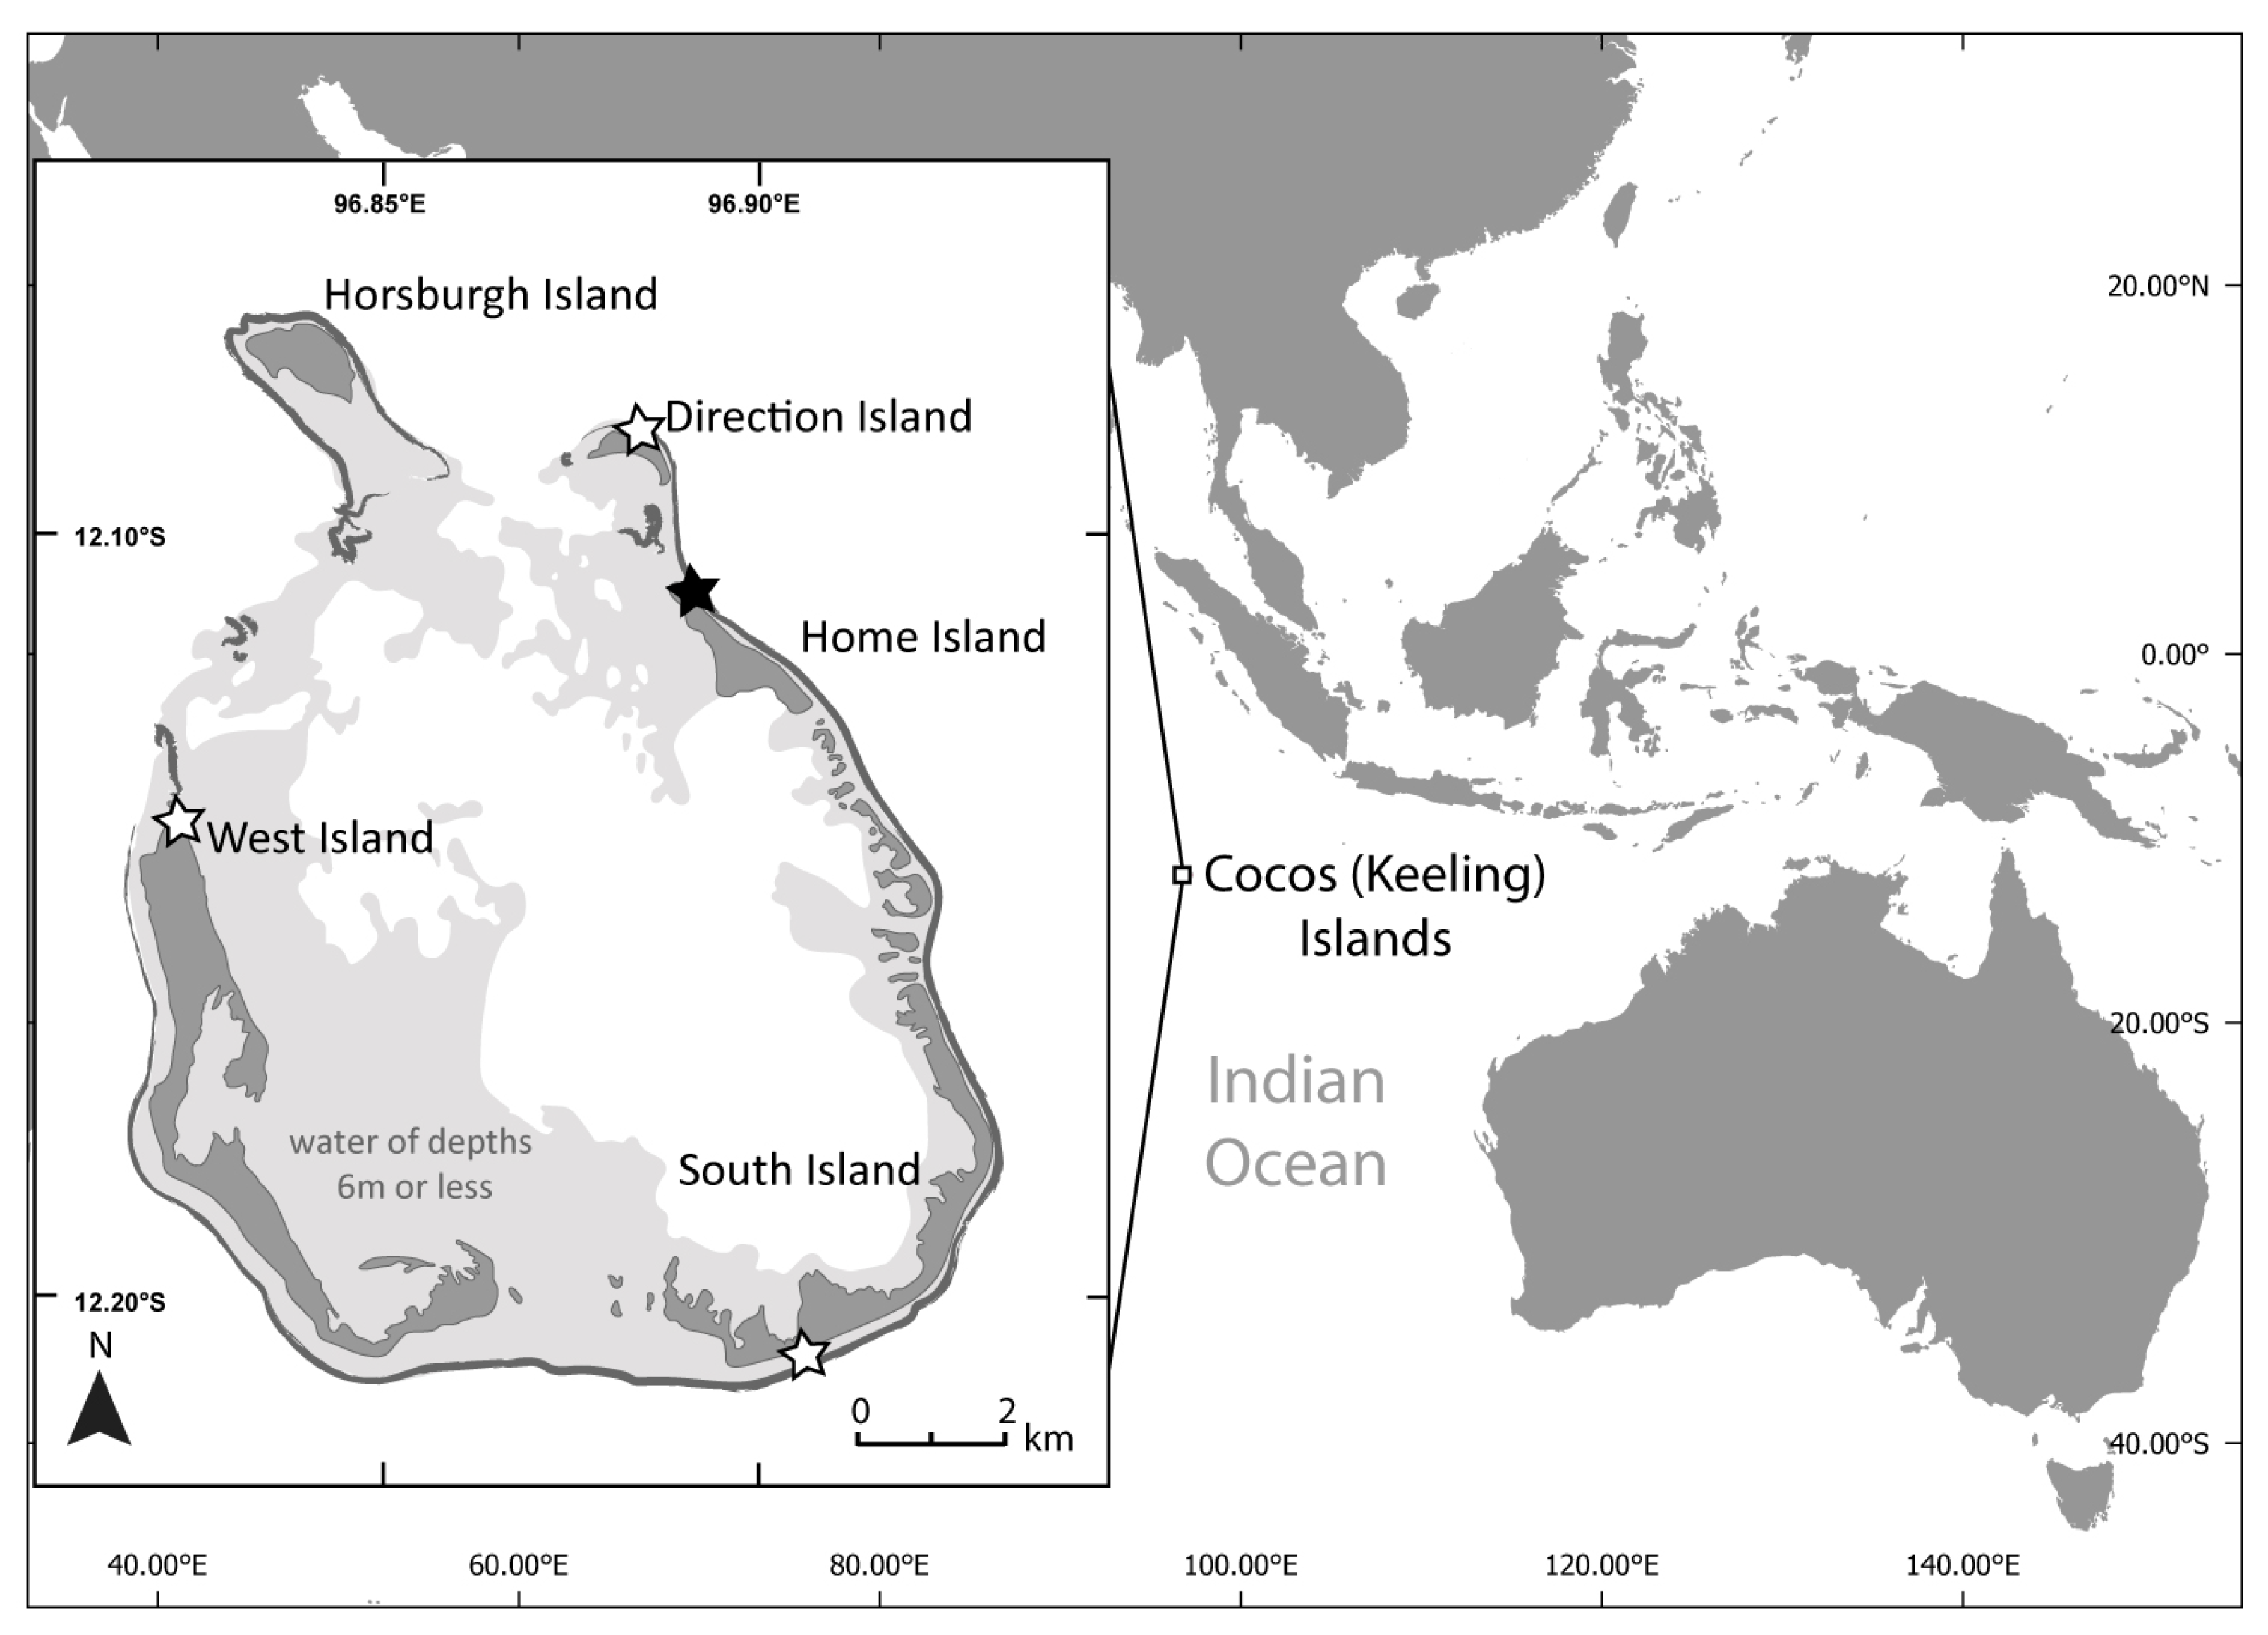
Plastic debris and sand samples were collected between 1 and 12 February 2020 on the Cocos (Keeling) Islands (12°05′S, 96°53′E Figure 2). The islands, located approximately 2100 km north-west of Exmouth, Western Australia, are made up of a carbonate atoll and smaller atoll with a total surface area of 14 km2 atop a volcanic seamount [39]. The sands of the Cocos (Keeling) Islands are composed of magnesium and calcium carbonates [39]. Four beaches were visited (Figure 2) and samples were collected from ocean-facing beaches on the four largest islands. The beaches had varying levels of accessibility: Home Island and West Island are both frequented by the local population, Direction Island is a popular tourist destination, and South Island is infrequently visited due to its remoteness and accessibility issues.
Ground surveys described by Guffogg et al. [31] revealed the most common MPD found in the Cocos (Keeling) Islands to be: hard white plastic fragments; hard coloured plastic fragments; shoes; transparent bottles and fishing debris composed mostly of ropes and some small buoys (Table 2). To compare the reflectance of plastics found in the field to those from a laboratory environment, five 1 m2 quadrats were setup on a beach and intentionally filled with MPD gathered from the immediate surroundings (see Figure A1 for an example). Each quadrat was contaminated with one category of MPD (as described above), with plastics categorised according to their physical properties rather than by polymer as it was not possible to confirm polymer in the field. The symbol used to denote polymer on an item was often not legible, either due to weathering and degradation of the plastic item, or because the plastic was a fragment of a larger item.
Spectral reflectance readings were captured ±3 h around solar noon (local time) using an Analytical Spectral Device (ASD) Fieldspec® Pro 4 hyperspectral radiometer (Malvern Panalytical, Boulder, CO, USA). The Fieldspec® is capable of recording full solar reflected spectrum between 350–2500 nm (VIS-SWIR); however, the Fieldspec® device used was fitted, at manufacture, with an extended 5 m fibre optic cable. This improves the overall quality of spectral measurements by increasing the mobility of the operator and reducing shadowing effects but does result in increased noise levels beyond 2300 nm. Before spectral readings were taken, the device was optimised, and a white reference was taken using a 99% white Spectralon® lambertian panel (Labsphere, North Sutton, NH, USA). New white references were taken between capturing quadrats in the field and when lighting conditions changed due to cloud cover. The ASD was configured to collect and average 30 scans per reading, and approximately 20 readings were captured for each quadrat. A representative spectral reading for the quadrat was achieved by continuously moving the spectral sensor over the quadrat in a randomised pattern, with the sensor held around 40 cm above the surface of the quadrat. No foreoptic was used, resulting in a field of view of 25 degrees. While some overlap with regions outside of the quadrat will have occurred, effort was made to avoid overlapping outside of the quadrat as much as possible.
2.2. Laboratory Setup and Sample Preparation
Virgin plastics which have not been exposed to environmental degradation were collected from municipal waste sources around Melbourne, Victoria (Table 2 and Figure 1). These items were cleaned, dried and stored. The plastics collected in this manner had not experienced environmental degradation, weathering or fragmentation. Care was taken not to cause surface scuffing or other forms of manual erosion during handling. After completion of the fieldwork, MPD and sand samples were brought back to a controlled laboratory and left in a dark area to dry. The same ASD Fieldspec® Pro 4 that was used during fieldwork was also used in the subsequent laboratory work.
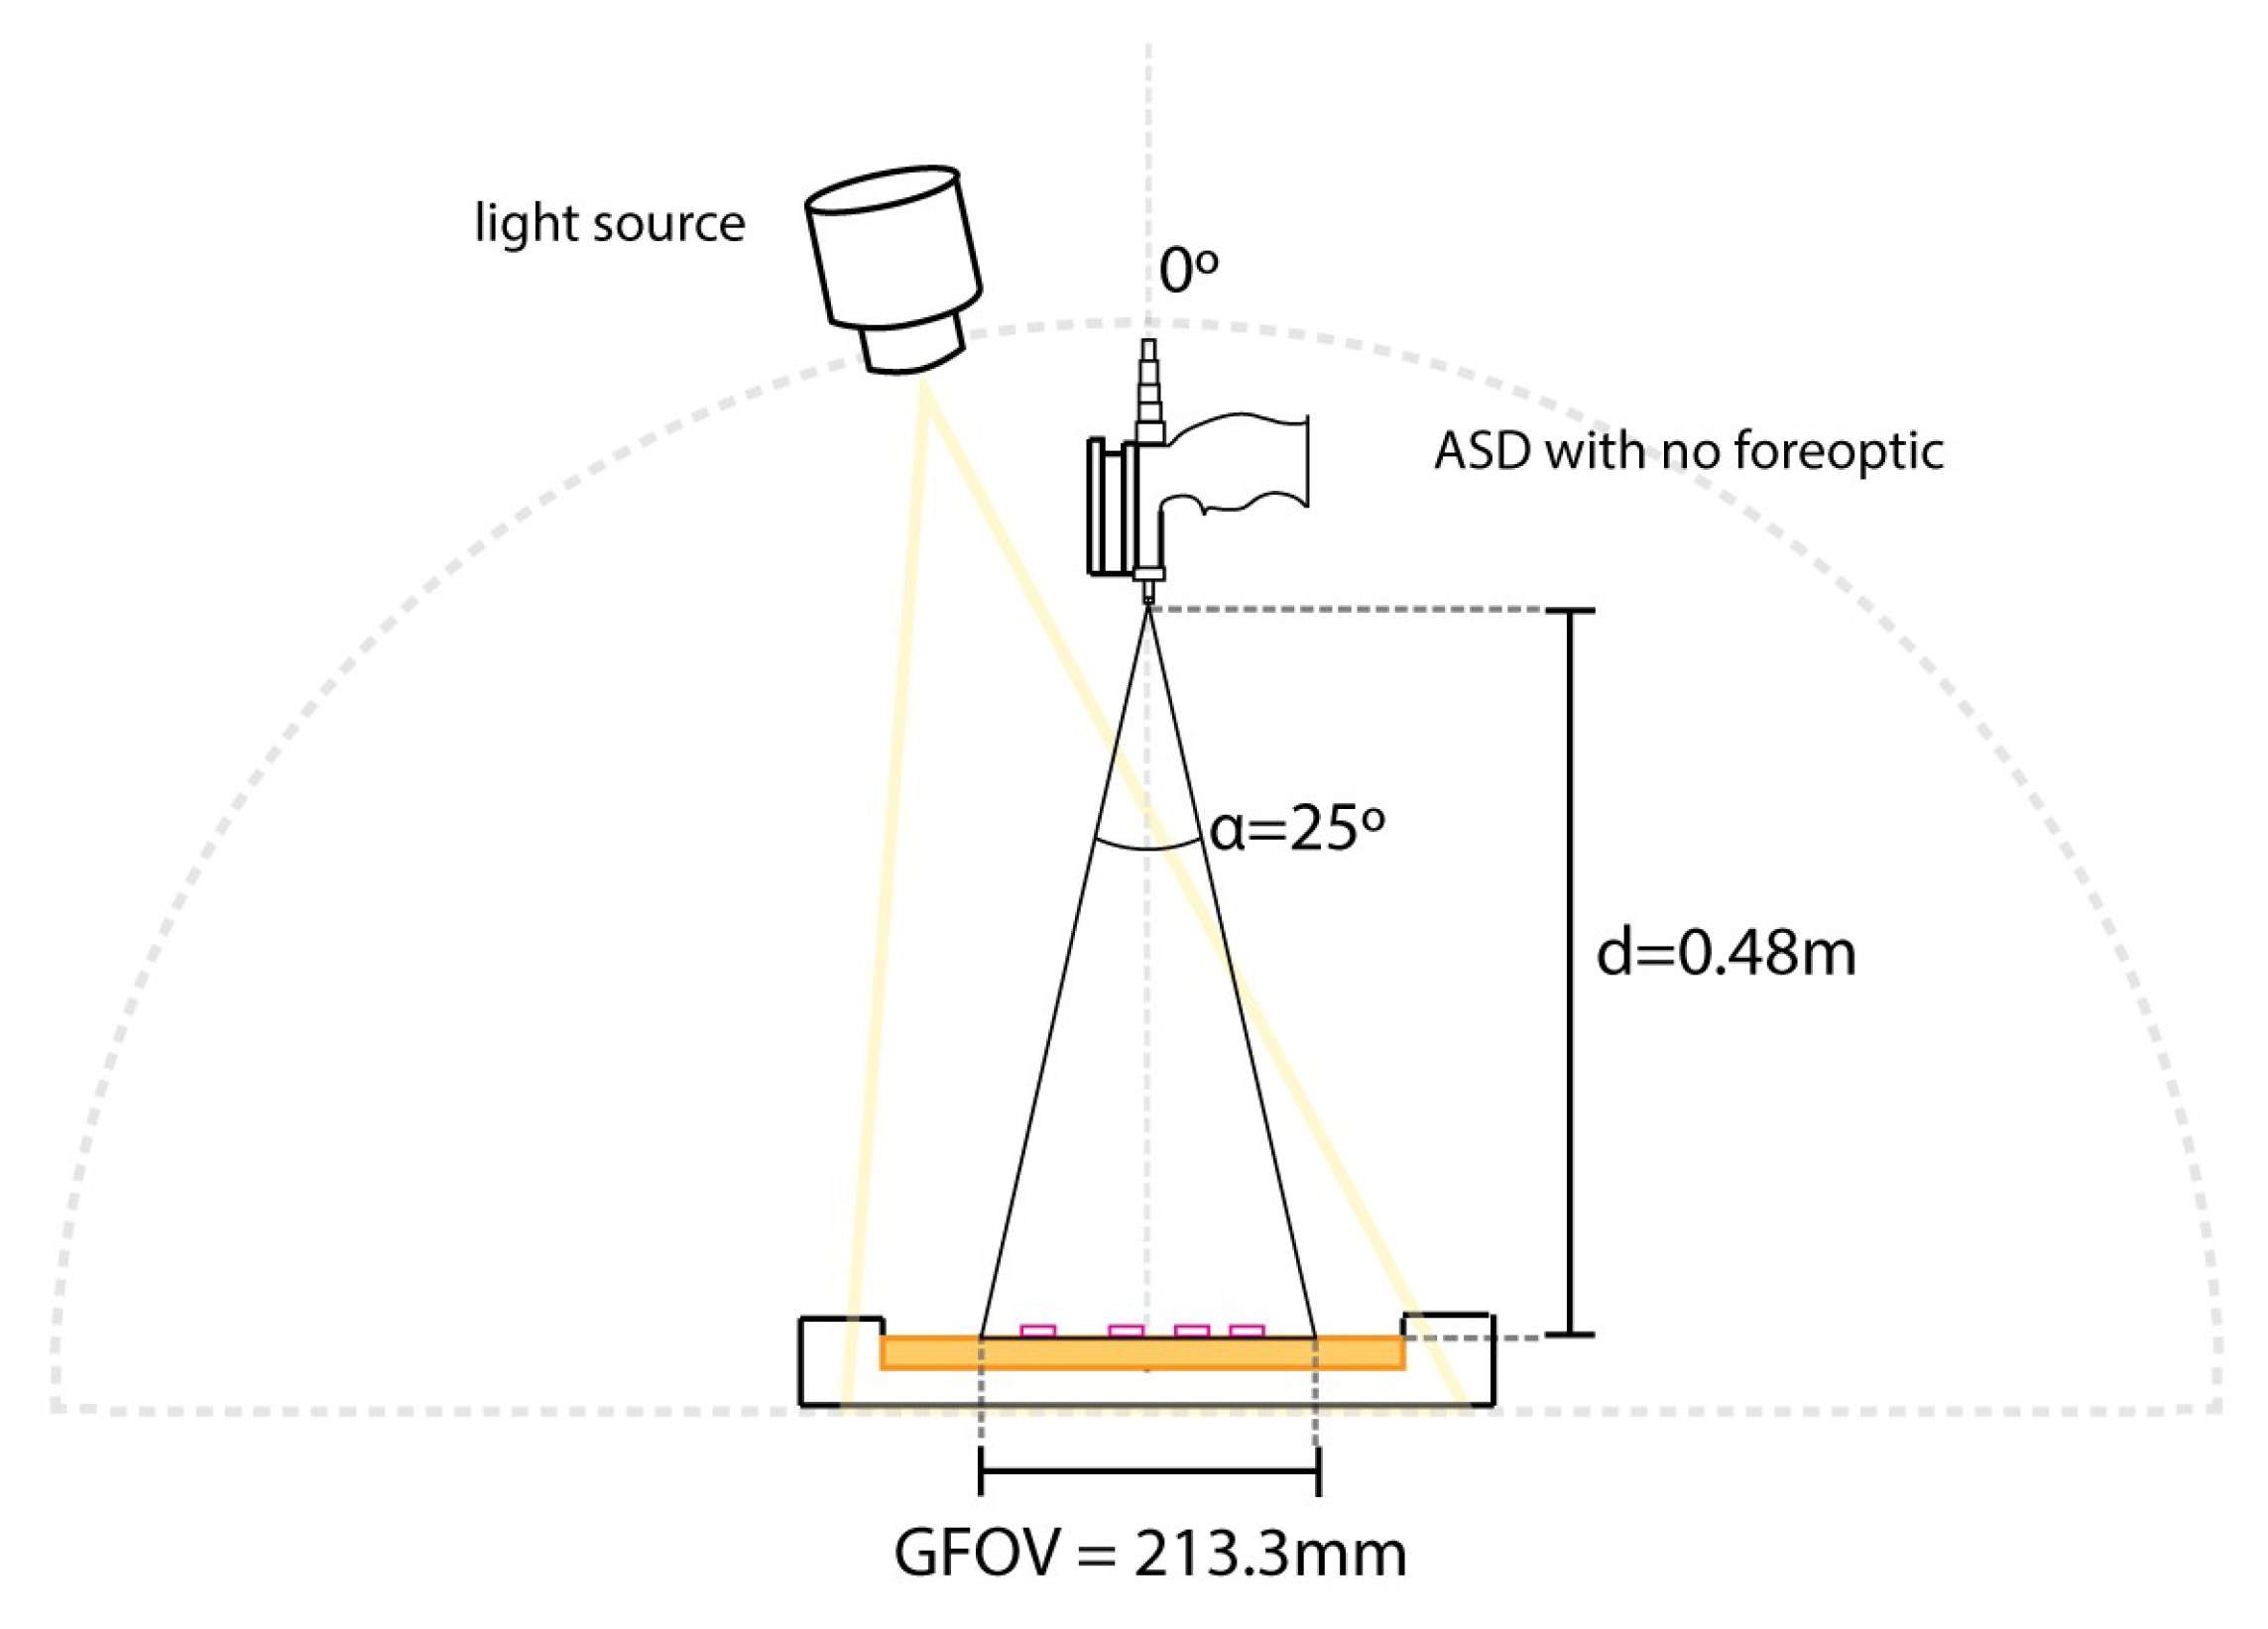
The Fieldspec® was set up in a dark room on a flat, stable surface. Sand was placed into a tray to a depth of 3 cm. To ensure the sand was of sufficient depth, additional sand was gradually added to the tray, and spectral measurements were taken at regular intervals. This process continued until there was no change in spectral reading with the addition of more sand (3 cm). The ASD sensor was suspended over the sand box using a mounting rail with the sensor pointed at nadir (see Figure A2 for a diagram of the setup). The final height between the end of the fibre-optic cable and the surface of the sand was 48 cm. While in the field the foreoptic was moved over the 1 m × 1 m quadrat area, in this setup, the foreoptic remained static. A halogen lamp was also attached to the same mounting rail, 5 cm to the side of the ASD sensor. As with the field test, no fore-optic was attached to the sensor, resulting in a ground sampling distance (GSD) of 21.3 cm.
The GSD was used to determine the size of plastic fragments to be used. For each group of plastics to be tested, both marine-harvested and virgin, fragments were cut out, representing 1% of the surface cover under the ASD. For the hard plastics (hard white, hard colour, clear bottles and shoes), each piece was cut to a square shape with equal lengths. For the fishing debris, the width of the rope was measured using calipers, and the length was cut accordingly to make the overall piece 1% of the surface area.
The ASD was turned on and left for 1 h prior to collecting reflectance data in the laboratory to allow sufficient time for the three spectrometer arrays to warm up; a 30 min warmup period is sufficient and was using during fieldwork because of time restraints. To begin the experiment, a dark reading was taken, the device was optimised and the 99% Spectralon® lambertian panel was used to capture a white reference. Each plastic group from Table 2 was tested, with a new white reference and sand-only readings taken first, followed by surface cover readings between 1–25%. Once reflectance had been captured for all surface covers, the plastic fragments were removed from the sandbox and a new white reading was taken before moving on to the next plastic group. Sand reflectance was measured between plastic surface cover scenarios to check if there were changes in the reflectance from varying surface texture. Each reading was composed of 30 scans, and a total of 25 readings were collected for each surface cover condition (including 0%).
2.3. Analysis
Once the spectral readings were collected, the data were processed using the SpecDal toolkit in Python 3 [40]. After importing the data, a step correction was applied to the first and third detectors, to align them with the second detector. Offsets between the detectors are a known factor, and occur despite randomisation of the fiber optic cables. The size of the offset can be affected by the proximity of the bare cable to the surface, the heterogeneity of the surface being observed and whether the sensor is held in a static position [41]. The second detector (1001–1800 nm range) is observed to be more stable at the ends of its wavelength coverage and so corrections are usually applied to bring the other detectors in line with this one. After the step correction, a Savitsky–Golay smoothing filter was also applied to the data, with a window length of 19 nm and a polynomial of 3. Because of the extended fibre optic cable fitted to the Fieldspec® Pro, there was excessive noise in the spectra beyond 2300 nm. Data from 2300–2500 nm were removed because of this.
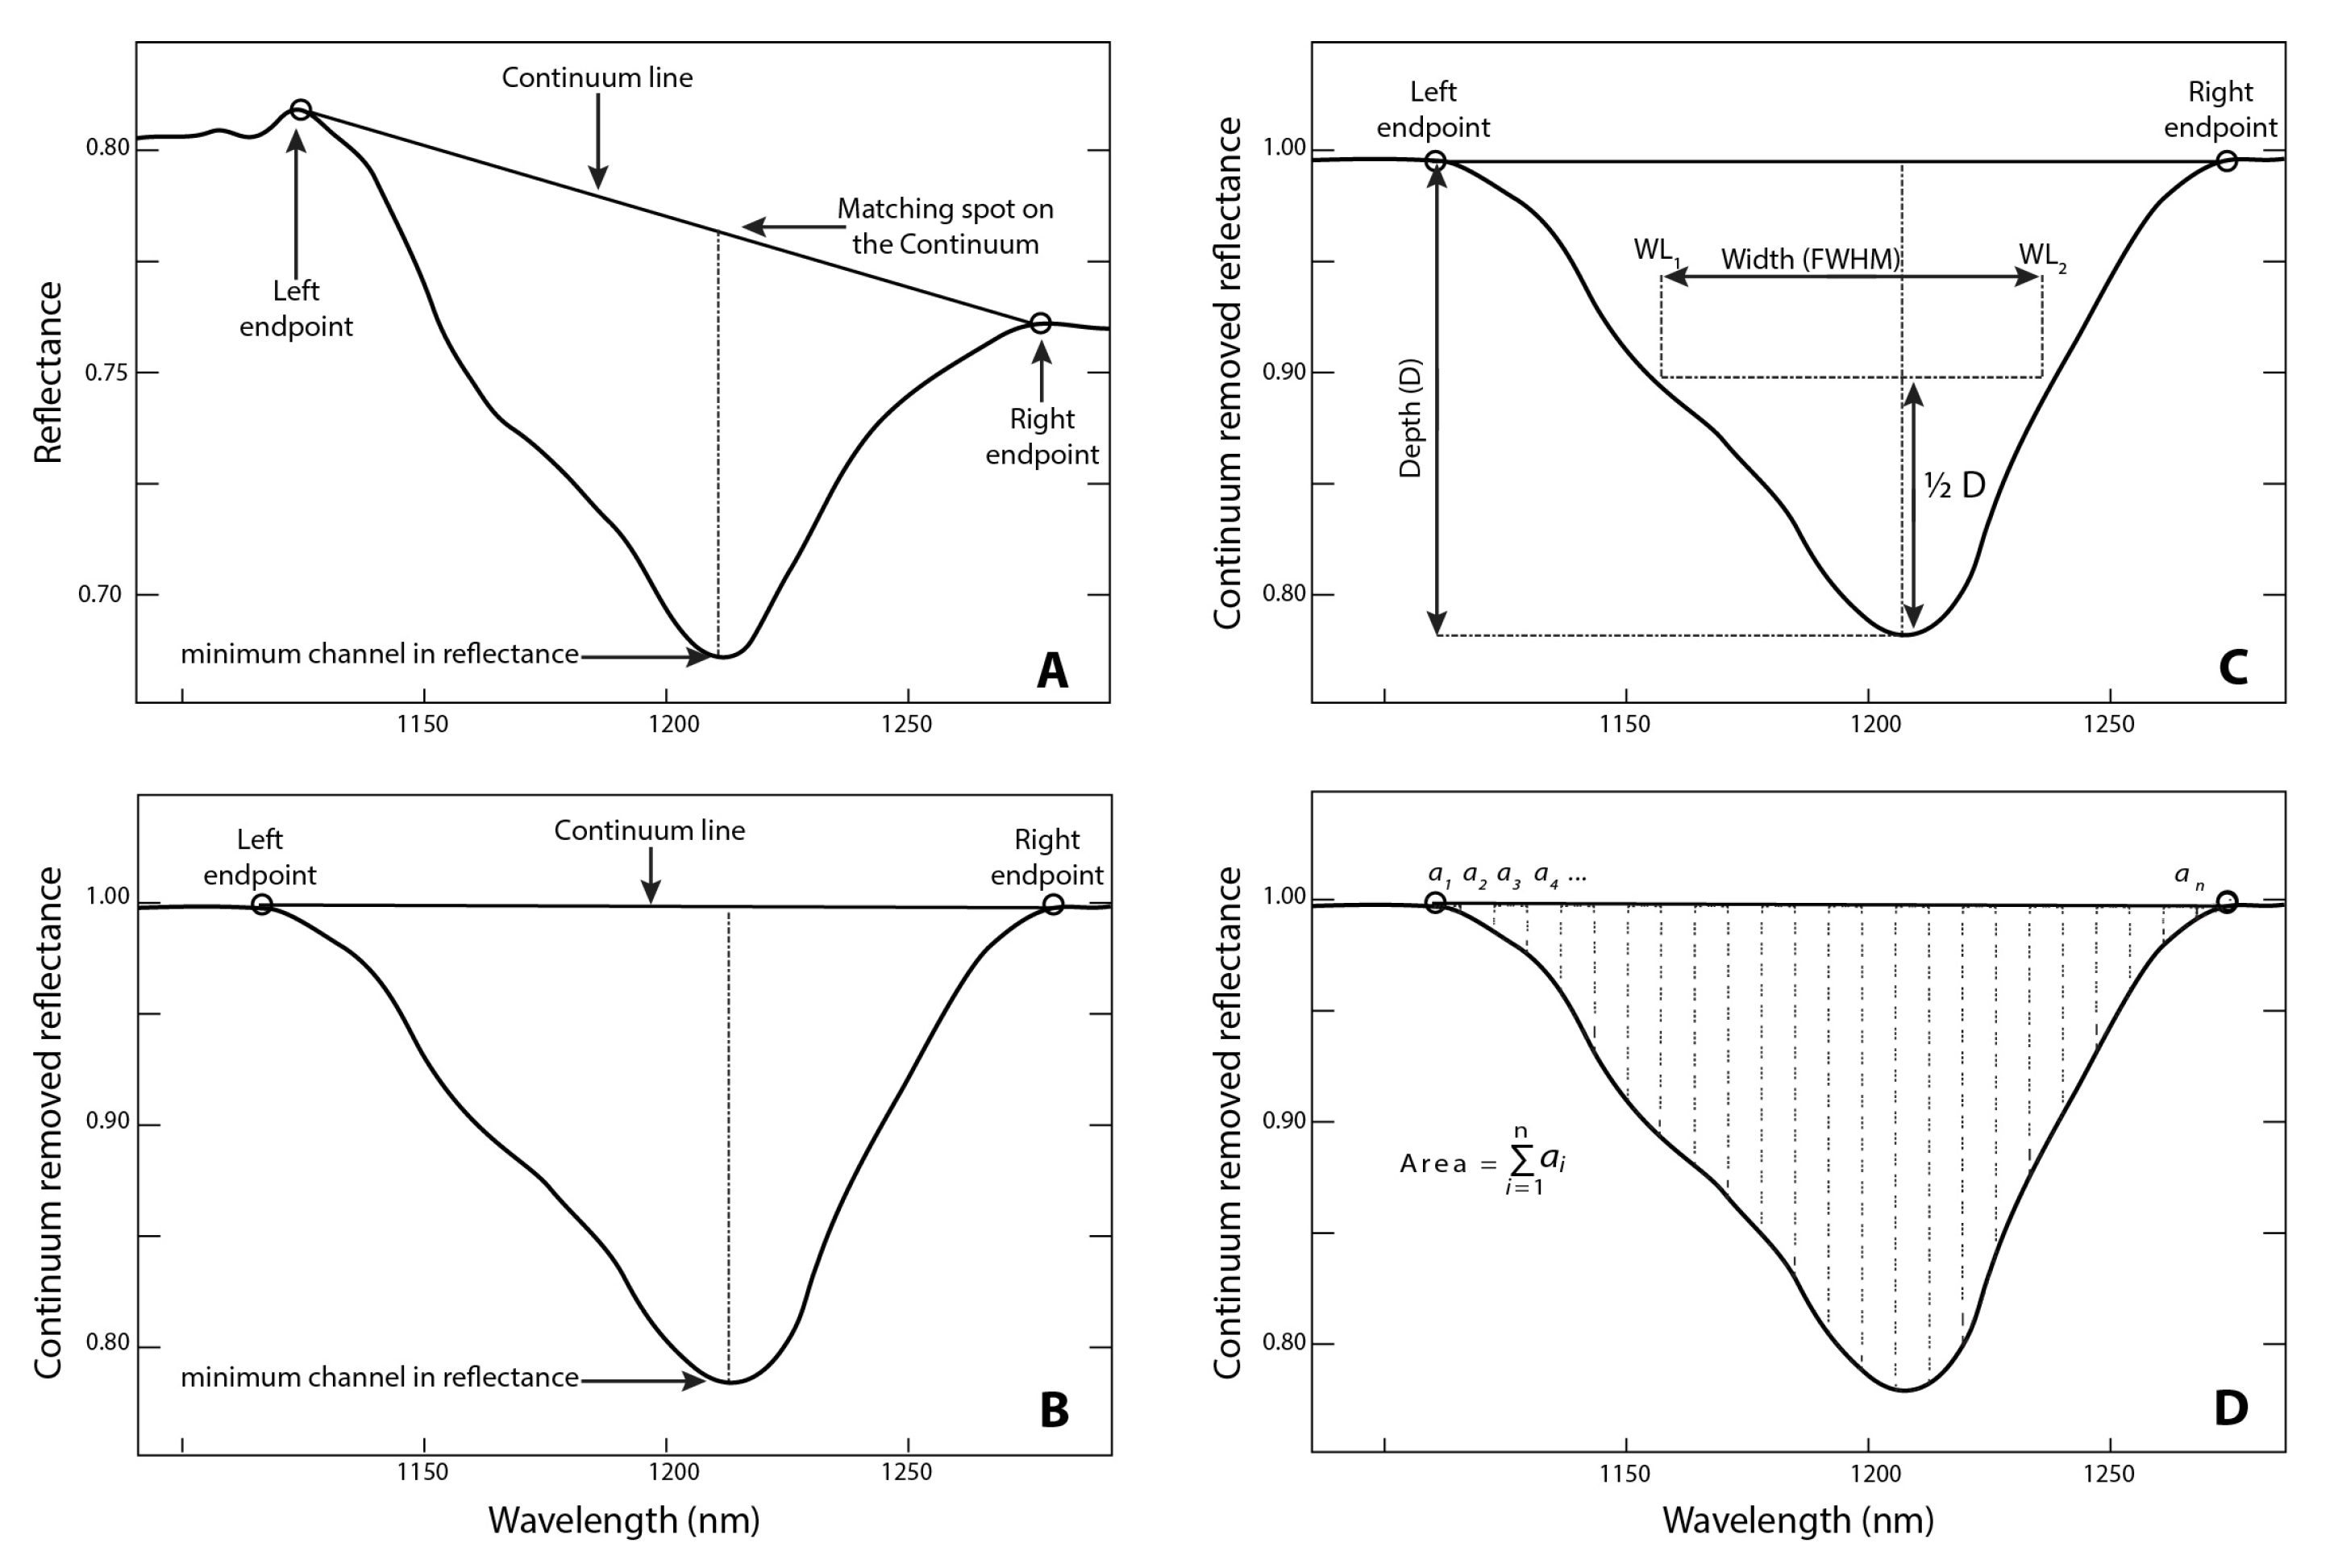
Continuum removal was applied to the smoothed and corrected spectra to isolate and analyse absorption features [42]. The continuum-removal was performed using the PySptools toolkit in Python 3 [43], which follows the methodology outlined by Clark et al., 1984 [42], and is based on PRISM routines in IDL developed by Kokalay [41] for extracting spectral features and their associated statistics. A straight line segment is used to connect the points of least absorption on either side of an absorption feature (see Figure A3 for an illustrated example).
Once the continuum removal was done, the key absorption features for each plastic group were identified. For plastics of known polymers (the virgin plastics), the absorption features identified were also compared to those published in other spectral libraries. For the plastics of unknown type (marine plastics from the Cocos (Keeling) Islands), the key absorption features were not compared to other sources. To assess the separability of the plastic scenarios from the sand-only scenario, Mann–Whitney U-tests were performed, comparing each surface cover increment to the sand control, with = 0.01.
To assess the differences between the different plastics, spectral feature analysis (SFA) was used to determine the point of maximum absorption within spectral features, the area, and the width of spectral features, measured as the full width at half maxima (FWHM) [41]. SFA is commonly used in the remote sensing of vegetation and is used for discriminating between spectrally similar items like photosynthetically active vegetation. It was also used by Guffogg et al. [31] to assess the relationship between surface cover of plastics and spectral absorption shape and depth, though they were not successful in establishing a relationship. Here, the parameters of feature depth, feature area and FWHM were determined.
3. Results
3.1. Spectra of Marine-Harvested and Virgin Plastics
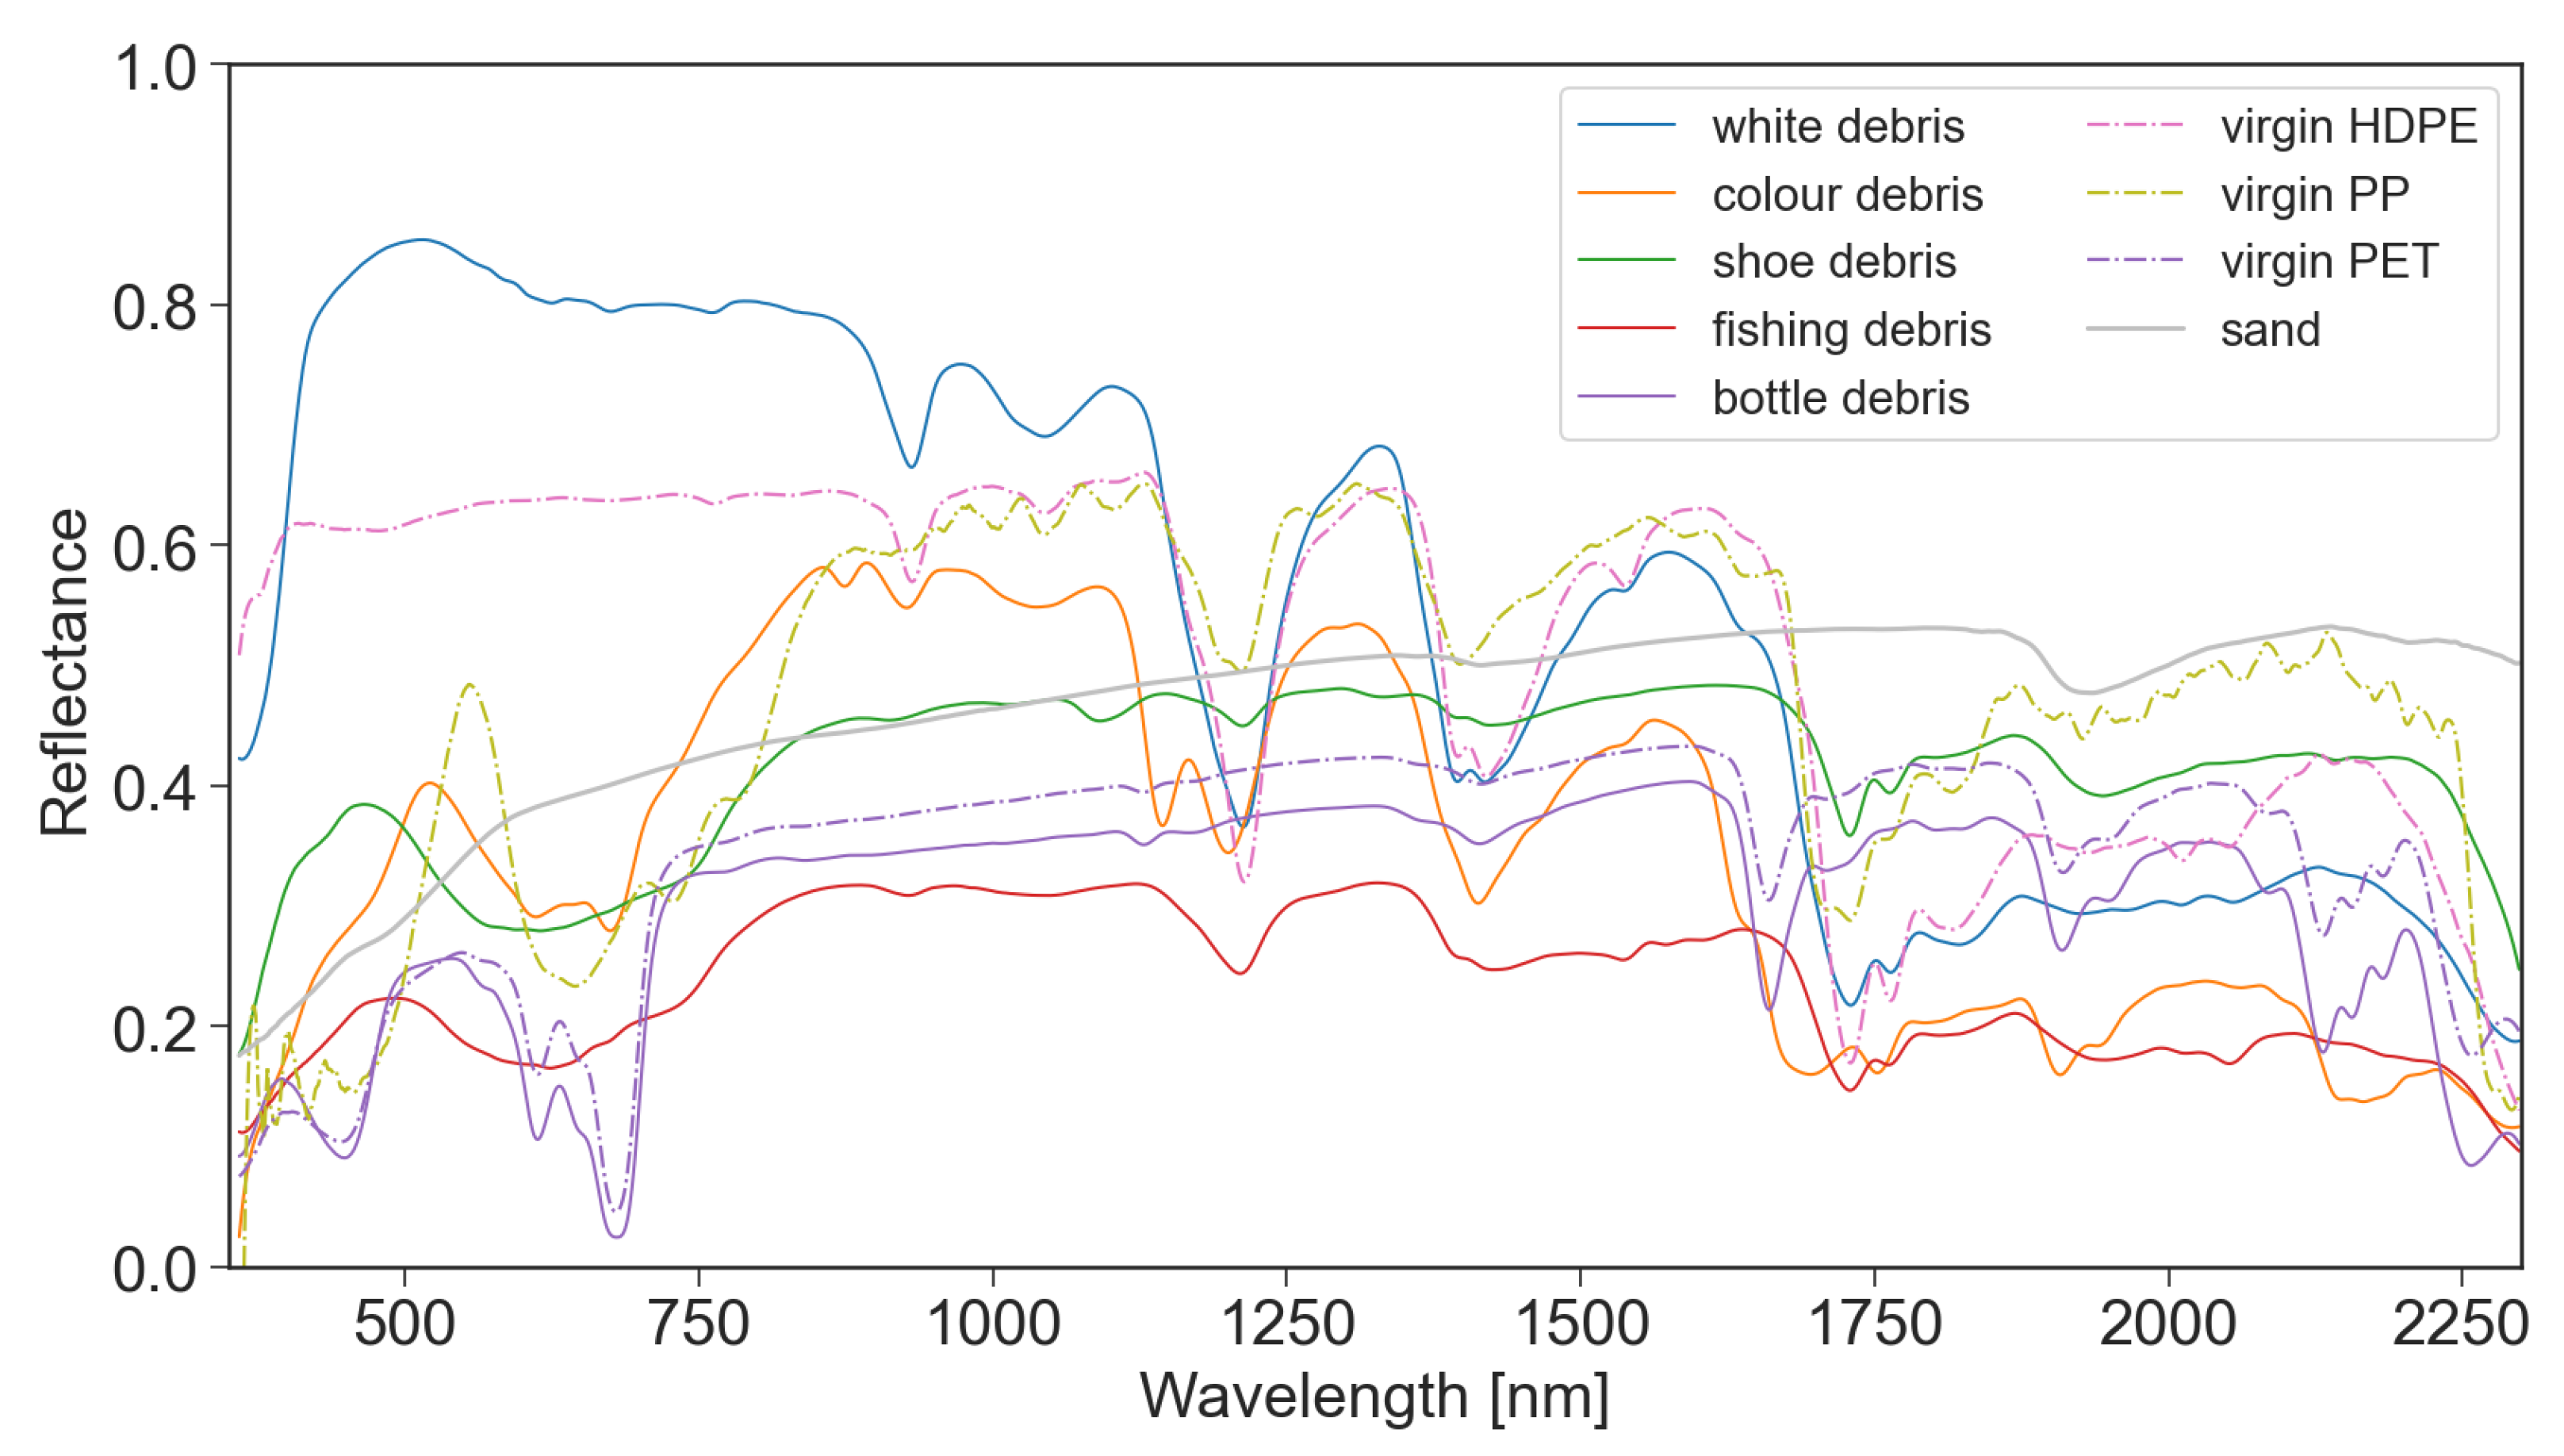
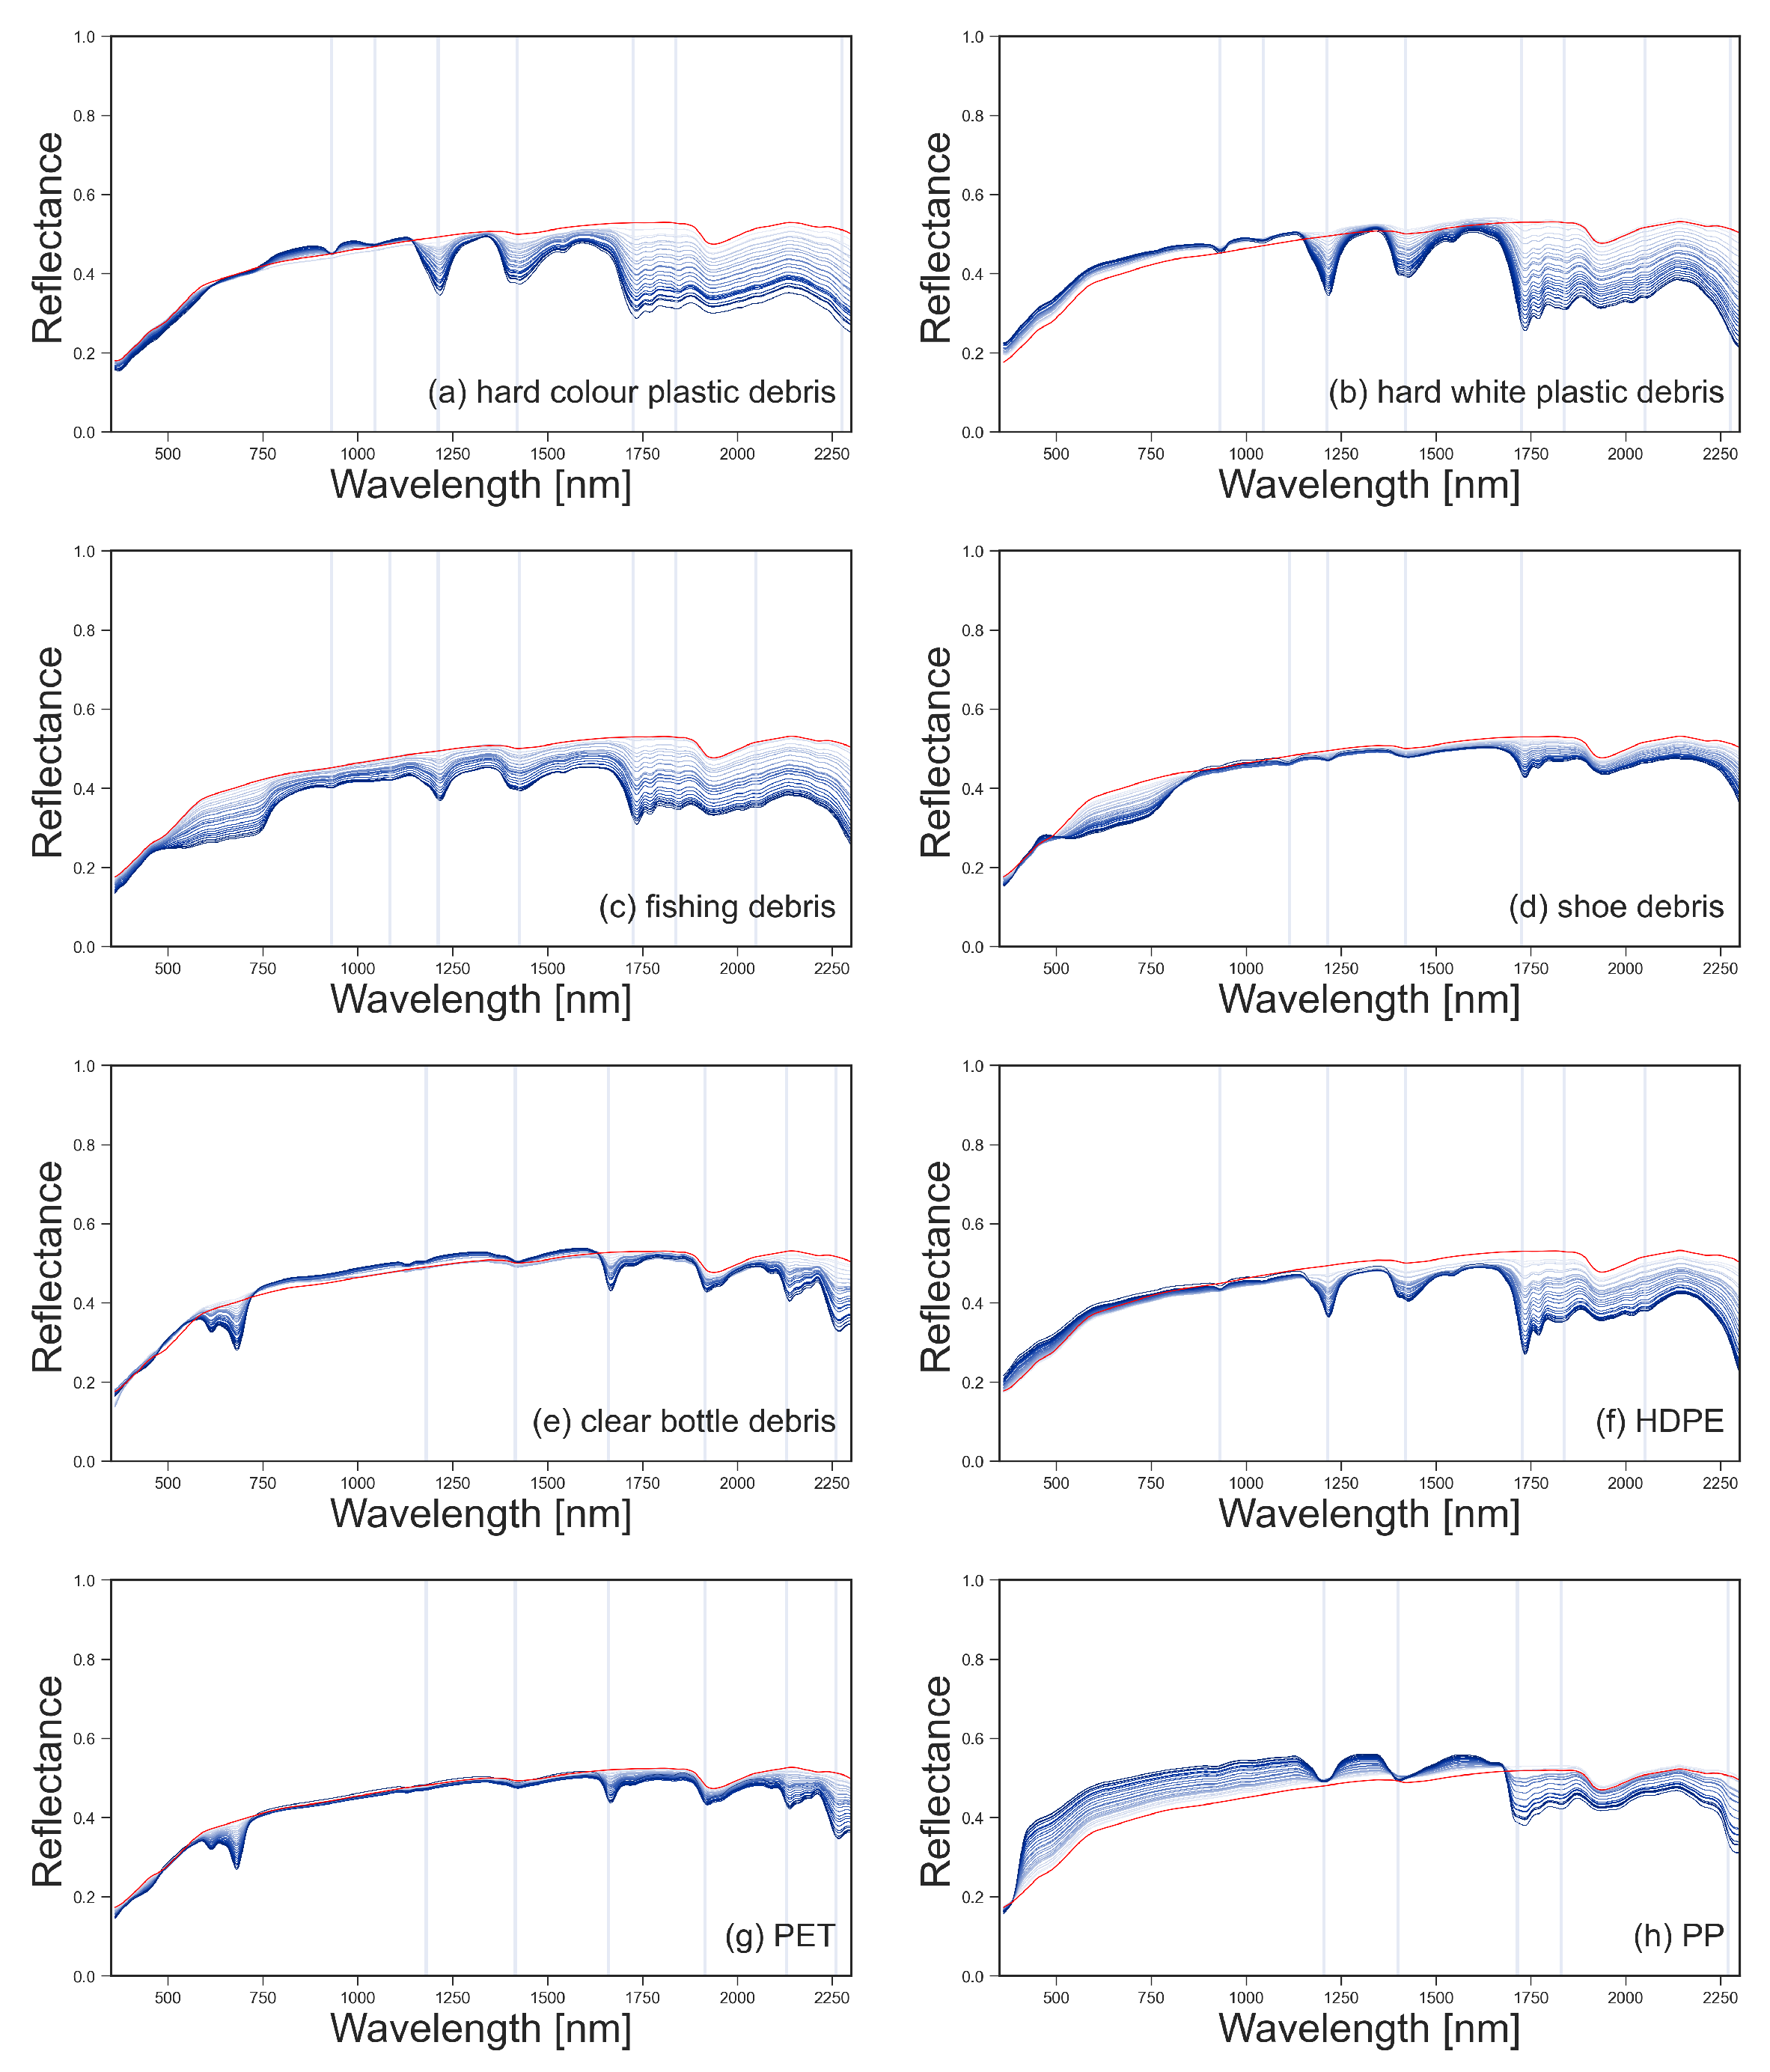
The spectral reflectance of all plastics were collected at 100% surface cover, as shown in Figure 3. The reflectance of the plastic groups varied between 350–850 nm due to physical properties like colour and transparency. Polymer-related absorption features were identified across the plastic groups between 900–2260 nm, as shown by the vertical lines in Figure 4. The continuum removed reflectance of plastics between 1–25% surface cover are shown in Figure 4, with the reflectance of sand (0% plastic surface cover) shown as a red line. The absolute reflectance of the plastic groups can be found in Figure A4. Some plastics exhibited increased reflectance in the VNIR when compared to sand. Lighter and more opaque plastic fragments showed higher reflectance than dark coloured items. PET, both weathered bottles and virgin plastic, showed little variation in reflectance outside of the polymer and colour related absorption features, despite increasing surface cover.
The reflectance of the sand was consistent throughout the experiments with Mann–Whitney U-tests confirming there were no significant changes in reflectance between readings. The sand had two absorption features that were consistently observed in all sand reflectance gathered; at 1418 nm with a 3% drop in reflectance and 1934 nm with a decrease in reflectance of 11% (Figure 4). Some of the plastics tested have absorption features at similar wavelengths; the hard white and coloured plastics showed small absorption features around 1931 nm and the weathered bottles at 1915 nm, overlapping with the absorption feature of the sand (Figure 4).
Mann–Whitney U-tests were also used to determine at what surface cover the different plastic groups became statistically separable from a sand only scenario. Our results showed that, for the plastics tested, in laboratory conditions where light is controlled for, surface covers of less than 8% could be separated from the sand-only scenario using at least one of the plastics absorption features (Table 3). White marine-harvested debris, coloured marine-harvested debris and HDPE required the least plastic cover to separate from sand (2%) while virgin PET required the highest surface cover of plastics (8%) (Table 3). It is expected that, if the scenarios were repeated in the environment, the minimum required surface cover would be higher. This can be seen by comparing data that was collected in the field with laboratory replicas in Section 3.2; the 95% confidence intervals for the field data are wider than those collected in the lab, while the median values are similar.
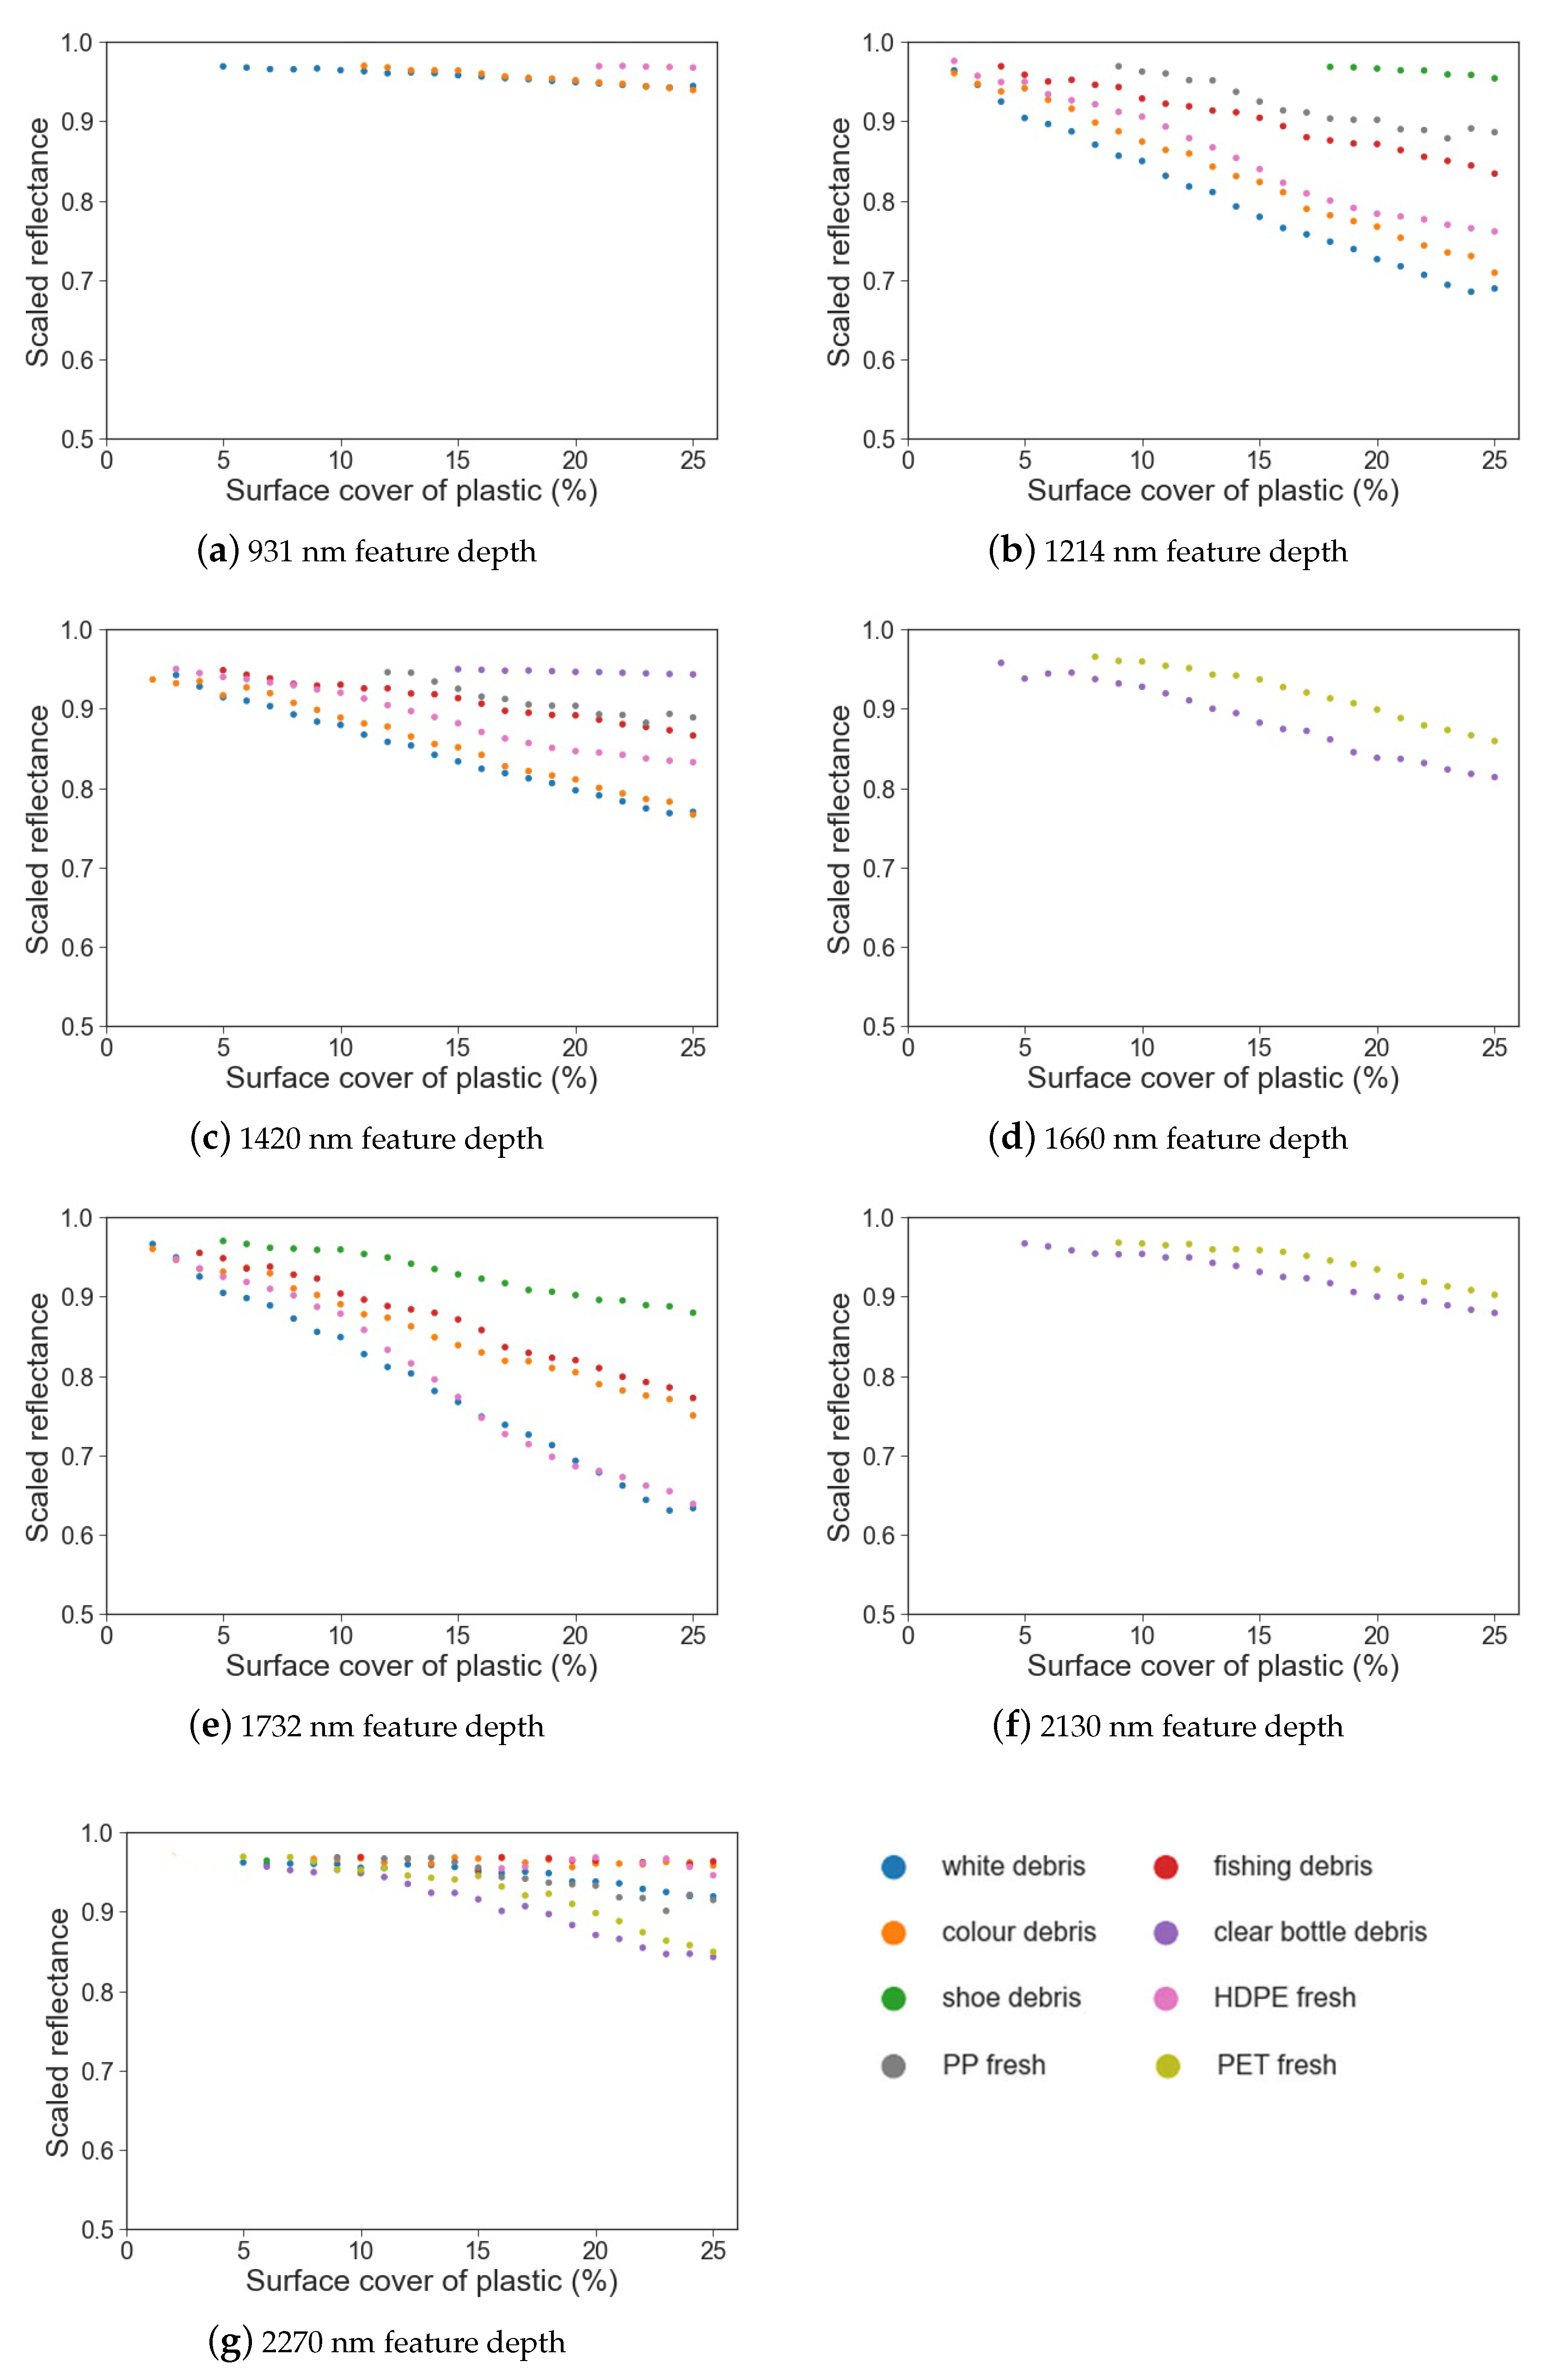
The spectral feature parameters of feature depth, area and FWHM were plotted against surface cover for the plastic-related absorption features present in the different groups (Figure 5, Figure 6 and Figure 7). While this process was done for all plastics, only absorption features that were statistically significant when compared to the sand control group are included in the figures. For example, only the virgin and weathered PET plastics showed statistically different absorption at 1660 nm when compared to sand, and so in Figure 5d, Figure 6f and Figure 7d, they are the only plastic included. As PET did not have an absorption feature at 1214 nm, it is not included in Figure 5b, Figure 6b and Figure 7b. Thus, all plastics with an absorption feature at a given wavelength are grouped, allowing for comparison of feature parameters, and also distinguishing plastics that can be grouped by the presence of a particular absorption feature.
White and coloured MPD and HDPE have an absorption feature at 931 nm and can be separated from sand at 5%, 11% and 21% surface cover; however, the drop in reflectance for these plastics was less than 10%. At 2130 nm, both PET samples have an absorption feature; the weathered sample is separable from sand at 5% surface cover and the virgin sample at 9% (Table 3); however, for both plastics, the feature is small, with reflectance within the feature dropping by 6%. Similarly, the feature noted at 2270 nm is small.
When comparing the white, coloured and fishing MPD samples, it can be seen that, while absorption features at 1214 nm, 1420 nm and 1732 nm are present for each group, the magnitude of the feature differs (Figure 5). At 1214 nm, absorption depth varies between 32% and 3% reflectance. White and coloured MPD and HDPE could be separated from sand with surface covers of 2% or more at this feature. At 1732 nm, while the white MPD still showed the strongest absorption depth (37%), the coloured debris showed weaker absorption (24%). The shoe debris group showed statistical difference from sand at 1732 nm at 5% surface cover, compared to 18% at 1214 nm; the maximum feature depth at 25% surface cover was the smallest of the plastics at both features (4% at 1214 nm and 12% at 1732 nm). Similarly with the virgin plastics, absorption features at 1214 nm and 1732 nm had differing magnitudes.
Comparing virgin and weathered PET, both have absorption features at 1660 nm; however, the weathered PET exhibits greater absorption (19%) when compared to the virgin samples (14%). Likewise, these were the only two plastics to have an absorption feature at 2130 nm. It is worth noting that both plastics were the same type of object; a green, translucent soft drink bottle. The absorption feature around 1732 nm is present in all plastic groups except for the two bottle samples (Figure 4). For both absorption features, the trends in feature depth, feature area and FWHM are similar.
Simple linear regression was used to examine the strength of the relationship between feature depth, area and FWHM and the surface cover for each plastic group (Table 3). While the strength of the relationship between the parameter (depth, area or FWHM) and surface cover varied between plastic groups, it was found that feature depth had a strong negative linear relationship with surface cover (r2 0.68–0.97) and feature area had a strong positive relationship (r2 0.85–0.98).
The feature area showed a trend of increasing values with surface cover for the absorption features at 1214 nm, 1660 nm and 1732 nm, and a minor increase with surface cover for features at 931 nm, 2130 nm and 2270 nm. However, the small size of these absorption features make it difficult to draw conclusions regarding trends in feature area.
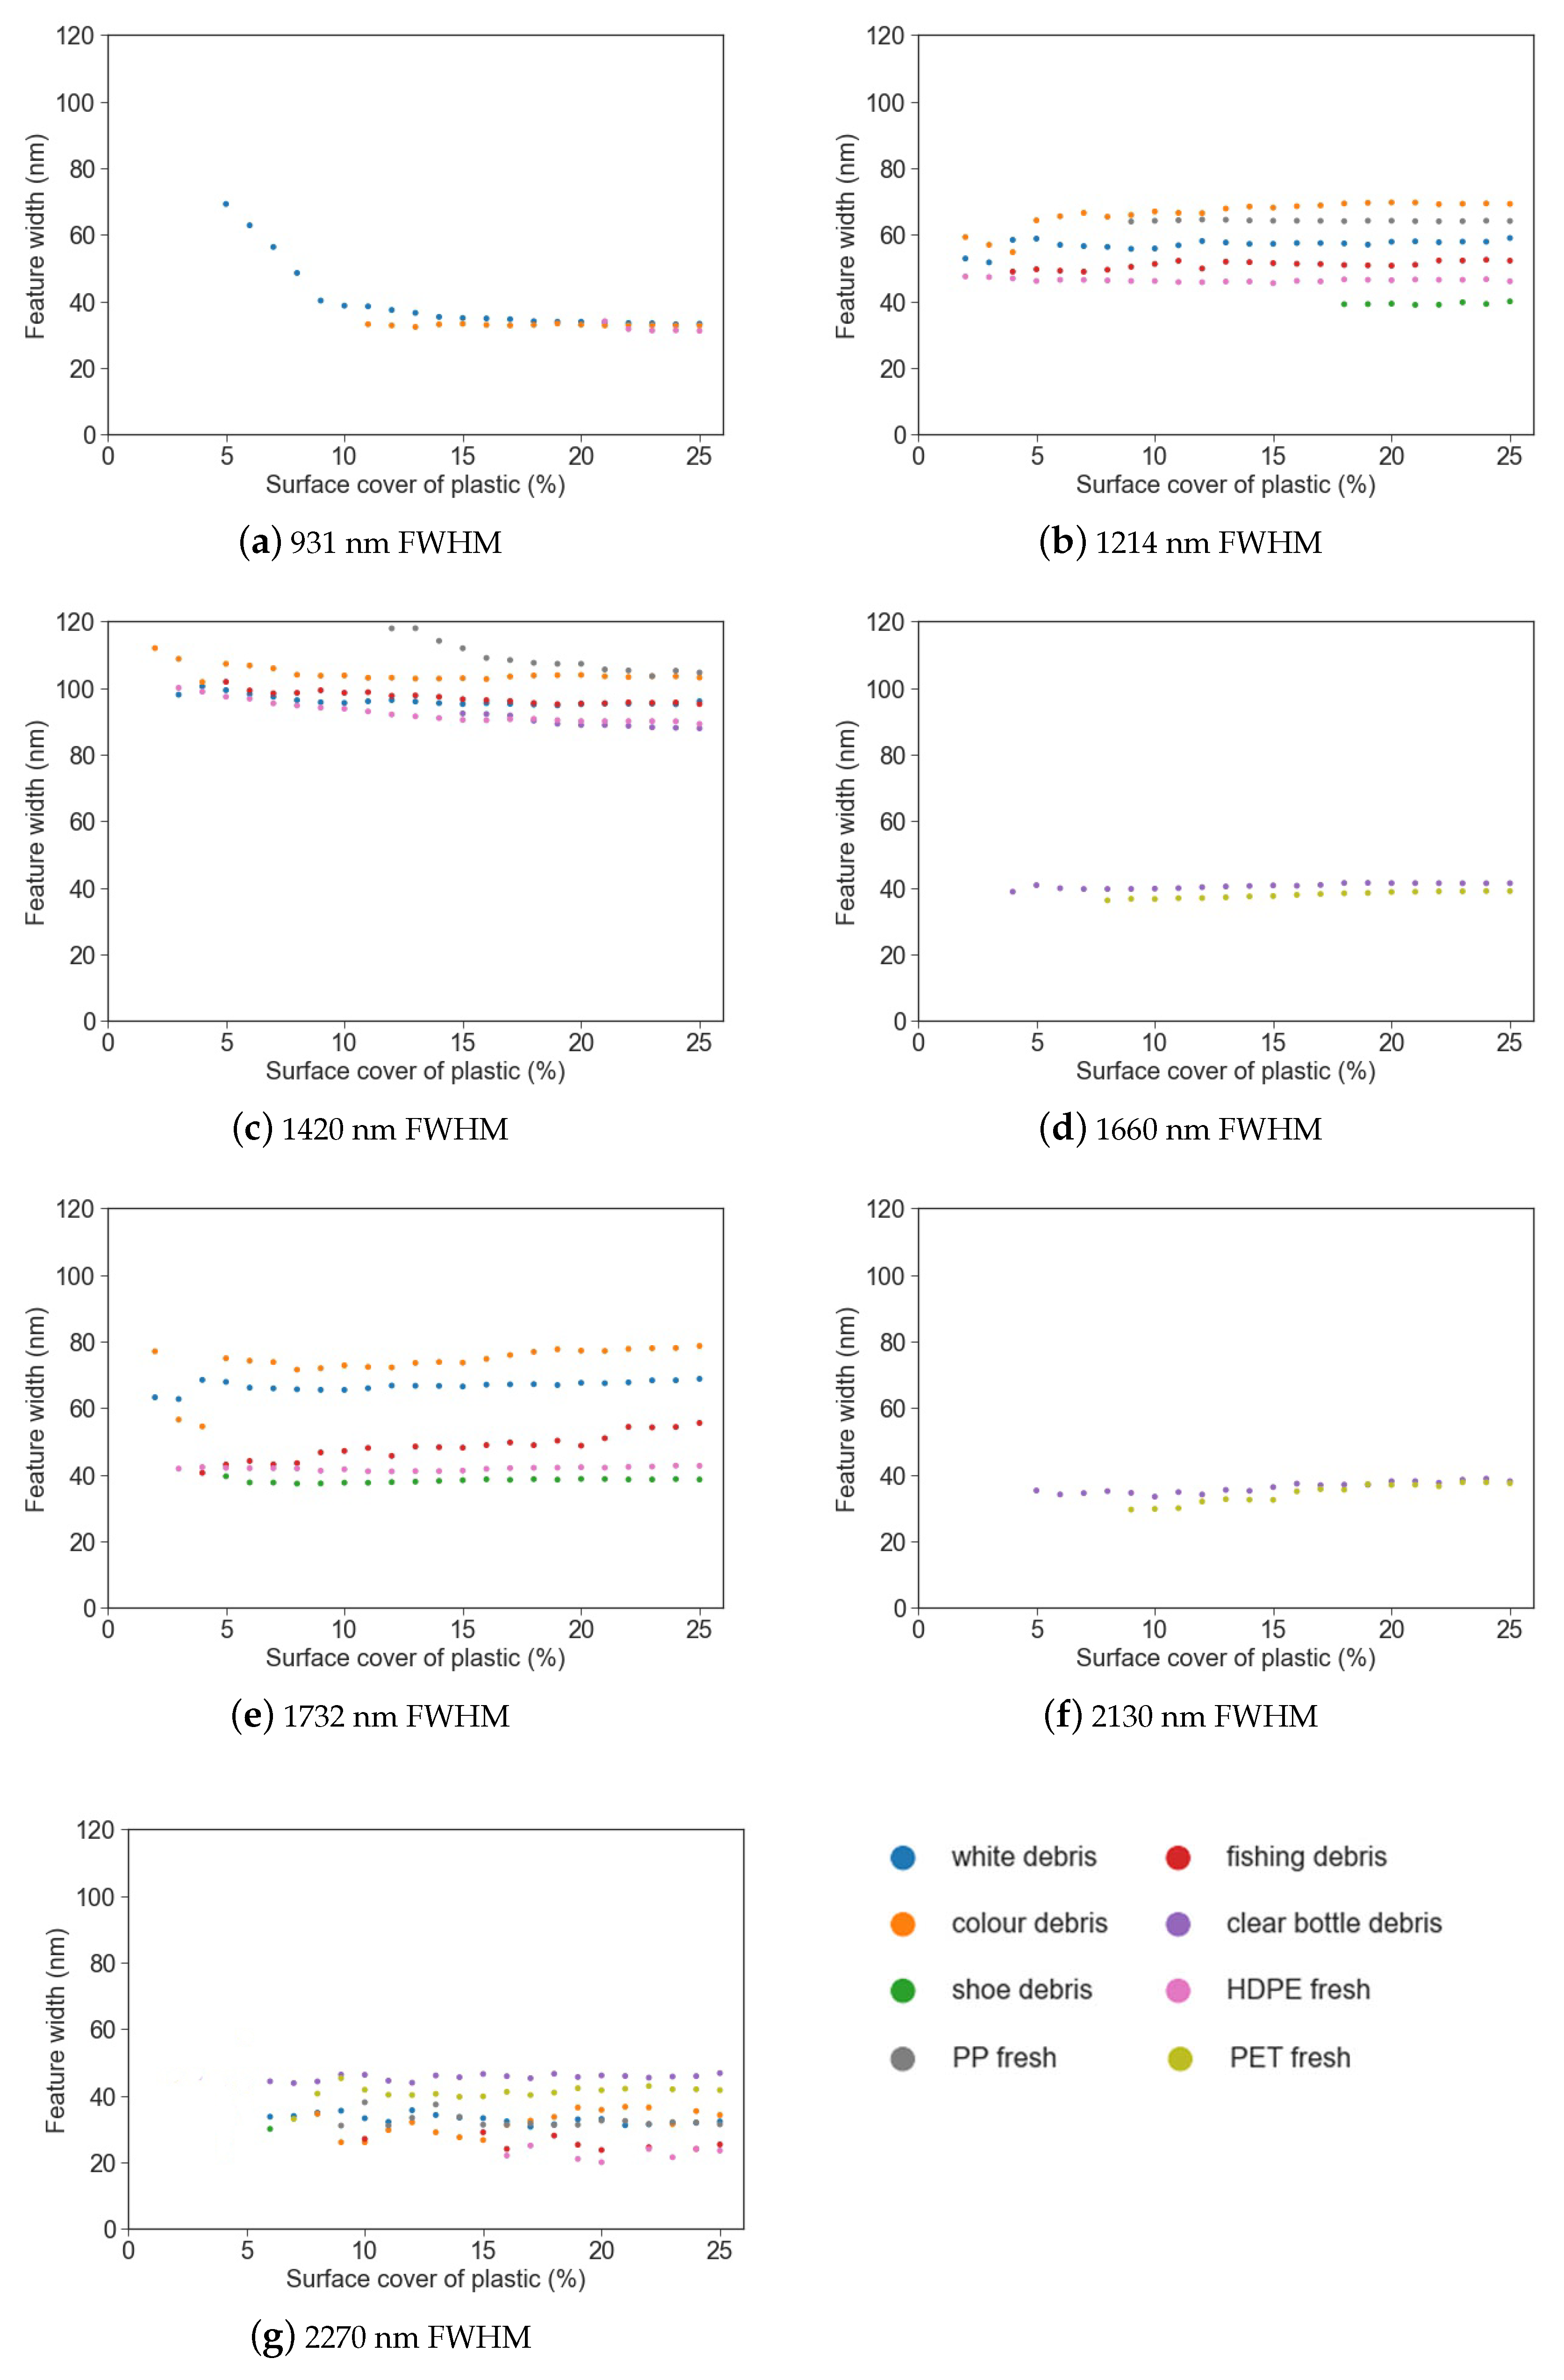
FWHM remained consistent despite increasing surface cover around 1214 nm, 1660 nm and 1732 nm (Figure 7f), with the trend remaining near horizontal above 5% surface cover. While FWHM exhibited strong relationships with surface cover (Table 3), there was no trend of either increasing or decreasing FWHM with surface cover; the trend was flat (Figure 7). Thus, while the strength of this association is significant, there is no useful trend that can be derived from FWHM. The exception was white debris at 931 nm, which showed a lessening trend in FWHM between 5–10%, followed by a horizontal trend.
The most commonly found spectral maxima were at 1214 nm, 1420 nm and 1732 nm. The spectral maxima for PP was offset from the other plastics around these features (1211 nm and 1415 nm), resulting in lessened spectral absorption when compared to the other plastic groups. The least common absorption features were at 1660 nm and 2130 nm, being present only for the virgin PET plastic and the marine-harvested bottles. In the absorption features that can separate plastics with less than 10% surface cover (1214 nm, 1420 nm, 1732 nm and 1660 nm), a significant relationship was observed for both feature depth and feature area (Table 3).
3.2. Comparison to Field Data
Five 1 m2 quadrats were set up on a beach in the Cocos (Keeling) Islands in February 2020, filled with plastic and spectral reflectances that were collected as described in the methods. The surface covers recorded in the field were then repeated in controlled laboratory conditions; the reflectance and the continuum-removed reflectance for these two data sets are shown in Figure 8. Overall brightness varied between the two sets of data, with the field readings showing a gradual decrease in reflectance as wavelength increased, while no such trend was observed in the laboratory data. This can be explained by the presence of water in the sediments; the laboratory data did not show the reduction in reflectance with increasing wavelength because the sand used was thoroughly dried beforehand.
When comparing the continuum-removed reflectances, a high degree of similarity was observed within the SWIR absorption features beyond 1500 nm (Figure 8 and Table 4). The absorption features around 1214 nm showed greater disparity, with a common absorption feature around 1180 nm present in the field observations, causing increased absorption when compared to the laboratory observations. This absorption was also noted by Guffogg et al. [31] who attributed it to water absorption around 1180 nm. There were some variations seen between the field and laboratory observations for plastic bottles; a variety of plastic bottles, predominantly transparent or lightly coloured blue and green translucent plastics, were sourced in the field. However, for the laboratory setup, a single colour and type of bottle was used, a green soft drink bottle. This resulted in absorption in the visible spectrum for the laboratory sample (the green bottle) that was less pronounced in the field samples, where the majority of the bottles were non-coloured or light blue.
Table 4 compares the feature depth, area and FWHM for the absorption features that were separable in both the field and laboratory datasets. Some of the features present in the laboratory were not distinguishable in the field data; increased noise and the presence of organic matter like bamboo and seaweed may have contributed to a lack of separable features. For white, coloured, shoe and fishing debris, features at 1214 nm and 1732 nm were observable in both datasets.
4. Discussion
The spectral reflectance from 350–2200 nm of virgin and weathered plastic samples were studied at a variety of sub-pixel surface covers (fractional cover), over a consistent background of bright sand. All plastics observed showed increasing absorption within key spectral features as surface cover increased between 1–25%. Our results indicate that, in the best-case scenario that we have explored, between 2–8% surface cover of plastics is needed for detection (Table 3). The plastic that required the highest fractional cover for detection was the virgin PET scenario; given the documented impacts of item transparency on absorption feature magnitude [44], this was expected. Our study differs from those previously published in the use of a sandy background and the inclusion of spectral feature analysis of feature depth, area and FWHM. Our results agree with findings from earlier publications, including characteristic absorption features shared by several plastics at 1214 nm and 1732 nm [34,35] and the identification of different absorption peaks for different weathered plastics [36].
Variation in the magnitude of absorption was noted between the plastic groups. Hard white and coloured debris, fishing debris and shoes have an absorption feature at 1732 nm, and for each group the relationship between feature depth and surface cover is strong (Table 3). However, absorption at the feature maxima at 25% surface cover varied from 0.62 to 0.87 between the groups (Figure 5f). A similar trend was observed at 1214 nm; absorption at maxima at 25% surface cover varied between the different groups (0.68 to 0.95, Figure 5b). For plastic debris detection methods over water that use the increased brightness of a pixel containing floating matter to separate pixels of interest [26], this may not be a problem. However, for detecting plastic debris against terrestrial backgrounds where absorption features are used [45], this poses a challenge for accurately quantifying sub-pixel plastic cover. For future endeavours attempting to quantify the volume of debris within a pixel, these variations in absorption magnitude may produce under-estimations of debris.
We found that there was a moderate to strong linear relationship between feature absorption depth at maxima and surface cover within the absorption features at 1214 nm, 1660 nm and 1732 nm (Table 3). These are the absorption features with the greatest magnitude among the different plastic types analysed in this study that do not fall within an atmospheric window. The absorption feature at 2270 nm, while not present in all groups, is also suitable for detection of some plastics at low surface covers. This absorption feature may also be useful for discriminating between different plastics [46].
While several plastics had strong absorption around 1420 nm (Figure 4), this feature is of limited use given atmospheric interference [47]. Similarly, while the absorption feature at 931 nm had a strong linear relationship with surface cover, it was only detectable for some plastics at a relatively high surface cover. Additionally, its small size and proximity to an atmospheric water vapour absorption band around 900 nm complicate the use of this feature for plastic detection [31,34]. Some other absorption features identified in previous studies were not suitable for detecting plastics at low surface covers; PET features at 1130 nm and 1910 nm, identified as useful for recycling [33], overlapped with a sand absorption feature and were not statistically separable from sand. A general plastic absorption feature identified at 2046 nm by Garaba and Dierssen [34] could not be statistically separated from sand in any of our samples and thus is not shown.
The absorption features in the NIR-SWIR (900–2300 nm) are the result of light absorption by polymers, in the first overtones involving stretching of carbon-hydrogen (C-H) and oxygen-hydrogen (O-H) bonds [48]. In the visible spectrum, reflectance was affected by the colour and opacity of the objects (Figure 4); however, this did not appear to impact the location of the absorption feature maxima in the NIR-SWIR. This supports the findings of Garaba et al. [32] who, likewise, found that, while object colour affected overall reflectance, it did not significantly influence SWIR absorption feature location. However, another investigation of multiple coloured samples of plastic found that the colour of plastic items did impact the shape and presence of absorption features in the SWIR and MIR [33]. As such, we recommend further investigation of the effect of object colour and transparency on SWIR absorption features.
Moroni et al. [49] noted that, for opaque PET items, absorption features were present at 1130, 1170, 1430 and 1660 nm, but transparent PET items had a flat spectral signature. As expected, given our items were transparent, we did not find the absorption features at 1130, 1170 and 1430 nm; however, despite item transparency, the absorption feature at 1660 nm was indeed present and useful for separating PET samples from the sand background. We also noted a feature at 2130 nm (Figure 5f) that was also useful for separating the PET samples from sand (Table 3).
The beach-harvested PET had a more opaque, weathered surface when compared to the virgin PET sample. The variation in minimum detectable cover between virgin PET and beached-harvested PET can be explained by degradation of the surface resulting in increased opacity. In addition to being detectable at lower surface covers, the beach-harvested PET had more intense absorption at 1660 nm and 2130 nm (Figure 5d,f). Moroni et al. found that transparent PET had flattened reflectance and fewer detectable absorption features when compared to opaque PET samples [49], and Goddijn-Murphy [28], showed in their study that the magnitude of reflectance of key absorption features is tied to the transparency of a plastic item. Thus, the observed differences between the two samples in our study suggest that environmental degradation may impact the detection limits for some plastics and that, as weathering increases the opacity of an item, more intense absorption may be observed and a lower fractional cover of the plastic could be detected.
Given the focus on detecting plastic in open waters, studies of fractional cover so far have presented plastics on either a dark, low reflectance background [32] or in aqueous environments [28,44]. Plastics floating on or partially submerged in water will have lower reflectance and muted absorption features, thus making detection more challenging [32,34,35,44]. The impact of overall low reflectance was noted by Garaba and Dierssen, whose study of fractional cover found that the relationship between surface cover and absorption was consistent and linear above 20%, but below that there were nonlinear variations [32]. In contrast, as our experiment was designed to simulate a beach environment, the overall reflectance of our samples did not drop below 20%, thanks to the bright sandy background. This may explain why we observed strong linear relationships with feature parameters at low fractional covers.
We noted differences in reflectance between the laboratory observations and the field observations, with the latter showing an overall decrease in reflectance with increasing wavelength. Given that the data were collected on a beachfront in proximity to the ocean, this is likely due to increased moisture in the sand. Zhou et al. [45] recently developed a knowledge-based classifier for plastic debris using Worldview-3 imagery. This classifier made use of the spectral features at 1660 nm, 1730 nm, 2165 and 2205 nm. However, the classifier was tested on dry environments and so their efficacy may be reduced in a beach environment where additional moisture may impact these longer wavelength features. In regard to plastic debris co-occurring with organic debris, Moshtaghi et al. demonstrated that the spectral feature at 1732 nm can serve to separate plastics from wood [35], as wood has no spectral feature here.
Challenges and Future Work
An obstacle we note for spectral detection on some beaches, in particular for our study areas on the Cocos (Keeling) Islands, was the presence of a large volume of shoes, predominantly flip flops (also called sandals). While the exact composition of these items varies depending on the manufacturer (Havianas, one of the largest producers of flip flops, state they use a proprietary blend of materials [50]), polyurethane and synthetic rubbers are commonly used. While the shoes used in our experiments have some diagnostic absorption features, features in the same region as the other plastics tested, the magnitude of their response was smaller (see Figure 5b,e). While expanded polystyrene foams have been included in spectral libraries of marine harvested plastics [34,36,37], polyurethane foam has not been included so far.
Surveys conducted on the Cocos (Keeling) beaches indicate that shoes can make up 14% of the total surface cover of beached plastic debris [31]. Significant numbers of flip flops were also noted by Lavers et al., who estimated the Cocos (Keeling) Island beaches could host nearly 977,000 [9]. As such, their contribution to the bulk reflectance on these beaches cannot be dismissed. In contrast, there is relatively little fishing debris on the Cocos (Keeling) islands (1.6%), despite fishing debris being one of the largest contributors to marine plastic debris within ocean gyres [9,10]. It may be that some a priori information will be needed to fine-tune plastic detection algorithms to improve outcomes for different regions.
The point of maximum absorption within the absorption features in our study, and those of other published studies, vary slightly; this is a documented phenomena, due to individual variations between devices used to capture reflectance data [41]. Despite minor variations in feature maxima, our results show good agreement with those in the broader literature [34,46]. While the effects of anisotropy have been investigated in previous studies [28,32], they are still not fully understood and so effort was taken to keep all of the plastics at the same orientation, the sensor at nadir and contribution from surrounding material consistent. However, for the marine harvested debris, we acknowledge that items of varying thickness, and items with curved surfaces, were part of the makeup of our study, and so anisotropy may be an influence in our results.
Finally, there is some evidence that fragment size impacts the strength of absorption, with Balsi et al. [36] finding that smaller fragments of the same types of plastic, such as flakes and granules, had more pronounced trends than the same type of plastic when measured as a single, larger piece [36]. We endeavored to keep our plastic debris items a homogeneous size to control for this factor; however, further research should examine the impact of fragment size on comparable surface covers.
5. Conclusions
This work presents the spectral characterisation of beached marine plastic debris (MPD) and virgin plastics of known polymers as fractional cover over sand. The marine plastics were collected from the Cocos (Keeling) Islands, in the Indian Ocean, as was information about the relative proportions of plastic groups in that setting. It was found that between 2–8%, depending on plastic polymer, of a unit area must be covered in plastic before the material can be spectrally separated from a non-contaminated area only containing sand. In addition to indicating the minimum detection limits in a controlled environment, our results also indicate that the minimum cover of MPD detectable is partly dependent on what types of plastics are present. Given variation in both the size and location of absorption features observed in this study, a priori information on major plastic types in different regions may be needed to fine-tune plastic detection algorithms and improve outcomes. Our results represent a best-case scenario with controlled variables; however, more complexity is expected in an outdoor environment when co-occurrences with organic debris, uneven surfaces and changing light conditions also come into play. Of the plastic absorption features examined, those at 1214 nm, 1660 nm and 1732 nm had strong absorption, linear relationships with feature depth and do not overlap with water or atmospheric absorption bands, making them candidates for spectral detection methods.
Author Contributions
Conceptualisation of study and methodology used, J.A.G., S.M.B., S.D.J. and M.S.-B., data collection and curation by J.A.G., S.M.B., C.J.B., S.D.J. and M.S.-B., analysis by J.A.G. and S.M.B. Project supervised by A.K.S. and S.D.J. All co-authors contributed to original draft preparation and review and editing. All authors have read and agreed to the published version of the manuscript.
Funding
J.A.G. is supported by an Australian Government Research Training Program Scholarship from RMIT University Australia. A.K.S. has received funding and support from the European Research Council (ERC) under the European Union’s Horizon 2020 research and innovation programme (Grant No. 834709).
Data Availability Statement
Data is available upon request from the Authors.
Acknowledgments
We thank Eija Aeonn, Jennifer Lavers and James Bradley for their assistance in the field, Liza and Mike Dicks for providing accommodation, and members of the Cocos community including Kylie James, Ash James, Peter McCartney and Cat McCartney for transport and logistics assistance. A.K.S. supported by the European Commission ‘BIOSPACE Monitoring Biodiversity from Space’ project (Grant No. ID 834709, H2020-EU.1.1.).
Conflicts of Interest
The authors declare no conflict of interest.
Appendix A
Figure A1.
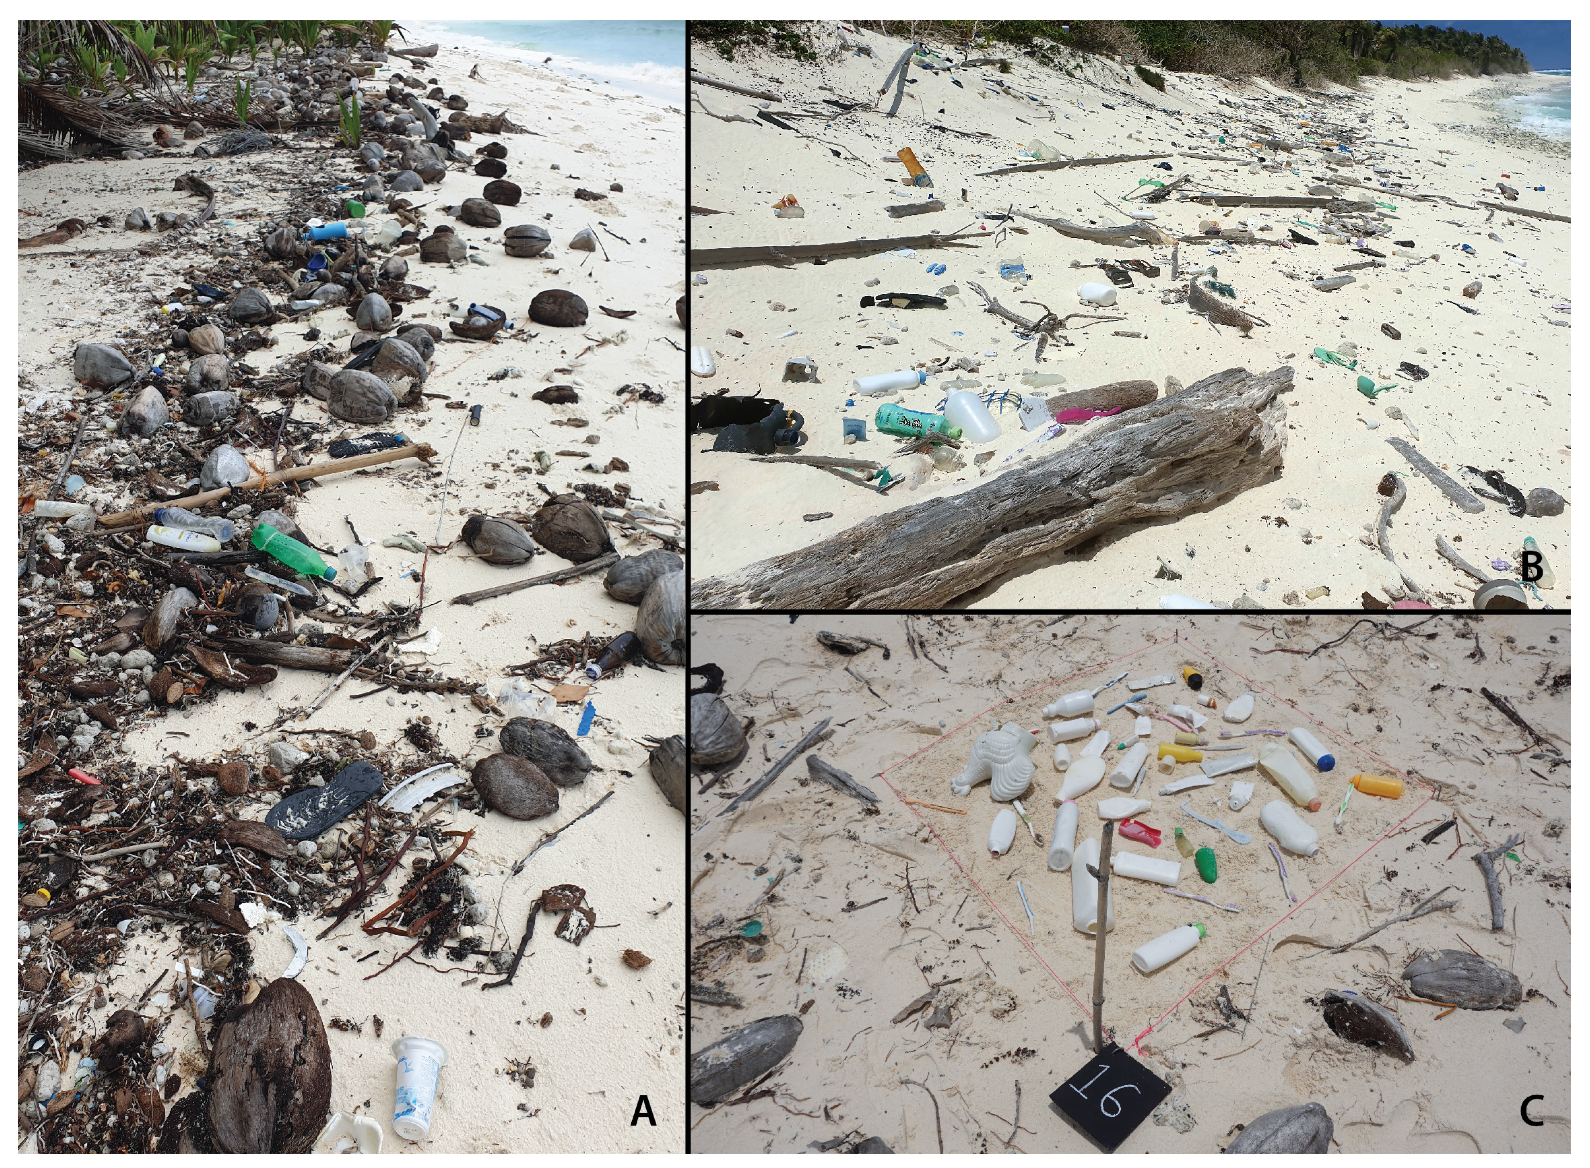
Marine plastic debris (MPD) on the Cocos (Keeling) Islands, February 2020 (A) Northern ocean-facing beach on West Island; (B) Southern ocean-facing beach on South Island; (C) a quadrat setup with an artificially created MPD surface cover of 25% hard, white plastic debris.
Figure A1.
Marine plastic debris (MPD) on the Cocos (Keeling) Islands, February 2020 (A) Northern ocean-facing beach on West Island; (B) Southern ocean-facing beach on South Island; (C) a quadrat setup with an artificially created MPD surface cover of 25% hard, white plastic debris.

Figure A2.
Setup of the ASD Fieldspec® Pro 4 for the laboratory component of the experiment. Plastic fragments covering 1% of GFOV were placed into the sand box to capture fractional cover readings.
Figure A2.
Setup of the ASD Fieldspec® Pro 4 for the laboratory component of the experiment. Plastic fragments covering 1% of GFOV were placed into the sand box to capture fractional cover readings.

Figure A3.
Spectral feature analysis; (A) continuum endpoints used to determine the continuum line for the spectral absorption feature; (B) continuum-hull removed spectral absorption; (C) feature depth and feature width (full width at half-maximum and (D) feature area, calculated by summing the individual band depths of each channel within the continuum-removed spectral absorption feature. Figure reproduced with permission from [31].

Figure A4.
Spectral reflectance for marine harvested plastic debris (a–e) and virgin plastics (f–h), with surface covers from 1% to 25% shown in blue. Spectral reflectance of sand (0% plastic surface cover) is shown in red. The location of the absorption maxima for the spectral features is shown with vertical lines.

References
- Pham, C.K.; Ramirez-Llodra, E.; Alt, C.H.; Amaro, T.; Bergmann, M.; Canals, M.; Company, J.B.; Davies, J.; Duineveld, G.; Galgani, F.; et al. Marine litter distribution and density in European seas, from the shelves to deep basins. PLoS ONE 2014, 9, e95839. [Google Scholar] [CrossRef] [Green Version]
- Suaria, G.; Aliani, S. Floating debris in the Mediterranean Sea. Mar. Pollut. Bull. 2014, 86, 494–504. [Google Scholar] [CrossRef]
- Jambeck, J.; Geyer, R.; Wilcox, C.; Siegler, T.; Perryman, M.; Andrady, A.; Narayan, R.; Law, K. Plastic waste inputs from Land into the Ocean. Science 2015, 347, 768–771. [Google Scholar] [CrossRef] [PubMed]
- Borrelle, S.B.; Ringma, J.; Law, K.L.; Monnahan, C.C.; Lebreton, L.; McGivern, A.; Murphy, E.; Jambeck, J.; Leonard, G.H.; Hilleary, M.A.; et al. Predicted growth in plastic waste exceeds efforts to mitigate plastic pollution. Science 2020, 369, 1515 LP–1518 LP. [Google Scholar] [CrossRef]
- Bergmann, M.; Lutz, B.; Tekman, M.B.; Gutow, L. Citizen scientists reveal: Marine litter pollutes Arctic beaches and affects wild life. Mar. Pollut. Bull. 2017, 125, 535–540. [Google Scholar] [CrossRef] [PubMed] [Green Version]
- Barnes, D.K.; Walters, A.; Gonçalves, L. Macroplastics at sea around Antarctica. Mar. Environ. Res. 2010, 70, 250–252. [Google Scholar] [CrossRef]
- Law, K.L.; Morét-Ferguson, S.E.; Goodwin, D.S.; Zettler, E.R.; Deforce, E.; Kukulka, T.; Proskurowski, G. Distribution of surface plastic debris in the eastern pacific ocean from an 11-year data set. Environ. Sci. Technol. 2014, 48, 4732–4738. [Google Scholar] [CrossRef]
- Woodall, L.C.; Sanchez-Vidal, A.; Canals, M.; Paterson, G.L.J.; Coppock, R.; Sleight, V.; Calafat, A.; Rogers, A.D.; Narayanaswamy, B.E.; Thompson, R.C. The deep sea is a major sink for microplastic debris. R. Soc. Open Sci. 2014, 1, 140317. [Google Scholar] [CrossRef] [Green Version]
- Lavers, J.L.; Dicks, L.; Dicks, M.R.; Finger, A. Significant plastic accumulation on the Cocos (Keeling) Islands, Australia. Sci. Rep. 2019, 9, 7102. [Google Scholar] [CrossRef] [PubMed]
- Lavers, J.L.; Bond, A.L. Exceptional and rapid accumulation of anthropogenic debris on one of the world’s most remote and pristine islands. Proc. Natl. Acad. Sci. USA 2017, 114, 6052–6055. [Google Scholar] [CrossRef] [Green Version]
- Pichel, W.G.; Veenstra, T.S.; Churnside, J.H.; Arabini, E.; Friedman, K.S.; Foley, D.G.; Brainard, R.E.; Kiefer, D.; Ogle, S.; Clemente-Colón, P.; et al. GhostNet marine debris survey in the Gulf of Alaska—Satellite guidance and aircraft observations. Mar. Pollut. Bull. 2012, 65, 28–41. [Google Scholar] [CrossRef] [PubMed]
- Napper, I.E.; Thompson, R.C. Marine Plastic Pollution: Other Than Microplastic. In Waste, 2nd ed.; Elsevier: Amsterdam, The Netherlands, 2019; pp. 425–442. [Google Scholar]
- Li, P.; Wang, X.; Su, M.; Zou, X.; Duan, L.; Zhang, H. Characteristics of Plastic Pollution in the Environment: A Review. Bull. Environ. Contam. Toxicol. 2021, 107, 577–584. [Google Scholar] [CrossRef] [PubMed]
- Lebreton, L.C.; Van Der Zwet, J.; Damsteeg, J.W.; Slat, B.; Andrady, A.; Reisser, J. River plastic emissions to the world’s oceans. Nat. Commun. 2017, 8, 15611. [Google Scholar] [CrossRef]
- Lebreton, L.C.; Andrady, A.; Eriksen, M.; Lebreton, L.C.; Carson, H.S.; Thiel, M.; Moore, C.J.; Borerro, J.C.; Galgani, F.; Ryan, P.G.; et al. Future scenarios of global plastic waste generation and disposal. Palgrave Commun. 2019, 5, 6. [Google Scholar] [CrossRef] [Green Version]
- Schmidt, C.; Krauth, T.; Wagner, S. Export of Plastic Debris by Rivers into the Sea. Environ. Sci. Technol. 2017, 51, 12246–12253. [Google Scholar] [CrossRef] [PubMed]
- Lebreton, L.; Slat, B.; Ferrari, F.; Sainte-Rose, B.; Aitken, J.; Marthouse, R.; Hajbane, S.; Cunsolo, S.; Schwarz, A.; Levivier, A.; et al. Evidence that the Great Pacific Garbage Patch is rapidly accumulating plastic. Sci. Rep. 2018, 8, 4666. [Google Scholar] [CrossRef] [Green Version]
- Lobelle, D.; Cunliffe, M. Early microbial biofilm formation on marine plastic debris. Mar. Pollut. Bull. 2011, 62, 197–200. [Google Scholar] [CrossRef]
- Olivelli, A.; Hardesty, B.D.; Wilcox, C. Coastal margins and backshores represent a major sink for marine debris: Insights from a continental-scale analysis. Environ. Res. Lett. 2020, in press. [Google Scholar] [CrossRef]
- Rudduck, O.A.; Lavers, J.L.; Fischer, A.M.; Stuckenbrock, S.; Sharp, P.B.; Banati, R.B. Inter-annual variation in the density of anthropogenic debris in the Tasman Sea. Mar. Pollut. Bull. 2017, 124, 51–55. [Google Scholar] [CrossRef] [PubMed]
- Hardesty, B.D.; Lawson, T.J.; van der Velde, T.; Lansdell, M.; Wilcox, C. Estimating quantities and sources of marine debris at a continental scale. Front. Ecol. Environ. 2017, 15, 18–25. [Google Scholar] [CrossRef]
- Van Sebille, E.; England, M.H.; Froyland, G. Origin, dynamics and evolution of ocean garbage patches from observed surface drifters. Environ. Res. Lett. 2012, 7, 6. [Google Scholar] [CrossRef]
- Mace, T.H. At-sea detection of marine debris: Overview of technologies, processes, issues, and options. Mar. Pollut. Bull. 2012, 65, 23–27. [Google Scholar] [CrossRef]
- Martínez-Vicente, V.; Clark, J.R.; Corradi, P.; Aliani, S.; Arias, M.; Bochow, M.; Bonnery, G.; Cole, M.; Cózar, A.; Donnelly, R.; et al. Measuring marine plastic debris from space: Initial assessment of observation requirements. Remote Sens. 2019, 11, 2443. [Google Scholar] [CrossRef] [Green Version]
- Garaba, S.P.; Aitken, J.; Slat, B.; Dierssen, H.M.; Lebreton, L.; Zielinski, O.; Reisser, J. Sensing Ocean Plastics with an Airborne Hyperspectral Shortwave Infrared Imager. Environ. Sci. Technol. 2018, 52, 11699–11707. [Google Scholar] [CrossRef] [PubMed]
- Biermann, L.; Clewley, D.; Martinez-Vicente, V.; Topouzelis, K. Finding Plastic Patches in Coastal Waters using Optical Satellite Data. Sci. Rep. 2020, 10, 5364. [Google Scholar] [CrossRef] [PubMed] [Green Version]
- Fallati, L.; Polidori, A.; Salvatore, C.; Saponari, L.; Savini, A.; Galli, P. Anthropogenic Marine Debris assessment with Unmanned Aerial Vehicle imagery and deep learning: A case study along the beaches of the Republic of Maldives. Sci. Total Environ. 2019, 693, 133581. [Google Scholar] [CrossRef] [PubMed]
- Goddijn-murphy, L.; Peters, S.; Sebille, E.V.; James, N.A.; Gibb, S. Concept for a hyperspectral remote sensing algorithm for floating marine macro plastics. Mar. Pollut. Bull. 2018, 126, 255–262. [Google Scholar] [CrossRef] [PubMed] [Green Version]
- Veenstra, T.S.; Churnside, J.H. Airborne sensors for detecting large marine debris at sea. Mar. Pollut. Bull. 2012, 65, 63–68. [Google Scholar] [CrossRef] [PubMed]
- Garaba, S.P.; Dierssen, H.M. An airborne remote sensing case study of synthetic hydrocarbon detection using short wave infrared absorption features identified from marine-harvested macro- and microplastics. Remote Sens. Environ. 2018, 205, 224–235. [Google Scholar] [CrossRef]
- Guffogg, J.A.; Soto-Berelov, M.; Jones, S.D.; Bellman, C.J.; Lavers, J.L.; Skidmore, A.K. Towards the Spectral Mapping of Plastic Debris on Beaches. Remote Sens. 2021, 13, 1850. [Google Scholar] [CrossRef]
- Garaba, S.P.; Arias, M.; Harmel, T.; Vries, R.D. Concentration, anisotropic and apparent colour effects on optical reflectance properties of virgin and ocean-harvested plastics. J. Hazard. Mater. 2020, 406, 124290. [Google Scholar] [CrossRef]
- Vázquez-Guardado, A.; Money, M.; McKinney, N.; Chanda, D. Multi-spectral infrared spectroscopy for robust plastic identification. Appl. Opt. 2015, 54, 7396. [Google Scholar] [CrossRef]
- Garaba, S.P.; Dierssen, H.M. Hyperspectral ultraviolet to shortwave infrared characteristics of marine-harvested, washed ashore and virgin plastics. Earth Syst. Sci. Data Discuss. 2019, 12, 77–86. [Google Scholar] [CrossRef] [Green Version]
- Moshtaghi, M.; Knaeps, E.; Sterckx, S.; Garaba, S. Spectral reflectance of marine macroplastics in the VNIR and SWIR measured in a controlled environment. Sci. Rep. 2021, 11, 5436. [Google Scholar] [CrossRef]
- Balsi, M.; Esposito, S.; Moroni, M. Hyperspectral characterization of marine plastic litters. In Proceedings of the 2018 IEEE International Workshop on Metrology for the Sea, Learning to Measure Sea Health Parameters, MetroSea 2018-Proceedings, Reggio Calabria, Italy, 4–6 October 2019; pp. 28–32. [Google Scholar] [CrossRef]
- Knaeps, E.; Sterckx, S.; Strackx, G.; Mijnendonckx, J.; Moshtaghi, M.; Garaba, S.P.; Meire, D. Hyperspectral-reflectance dataset of dry, wet and submerged marine litter. Earth Syst. Sci. Data 2021, 13, 713–730. [Google Scholar] [CrossRef]
- Corbari, L.; Maltese, A.; Capodici, F.; Mangano, M.C.; Sarà, G.; Ciraolo, G. Indoor spectroradiometric characterization of plastic litters commonly polluting the Mediterranean Sea: Toward the application of multispectral imagery. Sci. Rep. 2020, 10, 19850. [Google Scholar] [CrossRef] [PubMed]
- Woodroffe, C.D.; McLean, R.F.; Wallensky, E. Geomorphology of the Cocos (Keeling) Islands. Attol Res. Bull. 1994, 402, 1–33. [Google Scholar] [CrossRef]
- Kingdon, C.; Lee, Y. SpecDal Python Package. 2017. Available online: https://pypi.org/project/specdal/ (accessed on 25 April 2021).
- Kokaly, R.F. PRISM: Processing Routines in IDL for Spectroscopic Measurements (Installation Manual and User’s Guide, Version 1.0); Technical Report; US Geological Society: Reston, VA, USA, 2011.
- Clark, R.N.; Roush, T.L. Reflectance spectroscopy: Quantitative analysis techniques for remote sensing applications. J. Geophys. Res. Solid Earth 1984, 89, 6329–6340. [Google Scholar] [CrossRef]
- Therien, C. Pysptools Python Package. 2013. Available online: https://pysptools.sourceforge.io/ (accessed on 25 April 2021).
- Goddijn-Murphy, L.; Dufaur, J. Proof of concept for a model of light reflectance of plastics floating on natural waters. Mar. Pollut. Bull. 2018, 135, 1145–1157. [Google Scholar] [CrossRef] [PubMed]
- Zhou, S.; Kuester, T.; Bochow, M.; Bohn, N.; Brell, M.; Kaufmann, H. A knowledge-based, validated classifier for the identification of aliphatic and aromatic plastics by WorldView-3 satellite data. Remote Sens. Environ. 2021, 264, 112598. [Google Scholar] [CrossRef]
- Tasseron, P.; van Emmerik, T.; Peller, J.; Schreyers, L.; Biermann, L. Advancing Floating Macroplastic Detection from Space Using Experimental Hyperspectral Imagery. Remote Sens. 2021, 13, 2335. [Google Scholar] [CrossRef]
- Acuña-Ruz, T.; Uribe, D.; Taylor, R.; Amézquita, L.; Guzmán, M.C.; Merrill, J.; Martínez, P.; Voisin, L.; Mattar, B.C. Anthropogenic marine debris over beaches: Spectral characterization for remote sensing applications. Remote Sens. Environ. 2018, 217, 309–322. [Google Scholar] [CrossRef]
- Masoumi, H.; Safavi, S.; Khani, Z. Identification and Classification of Plastic Resins using Near Infrared Reflectance. Int. J. Mech. Ind. Eng. 2012, 6, 213–220. [Google Scholar]
- Moroni, M.; Mei, A.; Leonardi, A.; Lupo, E.; La Marca, F. PET and PVC separation with hyperspectral imagery. Sensors 2015, 15, 2205–2227. [Google Scholar] [CrossRef]
- Havianas. What Are Havianas Made of? Available online: https://havaianas.com.au/ (accessed on 2 September 2021).
Figure 1.
Outline of the methodology, including plastic sources, data processing steps, statistical analysis and final outputs.
Figure 1.
Outline of the methodology, including plastic sources, data processing steps, statistical analysis and final outputs.

Figure 2.
The Cocos (Keeling) Islands (North Keeling atoll not shown). Fieldwork was completed in February 2020. White stars indicate field sites where plastic debris was collected from and used in the laboratory experiments. The black star on Cemetery Beach showing where the field quadrat experiment was set up and spectral readings were collected in situ.

Figure 3.
Spectral reflectance of plastic groups (at 100% surface cover) collected from the Cocos (Keeling) Islands in February 2020, and virgin plastic polymers collected in 2021. While the MPD collected from the CKI were exposed to degradation and the exact polymers for the groups were not determined in the field, the virgin polymers were clearly identified and were not weathered or degraded.

Figure 4.
Scaled, continuum-removed spectral reflectance for marine harvested plastic debris (a–e) and virgin plastics (f–h), with surface covers from 1% to 25% shown in blue. Continuum-removed spectral reflectance of sand (0% plastic surface cover) is shown in red. The location of the absorption maxima for the spectral features is shown with vertical lines.

Figure 5.
Feature depth (drop in scaled reflectance) vs. surface cover for different marine-harvested and virgin plastics at (a) 931 nm; (b) 1214 nm; (c) 1420 nm; (d) 1660 nm; (e) 1732 nm; (f) 2130 nm; (g) 2270 nm.
Figure 5.
Feature depth (drop in scaled reflectance) vs. surface cover for different marine-harvested and virgin plastics at (a) 931 nm; (b) 1214 nm; (c) 1420 nm; (d) 1660 nm; (e) 1732 nm; (f) 2130 nm; (g) 2270 nm.

Figure 6.
Feature area vs. surface cover for different marine-harvested and virgin plastics at (a) 931 nm; (b) 1214 nm; (c) 1420 nm; (d) 1660 nm; (e) 1732 nm; (f) 2130 nm; (g) 2270 nm.
Figure 6.
Feature area vs. surface cover for different marine-harvested and virgin plastics at (a) 931 nm; (b) 1214 nm; (c) 1420 nm; (d) 1660 nm; (e) 1732 nm; (f) 2130 nm; (g) 2270 nm.

Figure 7.
Feature width (FWHM) vs. surface cover for different marine-harvested and virgin plastics at (a) 931 nm; (b) 1214 nm; (c) 1420 nm; (d) 1660 nm; (e) 1732 nm; (f) 2130 nm; (g) 2270 nm.
Figure 7.
Feature width (FWHM) vs. surface cover for different marine-harvested and virgin plastics at (a) 931 nm; (b) 1214 nm; (c) 1420 nm; (d) 1660 nm; (e) 1732 nm; (f) 2130 nm; (g) 2270 nm.

Figure 8.
Reflectance and continuum-removed reflectance for field captured and lab captured plastic groups (i) coloured hard fragments; (ii) white hard fragments; (iii) fishing ropes and lines; (iv) plastic bottles and (v) shoes. The reflectance of sand is indicated in grey. Regions where spectral reflectance could not be captured in the field because of atmospheric absorption (1350–1800 nm and 1800–2100 nm) are indicated with grey rectangles.


Table 1.
Previously published studies of marine plastic debris absorption features.
| Materials Tested | Citation |
|---|---|
| bottle caps, buoys, ropes, nets, containers and virgin plastic samples (PVC, PA 6.6 and PA 6, LDPE, PET, PP, PS, FEP, ABS, Merlon, PMMA) | Garaba et al., 2019 [34] |
| virgin plastic pellets and plastic waste in flake and fragment form for PET, PVC, LDPE, HDPE and PE | Moshtaghi et al., 2021 and Kneaps et al., 2021 [35,37] |
| HDPE, LDPE, PP, PVC, PS, Polycarbonate (PC), PET, Polylactic acid (PLA) | Balsi et al., 2019 [36] |
| Dry and wet microplastic fragments of PET, HDPE, EVA, PP, PS | Corbari et al., 2021 [38] |
Table 2.
Plastics used in the experiments were grouped by physical properties for the weathered debris and by polymer for the un-weathered virgin plastics. The assumed polymers are listed for the weathered plastics as identification of all weathered plastics in the field was not possible. Weathered plastics were collected from beaches on the Cocos (Keeling) Islands and are debris that have been exposed to environmental degradation. The physical properties of the samples used are noted.
| Plastic Group (W = Weathered Debris and Likely Polymer, V = Virgin Plastic with Known Polymer) | Optical and Physical Properties | Common Items | |
|---|---|---|---|
| w | Weathered bottles (PET) | Transparent, hard | Single use bottles |
| w | Fishing debris (Nylon, Polyamide) | Opaque, Flexible, Coloured | fishing rope, nets and lines |
| w | Coloured debris fragments (PP, Polyoxymethylene (POM)) | Opaque, coloured, hard | Disposable cigarette lighters, Bottle caps, Unknown fragments |
| w | White debris fragments (HDPE, PP) | Opaque, hard, white | Pharmaceutical bottles, Toothbrushes, fragments |
| w | shoe debris (Polyurethane (PU)) | Opaque, coloured, black, foam | shoes, flip-flops |
| v | High density polyethylene (HDPE) | Transparent, hard | Single use bottles |
| v | Polypropylene (PP) | Opaque, hard | Disposable cigarette lighters, Bottle caps, Unknown fragments |
| v | Polyethylene terephthalate (PET) | Transparent, hard | Single use bottles |
Table 3.
Minimum surface cover required for spectral separation from sand and Regression (r2) for spectral absorption feature parameters (depth at maxima, area, FWHM) vs. surface cover, for each plastic assemblage from the marine-harvested and virgin plastic groups. Where a spectral feature was not present for a particular group, the space has been left empty.
| Feature (nm) | Min Detect (%) | Depth r2 | Area r2 | FWHM r2 | Min Detect (%) | Depth r2 | Area r2 | FWHM r2 |
|---|---|---|---|---|---|---|---|---|
| White Debris | Colour Debris | |||||||
| 931 | 5 | 0.91 | 0.92 | 0.84 | 11 | 0.95 | 0.96 | 0.95 |
| 1214 | 2 | 0.73 | 0.97 | 0.83 | 2 | 0.68 | 0.98 | 0.8 |
| 1420 | 3 | 0.79 | 0.97 | 0.83 | 2 | 0.74 | 0.98 | 0.79 |
| 1660 | - | - | - | - | - | - | - | - |
| 1732 | 2 | 0.72 | 0.96 | 0.83 | 2 | 0.74 | 0.98 | 0.84 |
| 2130 | - | - | - | - | - | - | - | - |
| 2280 | 5 | 0.92 | 0.85 | 0.88 | 7 | 0.94 | 0.94 | 0.94 |
| Fishing Debris | Shoe Debris | |||||||
| 931 | - | - | - | - | - | - | - | - |
| 1214 | 4 | 0.84 | 0.97 | 0.88 | 17 | p > 0.05 | p > 0.05 | p > 0.05 |
| 1420 | 5 | 0.87 | 0.97 | 0.88 | - | - | - | - |
| 1660 | - | - | - | - | - | - | - | - |
| 1732 | 4 | 0.82 | 0.97 | 0.89 | 5 | 0.88 | 0.99 | 0.9 |
| 2130 | - | - | - | - | - | - | - | - |
| 2280 | 9 | 0.97 | 0.93 | 0.95 | - | - | - | - |
| Bottle Debris | PET | |||||||
| 931 | - | - | - | - | - | - | - | - |
| 1214 | - | - | - | - | - | - | - | - |
| 1420 | - | - | - | - | - | - | - | - |
| 1660 | 4 | 0.83 | 0.97 | 0.88 | 8 | 0.9 | 0.98 | 0.93 |
| 1732 | - | - | - | - | - | - | - | - |
| 2130 | 5 | 0.89 | 0.97 | 0.92 | 9 | 0.94 | 0.97 | 0.96 |
| 2280 | 5 | 0.9 | 0.85 | 0.82 | - | - | - | - |
| HDPE | PP | |||||||
| 930 | 21 | p > 0.05 | p > 0.05 | p > 0.05 | - | - | - | - |
| 1214 | 3 | 0.72 | 0.99 | 0.79 | 8 | 0.92 | 0.99 | 0.94 |
| 1420 | 3 | 0.8 | 0.99 | 0.82 | 12 | p > 0.05 | p > 0.05 | p > 0.05 |
| 1660 | - | - | - | - | - | - | - | - |
| 1732 | 3 | 0.71 | 0.99 | 0.83 | - | - | - | - |
| 2130 | - | - | - | - | - | - | - | - |
| 2260 | - | - | - | - | 8 | 0.96 | 0.97 | 0.95 |
Table 4.
Comparison of field and lab repeated experiments. Where an absorption feature could not be clearly identified in the field data, the space has been left empty. Spectral features that fall within water bands (1350–1500 nm and 1800–2100 nm) or were overly influenced by noisy data (2200 nm+) have not been included.
| Absorption Feature | Depth | Area | FWHM (nm) | Depth | Area | FWHM (nm) |
|---|---|---|---|---|---|---|
| White fragments | lab | field | ||||
| 931 | 0.94 | 4.27 | 30.4 | - | - | - |
| 1214 | 0.69 | 20.71 | 58.5 | 0.68 | 27.3 | 85.9 |
| 1732 | 0.65 | 21.23 | 67.2 | 0.69 | 20.1 | 67 |
| Colour fragments | lab | field | ||||
| 931 | 0.96 | 5.1 | 30 | - | - | - |
| 1214 | 0.84 | 12.01 | 73.3 | 0.76 | 21.01 | 88 |
| 1732 | 0.84 | 15.1 | 109 | 0.82 | 13.22 | 78 |
| Shoe debris | lab | field | ||||
| 1214 | 0.93 | 6.15 | 51.9 | 0.89 | 8.62 | 78 |
| 1732 | 0.849 | 7.29 | 36.9 | 0.83 | 9.8 | 46.5 |
| Fishing debris | lab | field | ||||
| 1214 | 0.81 | 13.06 | 49.2 | 0.86 | 12.62 | 87.3 |
| 1732 | 0.74 | 14.51 | 40.8 | 0.79 | 16.08 | 70 |
| Bottles debris | lab | field | ||||
| 1660 | 0.81 | 10.66 | 40 | 0.701 | 20.02 | 41.7 |
Publisher’s Note: MDPI stays neutral with regard to jurisdictional claims in published maps and institutional affiliations. |
© 2021 by the authors. Licensee MDPI, Basel, Switzerland. This article is an open access article distributed under the terms and conditions of the Creative Commons Attribution (CC BY) license (https://creativecommons.org/licenses/by/4.0/).
Share and Cite
MDPI and ACS Style
Guffogg, J.A.; Blades, S.M.; Soto-Berelov, M.; Bellman, C.J.; Skidmore, A.K.; Jones, S.D. Quantifying Marine Plastic Debris in a Beach Environment Using Spectral Analysis. Remote Sens. 2021, 13, 4548. https://doi.org/10.3390/rs13224548
AMA Style
Guffogg JA, Blades SM, Soto-Berelov M, Bellman CJ, Skidmore AK, Jones SD. Quantifying Marine Plastic Debris in a Beach Environment Using Spectral Analysis. Remote Sensing. 2021; 13(22):4548. https://doi.org/10.3390/rs13224548
Chicago/Turabian StyleGuffogg, Jenna A., Samantha M. Blades, Mariela Soto-Berelov, Chris J. Bellman, Andrew K. Skidmore, and Simon D. Jones. 2021. "Quantifying Marine Plastic Debris in a Beach Environment Using Spectral Analysis" Remote Sensing 13, no. 22: 4548. https://doi.org/10.3390/rs13224548
Note that from the first issue of 2016, this journal uses article numbers instead of page numbers. See further details here.