
Vehicle Classification Using the Discrete Fourier Transform with Traffic Inductive Sensors


Abstract
:1. Introduction
2. Proposed Method

3. Experimental Section
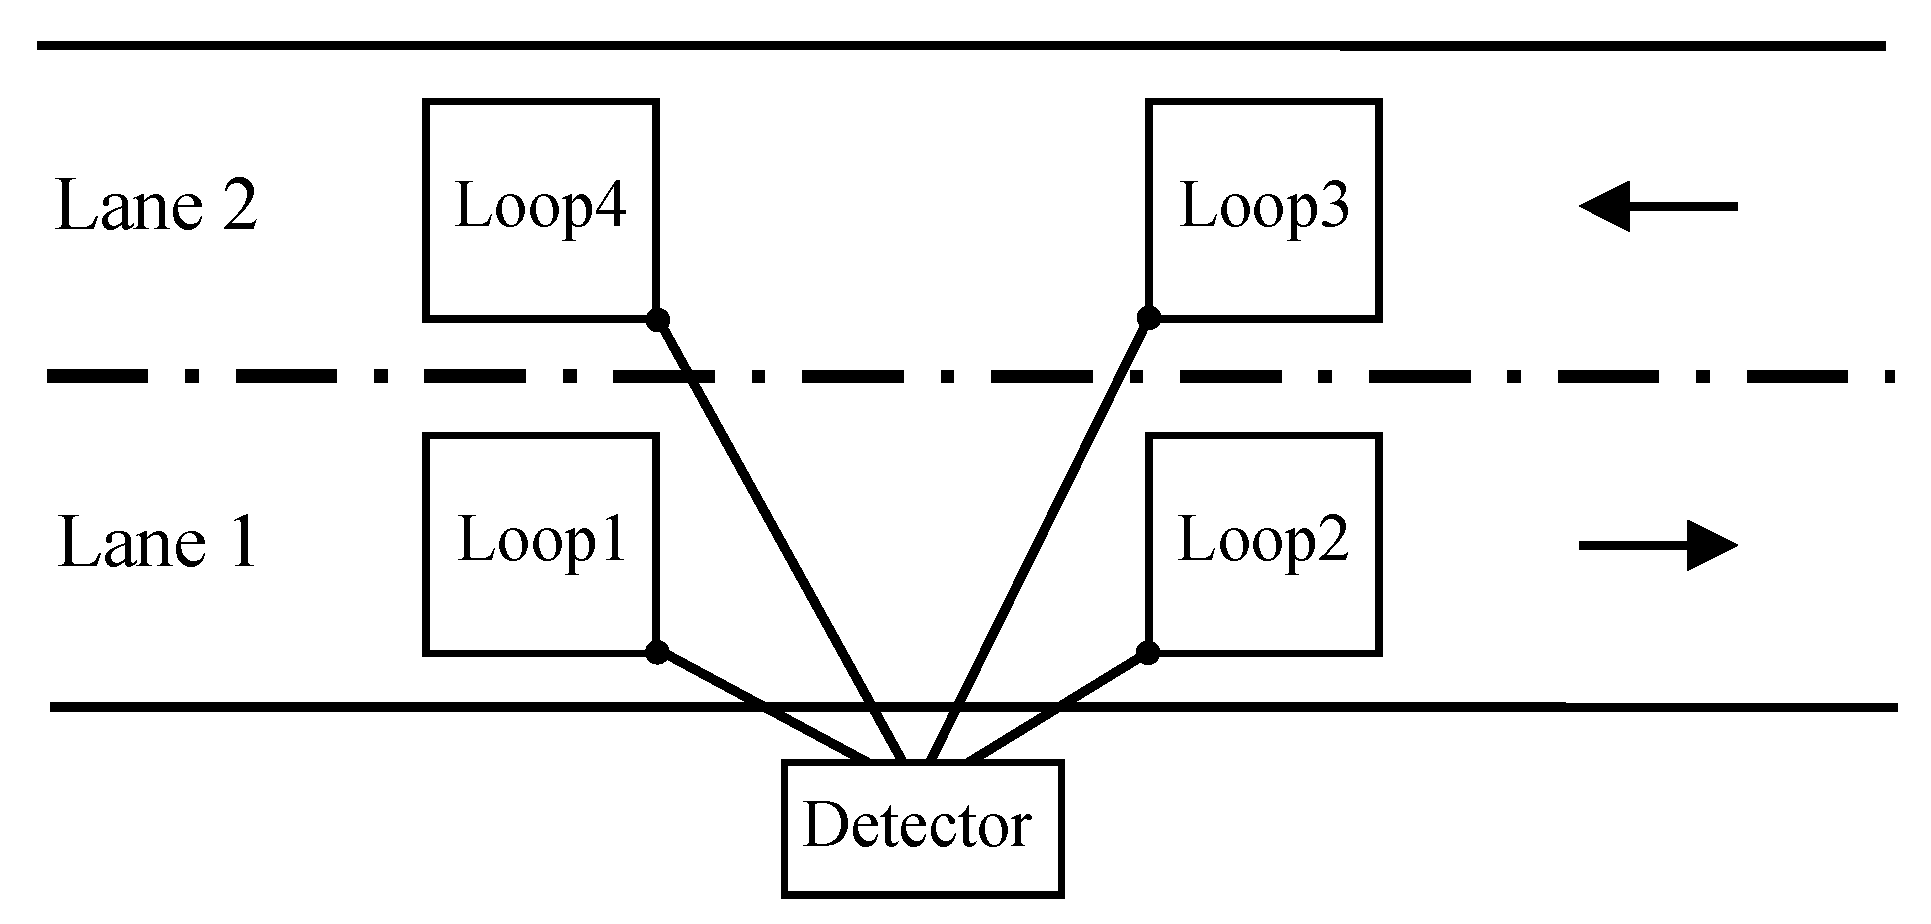
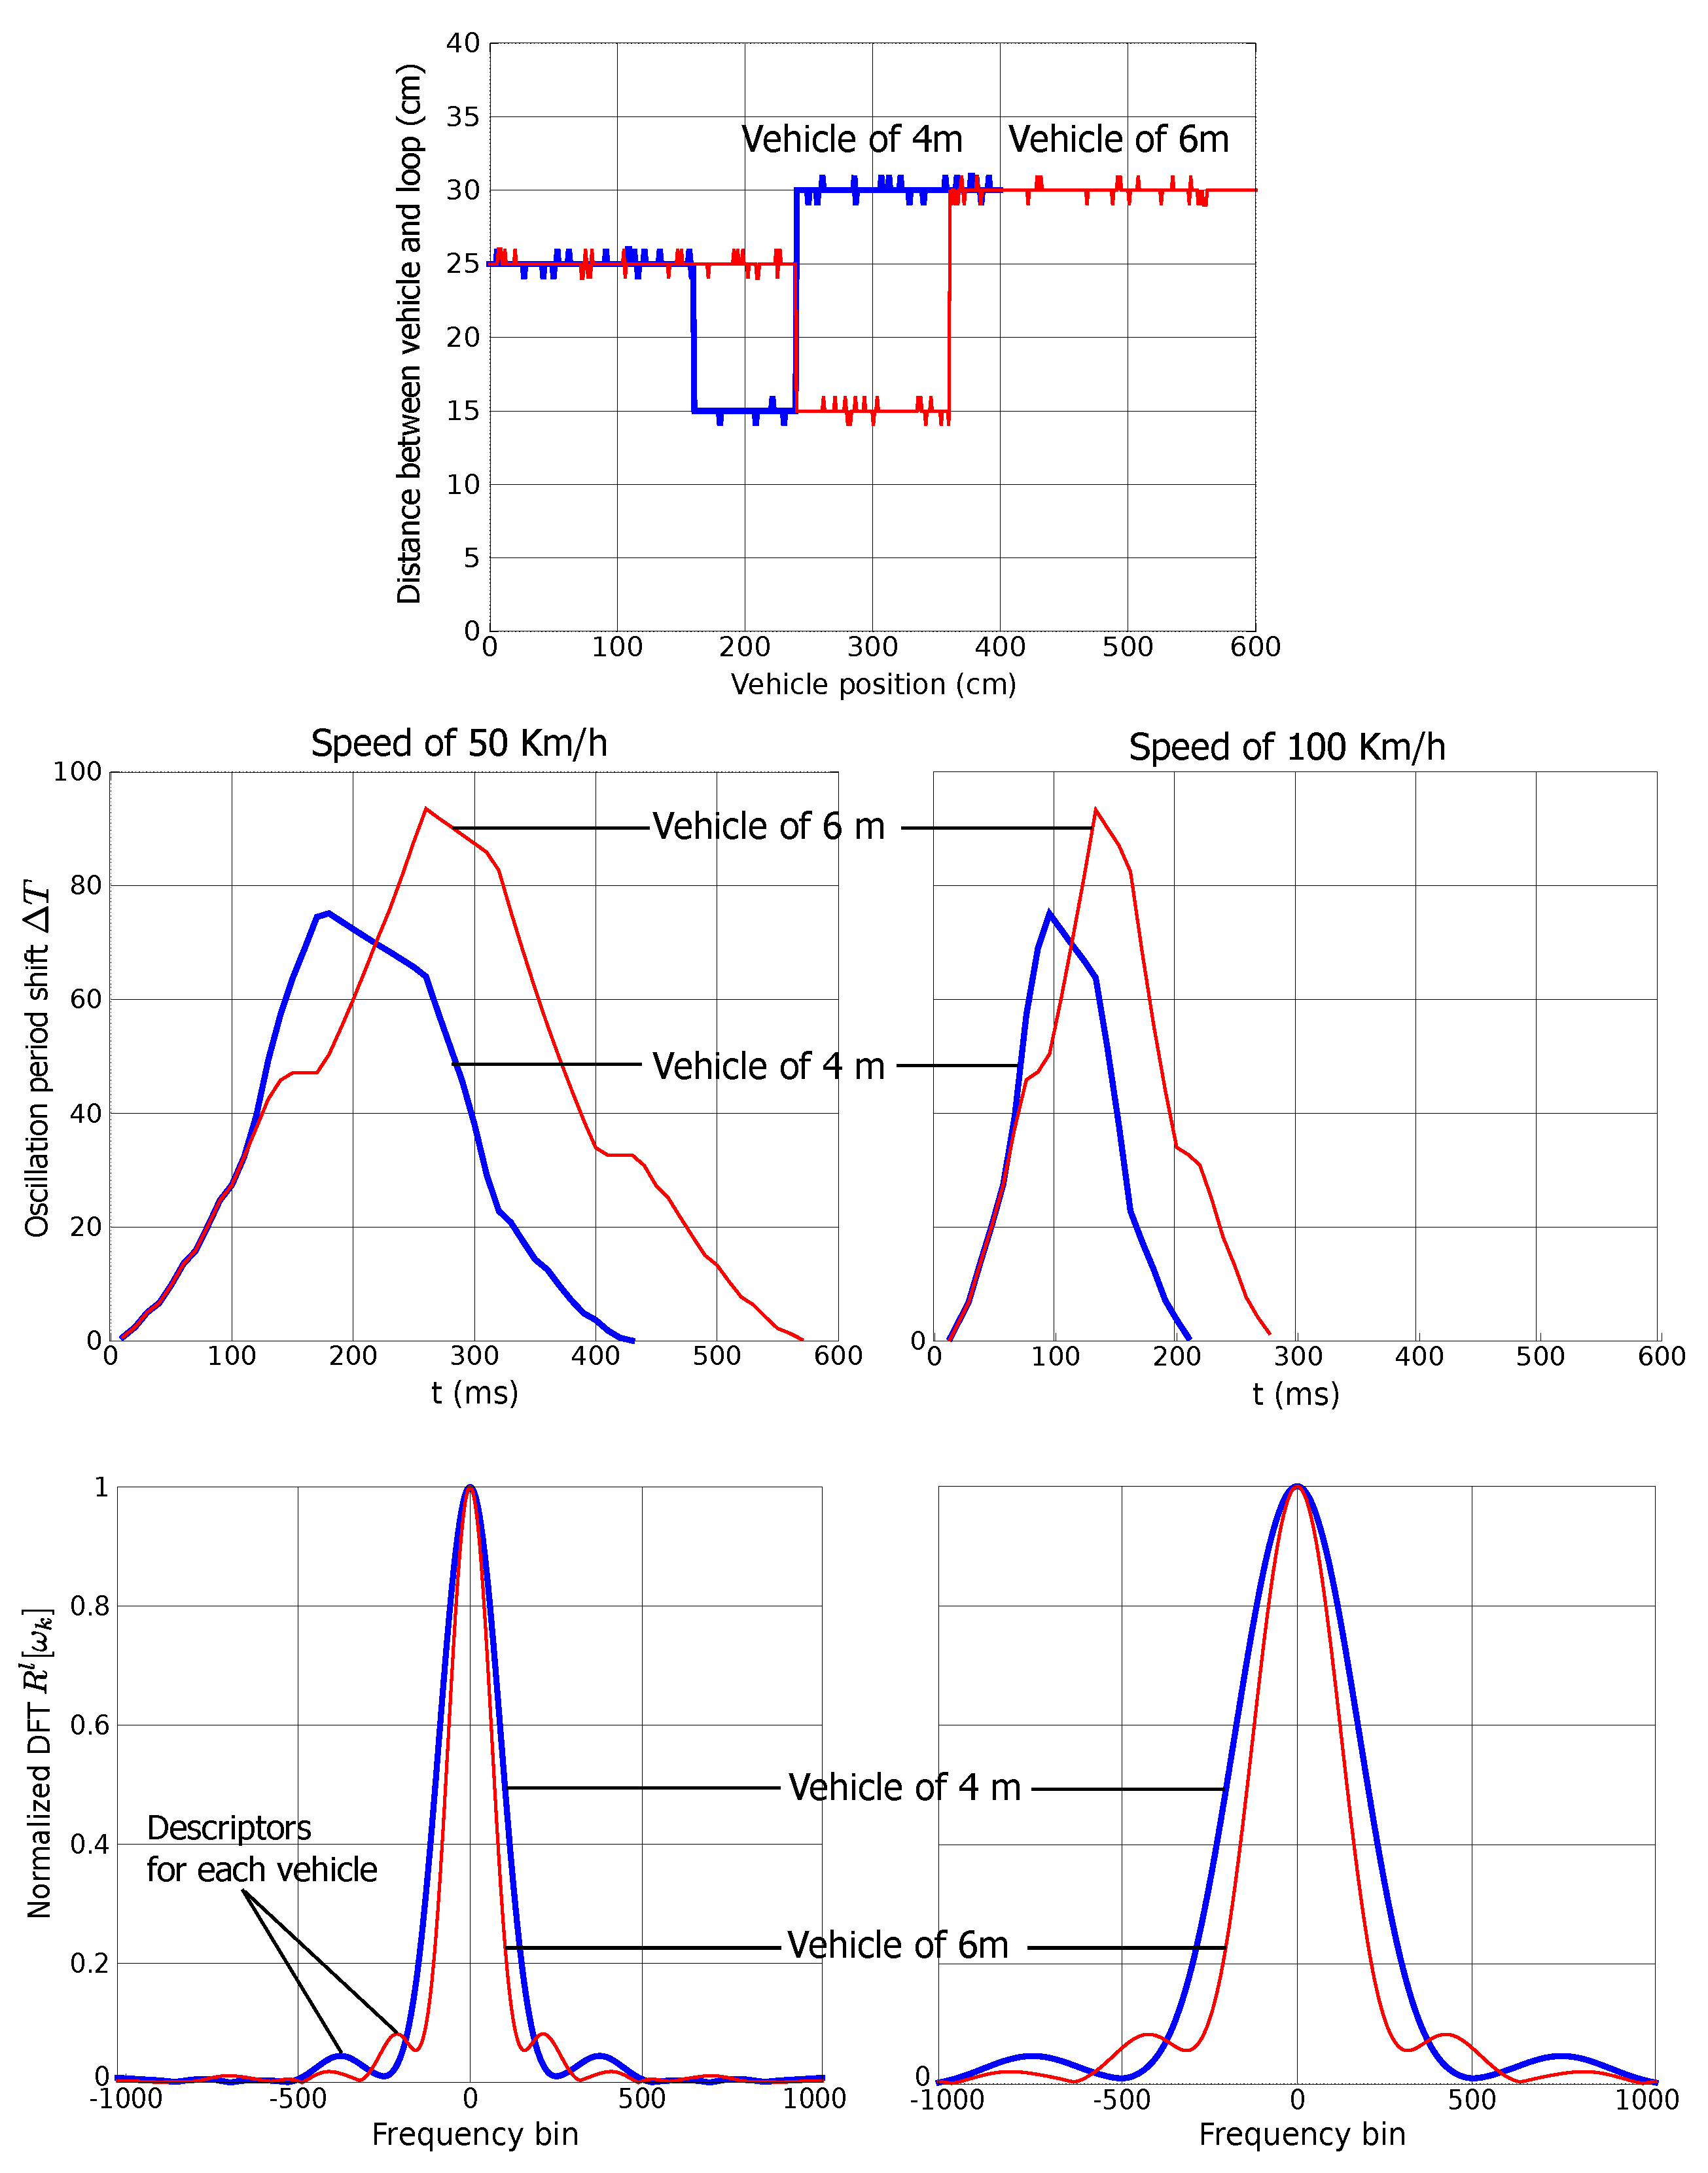
3.1. Experiment with an Inductive Loop Model


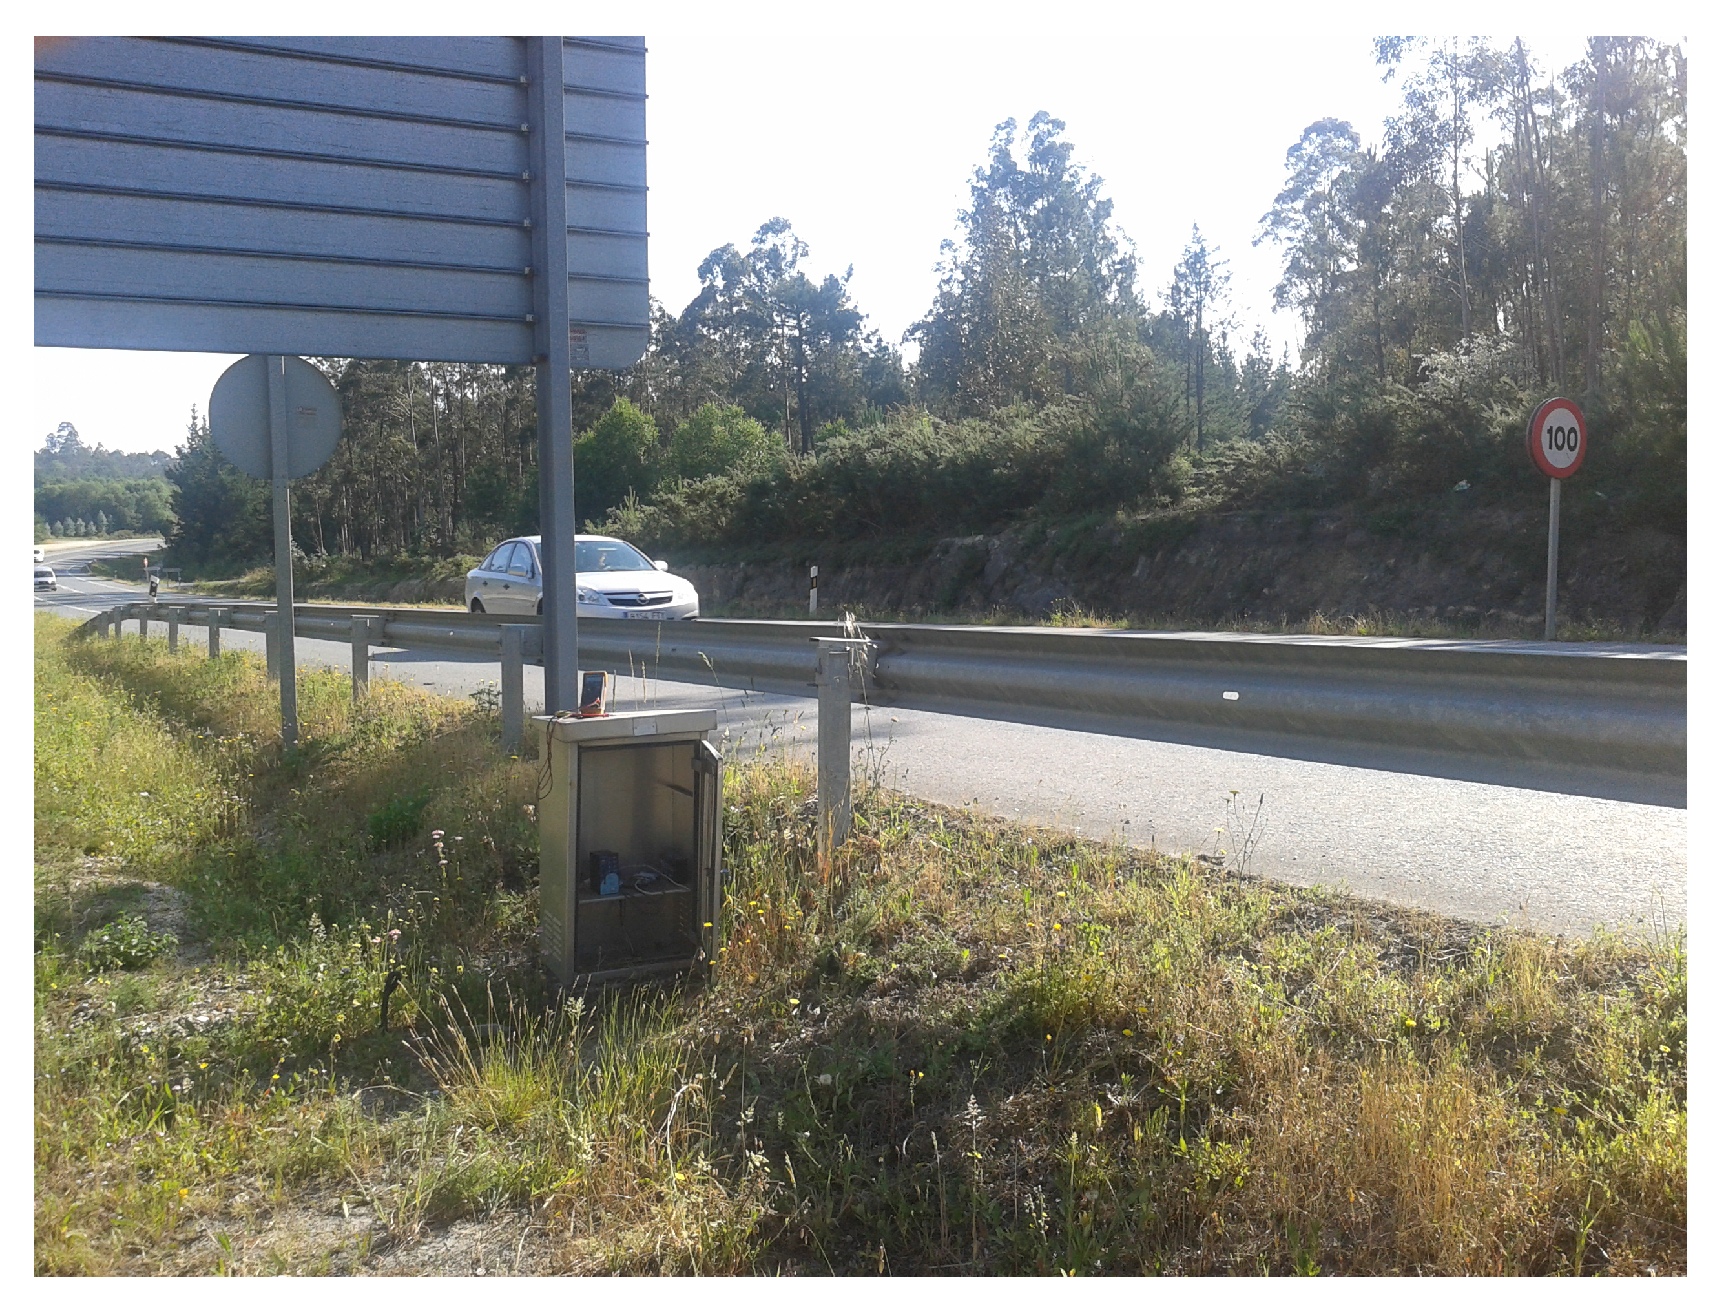
3.2. Experiment Using Real Acquired Signatures


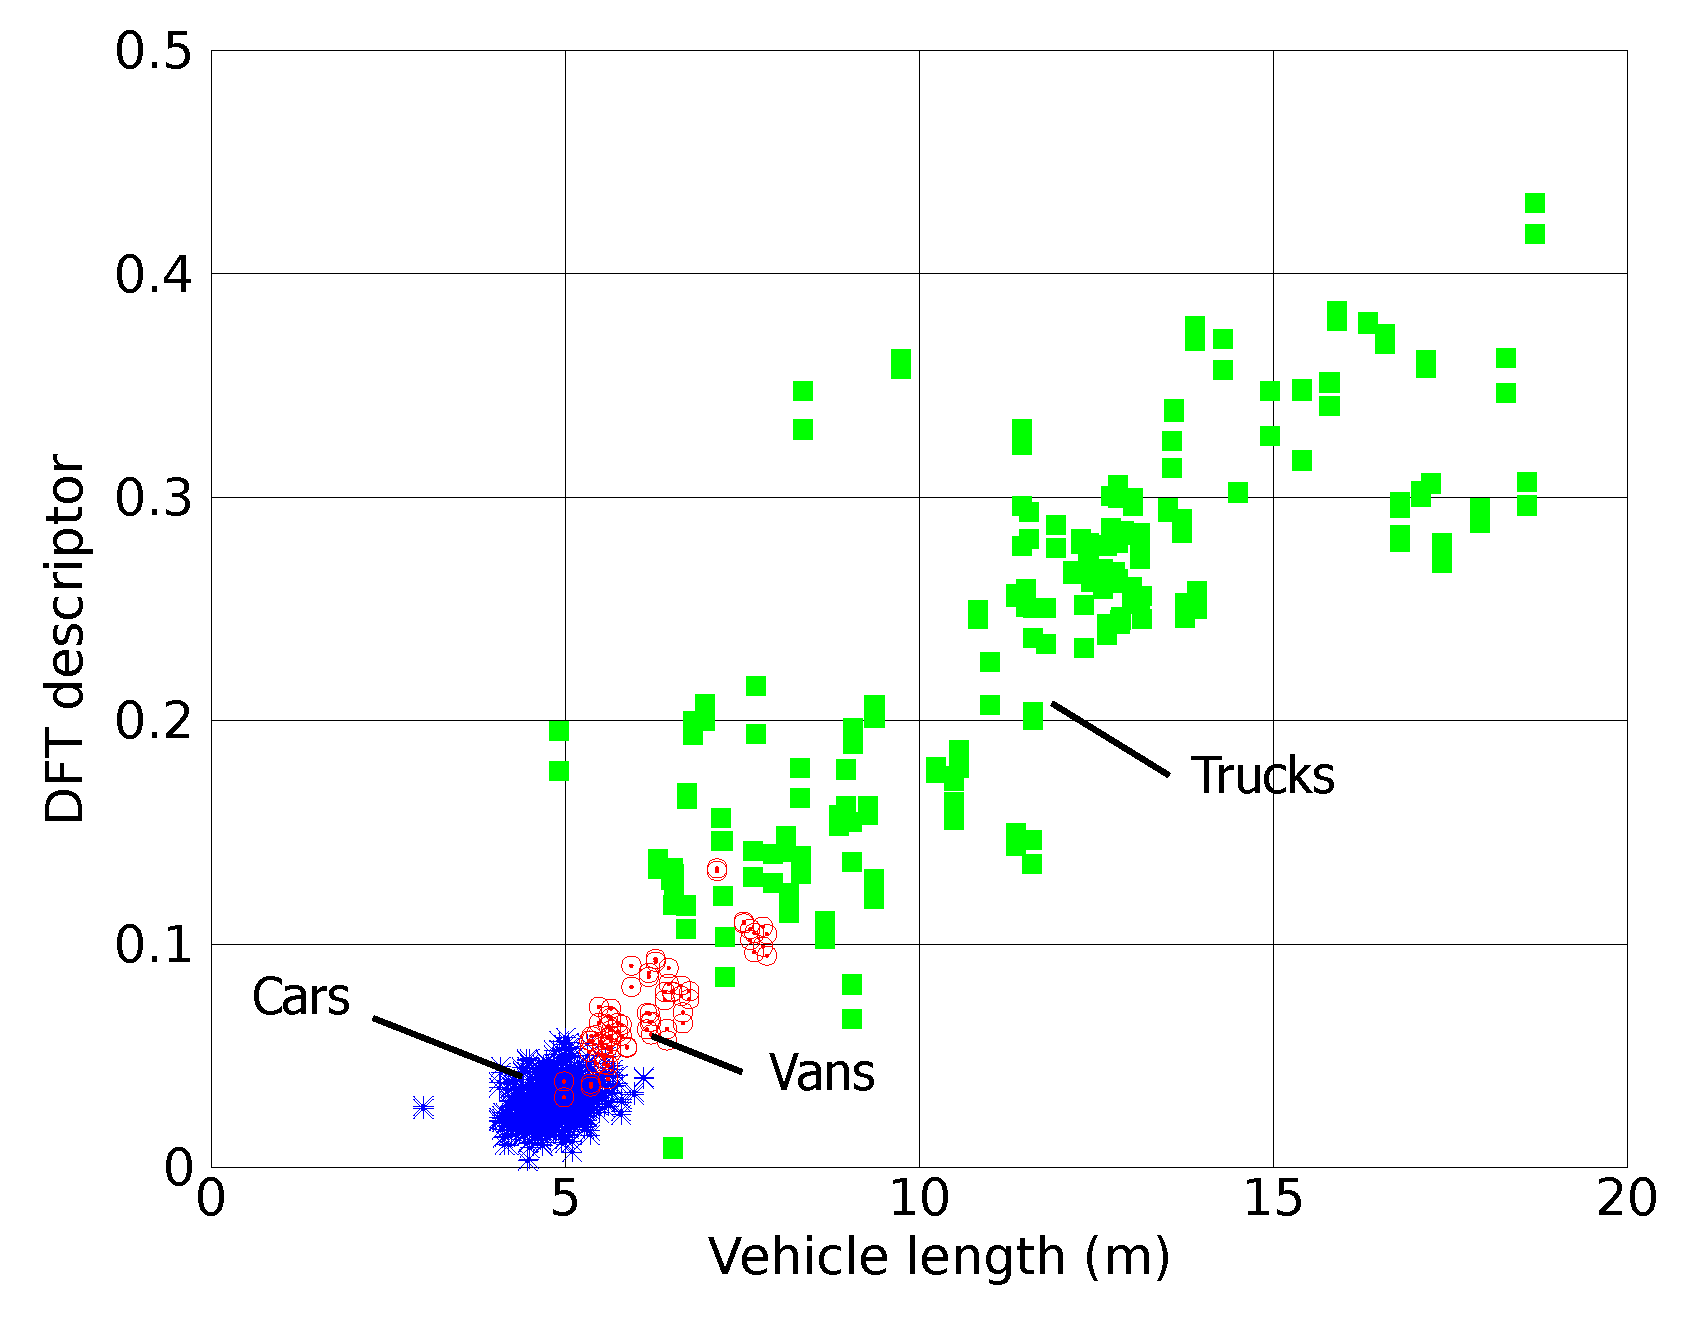
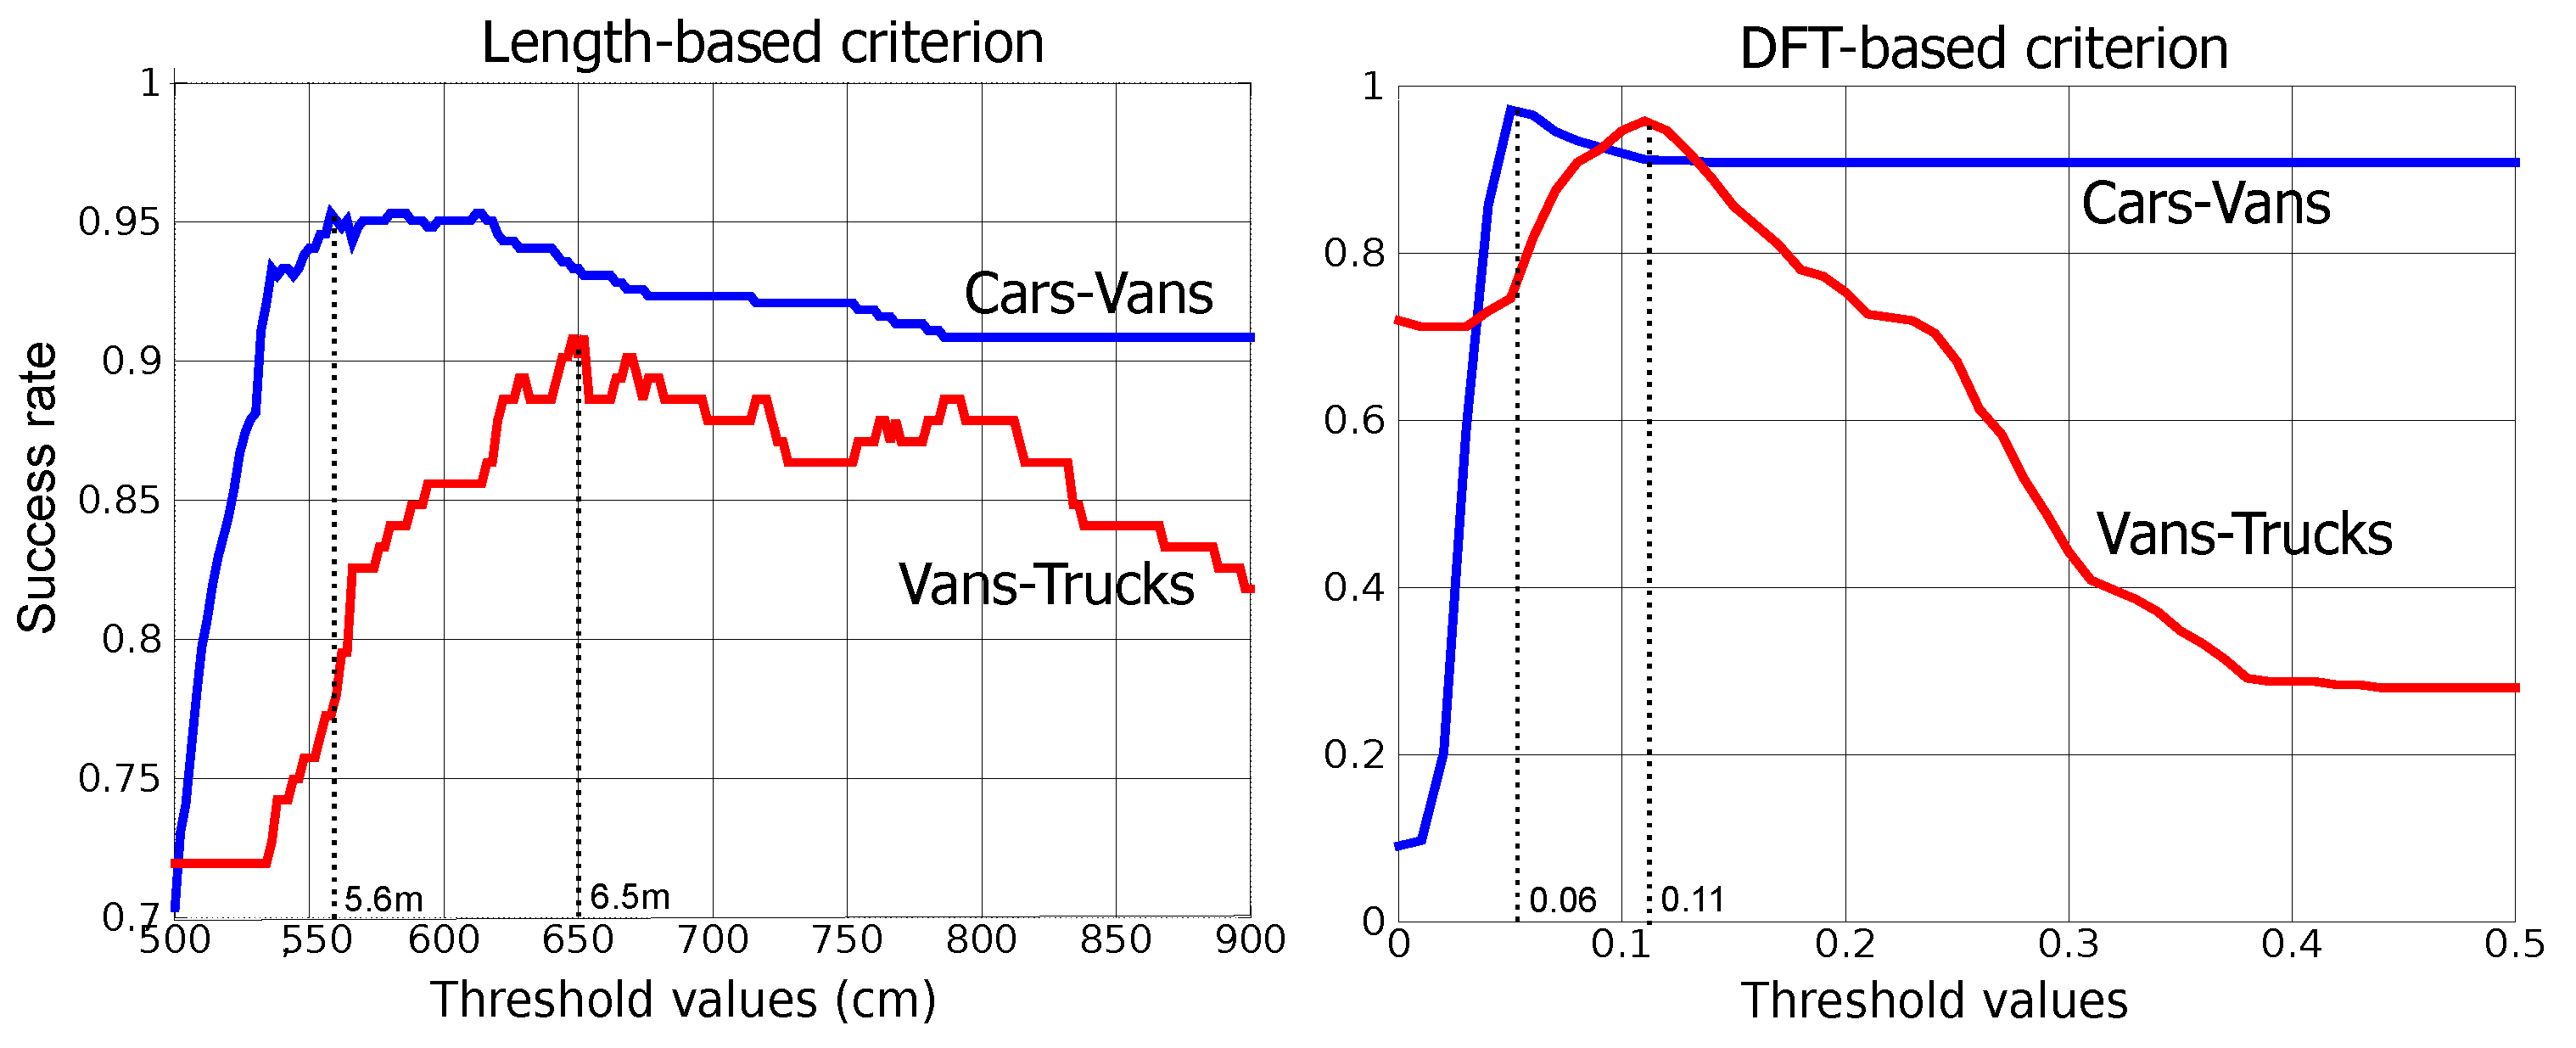
3.3. Experiment for Vehicle Classification


| Length | DFT (Loops 1 and 3) | DFT (Loops 2 and 4) | |||||||||||
|---|---|---|---|---|---|---|---|---|---|---|---|---|---|
| Car | Van | Truck | % | Car | Van | Truck | % | Car | Van | Truck | % | Total | |
| Car | 666 | 14 | 0 | 97.94 | 669 | 11 | 0 | 98.38 | 666 | 14 | 0 | 97.94 | 680 |
| Van | 13 | 27 | 21 | 44.26 | 12 | 42 | 7 | 68.85 | 16 | 41 | 4 | 67.21 | 61 |
| Truck | 2 | 5 | 161 | 95.83 | 1 | 7 | 160 | 95.24 | 1 | 13 | 154 | 91.67 | 168 |
| Total | 681 | 46 | 182 | 93.95 | 682 | 60 | 167 | 95.82 | 683 | 68 | 158 | 94.72 | 909 |
| Length | DFT (Loops 1 and 3) | DFT (Loops 2 and 4) | |||||||||||
|---|---|---|---|---|---|---|---|---|---|---|---|---|---|
| Car | Van | Truck | % | Car | Van | Truck | % | Car | Van | Truck | % | Total | |
| Car | 1013 | 7 | 2 | 99.12 | 998 | 22 | 2 | 97.65 | 1013 | 6 | 3 | 99.12 | 1022 |
| Van | 30 | 33 | 16 | 41.77 | 11 | 64 | 4 | 81.01 | 15 | 61 | 3 | 77.22 | 79 |
| Truck | 3 | 14 | 62 | 78.48 | 0 | 17 | 62 | 78.48 | 0 | 15 | 64 | 81.01 | 79 |
| Total | 1046 | 54 | 80 | 93.90 | 1009 | 103 | 68 | 95.25 | 1028 | 82 | 70 | 96.44 | 1180 |
4. Results and Discussion
5. Conclusions
Acknowledgments
Author Contributions
Conflicts of Interest
Appendix
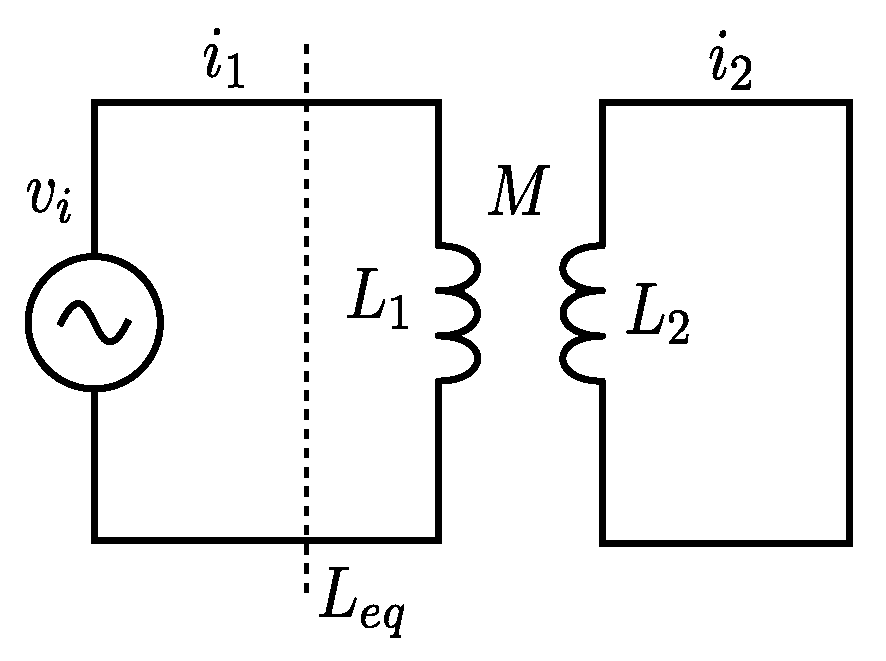
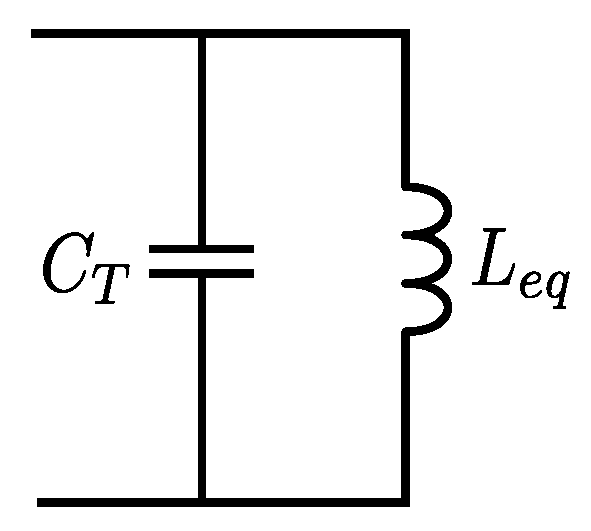
A. Equivalent Model


B. DFT Descriptor Properties
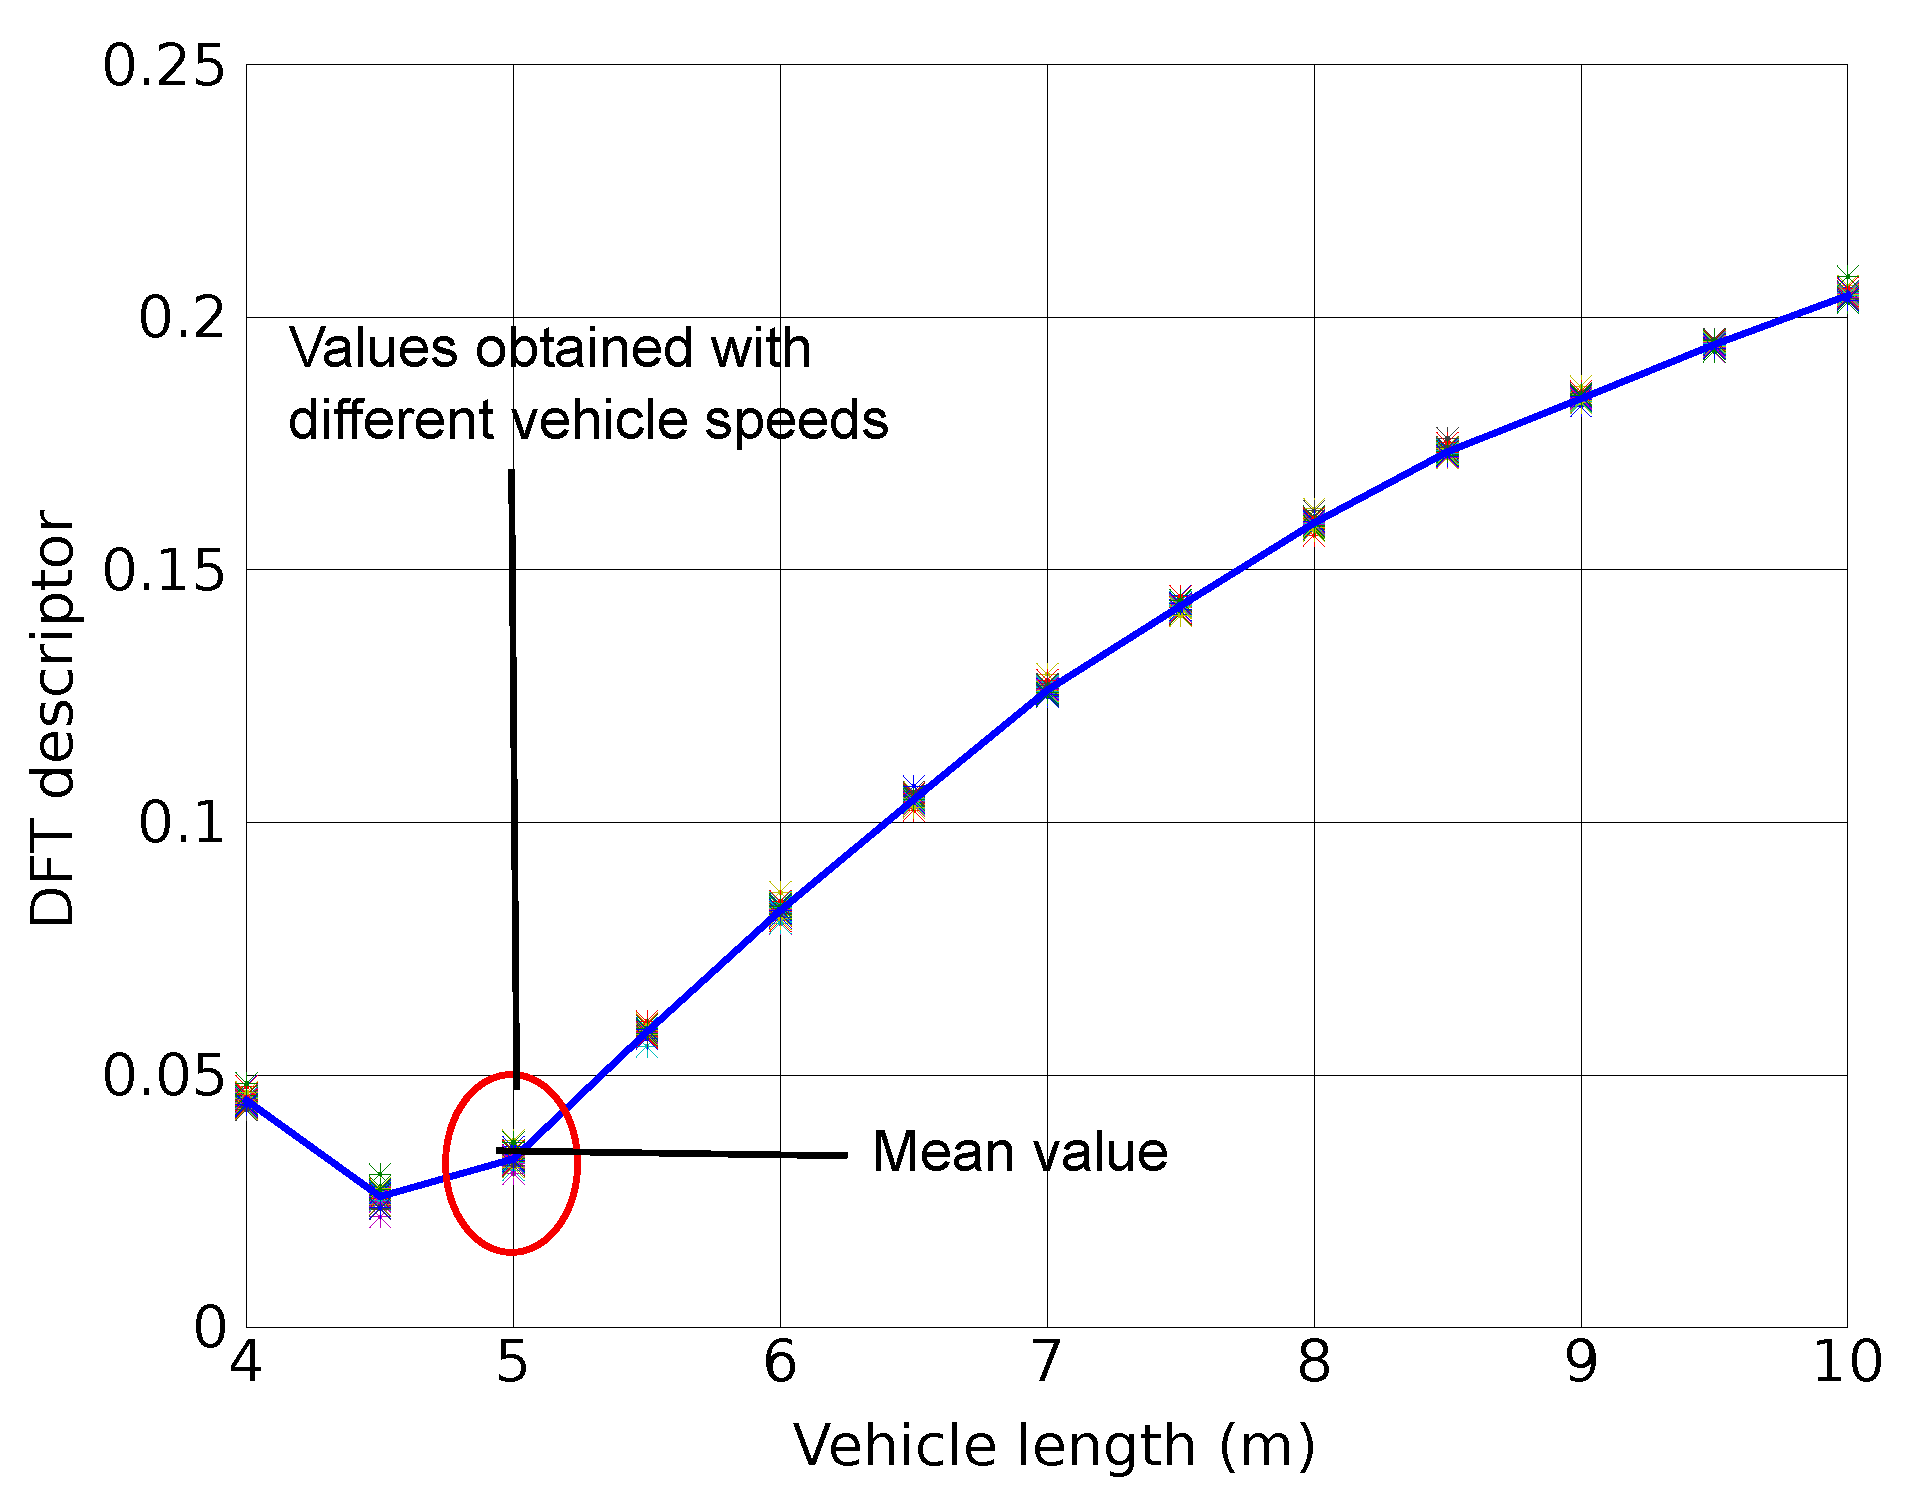
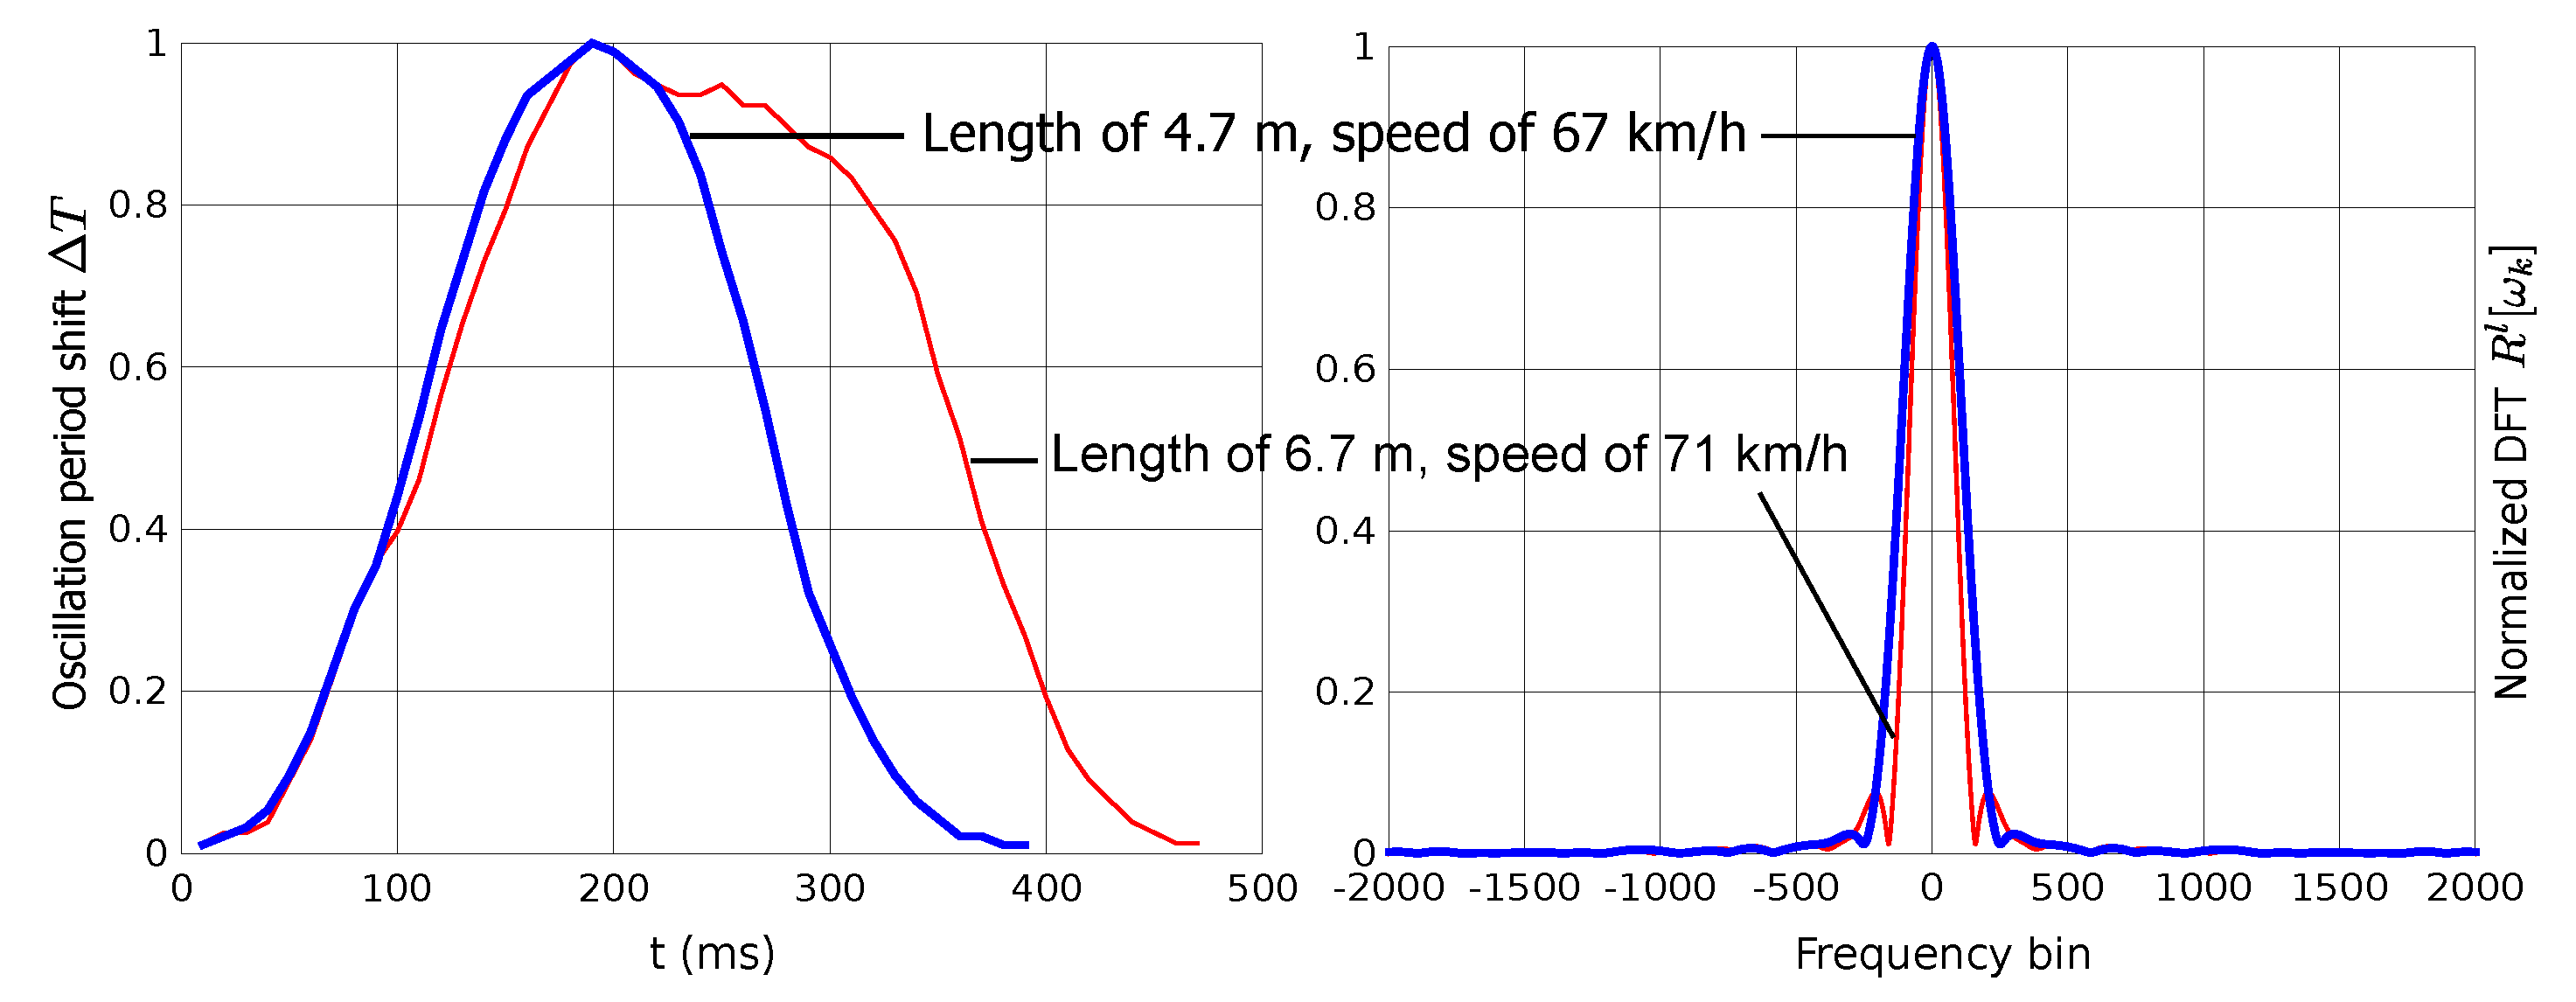
B.1. Independence on Speed
B.2. Independence on Lateral Displacement
References
- Coifmanab, B.; Neelisettyc, S. Improved Speed Estimation From Single-Loop Detectors with High Truck Flow. IEEE Trans. Intell. Transp. Syst. 2014, 18, 138–148. [Google Scholar] [CrossRef]
- Oh, S.; Ritchie, S.; Oh, C. Real-Time Traffic Measurement from Single Loop Inductive Signatures. Transp. Res. Rec. 2002, 1804, 98–106. [Google Scholar] [CrossRef]
- Gajda, J.; Sroka, R.; Stencel, M.; Wajda, A.; Zeglen, T. A vehicle classification based on inductive loop detectors. In Proceedings of the 18th IEEE Instrumentation and Measurement Technology Conference (IMTC), Budapest, Hungary, 21–23 May 2001; Volume 1, pp. 460–464.
- Jeng, S.T.; Chu, L.; Hernandez, S. Wavelet-k Nearest Neighbor Vehicle Classification Approach with Inductive Loop Signatures. Transp. Res. Rec. 2013, 2380, 72–80. [Google Scholar] [CrossRef]
- Jeng, S.T.; Ritchie, S. Real-Time Vehicle Classification Using Inductive Loop Signature Data. Transp. Res. Rec. 2008, 2086, 8–22. [Google Scholar] [CrossRef]
- Ndoye, M.; Totten, V.; Carter, B.; Bullock, D.; Krogmeier, J. Vehicle Detector Signature Processing and Vehicle Reidentification for Travel Time Estimation. In Proceedings of the 87th Annual Meeting of Transportation Research Board, Washington, DC, USA, 13–17 January 2008.
- Sun, C.; Ritchie, S. Individual Vehicle Speed Estimation Using Single Loop Inductive Waveforms. J. Transp. Eng. 1999, 125, 531–538. [Google Scholar] [CrossRef]
- Wang, Y.; Nihan, N.L. Freeway Traffic Speed Estimation with Single-Loop Outputs. Transp. Res. Rec. 2000, 1727, 120–126. [Google Scholar] [CrossRef]
- Sheik Mohammed Ali, S.; George, B.; Vanajakshi, L. An Efficient Multiple-Loop Sensor Configuration Applicable for Undisciplined Traffic. IEEE Trans. Intell. Transp. Syst. 2013, 14, 1151–1161. [Google Scholar] [CrossRef]
- Coifman, B. Using Dual Loop Speed Traps To Identify Detector Errors. Transp. Res. Rec. 1999, 1683, 47–58. [Google Scholar] [CrossRef]
- Geetharamant, G.; Sharmila Devi, C.; Arun Pandian, J. Vehicle Classification Algorithm using Fuzzy Expert Decision Set. Int. J. Appl. Innov. Eng. Manag. 2015, 4, 26–32. [Google Scholar]
- Jeng, S.T.; Chu, L. Vehicle Reidentification with the Inductive Loop Signature Technology. J. East. Asia Soc. Transp. Stud. 2013, 10, 1896–1915. [Google Scholar]
- Ki, Y.K.; Baik, D.K. Vehicle-Classification Algorithm for Single-Loop Detectors Using Neural Networks. IEEE Trans. Veh. Technol. 2006, 55, 1704–1711. [Google Scholar] [CrossRef]
- Meta, S.; Cinsdikici, M. Vehicle-Classification Algorithm Based on Component Analysis for Single-Loop Inductive Detector. IEEE Trans. Veh. Technol. 2010, 59, 2795–2805. [Google Scholar] [CrossRef]
- de Lima, G.; Silva, J.; Saotome, O. Vehicle inductive signatures recognition using a Madaline neural network. Neural Comput. Appl. 2010, 19, 421–436. [Google Scholar] [CrossRef]
- Jia, Z.; Chen, C.; Coifman, B.; Varaiya, P. The PeMS Algorithms for Accurate, Real-Time Estimates of g-factors and Speeds from Single-Loop Detectors. In Proceedings of the IEEE Intelligent Transportation Systems (ITSC), Oakland, CA, USA, 25–29 August 2001; Volume 1, pp. 536–541.
- Lu, X.Y.; Varaiya, P.; Horowitz, R.; Guo, Z.; Palen, J. Estimating Traffic Speed with Single Inductive Loop Event Data. Transp. Res. Rec. 2012, 2308, 157–166. [Google Scholar] [CrossRef]
- Klein, L.; Gibson, D.; Mills, M. Traffic Detector Handbook, 3rd ed.; Federal Highway Administration: Washington, DC, USA, 2006. [Google Scholar]
- Lamas-Seco, J.J.; Dapena, A.; González-Coma, J.P.; Castro, P.M.; Vazquez-Araujo, F.J. System for Vehicle Classification: Hardware Prototype and Off-line Signal Proccesing. In Proceedings of the IEEE Region 8 EuroCon Conference, Salamanca, Spain, 8–11 September 2015; pp. 376–379.
- Xia, Y.; Shi, X.; Song, G.; Geng, Q.; Liu, Y. Towards improving quality of video-based vehicle counting method for traffic flow estimation. Signal Process. 2014. [Google Scholar] [CrossRef]
- Xia, Y.; Wang, C.; Shi, X.; Zhang, L. Vehicles overtaking detection using RGB-D data. Signal Process. 2015, 112, 98–109. [Google Scholar] [CrossRef]
© 2015 by the authors; licensee MDPI, Basel, Switzerland. This article is an open access article distributed under the terms and conditions of the Creative Commons Attribution license (http://creativecommons.org/licenses/by/4.0/).
Share and Cite
Lamas-Seco, J.J.; Castro, P.M.; Dapena, A.; Vazquez-Araujo, F.J. Vehicle Classification Using the Discrete Fourier Transform with Traffic Inductive Sensors. Sensors 2015, 15, 27201-27214. https://doi.org/10.3390/s151027201
Lamas-Seco JJ, Castro PM, Dapena A, Vazquez-Araujo FJ. Vehicle Classification Using the Discrete Fourier Transform with Traffic Inductive Sensors. Sensors. 2015; 15(10):27201-27214. https://doi.org/10.3390/s151027201
Chicago/Turabian StyleLamas-Seco, José J., Paula M. Castro, Adriana Dapena, and Francisco J. Vazquez-Araujo. 2015. "Vehicle Classification Using the Discrete Fourier Transform with Traffic Inductive Sensors" Sensors 15, no. 10: 27201-27214. https://doi.org/10.3390/s151027201