
Probe and Sensors Development for Level Measurement of Fats, Oils and Grease in Grease Boxes


Abstract
:1. Introduction
2. Theoretical Basis and Methods
2.1. Grease Boxes
- Continuous measurement sensors that are able to provide the actual level of the liquid; and
- Presence measurement sensors, which can only provide a confirmation that the liquid has actually reached the level where the sensor is installed [14].
2.2. Detecting the Level of FOG Inside A Container
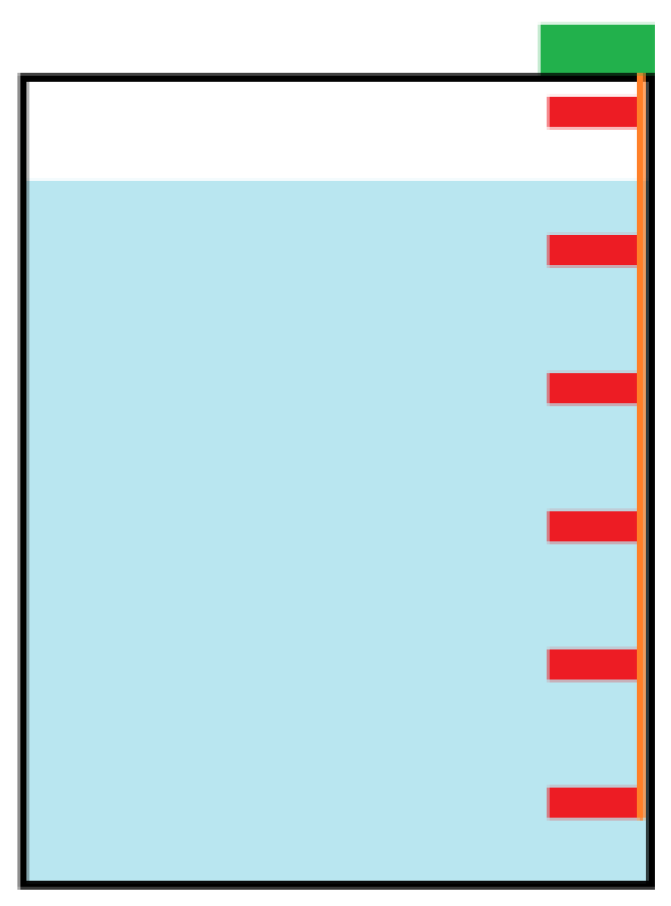
2.2.1. Conductivity Sensor
2.2.2. Level Buoy with Magnetic Sensor
2.2.3. Optical Sensor
2.2.4. Density Sensor with a Load Cell
2.2.5. Capacitance Sensor
3. FOG Level Detection: Implementation and Results
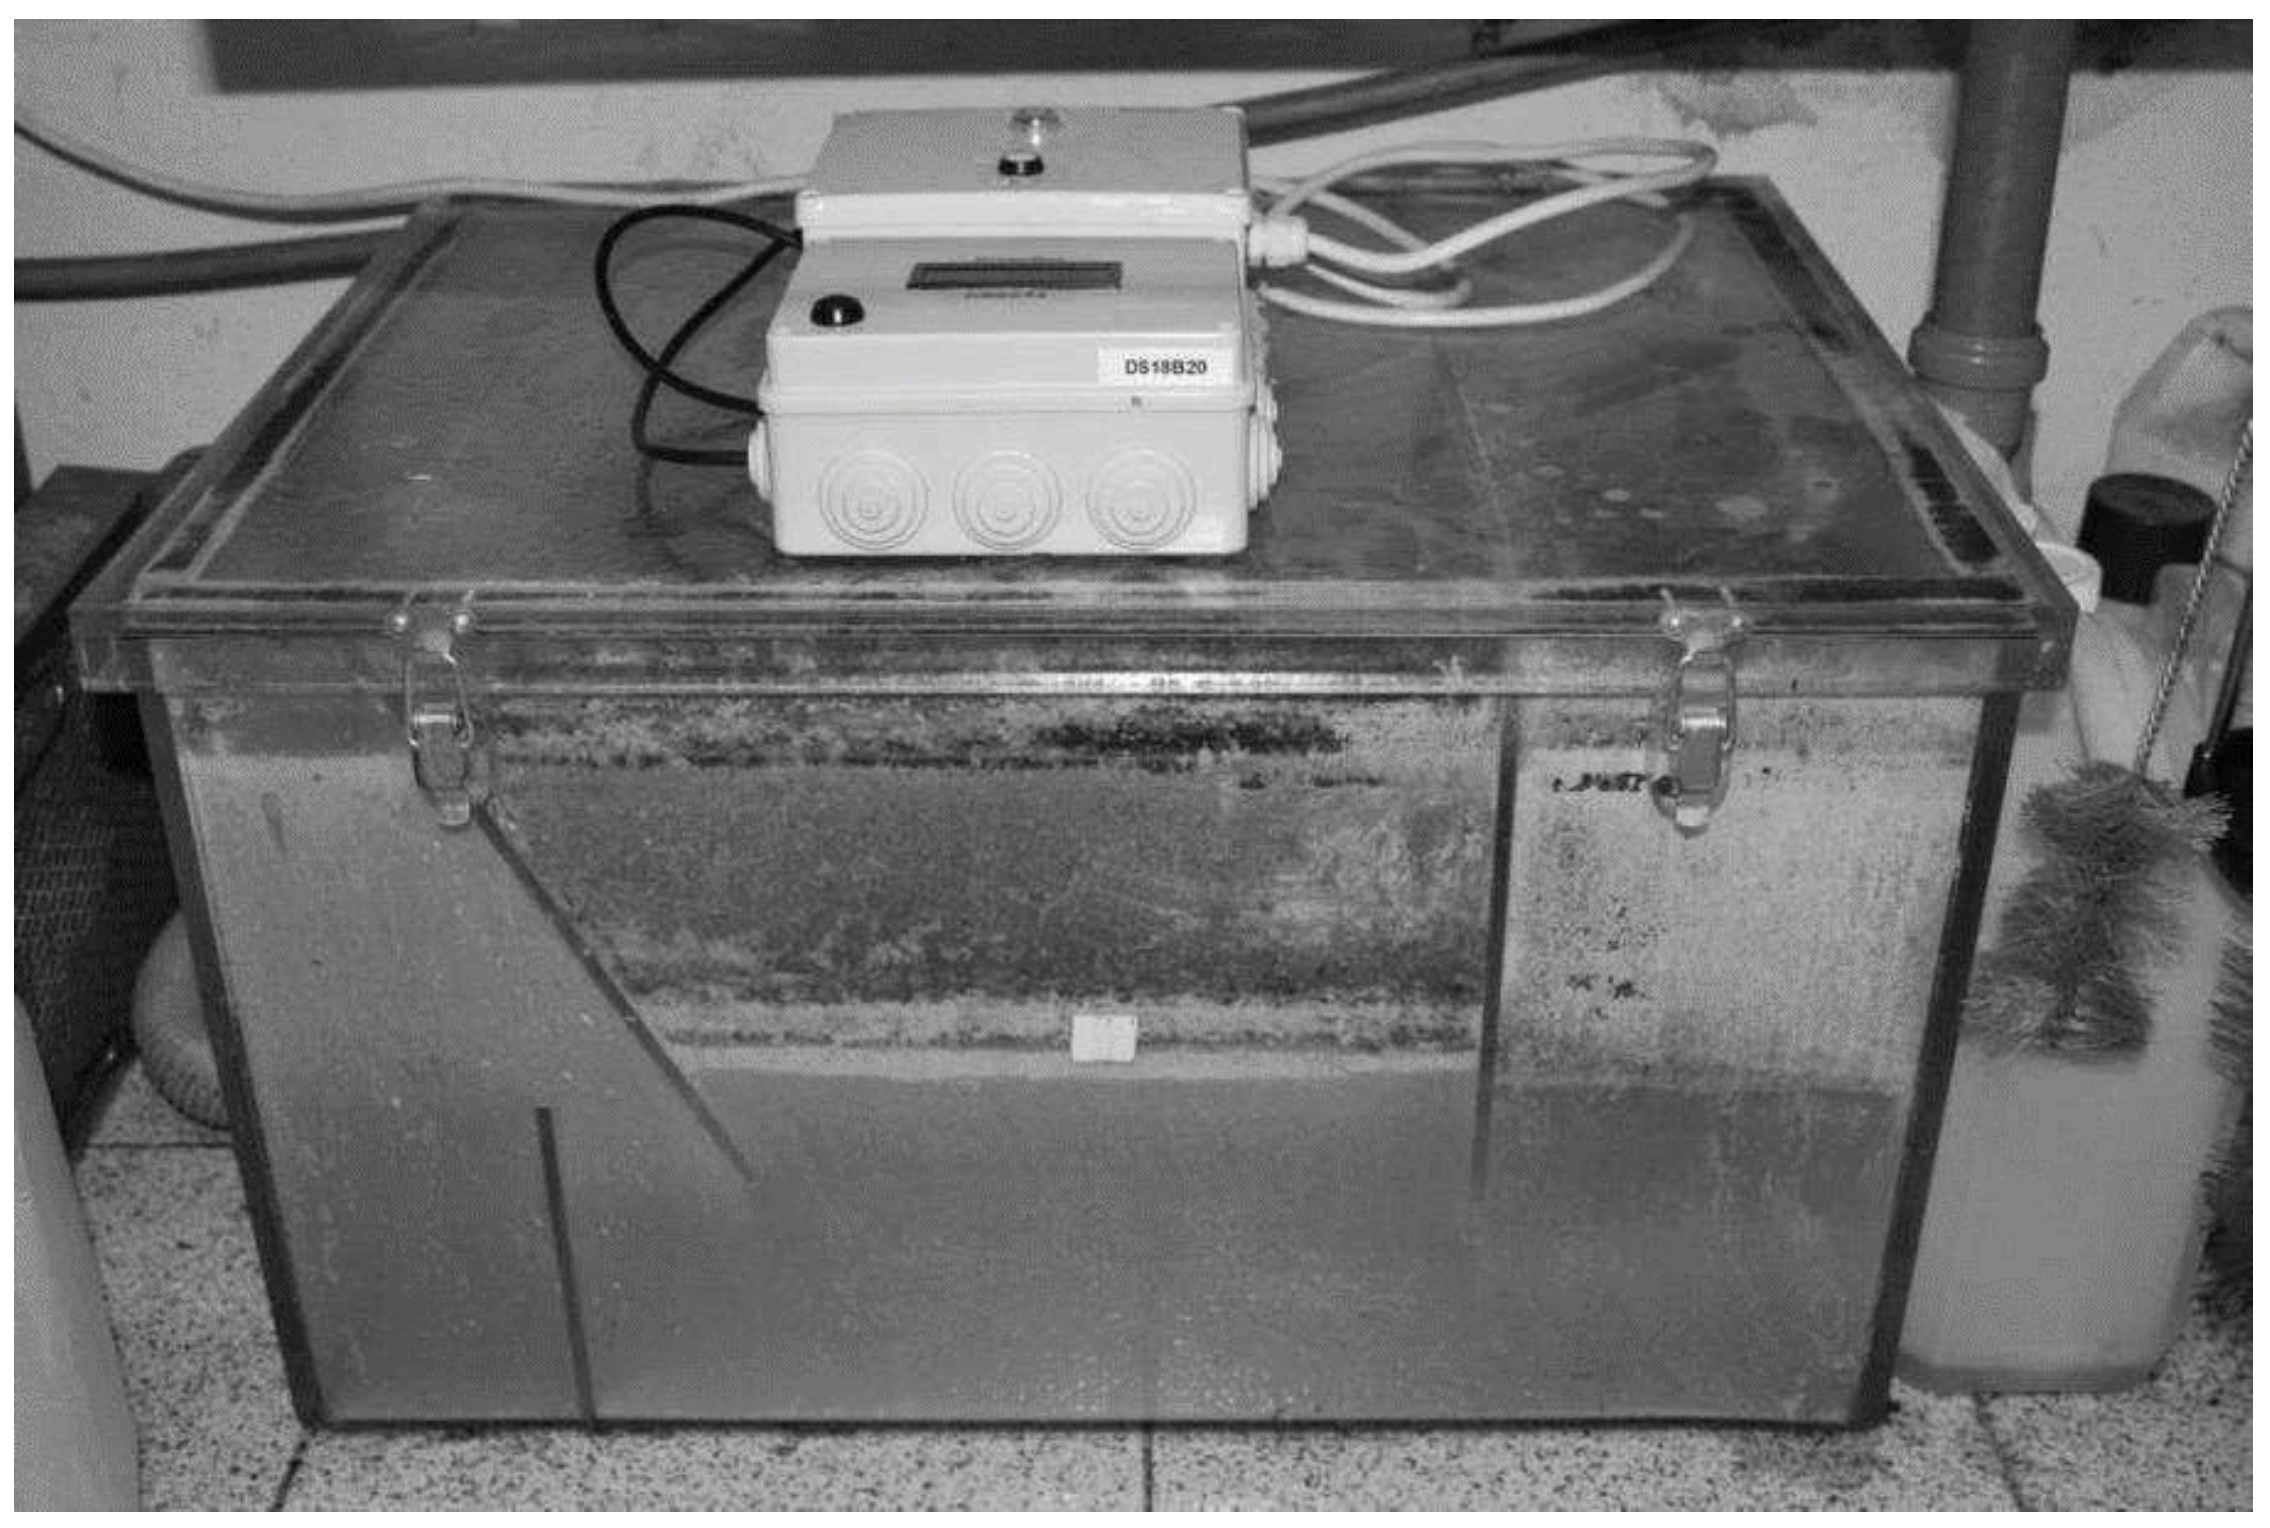
3.1. The Laboratory Development Environment and Test Bed
3.2. Conductivity Probe
3.3. Density Probe
3.4. Capacitance Probe
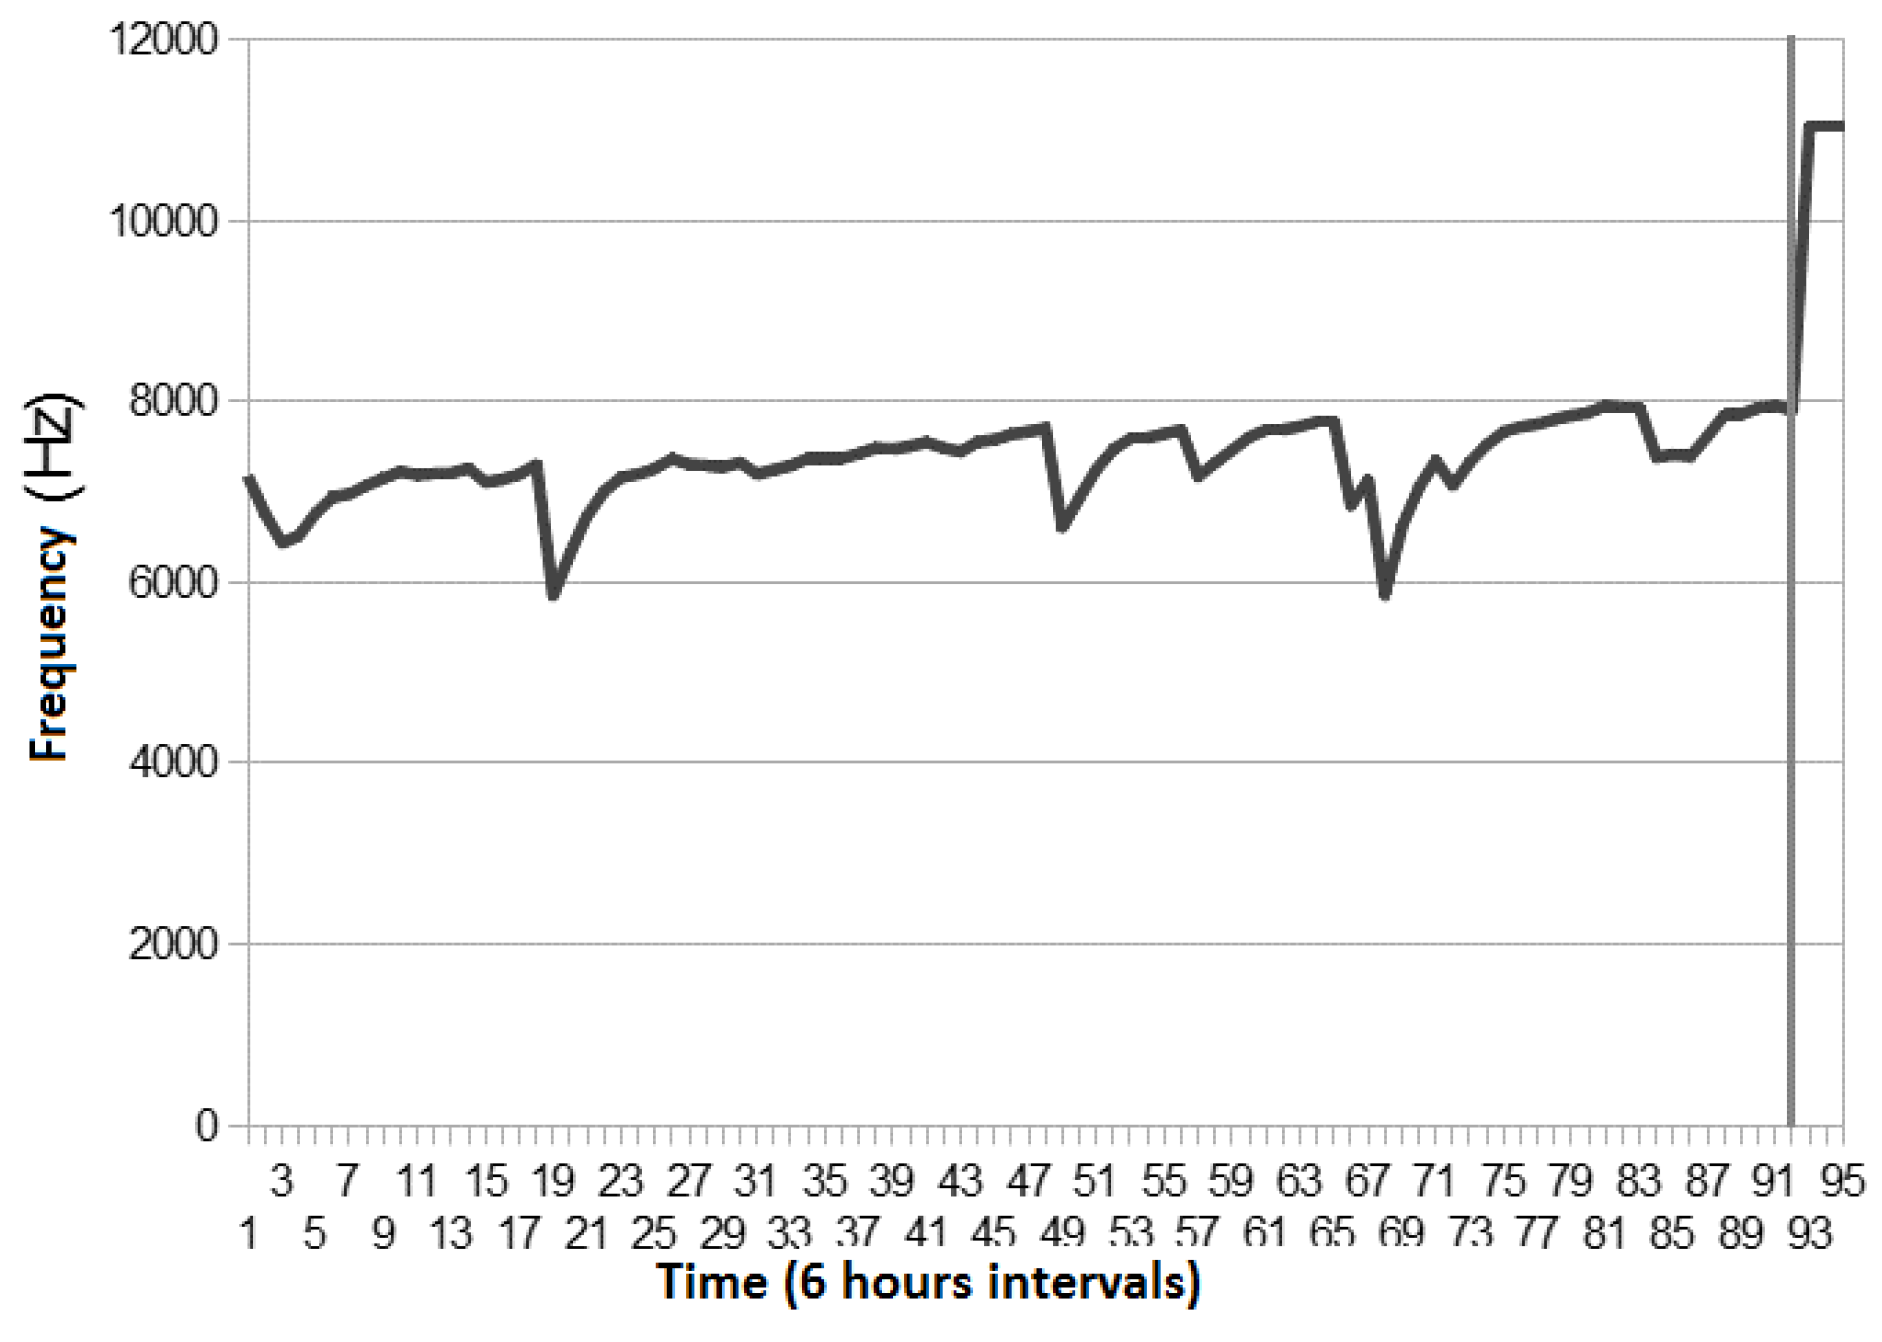
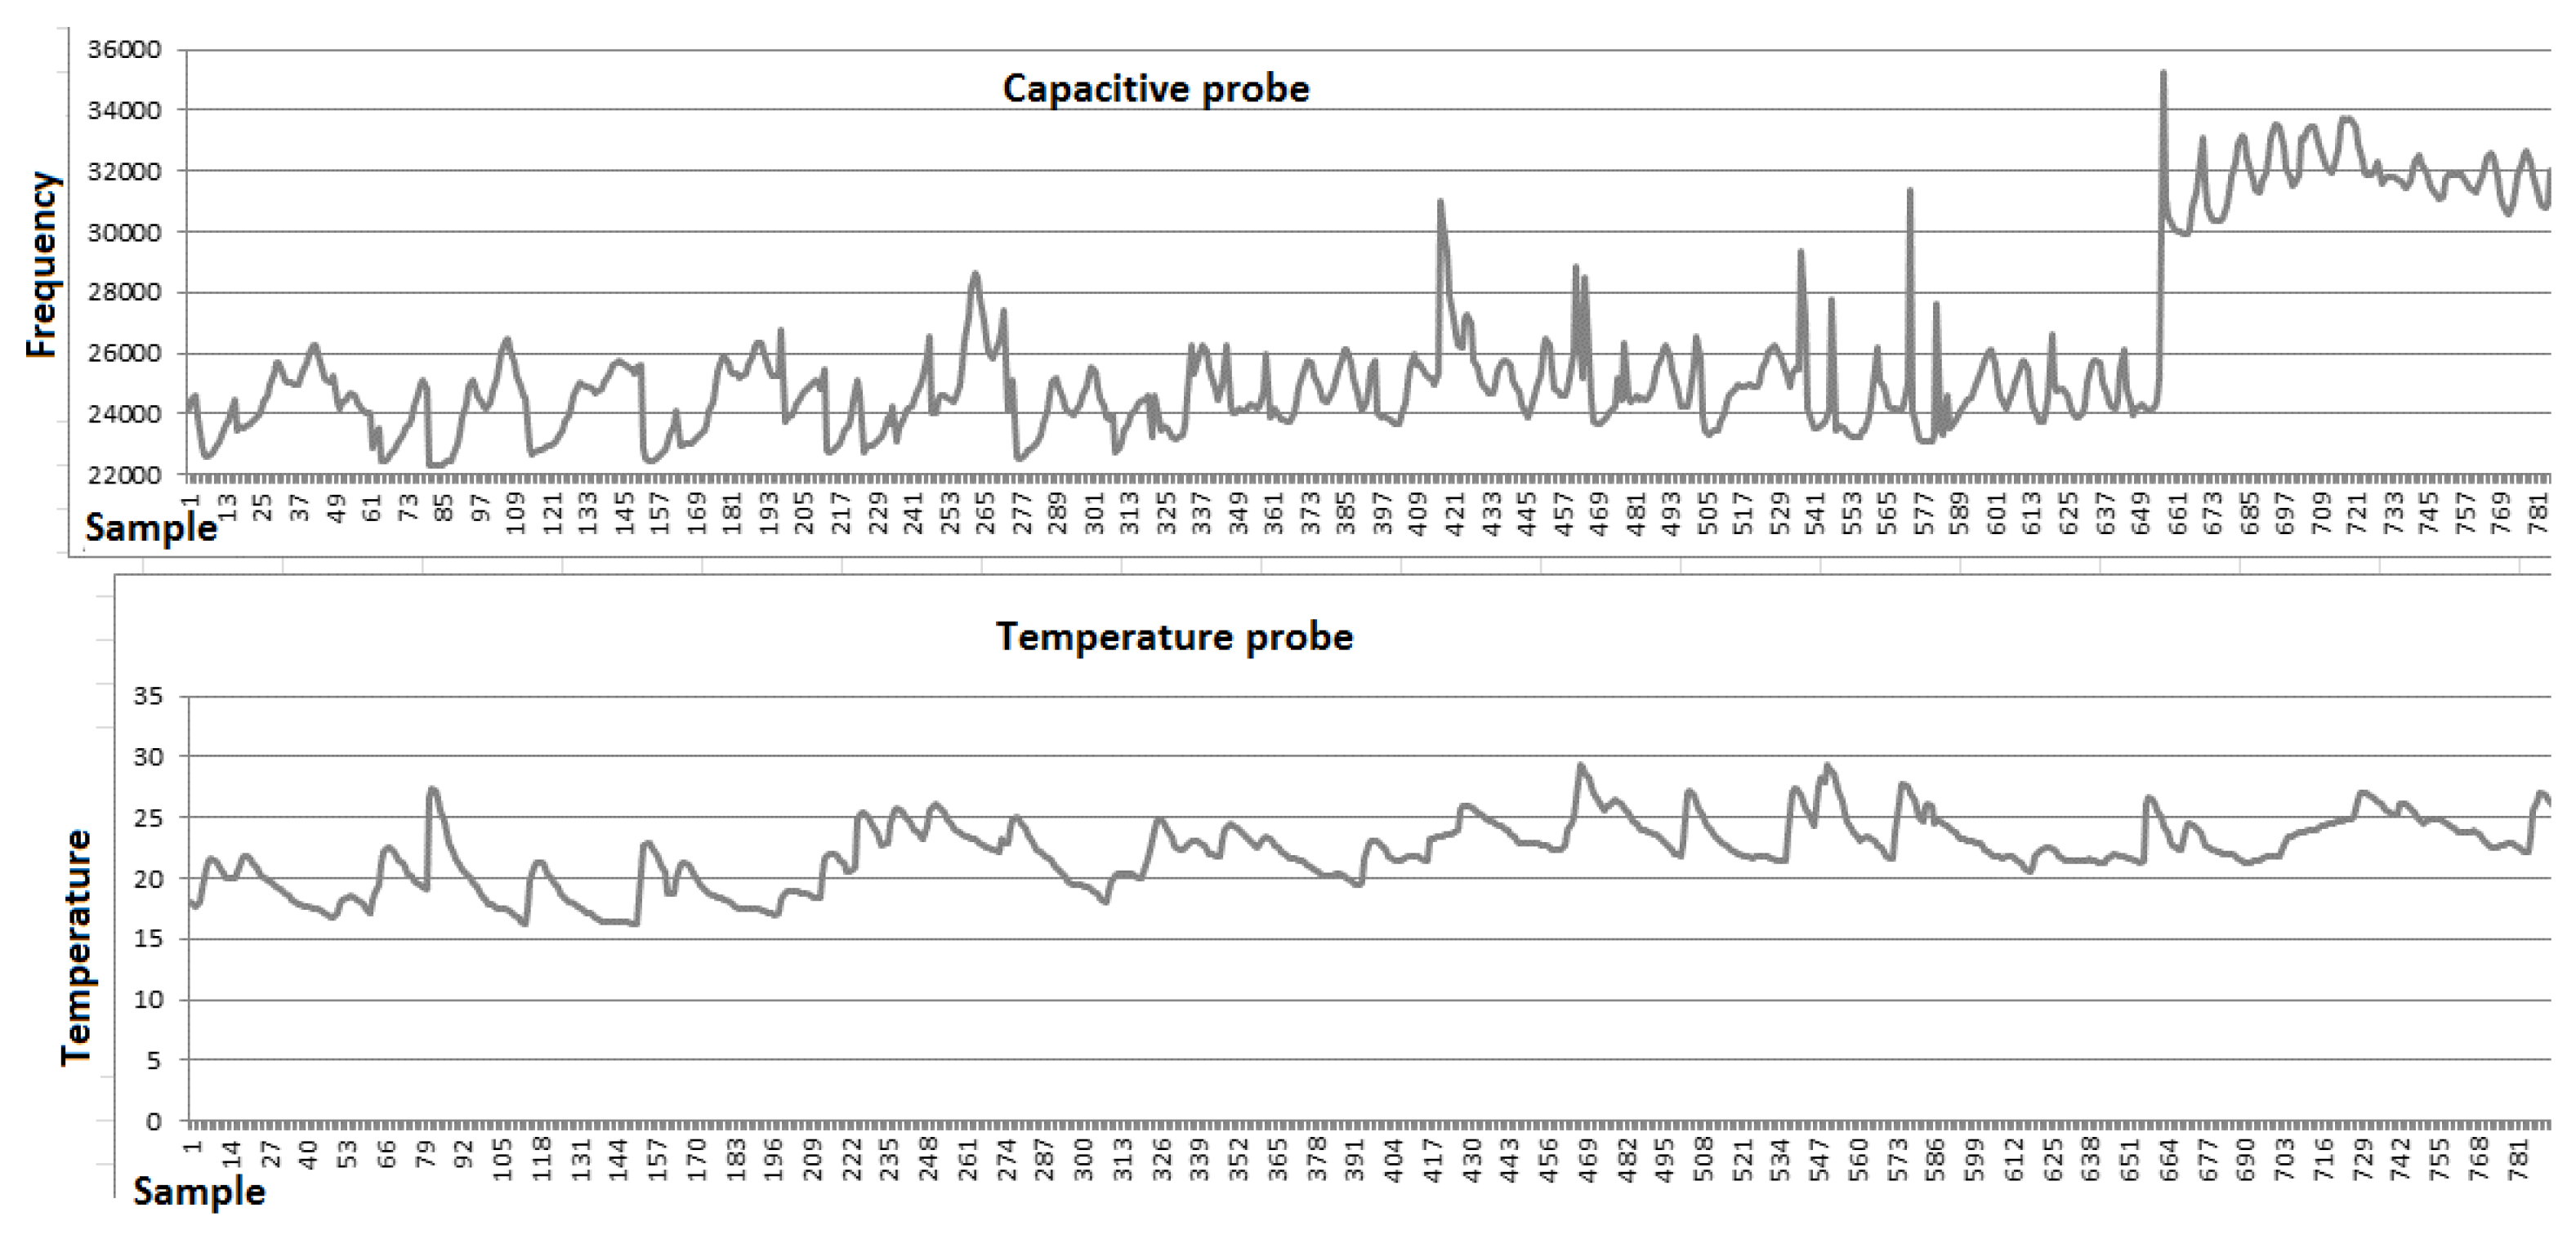
3.5. Testing the Capacitance Probe
3.6. Production Capacitive Probe
4. Discussion and Conclusions
5. Other Application and Future Work
Acknowledgments
Author Contributions
Conflicts of Interest
References
- Ackroyd, R. FOG’s place is in the kitchen: Serious problems can result when grease enters the municipal/sanitary system. PM Eng. 2007, 13, 42. [Google Scholar]
- Quinn, J.M.; McFarlane, P.N. Effects of slaughterhouse and dairy factory wastewaters on epilithon: A comparison in laboratory streams. Water Res. 1989, 23, 1267–1273. [Google Scholar] [CrossRef]
- McKelvey, R.W.; Robertson, I.; Whitehead, P.E. Effect of non-petroleum oil spills on wintering birds near Vancouver. Mari. Pollut. Bull. 1980, 11, 169–171. [Google Scholar] [CrossRef]
- Water UK. Available online: http://www.water.org.uk/home/policy/publications/archive/recycling/fogbrochure/fogbest-practice.pdf (accessed on 23 July 2015).
- He, X. Characterization of Grease Interceptors for Removing Fat, Oil and Grease (FOG) and Mechanisms of FOG Deposit Formation in Sewer Systems. Ph.D. Thesis, North Carolina State University, Raleigh, NC, USA, November 2012. [Google Scholar]
- Zlateff, D. FAQ: Fats, Oil and Grease (FOG). Available online: http://www.issaquahwa.gov/index.aspx?nid=407 (accessed on 14 September 2016).
- He, X.; Iasmin, M.; Dean, L.O.; Lappi, S.E.; Ducoste, J.J.; De los Reyes, F.L., III. Evidence for Fat, Oil, and Grease (FOG) Deposit Formation Mechanisms in Sewer Lines. Environ. Sci. Technol. 2011, 45, 4385–4391. [Google Scholar] [CrossRef] [PubMed]
- Crise chegou em força ao sector da restauração. Available online: http://www.tsf.pt/PaginaInicial/Economia/Interior.aspx?content_id=1795734 (accessed on 14 May 2013).
- Al-Shudeifat, M.A.; Donaldson, A.B. Combustion of waste trap grease oil in gas turbine generator. Fuel 2010, 89, 549–553. [Google Scholar] [CrossRef]
- Montefrio, M.J.; Xinwen, T.; Obbard, J.P. Recovery and pre-treatment of fats, oil and grease from grease interceptors for biodiesel production. Appl. Energy 2010, 87, 3155–3161. [Google Scholar] [CrossRef]
- Altın, R.; Cetinkaya, S.; Yücesu, H.S. The potential of using vegetableoil fuels as fuel for diesel engines. Energy Convers. Manag. 2001, 42, 529–538. [Google Scholar] [CrossRef]
- British Standards Institution. Grease Separators. Principles of Design, Performance and Testing, Marking and Quality Control; BS EN 1825-1; BSI: London, UK, 2004; p. 8. [Google Scholar]
- Do Ambiente, M. Decreto-Lei 236/98 de 1 de Agosto. DIÁRIO DA REPÚBLICA — I SÉRIE-A 1998, 176, 3676–3722. (In Portuguese) [Google Scholar]
- Iwamoto, K.; Kamata, I. Liquid-level sensor with optical fibers. Appl. Opt. 1992, 31, 51–54. [Google Scholar] [CrossRef] [PubMed]
- Gurevich, V. Electric Relays: Principles and Applications; CRC Press: New York, NY, USA, 2005; p. 671. [Google Scholar]
- Ramsden, E. Hall-Effect Sensors: Theory and Applications; Elsevier/Newnes: Oxford, UK, 2006. [Google Scholar]
- Tregay, G.W.; Conax Buffalo Corporation. Optical liquid level sensor using a polytetrafluoroethylene perfluoroalkoxy material. U.S. Patent 4,998,022, 5 March 1991. [Google Scholar]
- Elert, G. Index of Refraction of Vegetable Oil. 2006. Available online: http://hypertextbook.com/facts/2006/TingTingLuo.shtml (accessed on 20 April 2016).
- Vass, G. The Principles of Level Measurement. 2000. Available online: http://www.sensorsmag.com/sensors/leak-level/the-principles-level-measurement-941 (accessed on 17 June 2016).
- Building Automation Products Inc. Understanding 4-20 mA Current Loops; Application Note; Building Automation Products Inc.: Gays Mills, WI, USA, 2006. [Google Scholar]
- Schuler, E. A Practical Guide to Radio Frequency Level Controls; AMETEK Drexelbrook: Horsham, PA, USA, 1989. [Google Scholar]
- OMEGA ENGINEERING, Inc. Capacitance Continuous Level Measurement Probes. Available online: http://www.omega.com/ppt/pptsc.asp?ref=LV3000_LV4000&ttID=LV3000_LV4000&Nav= (accessed on 4 July 2016).
- Pratt, S. Capacitance Sensors for Human Interfaces; Ask the Application Engineer; Analog Dialogue: Norwood, MA, USA, October 2006. [Google Scholar]
- Digi International Inc. XBee® ZB. Available online: http://www.digi.com/products/wireless-wired-embedded-solutions/zigbee-rfmodules/zigbee-mesh-module/xbee-zb-module#overview (accessed on 21 June 2012).
- Digi International Inc. What is API (Application Programming Interface) Mode and How Does It Work? Available online: http://www.digi.com/support/kbase/kbaseresultdetl?id=2184 (accessed on 21 June 2012).
- Atmel Corporation. ATmega328P Datasheet. Available online: http://www.atmel.com/Images/Atmel-42735-8-bit-AVR-Microcontroller-ATmega328-328P_datasheet.pdf (accessed on 24 June 2016).
- Analog Devices, Inc. AD623: Single Supply, Rail-Rail, Low Cost Instrumentation Amplifier. Available online: http://www.analog.com/en/specialtyamplifiers/instrumentation-amplifiers/ad623/products/product.html (accessed on 24 June 2016).
- Fairchild Semiconductor. AN-118 - CMOS Oscilators; Application Note; Fairchild Semiconductor Corporation: Sunnyvale, CA, USA, 1974. [Google Scholar]
- NXP Semiconductors. General Purpose CMOS Timer. Available online: http://www.nxp.com/documents/data_sheet/ICM7555.pdf (accessed on 24 June 2016).
- Maxim Integrated Products. DS18B20 Datasheet – Programmable Resolution 1-Wire Digital Thermometer. Available online: http://pdfserv.maximintegrated.com/en/ds/DS18B20.pdf (accessed on 24 June 2016).
- Atmel Corporation. ATtiny13A Datasheet. Available online: http://www.atmel.com/Images/doc8126.pdf (accessed on 29 June 2016).
- Atmel Corporation. ATtiny25 Datasheet. Available online: http://www.atmel.com/Images/doc2586.pdf (accessed on 29 June 2016).
- Atmel Corporation. AVR307: Half Duplex UART Using the USI Module. Available online: http://www.atmel.com/Images/doc4300.pdf (accessed on 29 June 2016).
- Paret, D.; Fenger, C. The I2C Bus: from Theory to Practice; John Wiley and Sons Ltd: New York, NY, USA, 1997. [Google Scholar]
- Crump, S. SMBus Compatibility with an I2C Device; Application Report; Texas Instruments: Dallas, TX, USA, 2009. [Google Scholar]
- NXP Semiconductors. I2C-bus Specification and User Manual. Available online: http://www.nxp.com/documents/user_manual/UM10204.pdf (accessed on 29 June 2016).
- ON Semiconductor. How to Read Temperature through I2C Bus for NCT75-based Thermostat. Available online: http://www.onsemi.com/pub_link/Collateral/AND9032-D.PDF (accessed on 29 June 2016).
- Dangerous Prototypes. Open Bench Logic Sniffer. Available online: http://dangerousprototypes.com/docs/Open_Bench_Logic_Sniffer (accessed on 29 June 2016).
- Hexadecimal Object File Format Specification. Available online: http://microsym.com/editor/assets/intelhex.pdf (accessed on 29 June 2016).
- Dean, B.S. AVRDUDE - AVR Downloader/UploaDEr. Available online: http://www.nongnu.org/avrdude/ (accessed on 21 June 2016).
- YS. Fuse Bits Aren’t That Scary. Available online: http://embedderslife.wordpress.com/2012/08/20/fuse-bits-arent-that-scary/ (accessed on 21 June 2016).
- Ferrando, M.P. Troubleshooting I2C Bus Protocol; Application Report; Texas Instruments: Santa Clara, CA, USA, 2009. [Google Scholar]


| Temperature (°C) | ADC | Frequency (Hz) |
|---|---|---|
| 10 | 704 | 87,303 |
| 11 | 696 | 87,026 |
| 12 | 684 | 86,873 |
| 13 | 671 | 86,545 |
| 14 | 655 | 85,988 |
| 15 | 639 | 85,670 |
| 17 | 624 | 85,288 |
| 18 | 608 | 84,937 |
| 21 | 560 | 83,427 |
| 24 | 526 | 82,833 |
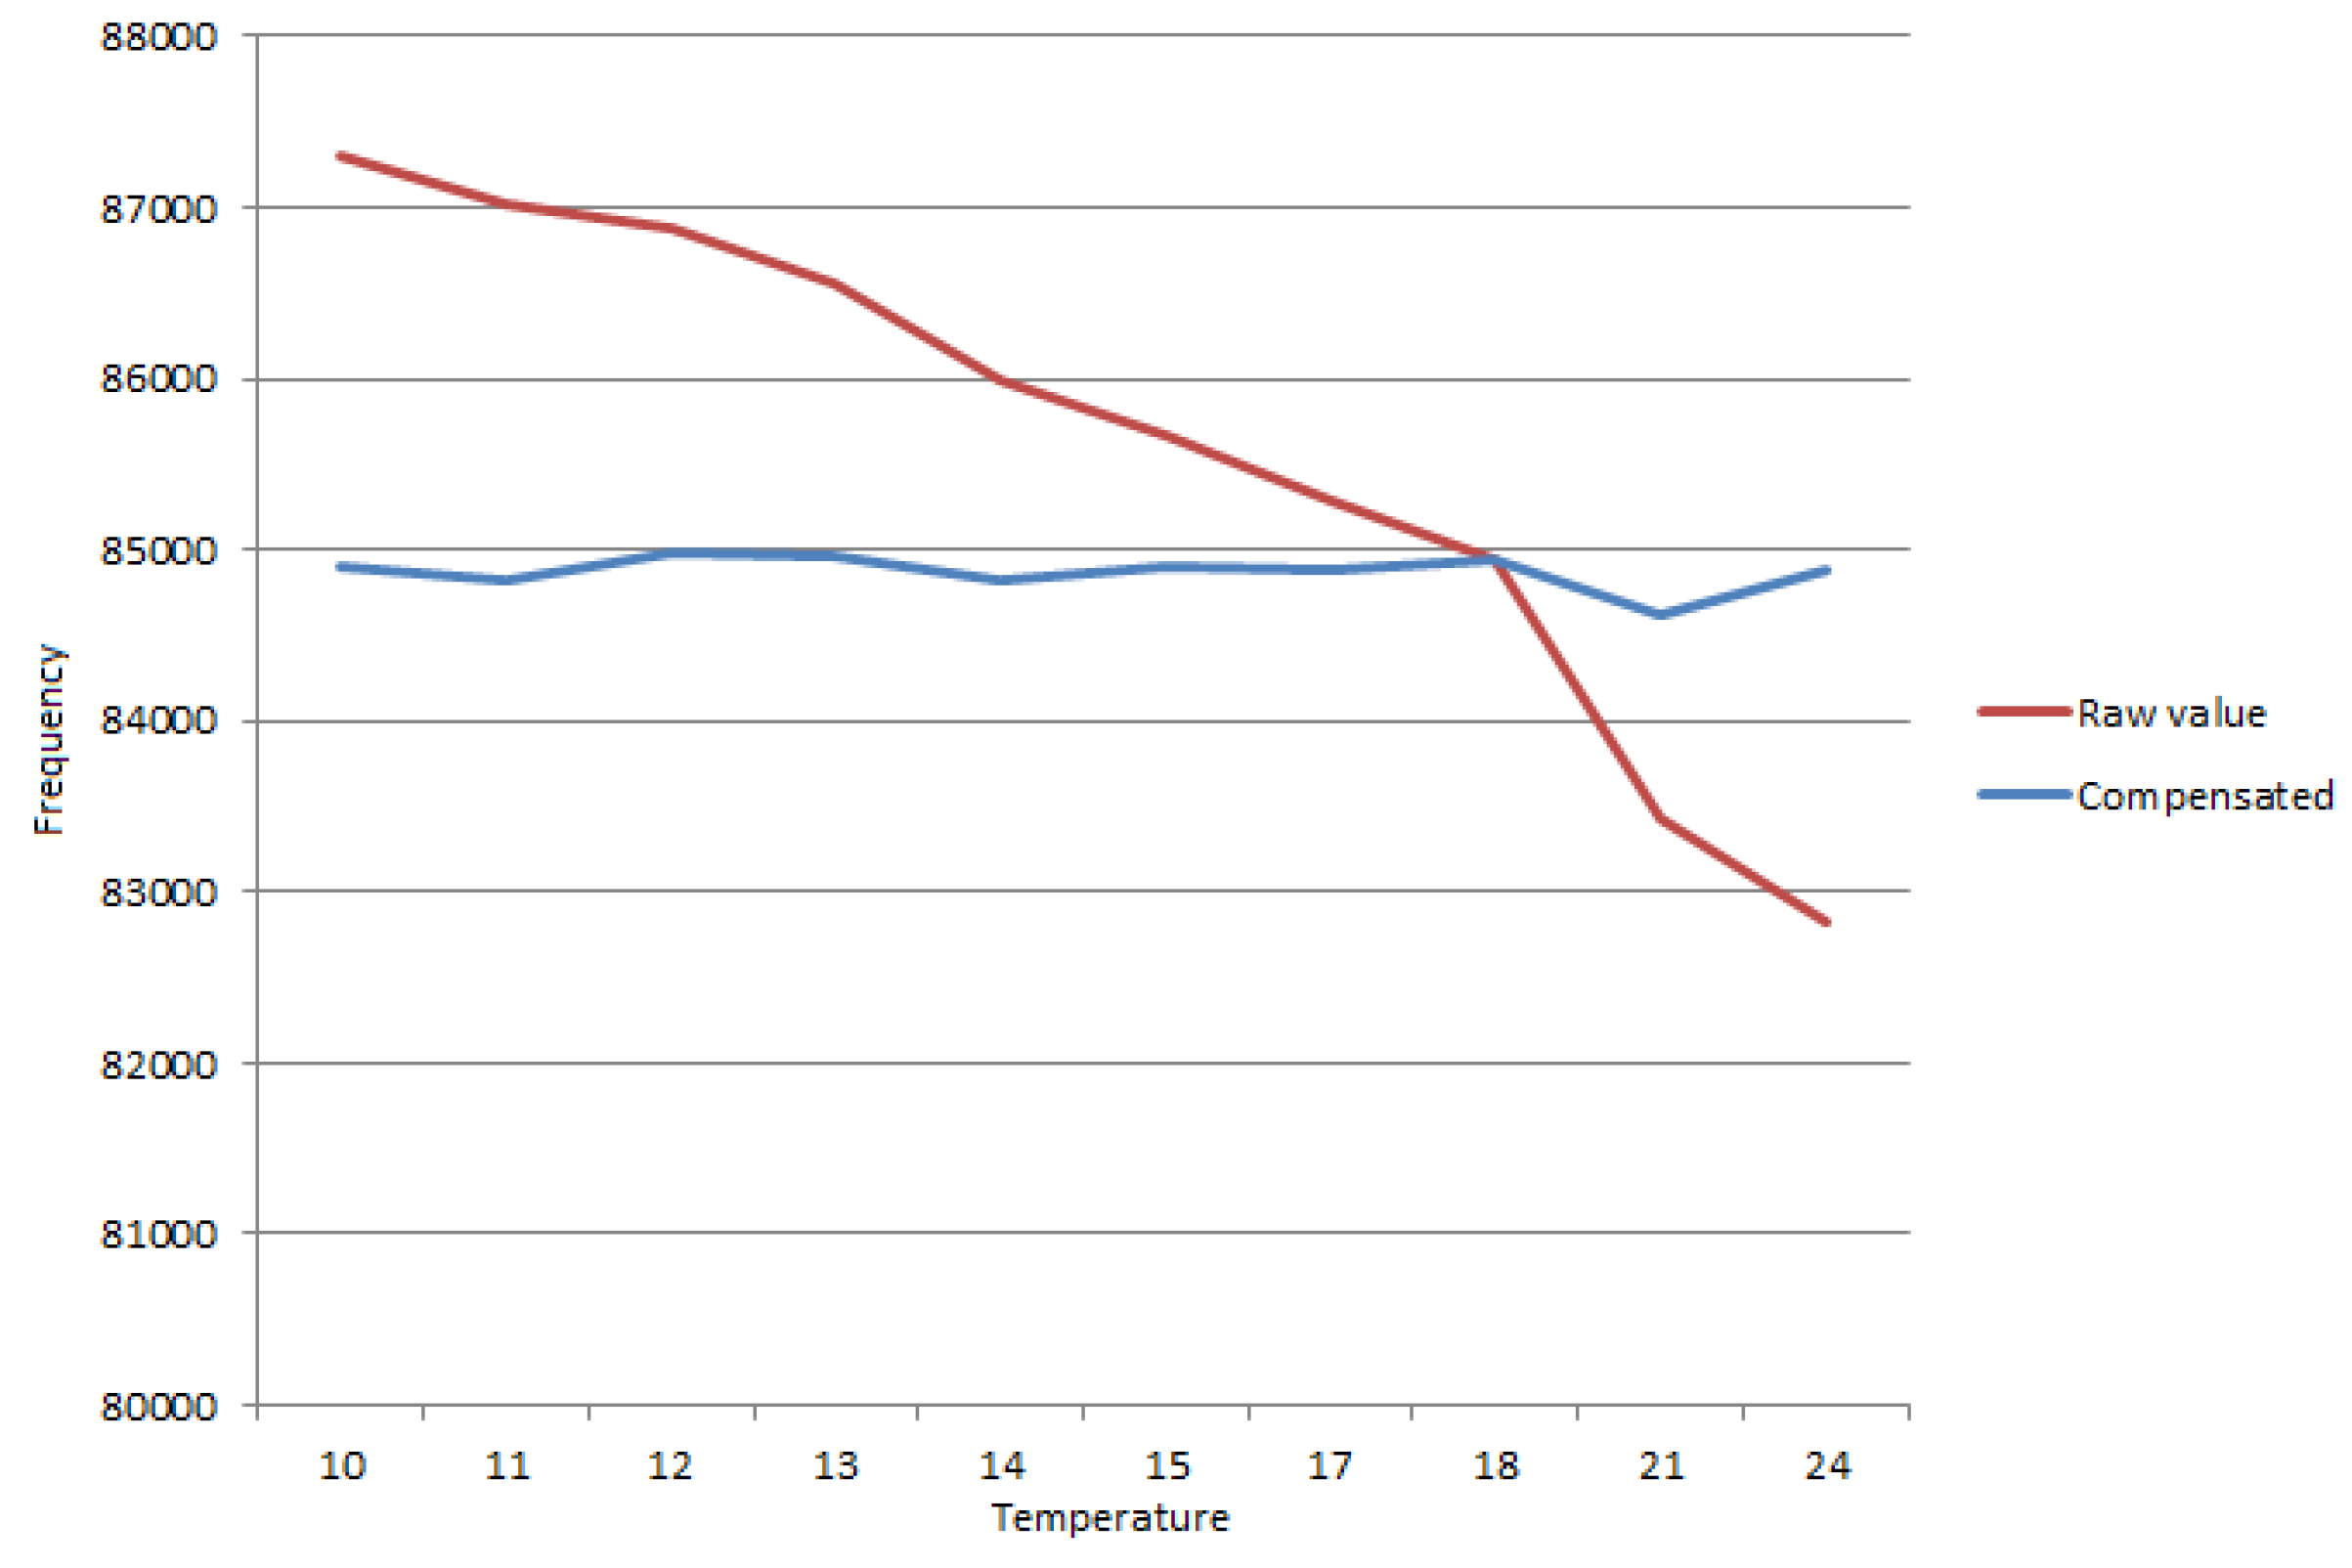
| Temperature (°C) | ADC | Frequency (Hz) | Compensated (Hz) |
|---|---|---|---|
| 10 | 704 | 87,303 | 84,903 |
| 11 | 696 | 87,026 | 84,826 |
| 12 | 684 | 86,873 | 84,973 |
| 13 | 671 | 86,545 | 84,970 |
| 14 | 655 | 85,988 | 84,813 |
| 15 | 639 | 85,670 | 84,895 |
| 17 | 624 | 85,288 | 84,888 |
| 18 | 608 | 84,937 | 84,937 |
| 21 | 560 | 83,427 | 84,627 |
| 24 | 526 | 82,833 | 84,883 |
| Command (byte) | Operation Description | Parameters (sent bytes) | Reply (received bytes) |
|---|---|---|---|
| 0 × 61 | Aquire sample | 0 | 6 |
| 0 × 65 | Change I2C address | 1 | 1 |
| 0 × 63 | Define CAL | 2 | 2 |
| 0 × 6B | Define k | 1 | 1 |
| 0 × 6C | Read configuration | 0 | 4 |
| 0 × 74 | Read temperature | 0 | 2 |
| 0 × 78 | Calibrate | 0 | 2 |
| 0 × 43 | Turn compensation on/off | 1 | 1 |
| 0 × 73 | Read serial number | 0 | 8 |
| Byte | 1 | 2 | 3 | 4 | 5 | 6 |
|---|---|---|---|---|---|---|
| Value in Figure 26 | 0 × 00 | 0 × 02 | 0 × F4 | 0 × 01 | 0 × F2 | 0 × 16 |
| Frequency (MSB) | Frequency | Frequency (LSB) | ADC | ADC | Check |
| Substance | Frequency (Hz) | Temperature (°C) |
|---|---|---|
| Water | 4450 | 24 |
| Air | 10,617 | 27 |
| Rice | 8310 | 23 |
| Corn | 6857 | 23 |
| Moist sand | 4510 | 23 |
| Dry earth | 10,555 | 25 |
| Wet earth | 5917 | 20 |
© 2016 by the authors; licensee MDPI, Basel, Switzerland. This article is an open access article distributed under the terms and conditions of the Creative Commons Attribution (CC-BY) license (http://creativecommons.org/licenses/by/4.0/).
Share and Cite
Faria, J.; Sousa, A.; Reis, A.; Filipe, V.; Barroso, J. Probe and Sensors Development for Level Measurement of Fats, Oils and Grease in Grease Boxes. Sensors 2016, 16, 1517. https://doi.org/10.3390/s16091517
Faria J, Sousa A, Reis A, Filipe V, Barroso J. Probe and Sensors Development for Level Measurement of Fats, Oils and Grease in Grease Boxes. Sensors. 2016; 16(9):1517. https://doi.org/10.3390/s16091517
Chicago/Turabian StyleFaria, José, André Sousa, Arsénio Reis, Vitor Filipe, and João Barroso. 2016. "Probe and Sensors Development for Level Measurement of Fats, Oils and Grease in Grease Boxes" Sensors 16, no. 9: 1517. https://doi.org/10.3390/s16091517