
A Fiber-Optic Sensor for Acoustic Emission Detection in a High Voltage Cable System

 and
and 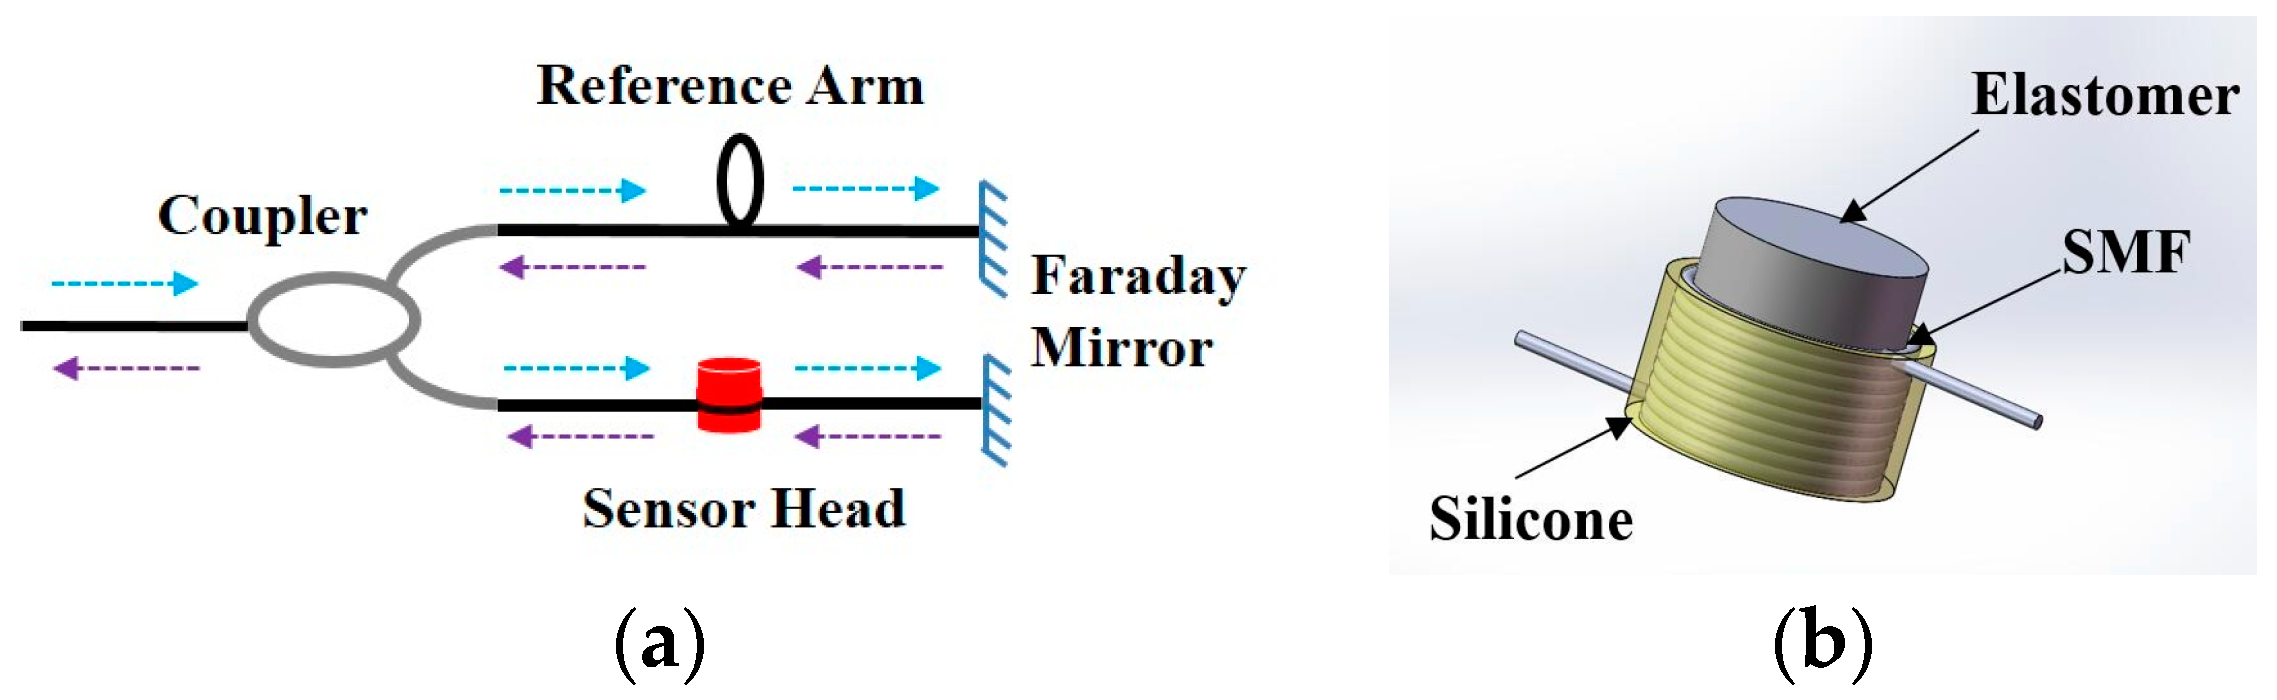
Abstract
:1. Introduction
2. Sensing Principle
3. Characterization of Michelson Interferometer-Based Fiber Sensor for Acoustic Emission Detection
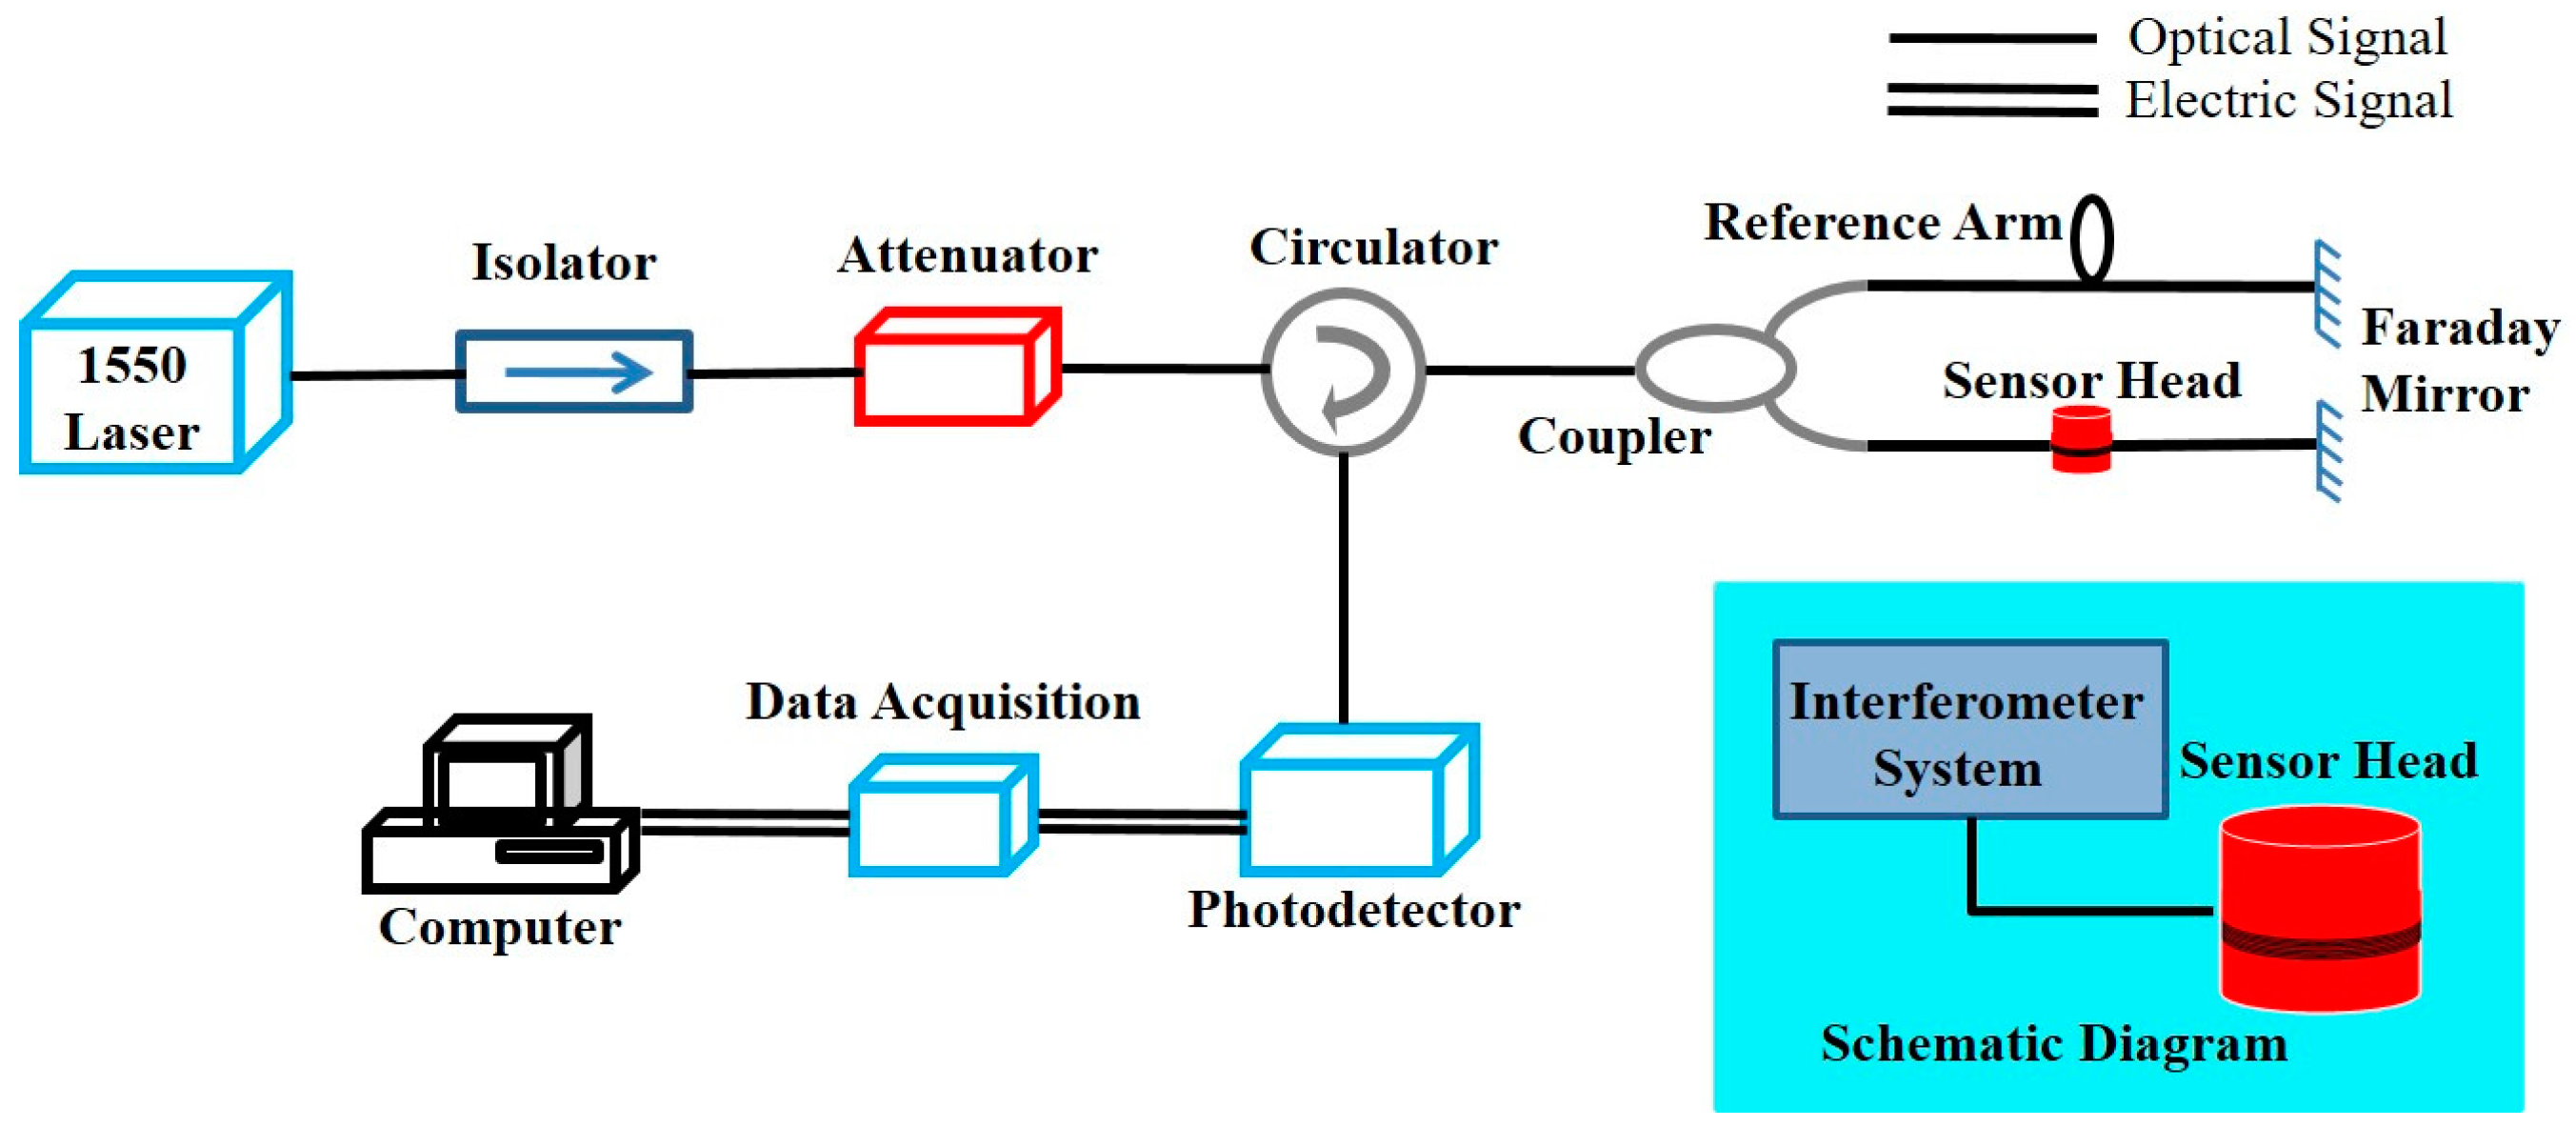
3.1. Experimental Setup of Michelson Interferometer-Based Fiber Sensing System
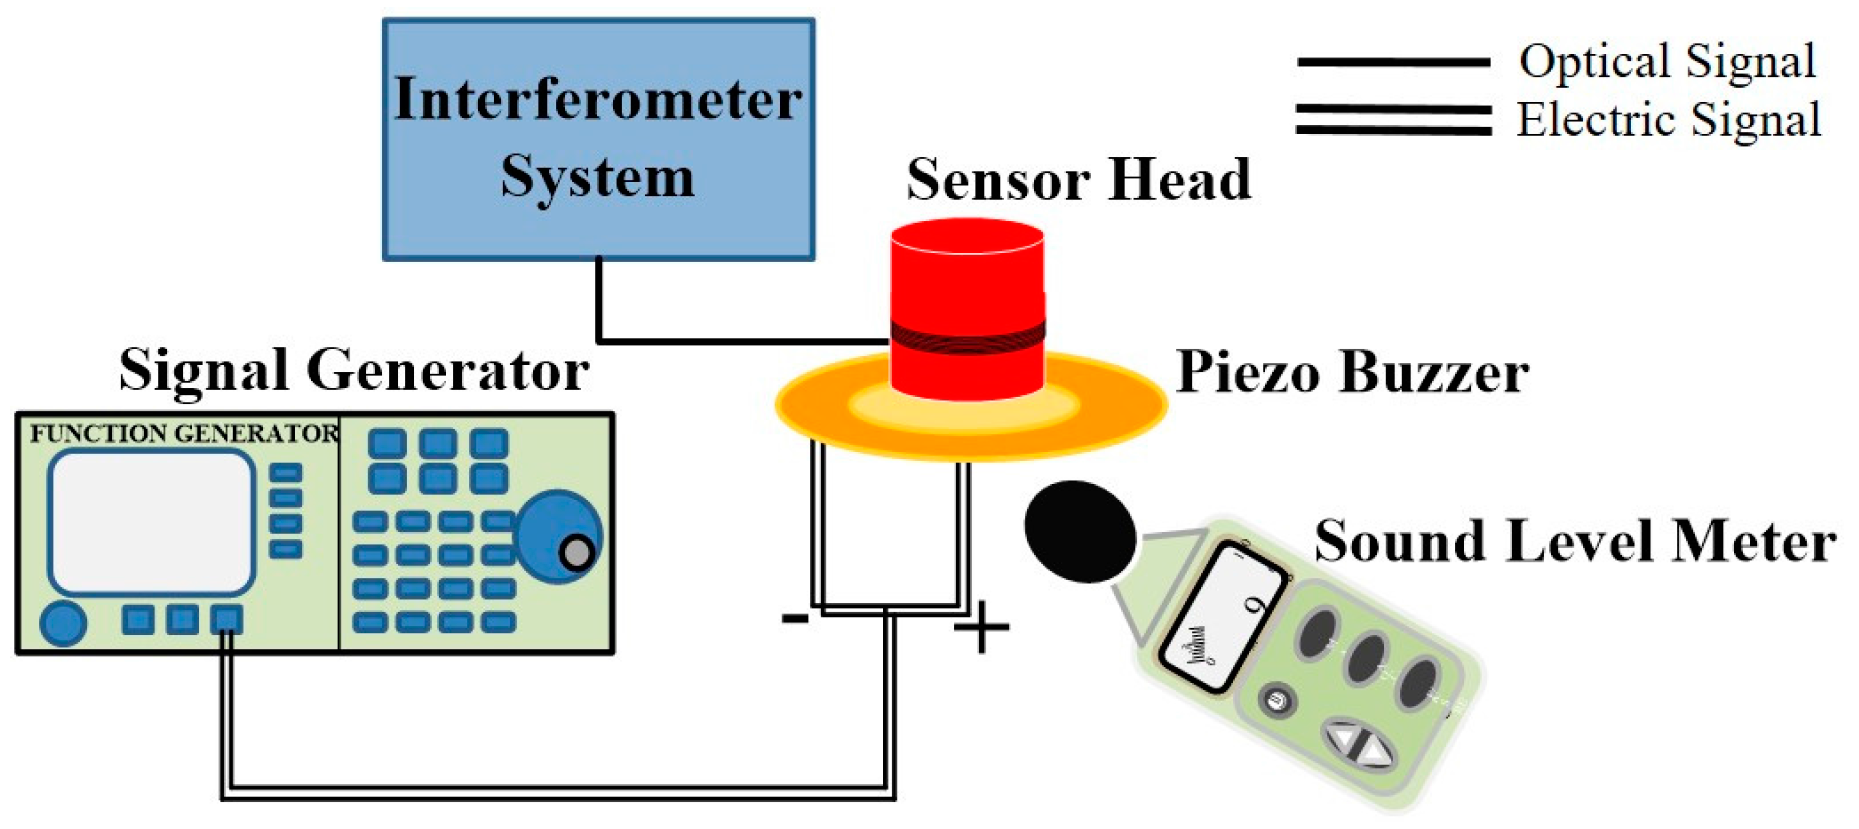
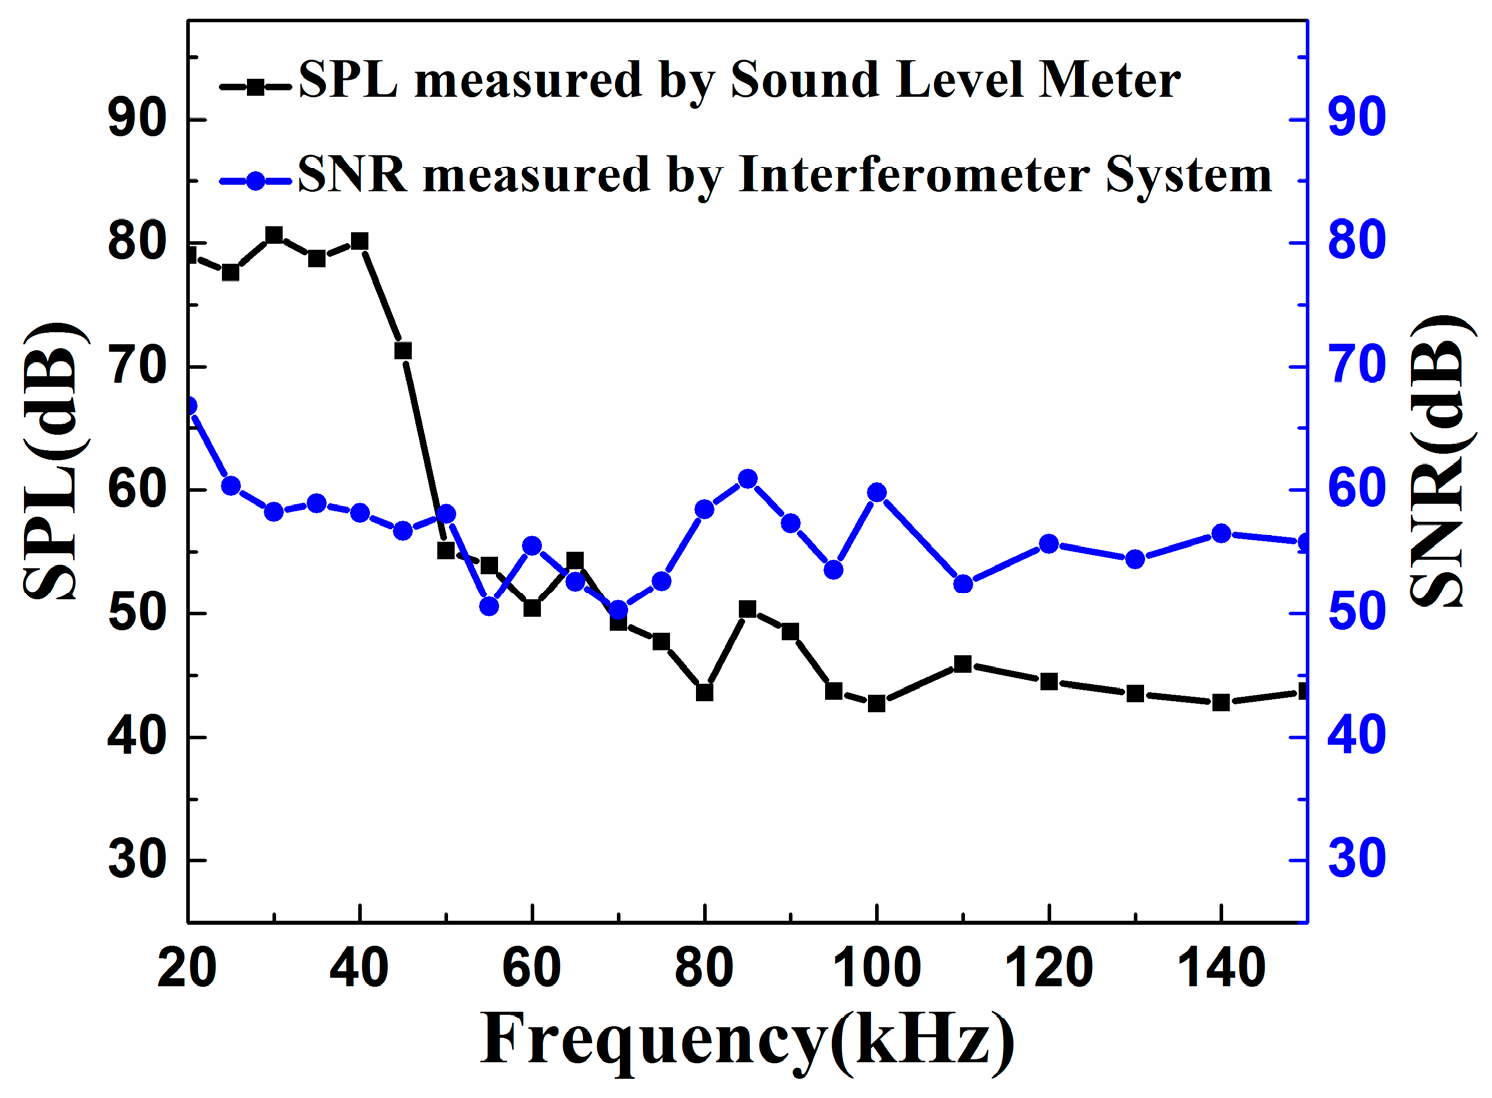
3.2. Characterziation of Frequency Response and Sensitivity of the Proposed Sensing System
4. Detection of Acoustic Emission by High Voltage Partial Discharge
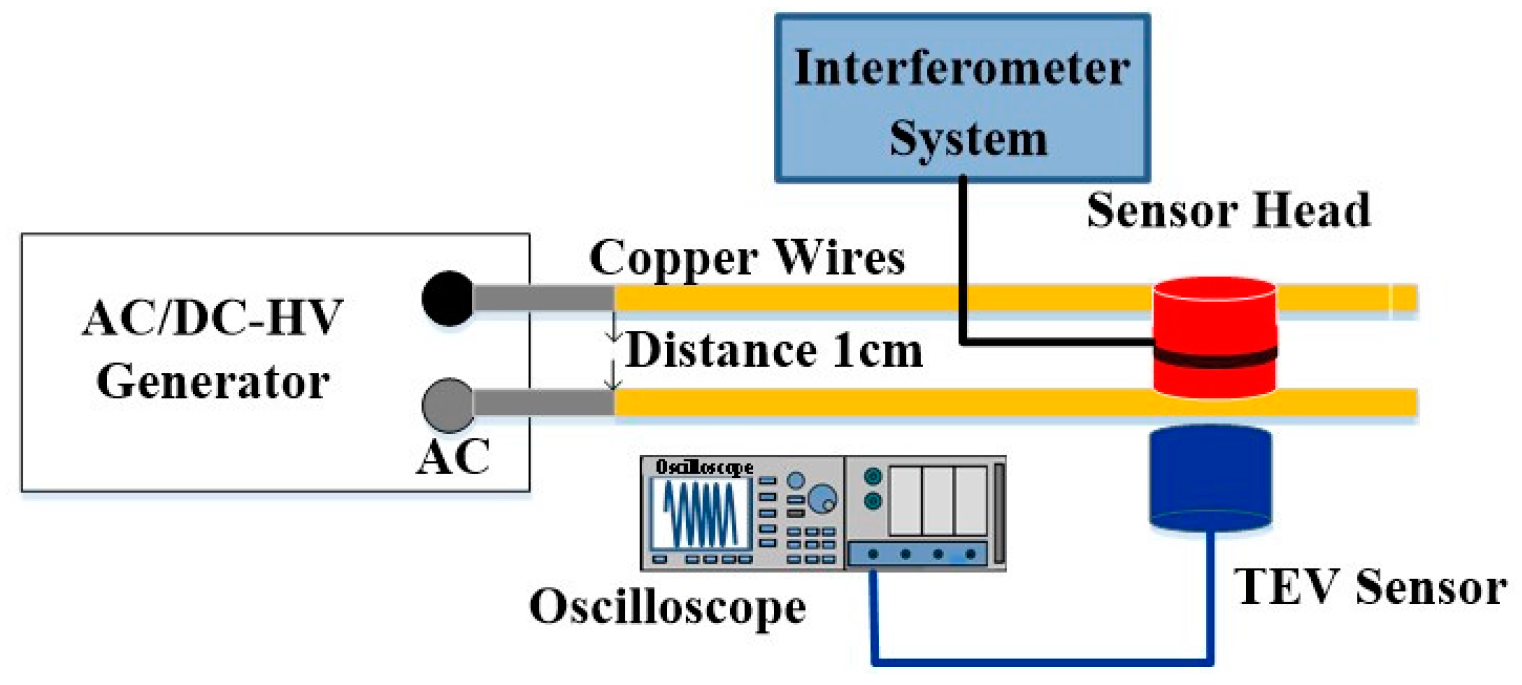
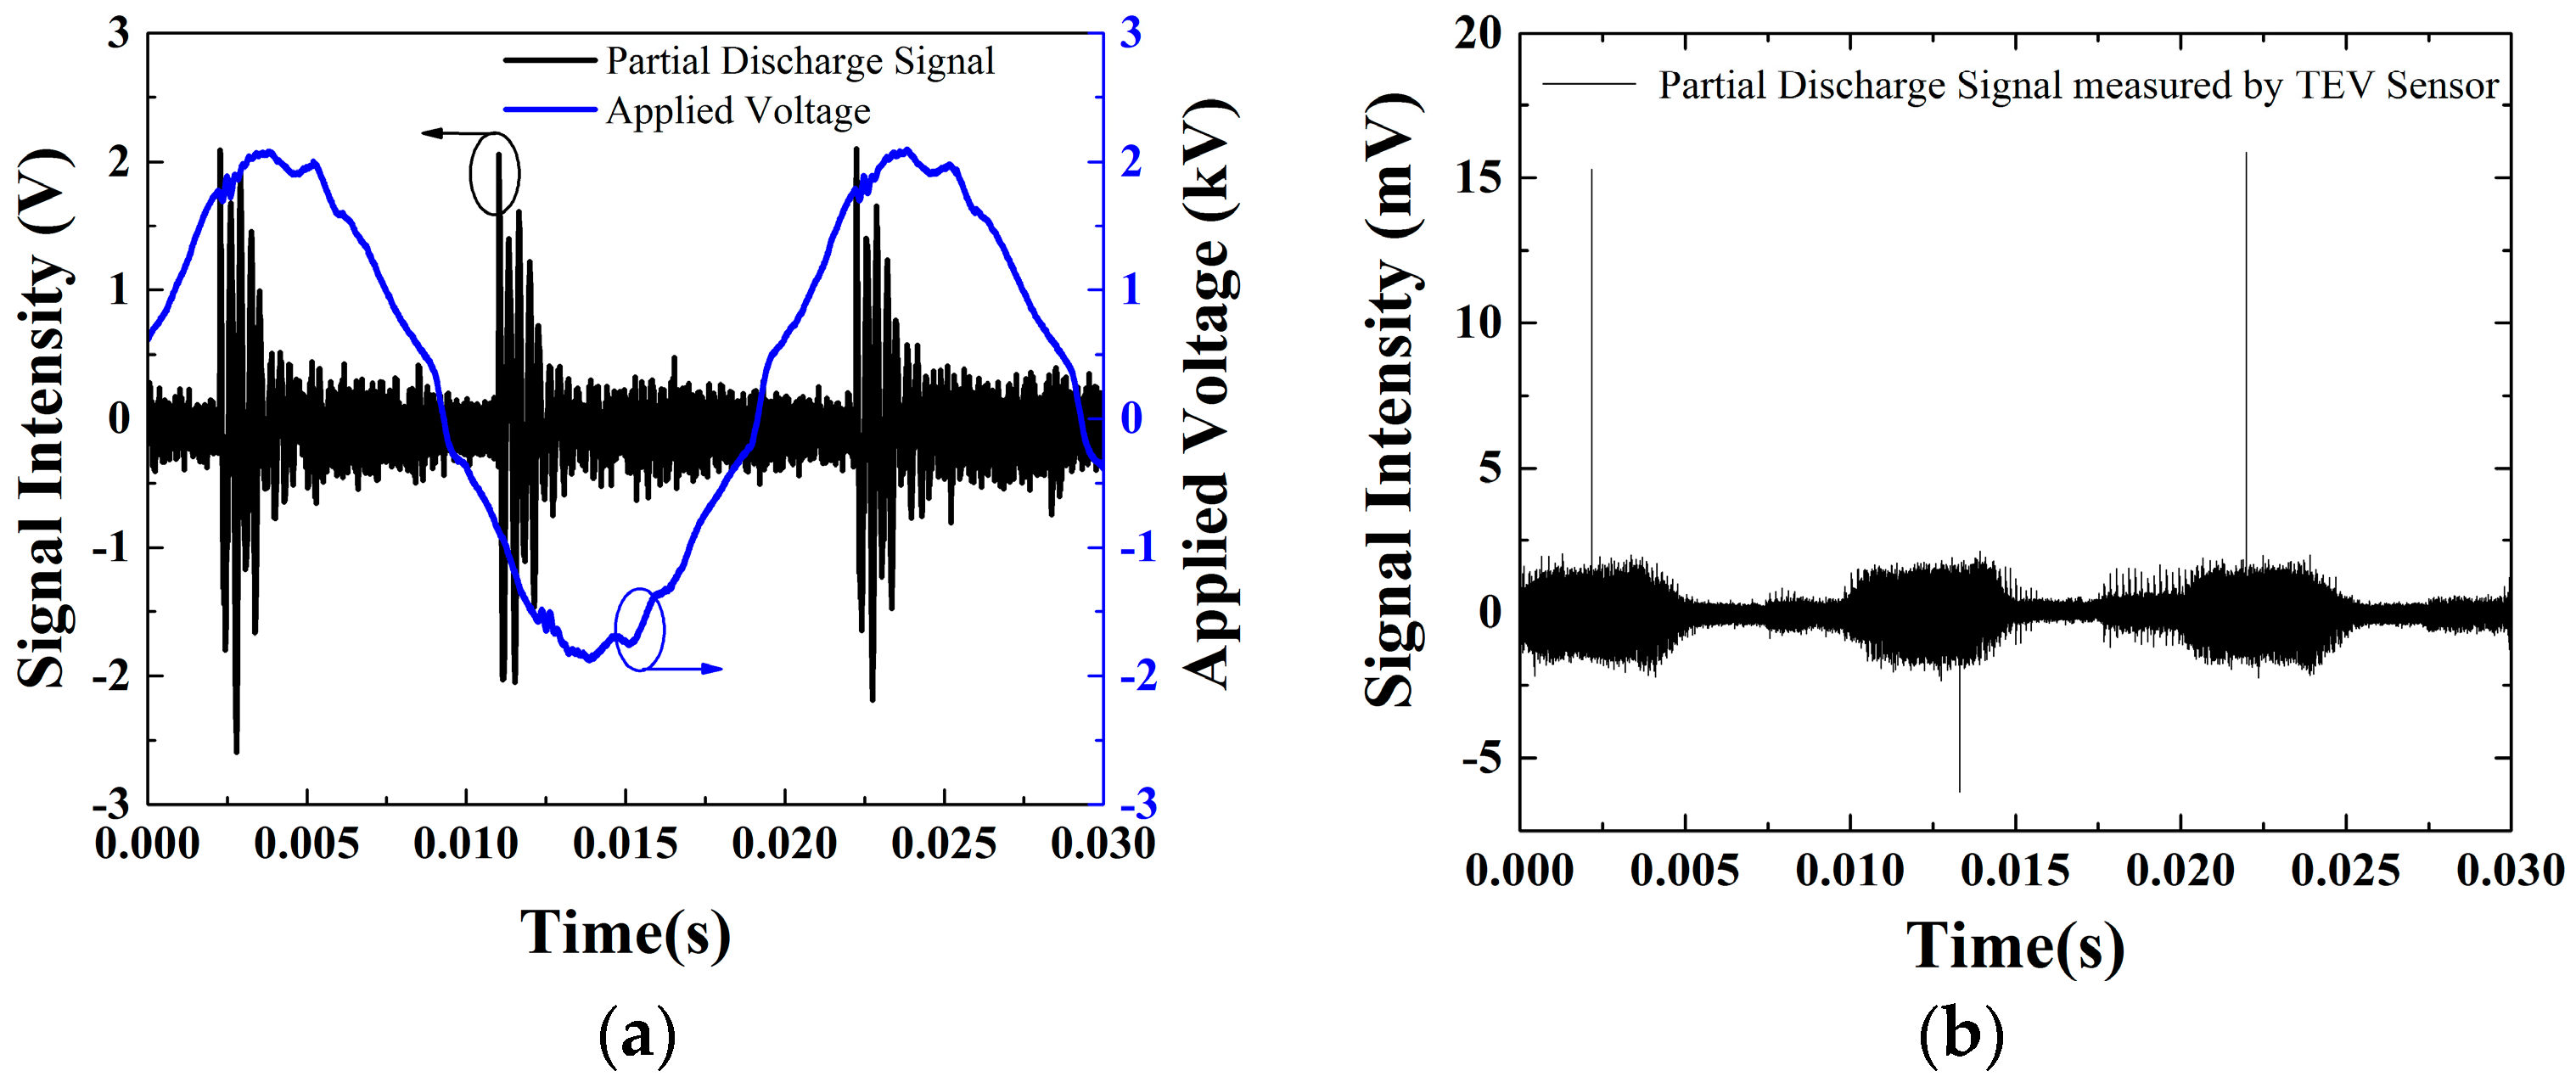
4.1. Dectection of Partial Discharge in the Laboratory Environment
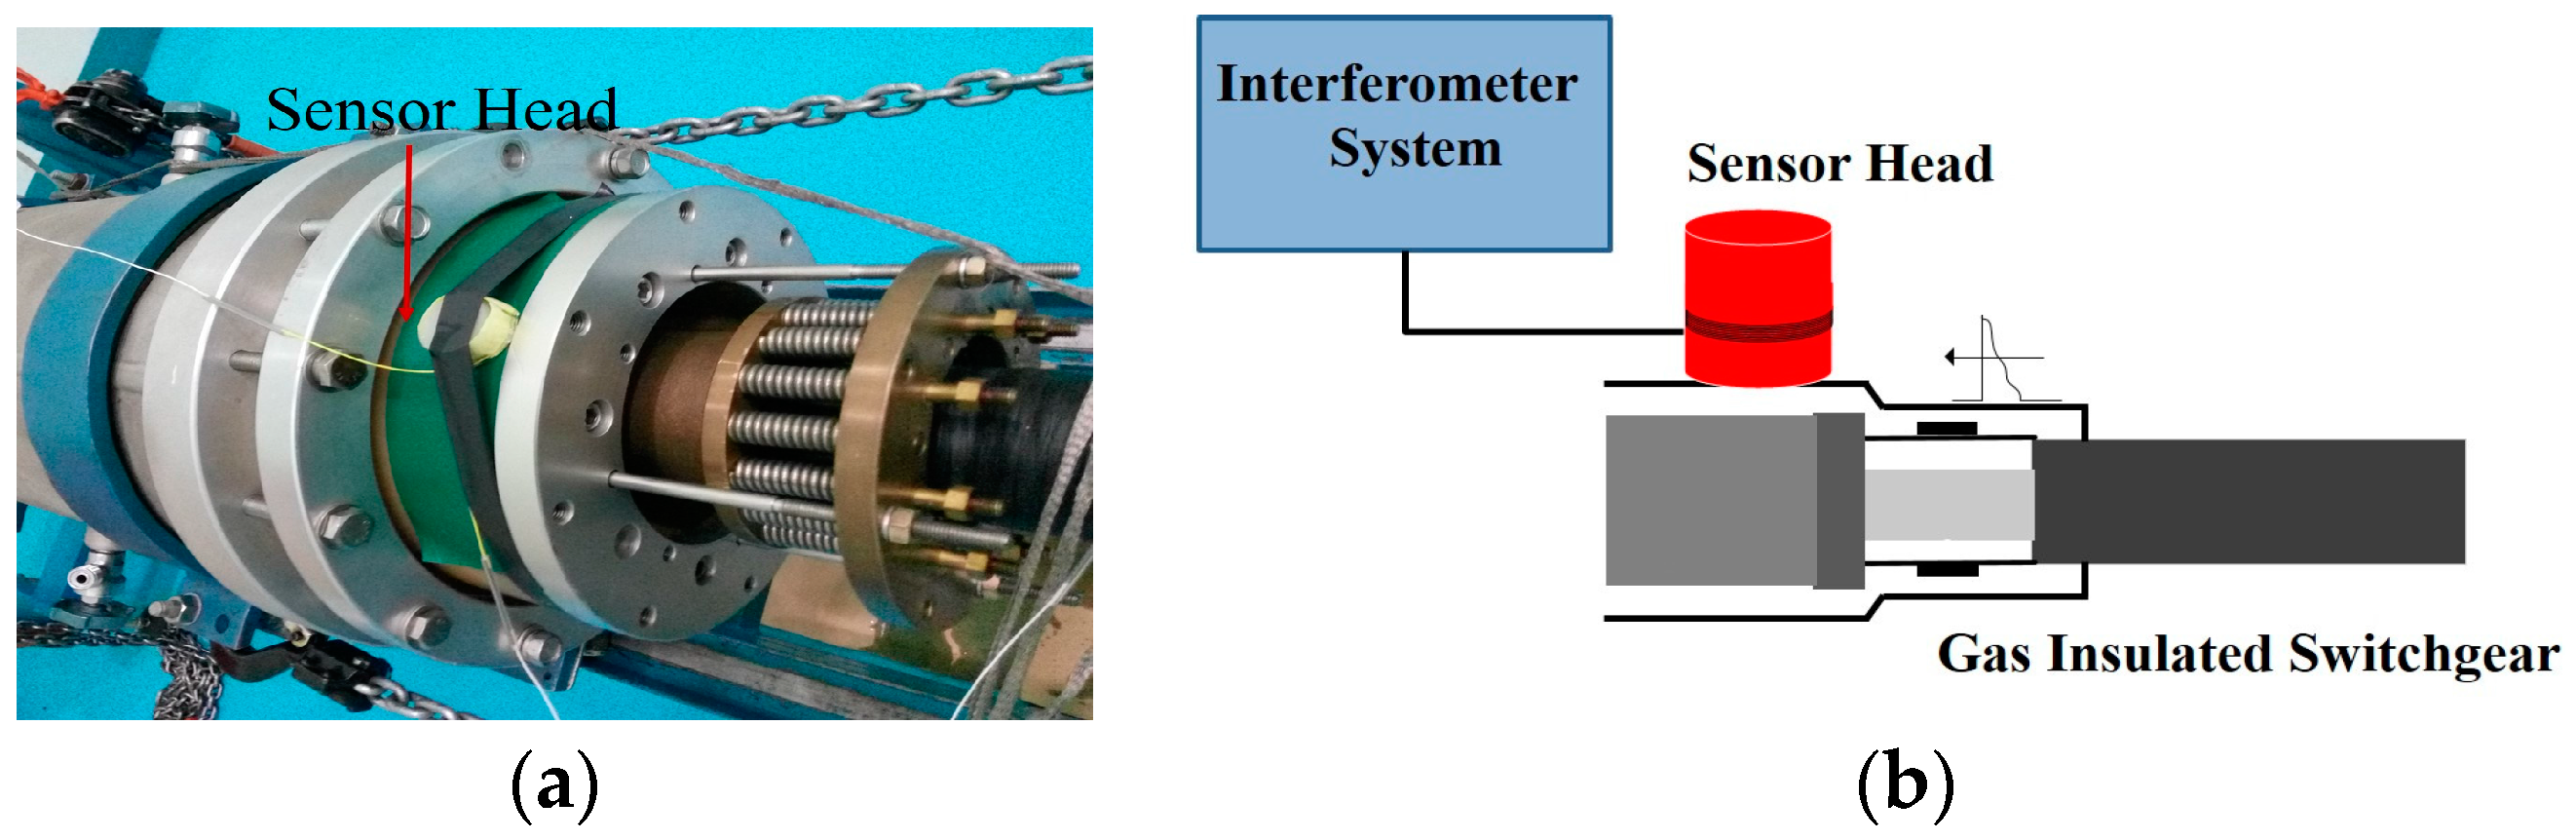
4.2. Detection of Real Partial Discharge Generated in Gas Insulated Switchgear (GIS)
5. Conclusions
Acknowledgments
Author Contributions
Conflicts of Interest
References
- Wang, Y.; Gong, S.; Grzybowski, S. Reliability evaluation method for oil-paper insulation in power transformers. Energies 2011, 4, 1362–1375. [Google Scholar] [CrossRef]
- Nainggolan, J.M.; Nakashima, T.; Sakoda, T.; Otsubo, M.; Kurihara, S.; Nagasato, S.; Yarimitsu, T. Location of partial discharge at joint section of XLPE cable using acoustic emission technique. In Proceedings of the 2010 Annual Report Conference on Electrical Insulation and Dielectric Phenomena (CEIDP), West Lafayette, IL, USA, 17–20 October 2010; pp. 1–4.
- Stone, G.C. Partial discharge diagnostics and electrical equipment insulation condition assessment. IEEE Trans. Dielectr. Electr. Insul. 2005, 12, 891–903. [Google Scholar] [CrossRef]
- Maciàsanahuja, C.; Lamela, H.; Garcíasouto, J. Fiber optic interferometric sensor for acoustic detection of partial discharges. J. Opt. Technol. 2007, 74, 122–126. [Google Scholar] [CrossRef]
- Culshaw, B. Fiber optics in sensing and measurement. IEEE J. Sel. Top. Quantum Electron. 2000, 6, 1014–1021. [Google Scholar] [CrossRef]
- Fracarolli, J.; Floridia, C.; Dini, D.; Rosolem, J.; Teixeira, R. Fiber optic interferometric method for acoustic emissions detection on power transformer’s bushing. In Proceedings of the Microwave & Optoelectronics Conference (IMOC), Rio de Janeiro, Brazil, 2–6 June 2013; pp. 1–5.
- Zhao, Z.; Macalpine, M.; Demokan, L. The Directionality of an Optical Fiber High-Frequency Acoustic Sensor for Partial Discharge Detection and Location. J. Lightwave Technol. 2000, 18, 795–806. [Google Scholar] [CrossRef]
- Sun, C.; Liang, Y.; Ansari, F. Serially multiplexed dual-point fiber-optic acoustic emission sensor. J. Lightwave Technol. 2004, 22, 487–493. [Google Scholar] [CrossRef]
- Lundgaard, L. Partial discharge. XIV. Acoustic partial discharge detection-practical application. IEEE Electr. Insul. Mag. 1992, 8, 34–43. [Google Scholar] [CrossRef]
- Wang, X.; Li, B.; Roman, H.; Russo, O. Acousto-optical PD detection for transformers. IEEE Trans. Power Deliv. 2006, 21, 1068–1073. [Google Scholar] [CrossRef]
- Chin, K.K.; Sun, Y.; Feng, G.; Georgiou, G.E.; Guo, K.; Niver, E.; Roman, H.; Noe, K. Fabry-Perot diaphragm fiber-optic sensor. Appl. Opt. 2007, 46, 7614–7619. [Google Scholar] [CrossRef] [PubMed]
- Dong, B.; Han, M.; Sun, L.; Wang, J.; Wang, Y.; Wang, A. Sulfur hexafluoride-filled extrinsic Fabry-Pérot interferometric fiber-optic sensors for partial discharge detection in transformers. IEEE Photonics Technol. Lett. 2008, 20, 1566–1568. [Google Scholar] [CrossRef]
- Wang, X.; Li, B.; Xiao, Z.; Lee, S.H.; Roman, H.; Russo, O.L.; Chin, K.K.; Farmer, K.R. An ultra-sensitive optical MEMS sensor for partial discharge detection. J. Micromech. Microeng. 2005, 15, 521–527. [Google Scholar] [CrossRef]
- Lima, S.E.U.; Frazão, O.; Farias, R.G.; Araújo, F.M.; Ferreira, L.A.; Santos, J.L.; Miranda, V. Mandrel-based fiber-optic sensors for acoustic detection of partial discharges—A proof of concept. IEEE Trans. Power Deliv. 2010, 25, 2526–2534. [Google Scholar] [CrossRef]
- Rosenthal, A.; Razansky, D.; Ntziachristos, V. High-sensitivity compact ultrasonic detector based on a pi-phase-shifted fiber Bragg grating. Opt. Lett. 2011, 36, 1833–1835. [Google Scholar] [CrossRef] [PubMed]
- Jang, T.S.; Lee, S.S.; Kwon, I.B.; Lee, W.J.; Lee, J.J. Noncontact detection of ultrasonic waves using fiber optic Sagnac interferometer. IEEE Trans. Ultrason. Ferroelect. Freq. Control 2002, 49, 767–775. [Google Scholar] [CrossRef]
- Fomitchov, P.A.; Krishnaswamy, S.; Achenbach, J.D. Extrinsic and intrinsic fiber optic Sagnac ultrasound sensors. Opt. Eng. 2000, 39, 1972–1984. [Google Scholar] [CrossRef]
- Guan, B.O.; Tan, Y.N.; Tam, H.Y. Dual polarization fiber grating laser hydrophone. Opt. Express 2009, 17, 19544–19550. [Google Scholar] [CrossRef] [PubMed]
- Wang, L.; Fang, N.; Wu, C.; Huang, Z. A fiber optic PD sensor using a balanced Sagnac interferometer and an EDFA-Based DOP Tunable fiber ring laser. Sensors 2014, 14, 8398–8422. [Google Scholar] [CrossRef] [PubMed]
- Kersey, A.D.; Davis, A. Polarization-Independent Interferometric Fiber Optic Sensor. In Proceedings of the Optical Fiber Communication Conference, Optical Society of America, Los Angeles, CA, USA, 18 February 1991.
- Wild, G.; Hinckley, S. Acousto-ultrasonic optical fiber sensors: Overview and state-of-the-art. IEEE Sens. J. 2008, 8, 1184–1193. [Google Scholar] [CrossRef]
- Rohwetter, P.; Habel, W. Fibre-optic sensors for partial discharge-generated ultrasound in elastomeric high-voltage insulation materials. In Proceedings of the Fifth European Workshop on Optical Fibre Sensors, Krakow, Poland, 19–22 May 2013.
- Rohwetter, P.; Lothongkam, C.; Habel, W.; Heidmann, G.; Pepper, D. Improved fibre optic acoustic sensors for partial discharge in elastomeric insulations. In Proceedings of the OFS2014 23rd International Conference on Optical Fiber Sensors, Cantabria, Spain, 2–6 June 2014.
- Itut, R.G. Characteristics of Single-Mode Optical Fibre Cable; Recommendation G 652 D; ITU: Geneva, Switzerland, 2005. [Google Scholar]
- Single Mode Fiber (G.652B) Optical Fiber Tongding Group Co., Ltd. Available online: http://www.tongdinggroup.com/en/proshow.asp?id=98 (accessed on 22 September 2016).
- Liu, L.; Lu, P.; Liao, H.; Wang, S.; Yang, W.; Liu, D.; Zhang, J. Fiber-Optic Michelson Interferometric Acoustic Sensor Based on a PP/PET Diaphragm. IEEE Sens. J. 2016, 16, 3054–3058. [Google Scholar] [CrossRef]
- Wada, K.; Narui, H.; Yamamoto, D.; Matsuyama, T.; Horinaka, H. Balanced polarization maintaining fiber Sagnac interferometer vibration sensor. Opt. Express 2011, 19, 21467–21474. [Google Scholar] [CrossRef] [PubMed]
- Sakoda, T.; Nakashima, T.; Nainggolan, J.M.; Otsubo, M.; Kurihara, S.; Nagasato, S.; Yarimitsu, T. Diagnostics of insulation deterioration of ethylene propylene rubber using an acoustic emission technique. IEEE Trans. Dielectr. Electr. Insul. 2010, 17, 1242–1248. [Google Scholar] [CrossRef]
- Lundgaard, L.E.; Hansen, W. Acoustic method for quality control and in-service periodic monitoring of medium voltage cable terminations. In Proceedings of the Conference Record of the 1998 IEEE International Symposium on Electrical Insulation, Arlington, VA, USA, 7–10 June 1998; pp. 130–133.
- Ren, M.; Dong, M.; Ren, Z.; Qiu, A. Application of Transient Earth Voltage method in PD detection in GIS. In Proceedings of the 2011 International Conference on Electrical Insulating Materials (ISEIM), Kyoto, Japan, 6–10 September 2011; pp. 313–316.
- Reid, A.; Judd, D.; Duncan, G. Simultaneous measurement of partial discharge using TEV, IEC60270 and UHF techniques. In Proceedings of the Conference Record of the 2012 IEEE International Symposium on Electrical Insulation (ISEI), San Juan, Puerto Rico, 10–13 June 2012; pp. 439–442.


© 2016 by the authors; licensee MDPI, Basel, Switzerland. This article is an open access article distributed under the terms and conditions of the Creative Commons Attribution (CC-BY) license (http://creativecommons.org/licenses/by/4.0/).
Share and Cite
Zhang, T.; Pang, F.; Liu, H.; Cheng, J.; Lv, L.; Zhang, X.; Chen, N.; Wang, T. A Fiber-Optic Sensor for Acoustic Emission Detection in a High Voltage Cable System. Sensors 2016, 16, 2026. https://doi.org/10.3390/s16122026
Zhang T, Pang F, Liu H, Cheng J, Lv L, Zhang X, Chen N, Wang T. A Fiber-Optic Sensor for Acoustic Emission Detection in a High Voltage Cable System. Sensors. 2016; 16(12):2026. https://doi.org/10.3390/s16122026
Chicago/Turabian StyleZhang, Tongzhi, Fufei Pang, Huanhuan Liu, Jiajing Cheng, Longbao Lv, Xiaobei Zhang, Na Chen, and Tingyun Wang. 2016. "A Fiber-Optic Sensor for Acoustic Emission Detection in a High Voltage Cable System" Sensors 16, no. 12: 2026. https://doi.org/10.3390/s16122026