Adsorption Characteristics and Mechanism of Calcium Ions on Different Molybdenite Surfaces via Experiments and DFT Simulations

1
Department of Mechanical and Electrical Engineering, Shandong University of Science and Technology, Qingdao 266590, China
2
Henan Province Industrial Technology Research Institution of Resources and Materials, Zhengzhou University, Zhengzhou 450066, China
3
College of Chemical and Biological Engineering, Shandong University of Science and Technology, Qingdao 266590, China
*
Author to whom correspondence should be addressed.
Separations 2021, 8(8), 107; https://doi.org/10.3390/separations8080107
Submission received: 25 May 2021
/
Revised: 16 July 2021
/
Accepted: 20 July 2021
/
Published: 24 July 2021
Abstract
:Calcium ions are common in flotation process water, and have a significant effect on the molybdenite floatability, making separation of molybdenite from other minerals more difficult. Therefore, to improve the separation selectivity, the research of how calcium ions affect the molybdenite surface properties is of great significance. In this study, various methods including flotation tests, contact angle measurements, batch adsorption tests and Density Functional Theory (DFT) simulations were carried out to understand the adsorption characteristics and mechanism. Results of the contact angle measurements showed that the inhibition effects of calcium ions on molybdenite flotation kinetics were mostly attributed to the decrease of the edge surface hydrophobicity, as the contact angle of the edge surface decreased more than the face surface after treatment with calcium ions. While fitting the results of batch adsorption tests with adsorption kinetics and isotherm models, it was found that the Lagergen pseudo-first-order equation and the Freundlich isotherm model nicely follow the experimental trend. Moreover, DFT calculation results indicated that both Ca2+ and CaOH+ preferentially adsorb on the molybdenite (100) surface, particularly the edge surface, which was consistent with the contact angle results. Ca2+ adsorbed on the Mo-top site on the S-(100) surface by forming Ca-S bonds, transferring electrons from Ca 3d orbitals to S 3p orbitals. CaOH+ adsorbed on the S-top site of Mo-(100) surface by forming a strong covalent Mo-O bond and S-Ca bond. The results provide a basis for understanding and improving the separation effect of molybdenite from other minerals in the presence of calcium ions.
1. Introduction
Molybdenite is the principal ore from which molybdenum metal is extracted. Due to the natural hydrophobic property of molybdenite, flotation is commonly used for its processing. In practice, molybdenite has closely paragenetic relationships with chalcopyrite. Since the molybdenite and chalcopyrite have similar floatability, inhibitors are commonly used for increasing the floatability difference between chalcopyrite and molybdenite, which is necessary for the successful separation [1]. In practical Cu-Mo separation processes, molybdenite is collected as the froth product and the chalcopyrite is depressed [2]. Flotation is a water-intensive process, and the surface properties of the minerals and the function of the reagents may be significantly affected by various ions in the process water. Moreover, flotation of the molybdenite is strongly depressed by ions, while chalcopyrite recovery is slightly lower under the same conditions [3]. If the wettability of molybdenite is depressed more, the separation process will be more difficult. So, studying the effect of ions on molybdenite flotation and mechanism is important for practical Cu-Mo separation.
The presence of metal ions has been reported to depress molybdenite floatability in certain situations. The deterioration of molybdenite floatability has been observed in Cu2+ and Fe3+ solutions, which was attributed to the adsorption of different hydrolyzed species at various pH [4]. In Pb2+ solution, the depression effect on molybdenite floatability depended on pH, and was mainly due to the formation of PbS on molybdenite surfaces [5]. Divalent ions such as Ca2+ and Mg2+ are unavoidable in process water, which are usually considered detrimental for the separation of copper–molybdenum ores [6,7,8]. This decrease may be related to the enhancement of salt or hydrophilic precipitates on the mineral surface hydration layer, preventing the air bubbles from draining the intervening thin liquid film on the mineral surfaces [9].
Molybdenite is a typical anisotropic mineral with two types of surfaces, named face (non-polar) and edge (polar), formed by the breakage of weak van der Waals interactions between S-Mo-S layers and by the rupture of the strong covalent Mo-S bonds, respectively [10]. The basal plane of MoS2 has been generally believed to be hydrophobic while the edges are hydrophilic. Additionally, the molybdenite faces are less chemically active than the edges [11]. Several scholars have studied the properties of the face and edge surface of natural molybdenite using advanced surface analytical techniques. Based on the anisotropic crystal structure, Lu et al. [12] first directly measured surface charge and wettability of the face and edge surfaces of molybdenite through surface force measurements to understand the relationship of surface properties and floatability. Xie et al. [13] studied the adsorption of polysaccharides on different molybdenite surfaces, and showed that the adsorption on the face surface was much weaker than the edge surface, and this anisotropy in polymer adsorption coincided with the contact angle results. Therefore, experimental methods were used to explain adsorption mechanisms on the different molybdenite surfaces, but these do not give a valid explanation at the atomic scale. Calculation methods, such as molecular dynamic simulation and DFT, have been developed and can be used to thoroughly understand mineral flotation behaviors from the atomic perspective [14,15,16], providing powerful support for further studies.
In mineral flotation systems, calcium ions are very common due to the use of the saline water, the flotation reagents (CaO, CaSO4, etc.) and mineral dissolution (gypsum, calcite, dolomite, etc.). The presence of calcium ions can depress molybdenite floatability in certain situations, making the separation of Cu-Mo more difficult. Based on anisotropic structure of molybdenite, how calcium ions affect the molybdenite surface properties has not been studied at the atomic scale. Studies of the interaction mechanisms of calcium ions and different molybdenite surfaces are comparatively deficient. In order to enhance the separation performance, this study investigated the adsorption mechanism of calcium ions on molybdenite surfaces through flotation tests, contact angle, batch adsorption tests and first-principles simulation calculation of calcium ions on the face and edge surfaces based on DFT.
2. Materials and Methods
2.1. Materials and Reagents
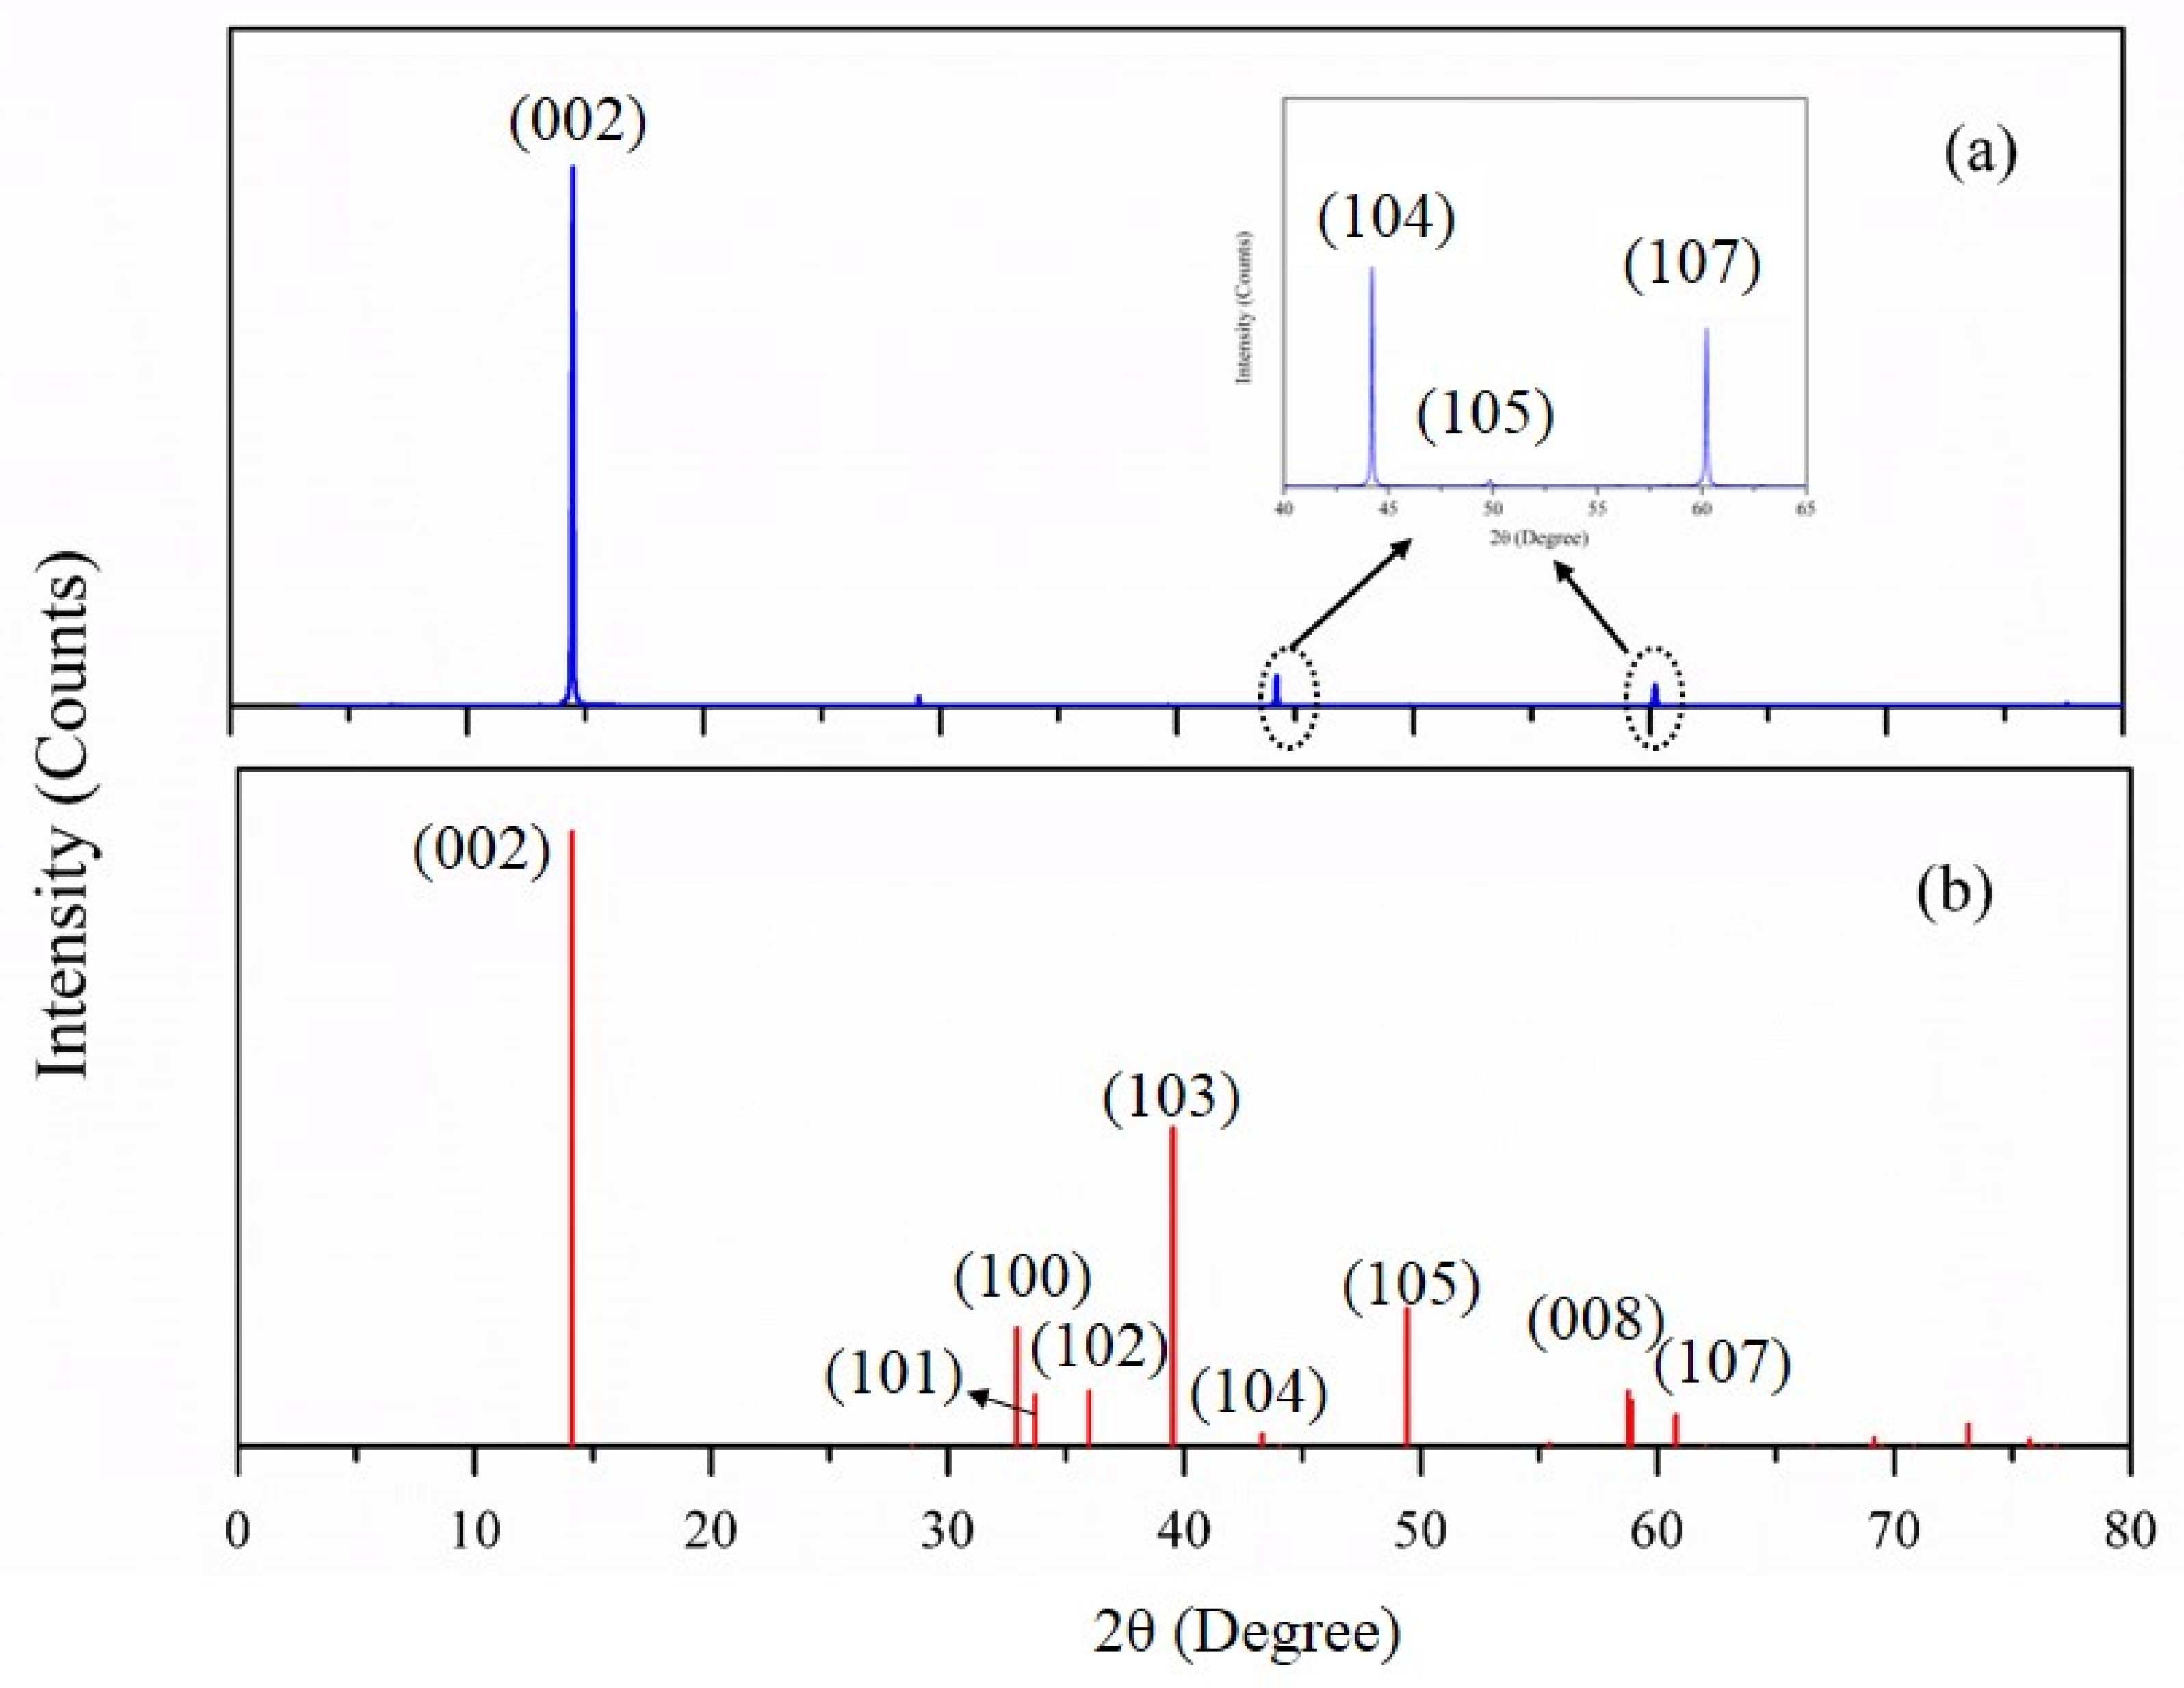
The high-purity molybdenite was obtained from Guangxi Province, China. The mineral composition of the sample was determined using the X-ray diffraction (XRD, Bruker, Karlsruhe, Germany). The X-ray diffraction test was made using Cu Kα radiation (40 kV, 30 mA on the tube). The angle 2θ is scanned in 0.02° steps, dwelling for 2 s at each step. The full spectrum fitting analysis of XRD source data was carried out on MDI Jade 6.0 software. The XRD patterns of the molybdenite sample and the standard 2H-type molybdenite (JCPDS no. 37-1492) are shown in Figure 1. The diffraction peak of the molybdenite sample positioned at 14.33 degrees 2θ in Figure 1a demonstrates a high degree of consistency with the 14.13 degrees 2θ peak of the standard 2H-type molybdenite in Figure 1b. X-ray fluorescence (XRF, Bruker, Germany) spectrometry analysis was conducted to confirm the high purity of the mineral quantitatively in order to gratify the single mineral properties study [17,18]. The XRF results showed that the pure molybdenite contains approximately 92.2% MoS2, 2.3% SiO2, 0.6% Al2O3, 0.5% Fe and others. The lump ores with good crystallization were picked and used to prepare the face and the edge surface. The face surfaces were freshly pulled off using adhesive tape and were directly used in tests given their perfect cleavage plane and super-smooth texture [12]. A cutting machine was used for the edge surface preparation, and abrasive papers with 2000 fine grade were used to ensure the surface was smooth. The calcium ion solutions used in the tests were prepared by diluting calcium sulfate (CaSO4) in milli-Q water. During the flotation process, kerosene was used as the collector and pine camphor oil as the frother, both of which were industrial-grade chemicals.
2.2. Micro-Flotation Tests
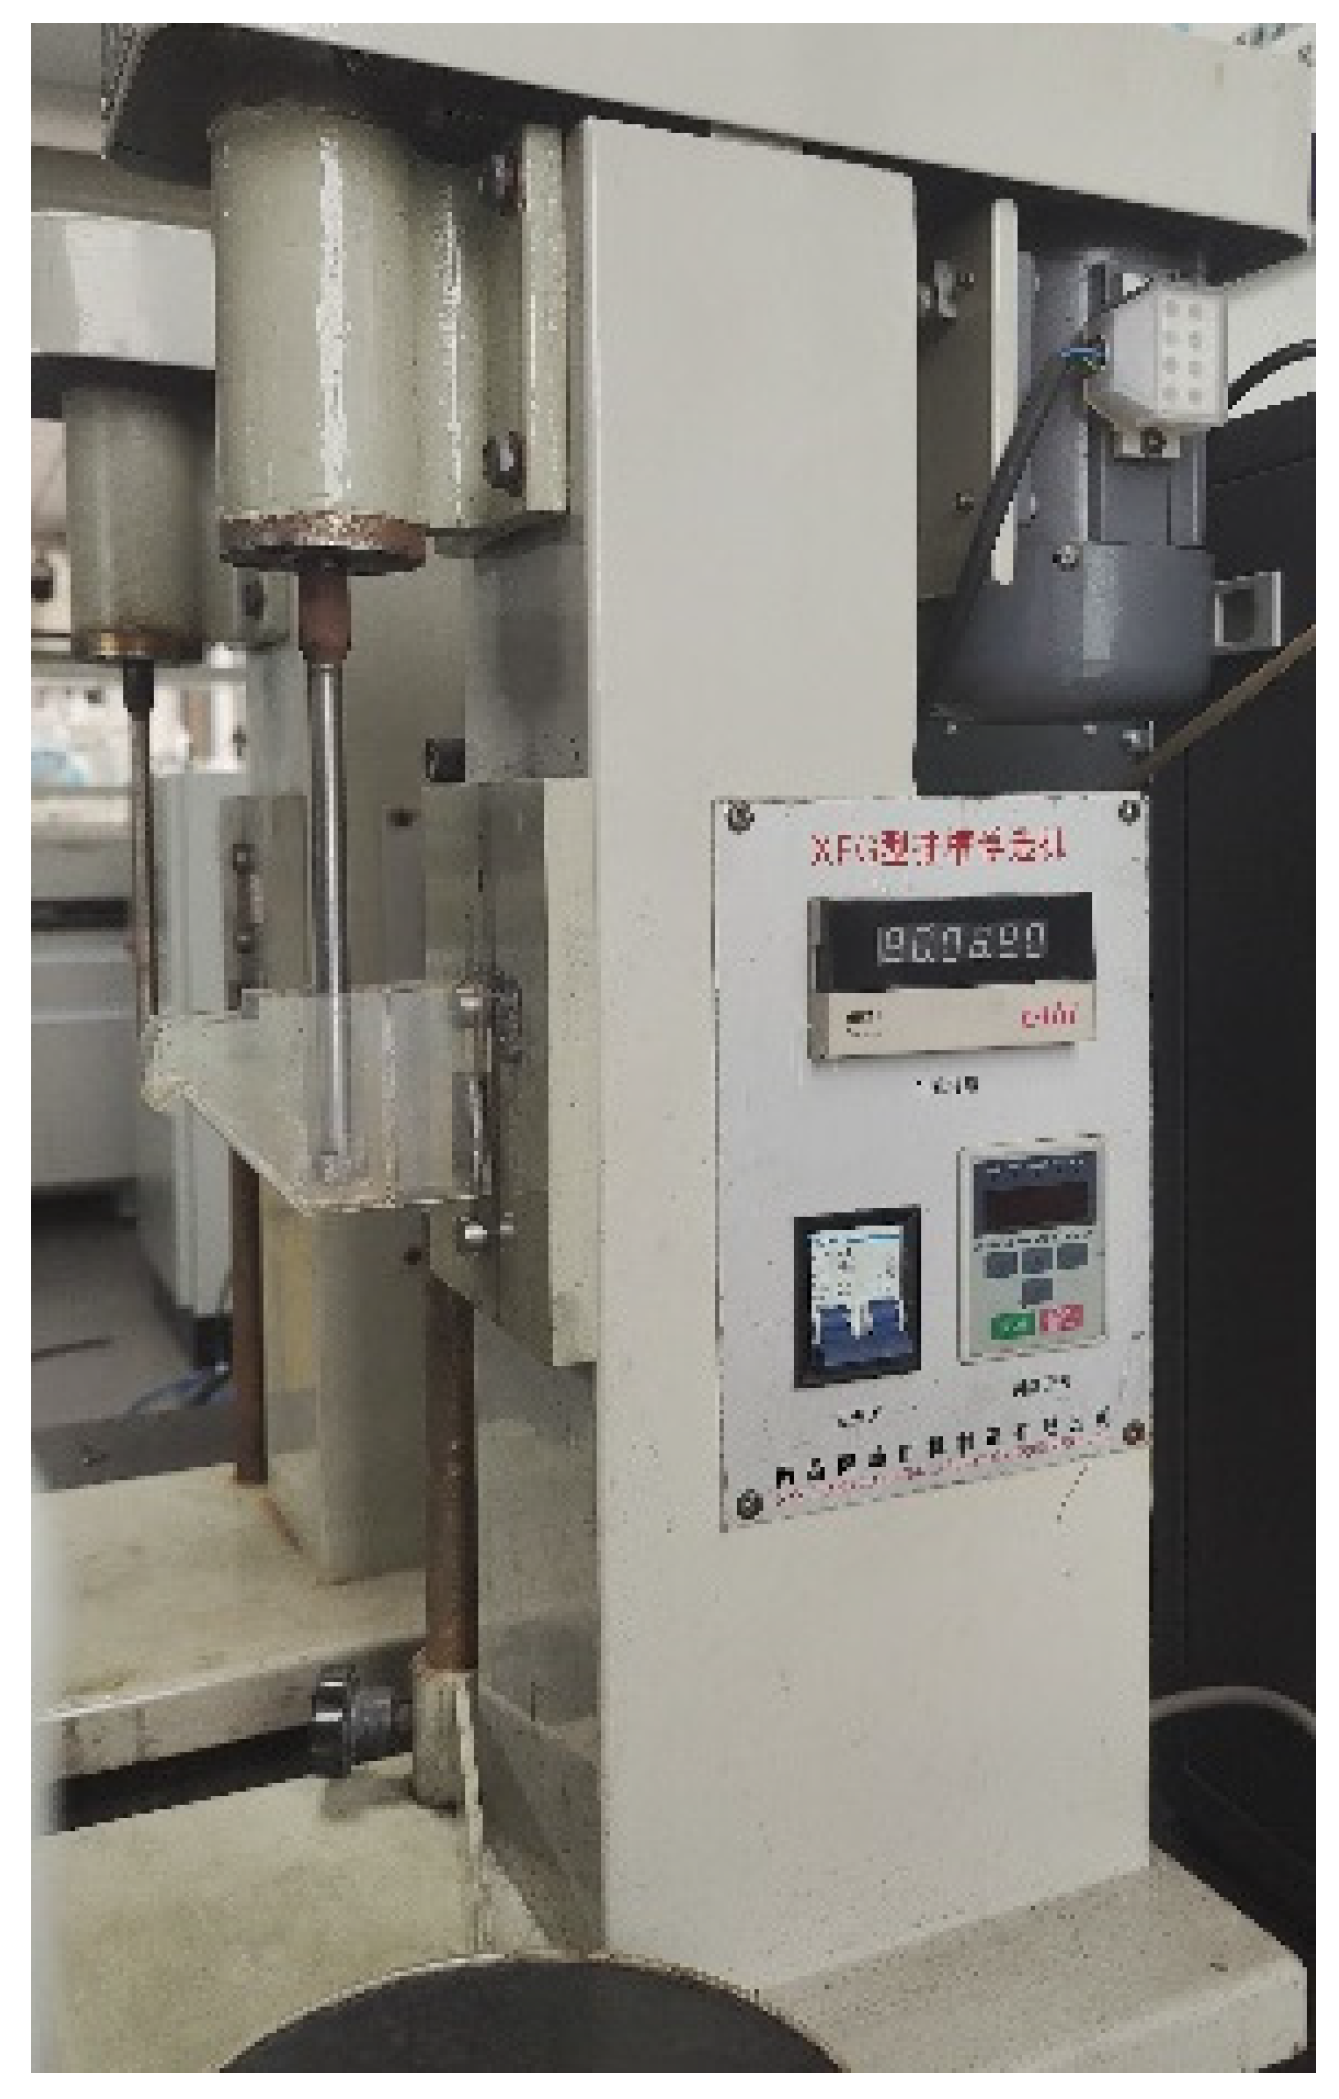
The micro-flotation tests were conducted in an XFG-40 mL flotation machine, which was produced by Nanchang Jianfeng Mining Machinery Manufacturing Co., Ltd., Jiangxi, China (Figure 2). Molybdenite powders used in the flotation experiments were hand-picked, crushed, and ground to −74 μm. Solutions with different concentrations of calcium ions were prepared with distilled water before the flotation tests. For each test, 2 g molybdenite was weighed and put into the tank of the flotation machine. About 40 mL of the prepared solution was added to the tank, and was mixed with the sample for 3 min at an agitation speed of 1600 r/min. The difference in the pH before and after mixing was less than 0.2. The collector was added to the pulp and conditioned for a further 3 min. Subsequently, the frother was added and conditioned for 2 min. After conditioning, micro-flotation was carried out for 3 min. In each test, the concentrate was collected using individual beakers after 0.5, 1, 2 and 3 min. The froth products were dried and weighed.
2.3. Adsorption Experiments of Calcium Ions on Molybdenite Powders
Adsorption kinetics and thermodynamics studies of calcium ions on molybdenite were carried out by adding 1 g of mineral sample and 100 mL of solution with different calcium ion concentrations into a 250 mL conical flask. During the adsorption process, the slurry was stirred at 1200 rpm and maintained at constant temperature (293 K) in a water bath. After adsorption, the solution was centrifuged for 5 min at 3000 rpm and then the supernatant concentrations of the residual calcium ion (Ct) were determined by Inductively Coupled Plasma Mass Spectrometry (ICP-MS, OPTIMA8300, PerkinElmer, Waltham, MA, USA). During testing, jump peak mode was used. The rate of cooling-air flow was 13 dm3/min. The sampling was approached at 18 s per wavelength. The amount of Ca adsorbed was calculated using the following equation:
where Q is the total amount of ions adsorbed on the mineral surface, mg/g. C0 and Ct are the calcium ions concentration initially and at time t, mg/L. V is the solution volume, L; m is the mineral mass used for adsorption experiments, g.
2.4. Contact Angle Measurements
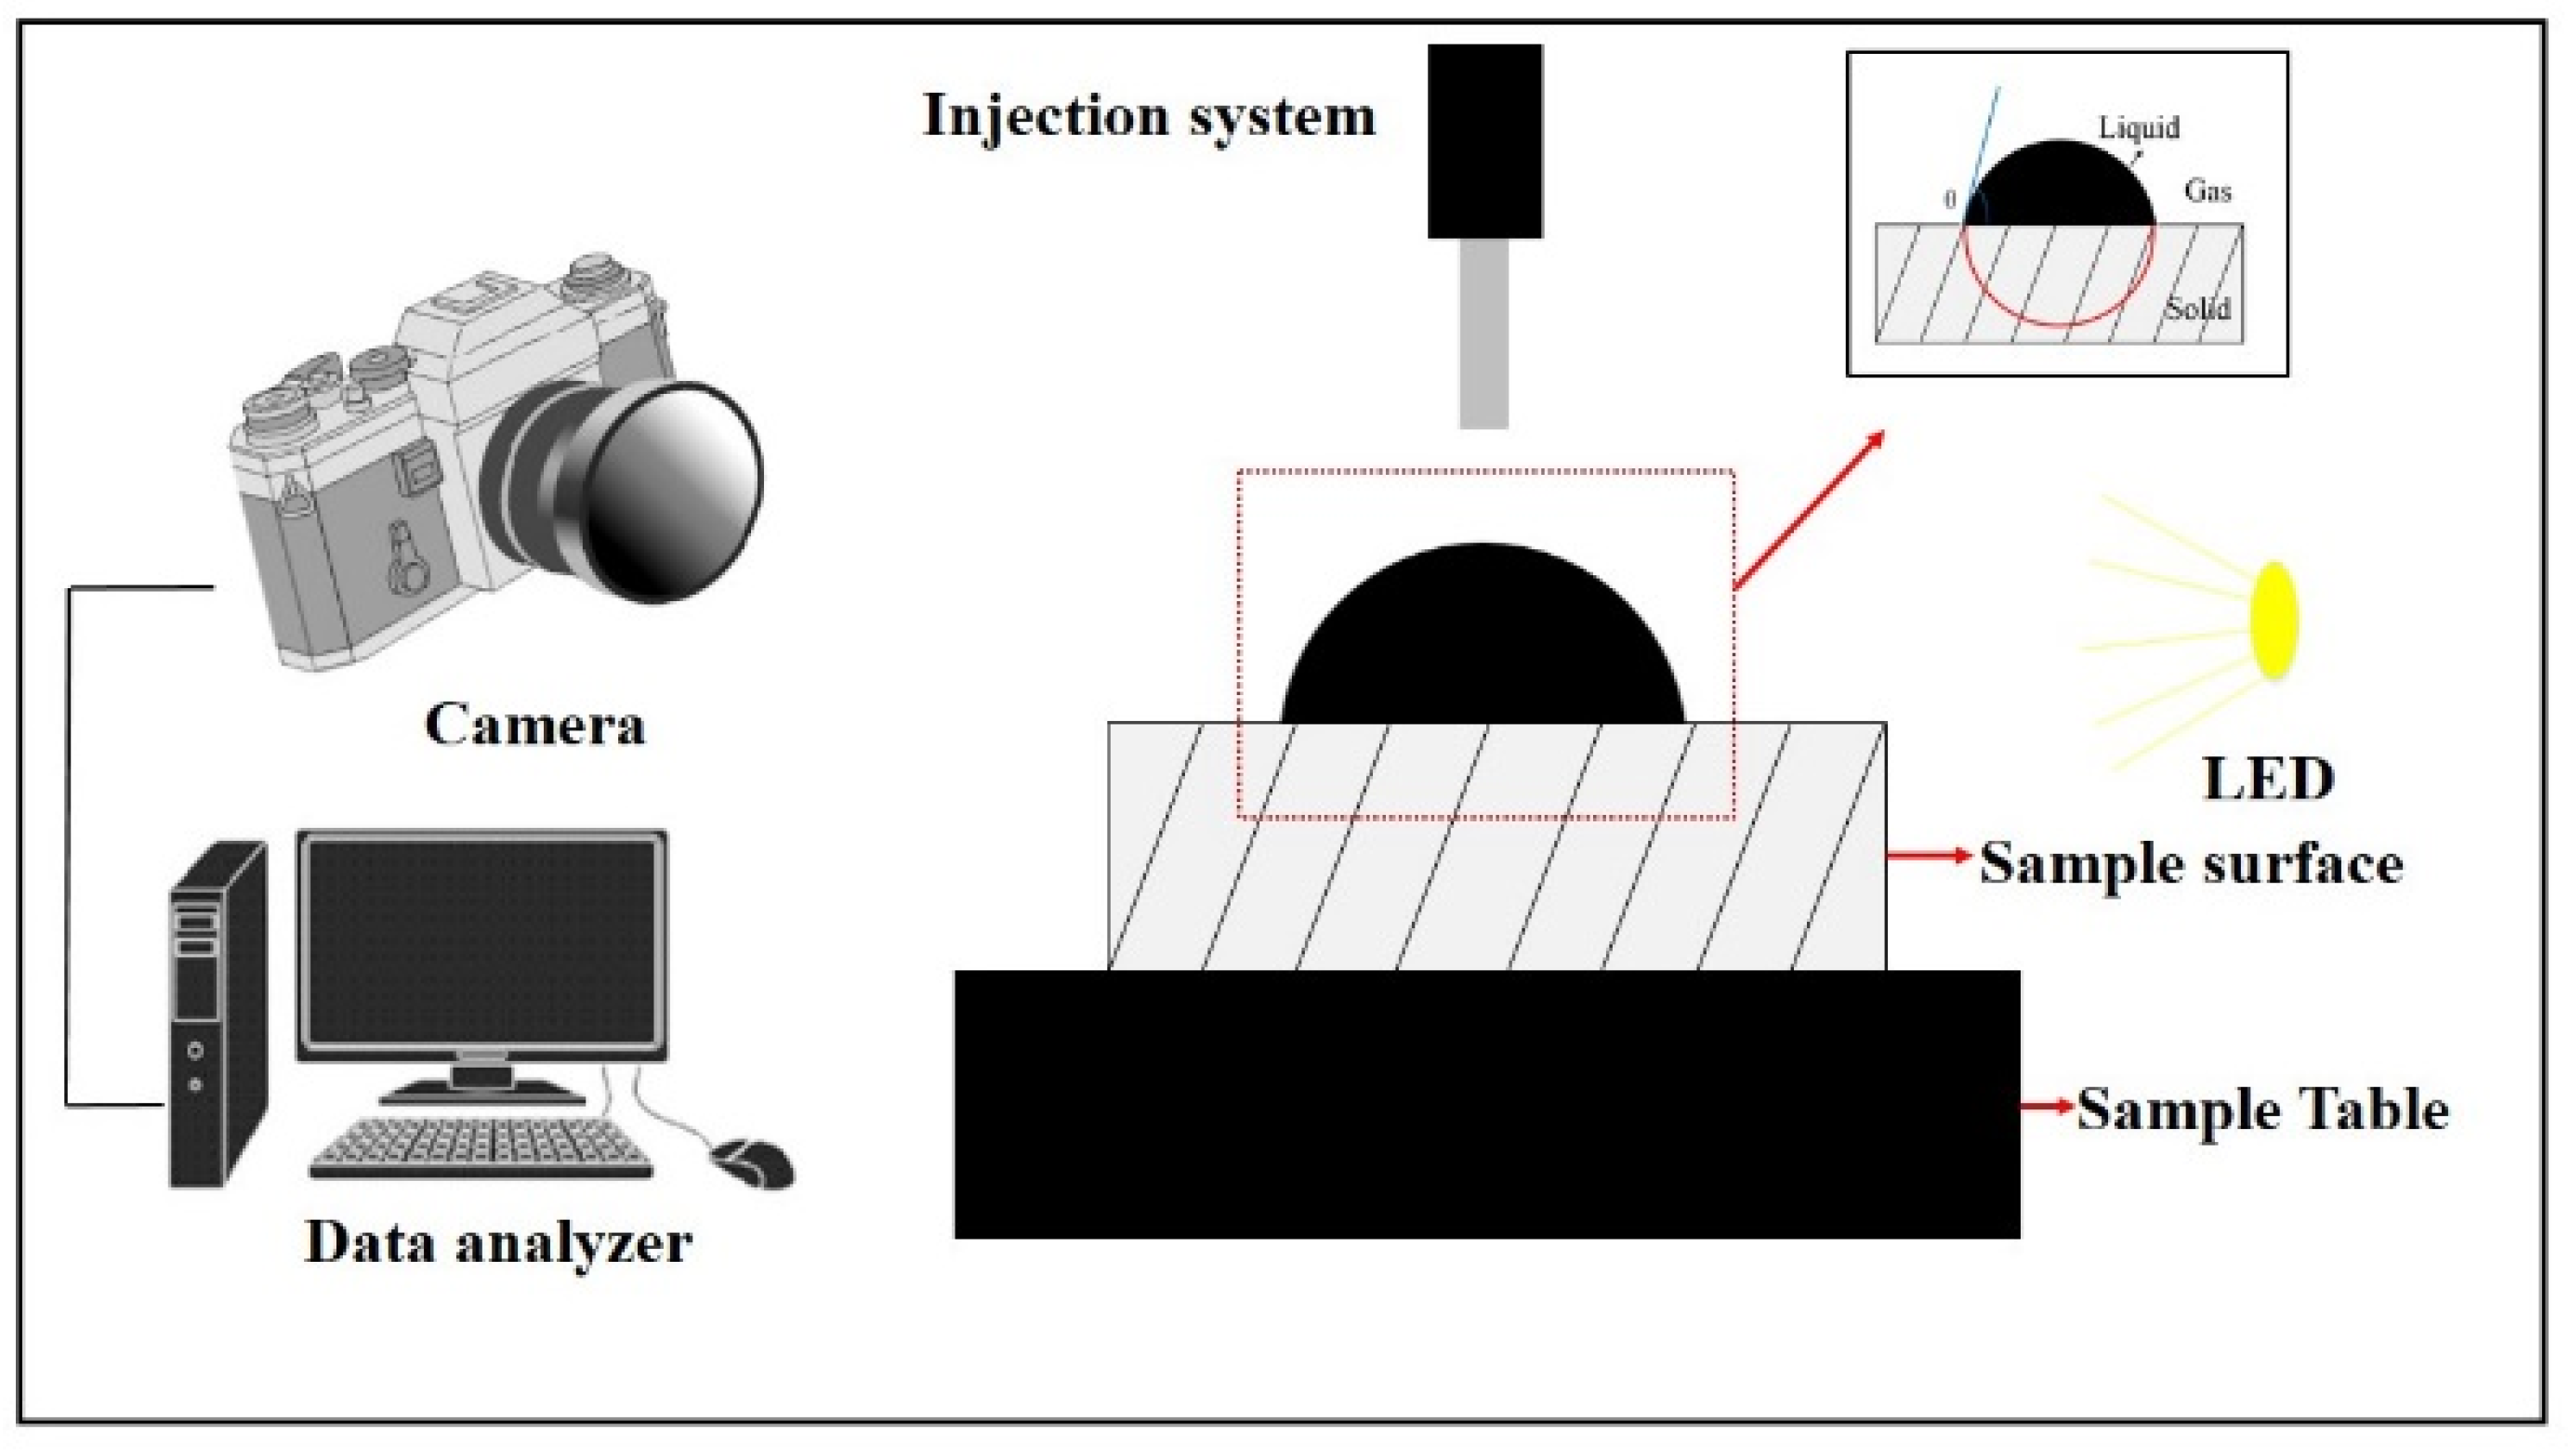
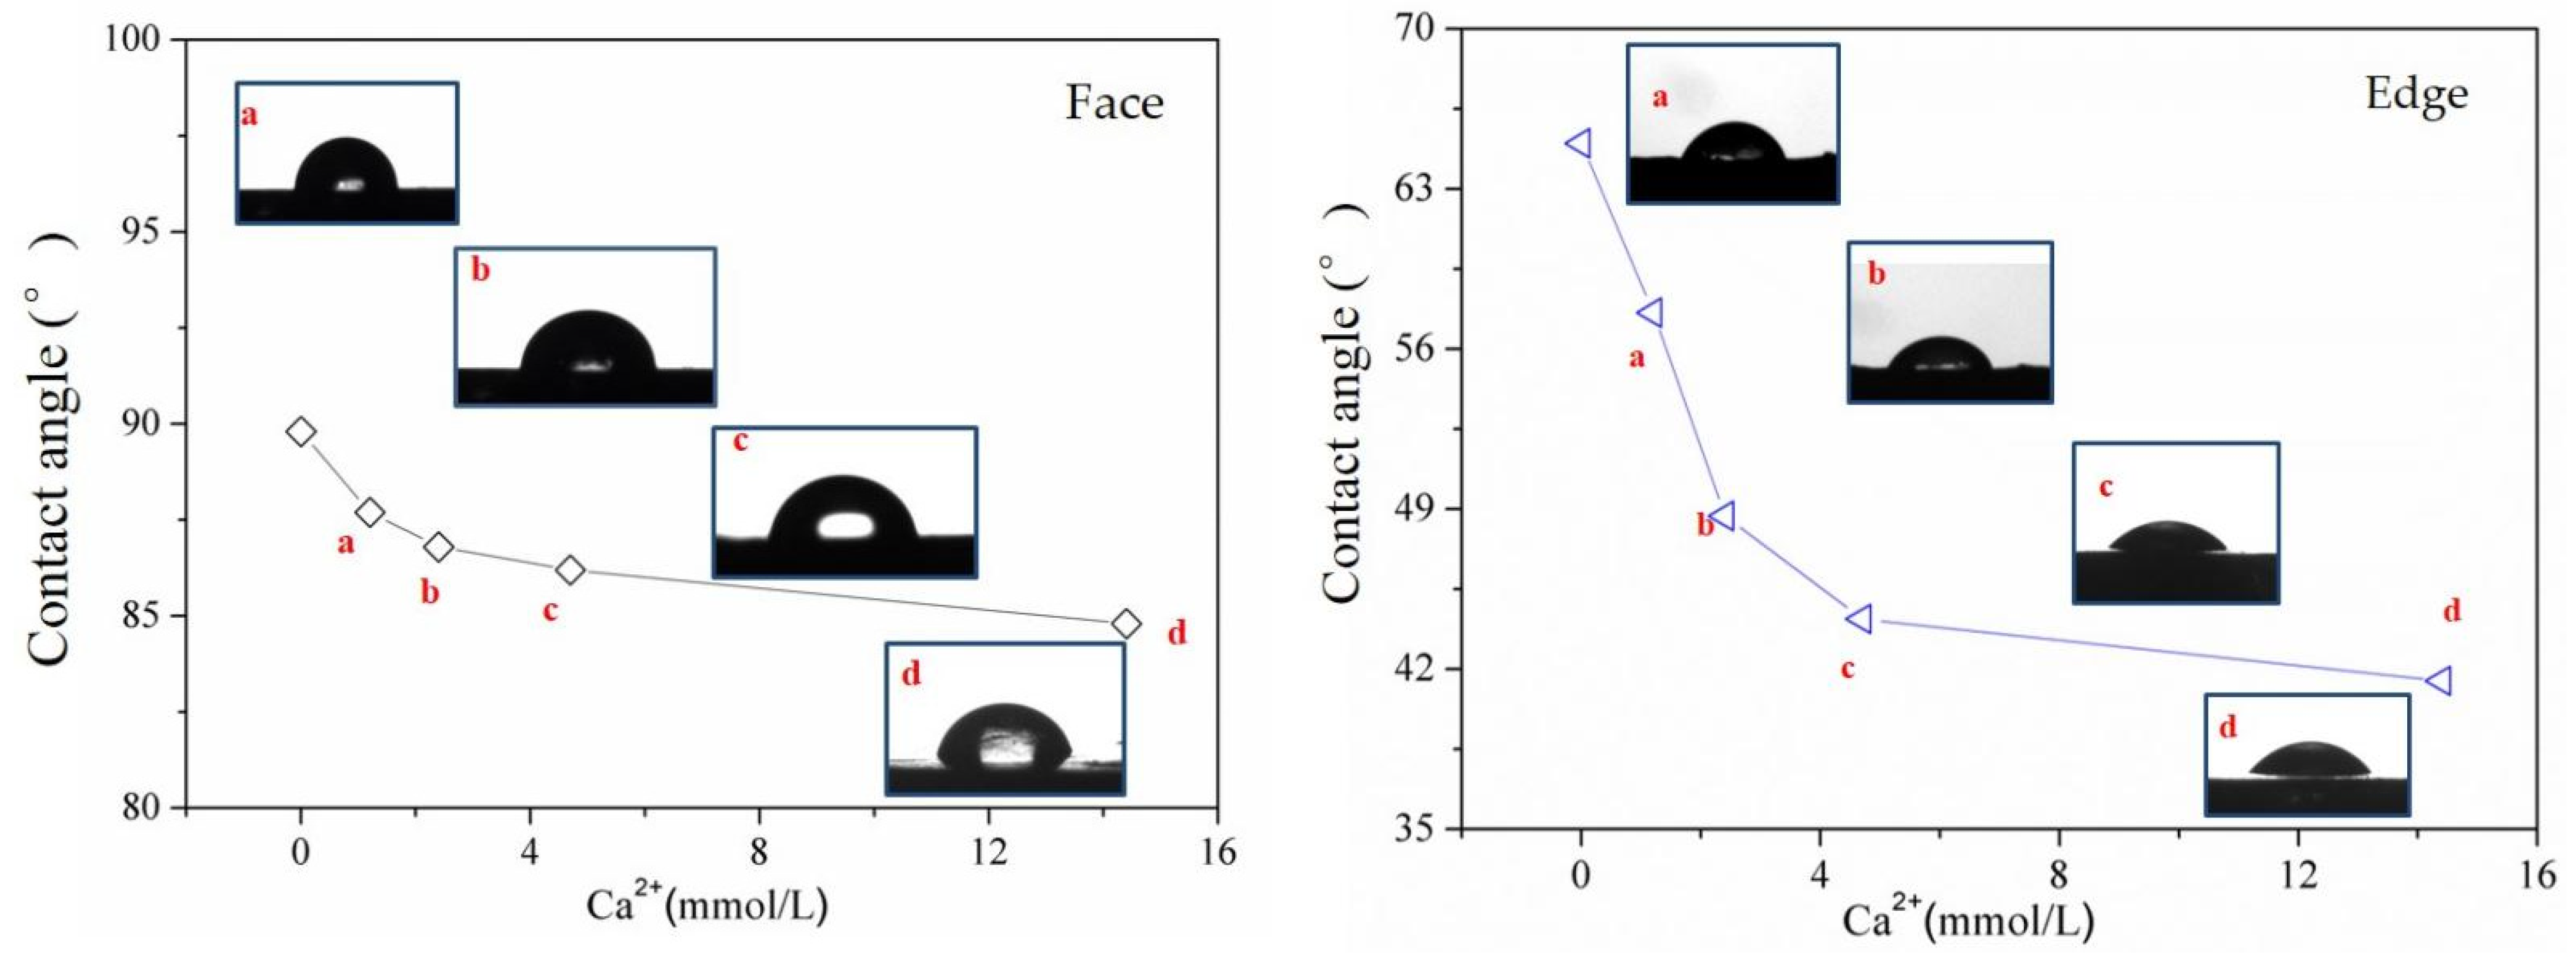
Contact angle, a measure of the solid surface wettability, is measured as the angle between the tangent to the liquid surface and the solid surface at the interface between solid and liquid phases, and is understood as the ability to retain liquids on a surface. In the study, a Contact Angle Measuring Device (DSA100, Kruss, Hamburg, Germany) was used to measure the contact angles of molybdenite surfaces before and after calcium ion adsorption using the sessile drop method and the Milli-Q water. A schematic of the Contact Angle Measuring Device is shown in Figure 3. During the measurements, the water droplet volume is set to 6 μL. The ion-adsorbed surfaces were prepared by wetting smooth molybdenite face and edge surfaces for 30 min. At least three experiments were carried out for each sample to ensure reproducibility. Circle fitting method was used for data processing.
2.5. Computational Methods and Models
All computational calculations were conducted using the Cambridge Sequential Total Energy Package (CASTEP) program based on the density functional theory (DFT) [19]. The electron exchange correlation (XC) functional had been modeled with the generalized gradient approximation (GGA) as proposed by Perdew–Burke–Ernzerhof (PBE) [20]. Van der Waals interactions with empirical dispersion corrections were also considered in the XC functional. The BFGS optimization algorithm was applied to optimize these structures. For adsorption configuration optimization, a cutoff energy of 280 eV was used for the basis set, and a Monkhorst–Pack scheme was chosen to describe the sampling of the Brillouin zone using a mesh of (5 × 5 × 2) k grid point. The convergence criteria for the maximum force between atoms, maximum atomic displacement, and the maximum stress were set of 0.05 eV/Å, 0.002 Å, and 0.1 GPa, respectively. The self-consistent field (SCF) convergence tolerance was set to 2.0 × 10⁻⁶ eV/atom.
The molybdenite model used for all calculations and simulations in this study was the 2H-MoS2 model. The molybdenite cell was extended into a (3 × 2 × 2) super cell first. A vacuum layer of 15 Å in the c-direction was set to eliminate interactions between the adjacent slabs. The face surface was built along the (001) cleavage plane and the edge surface was built along the (100) cleavage plane. The following valence electrons configurations were considered to calculate the pseudo potential of each atom—Mo-4s24p64d55s1 and S-3s23p4.
Ca2+ and CaOH+ are considered as the most common ionic forms of the calcium ion in solution [21,22]. In the simulation, Ca2+ was directly placed above the molybdenite surface. The geometry of CaOH+ was first constructed and optimized in the CASTEP module. Ca2+ and the optimized CaOH+ structure were placed on the optimized molybdenite surface to calculate and simulate its interaction process. The adsorption mechanism of calcium ions on the molybdenite surface was investigated by calculating the related adsorption energy (EAds), Mulliken bond, Mulliken charge distribution and partial density of states (PDOS). The adsorption energy of ions adsorbed on the molybdenite surface is calculated using Equation (2):
where ESurf-Ion, ESurf, EIon are the energy after ion adsorbed on the surface, the energy of the surface and the energy of the ion, respectively.
3. Results and Discussions
3.1. Effect of Calcium Ions on Molybdenite Flotation Performance
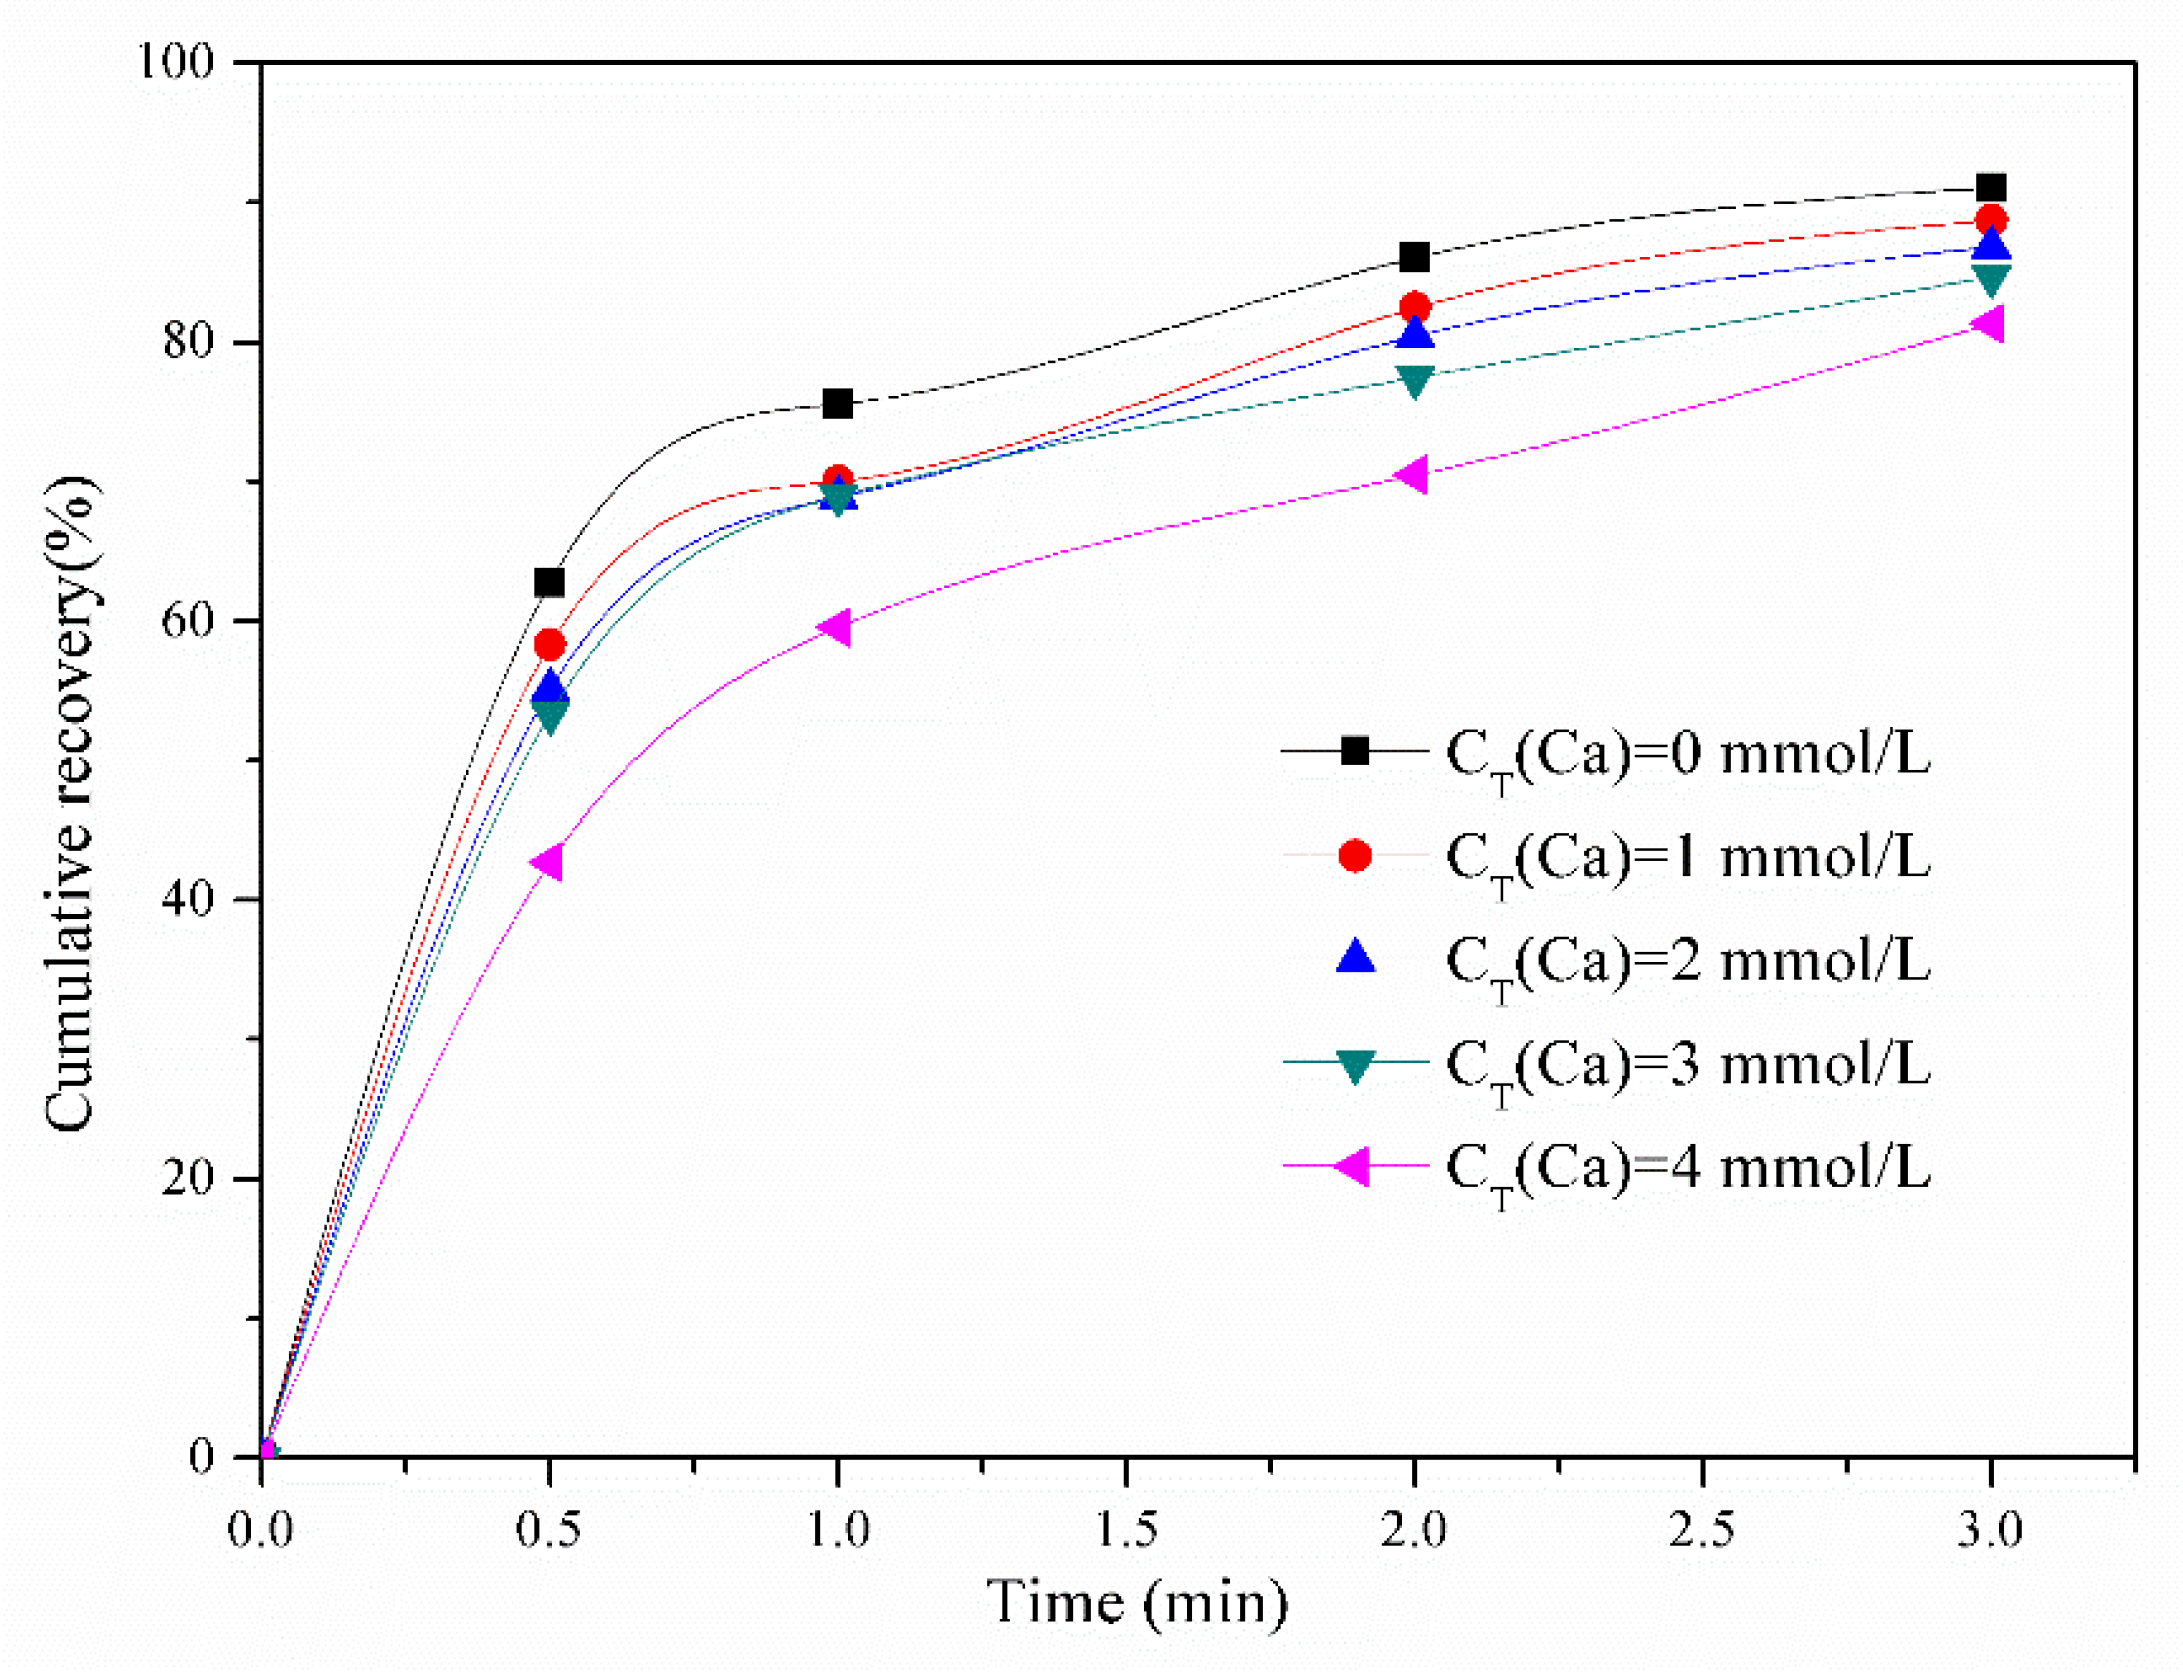
The flotation process is complex because of the interactions between the three phases (solid, gas, liquid) in the flotation system. The variation of cumulative flotation recovery with time is considered as an effective method to describe the flotation process [23,24]. To investigate the effects of calcium ions on molybdenite flotation, flotation recovery was obtained as the function of time using micro-flotation tests. The cumulative recovery–time curves are displayed in Figure 4. The figure shows that the flotation rate decreases with calcium ion concentration, which is similar with the work of Zhu et al. [25]. When calcium ion concentration increases from 0 to 1 mmol/L, the cumulative recovery decreases by 4.4%, 5.3%, 3.6% when the flotation time is 0.5, 1 and 2 min, respectively. However, as the calcium ions concentration varies from 1 to 3 mmol/L, the cumulative recovery changes very little. When the calcium ion concentration is increased to 4 mmol/L, the cumulative recovery decreases again. For different calcium concentrations, the variation of cumulative recovery with time is similar. The greatest flotation rate is observed in the first 0.5 min in all tests, while the flotation rate from 1 to 3 min is the slowest and remains the same.
3.2. Wetting Properties of Molybdenite Different Surfaces
The hydrophobicity of mineral surfaces is the most important index to evaluate the flotation performance. Studying the physical and chemical properties of minerals at the solid–liquid interface is an important way to understand the change of the mineral surface hydrophobicity and its interaction mechanism with ions. The adsorption strength of ions is closely related to the charge properties of the mineral surface, which can be influenced by pH. For divalent ion solutions, when the solution becomes alkaline, the hydrolyzed cations Ca(OH)+ form and adsorb on MoS2 surfaces [26]. Recent studies showed that interaction of molybdenite edges with ions or reagents was stronger than that of faces, which changed molybdenite ores’ hydrophobicity [26,27]. In this study, the effect of calcium concentration on the contact angle of molybdenite face and edge surfaces is presented in Figure 5. The contact angle of the molybdenite face and edge both decrease with increasing concentration of Ca2+, and the decrease value of the edge surface is greater than that of the face surface. This phenomenon is likely due to the adsorption of hydrophilic complexes on the mineral surface, which reduces the surface hydrophobicity [16]. The change of contact angle of the molybdenite’s faces and the edges with calcium ions has been studied previously, and reached the same conclusions with molybdenite particles (+150 μm) at pH 8 [28], which shows that the trend is independent of particle size and shape form. In the work of Wan et al. [29], Ca2+ was found to interact with molybdenite edges, producing CaMoO4 precipitates, which were responsible for the depression of molybdenite flotation by preventing the adsorption of diesel.
3.3. Batch Adsorption of Calcium Ions on Molybdenite
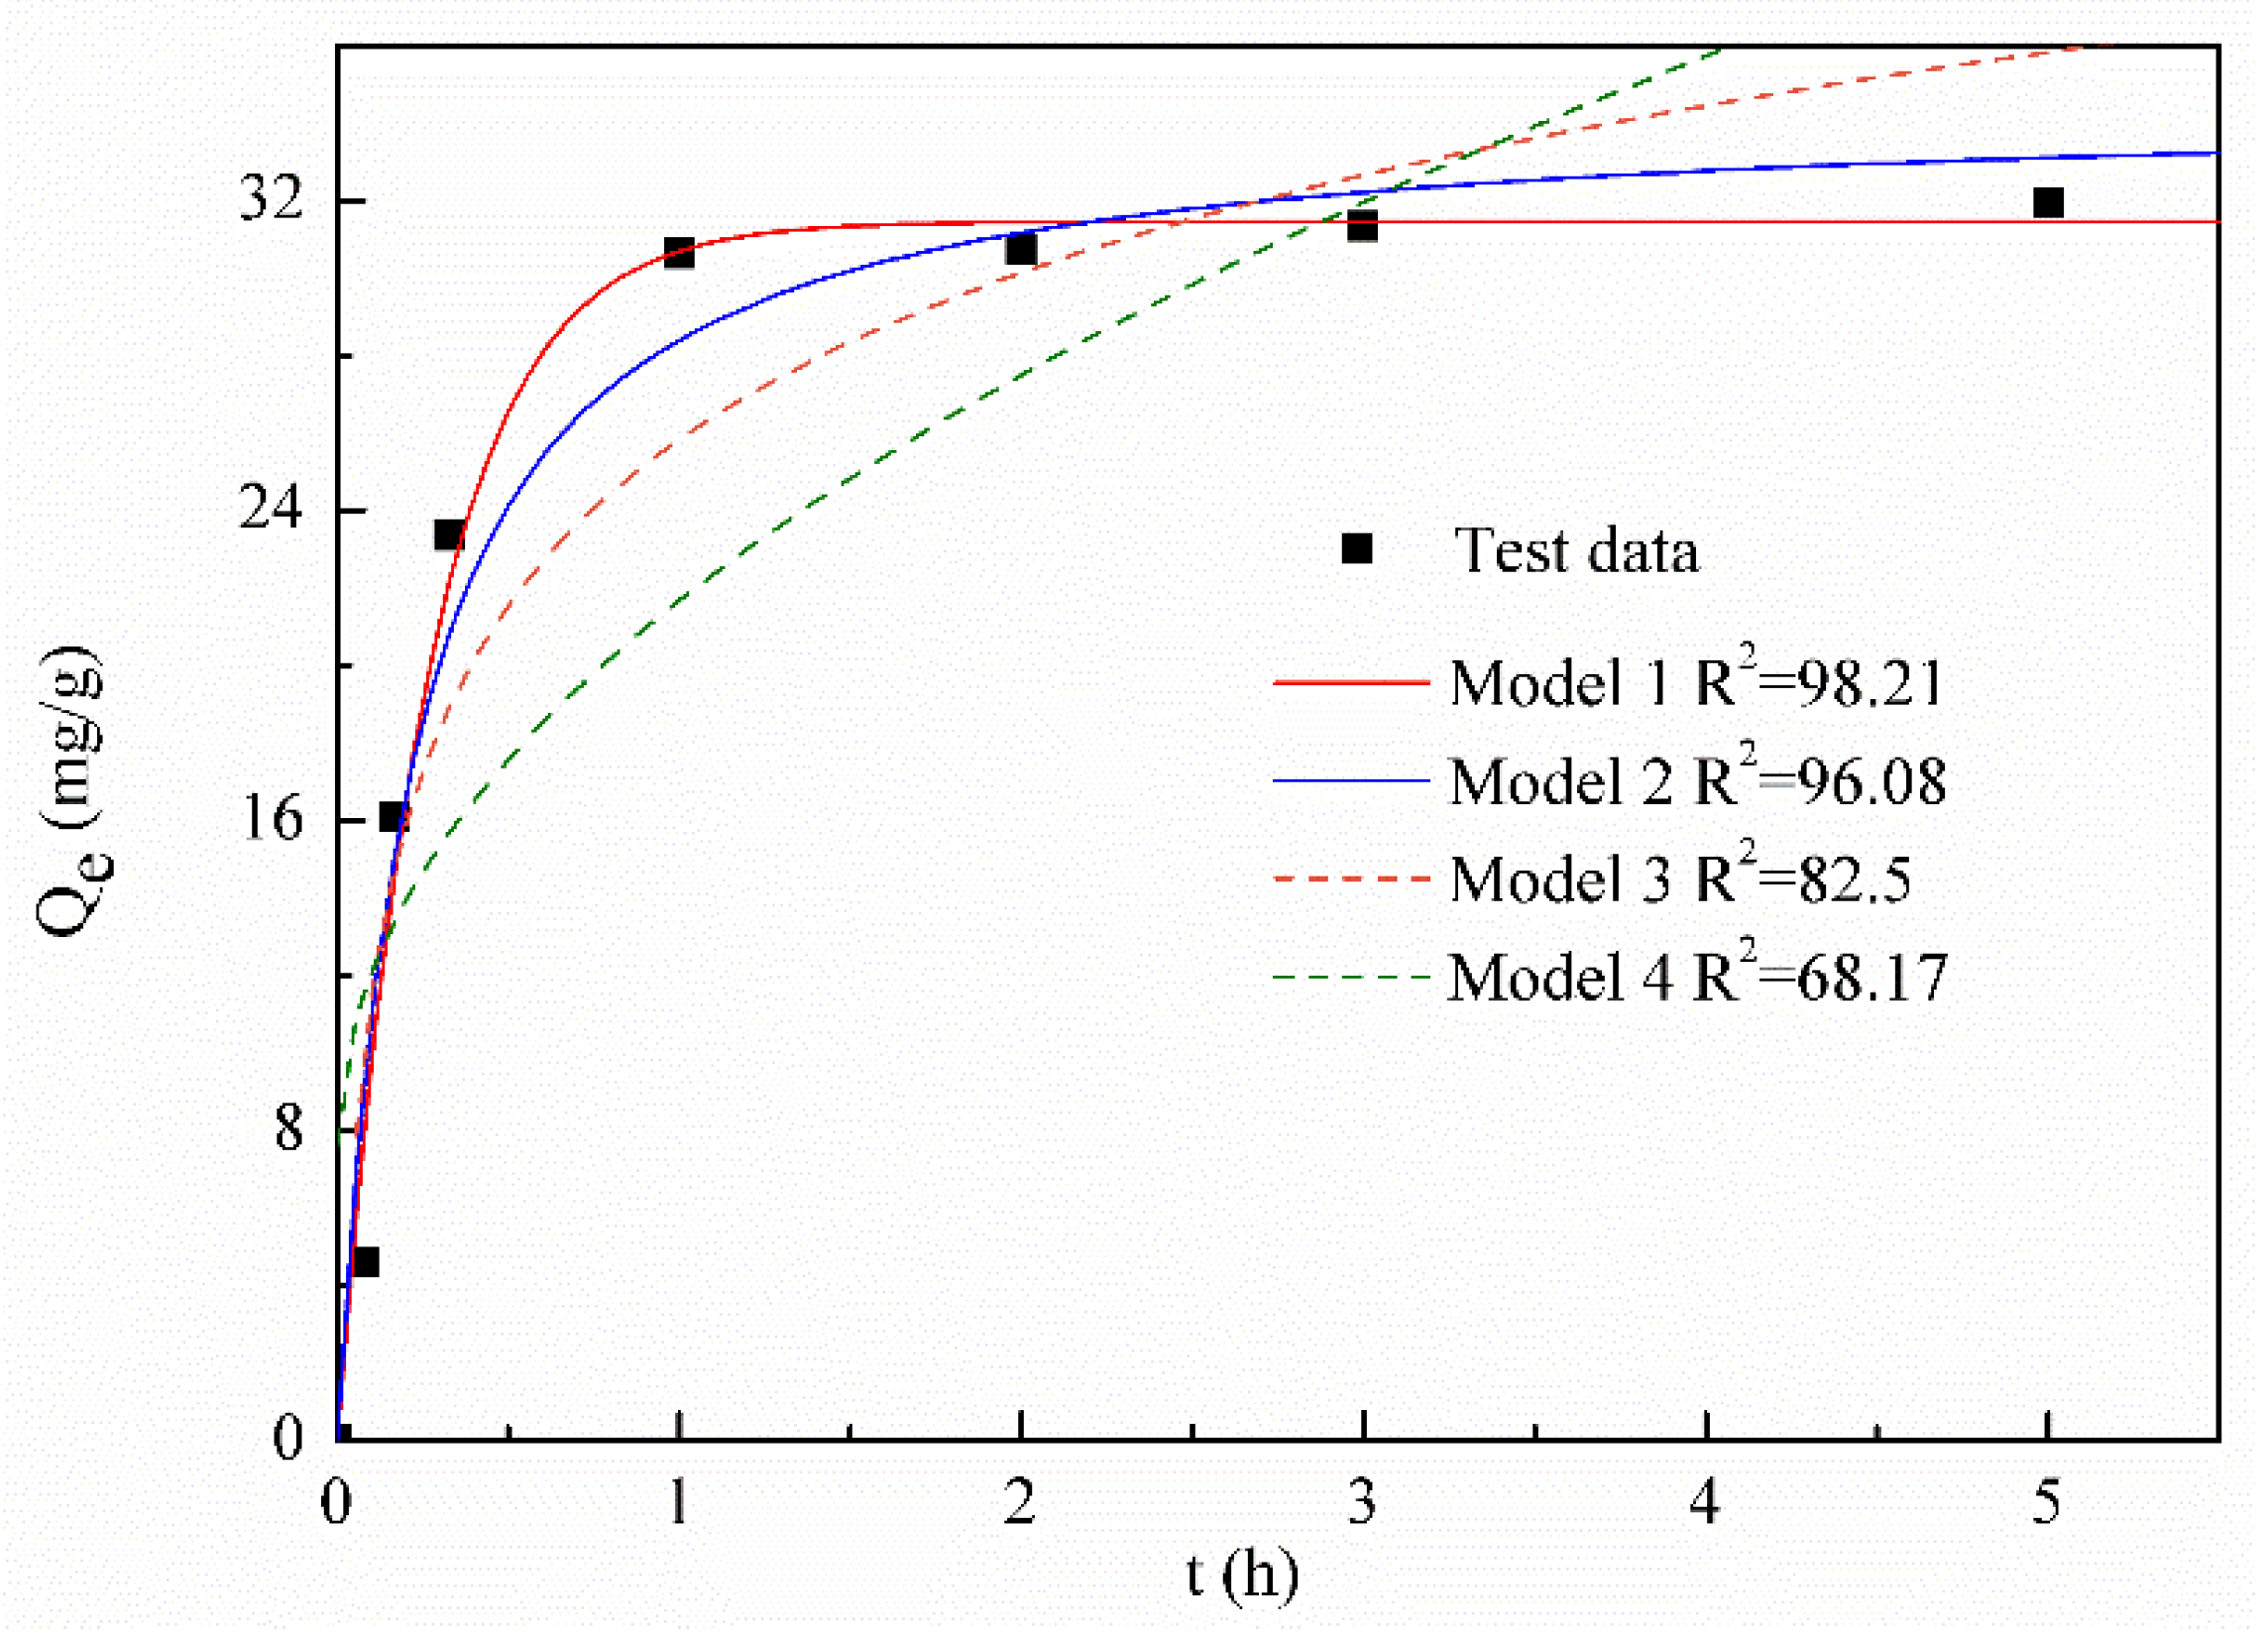
Since the hydrophobicity of mineral surfaces can be changed by the adsorption of cations, batch adsorption tests were carried out to investigate the adsorption property of calcium ions on molybdenite with the initial ion concentration of 14 mmol/L. The adsorption amount of calcium ions varies with time, as shown in Figure 6. The test results reveal that the adsorption process is composed of three stages (rapidly increasing, slowly increasing, and finally stabilizing). At the beginning, the adsorption of ions on molybdenite increased rapidly with the time. This observed rapid increase in adsorption capacity in 0.5 h is due to enough available adsorption sites [30]. After 0.5 h, due to the reduction in available active sites, competitive adsorption was initiated. Equilibrium was attained at 1 h with 30.6 mg/g adsorption of calcium ions.
The adsorption process of adsorbate to adsorbent is always complex in the solution environment. Adsorption kinetics study and adsorption isotherm analysis were used to reflect the adsorption mechanism, which can provide valuable information in the flotation process design. Four adsorption kinetic models (Table 1) were selected to explore the adsorption kinetics and adsorption mechanism [31]. The MATLAB software was used to fit the adsorption data and the kinetic model parameters were calculated. The models were compared according to the correlation coefficient (R2) (Figure 6). The pseudo-first-order model and pseudo-second-order model nicely followed the experimental trend since the value of R2 reached 98.21 and 96.08, respectively. When the Elovich equation and the intra-particle diffusion model were used to fit the experimental data, the fitting results were not good. Therefore, the adsorption of calcium ions on the molybdenite surfaces fitted the pseudo-first-order model best.
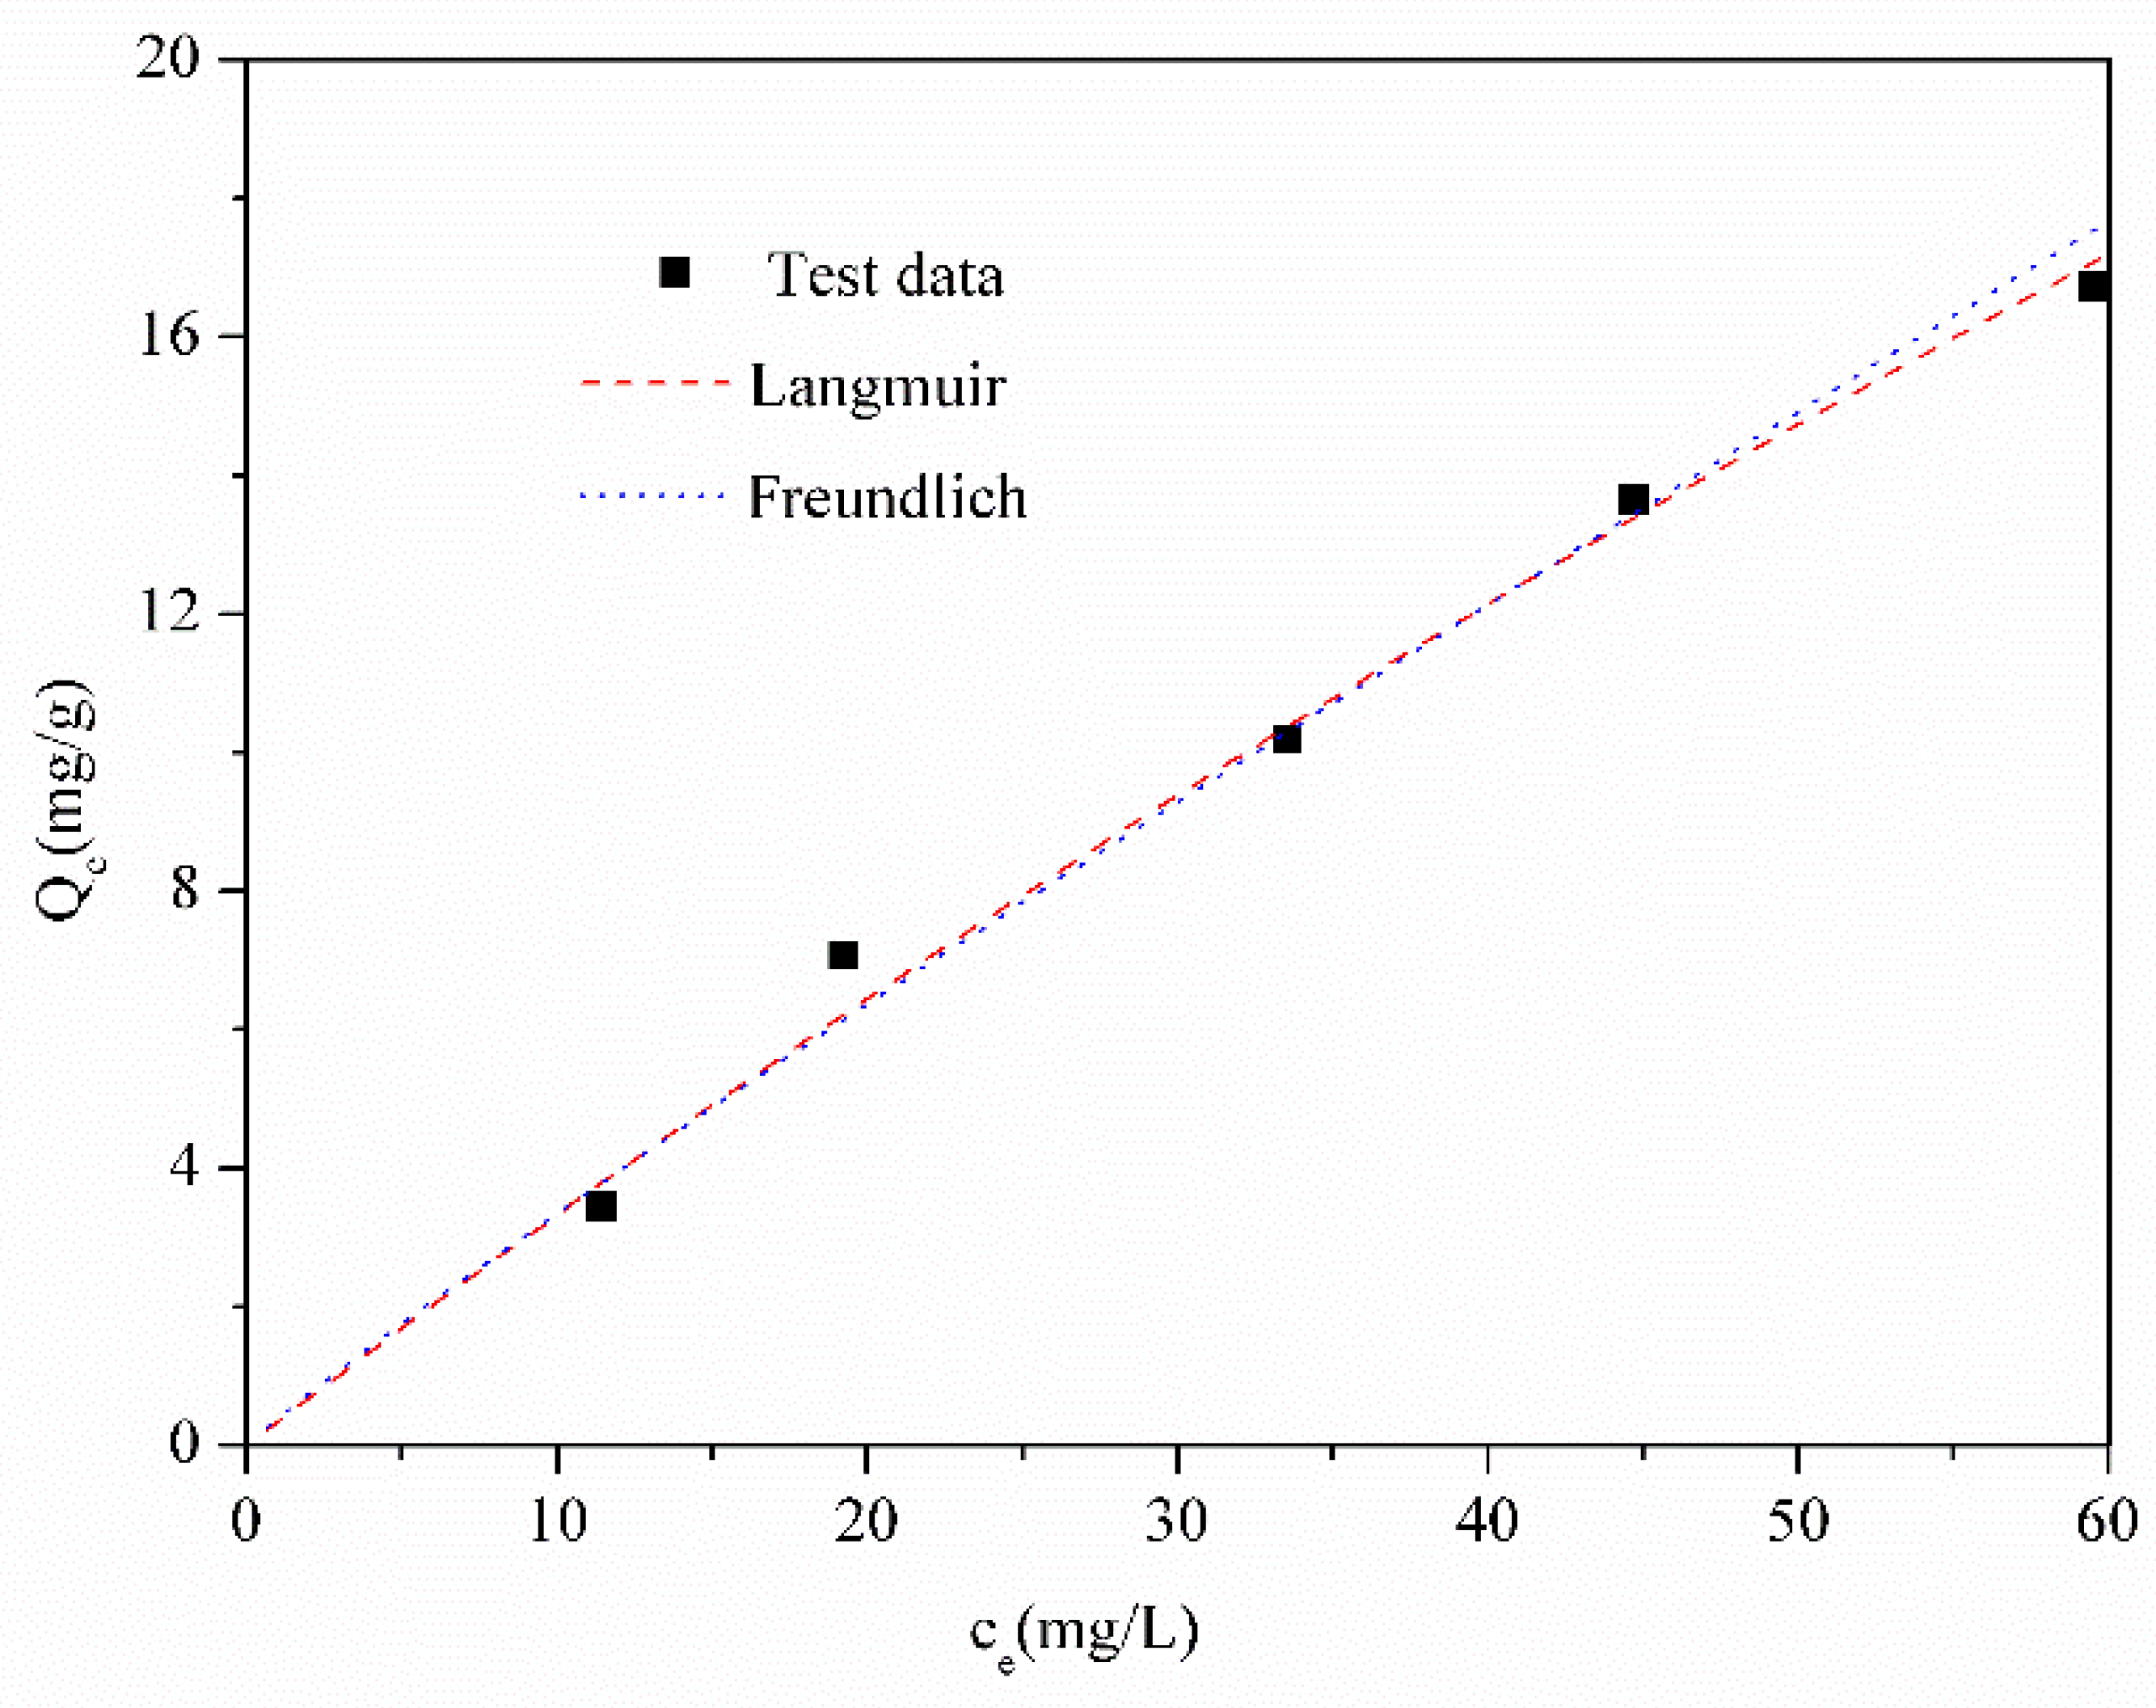
The adsorption isotherm experimental data obtained by carrying out adsorption tests with a series of initial calcium ion concentrations is displayed in Figure 7. An equilibrium conditions relationship between the amount of adsorbed calcium ions on molybdenite surfaces and the calcium ion concentration was described and established by mathematical models. The Langmuir (Equation (3)) and Freundlich (Equation (4)) adsorption isotherm models were often used for fitting the adsorption data [32,33]. The fitted parameters are shown in Table 2.
where Ce is the calcium ions concentration at equilibrium conditions, mg/L, Qm is the maximum adsorption amount, mg/g, K is the constant, n is related to the adsorption intensity.
According to the results of Table 2, it can be seen that the Langmuir and Freundlich models fit the isotherms and correlated with the experimental data well, with R2 values of 96.27 and 97.31, respectively. In comparison, the Freundlich models are better for describing the experimental data of calcium ion adsorption on molybdenite surfaces. As the Freundlich isotherm is based on the assumption that the adsorption is multilayered and heterogeneous, calcium ions can be adsorbed on molybdenite surfaces through multilayer adsorption [34].
3.4. Simulation of Calcium Ions on Molybdenite Surfaces Based on DFT
To explain the interaction mechanism of calcium ions with the molybdenite face and edge surfaces at an atomic scale, simulations using DFT were carried out. The first step of the simulation work was creating the molybdenite (001) and (100) surfaces using the super cell. Then, the most stable adsorption configuration of calcium ions on different molybdenite surfaces was given after geometry optimization. The detailed bond properties and bonding mechanism were studied finally based on the configuration.
3.4.1. Building the Molybdenite (001) and (100) Surfaces
There is a good agreement that the lower surface energy can guarantee the system stability. In the current work, the surface energy was calculated using Equation (5) [35]:
Esurf is the surface energy, Eslab is the super cell energy, N is the number of unit cell, Ebulk is the unit cell energy, A is the surface area.
Effects of the number of layers on the calculated energy of the molybdenite (001) surface and (100) surface are shown in Figure 8. As we can see, the energy of the molybdenite (001) surface was slightly increased as the atom layer changed from two to four, but it greatly increased as atom layer bigger than four. It implies that the (001) surface well converged at four layers slab, so four layers were used for molybdenite (001) surface building and calculation (Figure 8a). The energy of the molybdenite (100) surface had a little increase with the increase of atom layers. When the energy changes little, the system with fewer atoms will be selected to reduce the computing effort, so four layers of atoms were chosen for molybdenite (100) surface calculation, which is same as in the literature [36].
3.4.2. Adsorption Configuration of Calcium Ions on Molybdenite Different Surfaces
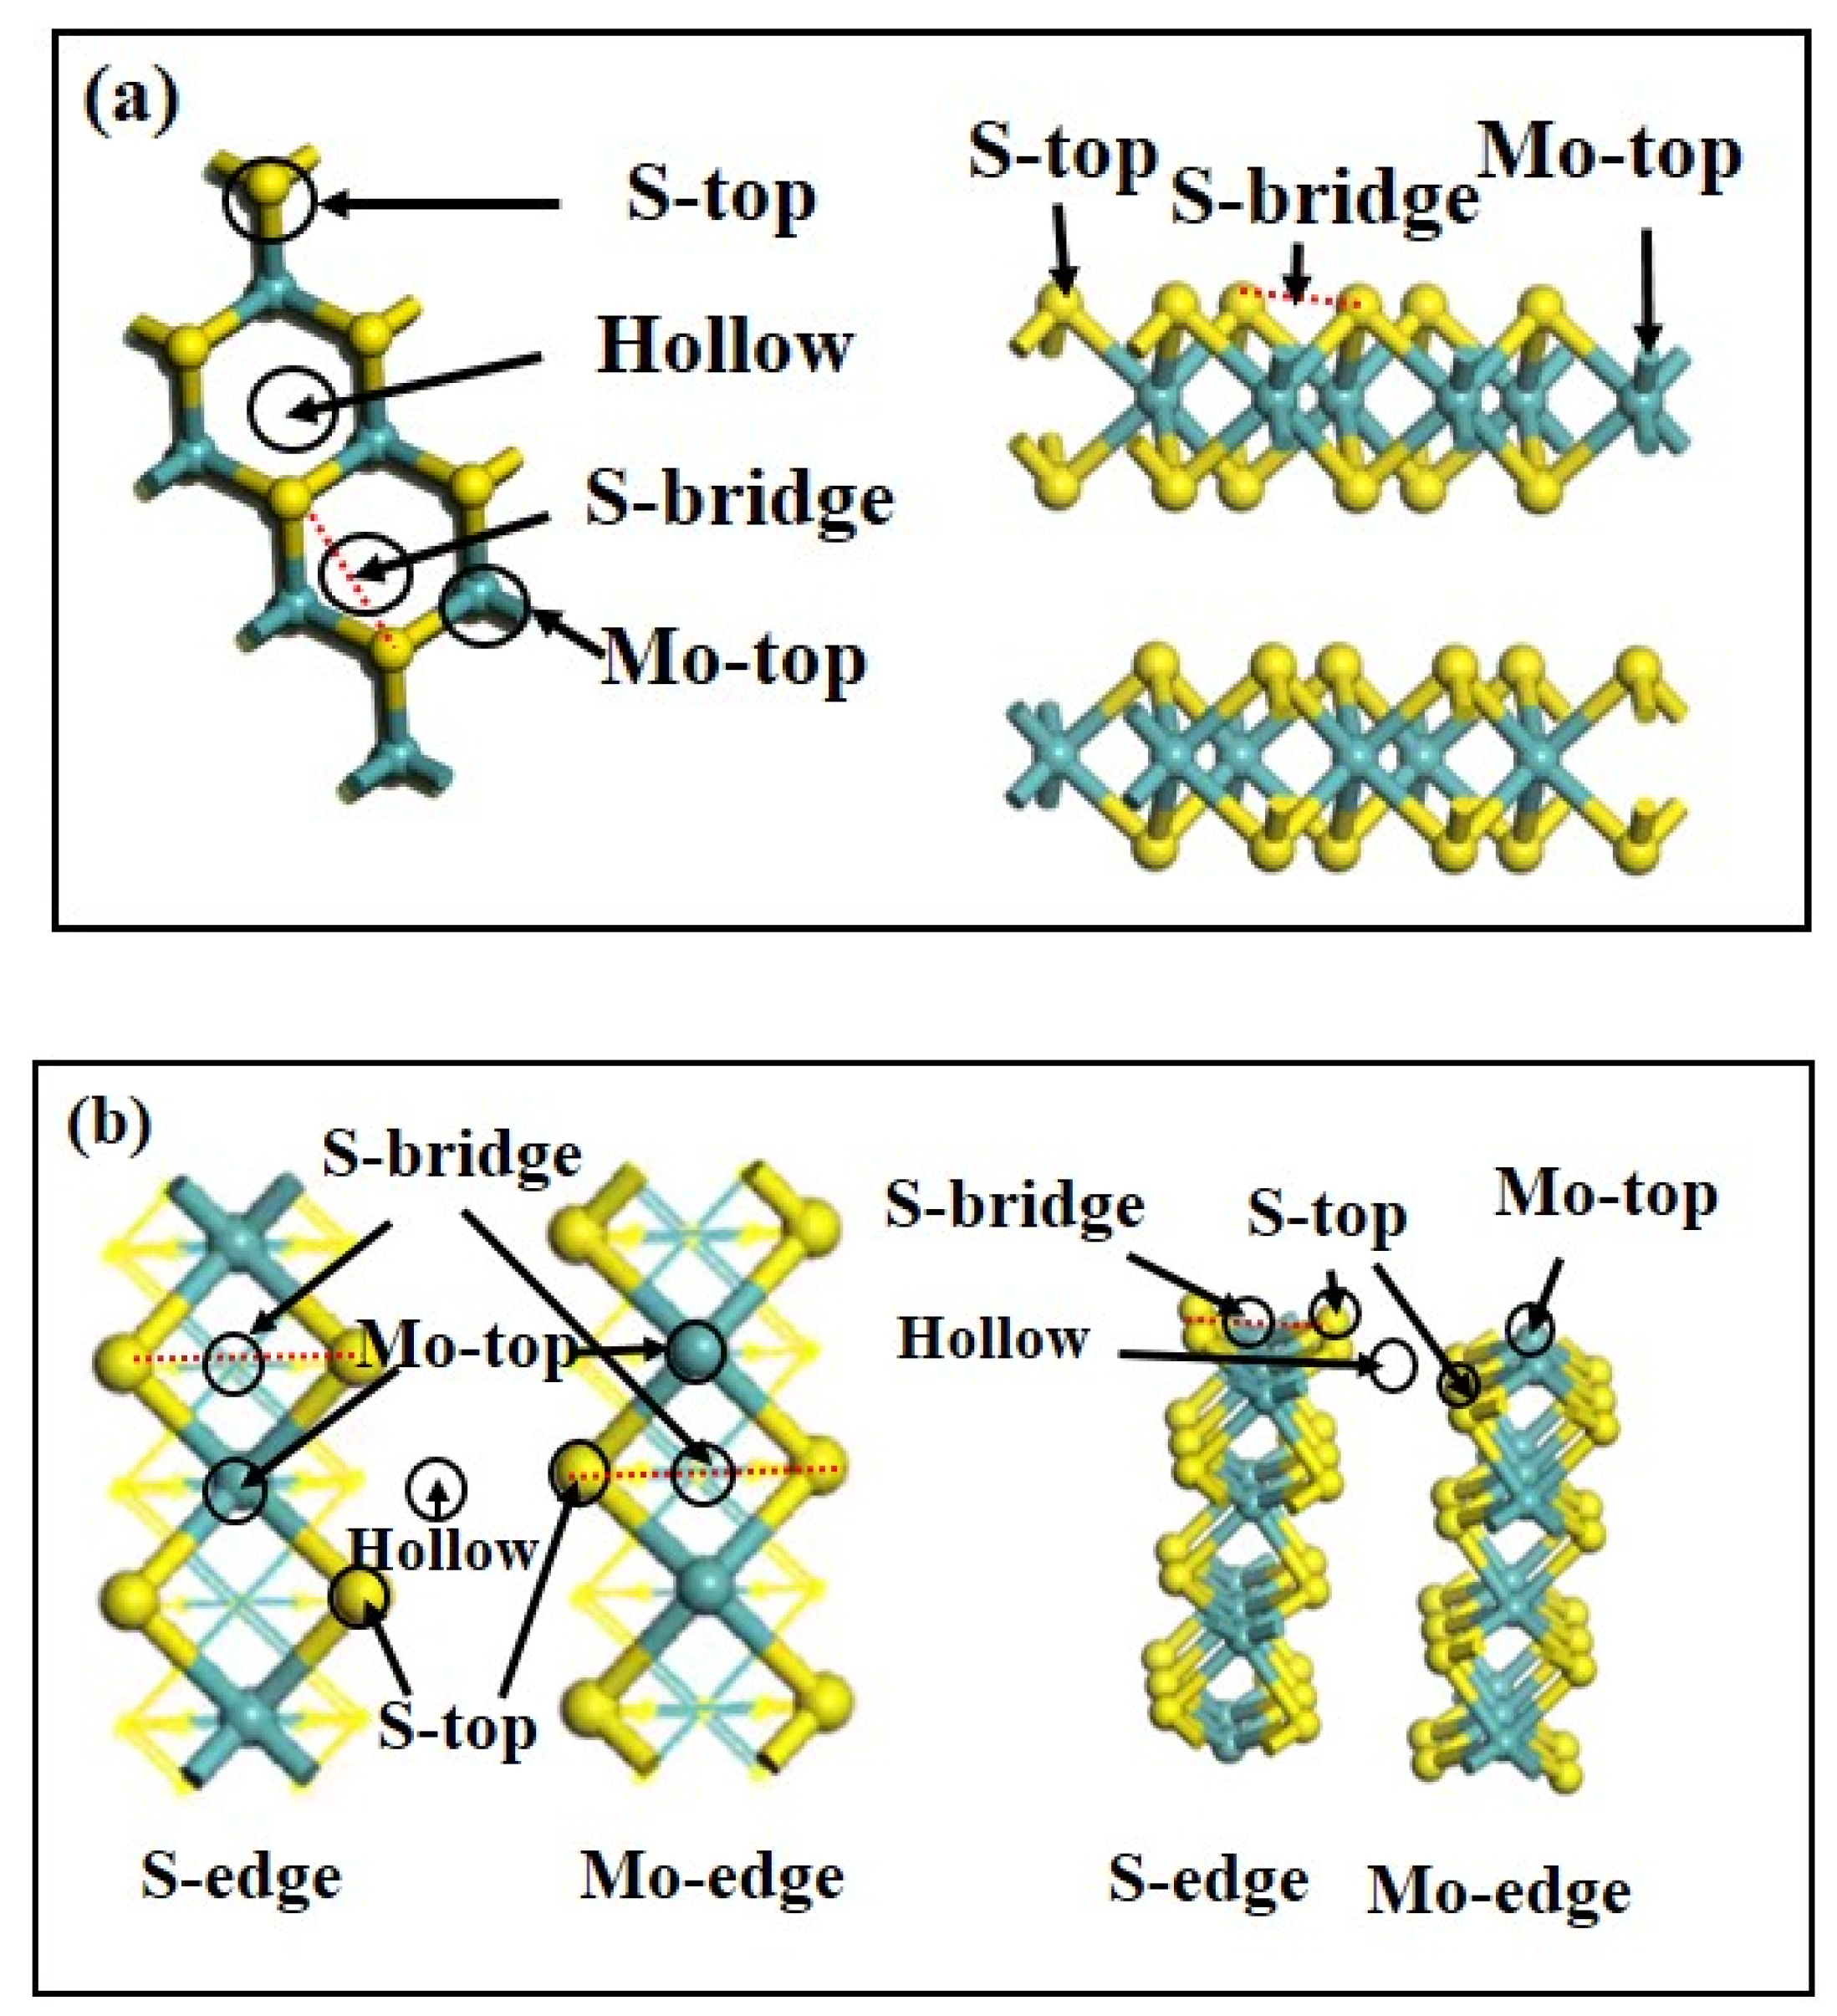
In this paper, to determine the dominate adsorption site and configuration of calcium ions (Ca2+ and CaOH+) on molybdenite surfaces, the adsorption energies and bond lengths of various adsorption sites were simulated. As shown in Figure 9a, for the nonpolar (001) surface, four typical active sites (S-top, Mo-top, S-bridge and Hollow) were considered [37]. For the molybdenite (100) surface, seven adsorption sites are considered due to the possibility of having an asymmetry feature between the S-edge and Mo-edge. These sites are three adsorption sites on the S-edge (Mo-top, S-top, S- bridge) and Mo-edge (Mo-top, S-top, S- bridge), respectively, with one site between them (Hollow), as shown in Figure 9b.
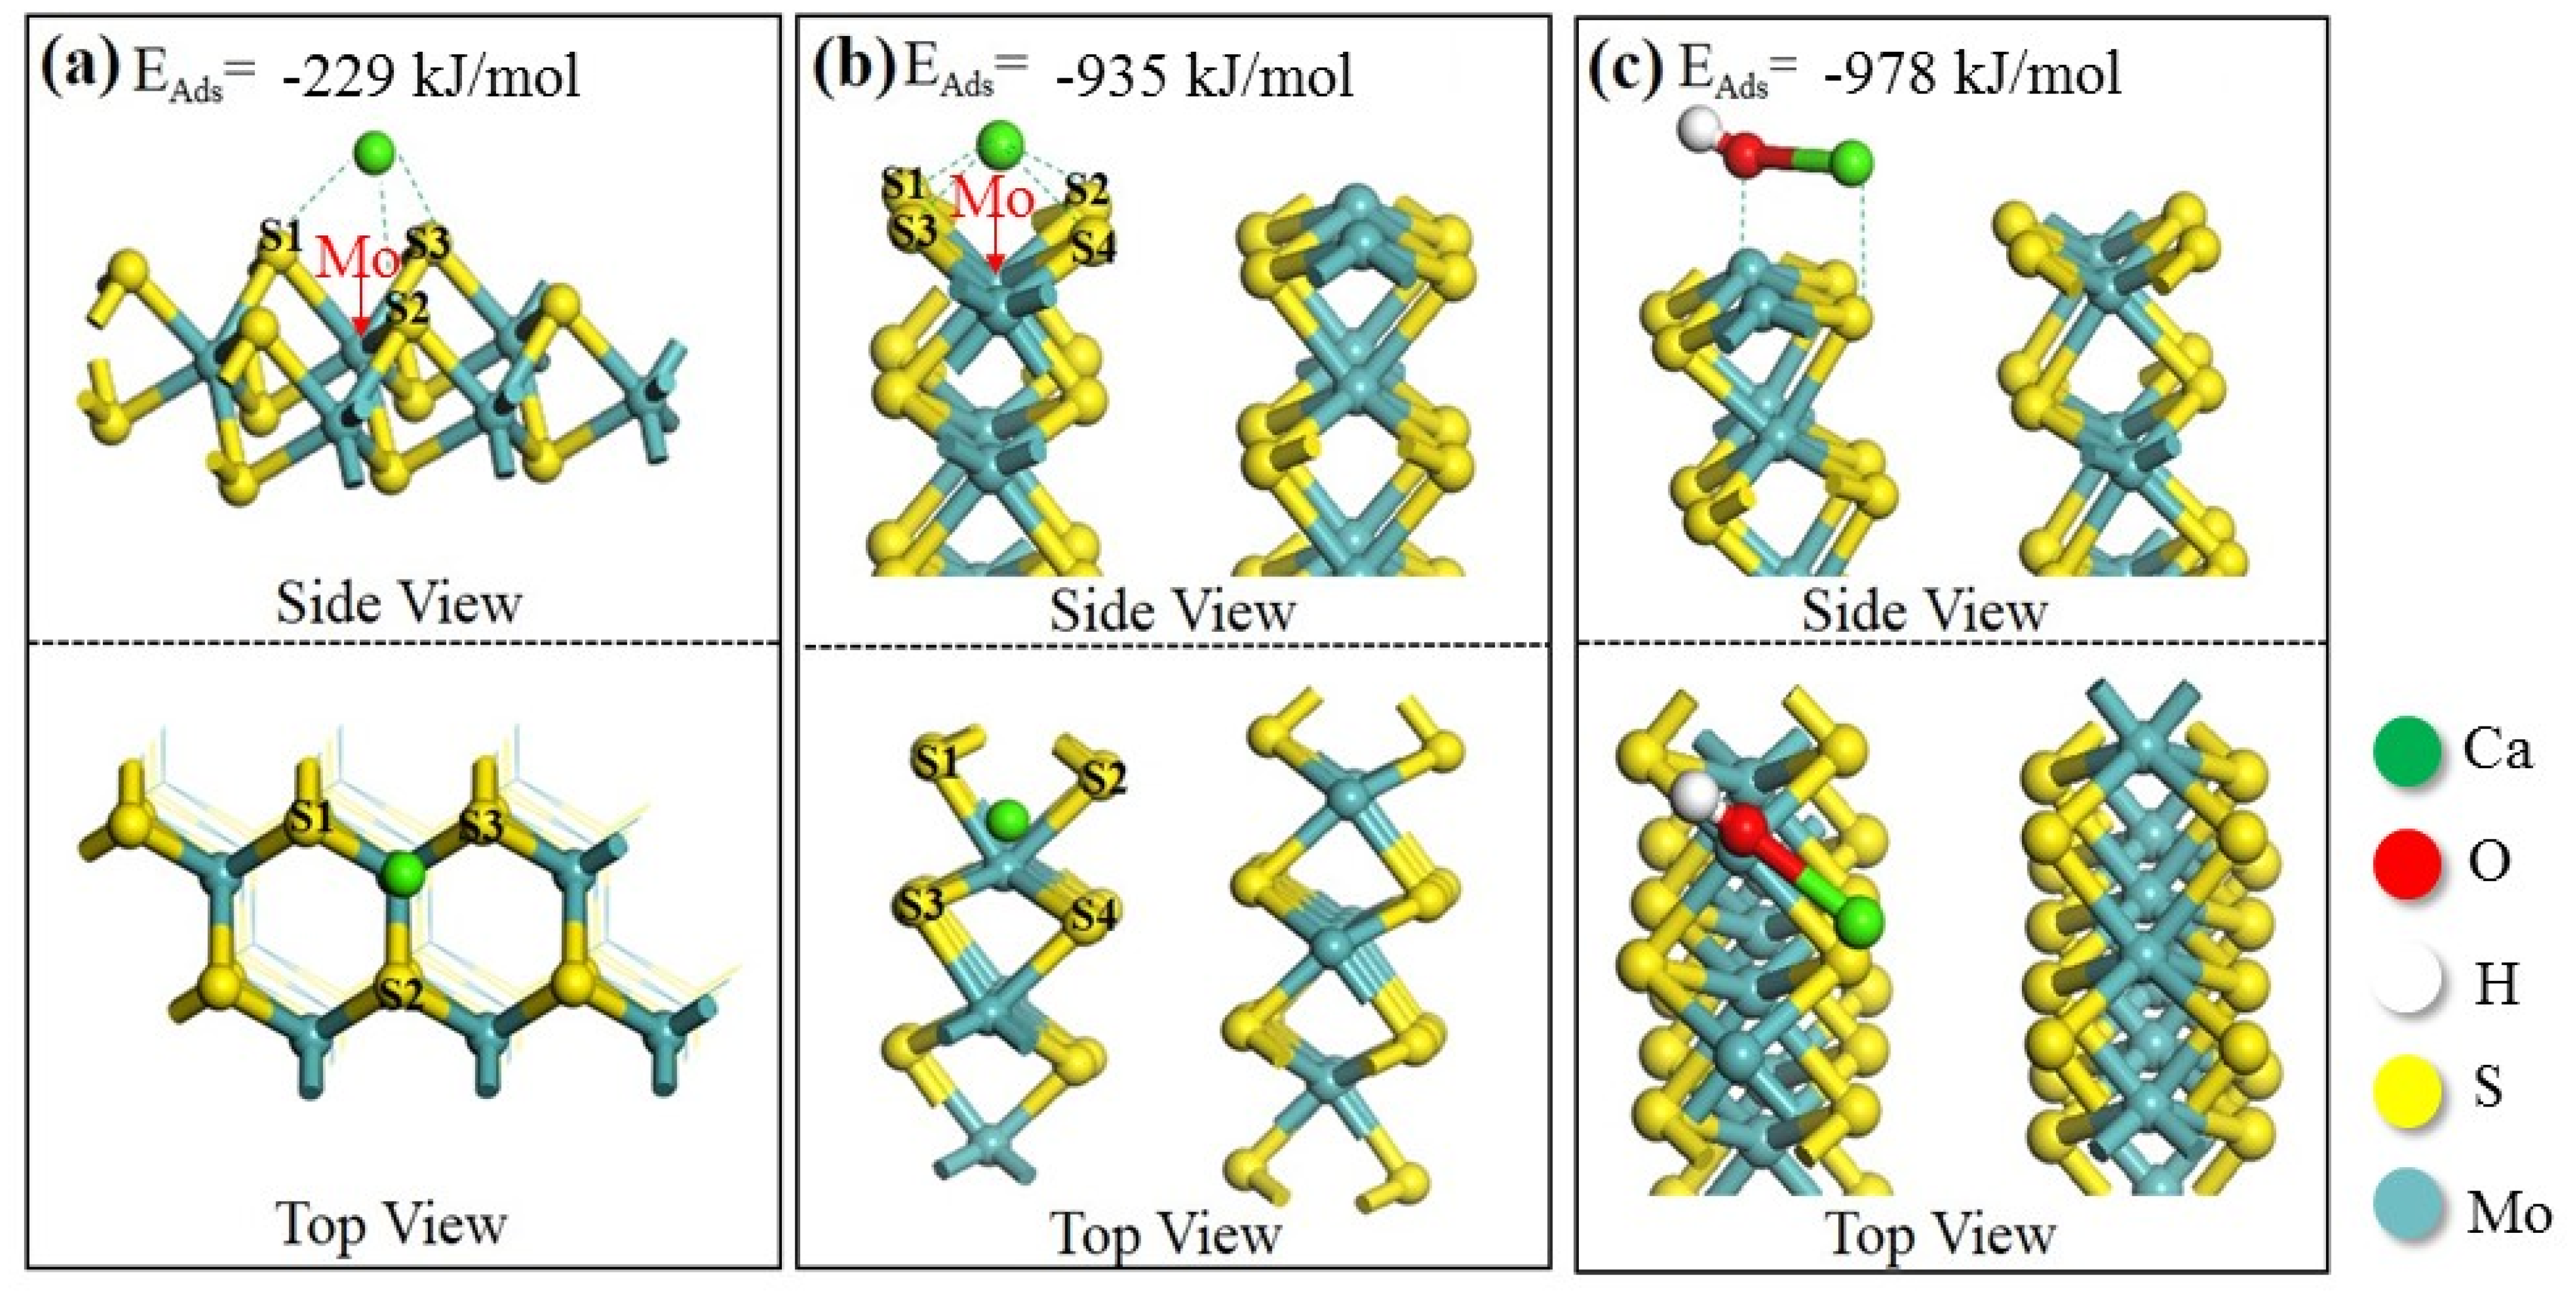
The calculated adsorption energies of calcium ions on different sites are shown in Table 3. It is noticed that the adsorption energy of calcium ions on the (100) surface is more negative than on the (001) surface, indicating that calcium ions are prefer to adsorb on the (100) surface since the more negative adsorption energy represents the more stable adsorption configuration. The difference of calcium ion adsorption between the (001) surface and the (100) surface can be attributed to the much greater electrochemical activity of the edge planes than the basal plane [38,39]. For the molybdenite (001) system, the adsorption energy of CaOH+ on it was close to zero, indicating that CaOH+ may not adsorb on the molybdenite (001) spontaneously. Comparing the adsorption energy results of Ca2+ on the molybdenite (001) surface, the adsorption site of Ca2+ above a Mo atom on molybdenite (001) was the most stable, with the adsorption energy of −229 kJ/mol. The stable adsorption configuration is shown in Figure 10a.
For the molybdenite (100) surface system, the adsorption energies are all significantly negative, indicating that the adsorption is thermodynamically stable. After the optimization, the adsorption of Ca2+ on the S-(100) surface is the most energetically stable in the Mo-top site, with adsorption energies of −935 kJ/mol (Figure 10b). Similarly, the most energetically stable site for CaOH+ adsorption on the Mo-(100) surface is the S-top site, with adsorption energies of −978 kJ/mol (Figure 10c). This difference may be because the S-(100) surface exposes S atoms at the top, which are negatively charged as compared to the Mo atom.
3.4.3. Bonding Mechanism Analysis
It is observed from Figure 10 that after geometry optimization, Ca2+ always absorbs on the top of the Mo atom, and may bond with S atoms surrounding the Mo atom. For the most stable configuration of CaOH+ on the molybdenite (100) surface, Ca atoms adsorb on top of the S atom while O atoms do so on top of the Mo atom. They may form two bonds of Ca-S and Mo-O. In order to gain insight into the bonding mechanism, we looked at Mulliken bond populations, Hirshfeld charge analysis and PDOS analysis.
The results of inter-atomic distances and bonds are shown in Table 4. When Ca2+ adsorbed on the (001) and (100) surfaces, the Ca atom and the S atoms on the molybdenite surfaces formed bonds. For the (001) surface, the bond length between the Ca atom and its surrounding S atoms is 2.67, 2.637 and 2.65 Å. For the (100) surface, four Ca-S bonds are formed with the bond length of 2.54, 2.62, 2.42 and 2.52 Å. Examination of Ca-S distances from optimized structures revealed that Ca2+ adsorbs on (100) surface in a stable fashion (Eads = −935 kcal/mol). After geometry optimization, the values of the electron populations of the Ca-S bond are 0.05–0.10 when Ca2+ was adsorbed on the molybdenite surfaces. As we all know, the larger the population value of bonds, the greater the degree of covalence [40], so these Ca-S bonds are relatively weak. When CaOH+ adsorbs on the (100) surface, a Mo-O bond is formed as well as an S-Ca bond. The Mo-O bond population is 0.34 and the bond length is 2.03 Å, indicating that Mo-O is a covalent bond. This most stable adsorption of CaOH+ on the molybdenite (100) surface (Eads = −978 kcal/mol) is due to the combined effect of the Ca-S bond and Mo-O bond with large bond populations.
The charge transfer between atoms was calculated based on the Hirschfeld charge. Table 5 shows the Hirschfeld charge of S, Ca and Mo atoms before and after adsorption. PDOS of these atoms were analyzed to investigate the electronic properties simultaneously.
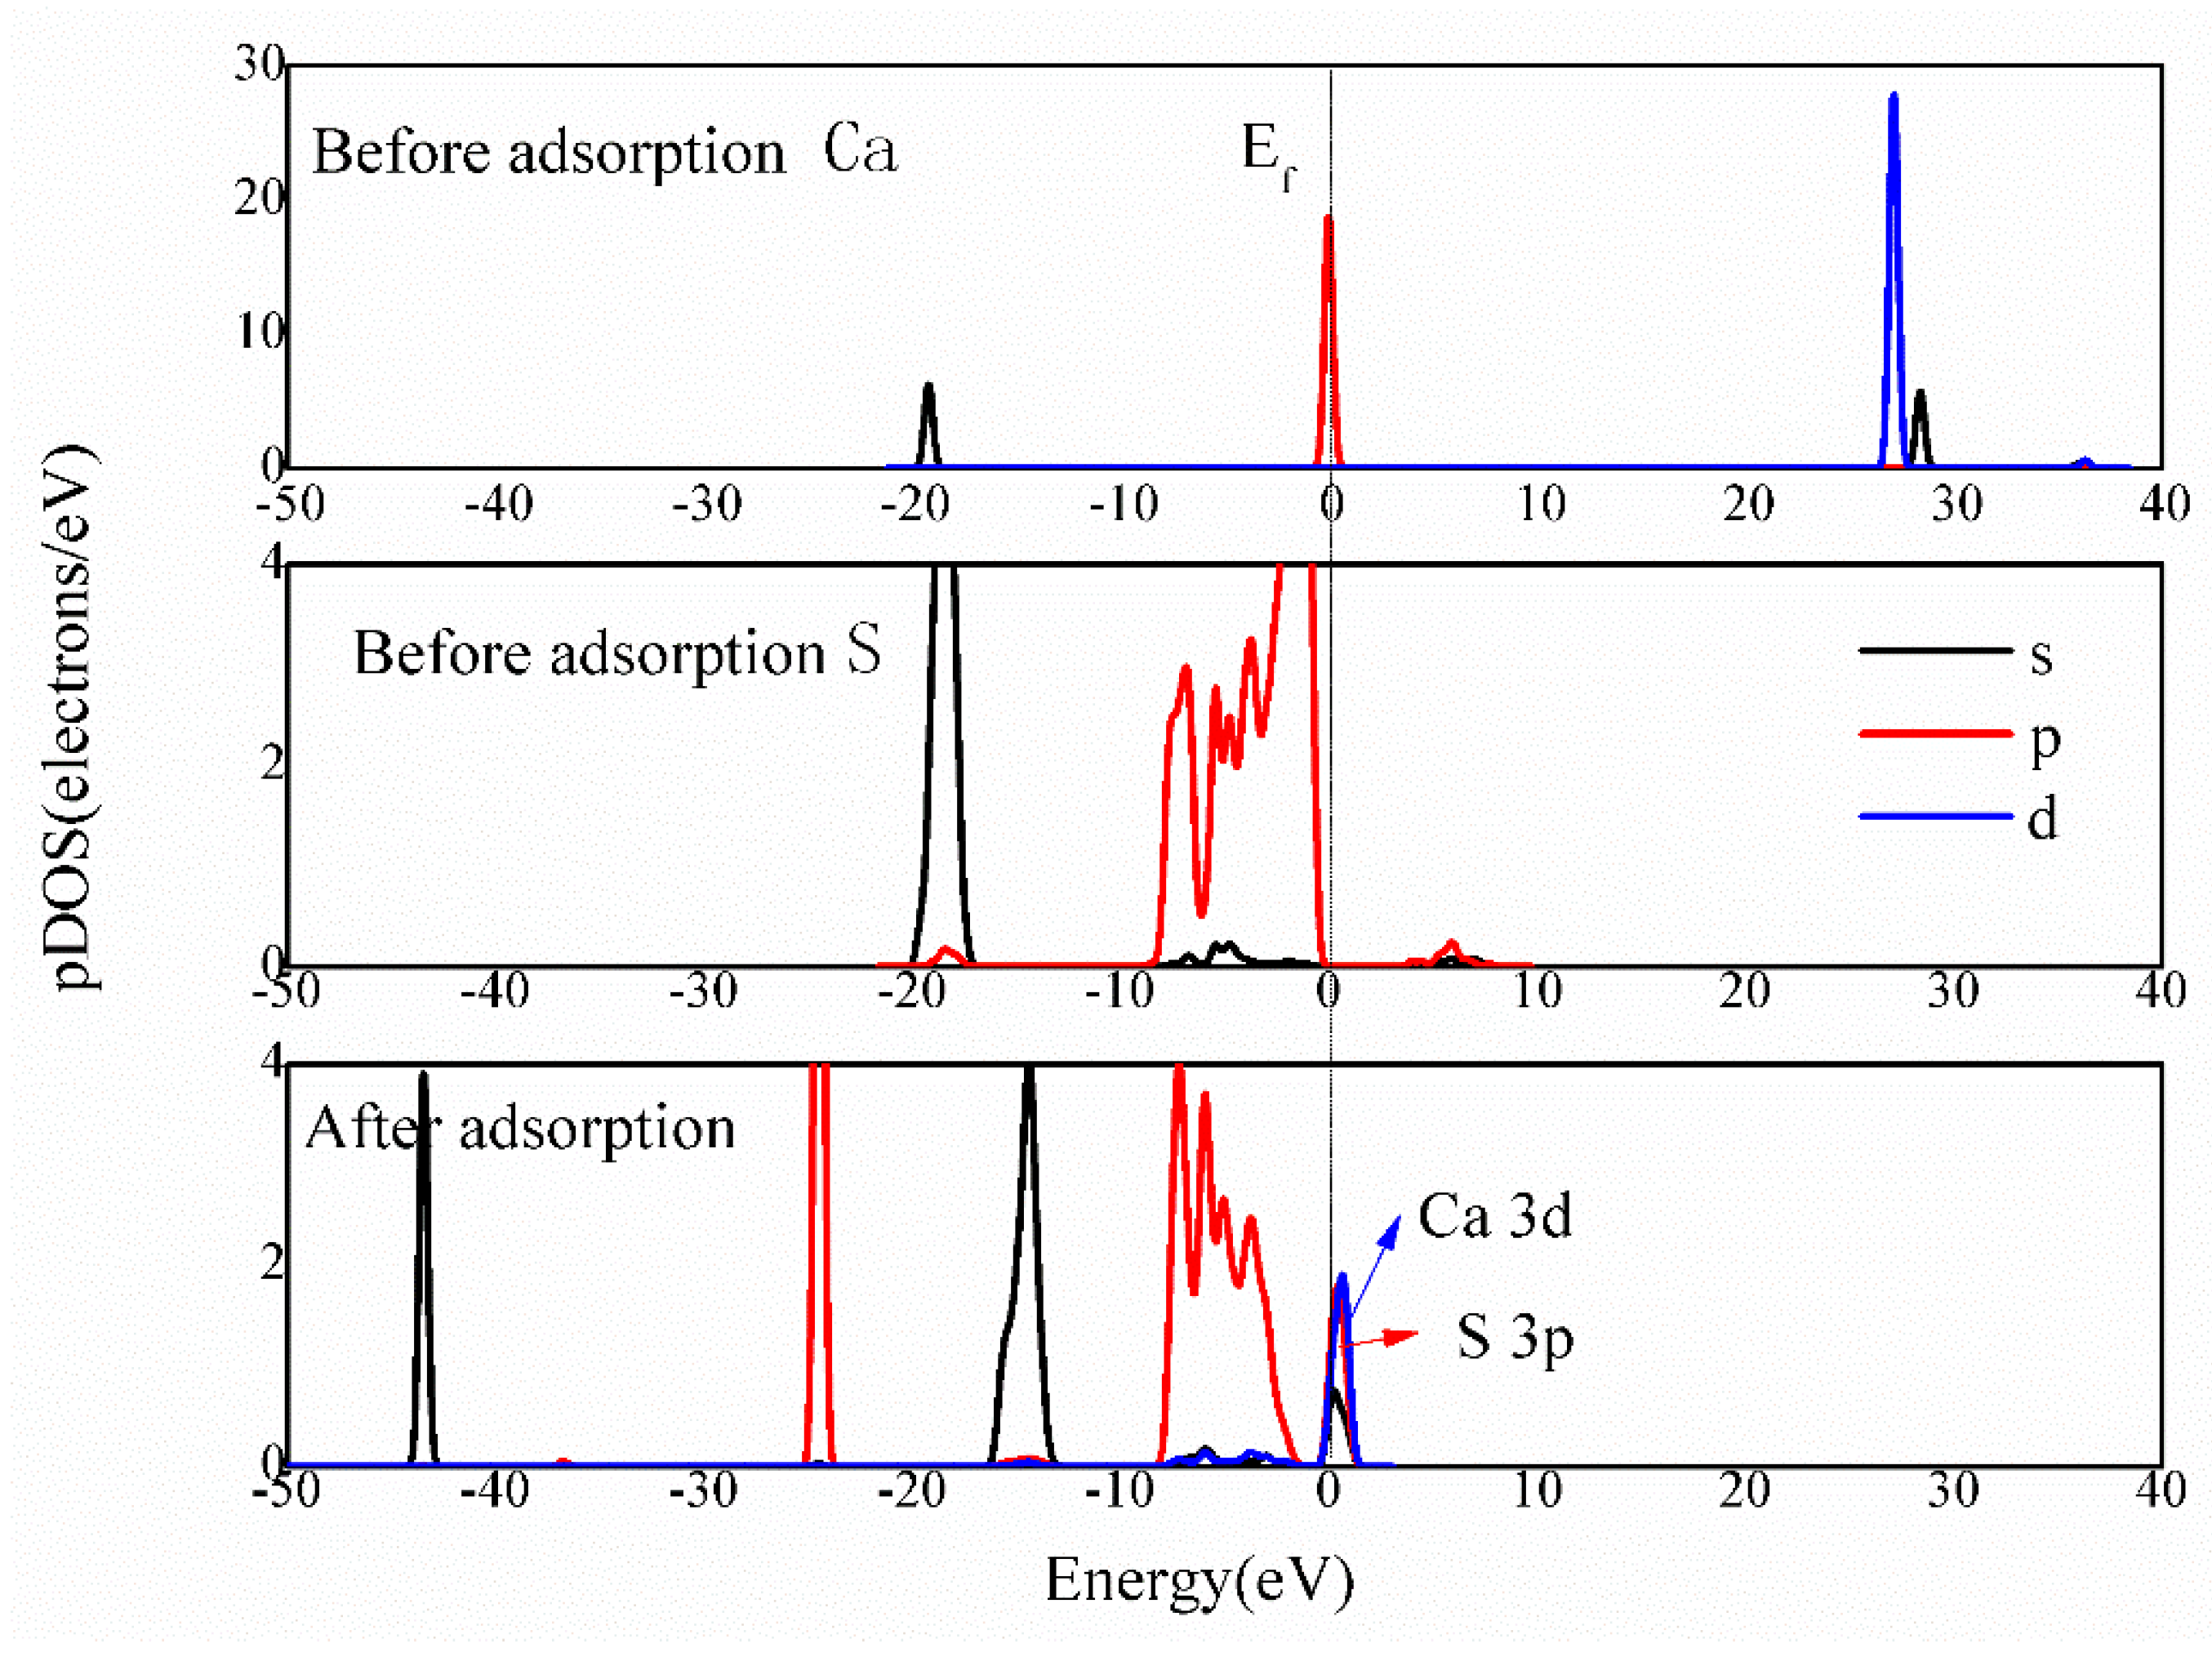
For Ca2+-(001) adsorption system, the Hirschfeld charge change of the Mo atom (Figure 10) was analyzed as well as the Ca atom and three S atoms. The gained electron for the Ca atom and three S atoms is 1.28 and 0.08 e, whereas the lost electron for the Mo atom is 0.02 e. It is noticed that an electron transferred from the Mo atom to the Ca atom, but the effect is quite weak for bonding. The Ca atom bond with three S atoms corresponds to the shared charge effect [41]. Figure 11 is the PDOS results of the Ca atom and the three S atoms before and after adsorption. The Ca 3d orbital and the S 3p orbital are bonded near −7–0 eV, indicating an interaction between Ca2+ and the molybdenite (001) surface. However, the overlapped density of state with the scope of −7–−1 eV is lower, and the overlap between −1–2.5 eV located around the Fermi level implies the bonding of Ca 3d and S3p is weak.
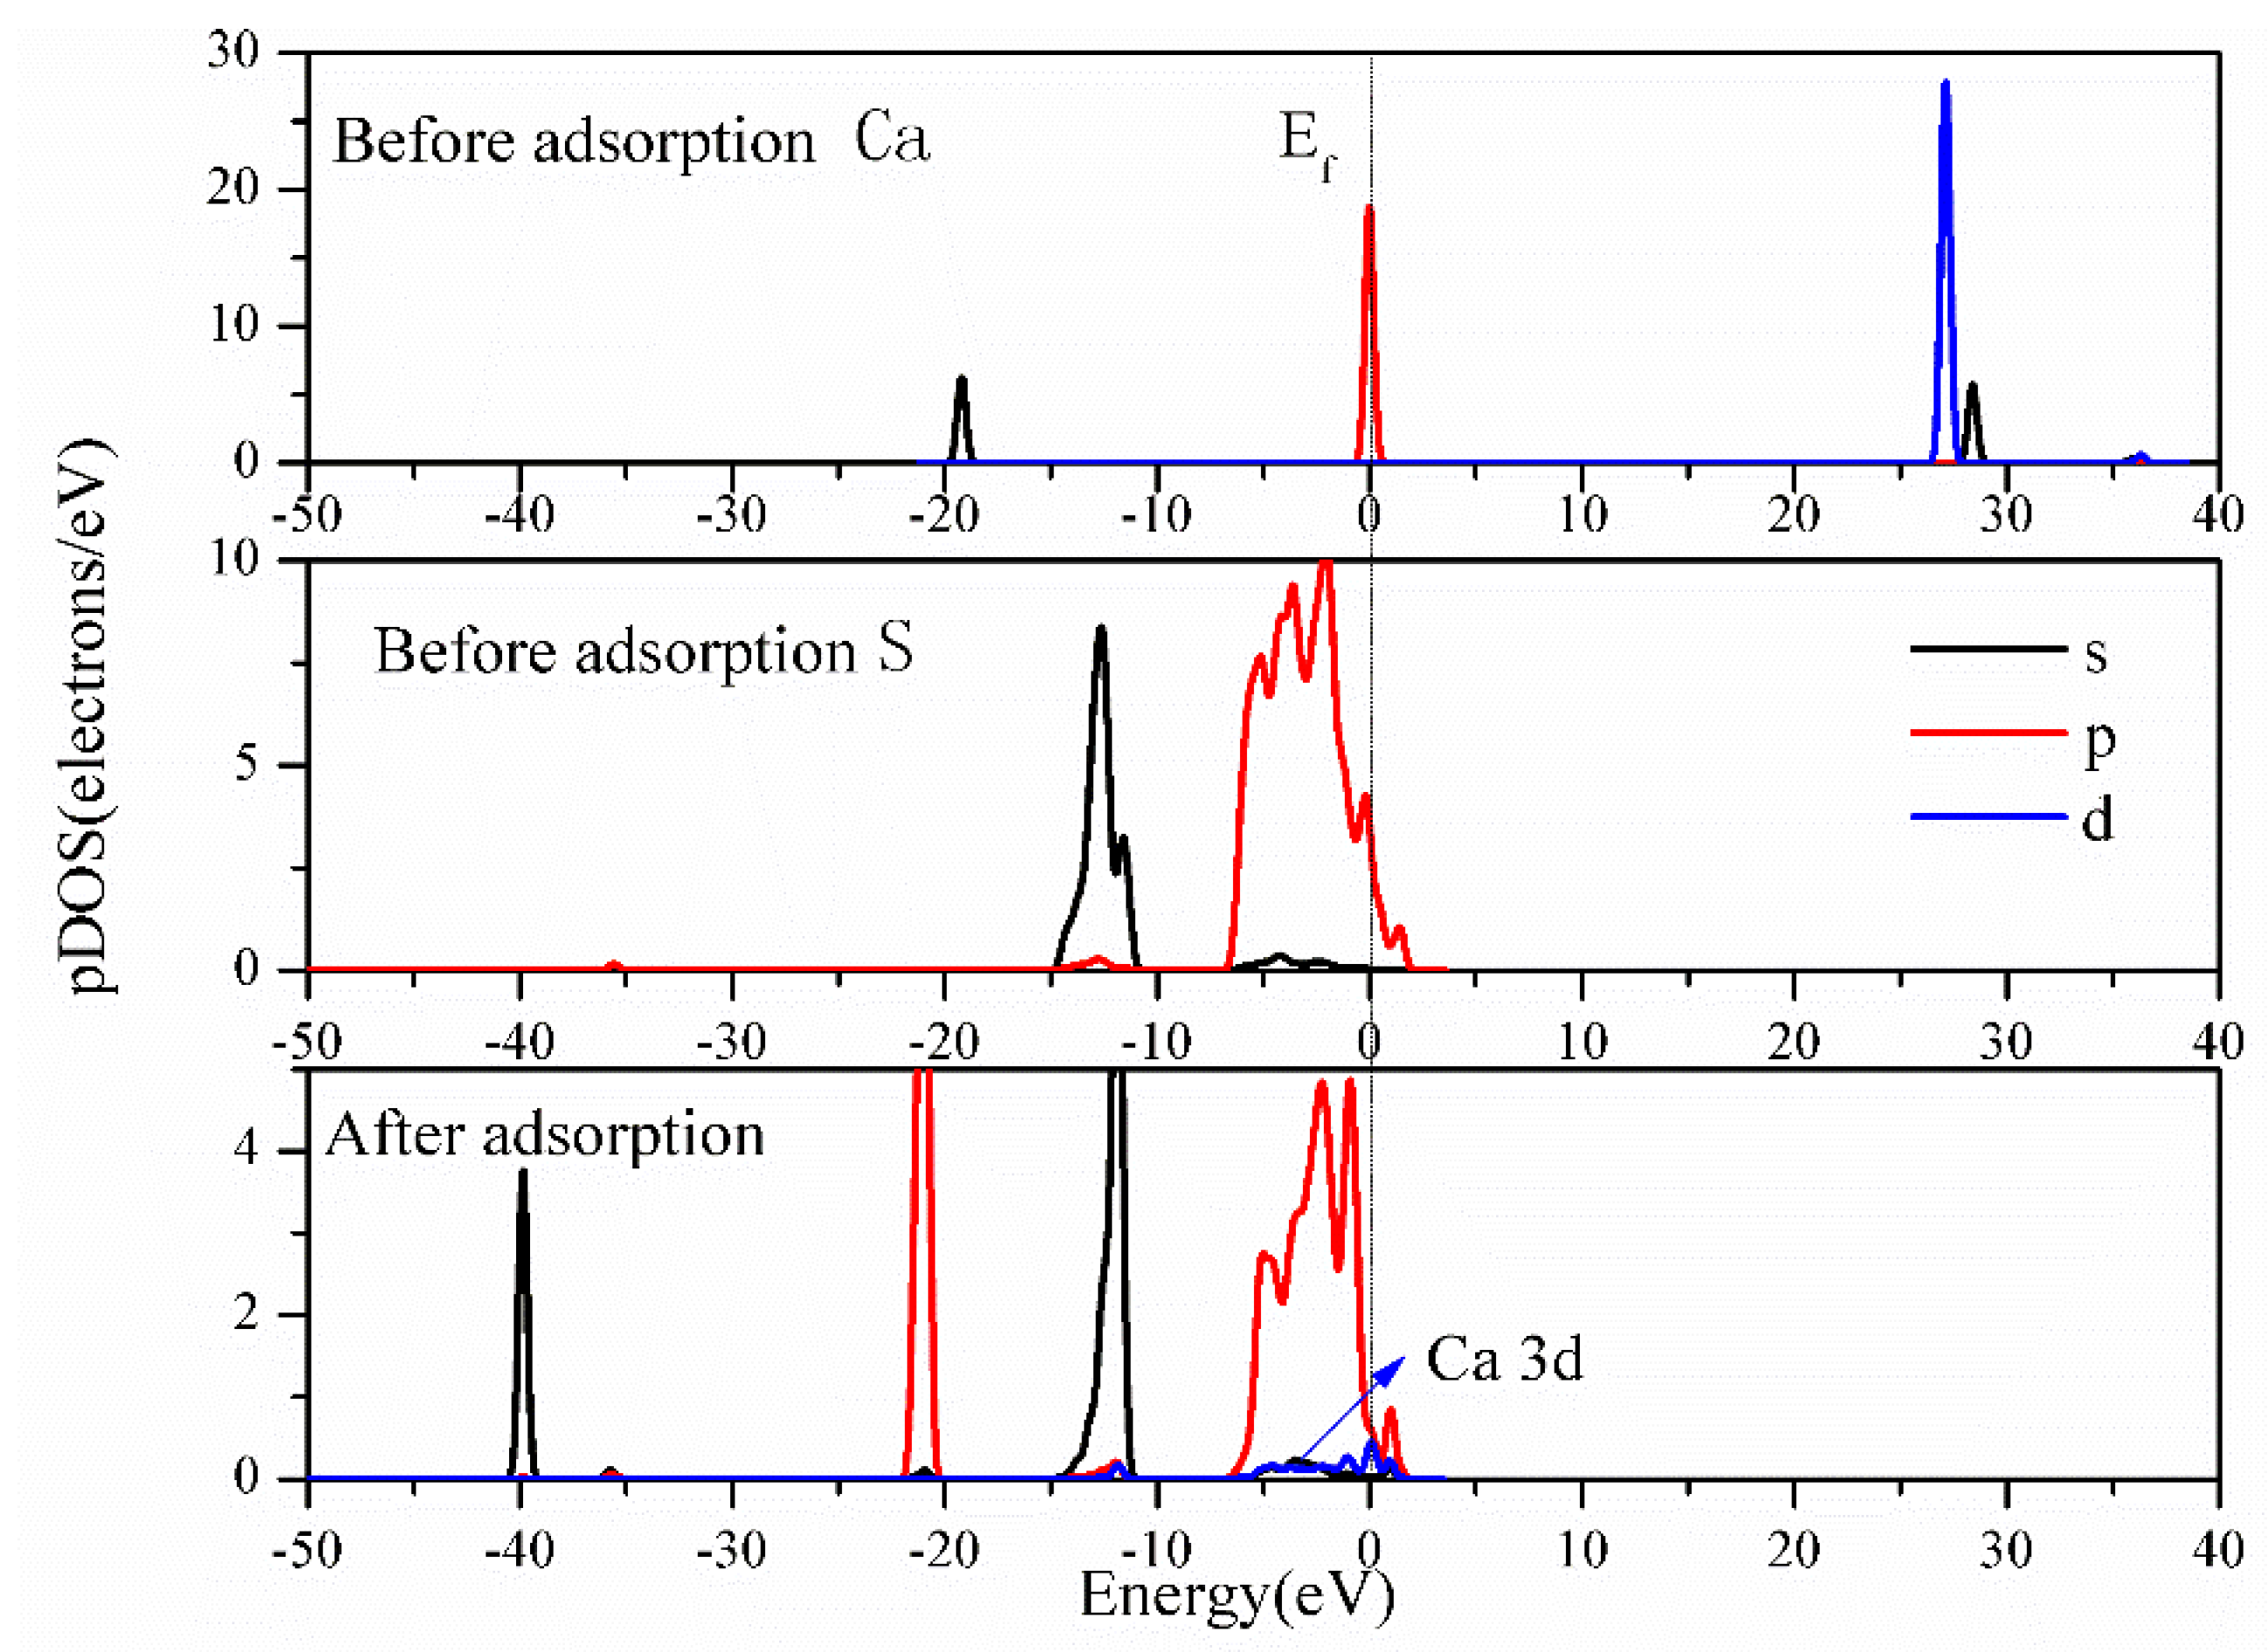
When Ca2+ adsorbs on the S-(100) surface, the Ca atom gains 1.73 e from four S atoms (lose 0.03~0.04 e) and the Mo atom (lose 0.04 e). The lost charge effect of the Mo atom and S atom makes the bond length of Mo-S1, Mo-S2, Mo-S3, Mo-S4 change from 2.38 to 2.44, 2.43, 2.43 and 2.43 Å, respectively, indicating the interaction between Ca2+ and the S-(100) surface is strong [18]. After adsorption, the calculated PDOS for Ca2+ and the three S atoms from the S-(100) surface is shown in Figure 12. The S atom loses electrons mostly on the S 3p orbital and loses little electrons on S 3s orbital. In the range of −5–0 eV, the Ca 3d orbital and the S 3p orbital were overlapping. Moreover, the Ca 3d orbital and S 3s orbital were overlapping at −15–−11 eV, but the overlap is narrow, indicating the interaction between Ca 3d and S 3s is weak. Compared with the Ca2+ adsorption on the (001) surface, the PDOS value of the Ca2+~S-(100) system is higher, which implies that Ca2+ prefers to absorb on the S-(100) surface. It is consistent with the results that the adsorption energy of Ca adsorption on the (100) surface is more negative than that on (001) surface.
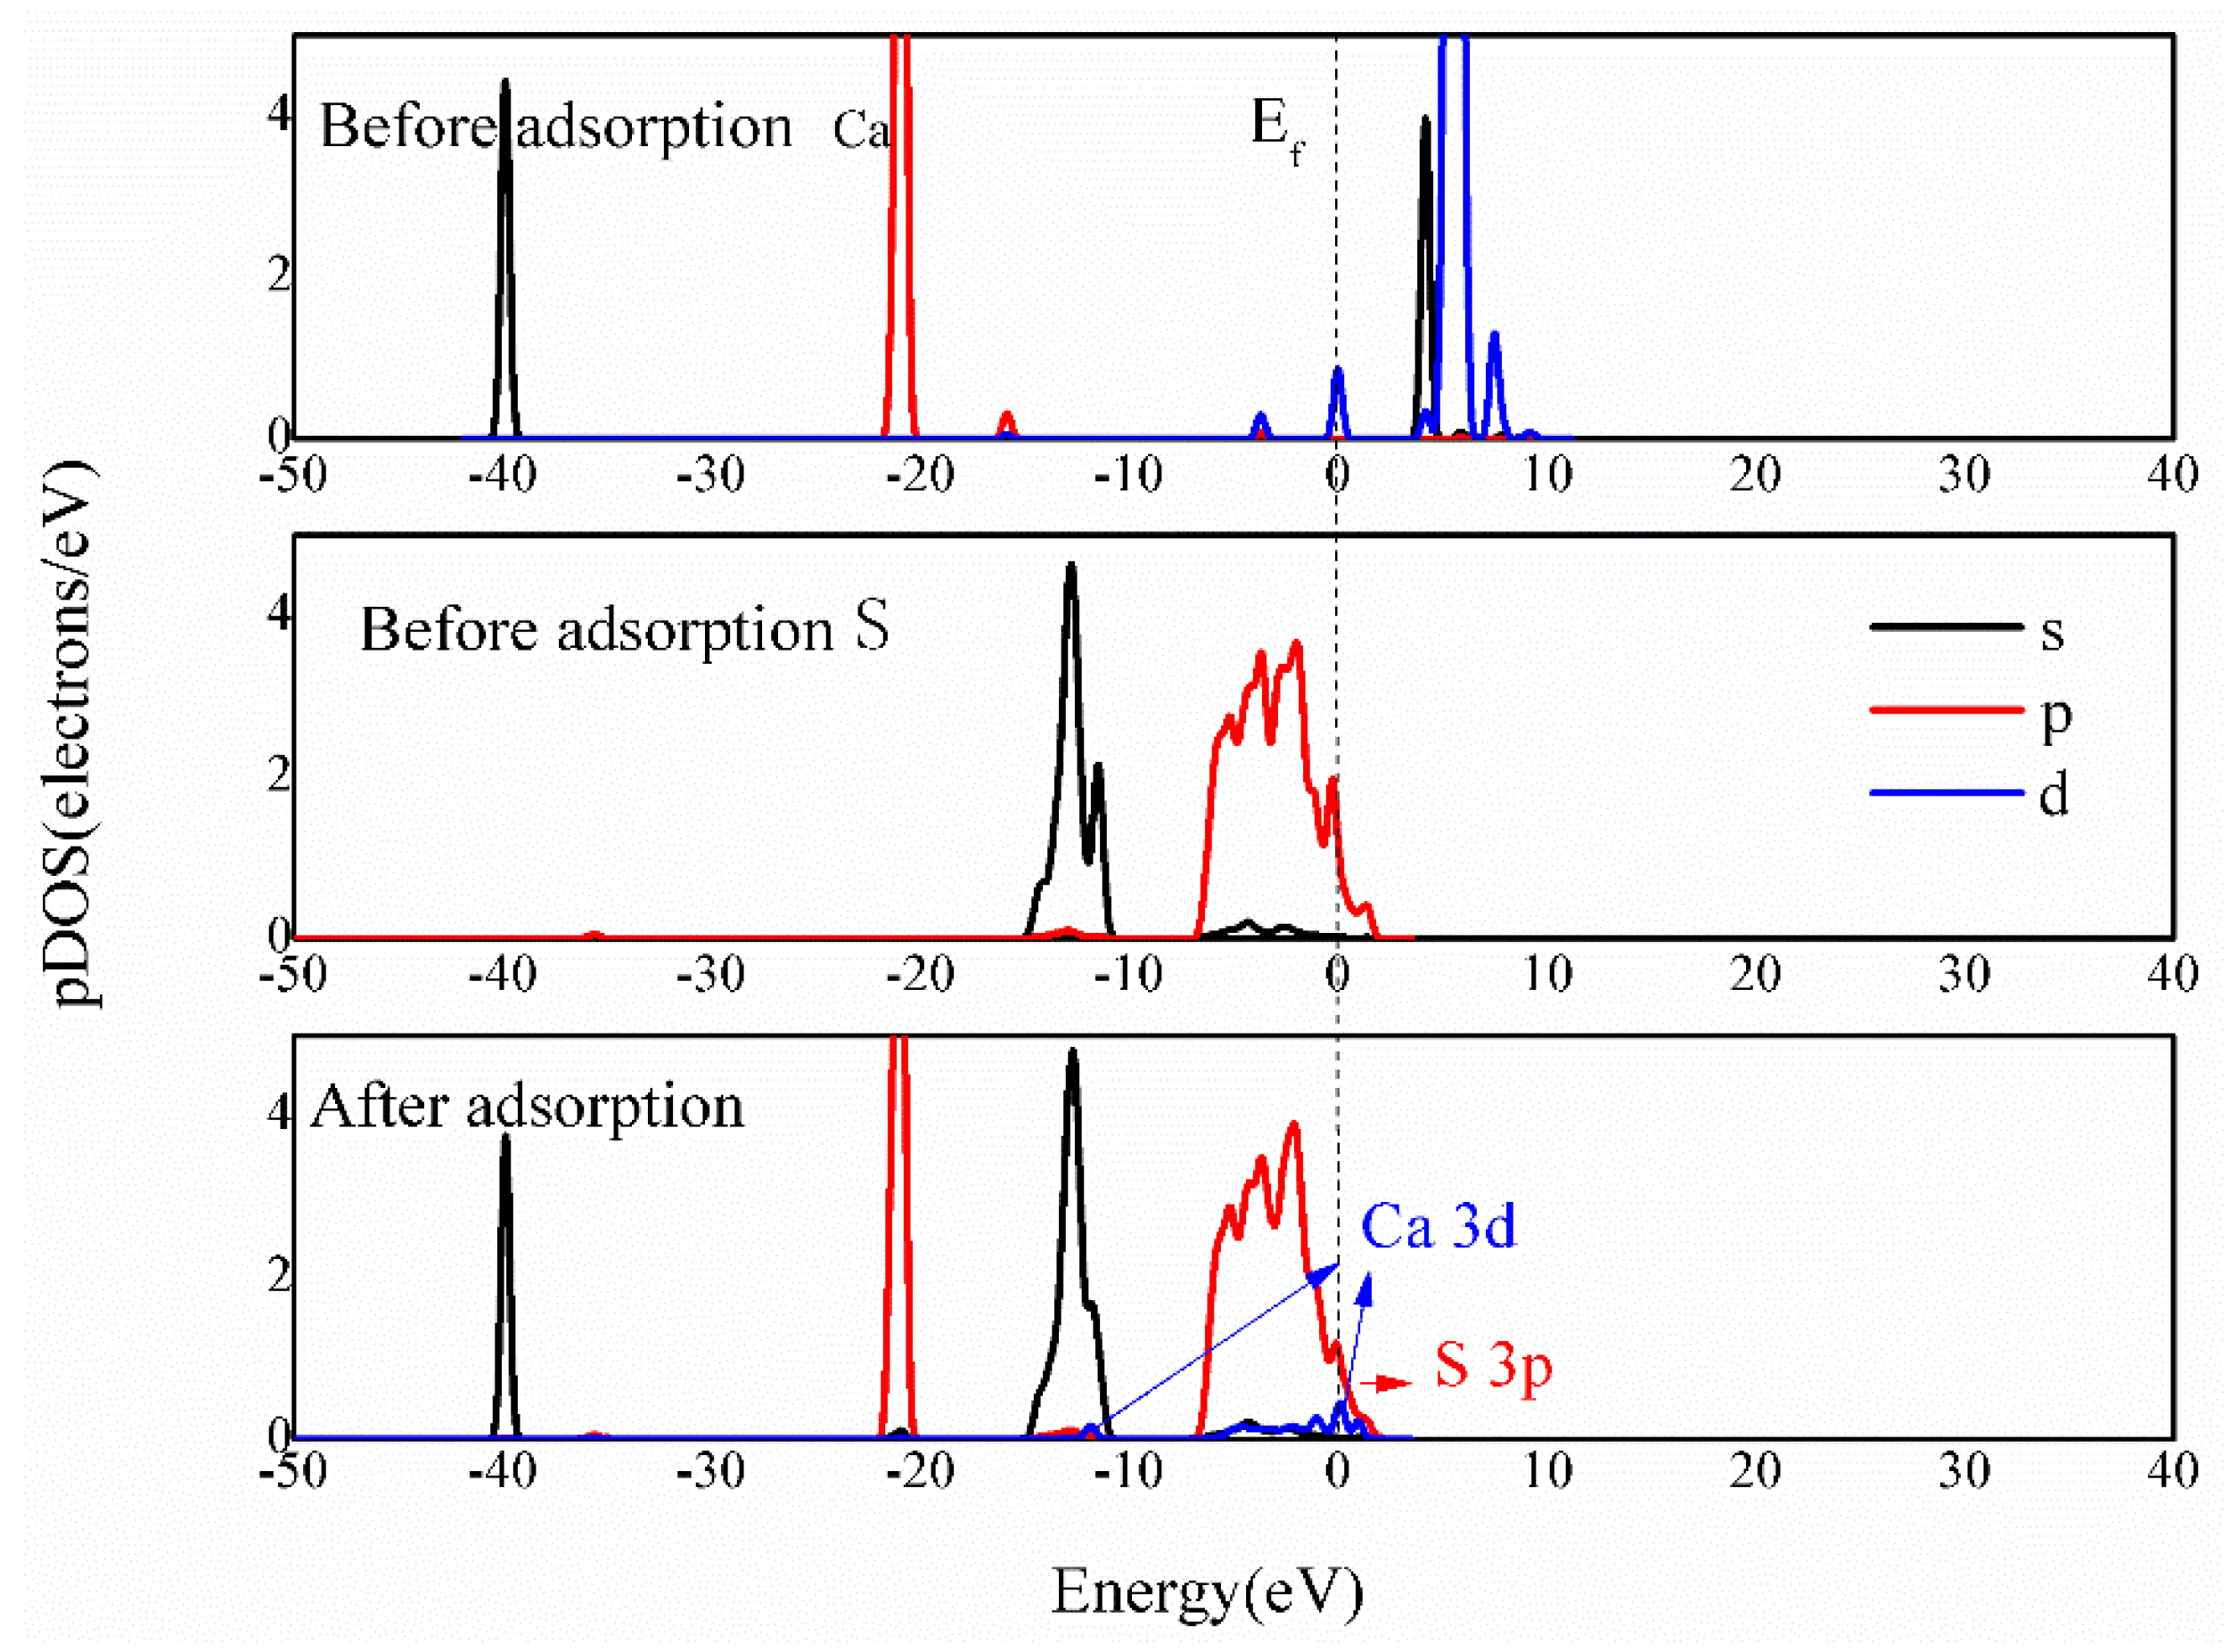
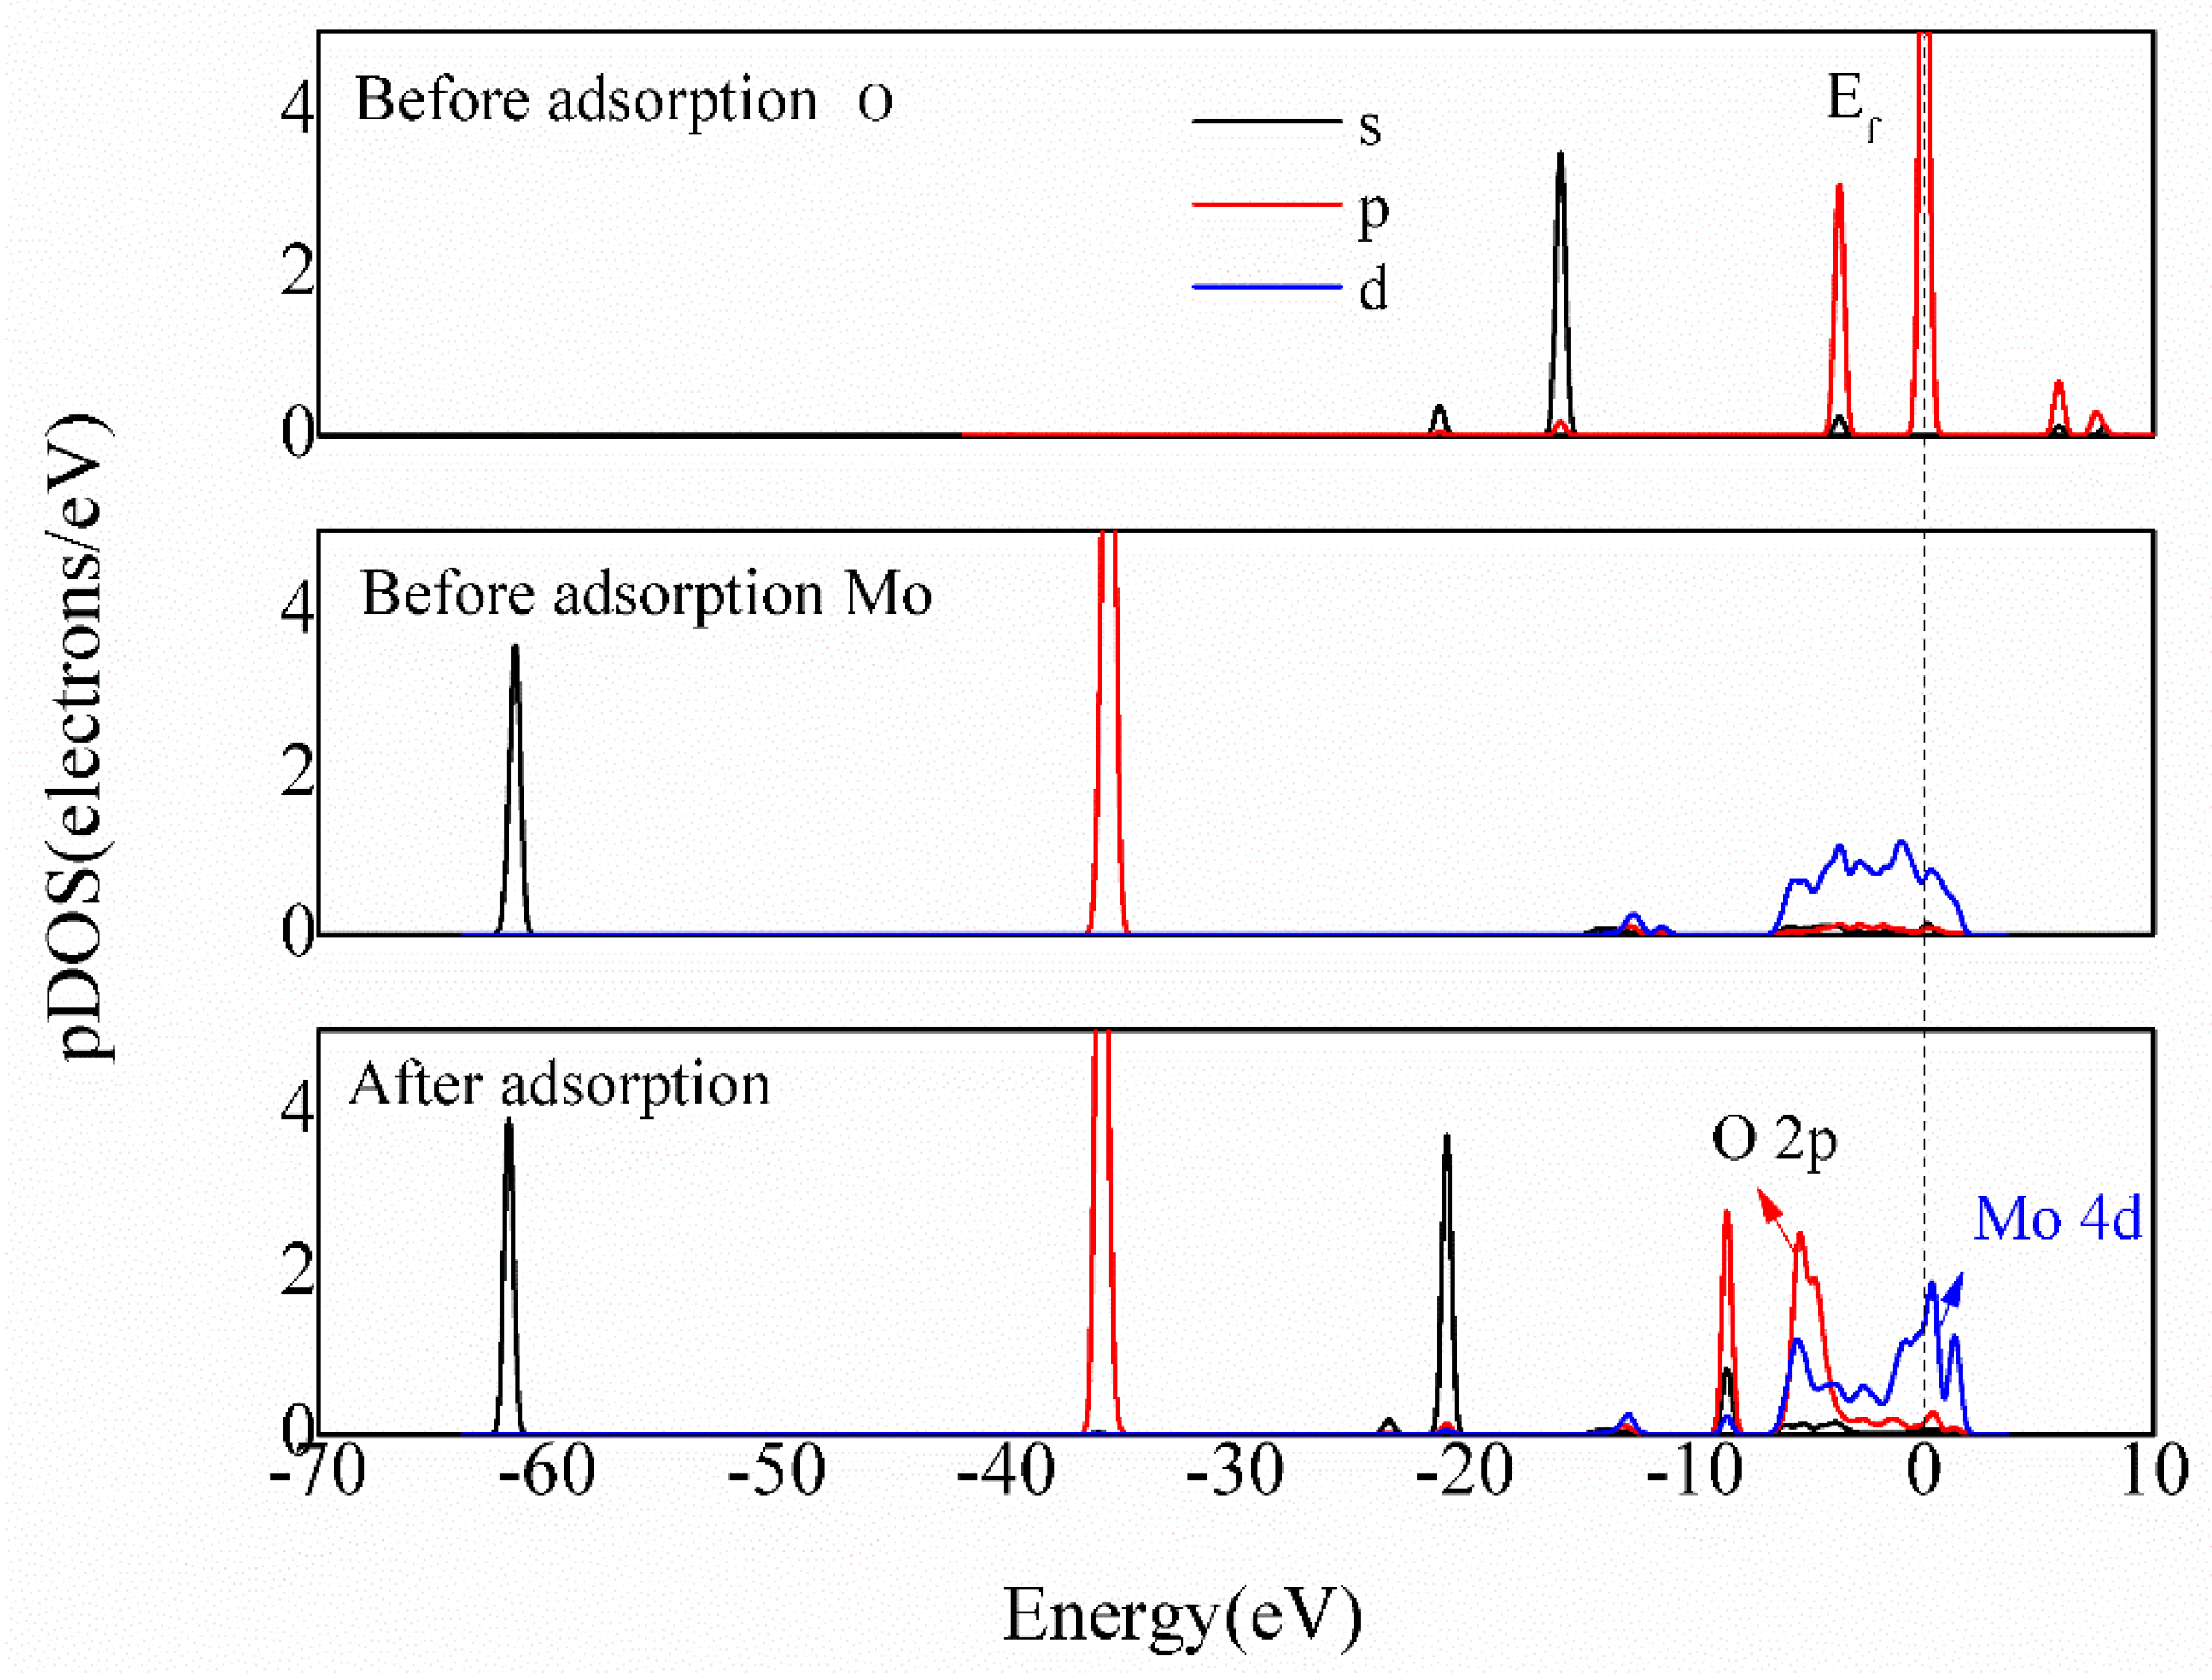
When CaOH+ adsorbs on the Mo-(100) surface, the charge of the S atom changes from −0.12 to −0.1 e, and the Ca atom changes from 1.19 to 0.59 e. After CaOH+ adsorbs on the Mo-(100) surface, the Mo atom and the S atom both charge more electrons, indicating there is the shared electrons effect. This is consistent with the results of the Mulliken bond population. The PDOS results of the S-Ca bond and Mo-O bond are shown in Figure 13 and Figure 14, respectively. As shown in Figure 13, the interaction between the S atom and Ca atom is mostly contributed to by the Ca 3d orbital and the S 3p orbital, which is similarly with the PDOS results of Ca2+ adsorbing on the S-(100) surface, that the interaction between the Ca 3d orbital and S 3s orbital is weak. In Figure 14, after adsorption, the Mo 4d orbital from the surface and O 2p orbital from CaOH+ overlapped at −14–2 eV, which implies the hybridization between the Mo 4d orbital and O 2p orbital is quite strong. This indicates that the Mo-O bond (2.03 Å) is strong covalently. Overall, the adsorption of calcium ions on molybdenite surfaces is a chemisorption process.
4. Conclusions
The presence of calcium ions depresses molybdenite floatability in certain situations, making the separation of Cu-Mo more difficult. The object of this study was to analyze the adsorption characteristics and mechanism of calcium ions on different molybdenite surfaces using several methods including flotation kinetic tests, contact angle tests, batch adsorption tests and simulation works based on DFT. The flotation kinetic test indicates that flotation rate and cumulative recovery both decrease with increasing calcium ion concentration, which is mostly due to the decrease of the surface hydrophobicity. Then, the contact angles of the molybdenite face and edge are separately measured, which implies that the contact angle of the molybdenite edge surface reduces more than the face surface upon calcium ion adsorption. Next, the adsorption kinetics and isotherm were studied using batch adsorption tests and were fitted to the experimental data with adsorption kinetics and isotherm models by Matlab software. The Lagergen pseudo-first-order equation and the Freundlich isotherm model nicely follow the experimental trend. To describe the adsorption mechanism at the atomic level, the adsorption energy, Mulliken bond population, Hirshfeld charge analysis and PDOS of Ca2+ and CaOH+ on molybdenite (001) and (100) surface was calculated and analyzed. The adsorption energies of Ca2+ and CaOH+ on the (100) surface were more negatively than that of the (001) surface, suggesting that both Ca2+ and CaOH+ prefer to adsorb on the molybdenite (100) surface, that is, the edge surface. This was consistent with the results of the contact angle test. The optimal adsorption site of Ca2+ on molybdenite (001) was the Mo-top site, where the Ca atom and three S atoms formed weak covalent Ca-S bonds through shared charge effect. For the (100) surface, Ca2+ was preferred to adsorb on the Mo-top site on the molybdenite S-(100) surface by forming Ca-S bonds. The CaOH+ hardly adsorbed on the molybdenite (001) surface spontaneously, but it can adsorb on top of the S atom at the surface of Mo-(100) by forming the strong covalent Mo-O bond and S-Ca bond. Overall, the adsorption of calcium ions on molybdenite surfaces is a chemisorption process. The results provide a basis of understanding for improving the separation effect of molybdenite from other minerals in the presence of calcium ions.
Author Contributions
L.S. and Y.C. proposed the idea of this research and took part in discussing the results; L.S. performed the experiments and analyzed the data; L.S. wrote the paper; L.L. and Q.Z. provided recommendations for the investigation process and provided helpful suggestions. All authors have read and agreed to the published version of the manuscript.
Funding
This research was funded by the National Nature Science Foundation, China (grant number: 52074175, U1704252), the Postdoctoral Science Foundation, China (grant number: 2019M662403), the Nature Science Foundation Project of Shandong Province, China (grant number: ZR2020ME103) and the Technology Innovation Program of Shandong Province, China (grant number: 2020KJD001).
Institutional Review Board Statement
Not applicable.
Informed Consent Statement
Not applicable.
Data Availability Statement
Not applicable.
Conflicts of Interest
The authors declare no conflict of interest.
References
- Li, M.; Wei, D.; Liu, Q.; Liu, W.; Zheng, J.; Sun, H. Flotation separation of copper-molybdenum sulfides using chitosan as a selective depressant. Miner. Eng. 2015, 83, 217–222. [Google Scholar] [CrossRef]
- Suyantara, G.P.W.; Hirajima, T.; Elmahdy, A.M.; Miki, H.; Sasaki, K. Effect of kerosene emulsion in MgCl2 solution on the kinetics of bubble interactions with molybdenite and chalcopyrite. Colloids Surf. A 2016, 501, 98–113. [Google Scholar] [CrossRef]
- Ramos, O.; Castro, S.; Laskowski, J. Copper–molybdenum ores flotation in sea water: Floatability and frothability. Miner. Eng. 2013, 53, 108–112. [Google Scholar] [CrossRef]
- Yang, B.; Wang, D.; Wang, T.; Zhang, H.; Jia, F.; Song, S. Effect of Cu2+ and Fe3+ on the depression of molybdenite in flotation. Miner. Eng. 2019, 130, 101–109. [Google Scholar] [CrossRef]
- Zhang, Q.; Zhu, H.; Yang, B.; Jia, F.; Yan, H.; Zeng, M.; Qu, H. Effect of Pb2+ on the flotation of molybdenite in the presence of sulfide ion. Results Phys. 2019, 14, 102361. [Google Scholar] [CrossRef]
- Qiu, Z.; Liu, G.; Liu, Q.; Zhong, H. Understanding the roles of high salinity in inhibiting the molybdenite flotation. Colloids Surf. A 2016, 509, 123–129. [Google Scholar] [CrossRef]
- Hirajima, T.; Suyantara, G.P.W.; Ichikawa, O.; Elmahdy, A.M.; Miki, H.; Sasaki, K. Effect of Mg2+ and Ca2+ as divalent seawater cations on the floatability of molybdenite and chalcopyrite. Miner. Eng. 2016, 96, 83–93. [Google Scholar] [CrossRef]
- Laskowski, J.S.; Castro, S.; Ramos, O. Effect of seawater main components on froth ability in the flotation of Cu-Mo sulfide ore. Physicochem. Probl. Miner. Process. 2014, 50, 17–29. [Google Scholar]
- Suyantara, G.P.W.; Hirajima, T.; Miki, H.; Sasaki, K. Floatability of molybdenite and chalcopyrite in artificial seawater. Miner. Eng. 2018, 115, 117–130. [Google Scholar] [CrossRef]
- Yang, B.; Song, S.; Lopez-Valdivieso, A. Effect of particle size on the contact angle of molybdenite powders. Min. Proc. Ext. Met. Rev. 2014, 35, 208–215. [Google Scholar] [CrossRef]
- Castro, S.C.S.; Lopez-Valdivieso, A.L.A.; Laskowski, J.L.J.S. Review of the flotation of molybdenite. Part I: Surface properties and floatability. Int. J. Miner. Process. 2016, 148, 48–58. [Google Scholar] [CrossRef]
- Yuan, D.; Cadien, K.; Liu, Q.; Zeng, H. Adsorption characteristics and mechanisms of O-Carboxymethyl chitosan on chalcopyrite and molybdenite. J. Colloid Interface Sci. 2019, 552, 659–670. [Google Scholar] [CrossRef] [PubMed]
- Braga, P.F.A.; Chaves, A.P.; Luz, A.B.; França, S.C.A. The use of dextrin in purification by flotation of molybdenite concentrates. Int. J. Miner. Process. 2014, 127, 23–27. [Google Scholar] [CrossRef]
- Lu, Z.; Liu, Q.; Xu, Z.; Zeng, H. Probing anisotropic surface properties of molybdenite by direct force measurements. Langmuir 2015, 31, 11409–11418. [Google Scholar] [CrossRef] [PubMed]
- Xie, L.; Wang, J.; Huang, J.; Cui, X.; Wang, X.; Liu, Q.; Zhang, H.; Liu, Q.; Zeng, H. Anisotropic polymer adsorption on molybdenite basal and edge surfaces and interaction mechanism with air bubbles. Front. Chem. 2018, 6, 361. [Google Scholar] [CrossRef]
- Wang, X.; Liu, W.; Duan, H.; Wang, B.; Han, C.; Wei, D. The adsorption mechanism of calcium ion on quartz (101) surface: A DFT study. Powder Technol. 2018, 329, 158–166. [Google Scholar] [CrossRef]
- Hu, Y.; He, J.; Zhang, C.; Zhang, C.; Wang, L. Insights into the activation mechanism of calcium ions on the sericite surface: A combined experimental and computational study. Appl. Surf. Sci. 2017, 427, 162–168. [Google Scholar] [CrossRef]
- Feng, Q.; Wen, S.; Deng, J.; Zhao, W. DFT study on the interaction between hydrogen sulfide ions and cerussite (110) surface. Appl. Surf. Sci. 2017, 396, 920–925. [Google Scholar] [CrossRef]
- Kohn, W.; Sham, L.J. Softness and the fukui function in the electronic theory of metals and catalysis. Phys. Rev. A 1965, 140, 1133–1138. [Google Scholar] [CrossRef] [Green Version]
- Perdew, J.P.; Burke, K.; Ernzerhof, M. Generalized gradient approximation made simple. Phys. Rev. Lett. 1996, 8, 3865–3868. [Google Scholar] [CrossRef] [PubMed] [Green Version]
- Peng, C.; Min, F.; Liu, L.; Chen, J. The adsorption of CaOH+ on (001) basal and (010) edge surface of Na-montmorillonite: A DFT study. Surf. Interface Anal. 2017, 49, 267–277. [Google Scholar] [CrossRef]
- Flores-Álvarez, J.M.; Elizondo-Álvarez, M.A.; Dávila-Pulido, G.I.; Uribe-Salas, A. Electrochemical behavior of galena in the presence of calcium and sulfate ions. Miner. Eng. 2017, 111, 158–166. [Google Scholar] [CrossRef]
- Zhu, X.; Wei, H.; Hou, M.; Wang, Q.; You, X.; Li, L. Thermodynamic behavior and flotation kinetics of an ionic liquid microemulsion collector for coal flotation. Fuel 2020, 262, 116627. [Google Scholar] [CrossRef]
- Xing, Y.; Xu, X.; Gui, X.; Cao, Y.; Xu, M. Effect of kaolinite and montmorillonite on fine coal flotation. Fuel 2017, 195, 284–289. [Google Scholar] [CrossRef]
- Zhu, H.; Li, Y.; Lartey, C.; Li, W.; Qian, G. Flotation kinetics of molybdenite in common sulfate salt solutions. Miner. Eng. 2020, 148, 106182. [Google Scholar] [CrossRef]
- Lu, Z.; Ralston, J.; Liu, Q. Face or Edge? Control of molybdenite surface interactions with divalent cations. J. Phys. Chem. C 2019, 124, 372–381. [Google Scholar] [CrossRef]
- Wang, J.; Xie, L.; Lu, Q.; Wang, X.; Wang, J.; Zeng, H. Electrochemical investigation of the interactions of organic and inorganic depressants on basal and edge planes of molybdenite. J. Colloid Interface Sci. 2020, 570, 350–361. [Google Scholar] [CrossRef]
- Zanin, M.; Ametov, I.; Grano, S.; Zhou, L.; Skinner, W. A study of mechanisms affecting molybdenite recovery in a bulk copper/molybdenum flotation circuit. Int. J. Miner. Process. 2011, 93, 256–266. [Google Scholar] [CrossRef]
- Wan, H.; Yang, W.; He, T.; Yang, J.; Guo, L.; Peng, Y. The influence of Ca2+ and pH on the interaction between PAHs and molybdenite edges. Minerals 2017, 7, 104. [Google Scholar] [CrossRef] [Green Version]
- Liu, X.; He, C.; Yu, X.; Bai, Y.; Ye, L.; Wang, B.; Zhang, L. Net-like porous activated carbon materials from shrimp shell by solution-processed carbonization and H3PO4 activation for methylene blue adsorption. Powder Technol. 2018, 326, 181–189. [Google Scholar] [CrossRef]
- Meng, M.; Wang, Z.; Ma, L.; Zhang, M.; Wang, J.; Dai, X.; Yan, Y. Selective adsorption of methylparaben by submicrosized molecularly imprinted polymer: Batch and dynamic flow mode studies. Ind. Eng. Chem. Res. 2012, 51, 14915–14924. [Google Scholar] [CrossRef]
- Sarti, E.; Chenet, T.; Stevanin, C.; Costa, V.; Cavazzini, A.; Catani, M.; Martucci, A.; Precisvalle, A.; Beltrami, G.; Pasti, L. High-silica zeolites as sorbent media for adsorption and pre-concentration of pharmaceuticals in aqueous solutions. Molecules 2020, 25, 3331. [Google Scholar] [CrossRef] [PubMed]
- Rajahmundry, G.K.; Garlapati, C.; Kumar, P.S.; Alwi, R.S.; Vo, D.V.N. Statistical Analysis of Adsorption Isotherm Models and its Appropriate Selection. Chemosphere 2021, 276, 130176. [Google Scholar] [CrossRef]
- Hashem, A.; Sanousy, M.A.; Mohamed, L.A.; Okoye, P.U.; Hameed, B.H. Natural and low-cost p.turgidum for efficient adsorption of hg(ii) ions from contaminated solution: Isotherms and kinetics studies. J. Polym. Environ. 2021, 29, 304–312. [Google Scholar] [CrossRef]
- You, X.; He, M.; Cao, X.; Wang, P.; Wang, J.; Li, L. Molecular dynamics simulations of removal of nonylphenol pollutants by graphene oxide: Experimental study and modelling. Appl. Surf. Sci. 2019, 475, 621–626. [Google Scholar] [CrossRef]
- Hussain, A.; Muhammad, T. Effect of Cu concentration and dopant site on the band gap of MoS2: A DFT study. Comput. Condens. Matter 2020, 24, e00494. [Google Scholar] [CrossRef]
- Zhao, C.; Chen, J.; Wu, B.; Long, X. Density functional theory study on natural hydrophobicity of sulfide surfaces. Trans. Nonferrous Met. Soc. China 2014, 24, 491–498. [Google Scholar] [CrossRef]
- Tan, S.M.; Ambrosi, A.; Sofer, Z.K.; Huber, T.; Sedmidubsky, D.; Pumera, M. Pristine basal- and edge-plane-oriented molybdenite MoS2 exhibiting highly anisotropic properties. Chemistry 2015, 21, 7170–7178. [Google Scholar] [CrossRef] [PubMed]
- Hinnemann, B.; Moses, P.G.; Bonde, J.; Joergensen, K.P.; Nielsen, J.H.; Horvh, S.; Chorkendorff, I.; Noerskov, J.K. Biomimetic Hydrogen Evolution: MoS2 Nanoparticles as Catalyst for Hydrogen Evolution. J. Am. Chem. Soc. 2005, 127, 5308–5309. [Google Scholar] [CrossRef]
- Castellà-Ventura, M.; Moissette, A.; Kassab, E. DFT Study of Si/Al Ratio and Confinement Effects on the Energetics and Vibrational Properties of some Aza-Aromatic Molecules Adsorbed on H-ZSM-5 Zeolite. Computation 2020, 8, 81. [Google Scholar] [CrossRef]
- Garcia-Diaz, R.; Romero De La Cruz, M.T.; Ochoa Valiente, R.; Guerrero-Sanchez, J.; Hernández Cocoletzi, G. DFT study for OH radical formation on SrTiO3(001) surface and the effect of Bi. Appl. Surf. Sci. 2019, 487, 1394. [Google Scholar] [CrossRef]
Figure 1.
X-ray diffraction patterns of molybdenite sample (a) and standard molybdenite (b).

Figure 2.
The XFG flotation machine used in the study.

Figure 3.
Schematic of the Contact Angle Measuring Device.

Figure 4.
Flotation recovery of molybdenite as a function of time (Kerosene: 350 mg/L; Pine camphor oil: 45 mg/L; pH = 6 ± 0.5).
Figure 4.
Flotation recovery of molybdenite as a function of time (Kerosene: 350 mg/L; Pine camphor oil: 45 mg/L; pH = 6 ± 0.5).

Figure 5.
Contact angles of molybdenite surface with calcium ions concentration.

Figure 6.
Kinetics curve of calcium ion adsorption on molybdenite.

Figure 7.
Adsorption isotherm model fitting of calcium ions on molybdenite.

Figure 8.
Effect of the layer on surface energy of molybdenite (001) surface (a) and (100) surface (b).
Figure 8.
Effect of the layer on surface energy of molybdenite (001) surface (a) and (100) surface (b).

Figure 9.
Adsorption sites on (a) molybdenite (001) surface and (b) molybdenite (100) surface.

Figure 10.
Optimized adsorption configuration of Ca2+ and CaOH+ on molybdenite surfaces. (a) Ca2+ on Mo-top of the (001) surface; (b) Ca2+ on Mo-top of S-(100) surface; (c) CaOH+ on S-top of the Mo-(100) surface.
Figure 10.
Optimized adsorption configuration of Ca2+ and CaOH+ on molybdenite surfaces. (a) Ca2+ on Mo-top of the (001) surface; (b) Ca2+ on Mo-top of S-(100) surface; (c) CaOH+ on S-top of the Mo-(100) surface.

Figure 11.
PDOS results of S atoms and the Ca atom before and after Ca2+ adsorption on molybdenite (001) surface.
Figure 11.
PDOS results of S atoms and the Ca atom before and after Ca2+ adsorption on molybdenite (001) surface.

Figure 12.
PDOS results of S atoms and the Ca atom before and after Ca2+ adsorption on the molybdenite (100) surface.
Figure 12.
PDOS results of S atoms and the Ca atom before and after Ca2+ adsorption on the molybdenite (100) surface.

Figure 13.
PDOS results of S and Ca before and after CaOH+ adsorbed on molybdenite (100) surface.

Figure 14.
PDOS results of O and Mo before and after CaOH+ adsorbed on molybdenite (100) surface.


Table 1.
Four adsorption models used in this study.
| Model | Formula | Notes |
|---|---|---|
| Pseudo-first-order (Model 1) | Widely used for describing adsorption process in liquid phase. | |
| Pseudo-second-order (Model 2) | Assume the adsorption is chemically affected. | |
| Elovich (Model 3) | Always used in adsorption study for mineral and soil. | |
| Intraparticle diffusion (Model 4) | Often used to analyze the rate-controlling process in the adsorption. |
Qt is the amount of adsorption at any time t, mg/g; Qe is the equilibrium adsorption capacity, mg/g; k is the adsorption rate; α is the initial adsorption rate, mg/g/min; β is related to the extent of surface coverage and activation energy for chemisorption, mg/g/min.
Table 2.
Adsorption isotherm fitting parameters.
| Langmuir | Freundlich | ||
|---|---|---|---|
| Qm | 102.46 | KF | 0.3952 |
| KL | 0.0034 | n | 1.0772 |
| R2 | 96.27 | R2 | 97.31 |
Table 3.
Adsorption energies of calcium ions on molybdenite surfaces.
| Ionic Form | Surface | Adsorption Site | Adsorption Energy (kJ/mol) |
|---|---|---|---|
| Ca2+ | (001) | S-top | −123 |
| Mo-top | −229 | ||
| Hollow | −195 | ||
| S-bridge | −201 | ||
| (100) | S-(100)- Mo-top | −935 | |
| S-(100)- S-bridge | −905 | ||
| S-(100)- S-top | −927 | ||
| H | −835 | ||
| Mo-(100)- S-top | −890 | ||
| Mo-(100)- Mo-top | −770 | ||
| Mo-(100)- S-bridge | −917 | ||
| CaOH+ | (001) | S-top | 10 |
| Mo-top | −17 | ||
| Hollow | −7 | ||
| S-bridge | −7 | ||
| (100) | S-(100)- Mo-top | −917 | |
| S-(100)- S-bridge | −931 | ||
| S-(100)- S-top | −909 | ||
| H | −931 | ||
| Mo-(100)- S-top | −978 | ||
| Mo-(100)- Mo-top | −770 | ||
| Mo-(100)- Sbridge | −850 |
Table 4.
Mulliken population and bond length of the stable adsorption configurations.
| Ionic Form-Surface | Adsorption Site | Bond | Populaiton | Bond Length(Å) |
|---|---|---|---|---|
| Ca2+-(001) | Mo-top | S1-Ca | 0.05 | 2.95 |
| S2-Ca | 0.10 | 2.73 | ||
| S3-Ca | 0.10 | 2.80 | ||
| Ca2+-(100) | S-(100)- Mo-top | S1-Ca | 0.09 | 2.54 |
| S2-Ca | 0.09 | 2.62 | ||
| S3-Ca | 0.08 | 2.42 | ||
| S4-Ca | 0.07 | 2.52 | ||
| CaOH+-(100) | Mo-(100)- S-top | S-Ca | 0.07 | 2.65 |
| O- Mo | 0.34 | 2.03 |
Table 5.
Hirshfeld charge of atoms before and after adsorption.
| Ionic -Surface | Adsorption Site | Atom | Hirshfeld Charge (e) | ||
|---|---|---|---|---|---|
| Before | After | Change | |||
| Ca2+-(001) | Mo-top | S1 | −0.11 | −0.14 | −0.03 |
| S2 | −0.11 | −0.13 | −0.02 | ||
| S3 | −0.11 | −0.14 | −0.03 | ||
| Ca | 1.99 | 0.71 | −1.28 | ||
| Mo | 0.22 | 0.24 | 0.02 | ||
| Ca2+-(100) | S-(100)- Mo-top | S1 | −0.18 | −0.14 | 0.04 |
| S2 | −0.18 | −0.14 | 0.04 | ||
| S3 | −0.18 | −0.15 | 0.03 | ||
| S4 | −0.18 | −0.14 | 0.04 | ||
| Ca | 1.99 | 0.26 | −1.73 | ||
| Mo | 0.28 | 0.32 | 0.04 | ||
| CaOH+-(100) | Mo-(100)- S-top | S | −0.12 | −0.10 | 0.02 |
| Ca | 1.19 | 0.59 | −0.60 | ||
| O | −0.44 | −0.33 | 0.11 | ||
| Mo | 0.24 | 0.36 | 0.12 | ||
Publisher’s Note: MDPI stays neutral with regard to jurisdictional claims in published maps and institutional affiliations. |
© 2021 by the authors. Licensee MDPI, Basel, Switzerland. This article is an open access article distributed under the terms and conditions of the Creative Commons Attribution (CC BY) license (https://creativecommons.org/licenses/by/4.0/).
Share and Cite
MDPI and ACS Style
Sun, L.; Cao, Y.; Li, L.; Zeng, Q. Adsorption Characteristics and Mechanism of Calcium Ions on Different Molybdenite Surfaces via Experiments and DFT Simulations. Separations 2021, 8, 107. https://doi.org/10.3390/separations8080107
AMA Style
Sun L, Cao Y, Li L, Zeng Q. Adsorption Characteristics and Mechanism of Calcium Ions on Different Molybdenite Surfaces via Experiments and DFT Simulations. Separations. 2021; 8(8):107. https://doi.org/10.3390/separations8080107
Chicago/Turabian StyleSun, Liqing, Yijun Cao, Lin Li, and Qingliang Zeng. 2021. "Adsorption Characteristics and Mechanism of Calcium Ions on Different Molybdenite Surfaces via Experiments and DFT Simulations" Separations 8, no. 8: 107. https://doi.org/10.3390/separations8080107
Note that from the first issue of 2016, this journal uses article numbers instead of page numbers. See further details here.