Physical Qualities Pertaining to Shorter and Longer Change-of-Direction Speed Test Performance in Men and Women


1
Department of Kinesiology, California State University, Fullerton, CA 92831, USA
2
College of Nursing and Health Sciences, University of Colorado-Colorado Springs, Colorado Springs, CO 90022, USA
*
Author to whom correspondence should be addressed.
†
These authors contributed equally to this work.
Sports 2019, 7(2), 45; https://doi.org/10.3390/sports7020045
Submission received: 18 January 2019
/
Revised: 5 February 2019
/
Accepted: 15 February 2019
/
Published: 16 February 2019
(This article belongs to the Special Issue Assessment and Development of Change of Direction Speed and Agility)
Abstract
:This study investigated relationships between shorter (505, change-of-direction (COD) deficit as a derived physical quality) and longer (Illinois agility test; IAT) COD tests with linear speed, lower-body power (multidirectional jumping), and strength in recreationally-trained individuals. Twenty-one males and 22 females (similar to collegiate club-sport and tactical athletes) were assessed in: 505 and COD deficit from each leg; IAT; 20 m sprint; vertical jump (VJ height, peak anaerobic power measured in watts (PAPw), power-to-body mass ratio); standing broad jump; lateral jump (LJ) from each leg; and absolute and relative isometric midthigh pull (IMTP) strength. Partial correlations calculated sex-determined relationships between the COD and performance tests, with regression equations calculated (p < 0.05). The 505 and IAT correlated with all tests except PAPw and absolute IMTP (r = ±0.43–0.71). COD deficit correlated with the LJ (r = −0.34–0.60). Left- and right-leg 505 was predicted by sex, 20 m sprint, and left-leg LJ (70–77% explained variance). Right-leg COD deficit was predicted by sex and left-leg LJ (27% explained variance). IAT was predicted by sex, 20 m sprint, right-leg LJ, and relative IMTP (84% explained variance). For individuals with limited training time, improving linear speed, and relative lower-body power and strength, could enhance shorter and longer COD performance.
1. Introduction
Change-of-direction (COD) speed and agility are essential components in a wide range of sports and activities. Agility has been defined as the initiation of a direction change in response to a stimulus [1]. COD ability or speed is the physical component of agility, which encompasses linear sprinting, technique, lower-body strength and power, and the ability to effectively decelerate and accelerate [1,2,3]. When measuring COD speed, it is important to note that this quality can be task-specific [4], and coaches must interpret this quality within the context of the assessment that was utilized. For example, Lockie [5] detailed that COD speed tests can be grouped under shorter or longer distance, and these can have different applications for coaches and athletes.
An example of a shorter distance COD speed test is the 505 [5]. The 505 involves a 10 m sprint past a timing gate, a further 5 m sprint to a turning line where the individual completes a 180° turn/direction change, before sprinting back through the gate. There has been some analysis of the important underlying physiological characteristics associated with the 505. Delaney et al. [6] found that linear speed measured by a 40 m sprint and relative strength measured by a three-repetition maximum back squat predicted dominant leg 505 time in elite male rugby league players. These researchers also discovered that vertical jump (VJ) and lateral jump (LJ) performance was predictive of 505 performance on the non-dominant leg. Linear speed over 10 m correlated with 505 performance among Division I and II collegiate female soccer players (correlation coefficient r = 0.39–0.55) [7]. Lower-body power, measured by a VJ, has also been related to the 505 in collegiate female soccer players (r = −0.63 to −0.66) [7]. The standing broad jump (SBJ) related to left-leg 505 in collegiate women rugby union players (r = −0.71) [8]. Likewise, relative isometric midthigh pull (IMTP) strength related to 505 performance in female basketball players (r = −0.79) [9]. As can be seen, different qualities have been identified as important depending on the sample used. However, there has been limited analysis of combined male and female samples representative of collegiate club-sport athlete [8,10,11,12] and tactical (first responders and military) recruit [13,14,15,16,17,18] populations. Although COD testing can be state- and agency-specific in tactical populations, it does feature in the hiring process of some agencies [19,20,21,22,23]. This is notable, as these individuals may not have the training time afforded to higher-level athletes [24,25,26,27,28]. Accordingly, it is important to understand what characteristics could crossover to shorter distance COD performance in collegiate club-sport and tactical athletes. It is incumbent on these individuals to efficiently improve COD speed pertaining to sport or occupational tasks (e.g., foot pursuits for police) [19,20,21,22,23].
The 505 can be used to produce another measure of COD ability, the COD deficit [29]. This measure calculates the impact that implementing a 180° turn has on the ability to cover a 10 m distance. Previous research has documented non-significant relationships between the COD deficit and linear speed in athletic populations [10,29,30]. In contrast, Lockie et al. [7] found that for both Division I and II collegiate female soccer players, there was a negative relationship between COD deficit and a 10 m sprint (r = −0.77 to −0.87). In Division I collegiate male soccer players, the VJ, triple hop, or SBJ did not significantly relate to the COD deficit for either leg [31]. For adolescent males and females, a range of lower-body strength and power assessments correlated with the left- and right-leg COD deficit [32]. Similar to the 505, different physical qualities may be important as it pertains to the COD deficit depending on the sample. However, the relationships between linear speed and lower-body power and strength to the COD deficit requires more analysis.
Lockie [5] described longer distance COD tests as having a duration greater than 6 s. These tests tend to have a greater volume of linear sprinting, interspersed with direction changes. It is important to note that longer distance COD speed tests may be limited by metabolic capacities, as opposed to just COD ability [33]. Nonetheless, these tests are commonly used, with one example being the Illinois agility test (IAT) [5]. The IAT has been used to assess athletic [33,34,35,36,37,38,39,40], law enforcement/public safety [41,42,43], and military [44,45,46] populations. Due to the greater volume of sprinting, a longer distance COD speed test such as the IAT may demonstrate stronger relationships with linear sprinting ability and lower-body multidirectional (vertical, horizontal, and lateral) power measured by jumping [12,47,48]. In occupational testing, longer distance COD speed tests are often used to measure multiple qualities (i.e., linear and COD speed in combination with lower-body power) [19,20,21,22,23]. Analyzing the physical characteristics of men and women to document those most important for longer distance COD speed is useful; this could help improve training efficiency for collegiate club-sport and tactical athletes.
Therefore, this study investigated the relationships between linear speed, lower-body power, and absolute and relative strength on shorter (505, COD deficit) and longer (IAT) COD speed tests in college-aged men and women. The 505 was used as it can isolate COD speed for each leg [6,7,8,9,49,50,51,52,53,54], and can also be used to produce the COD deficit as an alternate measure of COD ability [7,10,29,30,31,32,54]. The IAT was adopted as a longer COD speed test due to its widespread use in athletic [33,34,35,36,37,38,39,40] and tactical [41,42,43,44,45,46] populations. It was hypothesized that when controlling for sex, all variables would correlate with COD performance measured by the 505, COD deficit, and IAT. However, the relationships for linear speed, and lower-body power and strength, would be stronger in the longer COD speed test of the IAT.
2. Materials and Methods
2.1. Subjects
A convenience sample comprised of 43 subjects (age: 23.14 ± 2.37 years; body mass: 74.32 ± 12.65 kg; height: 1.70 ± 0.08 m), including 21 males (age: 23.38 ± 2.44 years; body mass: 81.38 ± 10.09 kg; height: 1.76 ± 0.06 m) and 22 females (age: 22.91 ± 2.33 years; body mass: 67.59 ± 11.22 kg; height: 1.65 ± 0.07 m). Subjects were recruited from the student population at the university. This sample has utility, as it is similar to collegiate club-sport athletes (mean age: ~21–22 years; male mean body mass and height: ~76–83 kg and ~1.72–1.82 m, respectively; female mean body mass and height: ~62–68 kg and ~1.60–1.63 m, respectively) [8,10,11,12], law enforcement recruits (mean age: ~23–25 years; male mean body mass and height: ~82–85 kg and ~1.80 m, respectively; female mean body mass and height: ~58–68 kg and ~1.67 m, respectively) [13,14], and military recruits (mean data combined for males and females; age: ~20–23 years; body mass: ~59–81 kg; height: ~1.63–1.73 m) [15,16,17,18]. As noted, this pertains to the age ranges across these studies, and the body masses and heights for both males and females. Data were combined for males and females, although as will be detailed, data analysis was controlled for sex. The subjects were required to be: over 18 years of age; currently training in either aerobic or resistance training (≥3 h per week); and free from any musculoskeletal disorders that would influence their ability to participate in the study. Accordingly, the subjects recruited were recreationally active, and familiar to the requirements of the assessments in this study. G*Power software (Version 3.1, Universität Kiel, Kiel, Germany) was used to confirm that for a correlation, point biserial model, a sample size of 43 ensured the data could be interpreted with a moderate (0.40) effect level [55], when the power level was 0.80 and significance was set at 0.05 [56]. Permission to conduct this research was approved by the institutional ethics committee. Subjects received an explanation of the study, which included the risks and benefits of participation, and written informed consent was obtained prior to testing.
2.2. Procedures
Prior to data collection, the subject’s age, height, and body mass were recorded. Height was measured barefoot using a stadiometer (Detecto ProDoc, Webb, MO, USA), while body mass was recorded using an electronic digital scale (Ohaus Corporation, Parsippany, NJ, USA). All data were collected across two sessions separated by 24–48 h depending on subject availability. During the first session, each subject completed two trials of the 20 m sprint, SBJ, and LJ (two trials per leg). During the second session, each subject completed two trials of the IAT, 505 (two trials per leg), VJ, and IMTP. The tests were structured in this way to limit fatigue influencing any aspect of test performance, laboratory and equipment availability, and to follow established guidelines for testing order [57]. All sprint and COD tests, in addition to the SBJ and LJ, were completed on a basketball court. Due to equipment availability, the VJ was performed in a laboratory with a concrete floor. The IMTP was performed in the laboratory on top of a force plate. Two minutes recovery was provided between trials and between tests throughout both sessions. The best trial (i.e., fastest sprint or COD test, best jump, highest IMTP force output) was used. Time was recorded to 0.01 s for all speed tests.
Prior to each testing session, all subjects completed a standardized warm-up, which consisted of approximately 10 min of dynamic stretching of the lower limbs, and linear and lateral runs over 10–20 m that progressively increased in intensity. Subjects were tested at the same time of day for both testing sessions, did not eat for 2–3 h prior to their sessions, and refrained from intensive exercise in the day prior to testing. Subjects were permitted to consume water as required throughout the two sessions.
2.3. 20 m Sprint
Linear speed was measured by a 20 m sprint with timing gates (Brower Timing Systems, Draper, UT, USA). Gates were positioned at 0, 5, 10, and 20 m to measure the 0–5 m, 0–10 m, and 0–20 m intervals. These intervals have been used in previous research to indicate linear speed [34,52,53]. The timing gate system was single-beam, and systems such as this have been shown to record reliable data [58,59,60]. Gate height was set at 0.93 m, which follows recommendations from the literature that single-beam gates should be positioned at the approximate hip height for the test subjects [59,61]. Gates were positioned 2.84 m apart, and subjects began the sprint from a standing start 50 cm behind the start line to trigger the first gate. Subjects were instructed to initiate the sprint when ready and cover the set distance as fast as possible. Approximately 15–20 m of extra distance was available after the 20 m mark to ensure subjects sprinted through the last gate, and to provide a safe deceleration zone following the sprint.
2.4. Standing Broad Jump (SBJ)
2.5. Lateral Jump (LJ)
2.6. Illinois Agility Test (IAT)
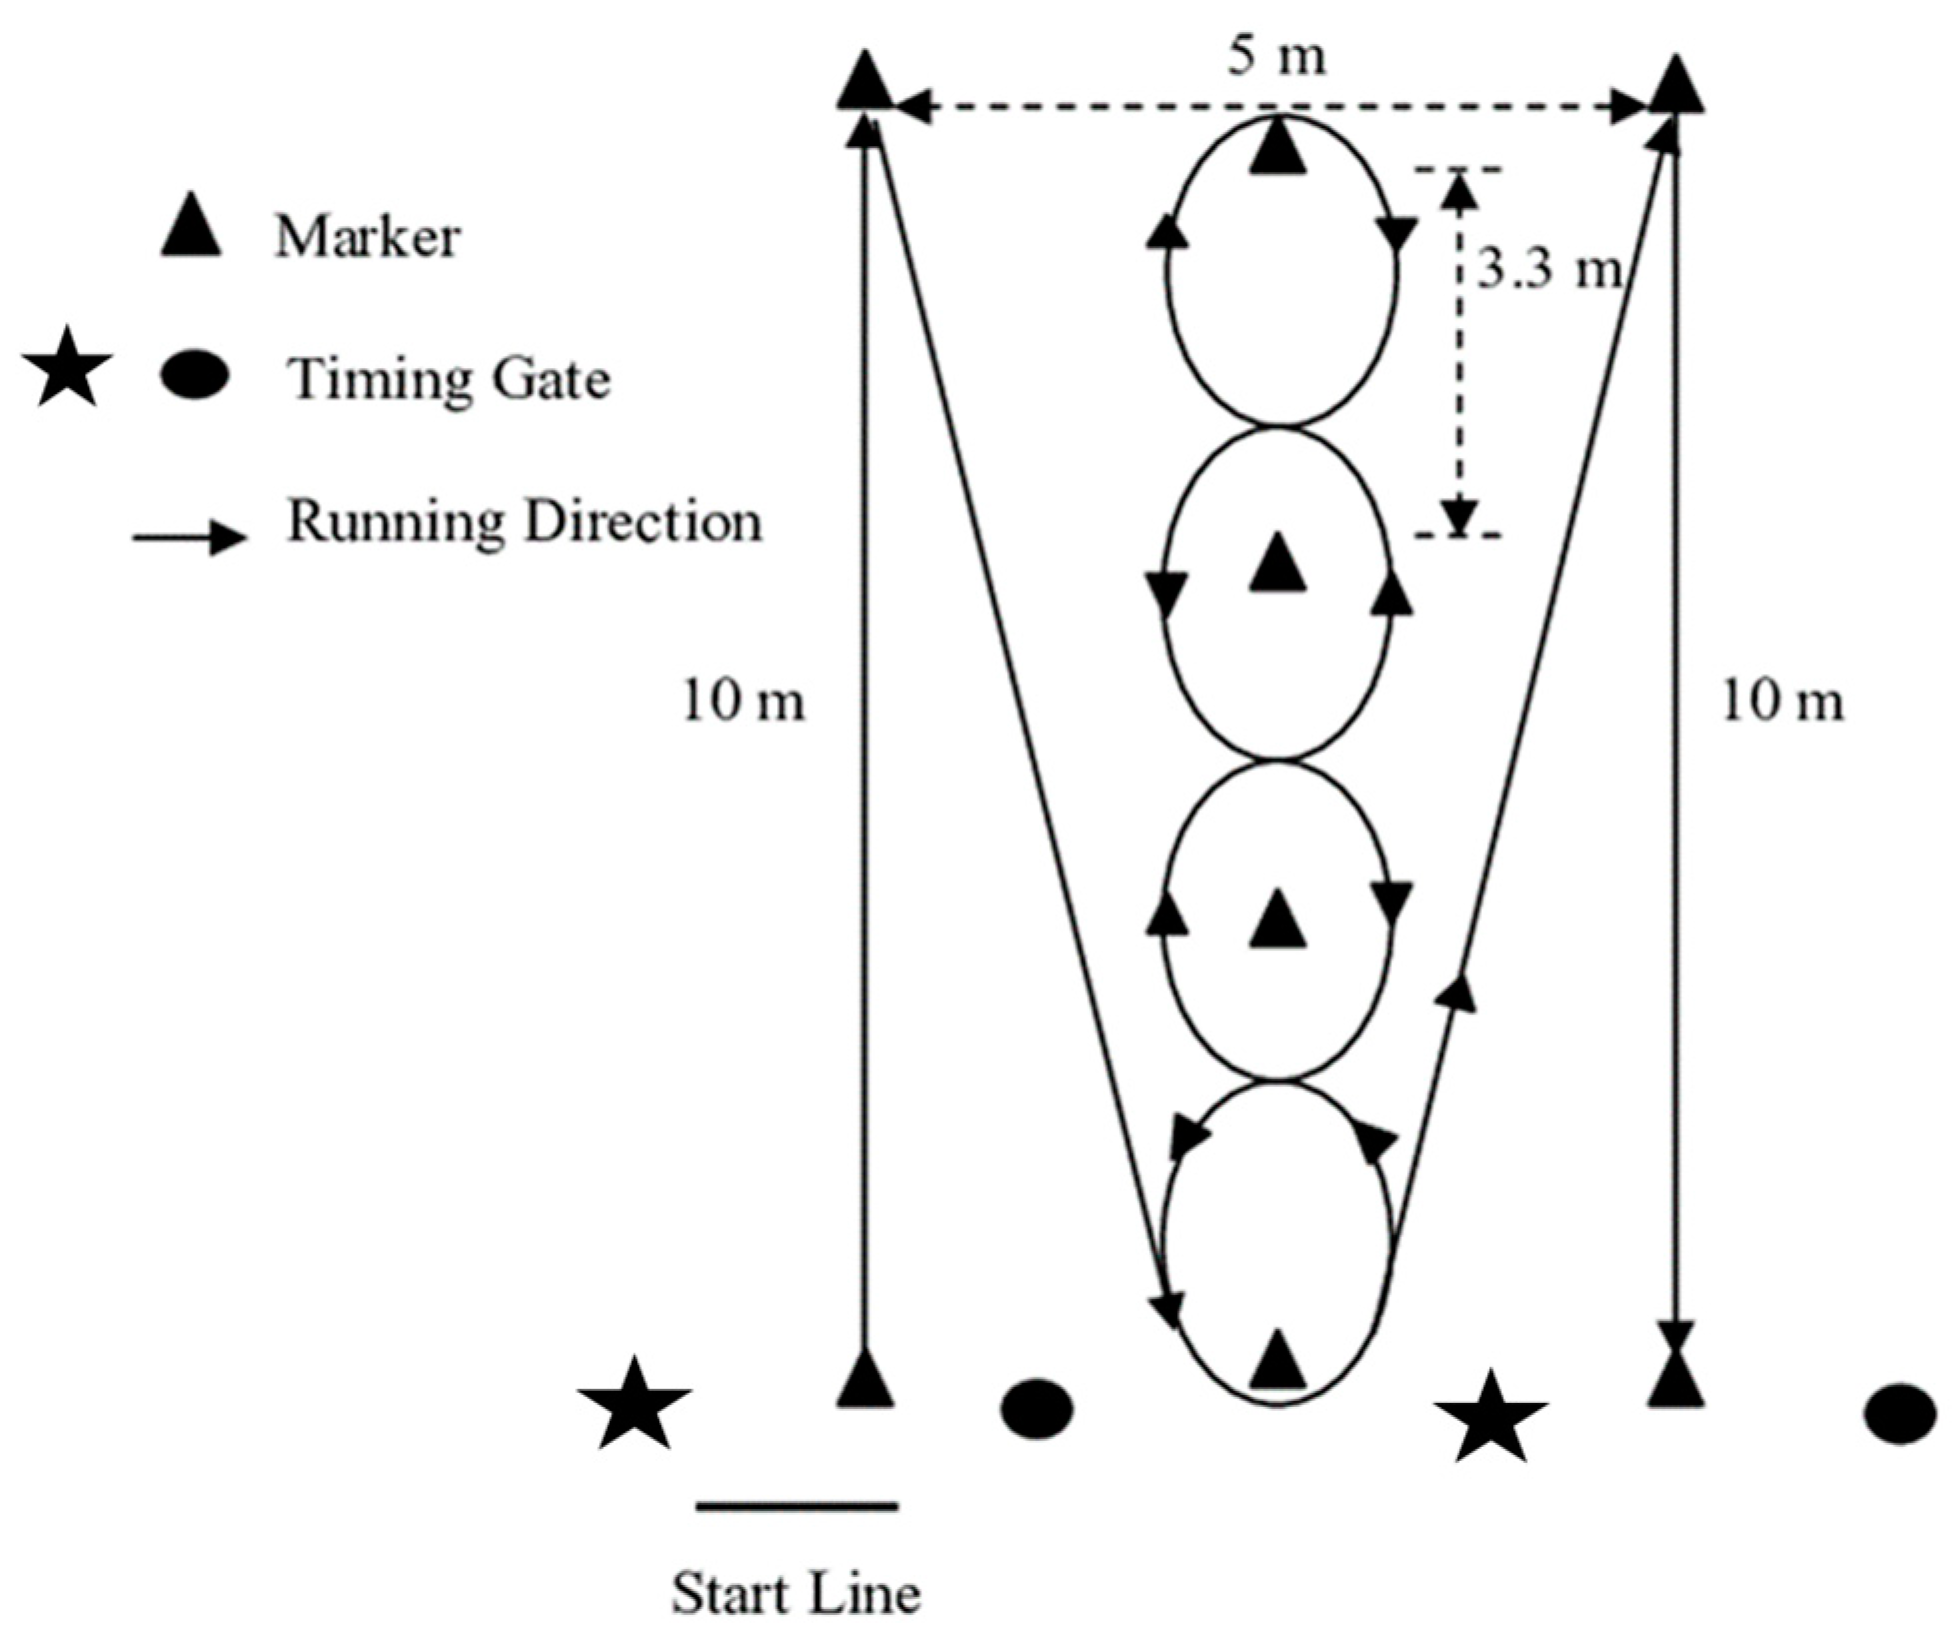
The dimensions and route direction for the IAT are shown in Figure 1 and was conducted according to previous research; the methods have been described in these studies [5,34,35]. Two pairs of single-beam timing gates were used at the start and finish lines. The height of the gates was set at 0.93 m [59,61], and they were positioned 1.93 m apart. A standing start 50 cm behind the start line was used. Subjects were instructed not to step over the markers but run around them, and were to follow the prescribed route throughout the trial.
2.7. 505 Test
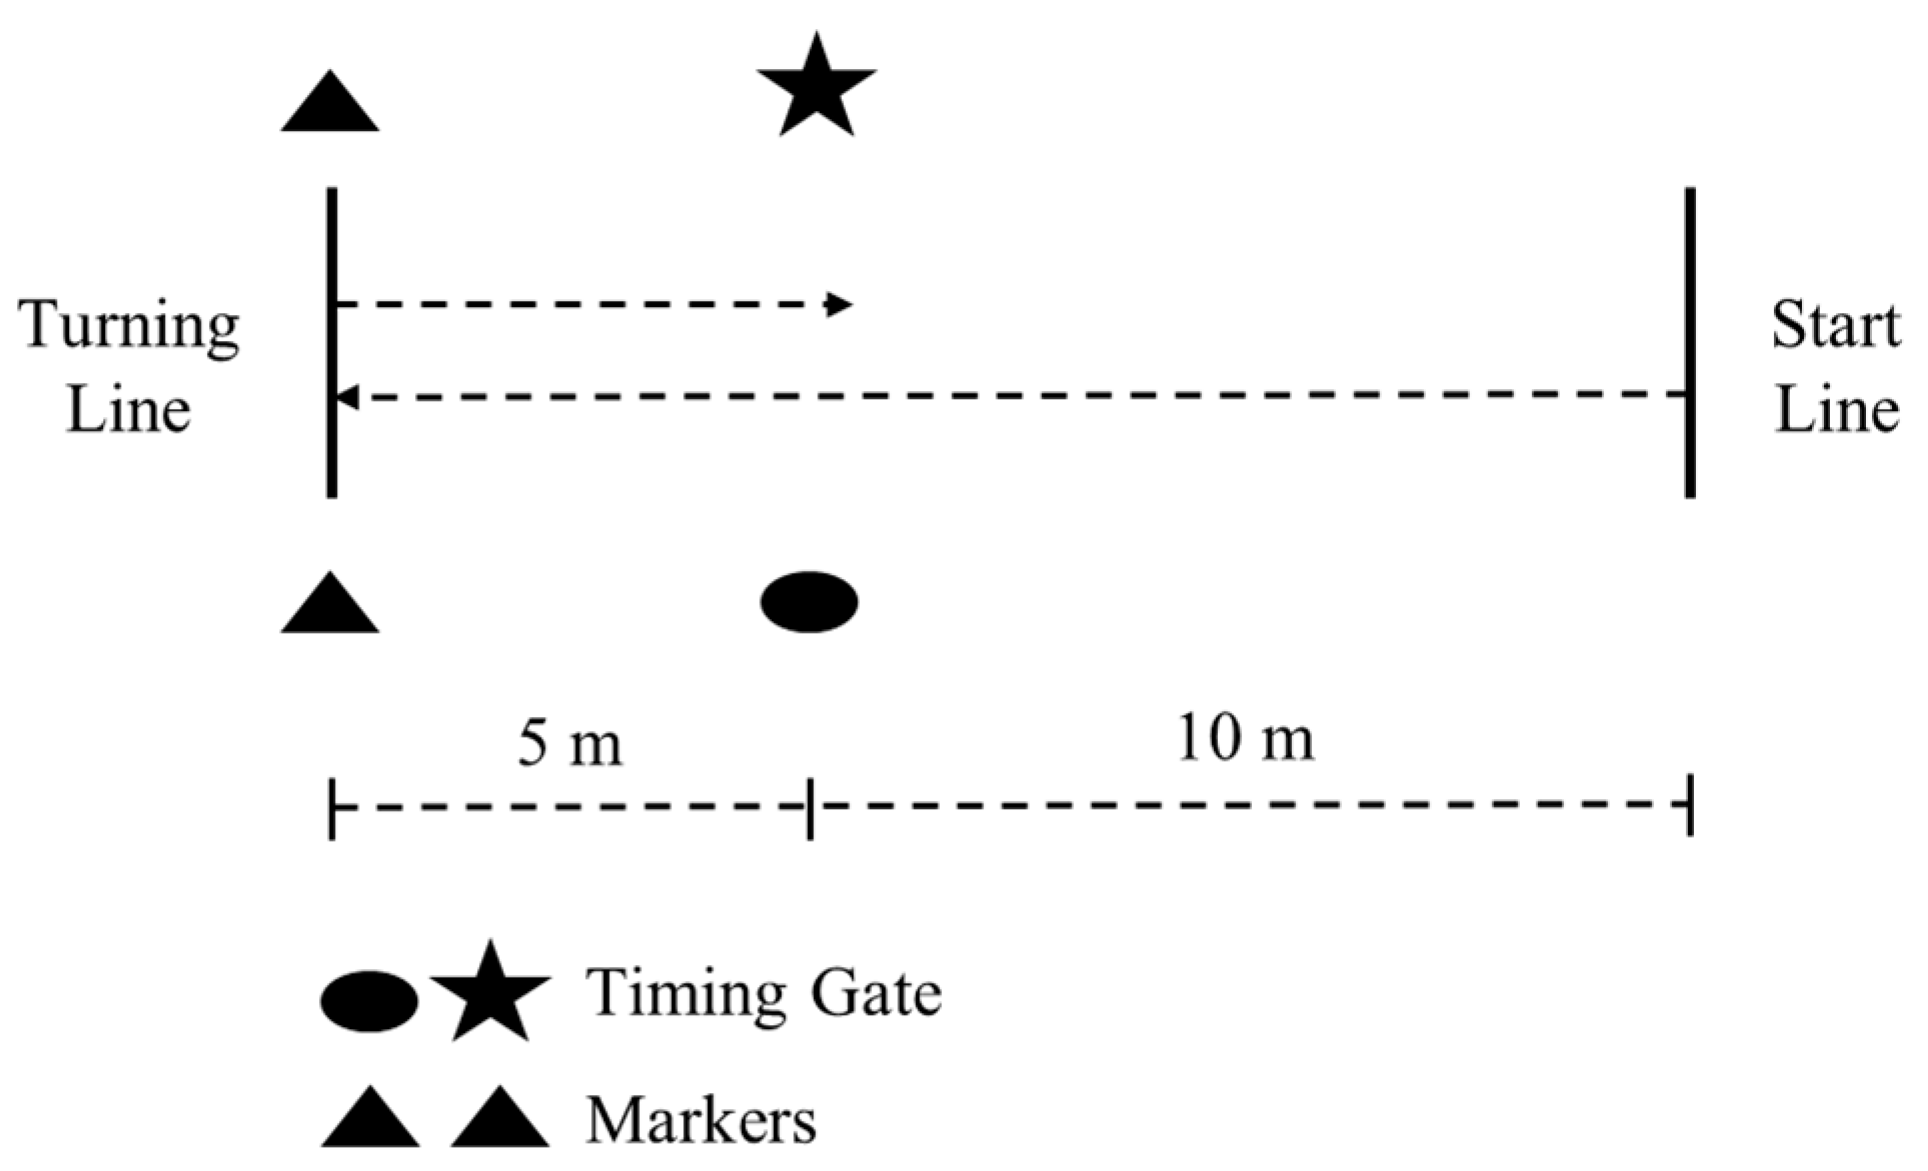
The methodology for the 505, as shown in Figure 2, was conducted per established methods, which have been described in detail [5,31,52,53]. A pair of timing gates set at a height of 0.93 m [59,61], and width of 2.84 m was used. The turning line was indicated by a line marked on the floor and with cones. Two trials were recorded for turns off the left and right foot, the order of which was randomized amongst the subjects. COD deficit for each leg was calculated via the formula: 505 time–10 m time [29]. The 10 m time was taken from the 0–10 m split from the linear sprint test, which follows standard procedures [7,10,29,30,31,32,54].
2.8. Vertical Jump (VJ)
The countermovement vertical jump measured lower-body power in the vertical plane. The VJ was measured via a Jump Station apparatus (EPIC Athletic Performance, Lincoln, NE, USA), and was conducted according to established methods described elsewhere [20,22,52,53,62]. Peak anaerobic power measured in watts (PAPw) from the VJ was calculated for the best trial by the equation: PAPw = (60.7⋅VJ height (cm)) + (45.3·body mass (kg)) − 2055 [63]. PAPw was calculated relative to body mass to provide a power-to-body mass ratio (P:BM) via the equation: P:BM = PAPw·BM−1 [7,12,62,64].
2.9. Isometric Midthigh Pull (IMTP)
To perform the IMTP, subjects stood on a force plate (AMTI, Watertown, MA, USA) within a power rack (Rogue Fitness, Columbus, OH, USA). The power rack allowed the bar to be fixed at the mid-point of the thigh (halfway between the iliac crest and the midpoint of the patella) for each subject. Subjects were instructed to grip the bar in a position similar to that of a second pull of a power clean, with an upright trunk position and so that their shoulders were in line with the bar, in their preferred position for the pull [65]. Subjects performed two, 5 s trials of the IMTP. In the advent of a difference in peak force of in excess of 250 N between the two trials, a third trial was performed [66]. A countdown of “3, 2, 1, take the weight” was given to the subjects before they initiated the pull. Subjects were instructed to pull as hard as possible, while driving their feet as hard as possible into the force plate. Data from the force plate was sampled at 1000 Hz and converted from analog to digital. This followed procedures established in the literature that led to the production of reliable IMTP data [67]. Digital signals were processed using a custom program through LabVIEW 2015 software (Version 15.0.1; National Instruments, Austin, TX, USA) where peak force was recorded and used for analysis. Relative force was also calculated according to the equation: relative force (N·kg−1) = peak force∙body weight in kg−1.
2.10. Statistical Analysis
All statistical analyses were computed using the Statistics Package for Social Sciences (Version 24.0; IBM Corporation, New York, NY, USA). Descriptive statistics (mean ± standard deviation [SD]) were calculated for each test parameter, and chi-square goodness of fit tests were conducted to check data distribution. Independent samples t-tests were utilized to determine whether differences in the performance tests existed between males and females and to confirm the use of sex as a control variable. An alpha level of p < 0.05 was required for significance. The relationships between the COD speed tests (505, COD deficit, and IAT) with the 20 m sprint intervals, jumps tests, and IMTP was investigated via partial correlations controlling for sex (p < 0.05). The correlation strength was designated as: an r between 0 to 0.3, or 0 to −0.3, was considered small; 0.31 to 0.49, or −0.31 to −0.49, moderate; 0.5 to 0.69, or −0.5 to −0.69, large; 0.7 to 0.89, or −0.7 to −0.89, very large; and 0.9 to 1, or −0.9 to −1, near perfect for relationship prediction [68]. Stepwise linear regression analyses (p < 0.05), with sex as a control variable, were conducted for the COD speed tests (each acted as a dependent variable) to illustrate whether a linear sprint interval, jump test variable, or strength variable predicted performance. This approach was undertaken due to the exploratory nature of this study and is similar to previous research [23].
3. Results
The chi-square goodness of fit analysis for all the variables indicated an expected data distribution when weighted by sex (χ2 (25–42) = 7.11–34.51, p = 0.15–1.00). Descriptive data for the combined, males, and females is shown in Table 1. There were significant differences between the sexes in all tests except for the left-leg COD deficit, which confirmed the need to control for sex in the correlation and regression analyses.
The partial correlation data is shown in Table 2. For the 505 from each leg and IAT, there were significant relationships with all tests except PAPw and absolute strength measured by the IMTP. Relationships with the linear sprint intervals were positive, and negative with the jump tests and relative IMTP strength; relationship strength ranged from moderate-to-large. For the COD deficit for each leg, there were only significant negative relationships with the LJ, which were moderate in strength.
The stepwise linear regression data is shown in Table 3. Sex was not entered into the model for the left-leg COD deficit, and thus this predictive equation was not generated. All predictive relationships were significant at p < 0.01, and sex was involved in all significant relationships. The 0–20 m sprint interval and left-leg LJ predicted the left- and right-leg 505, with an explained variance of 70% and 77%, respectively. The right-leg COD deficit was predicted by the left-leg LJ, with an explained variance of 27%. The IAT was predicted by the 0–20 m sprint interval, right-leg LJ, and relative strength measured by the IMTP, with an explained variance of 84%.
4. Discussion
The current study investigated how linear speed, lower-body power, and lower-body isometric strength may influence COD speed as measured by shorter and longer distance tests in college-aged individuals. This information is important, as collegiate club-sport [24,25] and tactical recruits [26,27,28] may not have the training time of other athletes. Understanding the physical qualities that could most influence COD speed improvements over shorter and longer distances could enhance training efficiency. The results indicated that for both the shorter (505) and longer (IAT) COD tests, faster linear speed, and greater lower-body power and relative isometric strength, related to faster COD performance. As hypothesized, the relationships tended to be stronger for the IAT. However, there were limited relationships between the COD deficit and the performance tests. The results from this study have implications for the training of college-aged individuals, especially those that need to train efficiently when developing their COD speed.
The 505 was used in this study as a measure of shorter COD speed. Previous 505 research has documented relationships between linear speed over different distances [6,7,29], lower-body power as measured by multidirectional jump tests [6,7,8], and lower-body strength [6,9]. The results from this study supported these findings. All sprint intervals and the jump tests correlated with the 505 from each leg, while the 0–20 m sprint interval and left-leg LJ predicted the 505. These data could have been influenced by the degree of linear sprinting (10 m about the 180° turn) still present within the 505 [4,29]. Nonetheless, these data illustrate the potential importance of linear sprinting ability and lower-body strength and power to shorter COD performance in recreationally-active individuals. Improvements in these qualities could influence athletic and occupational tasks that require shorter COD actions. Interestingly, P:BM but not PAPw, and relative IMTP but not absolute IMTP, correlated with the 505. These results indicate that males and females typical of collegiate club-sport [8,10,11,12] and tactical recruit [13,14,15,16,17,18] athletes should not just improve their lower-body strength and power to enhance their shorter COD speed, but ensure they can express high force and power relative to their body mass.
As 505 performance can be influenced by linear speed, the COD deficit may provide an alternate measure of shorter COD performance [4,29]. Previous research has found limited relationships between physical fitness assessments and the COD deficit [8,29,30,31]. The current results provided further support to these studies. Only the LJ demonstrated significant relationships to the COD deficit, with the left-leg LJ predicting the right-leg COD deficit (although the predictive relationship was low; 27% explained variance when combined with sex). These relationships could relate to the actions inherent within the 505 (i.e., the lateral 180° direction change). Nevertheless, given the limited relationships with the performance tests, this may suggest that technical qualities (i.e., COD biomechanics) may influence the COD deficit more than an individual’s physical qualities [69]. Considering this, and within the context of this study where individuals may be more time-restricted with their training [24,25,26,27,28], shorter COD speed could be initially targeted via improvements in linear speed and lower-body power and strength. Once this foundation is present and should the opportunity arise, more directed technique training could be adopted.
The IAT has been used to assess COD speed in athletic [33,34,35,36,37,38,39,40], law enforcement/public safety [41,42,43], and military [44,45,46] populations. COD speed tests that have a duration above 6 s (e.g., Arrowhead test, T-test) have been found to have significant relationships with linear speed tests [12,47,48]. This is most likely due to the greater demands on linear sprinting. Further to this, given that sprint performance often exhibits strong relationships with jumping ability as both utilize the stretch-shortening cycle [70], longer distance COD speed tests often demonstrate relationships with multidirectional jump performance [12,47]. This was reflected in the results from this study. All linear sprint intervals and jump tests correlated with the IAT, and the IAT was predicted by the 0–20 m sprint interval, right-leg LJ, and relative IMTP. Similar to the 505 results, P:BM and relative IMTP correlated with the IAT, while PAPw and absolute IMTP did not. These data indicate the potential value of enhancing linear speed, and lower-body power and strength relative to body mass, for males and females that need to perform longer distance COD speed efforts. This has particular relevance in the occupational field, as tasks such as simulated foot pursuits can be performed over distances of approximately 70–90 m, with multiple direction changes [19,20,21,22,23]. To efficiently improve longer distance COD speed efforts, linear speed, lower-body strength, and lower-body power training should be used by males and females. Although this may seem a straightforward recommendation, these training approaches are not often adopted in the occupational field [22,23], even with a greater focus nowadays on the tactical athlete.
There are study limitations that should be acknowledged. Only two COD speed tests were analyzed in this study; it would be of interest to investigate other shorter (e.g., pro-agility shuttle, three-cone drill) or longer (e.g., Arrowhead, T-test) assessments used to measure COD ability [5]. Further to this, the relationships between physical qualities and direction change performance through different turn angles (e.g., 45° vs. 90° vs. 180°) should be considered. Nimphius et al. [4] has noted that the angle of a direction change will influence COD speed, and this is likely linked to the physical qualities required for faster performance. Only bilateral isometric strength was measured in this study. As unilateral and dynamic strength should have some influence on COD speed, greater analysis of the impact of lower-body strength on shorter and longer COD performance could be conducted. Lastly, the sample analyzed were recreationally-trained, college-aged males and females, and not a specific athletic population. Despite this, the sample has great utility, and as noted earlier, is similar to collegiate club-sport [8,10,11,12] and tactical recruit [13,14,15,16,17,18] athletes. Accordingly, the results may be inferred across lower-level college athletes from different sports and individuals from different occupations (e.g., first responders, military), as these groups all are required to perform shorter and longer distance COD tasks.
5. Conclusions
The results from this study indicated that in recreationally-trained, college-aged individuals, linear speed over 20 m, lower-body power measured via multidirectional jumping, and lower-body isometric strength related to shorter (505) and longer (IAT) COD performance. Moreover, P:BM and relative IMTP was more important than absolute power and force generation for these COD tasks. For those individuals who may have limited training time, such as collegiate club-sport [24,25] and tactical recruit [26,27,28] athletes, specific targeting of linear sprinting, and relative lower-body power and strength could lead to enhanced shorter and longer COD performance. Finally, the COD deficit, which may provide an alternate measure of shorter COD ability, did not relate to most of the speed, power, and strength tests. Improvements in this quality may require more targeted technique development.
Author Contributions
R.G.L. was involved in study design, data interpretation, and manuscript writing and editing. B.K.P. was involved in data collection, data interpretation, and manuscript writing and editing. J.J.D. was involved in manuscript writing and editing.
Funding
This research received no external funding.
Acknowledgments
We would like to acknowledge our subjects for their contribution to this study. This research project received no external financial assistance. None of the authors have any conflict of interest.
Conflicts of Interest
The authors declare no conflict of interest.
Abbreviations
| COD | Change-of-direction |
| m | Meter |
| VJ | Vertical jump |
| LJ | Lateral jump |
| r | Correlation coefficient |
| SBJ | Standing broad jump |
| IMTP | Isometric midthigh pull |
| s | Seconds |
| IAT | Illinois agility test |
| kg | Kilograms |
| cm | Centimeters |
| PAPw | Peak anaerobic power measured in watts |
| P:BM | Power-to-body mass ratio |
| N | Newtons |
| SD | Standard deviation |
| p | Significance |
| w | Watts |
| w·kg−1 | Watts per kilogram body mass |
| N·kg−1 | Newtons per kilogram body mass |
| L | Left |
| R | Right |
References
- Sheppard, J.M.; Young, W.B. Agility literature review: Classifications, training and testing. J. Sports Sci. 2006, 24, 919–932. [Google Scholar] [CrossRef] [PubMed]
- Hewit, J.K.; Cronin, J.B.; Hume, P.A. Kinematic factors affecting fast and slow straight and change-of-direction acceleration times. J. Strength Cond. Res. 2013, 27, 69–75. [Google Scholar] [CrossRef] [PubMed]
- Hewit, J.K.; Cronin, J.B.; Hume, P.A. Understanding change of direction performance: A technical analysis of a 180° aerial catch and turn task. Int. J. Sports Sci. Coach. 2012, 7, 503–514. [Google Scholar] [CrossRef]
- Nimphius, S.; Callaghan, S.J.; Bezodis, N.E.; Lockie, R.G. Change of direction and agility tests: Challenging our current measures of performance. Strength Cond. J. 2018, 40, 26–38. [Google Scholar] [CrossRef]
- Lockie, R.G. Testing, assessment, and monitoring of agility and quickness. In Developing Agility and Quickness; Dawes, J.J., Ed.; Human Kinetics: Champaign, IL, USA, 2019; Volume 2, pp. 77–98. [Google Scholar]
- Delaney, J.A.; Scott, T.J.; Ballard, D.A.; Duthie, G.M.; Hickmans, J.A.; Lockie, R.G.; Dascombe, B.J. Contributing factors to change-of-direction ability in professional rugby league players. J. Strength Cond. Res. 2015, 29, 2688–2696. [Google Scholar] [CrossRef] [PubMed]
- Lockie, R.G.; Dawes, J.J.; Jones, M.T. Relationships between linear speed and lower-body power with change-of-direction speed in national collegiate athletic association divisions i and ii women soccer athletes. Sports 2018, 6, 30. [Google Scholar] [CrossRef] [PubMed]
- Lockie, R.G.; Orjalo, A.J.; Amran, V.L.; Davis, D.L.; Risso, F.G.; Jalilvand, F. An introductory analysis as to the influence of lower-body power on multidirectional speed in collegiate female rugby players. Sport Sci. Rev. 2016, 25, 113–134. [Google Scholar] [CrossRef] [Green Version]
- Spiteri, T.; Nimphius, S.; Hart, N.H.; Specos, C.; Sheppard, J.M.; Newton, R.U. Contribution of strength characteristics to change of direction and agility performance in female basketball athletes. J. Strength Cond. Res. 2014, 28, 2415–2423. [Google Scholar] [CrossRef]
- Lockie, R.G. Change-of-direction deficit in collegiate women’s rugby union players. FU Phys. Ed. Sport 2018, 16, 19–31. [Google Scholar] [CrossRef]
- Fukuda, D.H.; Smith, A.E.; Kendall, K.L.; Cramer, J.T.; Stout, J.R. The determination of critical rest interval from the intermittent critical velocity test in club-level collegiate hockey and rugby players. J. Strength Cond. Res. 2011, 25, 889–895. [Google Scholar] [CrossRef]
- McFarland, I.; Dawes, J.J.; Elder, C.L.; Lockie, R.G. Relationship of two vertical jumping tests to sprint and change of direction speed among male and female collegiate soccer players. Sports 2016, 4, 11. [Google Scholar] [CrossRef] [PubMed]
- Crawley, A.A.; Sherman, R.A.; Crawley, W.R.; Cosio-Lima, L.M. Physical fitness of police academy cadets: Baseline characteristics and changes during a 16-week academy. J. Strength Cond. Res. 2016, 30, 1416–1424. [Google Scholar] [CrossRef] [PubMed]
- Boyce, R.W.; Jones, G.R.; Schendt, K.E.; Lloyd, C.L.; Boone, E.L. Longitudinal changes in strength of police officers with gender comparisons. J. Strength Cond. Res. 2009, 23, 2411–2418. [Google Scholar] [CrossRef] [PubMed]
- Childs, J.D.; Teyhen, D.S.; Casey, P.R.; McCoy-Singh, K.A.; Feldtmann, A.W.; Wright, A.C.; Dugan, J.L.; Wu, S.S.; George, S.Z. Effects of traditional sit-up training versus core stabilization exercises on short-term musculoskeletal injuries in us army soldiers: A cluster randomized trial. Phys. Ther. 2010, 90, 1404–1412. [Google Scholar] [CrossRef] [PubMed]
- Mala, J.; Szivak, T.K.; Flanagan, S.D.; Comstock, B.A.; Laferrier, J.Z.; Maresh, C.M.; Kraemer, W.J. The role of strength and power during performance of high intensity military tasks under heavy load carriage. US Army Med. Dep. J. 2015, 3–11. [Google Scholar]
- Jones, B.H.; Bovee, M.W.; Harris, J.M., 3rd; Cowan, D.N. Intrinsic risk factors for exercise-related injuries among male and female army trainees. Am. J. Sports Med. 1993, 21, 705–710. [Google Scholar] [CrossRef] [PubMed] [Green Version]
- Stone, B.L.; Heishman, A.D.; Campbell, J.A. The effects of a periodized vs. Traditional military training program on 2-mile run performance during the Army Physical Fitness Test (APFT). J. Strength Cond. Res. 2017. [Google Scholar] [CrossRef] [PubMed]
- Cesario, K.A.; Dulla, J.M.; Moreno, M.R.; Bloodgood, A.M.; Dawes, J.J.; Lockie, R.G. Relationships between assessments in a physical ability test for law enforcement: Is there redundancy in certain assessments? Int. J. Exerc. Sci. 2018, 11, 1063–1073. [Google Scholar]
- Lockie, R.G.; Ruvalcaba, T.R.; Stierli, M.; Dulla, J.M.; Dawes, J.J.; Orr, R.M. Waist circumference and waist-to-hip ratio in law enforcement agency recruits: Relationship to performance in physical fitness tests. J. Strength Cond. Res. 2018. [Google Scholar] [CrossRef]
- Lockie, R.G.; Stierli, M.; Dawes, J.J.; Cesario, K.A.; Moreno, M.R.; Bloodgood, A.M.; Orr, R.M.; Dulla, J.M. Are there similarities in physical fitness characteristics of successful candidates attending law enforcement training regardless of training cohort? J. Trainol. 2018, 7, 5–9. [Google Scholar] [CrossRef] [Green Version]
- Lockie, R.G.; Balfany, K.; Bloodgood, A.M.; Moreno, M.R.; Cesario, K.A.; Dulla, J.M.; Dawes, J.J.; Orr, R.M. The influence of physical fitness on reasons for academy separation in law enforcement recruits. Int. J. Environ. Res. Public Health 2019, 16, 372. [Google Scholar] [CrossRef]
- Lockie, R.G.; Dawes, J.J.; Balfany, K.; Gonzales, C.E.; Beitzel, M.M.; Dulla, J.M.; Orr, R.M. Physical fitness characteristics that relate to Work Sample Test Battery performance in law enforcement recruits. Int. J. Environ. Res. Public Health 2018, 15, 2477. [Google Scholar] [CrossRef] [PubMed]
- Steinhagen, M.R.; Meyers, M.C.; Erickson, H.H.; Noble, L.; Richardson, M.T. Physiological profile of college club-sport lacrosse athletes. J. Strength Cond. Res. 1998, 12, 226–231. [Google Scholar]
- Lockie, R.G.; Birminagham-Babauta, S.A.; Stokes, J.J.; Liu, T.M.; Risso Fabrice, G.; Lazar, A.; Giuliano, D.V.; Orjalo Ashley, J.; Moreno, M.R.; Stage, A.A.; et al. An analysis of collegiate club-sport female lacrosse players: Sport-specific field test performance and the influence of stick carry on speed. Int. J. Exerc. Sci. 2018, 11, 269–280. [Google Scholar]
- Lockie, R.G.; Fazilat, B.; Dulla, J.M.; Stierli, M.; Orr, R.M.; Dawes, J.J.; Pakdamanian, K. A retrospective and comparative analysis of the physical fitness of custody assistant classes prior to academy training. Sport Exerc. Med. Open J. 2018, 4, 44–51. [Google Scholar] [CrossRef]
- Cesario, K.; Moreno, M.; Bloodgood, A.; Lockie, R. A Sample Ability-Based Conditioning Session for Law Enforcement and Correctional Recruits; TSAC Report; TSAC: Colorado Springs, CO, USA, 2019; pp. 6–11. [Google Scholar]
- Moreno, M.; Cesario, K.; Bloodgood, A.; Lockie, R. Circuit Strength Training with Ability-Based Modifications for Law Enforcement Recruits; TSAC Report; TSAC: Colorado Springs, CO, USA, 2018; pp. 26–33. [Google Scholar]
- Nimphius, S.; Callaghan, S.J.; Spiteri, T.; Lockie, R.G. Change of direction deficit: A more isolated measure of change of direction performance than total 505 time. J. Strength Cond. Res. 2016, 30, 3024–3032. [Google Scholar] [CrossRef]
- Dos’Santos, T.; Thomas, C.; Comfort, P.; Jones, P.A. Comparison of change of direction speed performance and asymmetries between team-sport athletes: Application of change of direction deficit. Sports 2018, 6, 174. [Google Scholar] [CrossRef]
- Lockie, R.G.; Stage, A.A.; Stokes, J.J.; Orjalo, A.J.; Davis, D.L.; Giuliano, D.V.; Moreno, M.R.; Risso, F.G.; Lazar, A.; Birmingham-Babauta, S.A.; et al. Relationships and predictive capabilities of jump assessments to soccer-specific field test performance in Division I collegiate players. Sports 2016, 4, 56. [Google Scholar] [CrossRef]
- Thomas, C.; Dos’Santos, T.; Comfort, P.; Jones, P.A. Relationships between unilateral muscle strength qualities and change of direction in adolescent team-sport athletes. Sports 2018, 6, 83. [Google Scholar] [CrossRef]
- Vescovi, J.D.; McGuigan, M.R. Relationships between sprinting, agility, and jump ability in female athletes. J. Sports Sci. 2008, 26, 97–107. [Google Scholar] [CrossRef]
- Lockie, R.G.; Schultz, A.B.; Callaghan, S.J.; Jeffriess, M.D.; Berry, S.P. Reliability and validity of a new test of change-of-direction speed for field-based sports: The change-of-direction and acceleration test (CODAT). J. Sports Sci. Med. 2013, 12, 88–96. [Google Scholar] [PubMed]
- Wilkinson, M.; Leedale-Brown, D.; Winter, E.M. Validity of a squash-specific test of change-of-direction speed. Int. J. Sports Physiol. Perform. 2009, 4, 176–185. [Google Scholar] [CrossRef] [PubMed]
- Gabbett, T.J. Physiological characteristics of junior and senior rugby league players. Br. J. Sports Med. 2002, 36, 334–339. [Google Scholar] [CrossRef] [Green Version]
- Jarvis, S.; Sullivan, L.O.; Davies, B.; Wiltshire, H.; Baker, J.S. Interrelationships between measured running intensities and agility performance in subelite rugby union players. Res. Sports Med. 2009, 17, 217–230. [Google Scholar] [CrossRef] [PubMed]
- Váczi, M.; Tollár, J.; Meszler, B.; Juhász, I.; Karsai, I. Short-term high intensity plyometric training program improves strength, power and agility in male soccer players. J. Hum. Kinet. 2013, 36, 17–26. [Google Scholar] [CrossRef] [PubMed]
- Vescovi, J.D.; Brown, T.D.; Murray, T.M. Positional characteristics of physical performance in division i college female soccer players. J. Sports Med. Phys. Fit. 2006, 46, 221–226. [Google Scholar]
- Vescovi, J.D.; Rupf, R.; Brown, T.D.; Marques, M.C. Physical performance characteristics of high-level female soccer players 12-21 years of age. Scand. J. Med. Sci. Sports 2011, 21, 670–678. [Google Scholar] [CrossRef] [PubMed]
- Adams, J.; Cheng, D.; Lee, J.; Shock, T.; Kennedy, K.; Pate, S. Use of the bootstrap method to develop a physical fitness test for public safety officers who serve as both police officers and firefighters. Proceedings (Bayl. Univ. Med. Center) 2014, 27, 199–202. [Google Scholar] [CrossRef]
- Orr, R.; Schram, B.; Pope, R. A comparison of military and law enforcement body armour. Int. J. Environ. Res. Public Health 2018, 15, 339. [Google Scholar] [CrossRef] [PubMed]
- Beck, A.Q.; Clasey, J.L.; Yates, J.W.; Koebke, N.C.; Palmer, T.G.; Abel, M.G. Relationship of physical fitness measures vs. Occupational physical ability in campus law enforcement officers. J. Strength Cond. Res. 2015, 29, 2340–2350. [Google Scholar] [CrossRef] [PubMed]
- Raya, M.A.; Gailey, R.S.; Gaunaurd, I.A.; Jayne, D.M.; Campbell, S.M.; Gagne, E.; Manrique, P.G.; Muller, D.G.; Tucker, C. Comparison of three agility tests with male servicemembers: Edgren side step test, t-test, and illinois agility test. J. Rehabil. Res. Dev. 2013, 50, 951–960. [Google Scholar] [CrossRef] [PubMed]
- Foulis, S.A.; Sharp, M.A.; Redmond, J.E.; Frykman, P.N.; Warr, B.J.; Gebhardt, D.L.; Baker, T.A.; Canino, M.C.; Zambraski, E.J. U.S. Army physical demands study: Development of the occupational physical assessment test for combat arms soldiers. J. Sci. Med. Sport 2017, 20, S74–S78. [Google Scholar] [CrossRef] [PubMed]
- Roy, T.C.; Springer, B.A.; McNulty, V.; Butler, N.L. Physical fitness. Mil. Med. 2010, 175, 14–20. [Google Scholar] [CrossRef]
- Lockie, R.G.; Callaghan, S.J.; Berry, S.P.; Cooke, E.R.; Jordan, C.A.; Luczo, T.M.; Jeffriess, M.D. Relationship between unilateral jumping ability and asymmetry on multidirectional speed in team-sport athletes. J. Strength Cond. Res. 2014, 28, 3557–3566. [Google Scholar] [CrossRef] [PubMed]
- Lockie, R.G.; Jalilvand, F. Reliability and criterion validity of the Arrowhead change-of-direction speed test for soccer. FU Phys. Ed. Sport 2017, 15, 139–151. [Google Scholar]
- Lockie, R.G.; Callaghan, S.J.; Jeffriess, M.D. Analysis of specific speed testing for cricketers. J. Strength Cond. Res. 2013, 27, 2981–2988. [Google Scholar] [CrossRef] [PubMed]
- Nimphius, S.; McGuigan, M.R.; Newton, R.U. Relationship between strength, power, speed, and change of direction performance of female softball players. J. Strength Cond. Res. 2010, 24, 885–895. [Google Scholar] [CrossRef]
- Lockie, R.G.; Callaghan, S.J.; Jeffriess, M.D. Can the 505 change-of-direction speed test be used to monitor leg function following ankle sprains in team sport athletes? J. Aust. Strength Cond. 2015, 23, 10–16. [Google Scholar]
- Lockie, R.G.; Schultz, A.B.; Callaghan, S.J.; Jordan, C.A.; Luczo, T.M.; Jeffriess, M.D. A preliminary investigation into the relationship between functional movement screen scores and athletic physical performance in female team sport athletes. Biol. Sport 2015, 32, 41–51. [Google Scholar] [CrossRef]
- Lockie, R.G.; Schultz, A.B.; Jordan, C.A.; Callaghan, S.J.; Jeffriess, M.D.; Luczo, T.M. Can selected functional movement screen assessments be used to identify movement deficiencies that could affect multidirectional speed and jump performance? J. Strength Cond. Res. 2015, 29, 195–205. [Google Scholar] [CrossRef]
- Lockie, R.G.; Jalilvand, F.; Orjalo, A.J.; Giuliano, D.V.; Moreno, M.R.; Wright, G.A. A methodological report: Adapting the 505 change-of-direction speed test specific to American football. J. Strength Cond. Res. 2017, 31, 539–547. [Google Scholar] [CrossRef] [PubMed]
- Hopkins, W.G. How to interpret changes in an athletic performance test. Sportscience 2004, 8, 1–7. [Google Scholar]
- Faul, F.; Erdfelder, E.; Lang, A.G.; Buchner, A. G*power 3: A flexible statistical power analysis program for the social, behavioral, and biomedical sciences. Behav. Res. Methods 2007, 39, 175–191. [Google Scholar] [CrossRef] [PubMed]
- McGuigan, M.R. Principles of test selection and administration. In Essentials of Strength Training and Conditioning, 4th ed.; Haff, G.G., Triplett, N.T., Eds.; Human Kinetics: Champaign, IL, USA, 2015; pp. 249–258. [Google Scholar]
- Darrall-Jones, J.D.; Jones, B.; Roe, G.; Till, K. Reliability and usefulness of linear sprint testing in adolescent rugby union and league players. J. Strength Cond. Res. 2016, 30, 1359–1364. [Google Scholar] [CrossRef] [PubMed]
- Winchester, J.B.; Nelson, A.G.; Landin, D.; Young, M.A.; Schexnayder, I.C. Static stretching impairs sprint performance in collegiate track and field athletes. J. Strength Cond. Res. 2008, 22, 13–19. [Google Scholar] [CrossRef] [PubMed]
- Shalfawi, S.A.I.; Enoksen, E.; Tønnessen, E.; Ingebrigtsen, J. Assessing test-retest reliability of the portable brower speed trap ii testing system. Kinesiology 2012, 44, 24–30. [Google Scholar]
- Yeadon, M.R.; Kato, T.; Kerwin, D.G. Measuring running speed using photocells. J. Sports Sci. 1999, 17, 249–257. [Google Scholar] [CrossRef]
- Lockie, R.G.; Dawes, J.J.; Orr, R.M.; Stierli, M.; Dulla, J.M.; Orjalo, A.J. An analysis of the effects of sex and age on upper- and lower-body power for law enforcement agency recruits prior to academy training. J. Strength Cond. Res. 2018, 32, 1968–1974. [Google Scholar] [CrossRef]
- Sayers, S.P.; Harackiewicz, D.V.; Harman, E.A.; Frykman, P.N.; Rosenstein, M.T. Cross-validation of three jump power equations. Med. Sci. Sports Exerc. 1999, 31, 572–577. [Google Scholar] [CrossRef]
- Dawes, J.J.; Orr, R.M.; Elder, C.L.; Krall, K.; Stierli, M.; Schilling, B. Relationship between selected measures of power and strength and linear running speed amongst Special Weapons and Tactics police officers. J. Aust. Strength Cond. 2015, 23, 23–28. [Google Scholar]
- Comfort, P.; Jones, P.A.; McMahon, J.J.; Newton, R. Effect of knee and trunk angle on kinetic variables during the isometric midthigh pull: Test-retest reliability. Int. J. Sports Physiol. Perform. 2015, 10, 58–63. [Google Scholar] [CrossRef] [PubMed]
- Secomb, J.L.; Lundgren, L.E.; Farley, O.R.; Tran, T.T.; Nimphius, S.; Sheppard, J.M. Relationships between lower-body muscle structure and lower-body strength, power, and muscle-tendon complex stiffness. J. Strength Cond. Res. 2015, 29, 2221–2228. [Google Scholar] [CrossRef] [PubMed]
- James, L.P.; Roberts, L.A.; Haff, G.G.; Kelly, V.G.; Beckman, E.M. Validity and reliability of a portable isometric mid-thigh clean pull. J. Strength Cond. Res. 2017, 31, 1378–1386. [Google Scholar] [CrossRef] [PubMed]
- Hopkins, W.G. A Scale of Magnitude for Effect Statistics. Available online: www.sportsci.org/resource/stats/index.html (accessed on 6 October 2018).
- Dos’Santos, T.; Thomas, C.; Jones, P.A.; Comfort, P. Mechanical determinants of faster change of direction speed performance in male athletes. J. Strength Cond. Res. 2017, 31, 696–705. [Google Scholar] [CrossRef] [PubMed]
- Kraemer, W.J.; Ratamess, N.A.; Volek, J.S.; Mazzetti, S.A.; Gómez, A.L. The effect of the meridian shoe on vertical jump and sprint performances following short-term combined plyometric/sprint and resistance training. J. Strength Cond. Res. 2000, 14, 228–238. [Google Scholar]
Figure 1.
The Illinois agility test (IAT).

Figure 2.
The 505 test.


Table 1.
Descriptive data (mean ± SD) for combined, males, and females in the 505 and change-of-direction (COD) deficit for the left (L) and right (R) legs, IAT, 0–5 m, 0–10 m, and 0–20 m sprint intervals, vertical jump (VJ), peak anaerobic power measured in watts (PAPw), power-to-body mass ratio (P:BM), standing broad jump (SBJ), lateral jump (LJ) for the left (L) and right (R) legs, and absolute and relative isometric midthigh pull (IMTP).
| Variables | Combined (n = 43) | Males (n = 21) | Females (n = 22) | p |
|---|---|---|---|---|
| 505 L (s) | 2.71 ± 0.29 | 2.54 ± 0.19 | 2.90 ± 0.25 * | <0.01 |
| COD Deficit L (s) | 0.70 ± 0.19 | 0.67 ± 0.19 | 0.74 ± 0.18 | 0.18 |
| 505 R (s) | 2.73 ± 0.30 | 2.53 ± 0.16 | 2.94 ± 0.26 * | <0.01 |
| COD Deficit R (s) | 0.72 ± 0.18 | 0.66 ± 0.16 | 0.78 ± 0.17 * | 0.02 |
| IAT (s) | 17.87 ± 1.68 | 16.78 ± 0.99 | 19.02 ± 1.49 * | <0.01 |
| 0–5 m (s) | 1.18 ± 0.12 | 1.10 ± 0.07 | 1.26 ± 0.12 * | <0.01 |
| 0–10 m (s) | 2.01 ± 0.21 | 1.87 ± 0.11 | 2.16 ± 0.19 * | <0.01 |
| 0–20 m (s) | 3.54 ± 0.40 | 3.26 ± 0.20 | 3.83 ± 0.34 * | <0.01 |
| VJ (cm) | 49.53 ± 13.17 | 59.05 ± 10.54 | 39.57 ± 6.62 * | <0.01 |
| PAPw (w) | 4318.31 ± 1108.12 | 5203.36 ± 637.03 | 3391.12 ± 623.10 * | <0.01 |
| P:BM (w·kg−1) | 57.83 ± 10.08 | 64.59 ± 8.19 | 50.75 ± 6.31 * | <0.01 |
| SBJ (m) | 1.92 ± 0.41 | 2.23 ± 0.25 | 1.59 ± 0.25 * | <0.01 |
| LJ L (m) | 1.44 ± 0.30 | 1.62 ± 0.25 | 1.26 ± 0.22 * | <0.01 |
| LJ R (m) | 1.43 ± 0.32 | 1.64 ± 0.25 | 1.21 ± 0.21 * | <0.01 |
| IMTP (N) | 1936.29 ± 488.39 | 2324.10 ± 275.05 | 1530.01 ± 287.58 * | <0.01 |
| Relative IMTP (N·kg−1) | 25.91 ± 4.20 | 28.74 ± 2.61 | 22.95 ± 3.44 * | <0.01 |
* Significantly (p < 0.05) different from the males.
Table 2.
Partial correlations controlling for sex in recreationally-trained men and women between the 505 and COD deficit for the left (L) and right (R) legs and IAT, with the 0–5 m, 0–10 m, and 0–20 m sprint intervals, VJ, PAPw, P:BM, SBJ, LJ for the left (L) and right (R) legs, and absolute and relative IMTP (n = 43). r: correlation coefficient; p: significance.
| Variables | 505 L | COD Deficit L | 505 R | COD Deficit R | IAT | |
|---|---|---|---|---|---|---|
| 0–5 m | r p | 0.46 * <0.01 | −0.25 0.11 | 0.58 * <0.01 | −0.14 0.40 | 0.57 * <0.01 |
| 0–10 m | r p | 0.57 * <0.01 | −0.15 0.35 | 0.64 * <0.01 | −0.08 0.61 | 0.64 * <0.01 |
| 0–20 m | r p | 0.64 * <0.01 | −0.03 0.86 | 0.71 * <0.01 | 0.04 0.82 | 0.74 * <0.01 |
| VJ | r p | −0.43 * 0.01 | −0.18 0.26 | −0.46 * <0.01 | −0.22 0.16 | −0.45 * <0.01 |
| PAPw | r p | −0.17 0.28 | −0.15 0.35 | −0.26 0.10 | −0.27 0.08 | −0.24 0.13 |
| P:BM | r p | −0.51 * <0.01 | −0.24 0.14 | −0.51 * <0.01 | −0.24 0.13 | −0.51 * <0.01 |
| SBJ | r p | −0.60 * <0.01 | −0.18 0.26 | −0.61 * <0.01 | −0.20 0.20 | −0.66 * <0.01 |
| LJ L | r p | −0.62 * <0.01 | −0.43 * <0.01 | −0.60 * <0.01 | −0.44 * <0.01 | −0.67 * <0.01 |
| LJ R | r p | −0.55 * <0.01 | −0.34 * 0.03 | −0.57 * <0.01 | −0.39 * 0.01 | −0.66 * <0.01 |
| IMTP | r p | −0.15 0.36 | −0.15 0.34 | −0.25 0.11 | −0.30 0.06 | −0.30 0.06 |
| Relative IMTP | r p | −0.50 * <0.01 | −0.18 0.25 | −0.54 * <0.01 | −0.24 0.13 | −0.63 * <0.01 |
* Significant (p < 0.05) relationship between the two variables.
Table 3.
Stepwise linear regression analysis between the COD speed tests (505 and COD deficit for the left [L] and right [R] legs, IAT) and VJ, PAPw, P:BM, SBJ, left- and right-leg LJ, and absolute and relative IMTP in recreationally-trained men and women (n = 43).
Table 3.
Stepwise linear regression analysis between the COD speed tests (505 and COD deficit for the left [L] and right [R] legs, IAT) and VJ, PAPw, P:BM, SBJ, left- and right-leg LJ, and absolute and relative IMTP in recreationally-trained men and women (n = 43).
| Variables | R | R2 | Adjusted R2 | |
|---|---|---|---|---|
| 505 L | Sex | 0.64 ** | 0.41 | 0.39 |
| Sex, 0–20 m sprint | 0.81 *** | 0.65 | 0.64 | |
| Sex, 0–20 m sprint, Left-leg LJ | 0.85 *** | 0.72 | 0.70 | |
| 505 R | Sex | 0.69 ** | 0.48 | 0.47 |
| Sex, 0–20 m sprint | 0.86*** | 0.73 | 0.73 | |
| Sex, 0–20 m sprint, Left-leg LJ | 0.89 *** | 0.77 | 0.77 | |
| COD Deficit R | Sex | 0.36 * | 0.13 | 0.11 |
| Sex, Left-leg LJ | 0.55 ** | 0.30 | 0.27 | |
| IAT | Sex | 0.68 ** | 0.45 | 0.44 |
| Sex, 0–20 m sprint | 0.87 *** | 0.76 | 0.74 | |
| Sex, 0–20 m sprint, Right-leg LJ | 0.91 **** | 0.82 | 0.81 | |
| Sex, 0–20 m sprint, Right-leg LJ, Relative IMTP | 0.93 **** | 0.86 | 0.84 | |
Note: no variables were entered into the predictive model for the left-leg COD deficit. * = moderate, ** = large, *** = very large, **** = near perfect.
© 2019 by the authors. Licensee MDPI, Basel, Switzerland. This article is an open access article distributed under the terms and conditions of the Creative Commons Attribution (CC BY) license (http://creativecommons.org/licenses/by/4.0/).
Share and Cite
MDPI and ACS Style
Lockie, R.G.; Post, B.K.; Dawes, J.J. Physical Qualities Pertaining to Shorter and Longer Change-of-Direction Speed Test Performance in Men and Women. Sports 2019, 7, 45. https://doi.org/10.3390/sports7020045
AMA Style
Lockie RG, Post BK, Dawes JJ. Physical Qualities Pertaining to Shorter and Longer Change-of-Direction Speed Test Performance in Men and Women. Sports. 2019; 7(2):45. https://doi.org/10.3390/sports7020045
Chicago/Turabian StyleLockie, Robert G., Brett K. Post, and J. Jay Dawes. 2019. "Physical Qualities Pertaining to Shorter and Longer Change-of-Direction Speed Test Performance in Men and Women" Sports 7, no. 2: 45. https://doi.org/10.3390/sports7020045
Note that from the first issue of 2016, this journal uses article numbers instead of page numbers. See further details here.