Maintenance of a High-Voltage Overhead Transmission Line: Sustainability and Noise Impact Assessment


1
Department of Mechanical and Industrial Engineering, University of Brescia, 25128 Brescia, Italy
2
Department of Industrial Engineering, University of Padova, 35131 Padova, Italy
3
AOT Torino, Terna Rete Italia S.p.A., 10154 Torino, Italy
*
Author to whom correspondence should be addressed.
Sustainability 2018, 10(2), 491; https://doi.org/10.3390/su10020491
Submission received: 15 January 2018
/
Revised: 5 February 2018
/
Accepted: 7 February 2018
/
Published: 12 February 2018
Abstract
:Overhead high-voltage lines are a common choice for power transmission, but their planning, installation and management are often challenging tasks because of the surrounding public interest and of their importance as critical infrastructures. This is particularly true in the case of industrial installations requiring a high continuity of service. The working group formed by the University of Brescia (UniBS), the University of Padova (UniPD), and Torino Transmission Operating Area (AOT) of Terna Rete Italia S.p.A. (Terna) has studied an innovative solution featuring a remotely-operated switchgear mounted directly on the trellis holding the conductors. This strategy reduces visual impact, land use and vulnerability of the system to weather adversity, but noise exposure of the population requires appropriate study. This work introduces a new technical solution, discusses its benefits, and assesses the audible noise impact of the improved transmission line, considering the combined effect of switchgear action and corona discharge around the conductors. The sound emission data are fed as input into a sound propagation software enabling evaluating the noise perceived by people living in the neighborhoods. A mitigation solution is proposed and analyzed.
1. Introduction
High- and ultra-high-voltage infrastructures are the future of electrical grids for their increased capacity, transmission distance and efficiency. A recent work by Lienert et al. [1] presents the emblematic case of Switzerland, which, after the Fukushima accident, is facing the transition from nuclear to renewable sources, a change requiring grid adaptation, new energy storages and new connections. However, energy infrastructures are generally regarded with suspicion by the involved population, often bound to a “not in my backyard” mentality [2]: a paradox arises in the switch to sustainable sources of energy generating new sustainability challenges for the transmission lines transporting it. An analysis of the burdens coming with overhead transmission lines is presented in [3], where the authors take in consideration technical aspects (transmission loss and infrastructure costs), impact on the population (noise, electromagnetic fields and interruption of supply) and environmental effects (visual intrusion, ecosystems and land use). Population perception is a key-word in planning new energy assets [4], but the matter is so sensitive that other concepts, such as trust [5] and political ideology [6], can be drivers of success or failure stories.
Like water supply, public health, transportation and other energy-related assets, transmission lines are part of the so-called “critical infrastructures” in that they provide essential services for the economy and functioning of a society. Resilience, intended as adaptive capacity, damage limitation and recovery speed, is therefore a most desirable quality in the power supply network [7]. Every service interruption has a cost of non-disposed electricity which has been analyzed in several literature studies for different types of consumers [8], such as households [9] and tertiary sector [10]. In some cases, the consumer may even claim compensation following unplanned electricity outages. In this context, it is evident how the study of efficient fault diagnosis strategies [11] is another interesting path of research.
The work cluster composed by the University of Brescia (UniBS), the University of Padova (UniPD) and Torino Transmission Operating Area (AOT) of Terna Rete Italia S.p.A. (Terna) has recently been active in developing projects for the electric power transmission system, the main driving force being to increase service reliability while complying with the very stringent national limits regarding human exposure to low frequency electric and magnetic fields [12]. Several solutions are possible in this respect, such as designing innovative line configurations and reducing the distance between phase conductors along the span, for example by means of rod compactors [13]. However, these solutions are generally characterized by high-voltage gradients on the conductors, responsible for generating the so-called “corona discharge”, which can result in power loss, radio-interference, emission of visible light and ozone, and emission of noise.
In the case study at hand, the introduction of a remotely operated tele-switchgear (TSG) is anticipated, which is able to ensure continuity of service to the most demanding users and to disconnect a mesh in the case of maintenance. The innovative installation of the switchgear on the trellis holding the conductors allows considerably decreasing the land use, limiting the visual intrusion, reducing power outages and increasing the resilience of the system, whereas conventional installations would require the construction of large-footprint stations. However, trellis-mounting may have a downside in the noise impact of such devices, whose operation, even if sporadic, produces noise. Being the sound source “visible” to the receivers, noise is more likely to reach them directly, without being attenuated by vegetation, terrain orography or buildings. The impact of the new solution must therefore be carefully evaluated and, if required, mitigated.
According to the Night Noise Guidelines for Europe developed by the World Health Organization (WHO) [14], noise is the second source impacting on health after poor air quality. By contrast, environmental noise is sometimes referred to as the “forgotten pollutant”, because other forms of pollution have been given priority in mitigation policies in the past [15], although it has been proven that this factor cannot be neglected in the evaluation of the environmental quality [16]. Several studies show how the prolonged and uncontrolled exposure to audible noise can result in health issues, even at low intensity. The effect of environmental disturbances on sleep [17] and the influence of low-frequency noise on people’s quality of life [18] have been considered in the literature. In the latter study, the authors use the “Procedure for the assessment of low frequency noise complaints” by the UK’s Department for Environment, Food and Rural Affairs (DEFRA) [19] to perform a quantitative evaluation of the low-frequency noise levels, and, in recognizing the complexity of the problem, they envisage the need for future research to establish solid correlations. Impulse noise, consisting of loud, sharp sound spikes, is another particularly dangerous type of noise because of its violence and of its indirect effects, such as sudden awakenings during the night sleep [20].
To evaluate acoustic noise, accurate methods are necessary to verify the conformity to the limits specified by international guidelines and relevant legislation, and to comply with the rules of best practice from both technical and economic viewpoint. No mathematical models are available to predict the noise generated by switching devices, which must therefore be measured experimentally. On the other hand, semi-empirical methods for the prediction of the corona discharge noise can be found in the technical literature. Developed during the 1960s–1980s by electrical utilities or research institutes of many countries, they have been compared with each other and thoroughly discussed within international organizations, such as the International Council on Large Electric Systems (CIGRE) and the Institute of Electrical and Electronic Engineers (IEEE). Recently, the spread of high-voltage lines has renewed interest in this topic and original studies on models [21,22] and evaluation methods [23] have been proposed.
The aim of this paper is to present the benefits of the planned TSG installation solution and to predict the noise impact of the modified transmission line, by developing a noise spreading model that considers the contributions of both the switching device and the corona effect around the conductors. The study features the experimental characterization of the switchgear, which, to the authors’ knowledge, has not yet been sufficiently detailed in the scientific literature. The corona noise emission has been estimated by means of a self-developed MATLAB® code [24] whose recent validation provided encouraging results [25]. The power level values of the two types of noise source have been fed as input into a specialized software, which made it possible to predict the outdoor sound pressure levels of the whole transmission system, and to simulate the effect of possible mitigation measures.
2. Materials and Methods
2.1. High-Voltage Tele-Switchgears: A Small-Footprint Solution
Drivers for the improvement of electric power lines are enhanced control, capacity to operate with high current, reliability and adaptation to different energy sources [26], and they determine the search for more and more performing switchgears. New tools available nowadays allow for more accurate estimation of transient overvoltages, thus limiting dimensions, weights, impact and costs without sacrificing performances [27]. However, there is more to consider when making a decision: to operate on network infrastructures with sustainable actions means to conceive technical solutions ensuring the highest possible degree of integration with the territory.
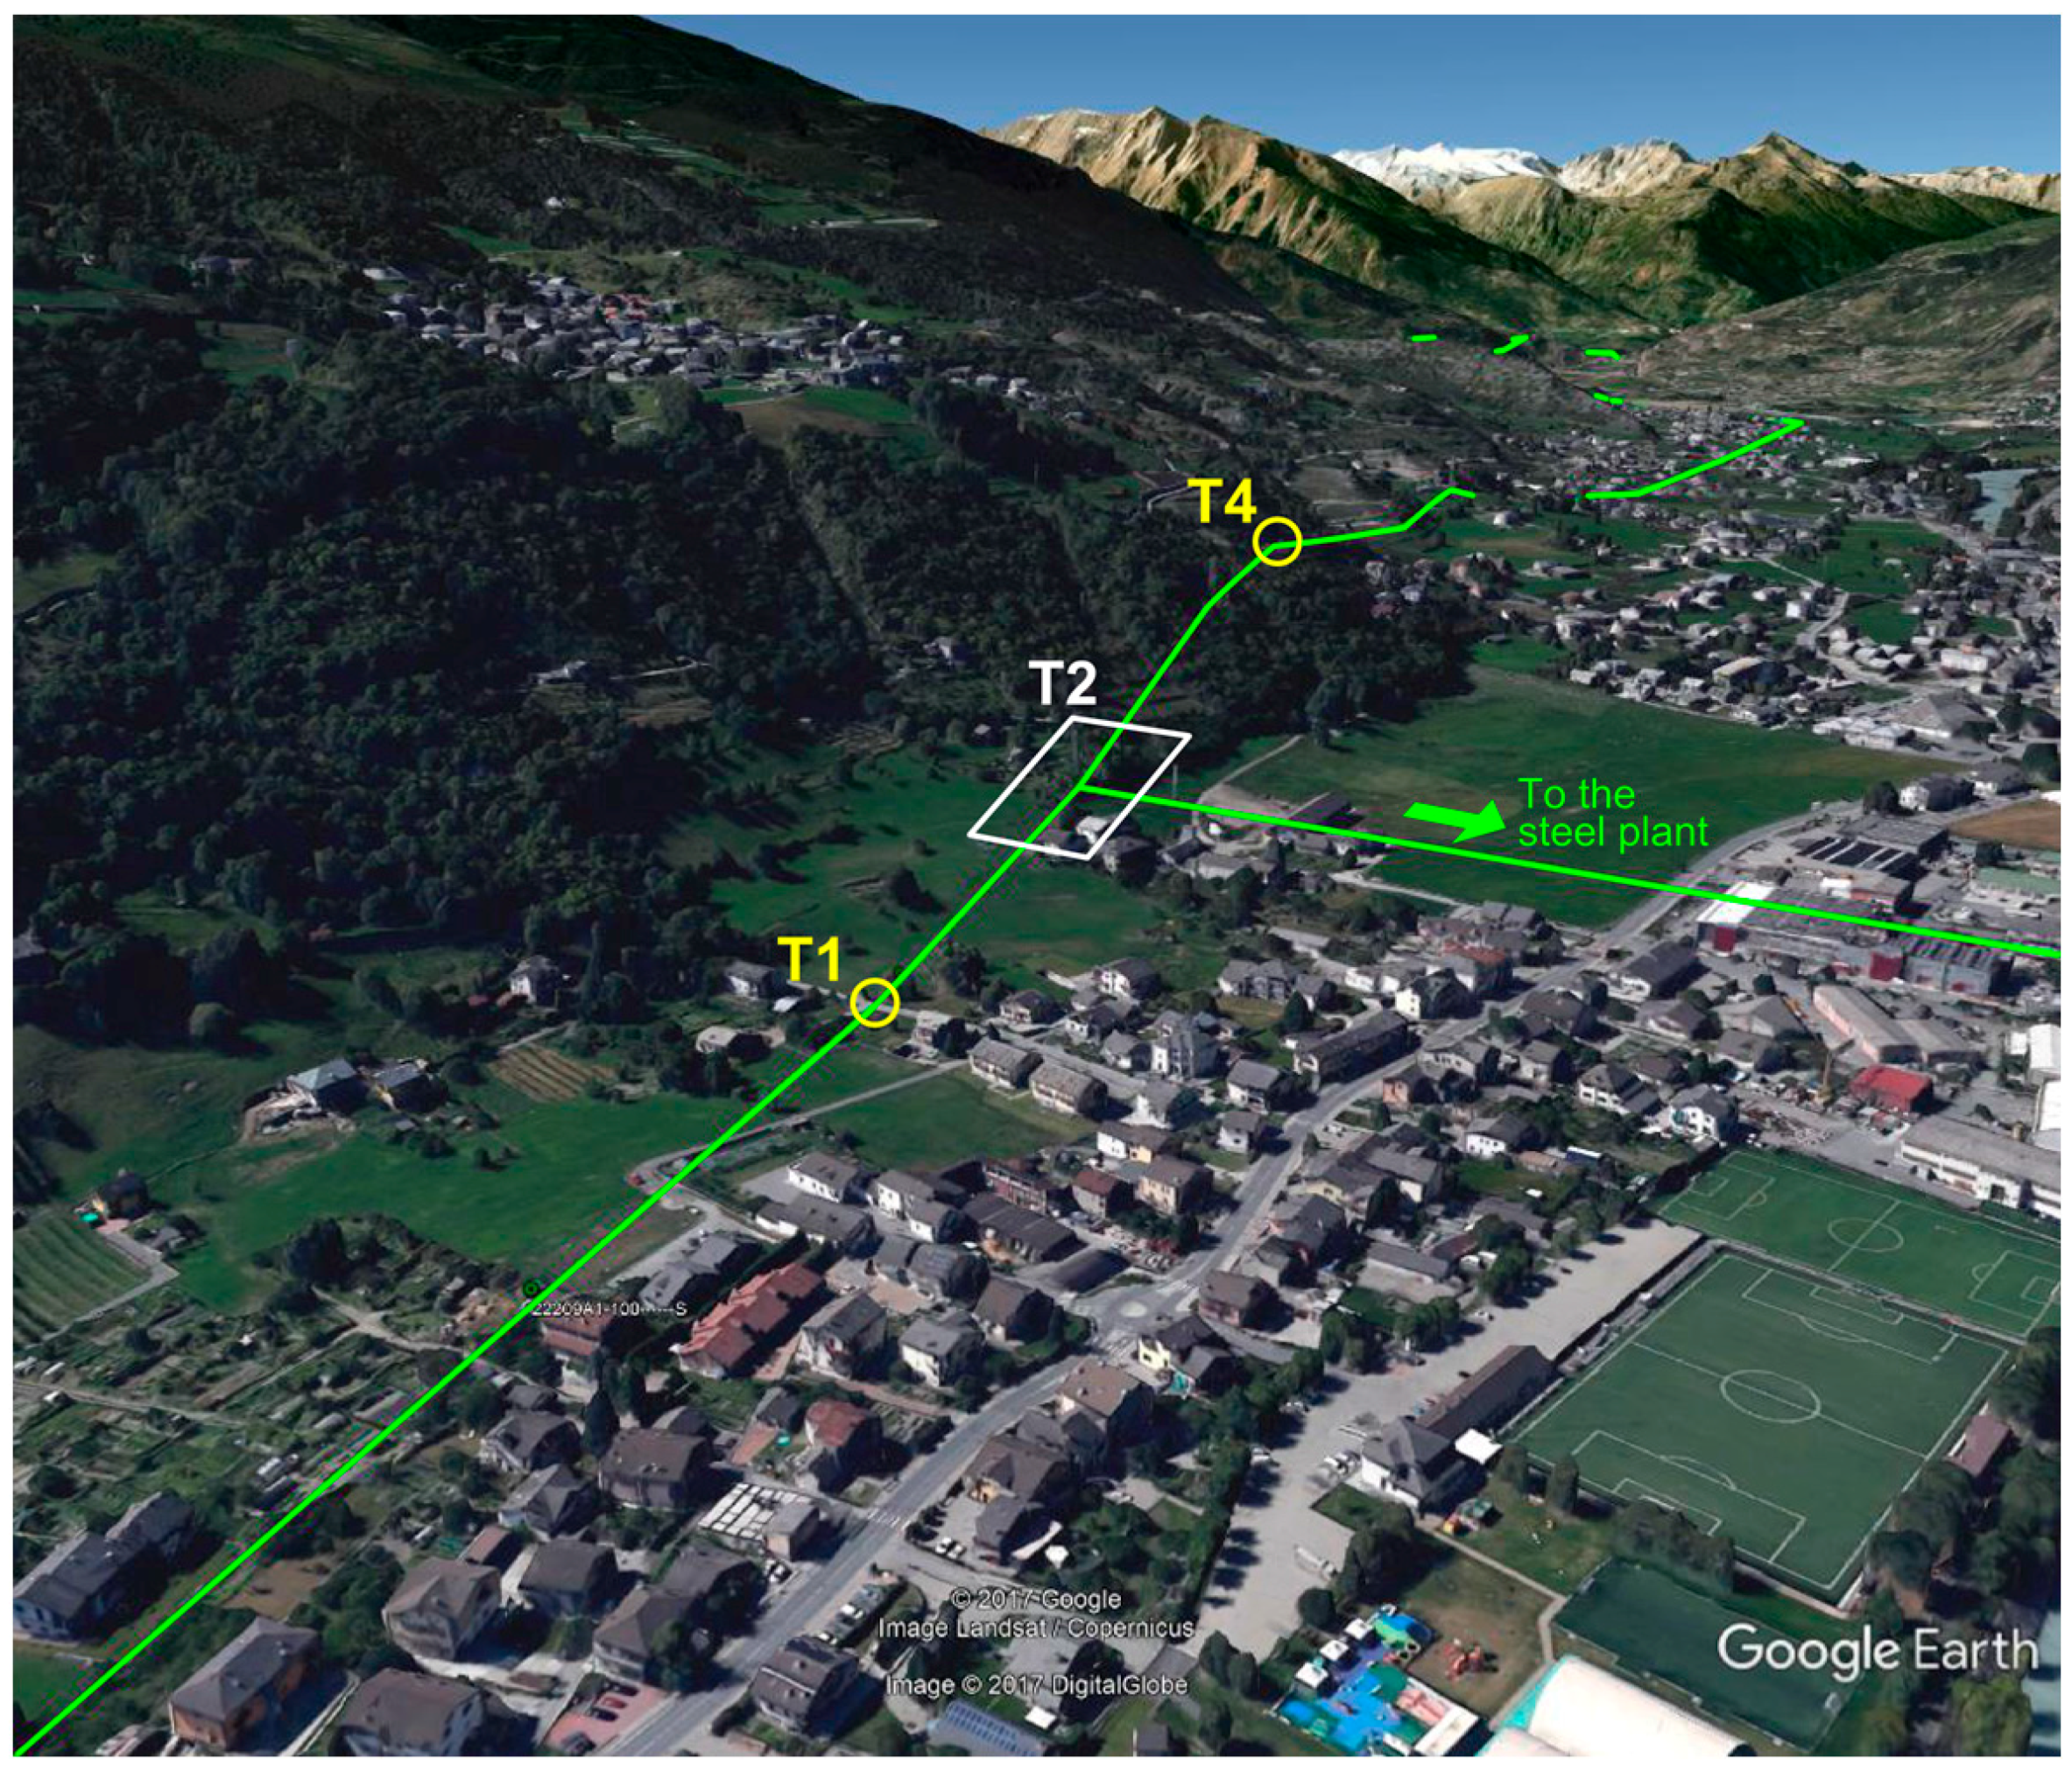
The proposed case study features a transmission line running adjacent to a steel plant, an energy-consuming factory using continuous casting (Figure 1). The industrial site is close to Aosta, Northwest Italy.
The infrastructure requires a systematic maintenance intervention on damaged, old parts, including supports and maneuver devices, which must be replaced with new components respecting the current state-of-the-art in terms of technology, safety and sustainability.
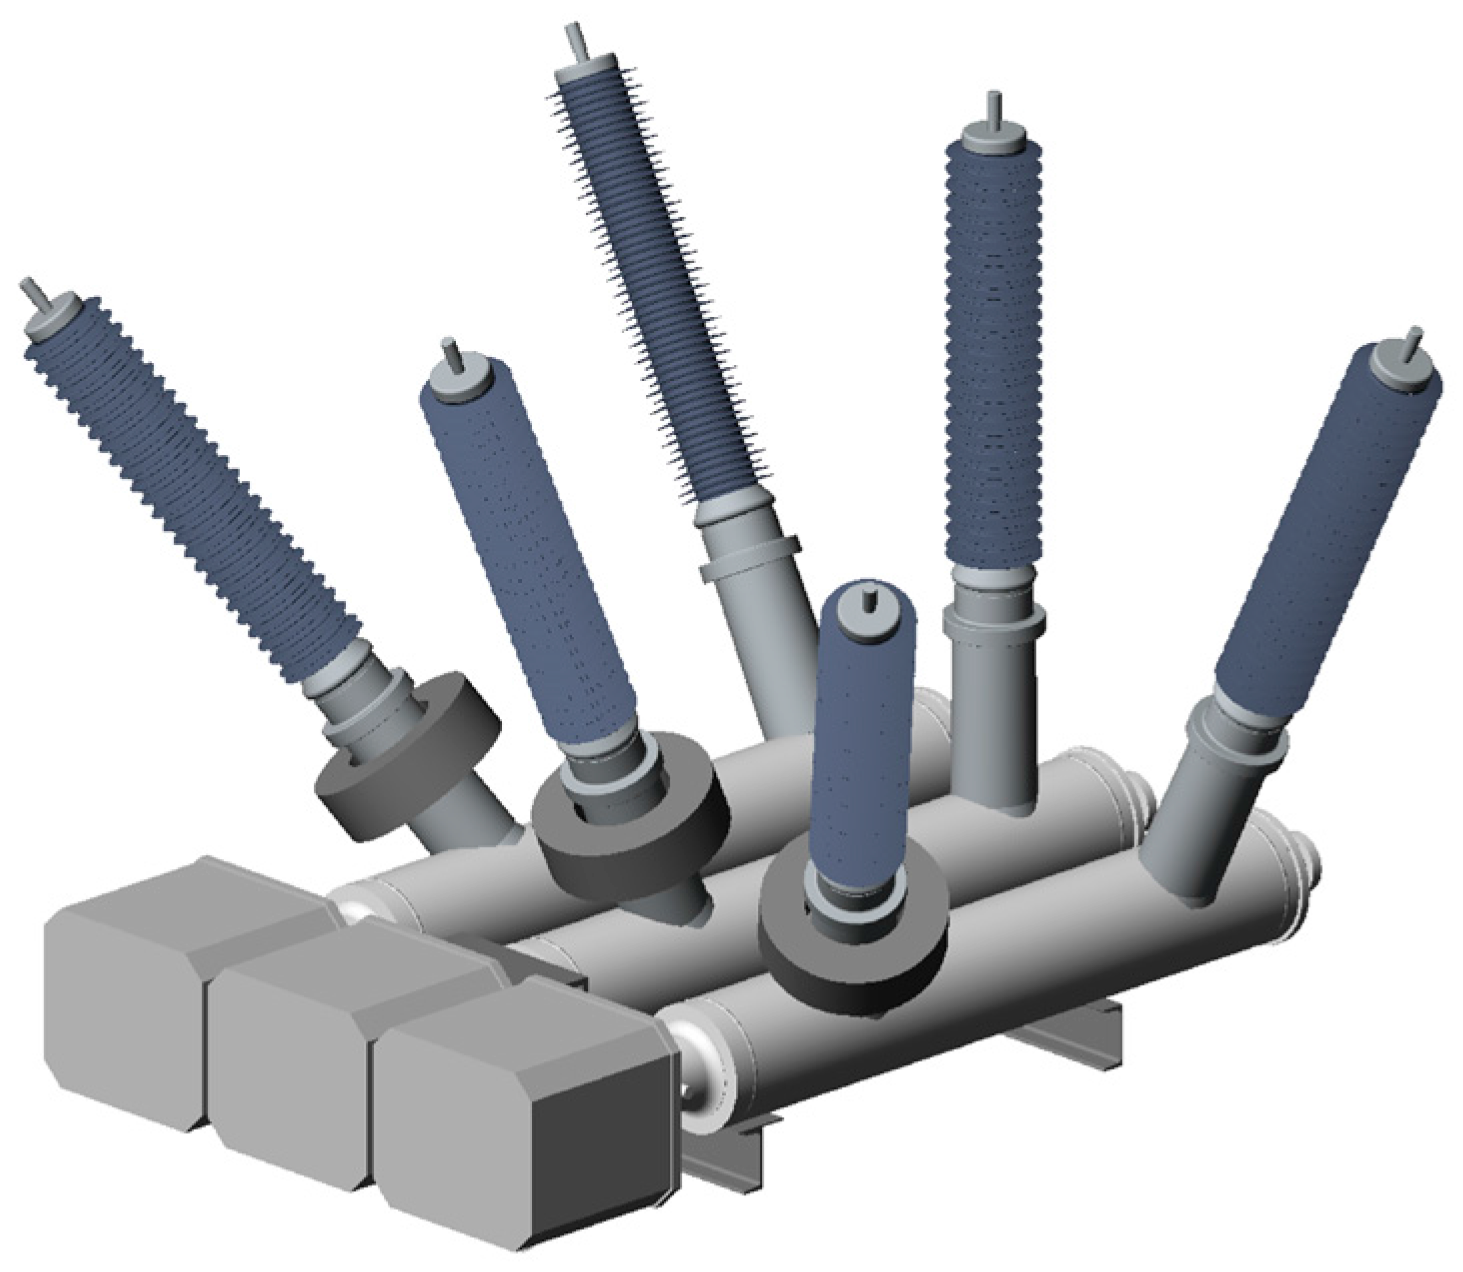
The TSG chosen by AOT Torino for this purpose, shown in Figure 2, is characterized by ultra-fast switch time, versatility and quick failure identification. Considerable technical benefits are obtained from the replacement: remote control, whereas the currently installed devices can be operated only manually, capability of interrupting currents up to 50 kA, and possibility to easily integrate future expansions. The mechanical linkage of the new device is enclosed in a SF6 gas-insulated housing, thus preventing the junctions from freezing-up and electric arcs from striking in atmosphere. Consequently, the maneuverability is always guaranteed and the risk of fire, particularly high near wooded areas, is avoided.
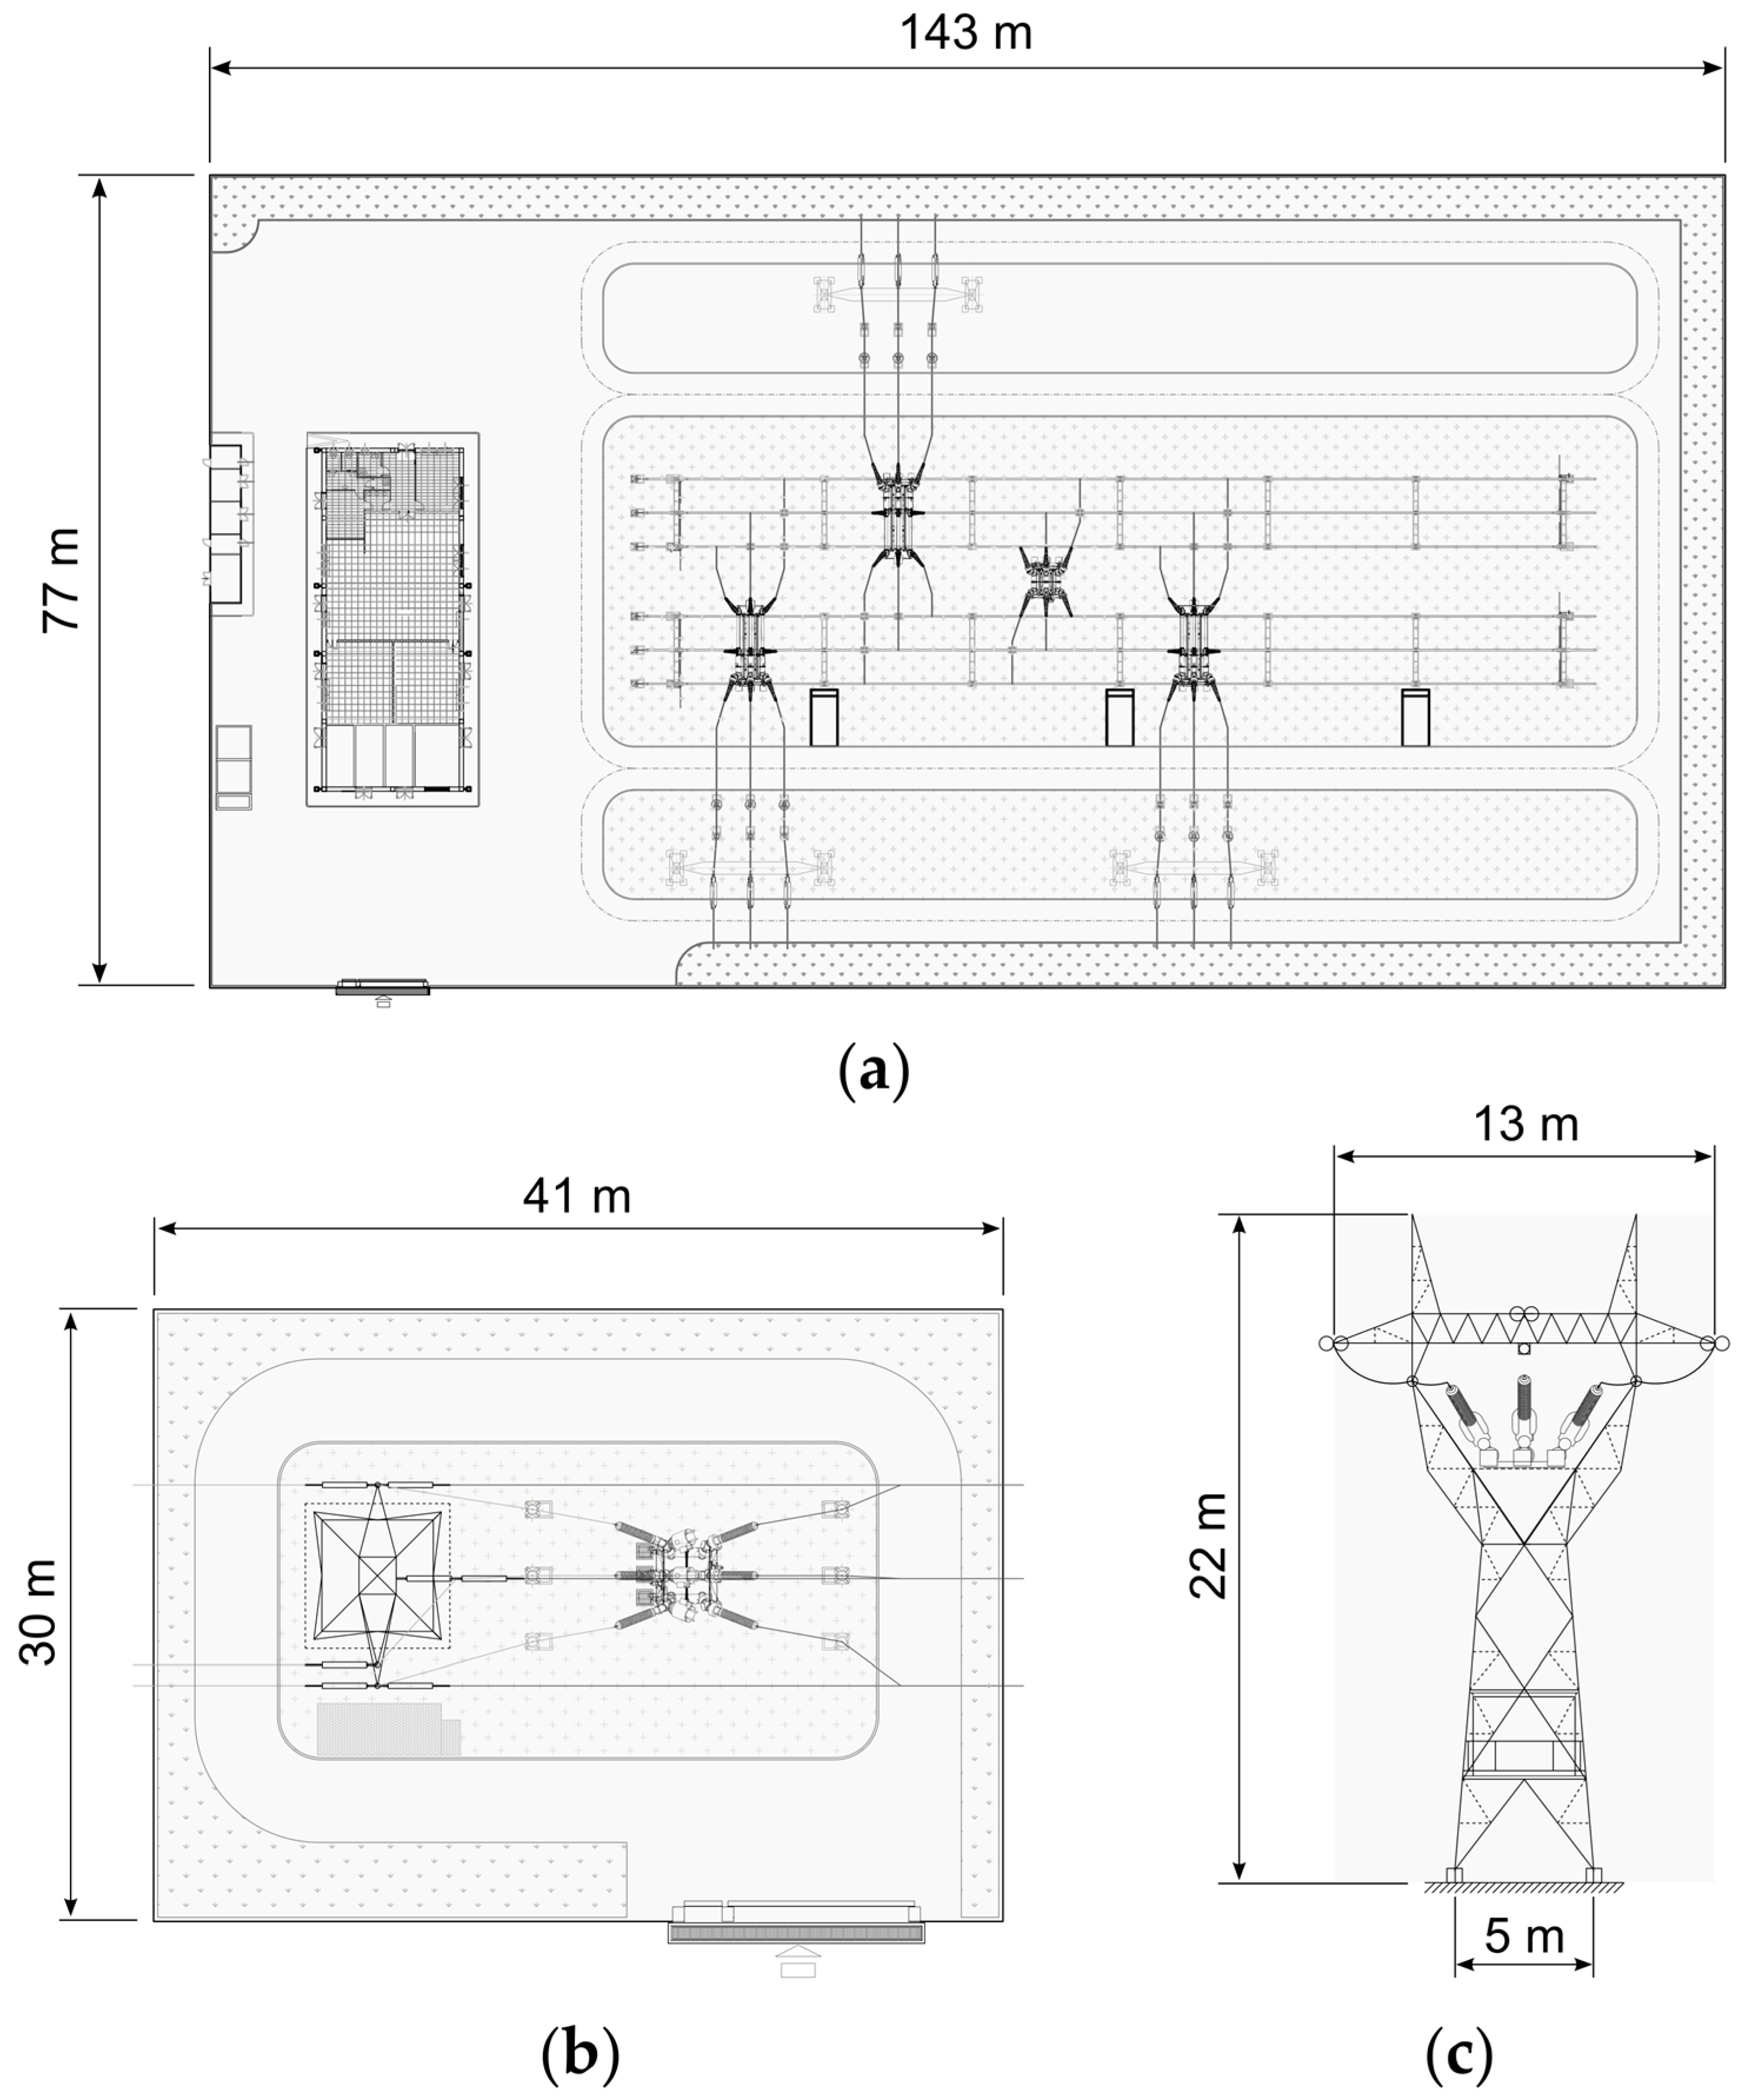
With reference to Figure 1, a first solution to perform the intervention would be to build a standard national transmission network station in correspondence of node T2 (conventional solution, Figure 3a). The station should follow the design regulations prescribed for this kind of installation, resulting in a large, invasive and expensive building, to fabricate which a complex authorization process would be necessary. Worst of all, intervening on node T2 would imply the prolonged halt of the factory plants. Therefore, operations on lateral trellises are envisaged instead.
Two substations could be installed in correspondence of T1 and T4 structures, as shown in Figure 3b. However, this solution would again require creating two visually intrusive structures around the maneuver equipment, unsheltered from extreme weather conditions and possibly subject to snow cover, using a large amount of land (≈2500 m2 in total) and requiring an equally long authorization process.
To overcome the limitations of conventional installation options, an innovative solution is proposed, consisting in mounting the TSG directly on the trellis (Figure 3c). The trellis, bound to be maintained anyway, would be replaced by a similar delta-shaped tower whose top can support the TSG and whose body can house a kiosk, designed to enclose the remote-control devices. Table 1 summarizes the main characteristics of the alternatives shown in Figure 3. It can be observed that the solution consisting in the installation of TSGs on trellises is the most convenient in terms of visual intrusion, land use, resilience, cost-saving and reduced planning permission. Moreover, the skyline of the delta-shaped tower suitable to support the TSG is quite similar to the silhouette of conventional towers used in 220 kV lines, with an even smaller top width. On the other hand, considering the elevated position of the TSG, its noise impact in the case of switching operations requires analysis, since sound is more likely to reach the receivers directly, without attenuation by trees, terrain orography or built structures.
From an acoustic point of view, the TSG is a “passive” component most of the time, and it becomes audible only during switching operations, when it produces a loud transient noise. No models are available in the literature to predict the sound energy level of similar devices during operation; for this reason, in accordance with good practice rules, the acoustical characterization of this apparatus must be performed through experimental measurements on an identical system. The description of the measurement campaign and of the sound emissions for such device will be given in the next subsection.
2.2. Experimental Characterization of the Tele-Switchgear Noise
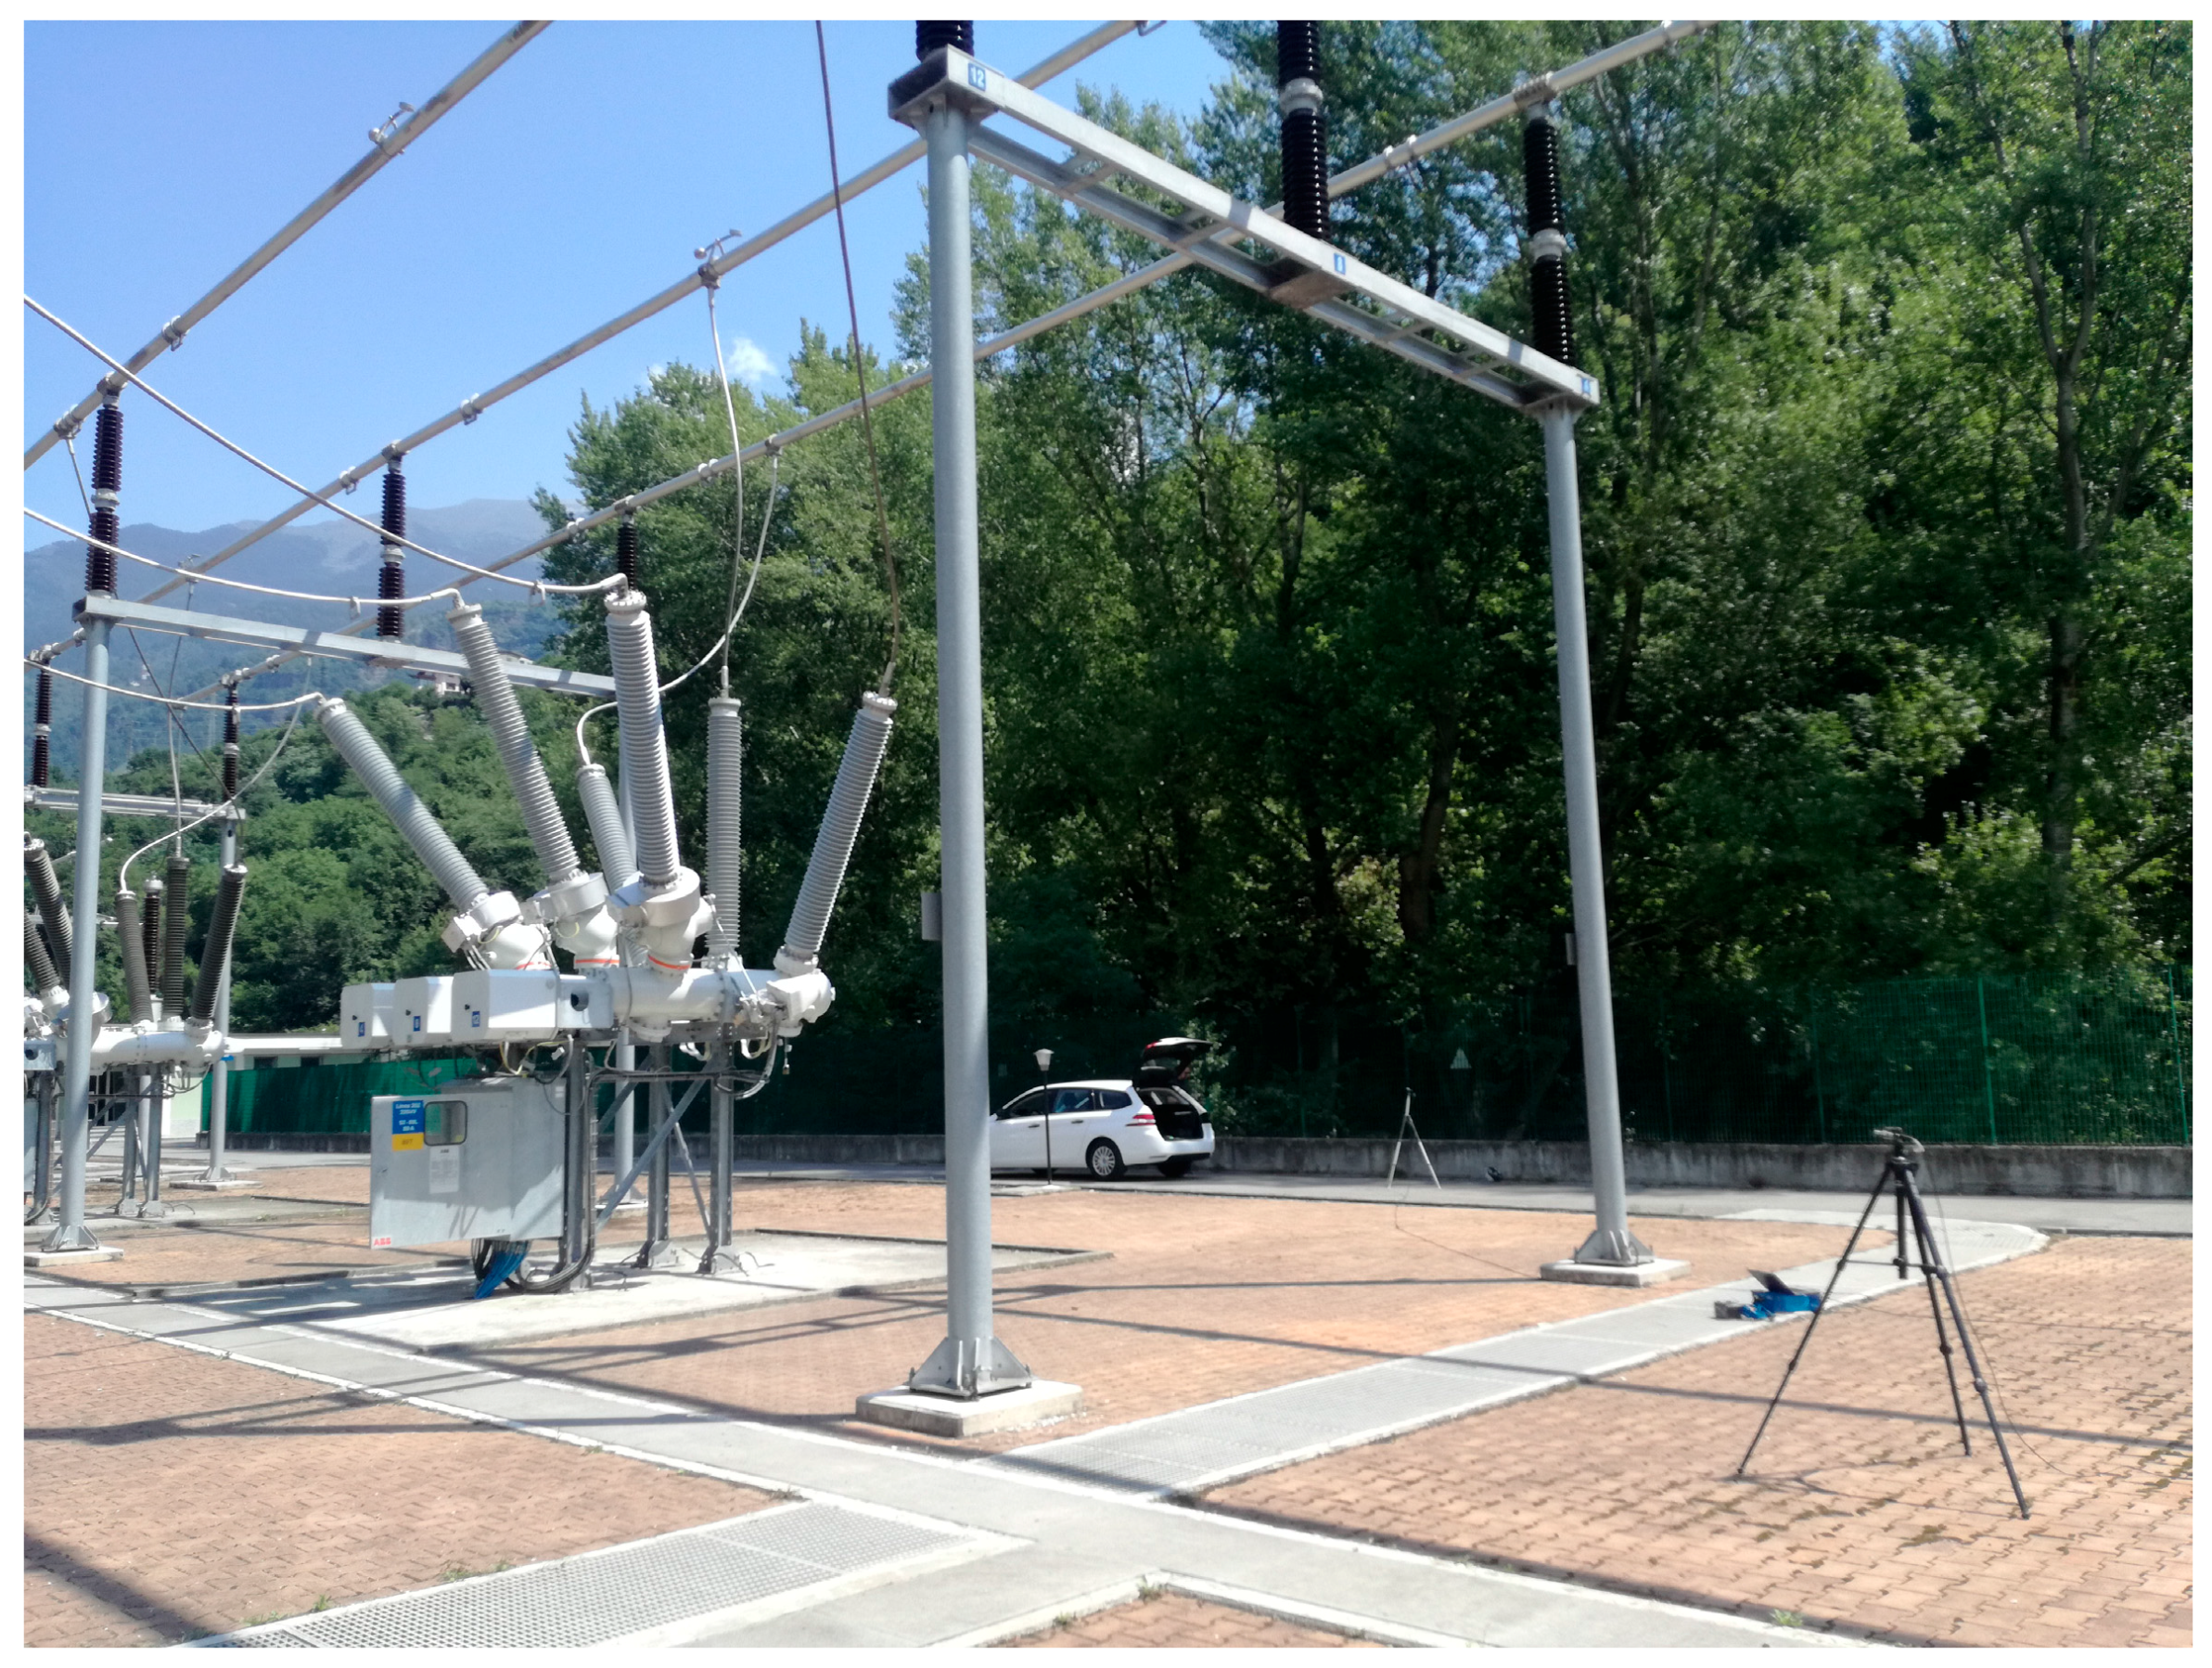
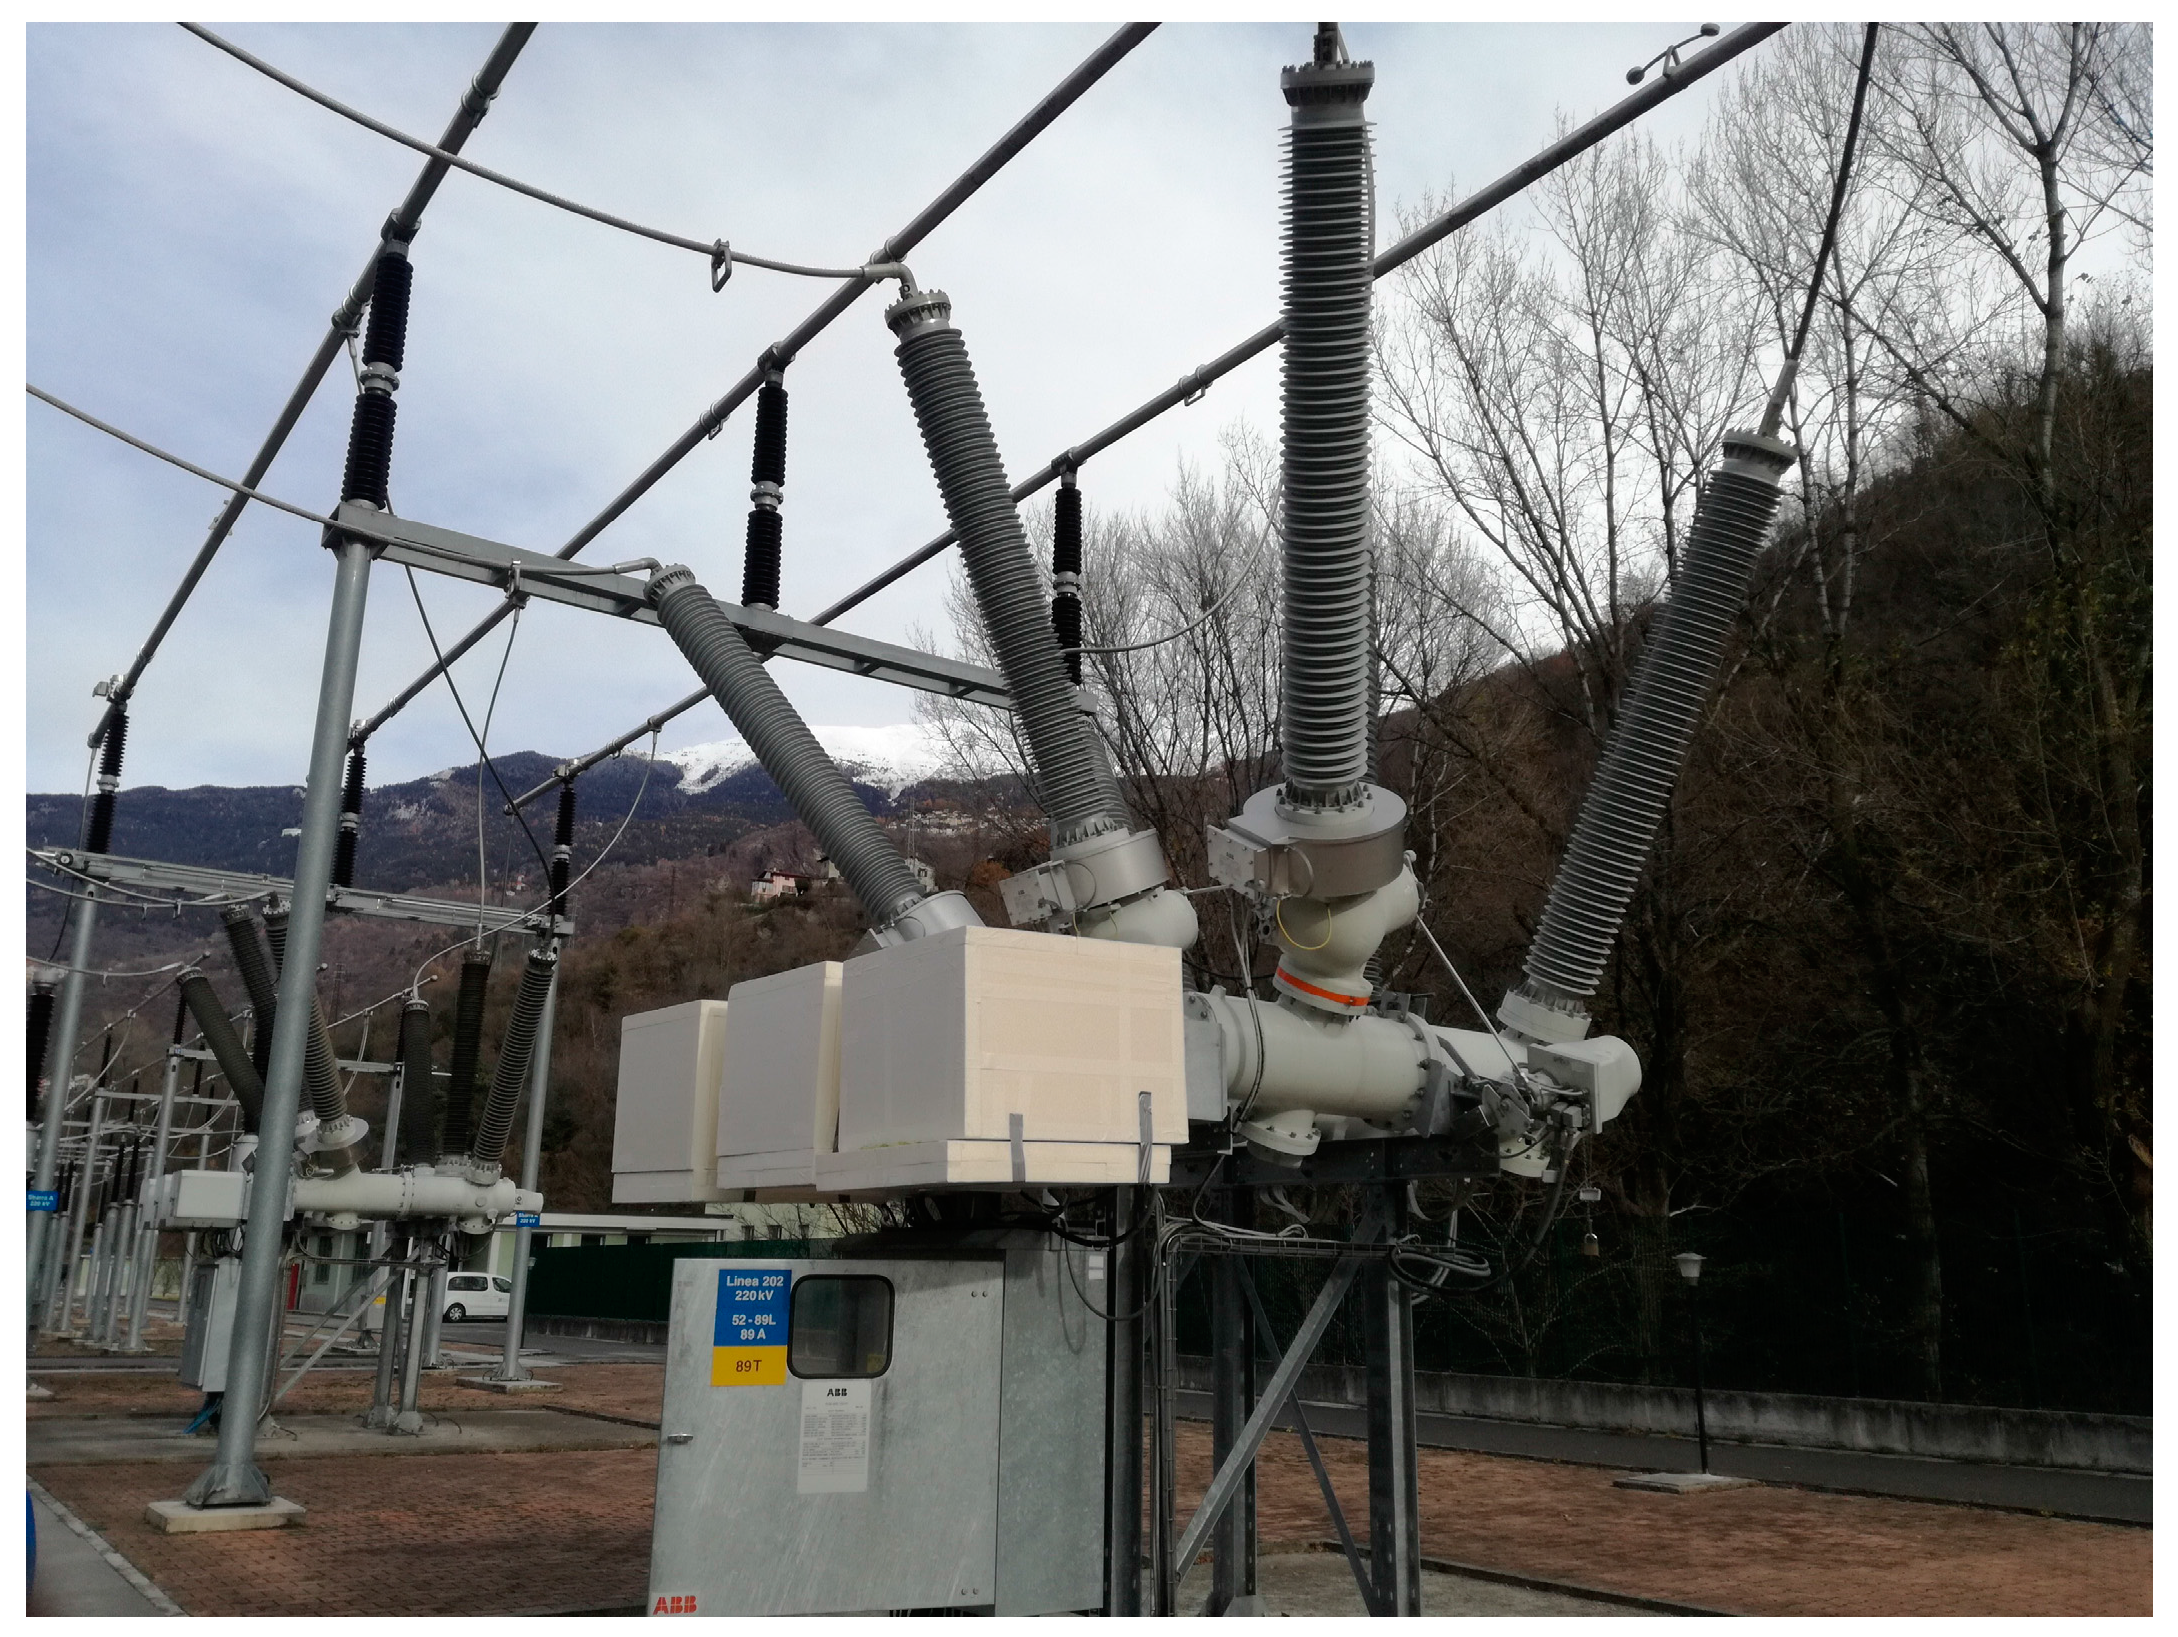
The measurement campaign to characterize the acoustic emission of the TSG has been made at one of the Terna high-voltage stations close to Brescia, Northeast Italy, where two TSGs are installed (see Figure 4).
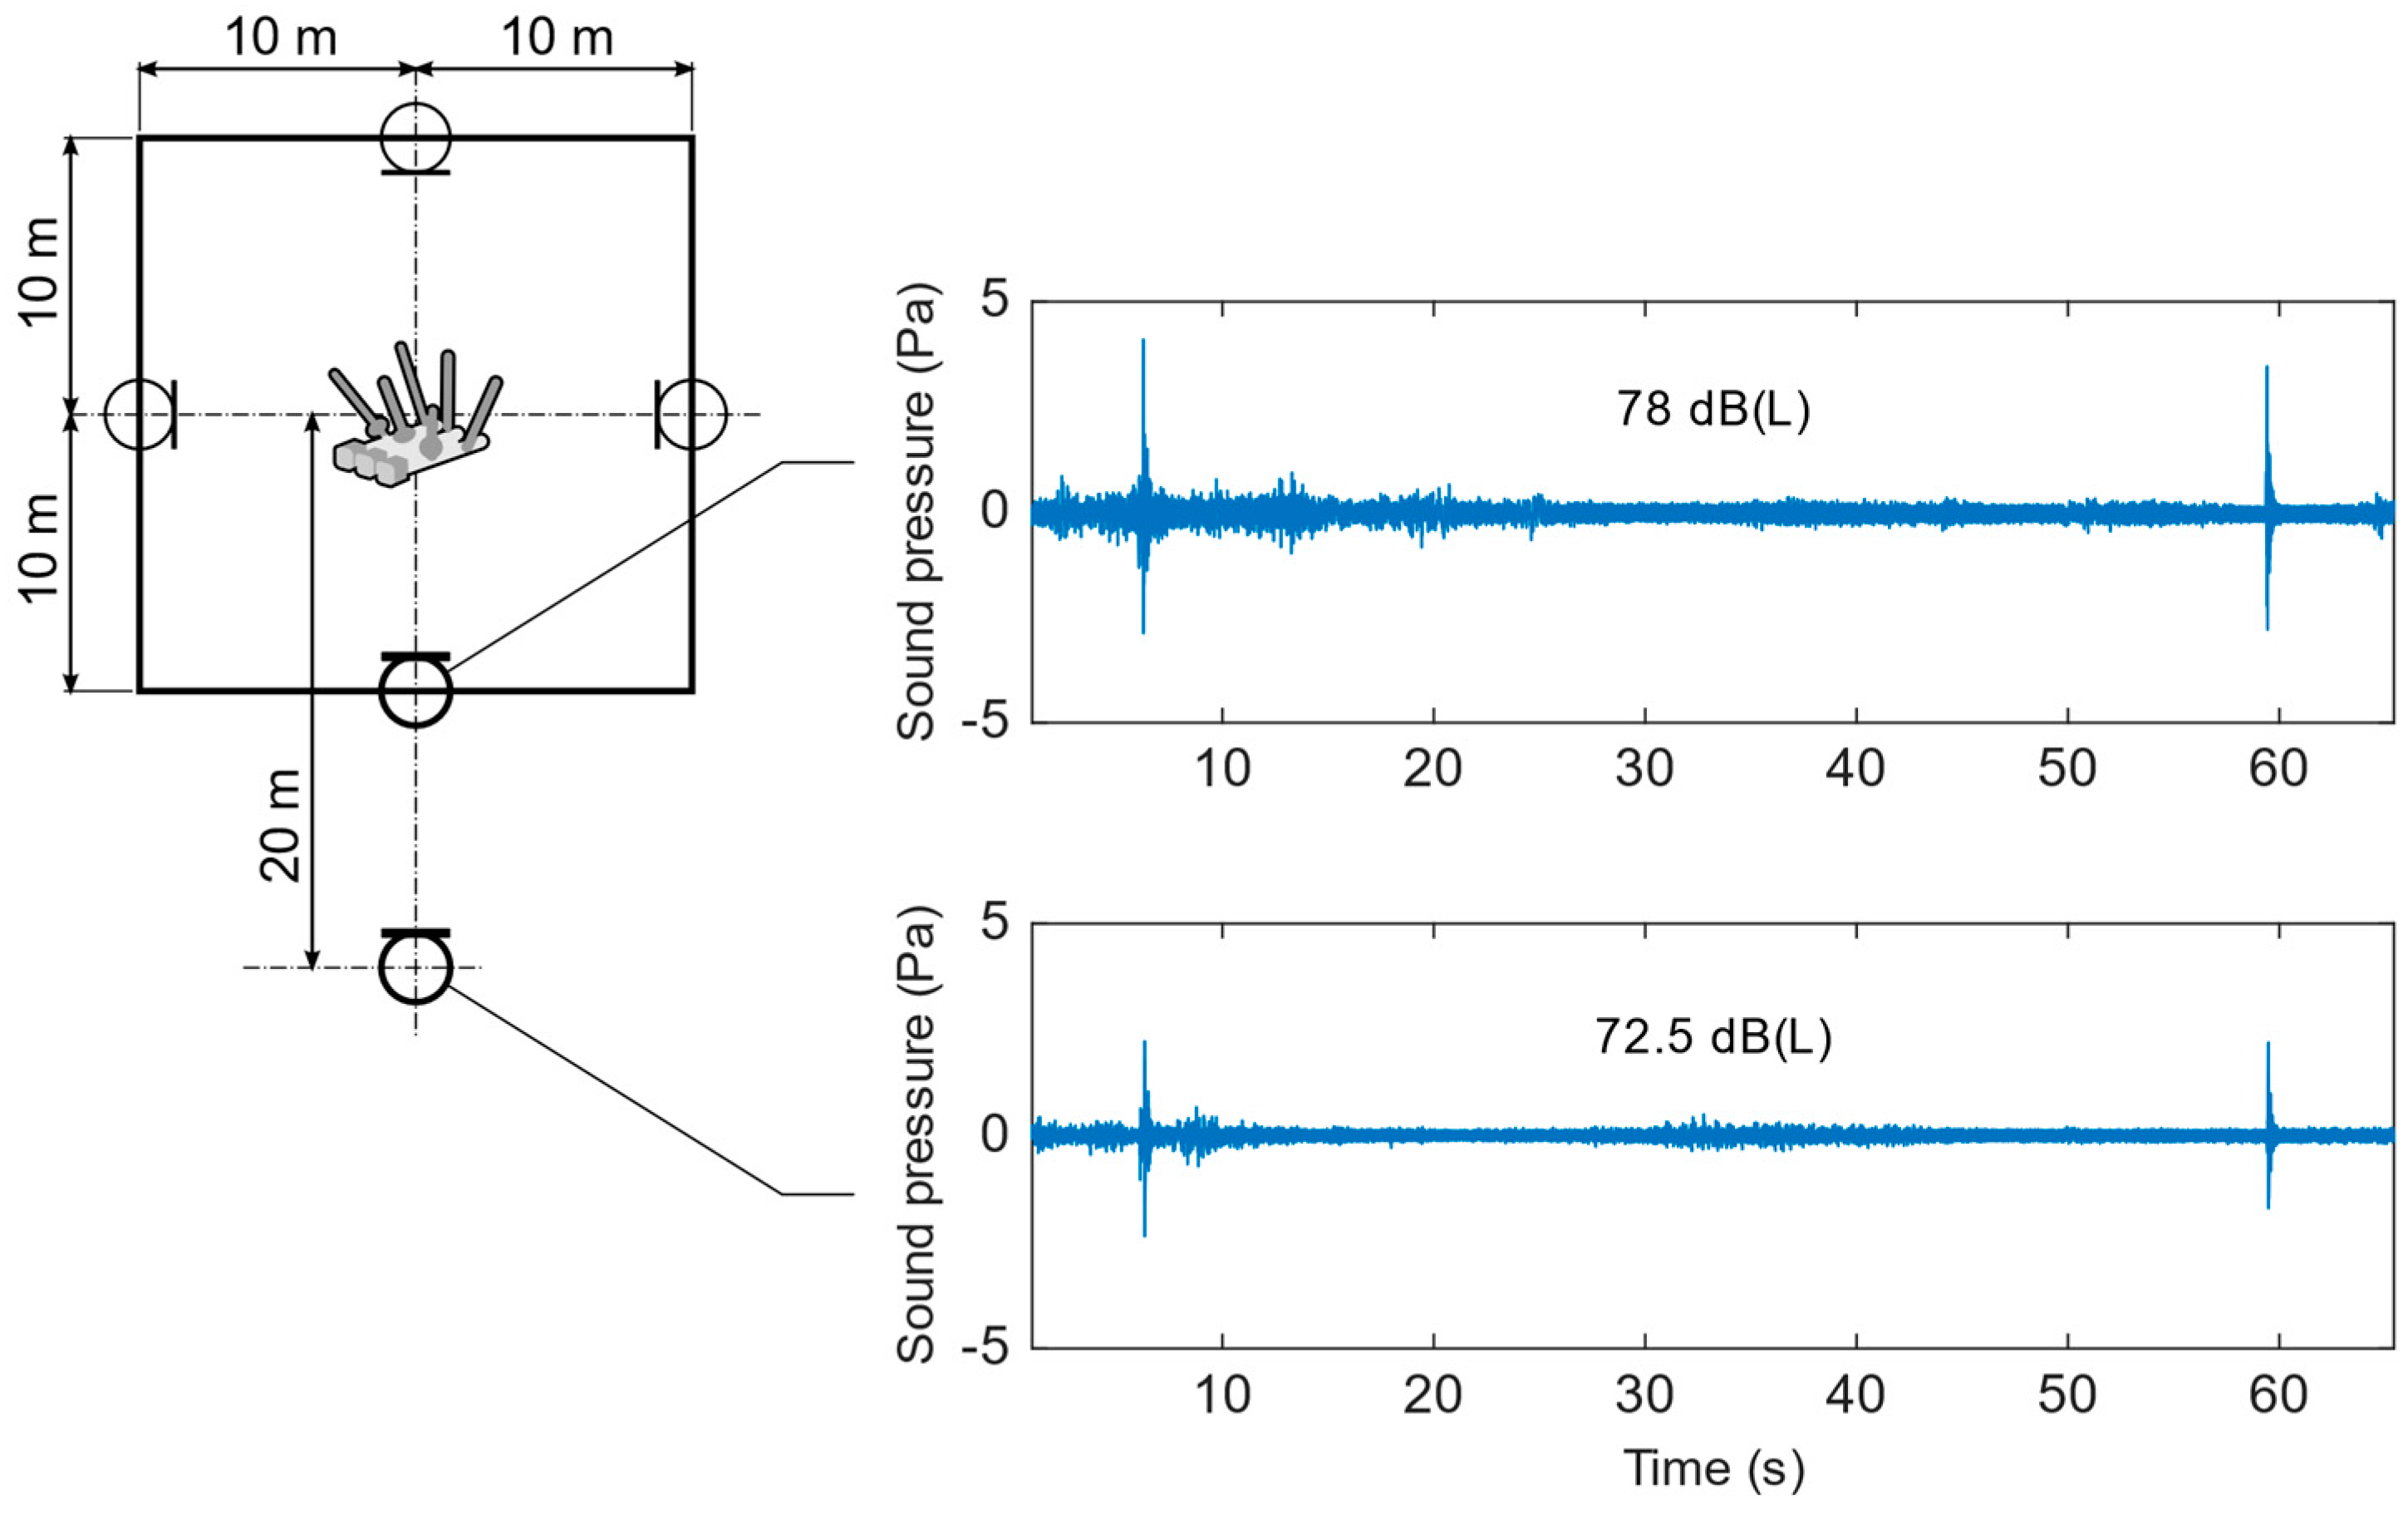
A sound source emitting transient noise is characterized through its energy level determined by sound pressure level measurements according to ISO 3746:2010 standard [28]. The TSGs are placed open-air, essentially in free-field conditions, and over a hard surface. An Oros OR36 multichannel analyzer and two Brüel & Kjær Type 4189 microphones have been used. The control surface prescribed by the standard should be a hemisphere or a parallelepiped. The latter configuration has been chosen, with face-center microphones placed 10 m away from the device: however, it is worth noting that it has not been possible to make measurements above a height of 3 m for safety reasons, thus the upper face of the control surface could not be completed. A sketch of the measurement positions is shown in Figure 5: sound pressure level measurements along the main axes of the TSG showed that the source can be considered omnidirectional and that the decay with distance is typical of a point source (that is, the sound pressure level decreases by 6 dB per doubling of distance).
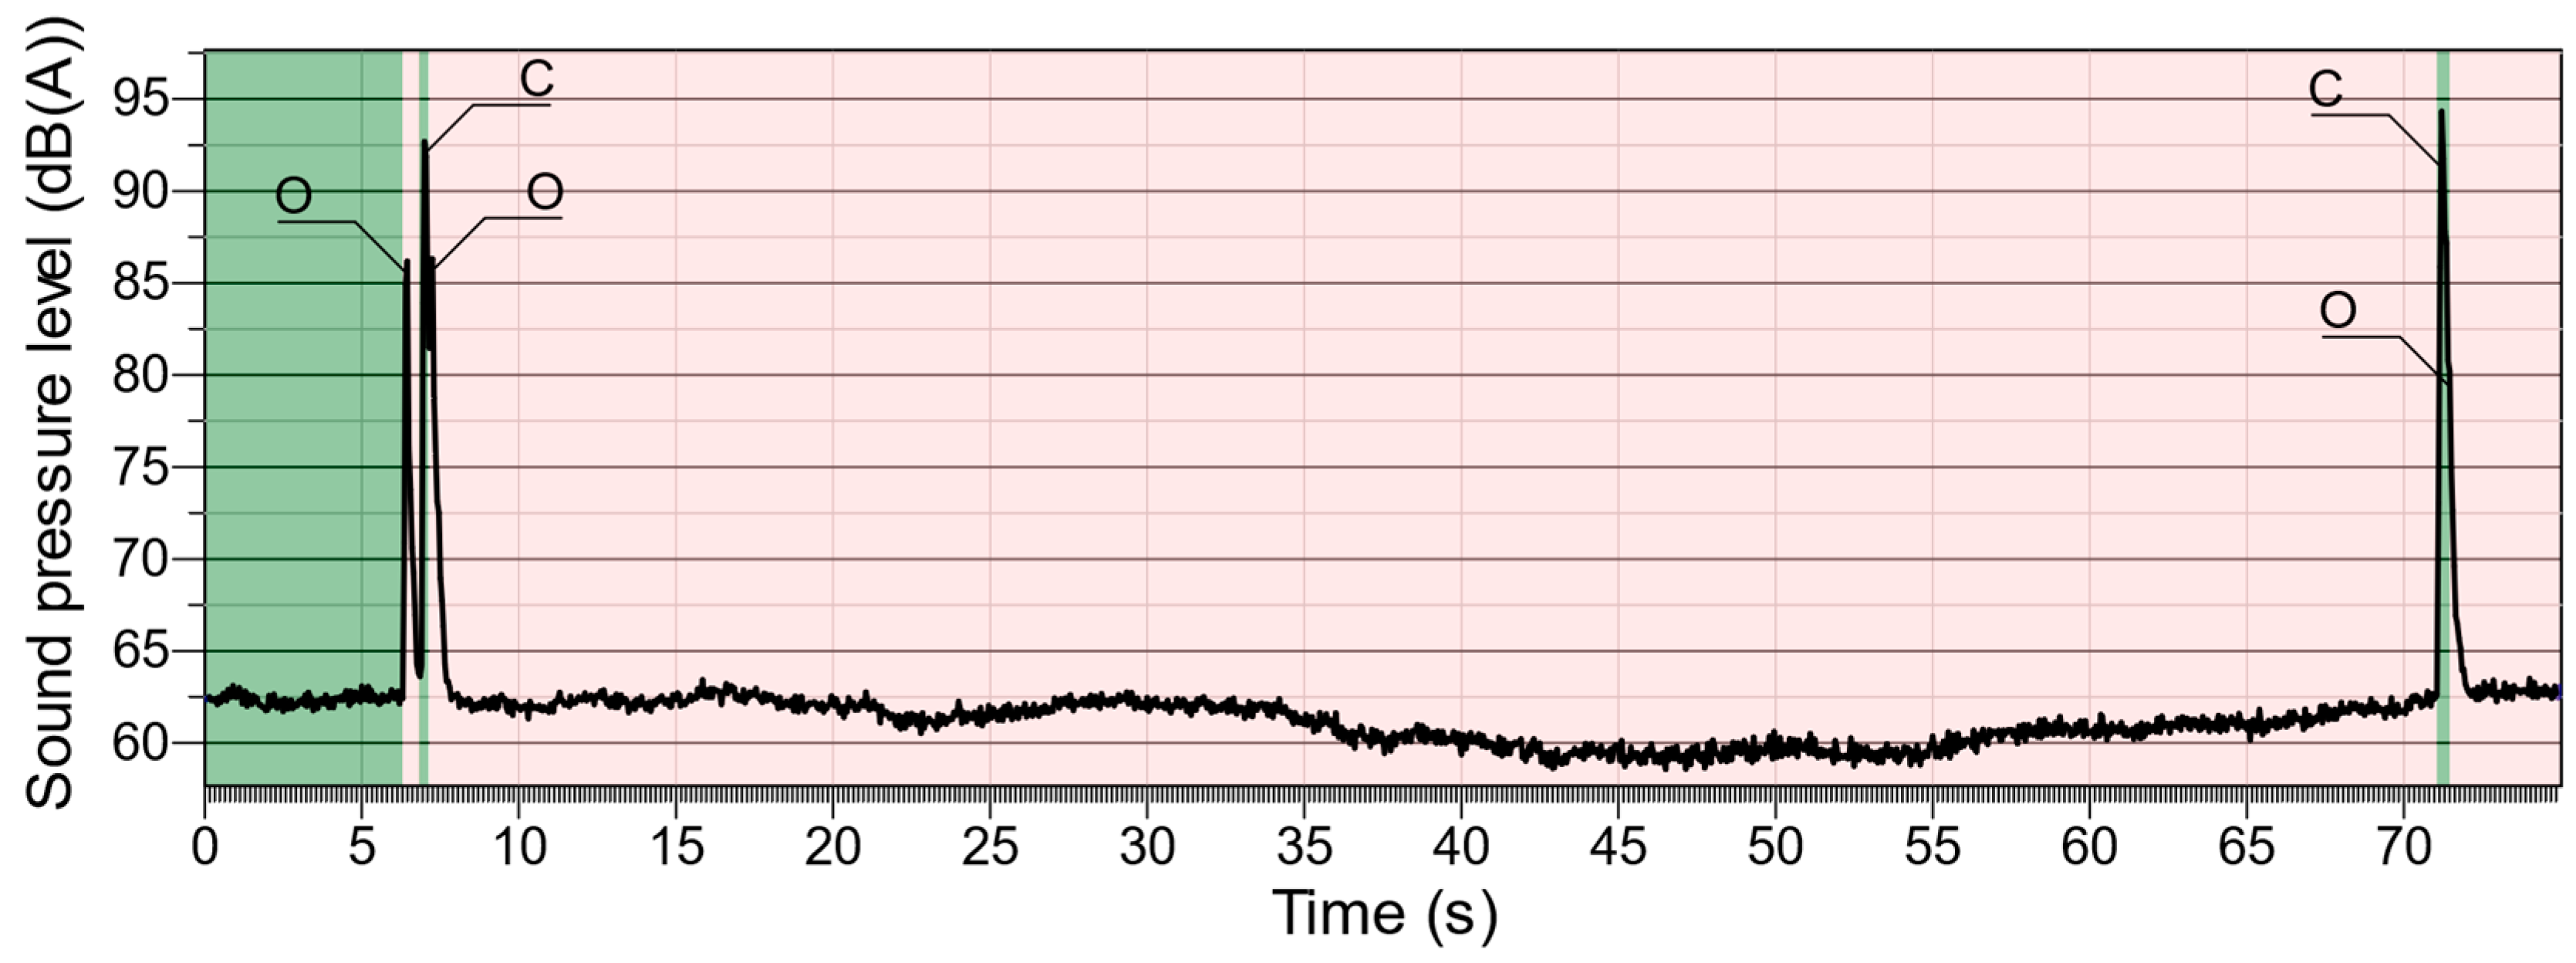
The test sequence adopted for the measurements is characterized by two events. The duration of each noise event is about 1 s and the shortest interval between two consecutive operations is 60 s. Several measurements have been repeated on the same test sequence, providing similar values of the measured quantities for the different positions and for the two events. Figure 6 shows an example of A-weighted sound pressure level measured during the execution of the test sequence using the “Fast” detector. It can be seen that each event is made of a rapid series of more peaks: in particular, the first event consists of an open–close–open (O–C–O) sequence, produced by the automatic attempt of the TSG to re-connect the line. After about one minute, the TSG makes a second attempt, which, if unsuccessful, results in a new close–open (C–O) sequence.
The parameters required by the simulation software have been estimated following a similar procedure as the one outlined in ISO 3746:2010 standard [28], repeated for each one-third octave band. The sound energy level for either event can be computed with the following equation:
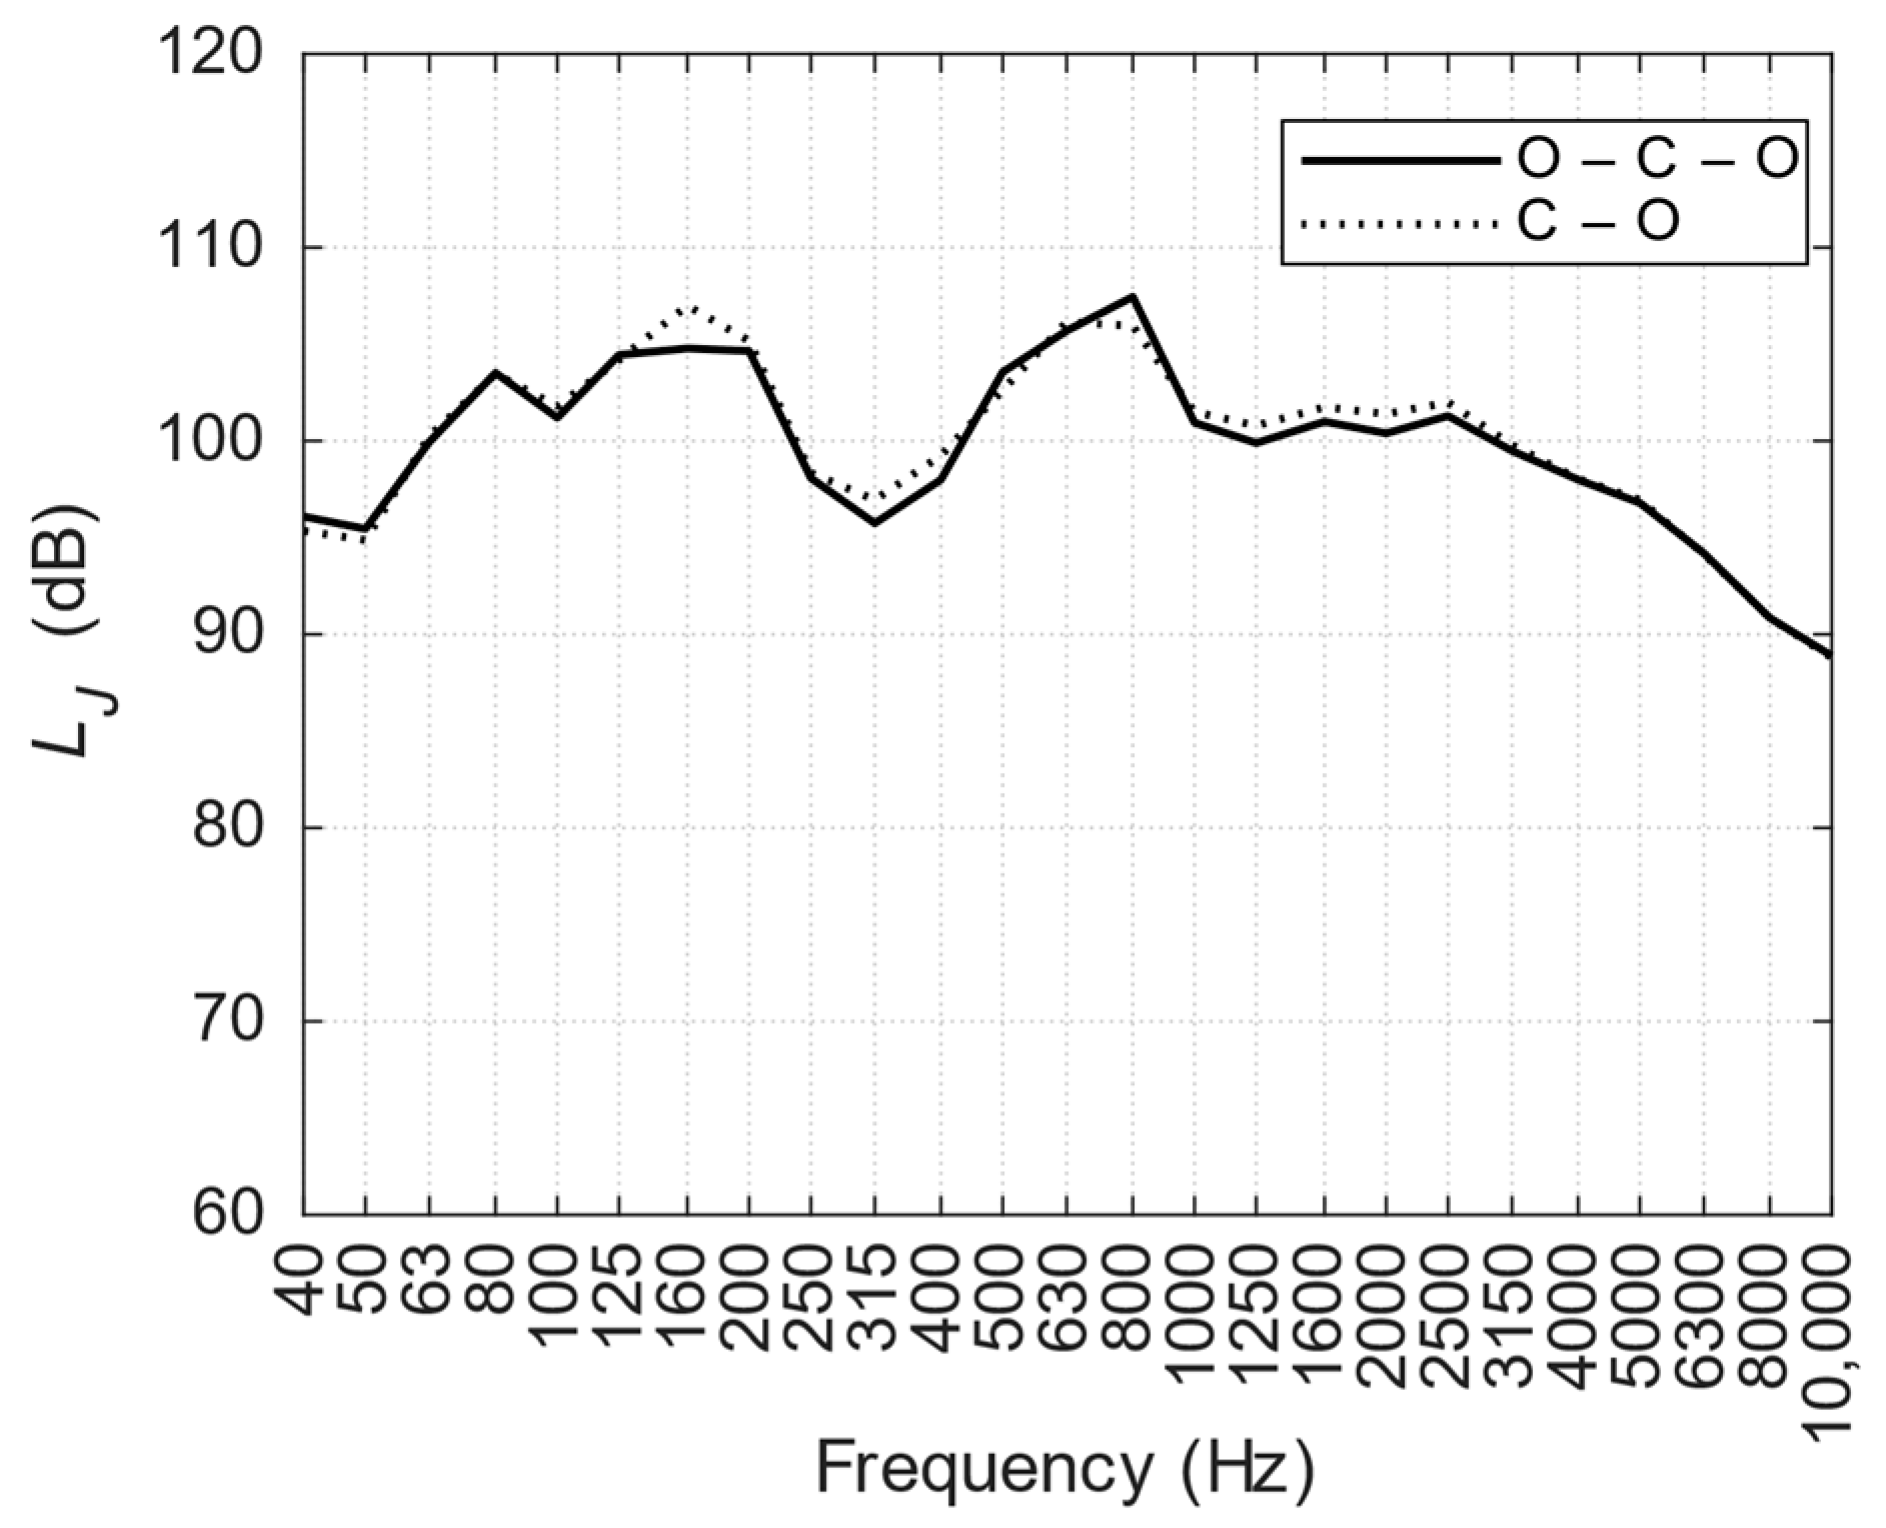
where fc is the center frequency of the considered one-third octave band, Lp is the space average of the statistically averaged single-event time-integrated sound pressure levels, k1 is the correction accounting for the background noise, k2 is the correction due to the reflections, and S is the area of the control surface enveloping the source. The difference between the total noise including the TSG impulse and the sole background noise inside the station exceeds 10 dB in the whole frequency range of interest, so the correction k1 in Equation (1) can be neglected. Similarly, when the measurements are carried out in open-air, the correction factor k2 can be ignored. The spectra obtained for the two events are shown in Figure 7. The computed overall sound energy level of the TSG is 115.5 dB (O–C–O event) and 115.8 dB (C–O event).
LJ(fc) = Lp(fc) + k1(fc) + k2(fc) + 10 log10(S),
2.3. Corona Discharge Noise around the Overhead Transmission Line
Corona discharge is caused by the ionization of the air surrounding the electrically-charged conductors of the transmission line, that can result, among others, in the emission of audible noise.
The Addendum 61 to CIGRE document No. 20 [29] describes the noise coming from high-voltage overhead lines as “frying, crackling or hissing sounds” and possibly a “hum”. These two sounds correspond to a typical spectrum consisting of two parts:
- Tonal components, due to the movement of charged ions around the conductor, are multiples of twice the mains frequency (for example, 100 Hz when the line frequency is 50 Hz); the first one or two harmonics are generally the dominant components and are the source of the “humming noise”
- A broad-band part, generated by positive polarity streamers, is spread over a wide frequency interval usually ranging from 1 kHz to the ultrasounds; this component is the source of the “crackling noise”.
Broad-band noise level decreases smoothly at increasing distance. It is worth remarking that an additional attenuation effect to this type of noise is provided by air absorption, which increases with increasing distance and which depends on sound frequency, air temperature and relative humidity.
On the other hand, as pointed out in [23], humming noise attenuates little with distance, is not affected by air absorption and can be heard especially in rainy conditions. The main attenuation effects in this case are provided by the A-weighting (that is to say, the filter representing human ear sensitivity) and by the aging of the conductors.
Methods to predict audible noise generated by transmission lines are available from studies carried out during the 1960–1980s, when pioneering studies on high-voltage lines were conducted in many countries. The various formulae presented in the literature to attribute a sound power level to a transmission line have a general form of the type:
where KA is a constant derived from numerical simplifications. Amongst the various formulations, the one specified by the CIGRE guideline has been adopted. The sound power level for heavy rain (HR) weather condition is computed according to Equation (3):
and expressed in A-weighted decibels referred to 1 µW/m. The formulation is valid under the ranges of parameters g, d and n specified by the CIGRE guideline. The CIGRE guideline gives directions to compute also the sound power level for average rain (AR) and fair weather (FW) conditions, and defines the three situations (HR, AR and FW) according to laboratory parameters.
ΓA = f1(g) + f2(d) + f3(n) + KA
Γ(A,HR) = − 650/g + 40 log10 (d) + 15 log10 (n) + 25
The sound power level for AR condition, which can be considered representative of wet conductors, is computed as
being Δ0 and Δc two empirical correction factors. The sound power level value for FW condition can be found as
Γ(A,AR) = Γ(A,HR) − Δ0 + Δc
Γ(A,FW) = Γ(A,AR) − 17
Classifying weather conditions in one of these three groups may not be simple. FW is the only condition relative to completely dry conductors. HR is representative of a high rain rate (around 10 mm/h and above) and it is considered as the worst case in terms of corona discharge. However, an intense rainfall is likely to mask, at least partially, the corona audible noise. AR (also known as “wet”) can be used to model wet conductors both with light rain and with no rain at all, when a water film is present on the conductors due to fog or moist, or as a residual of a previous rainfall. This condition is still critical in terms of corona discharge noise because of the wet conductors, but it lacks the significant masking effect of a heavy rainfall. Besides, it represents weather conditions that can be experienced frequently in mountain areas.
This model has recently been incorporated into a MATLAB® code, enabling the operators to estimate the sound power level spectrum of transmission lines [24]. The code has been validated by performing long term measurements using a sound level meter on a single circuit, double sub-conductor 380 kV transmission line [25], with an average deviation of 1.5 dB.
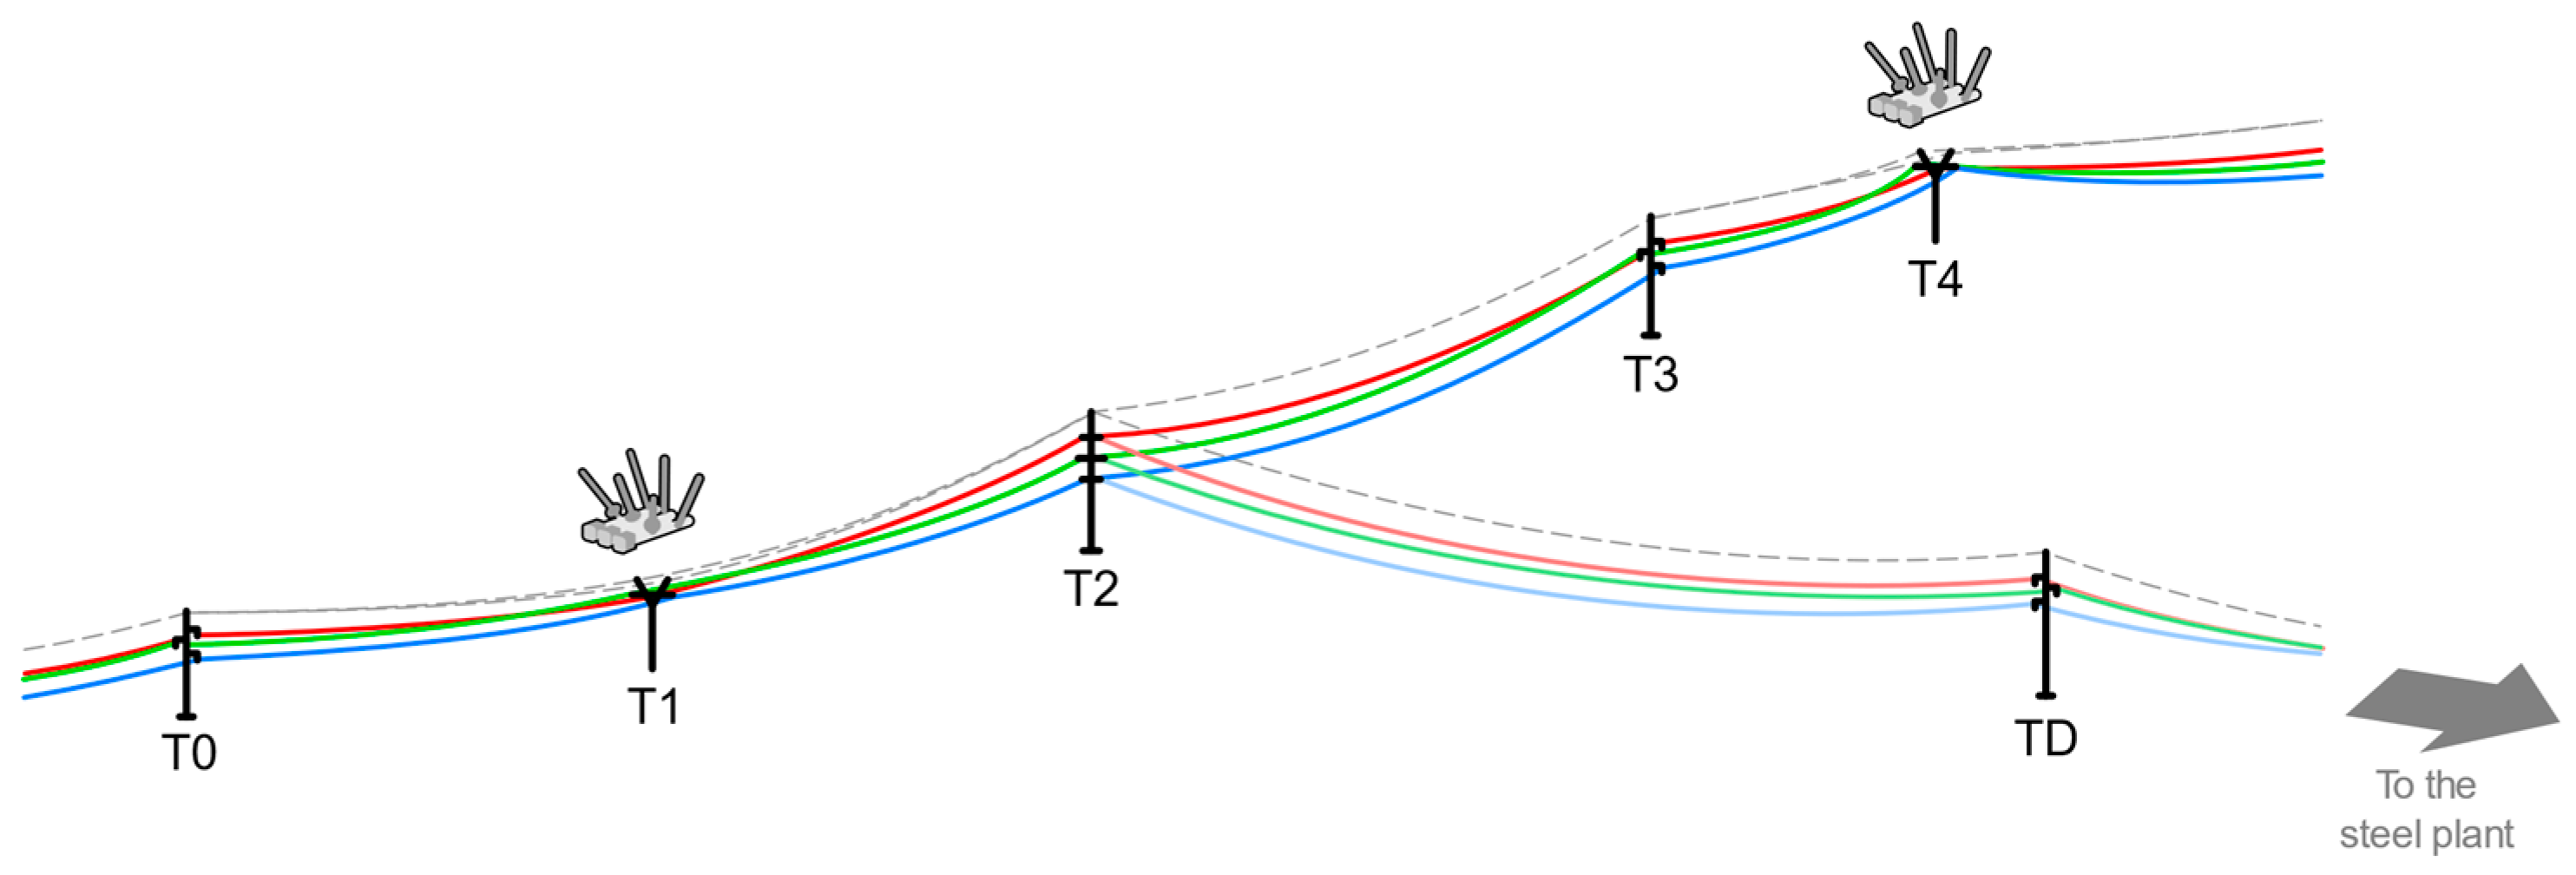
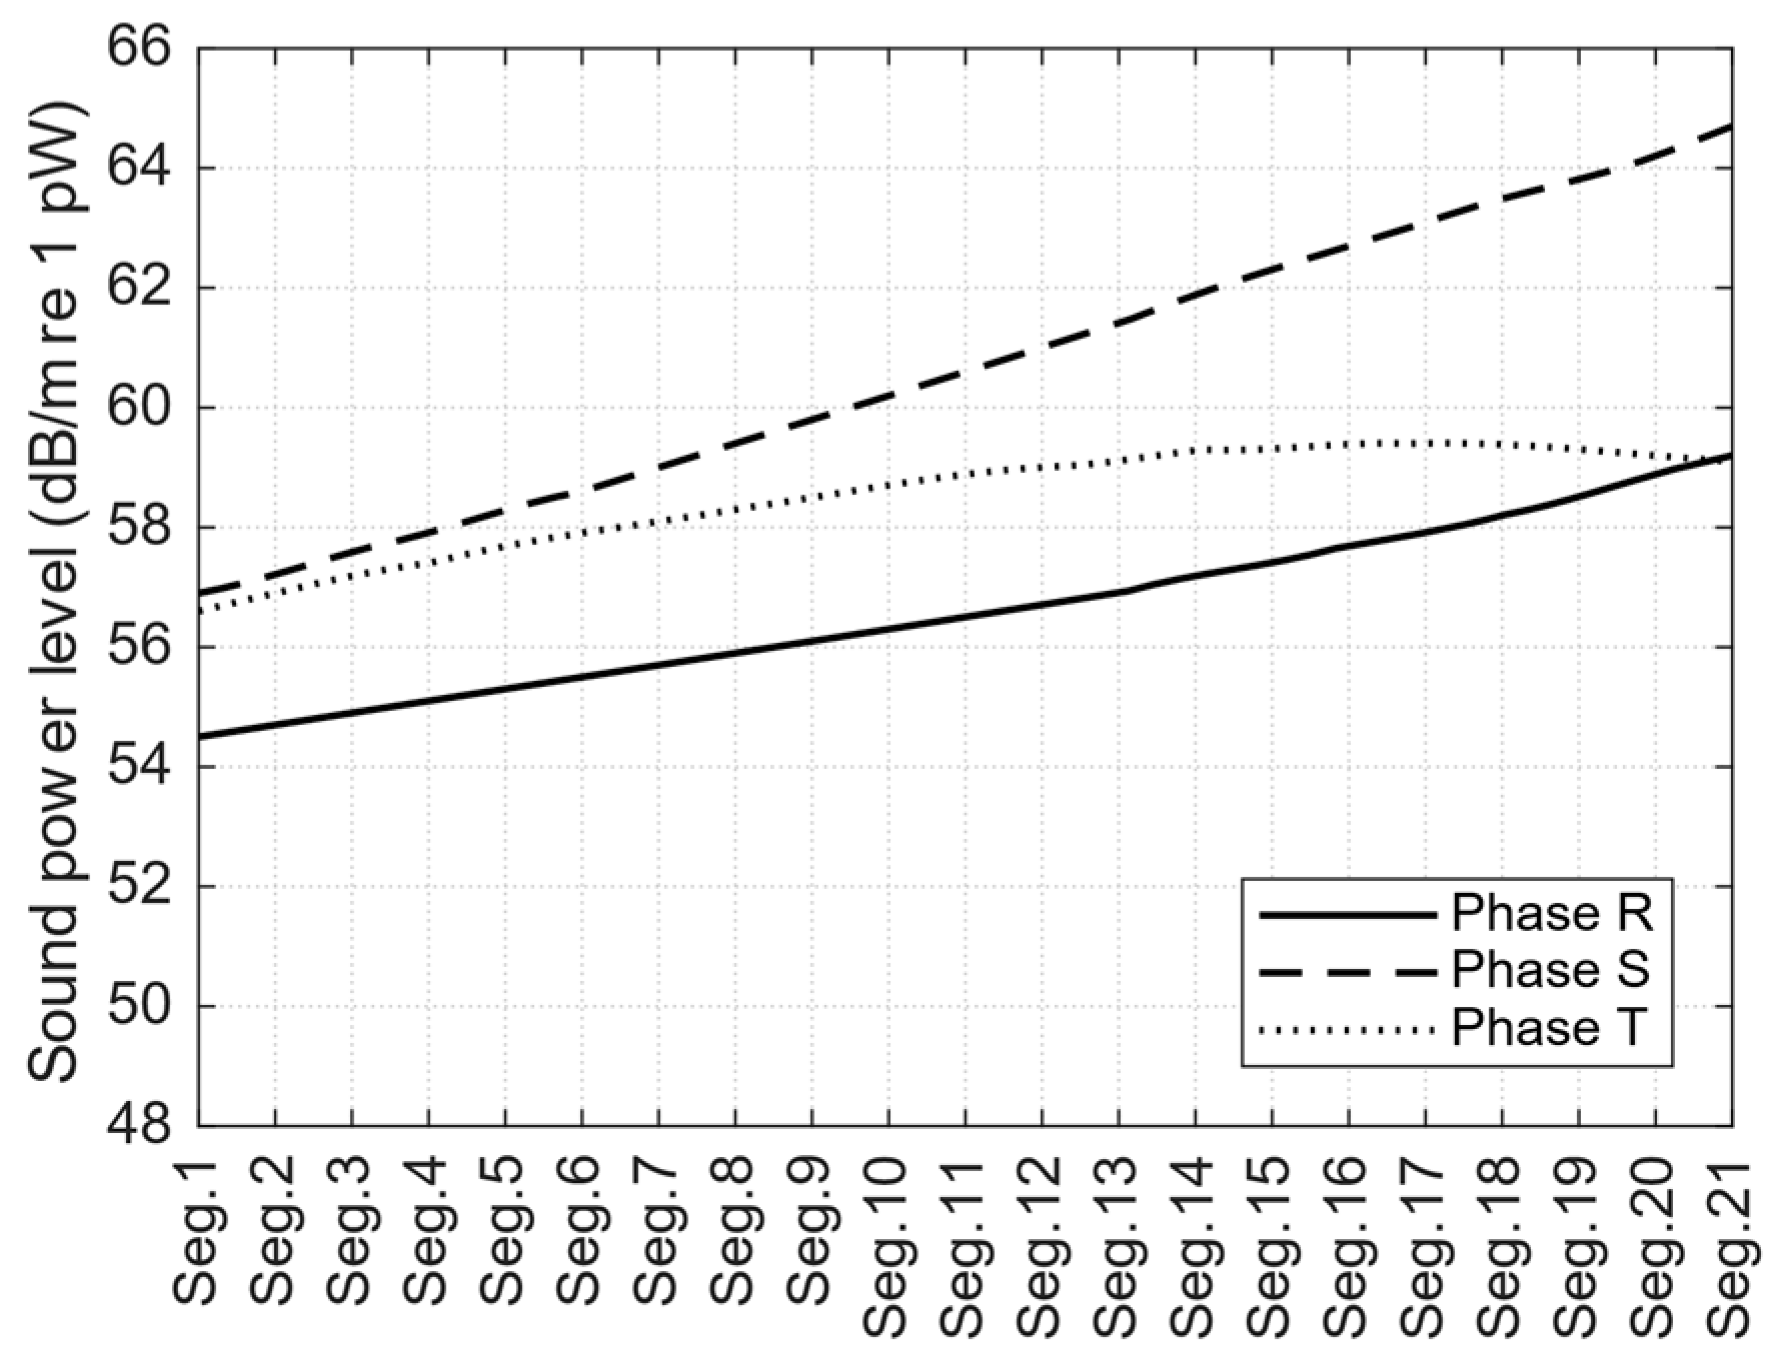
The infrastructure considered in this study is a single circuit, double sub-conductor 220 kV transmission line. Each sub-conductor has a diameter of 19.6 mm. Through the years, the transmission line has undergone several maintenance actions, thus the configuration of the conductors changes according to the type of trellis used for the conductor suspension. Figure 8 shows an example of the configuration adjustment occurring along the line. Since the distance between the phases is one of the main geometric parameters influencing the sound power level, it has been necessary to compute the sound power values for each span along the catenary evolution by means of the corona noise model described above. The code computes the sound power level values of the conductors with a spatial discretization of 10 m. As observed in [3], the corona noise can usually be heard in the form of harmless humming or buzzing, but humidity can increase the noise intensity to potentially troubling levels for nearby residents. The code has therefore been run in average rain conditions to account for a context of high-humidity where the sound of rain does not mask the noise produced by the transmission line. An example of the sound power data obtained by the MATLAB® code and used in the subsequent noise simulations is given in Figure 9, for the span between trellises T1 and T2.
2.4. Noise Spreading Model
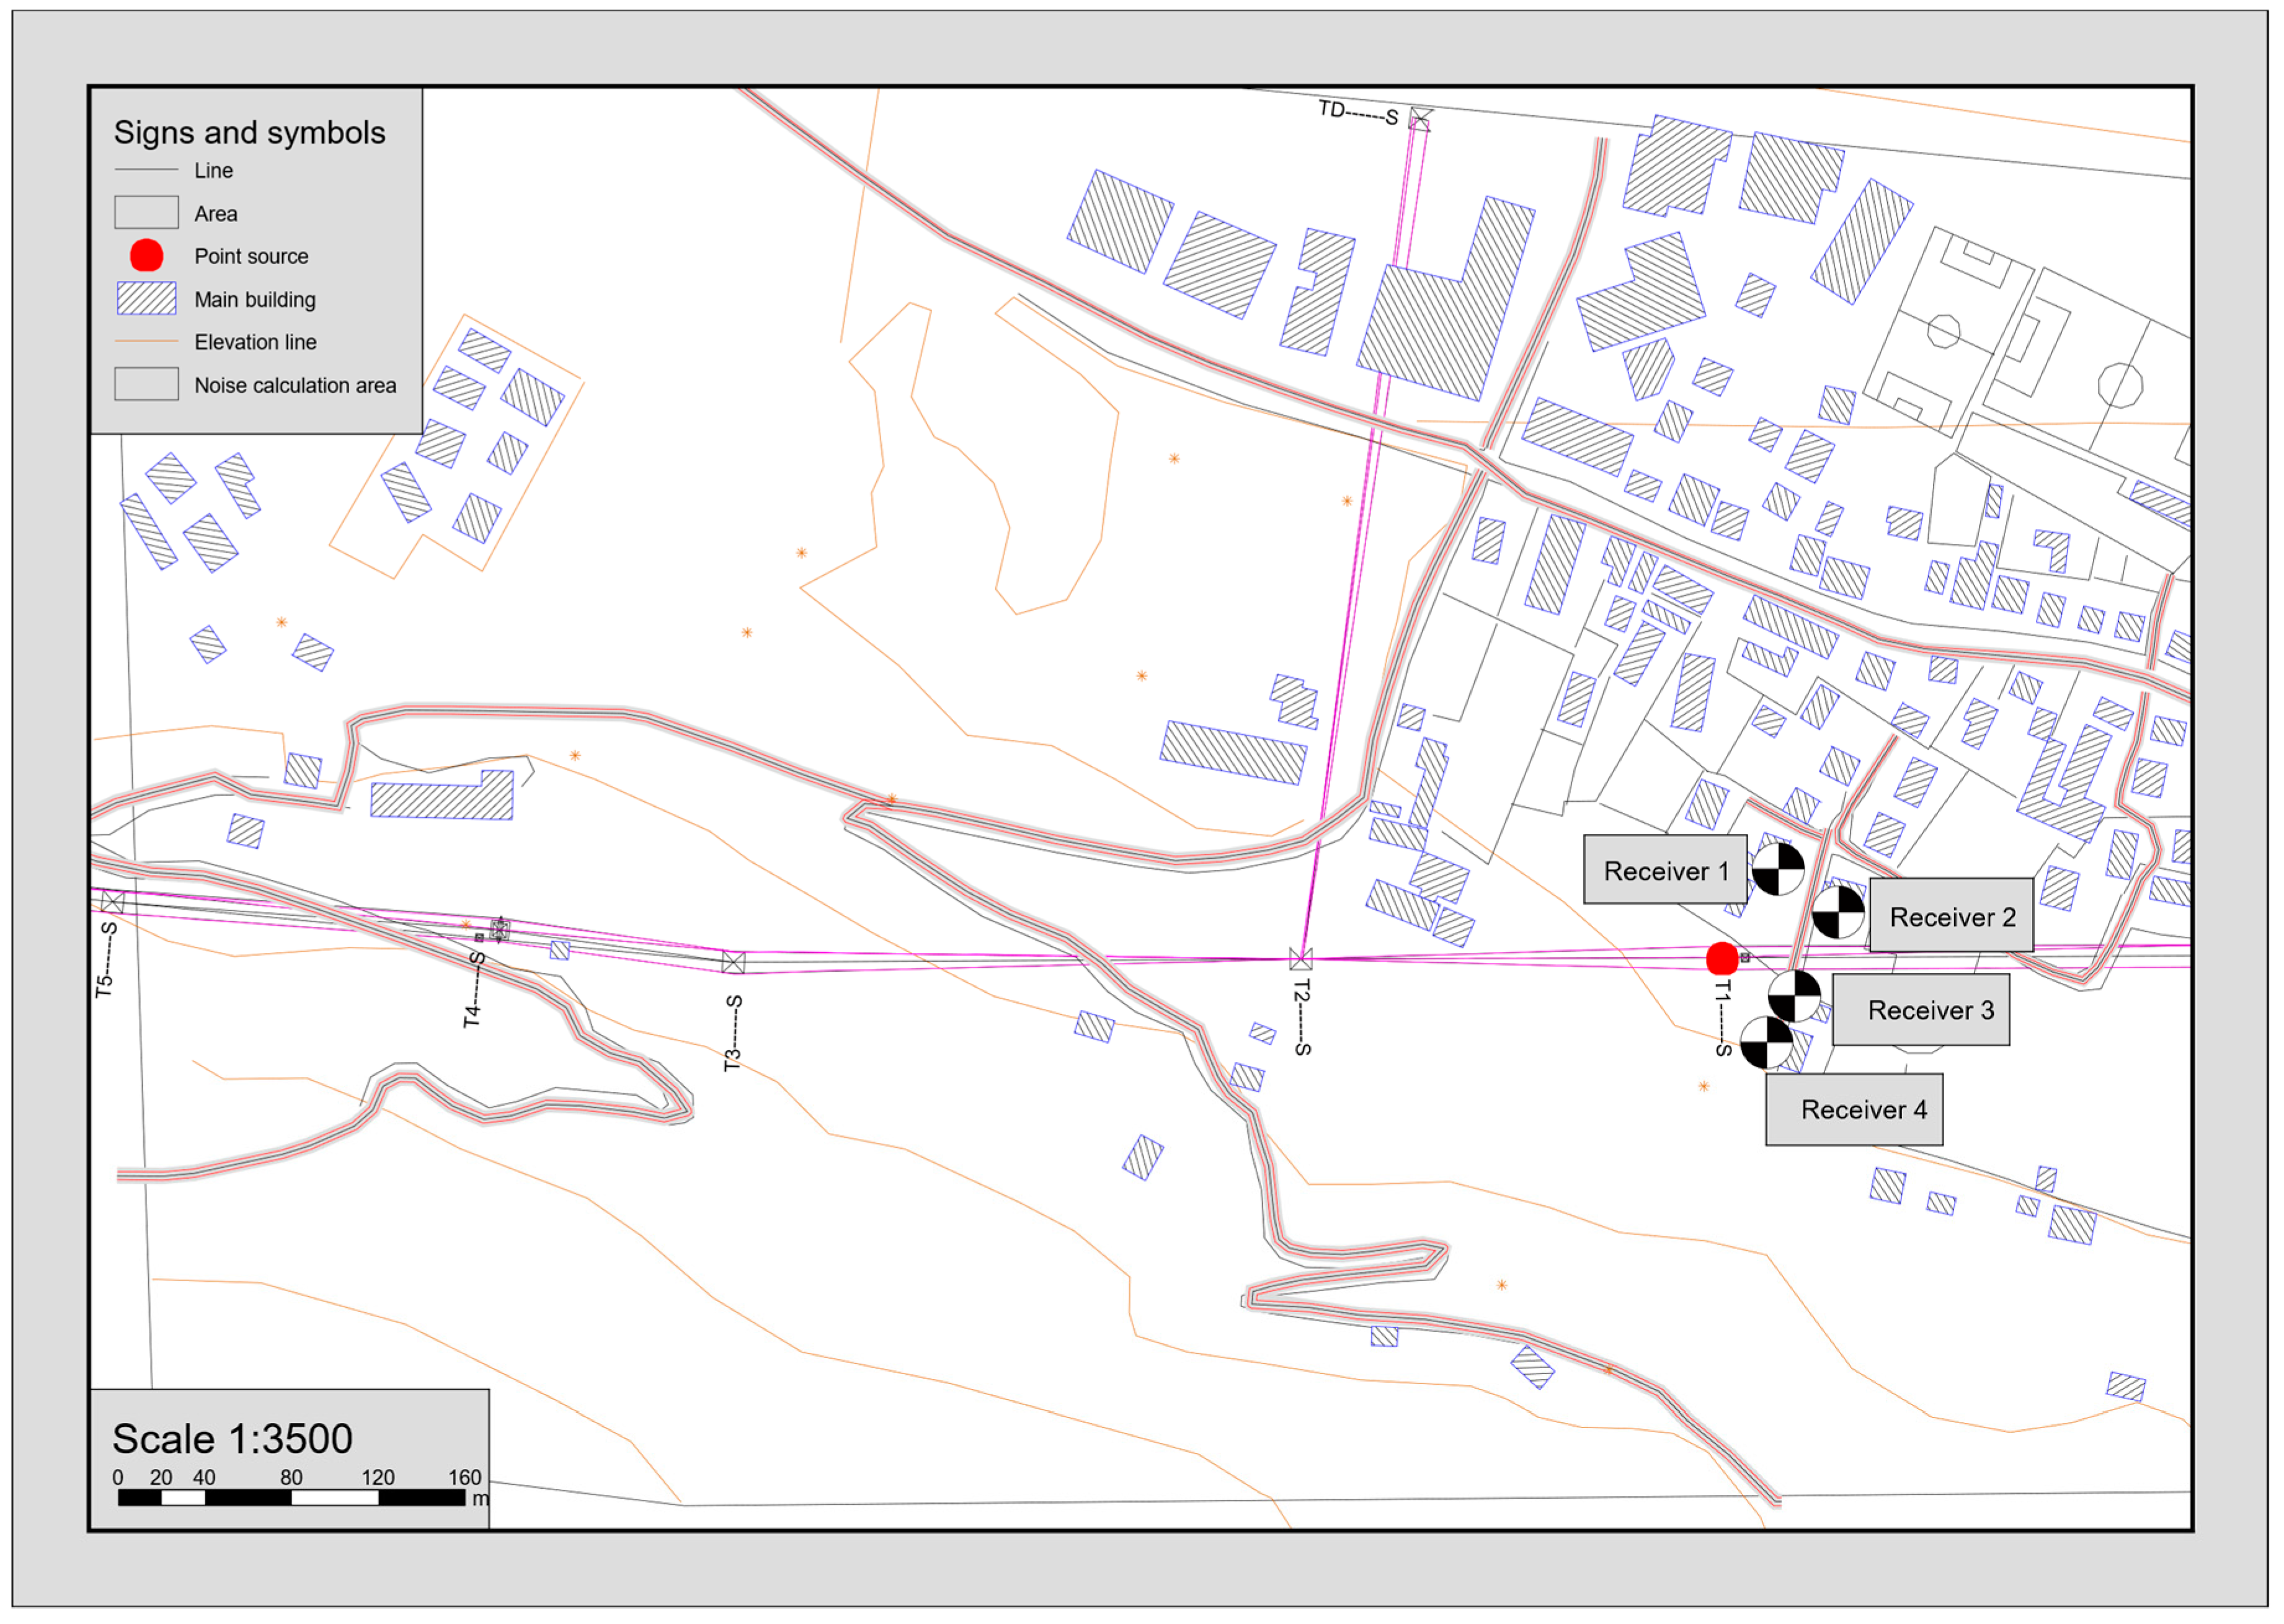
To run a complete noise propagation simulation, two point sources representing the TSGs and three line sources representing the conductors have all been introduced into the model. The software used is SoundPLAN® 8.0, a ray-tracing program implementing the procedures included in the reference international regulations. The choice of a professional software has been made for its advanced computation and three-dimensional representation capabilities, which are essential characteristics in this type of impact assessment evaluations [30,31]. The relevant standards in this case are the ISO 9613 part 1 and 2 [32,33] for outdoor sound propagation from industrial sources, and the CNOSSOS-EU protocol [34]. The simulation area is a rectangle with dimensions 1.1 km × 0.6 km including the transmission line, limited to such extents because, at distances above 250 m from the sources, results may be not reliable due to temperature gradients and wind. Seven sectors of the power transmission lines, positioned between eight trellises, have been introduced in the complete model. The local terrain is characterized by mountains, so particular attention has been paid to preparing the digital ground model. In the simulation, the trellis structure itself is not an acoustic source, but the TSG mounted on it is the main source type to be investigated. The TSGs have been modeled as point sources according to the description given in Section 2.2 and placed at the design elevations. As concerns the transmission line, the position of the conductors has been introduced in the model considering the catenary equation computed from the design parameters: mass per unit length, tension and average temperature of the conductors. Once terrain and sources have been fully characterized in the model, buildings and roads have been added, as well as some visual elements included as references. In terms of noise propagation, the only element of interest is represented by the buildings, since they act as a sound barrier. For this reason, they have been introduced with their real height. The main goal of the simulation campaign is to predict the sound pressure level distribution 4 m above the ground and at some specific positions where the noise impact can be particularly noticeable for the population (receivers placed closest to the line). For this reason, the four closest receivers have been selected as probes to evaluate simulation results. The receivers’ locations are defined in Figure 10.
The simulation software provides several outputs, including horizontal maps, vertical maps and point-by-point sound pressure levels. Simulations have been performed with both ISO 9613 and CNOSSOS-EU, which provided slightly higher values for distances above 100 m from the sources, while no difference could be observed close to the transmission line as in the case of the considered receivers. The maps shown in the following sections are the ones obtained with CNOSSOS-EU procedure.
2.5. Italian Noise Assessment Framework
The administrative reference in Italy concerning noise protection of individuals and communities is the Framework Law on Environmental Noise [35] which regulates the relationship between the State and the noise-emitting entity and establishes the competencies of the relevant national and local authorities. The Framework Law considers absolute and relative immission limits and absolute emission limits. Noise immission is defined as the sum of the maximum noise produced by the source and the residual noise, while emission only accounts for the noise produced by the specific source. Absolute limits depend on the acoustic classification of the territory made by the municipality, and they are valid outside the living spaces (open-air). They are referred to day-time (h. 6–22) and night-time (h. 22–6) periods and are expressed in terms of A-weighted equivalent levels over the entire reference time interval as a function of the acoustic class. The considered site belongs to Class III, which generally encompasses mixed residential and small business areas or, as in this case, rural areas. The immission noise limits for Class III are 60 dB(A) during the day-time and 50 dB(A) during the night-time, while the emission limits are 5 dB lower.
As concerns the relative (also known as “differential”) threshold, the immission level must not exceed the residual noise alone by more than 5 dB during the day and 3 dB during the night. The assessment is based on indoor sound pressure level, (which, in the case of open windows, is generally at least 3 dB below the façade level [36]) evaluated over the period of noisiest operation of the specific sources. To summarize, the noise impact of the TSGs according to the Italian legislation is evaluated by determining:
- the equivalent sound pressure level during the day-time/night-time, to be compared with absolute limits; and
- the difference between the equivalent sound pressure levels with noise source on and off, to be compared with relative limits.
As concerns impulsive noise, the Italian legislation states that the noise falls in this category when the noise event:
- features highly peaky components;
- is shorter than 1 s; and
- repeats during the reference time interval.
If the three conditions are met, the noise emission level must be increased by 3 dB.
3. Results and Discussion
In this section, the compliance of the power line with the Italian legislation will be assessed. First of all, the noise emitted by the line will be evaluated, due to corona discharge effect in the whole frequency spectrum and without considering the action of the TSGs. Subsequently, the action of the TSG will be evaluated. In both cases, the assessment will be carried out in terms of absolute emission, absolute immission and differential limits the presence of tones and impulsive components will be investigated.
The noise assessment has been focused on the night-time, when the residual noise is generally lower and sound sources can be heard more clearly. Receiver 3 (Figure 10) is the closest to either TSG, thus it has been chosen as the evaluation point for the assessment.
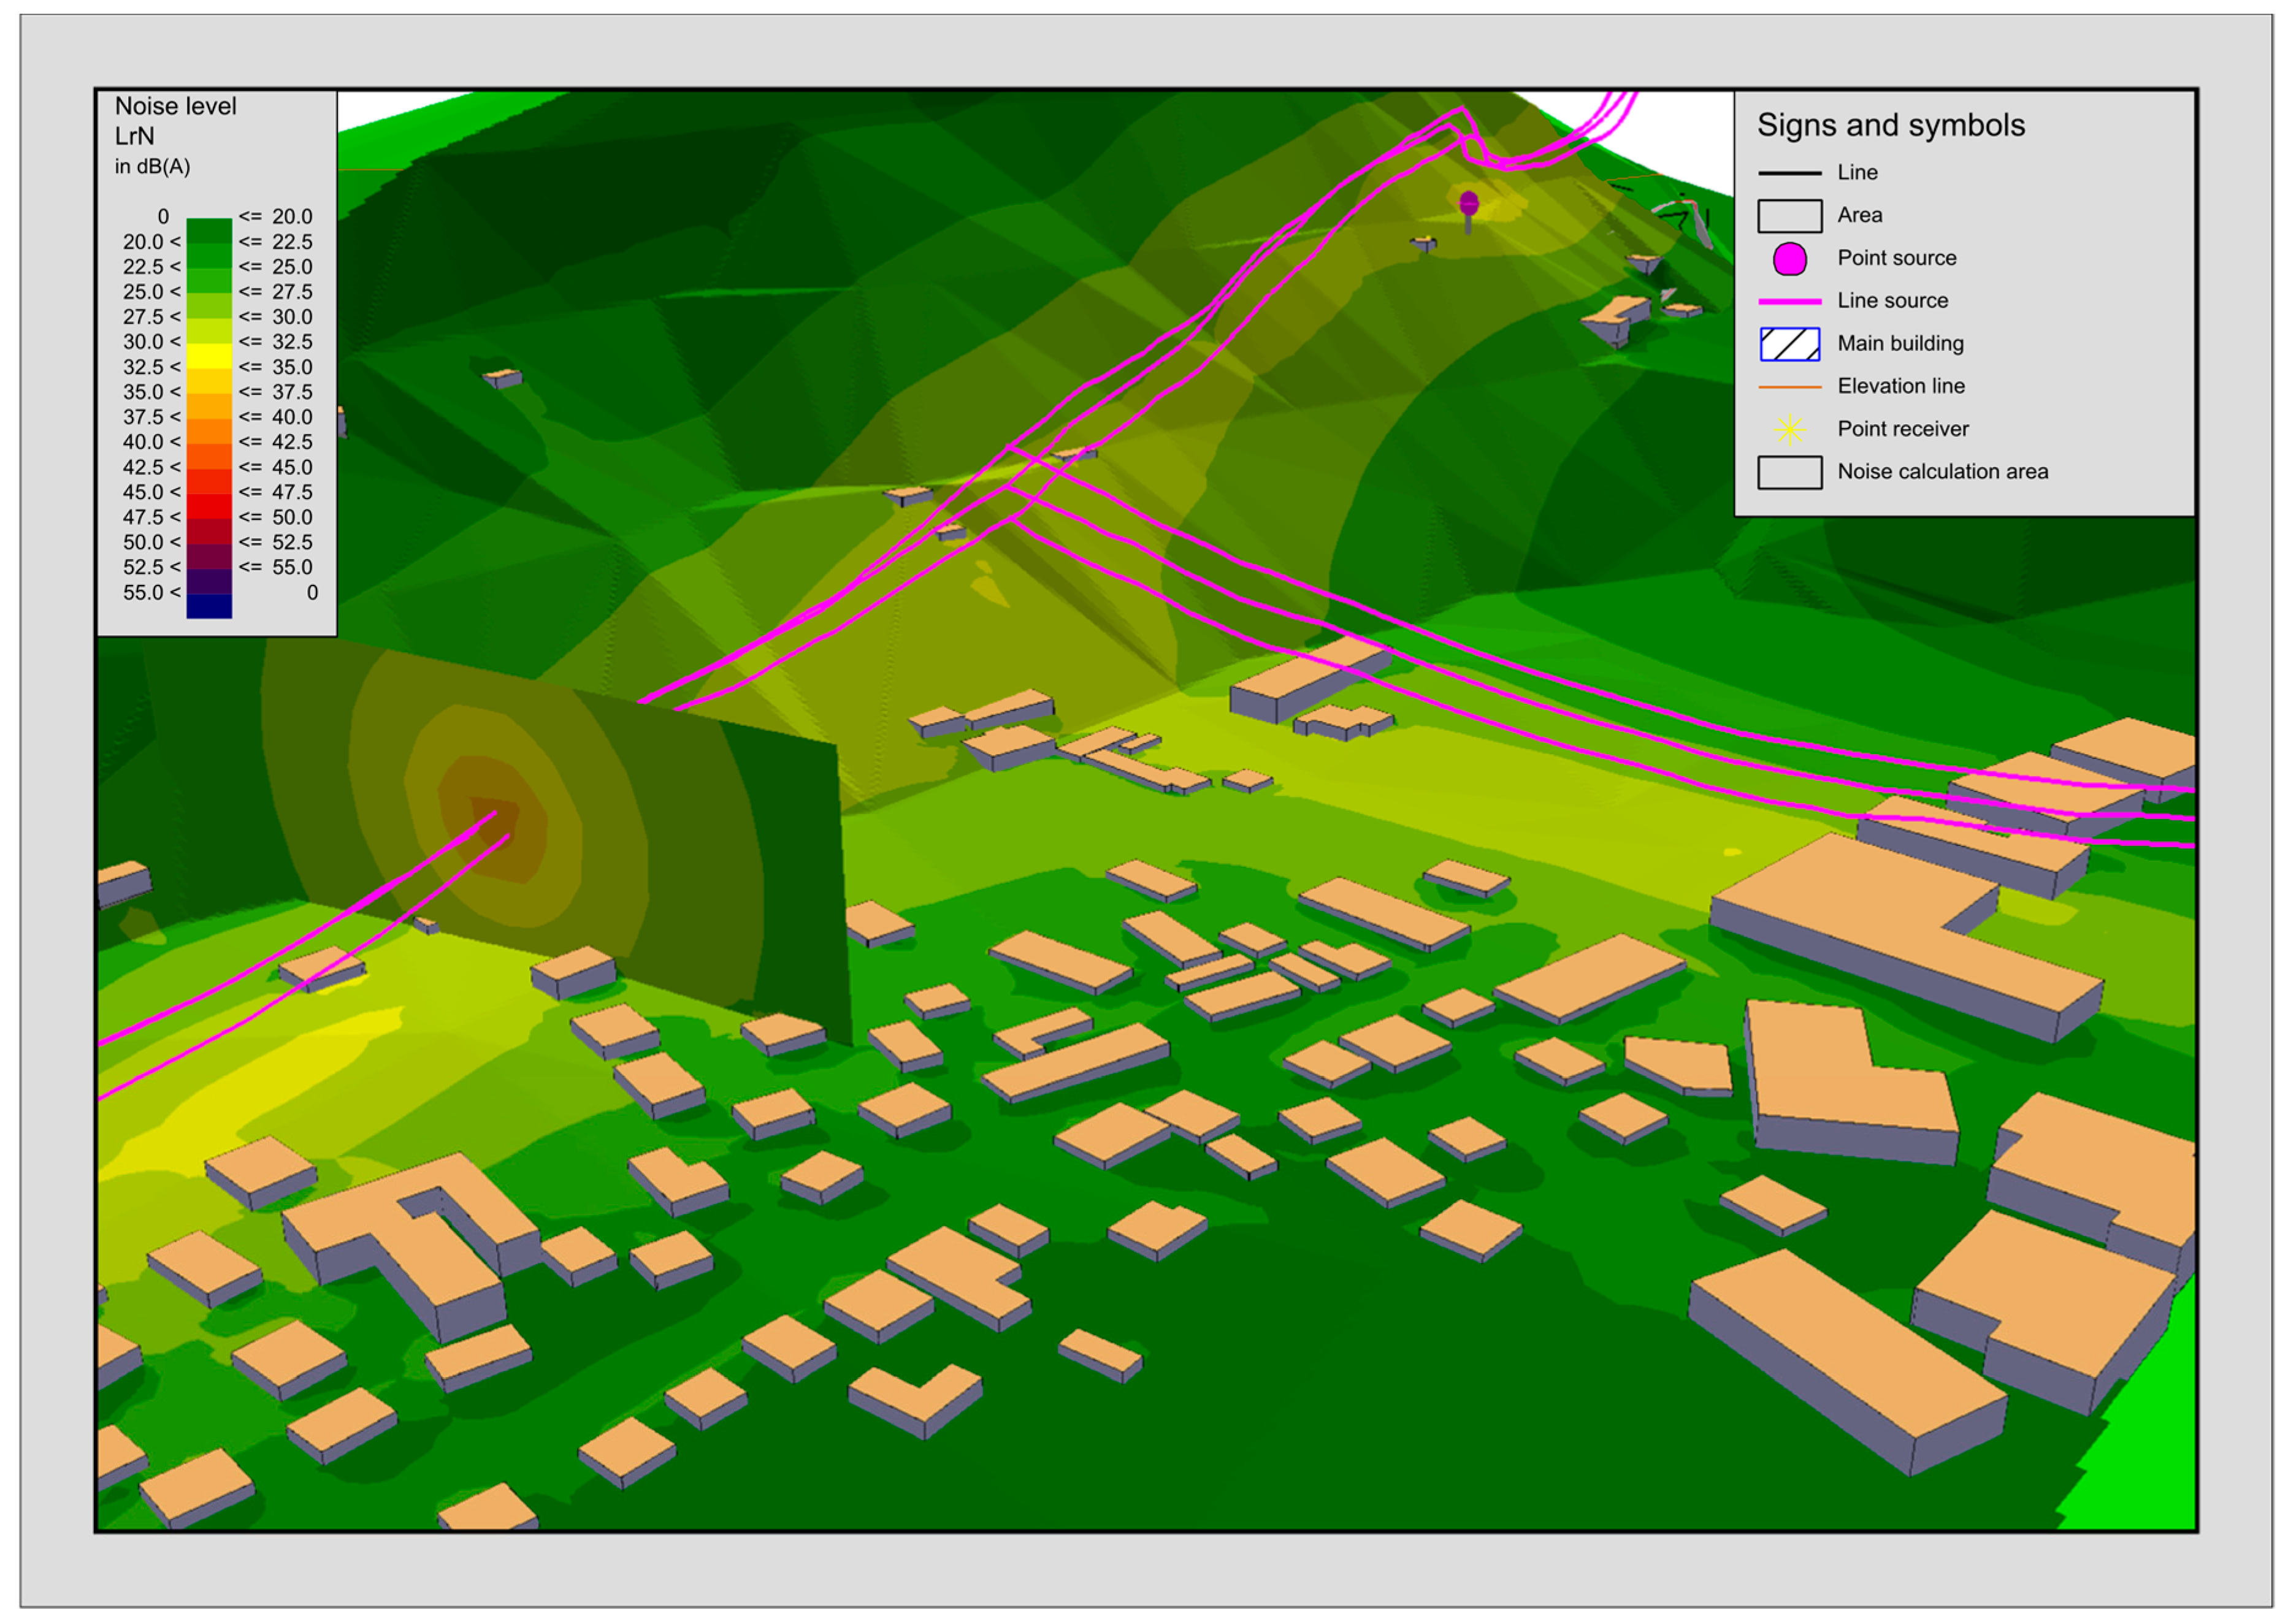
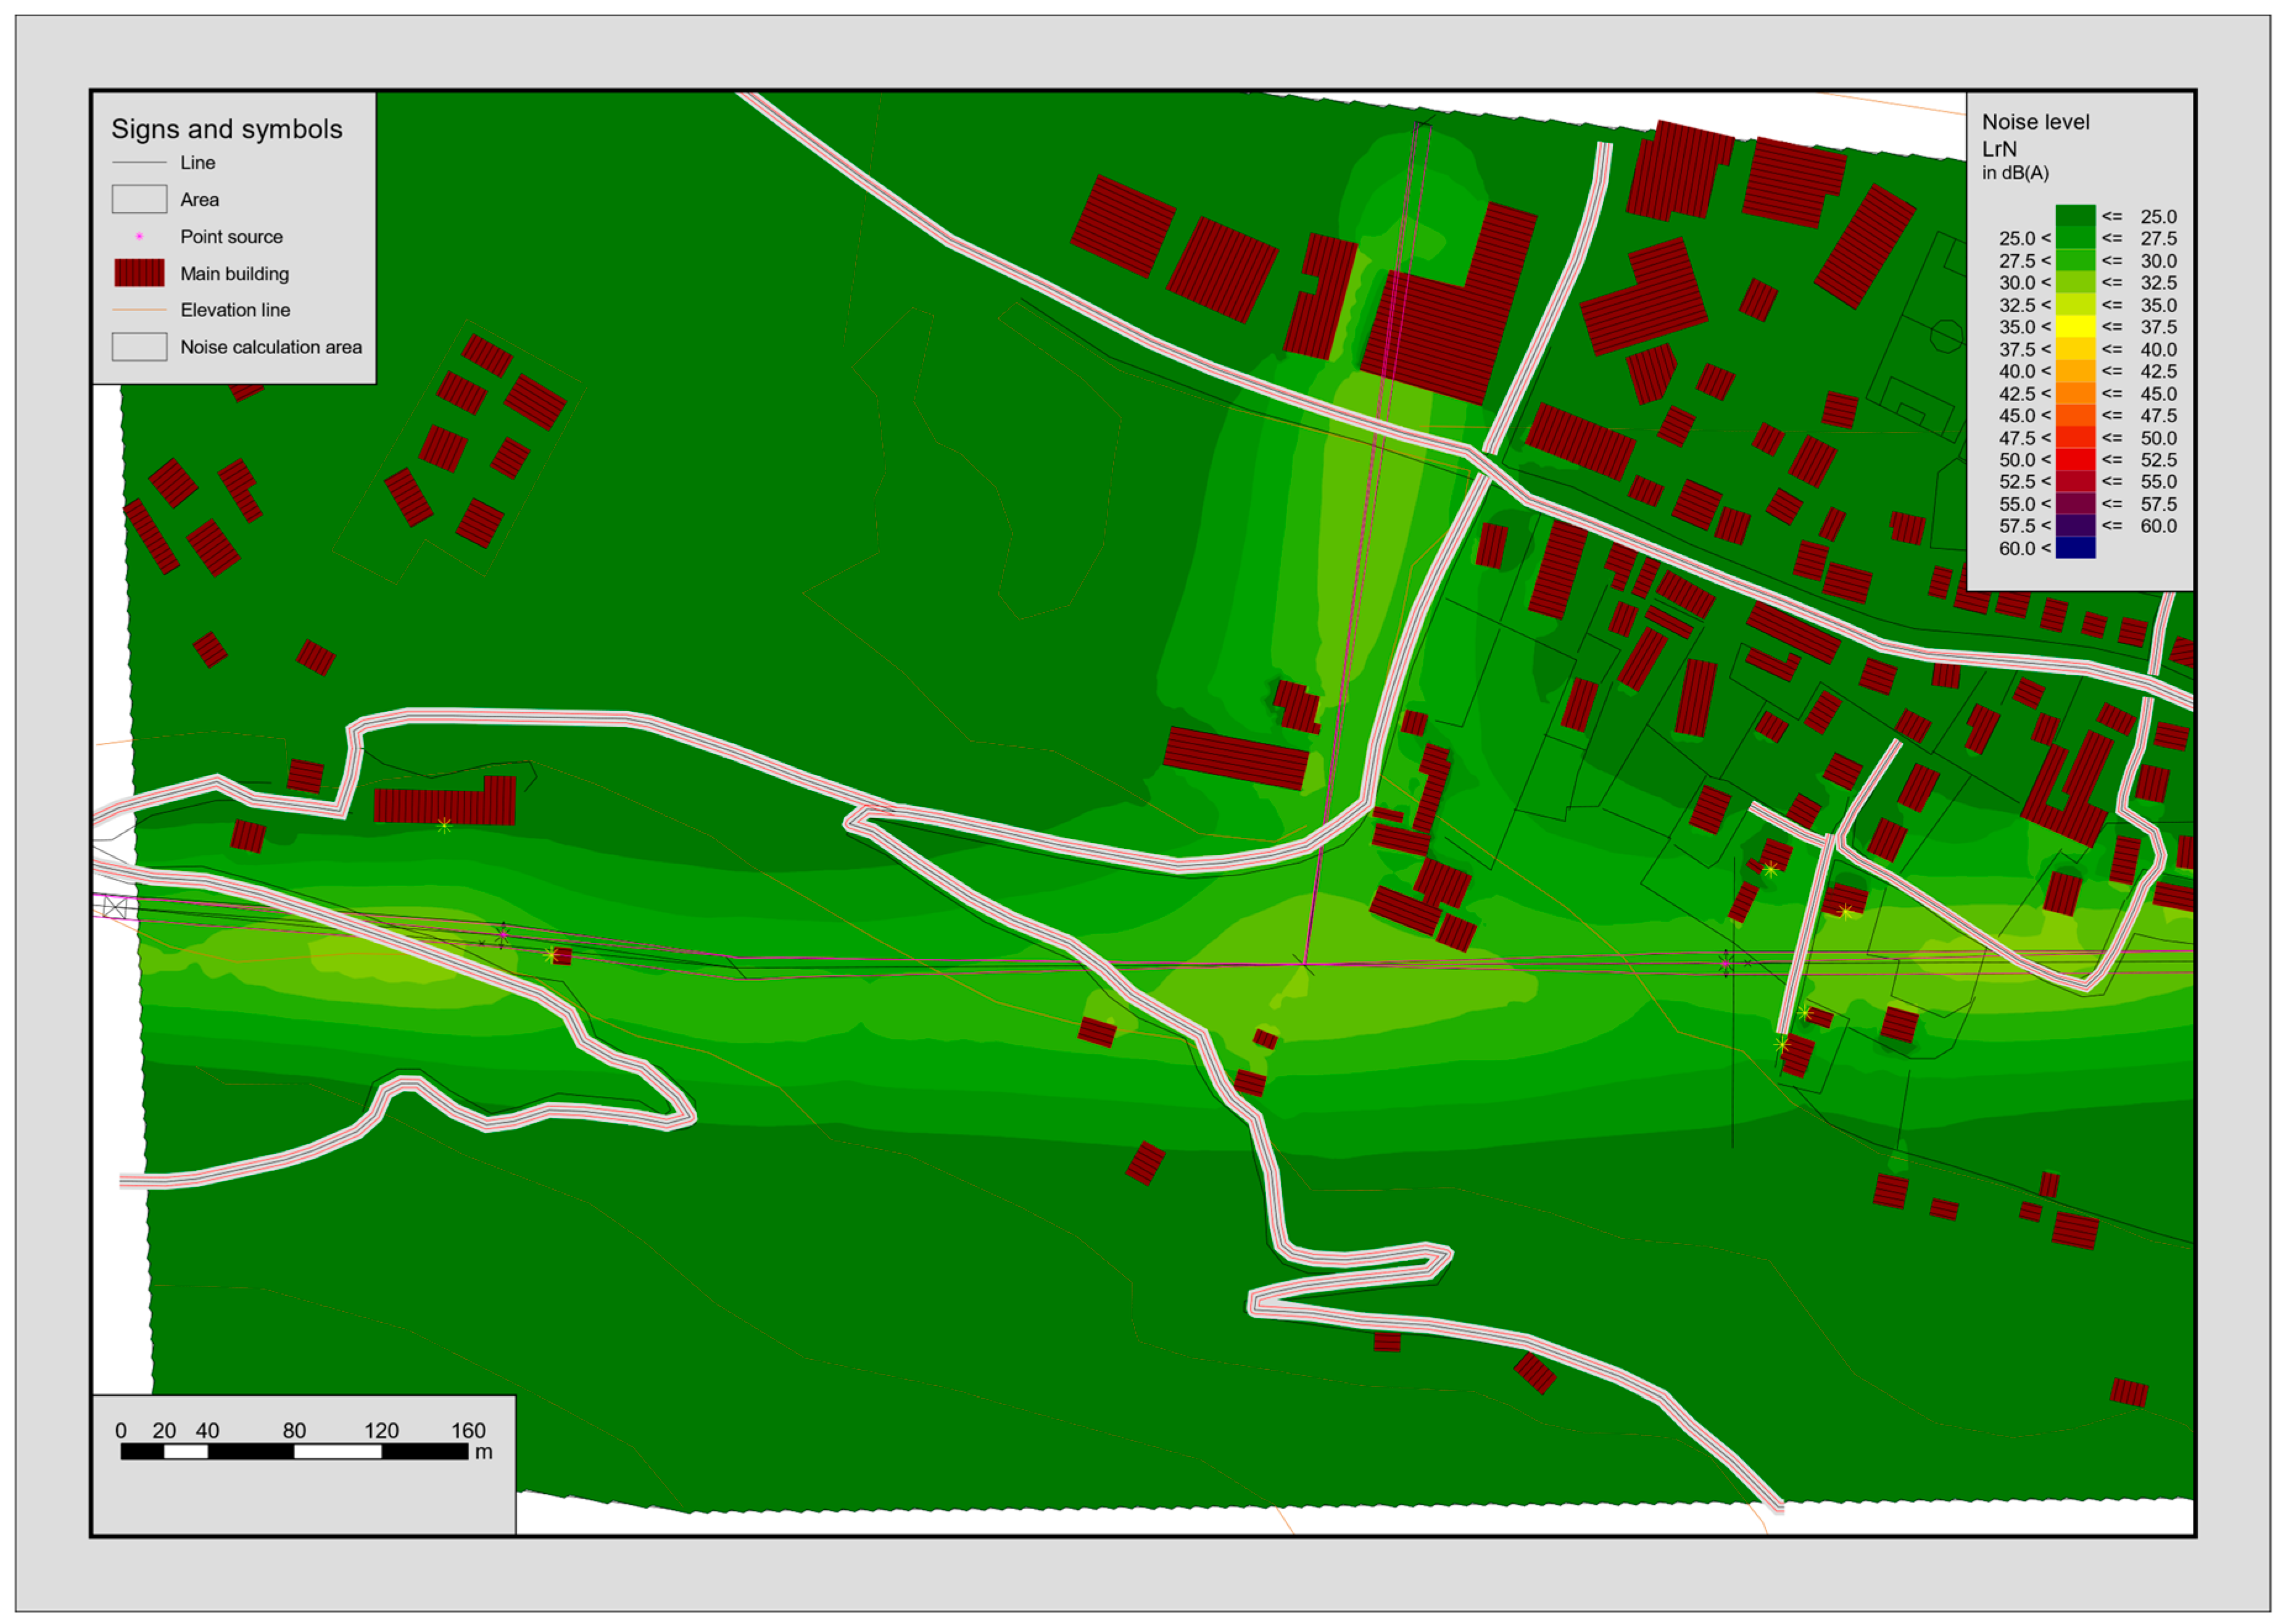
Firstly, the corona noise alone has been considered. The emission level estimated through the prediction code (see Section 2.3) has been used to simulate the noise spreading map shown in Figure 11, providing the ordinary effect of the line when the TSGs do not work: in this case, the predicted A-weighted emission level at Receiver 3 is LE,corona = 27 dB(A).
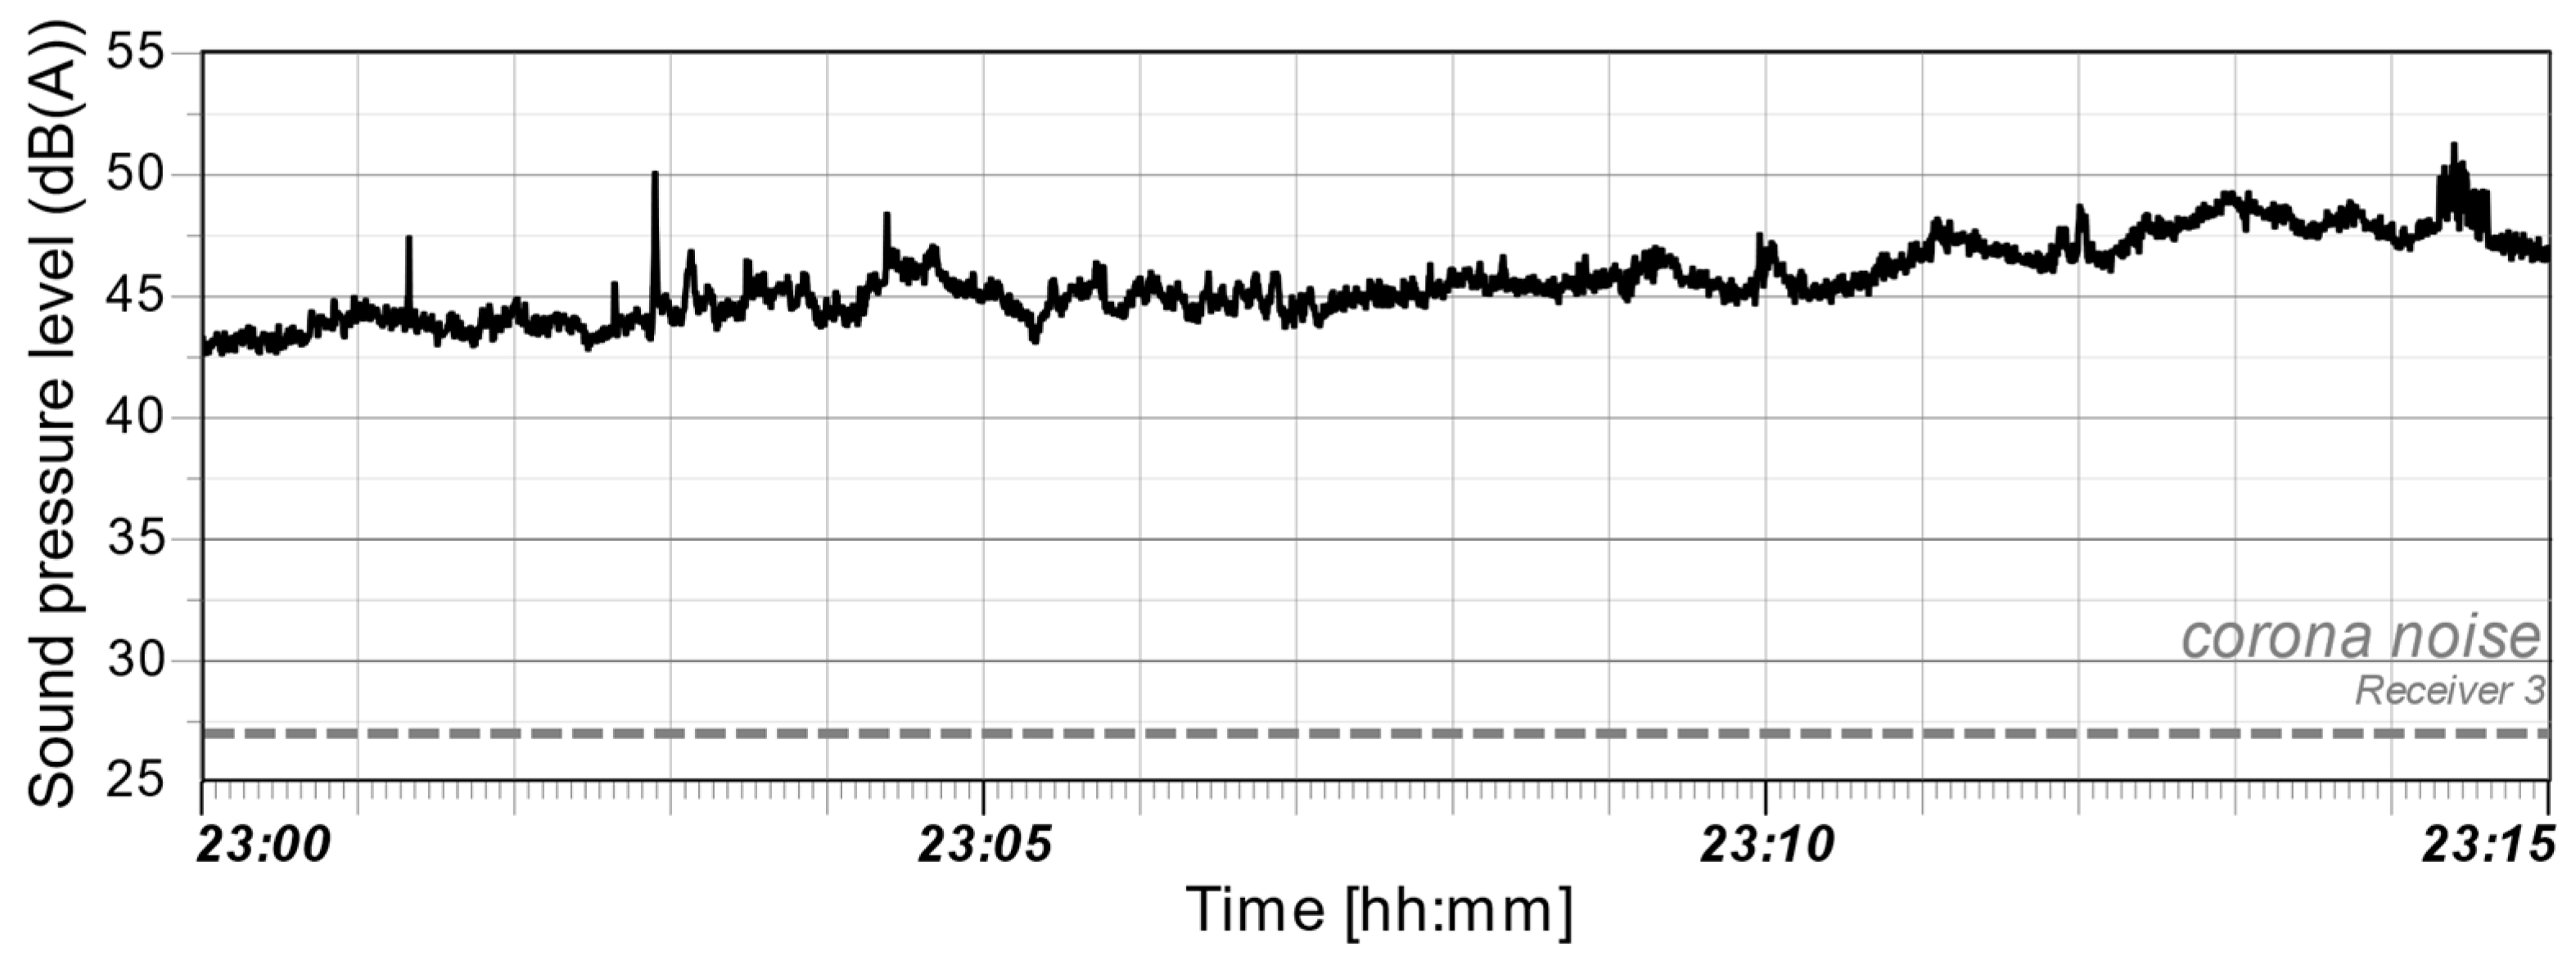
Such noise emission should be compared to the residual noise level measured at the receiver when the noise source is not working. However, the transmission line emission cannot be turned off, so it is always included in the residual noise measured outdoor (Figure 12), whose resulting LAeq is 45.9 dB(A) based on the performed measurements. The time-history also reveals that no impulsive contributions are present.
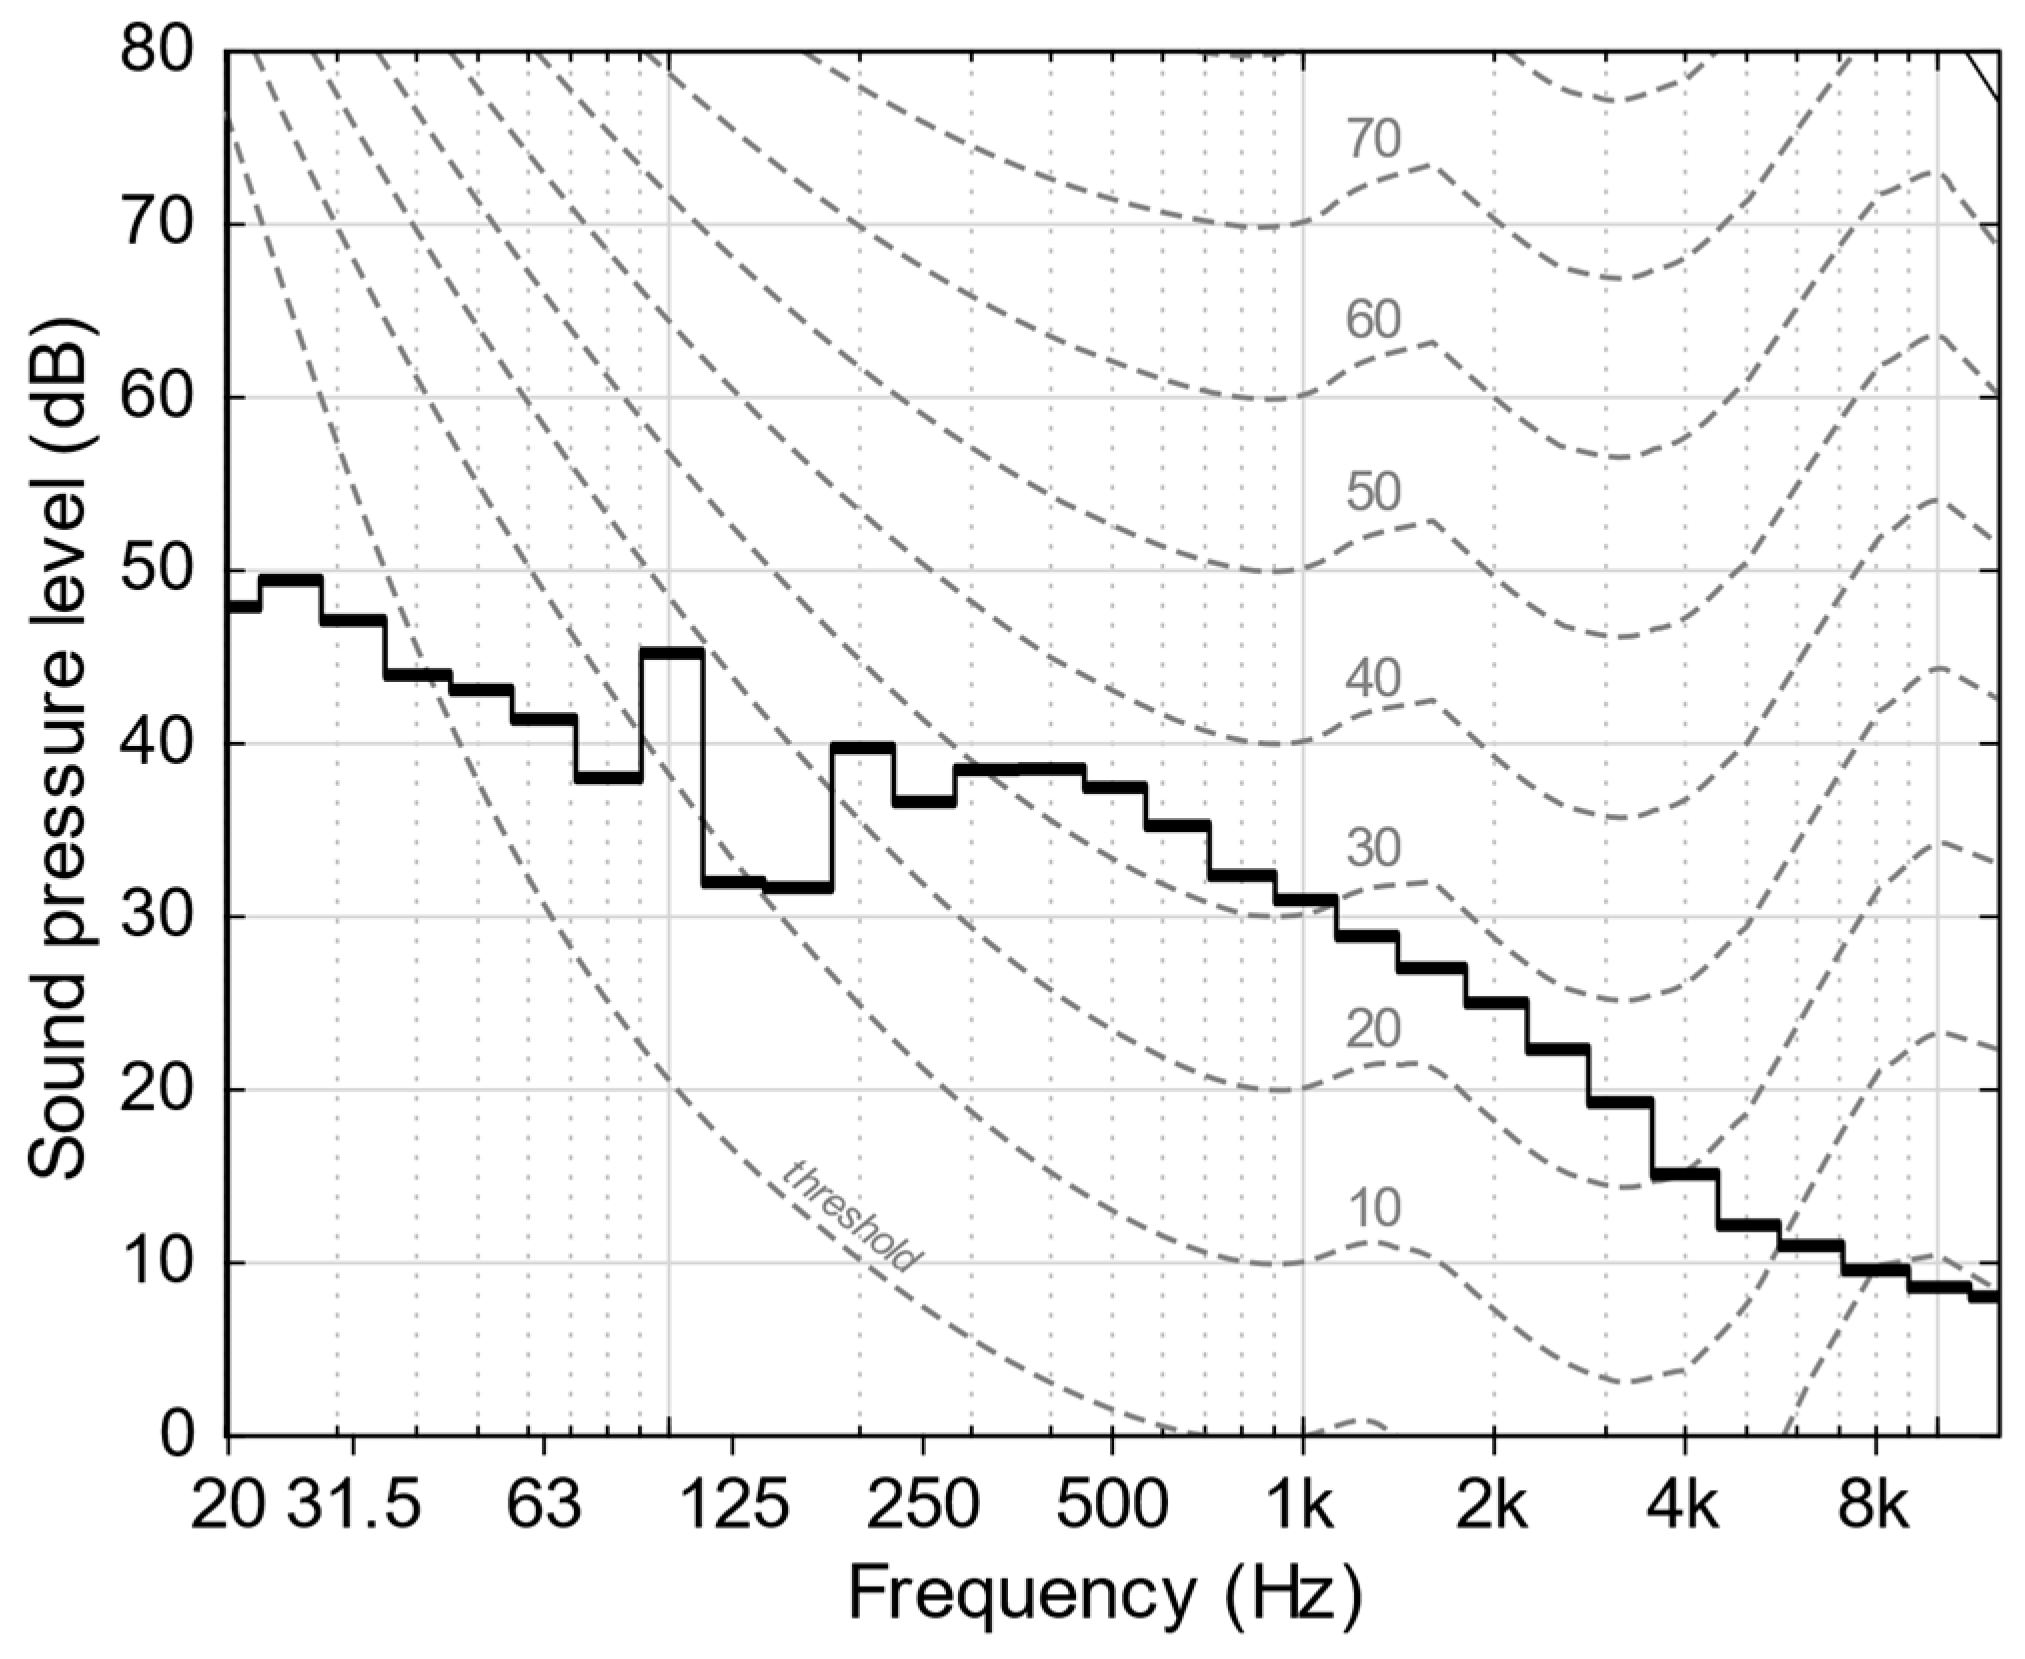
To experimentally estimate the corona effect contribution, one can extract the portion of the time history with a low sound pressure level and analyze the corresponding average spectrum. Below the hearing threshold, the measured sound pressure levels are 57, 57, 54 and 48 dB in the one-third octave bands from 10 to 20 Hz, which are low values if compared to DEFRA guideline recommendations [19]. This result agrees with other available literature findings [18]. Therefore, only the audible frequency range will be considered in the following. As previously described, the corona noise emission usually displays a humming component at 100 Hz and a broadband noise above 1 kHz. From the extracted spectrum shown in Figure 13, the latter component cannot be seen, while a continuous spectrum in the mid-frequency range is observed, which can be attributed to industrial noise such as the steel factory emission. On the other hand, the peak at 100 Hz can be clearly spotted: if its sound pressure level, 45 dB, is A-weighted, one obtains 45 − 19.1 ≈ 26 dB(A), a value close to the LE,corona = 27 dB(A) predicted by the simulation. Finally, this value can be energetically subtracted from the residual LAeq = 45.9 dB(A) to isolate the background noise contribution: the resulting value of 45.85 dB(A) shows that the corona discharge noise has a negligible influence with respect to environmental noise coming from other sources.
As concerns the prominent discrete-frequency component at 100 Hz, this cannot be considered as a disturbing tone according to the Italian legislation, since the 20 phon equal-loudness-level contour [37] touched by the 100 Hz tone is not the highest among the contours touched by other components of the noise spectrum.
In setting-up the simulation to account for the contribution of the TSG devices, the following considerations have been made:
- automatic TSG operation consists of 2 impulsive events (see Section 2.2);
- an additional closing attempt can be performed manually within 15 min; and
- the operation features the intervention of one TSG at a time.
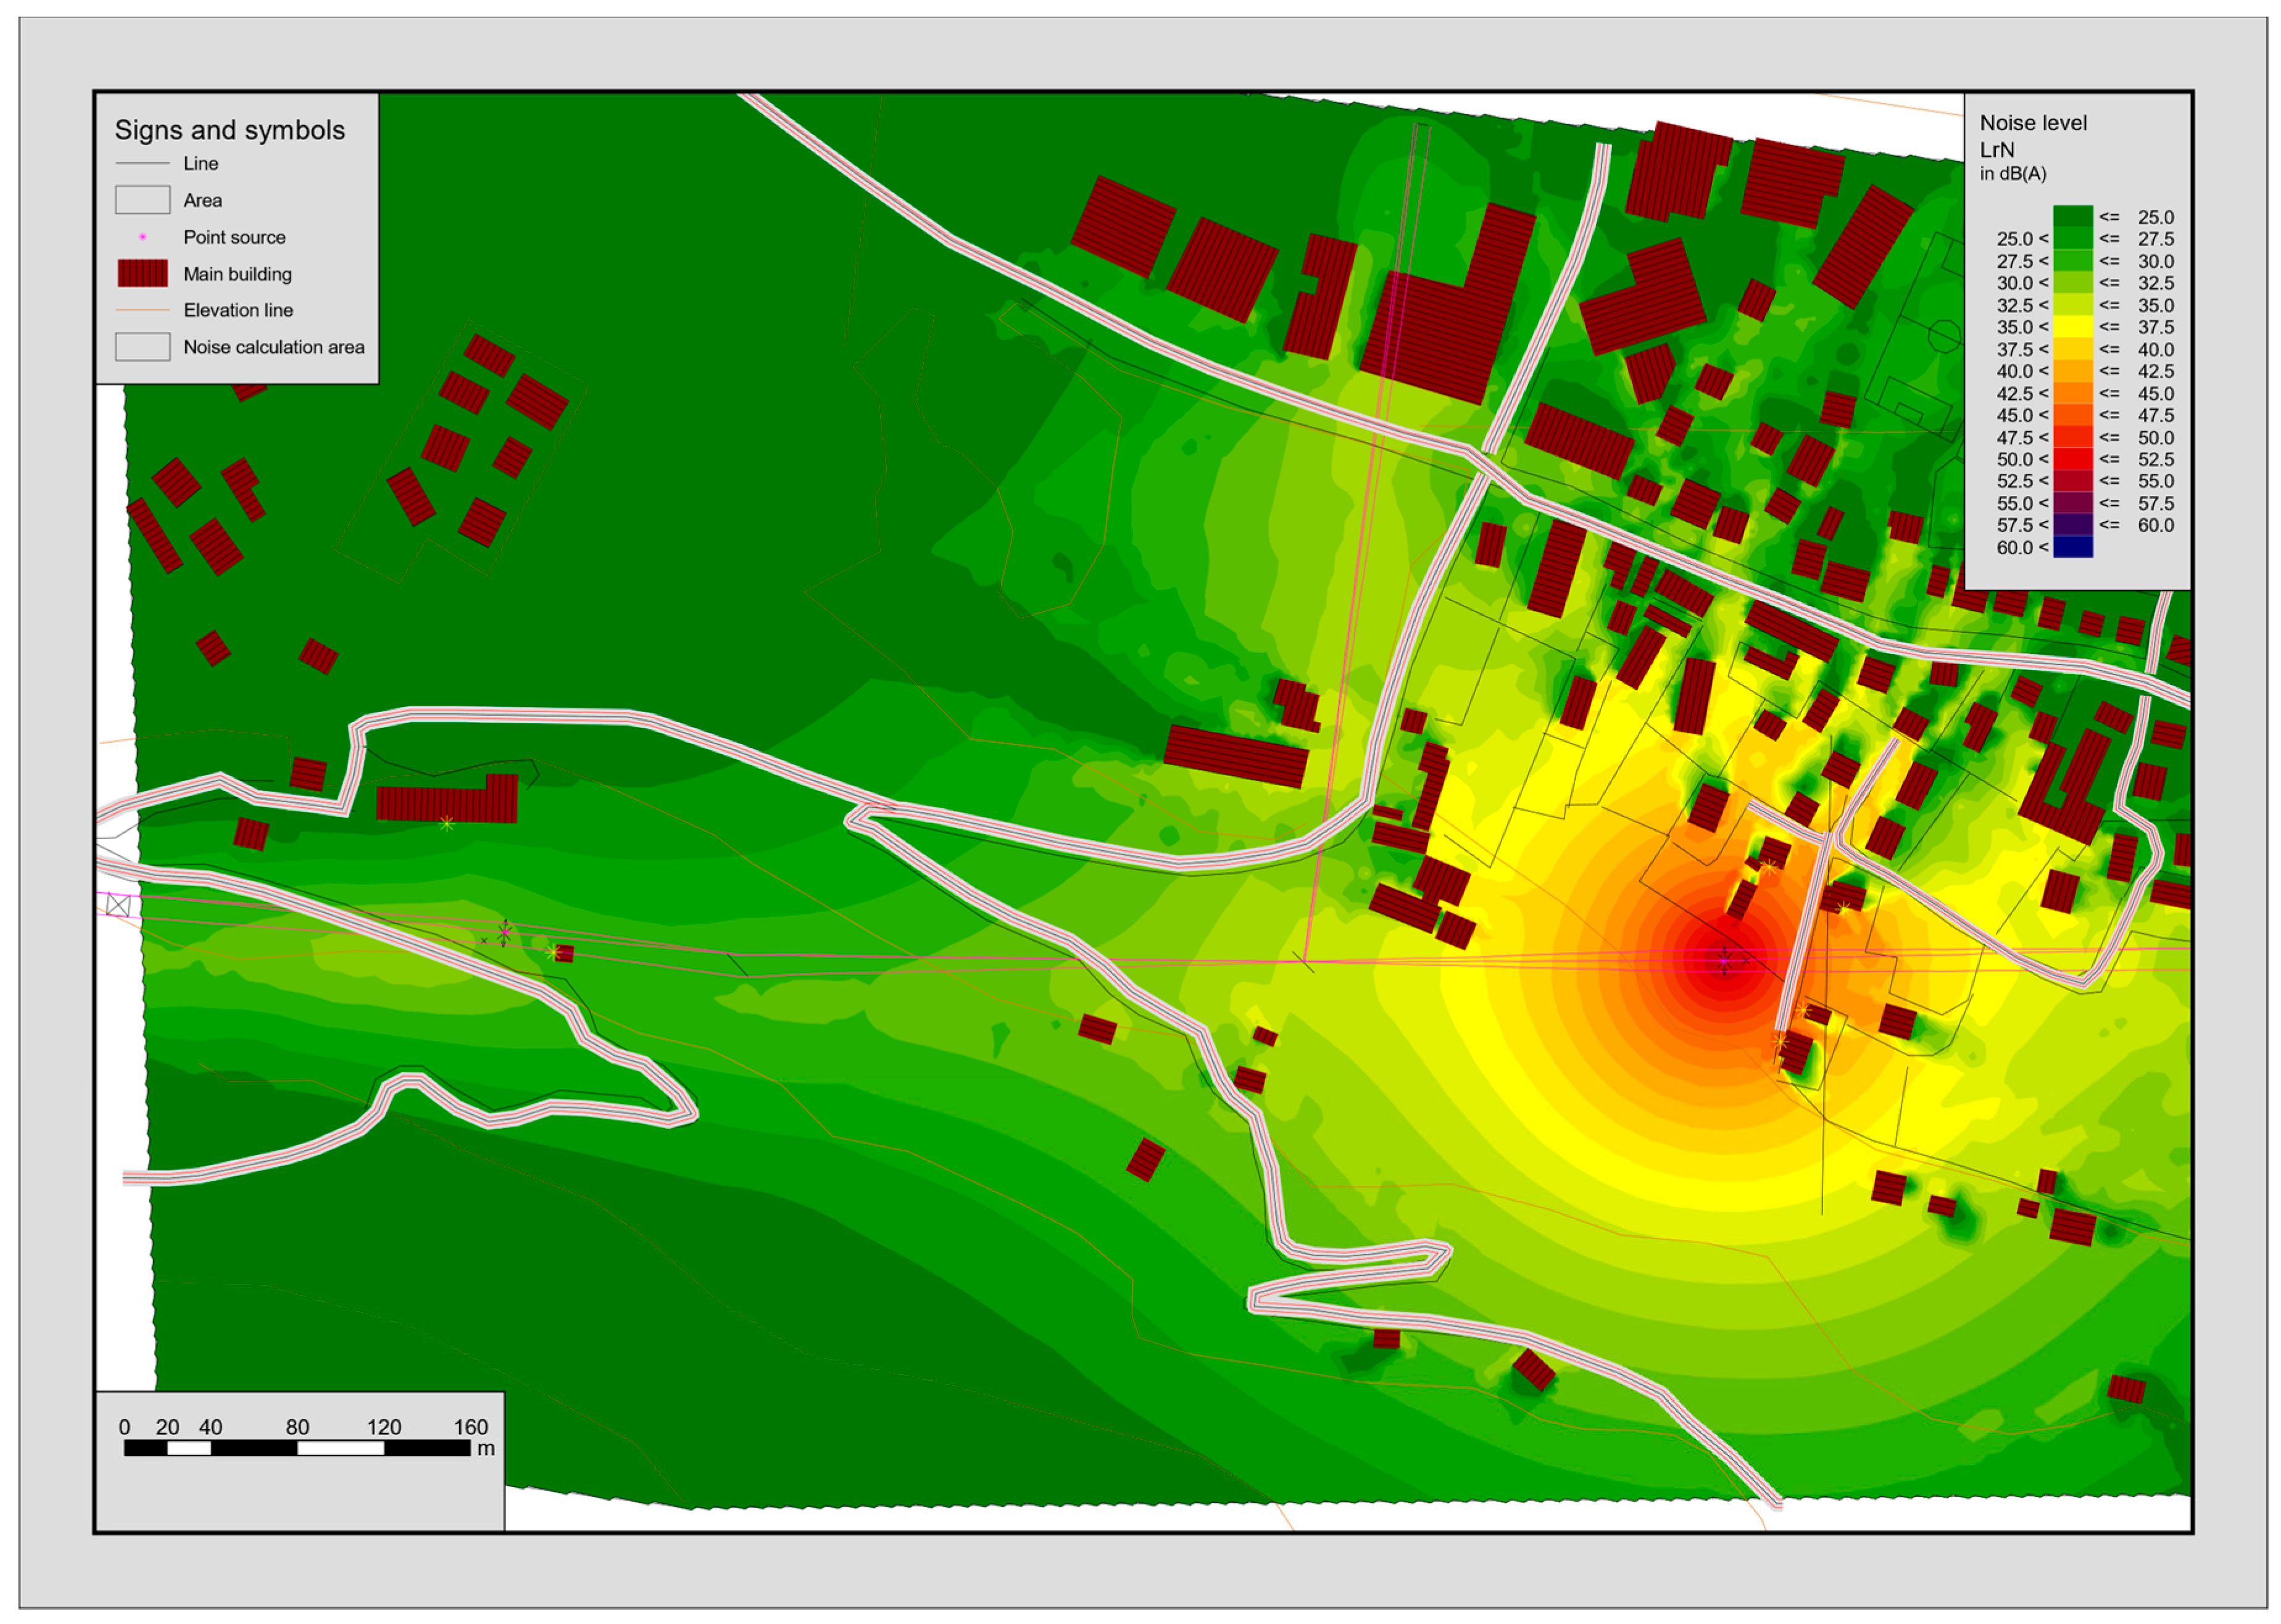
Therefore, the TSG source closer to Receiver 3 has been added to the model and associated to three impulsive events in 15 min. The simulation result can be observed in Figure 14.
An equivalent level LAeq,15min of 43 dB(A) is predicted at Receiver 3 due to the contributions of the corona noise and of three TSG actions in the noisiest period. According to the Italian legislation, no correction for impulsive noise is applicable since the event is related to unpredictable circumstances and therefore cannot be classified as repetitive. The differential criterion can now be verified: the energetic sum of the simulated LAeq,15min = 43 dB(A) and of the residual noise of 45.9 dB(A) is 47.7 dB(A), exceeding the residual by 1.8 dB, which is below the maximum 3 dB permitted during night-time.
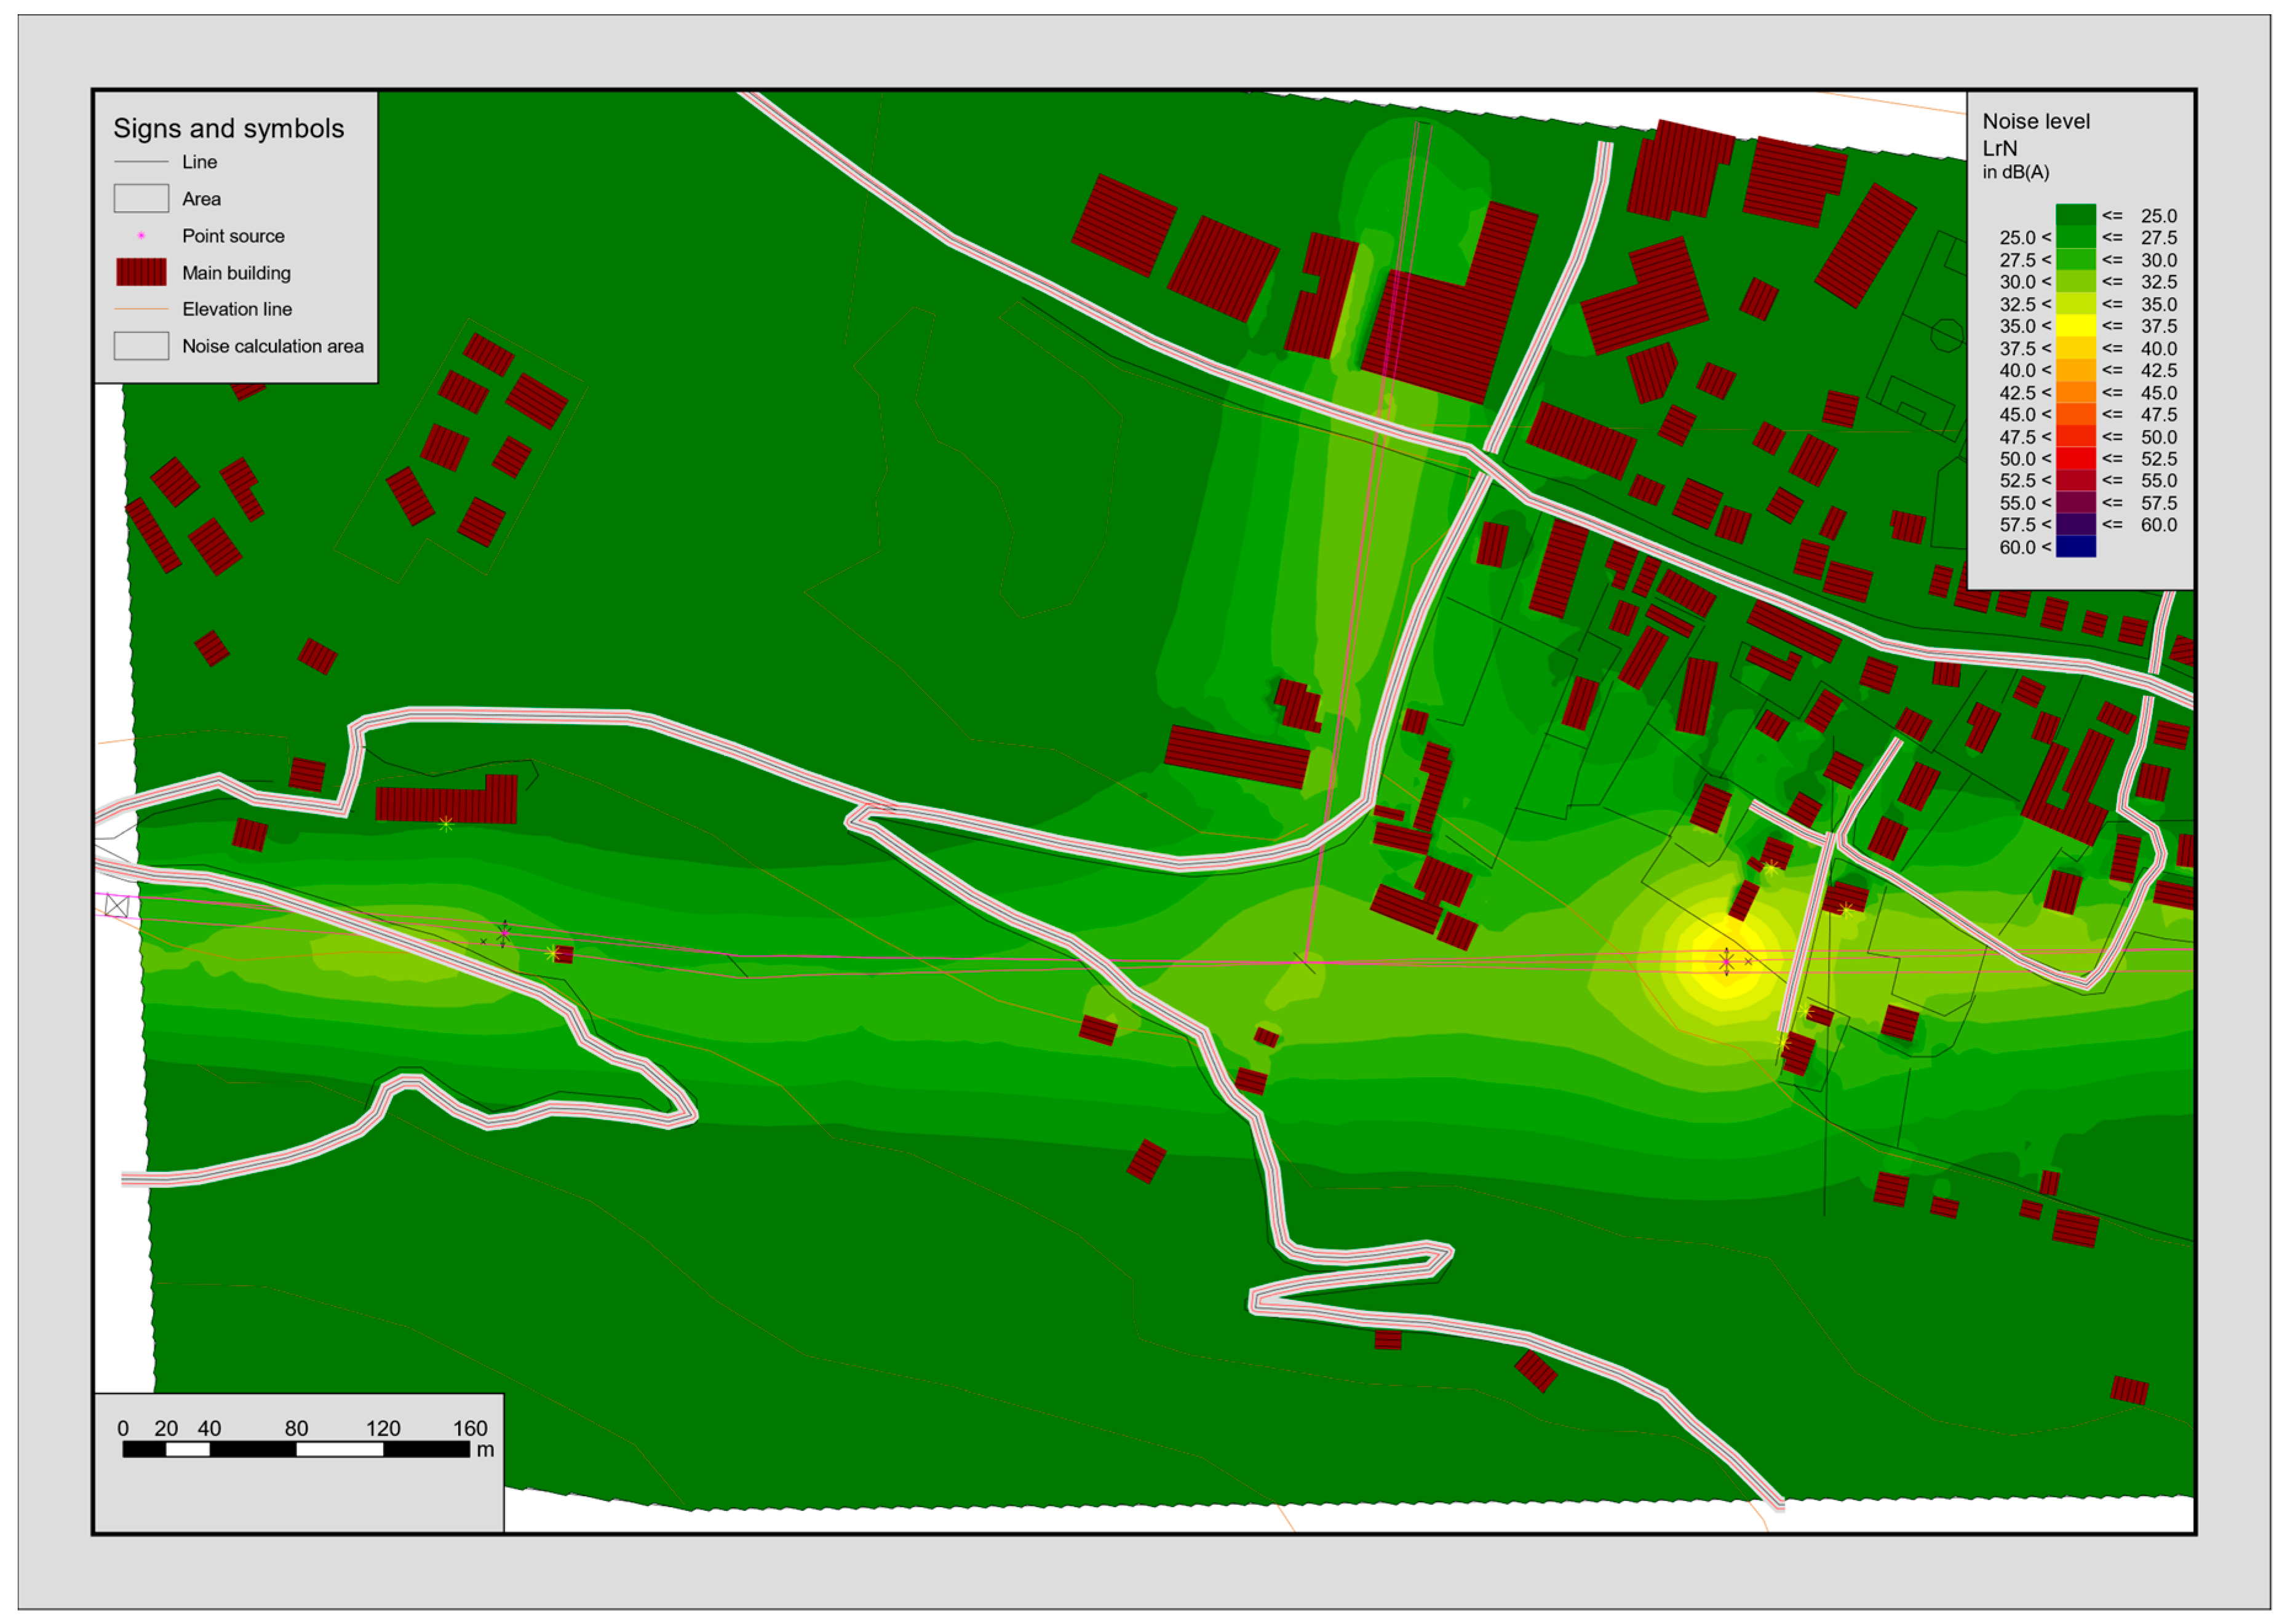
In the context of an assessment performed in compliance to the Italian legislation, the absolute immission and emission limits must be evaluated by distributing the noise induced by corona discharge and TSG operation along the whole night-time: therefore, the A-weighted sound pressure level is obtained by considering stationary corona noise and three TSG actions during the night and computing the equivalent level over the entire reference period. The resulting map is reported in Figure 15.
The night-time equivalent level LAeq, which is the absolute emission level of the infrastructure, is 30 dB(A) at Receiver 3 and it fully respects the limit of 45 dB(A) imposed for this class. The emission can be energetically summed to the residual noise to obtain the absolute immission level: a value of 46 dB(A) is found, which is also below the maximum permitted value of 50 dB(A).
From the predictive analysis carried out in this section, it can be concluded that the proposed maintenance intervention is compliant to the Italian legislation prescriptions.
4. Noise Mitigation Measures and Guidelines
In the simulations reported above, the main noise contribution derives from the TSG action. The described maintenance activity is compatible with the Italian noise assessment framework, but, given the impulsive nature of the TSG noise and the possibility that other situations feature closer receivers, the case can be analyzed in the light of different approaches.
The international recommendation ISO/R 1996:1971 [38], withdrawn in 1982, introduced the idea of comparing the measured noise to a criterion level whose value had to be evaluated according to the specific context. The standard proposed a correlation between the amount by which noise level exceeded the criterion level and the estimated reaction of the exposed community. The gap left after the ISO/R 1996 withdrawal was filled with standard ISO 1996, whose part 1 [39] transformed the basis of the assessment procedure by relating noise effects to the source type. The current version of the standard is particularly focused on noise generated by road traffic, railways or aircrafts, and does not appear tailored to describe the impact of energy infrastructures such as the one considered in this study.
A completely different approach is followed by WHO, which focuses on the health effects of different noise exposures on the population. The Guidelines for community noise [40] set day-time levels of 50–55 dB(A) as the upper threshold, below which most of the non-vulnerable adult population will not be seriously affected. The Night noise guidelines for Europe [14], published ten years later, recommend a night-time noise indicator not exceeding 40 dB(A), associated to frequent, but modest, effects on sleep. Both the documents set threshold values irrespective of the residual noise and of the specific context, which seems unsuitable for the assessment of industrial noise, as pointed out in [41].
A convenient approach is provided by BS 4142:2014 [42], which has been recently updated in the light of the technical progress and is specifically designed for the assessment of industrial and commercial noise impact. The procedure consists in measuring the equivalent level with the noise source on for a given time interval (15 min at night-time), then switching off the source and measuring the residual (equivalent level) and LA90,T (level exceeded 90% of the reference time intervals, T) background noise. The logarithmic difference between the level with source on and the residual level gives the specific noise level, which, when required, must be linearly increased by tonal and/or impulsive penalties to obtain the so-called rating level. The rating level exceedance with respect to the background gives an indication of the disturbance impact: depending on the context, a difference of +5 dB can be an indication of an adverse impact, that is likely to become significant if the difference exceeds +10 dB. To calculate the prominence of impulsive sounds and the relative correction, irrespective of their repetitiveness, the standard implements the Nordtest Method NT ACOU 112 [43], which prescribes to add a term to the measured A-weighted equivalent level to account for the extra-impact of this type of noise. Applying this method to a series of TSG noise measurements performed 20 m far from the source, an average prominence of 9.8 is calculated, leading to a +8.6 dB adjustment. The measured LA90,15min is 44 dB(A). The simulation in Figure 13 predicts an A-weighted equivalent level of 49 dB(A) at this distance, thus the resulting rating level would be around 58 dB(A), exceeding the LA90,15min background noise by 14 dB: according to BS 4142:2014, such a large difference would be likely associated to a “significantly adverse” impact.
It is worth noting that the reference time interval strongly affects the outcome of the assessment: the Nordtest [43] procedure proposes a period of 30 min, but it presents this value as a preliminary choice unsupported by systematic investigations. The shorter 15 min indicated by British Standard [42], which matches the overall duration of the TSG maneuver sequence, reduces the dilution of the disturbance over time and increases the effect of the correction. As a complementary analysis, one of the indicators mentioned by ISO 1996-1 [39], the C-weighted peak level LCpeak, can be monitored, which is found to be 110 dB(C) at the receiver, a value that does not present risks of direct hearing damages.
The noise reduction required to limit the most audible contribution so that it becomes comparable to the background noise can be roughly estimated as the difference between the sound exposure level and the LA90,15min. The sound exposure level describes a sound event characterized by the same energy as the real event but compressed in one second. Its value has been calculated as 74 dB(A) for a hypothetic receiver at 20 m distance from the TSG.
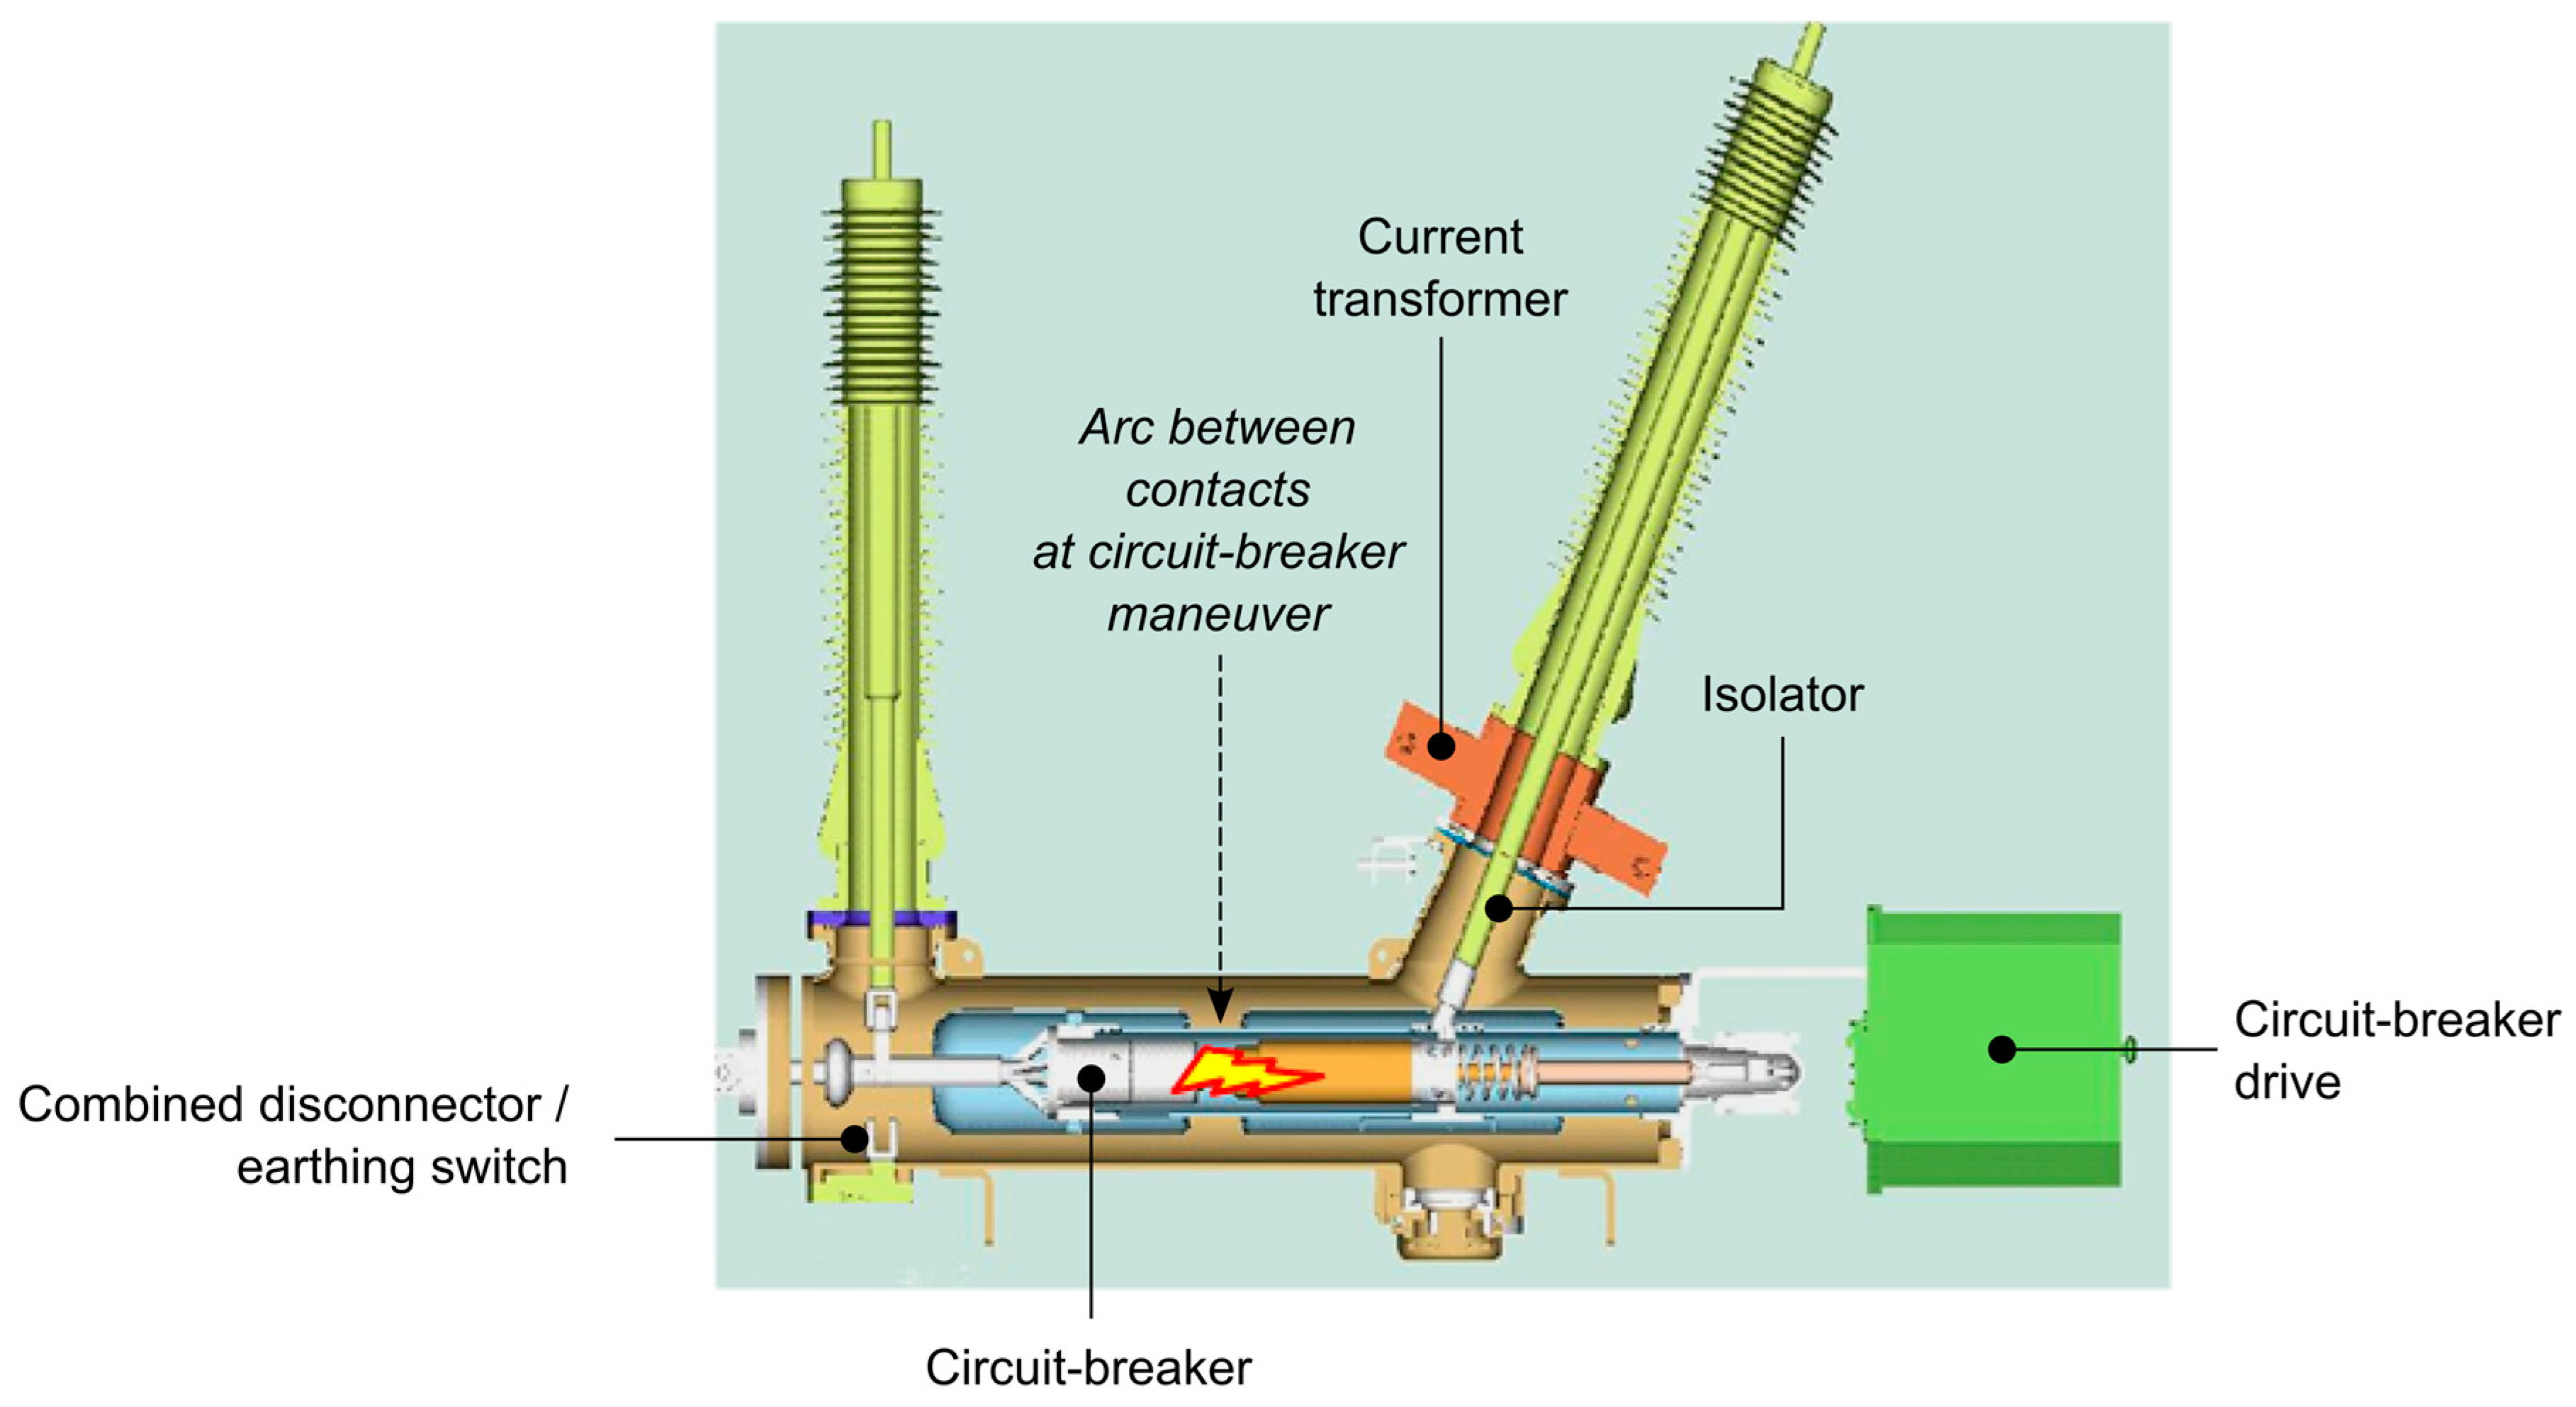
This value can be reached only by working directly on the source: therefore, the main noise generation mechanism of the TSG must be understood. For this particular TSG model, the active part of the device is the mechanical actuator located at one end of the switchgear. This mechanical switch is enclosed in a metal box, whose surface can be easily excited by an impulse force, thus vibrating and radiating sound. A sketch of the TSG inner elements and indications on its working principle are reported in Figure 16.
The proposed mitigation solution consists in the addition of a noise insulating cover around the loudest element of the TSG. A first test has been made by enclosing the drives in boxes realized with 60-mm polystyrene panels having a density of 33 kg m−3. The theoretical performance of this solution is a reduction of the sound pressure level measured at the receiver of approximately 9 dB. Figure 17 shows a picture of the shielded TSG during the measurement campaign. The detected difference between the sound pressure levels measured 10 m away from the unshielded and shielded source is 7 dB. This value is compatible with the theoretical calculation, especially considering the presence of acoustic leakages through the gaps between panels that could not be sealed during the mounting, and that are clearly visible in Figure 17.
In general, a more performing cover can be designed starting from the required degree of sound insulation and exploiting the possibilities offered by sandwich materials, a particularly interesting class of structures which are often chosen for their lightweight and stiffness characteristics. Practical methods are available in the literature to design a sandwich panel with the desired sound transmission loss, also accounting for the coincidence effect (see for instance [44,45]). To reduce the reflections inside the open volume and the transmission to adjoining structures, the internal walls of the enclosure can be lined with soft absorptive material, such as mineral wool.
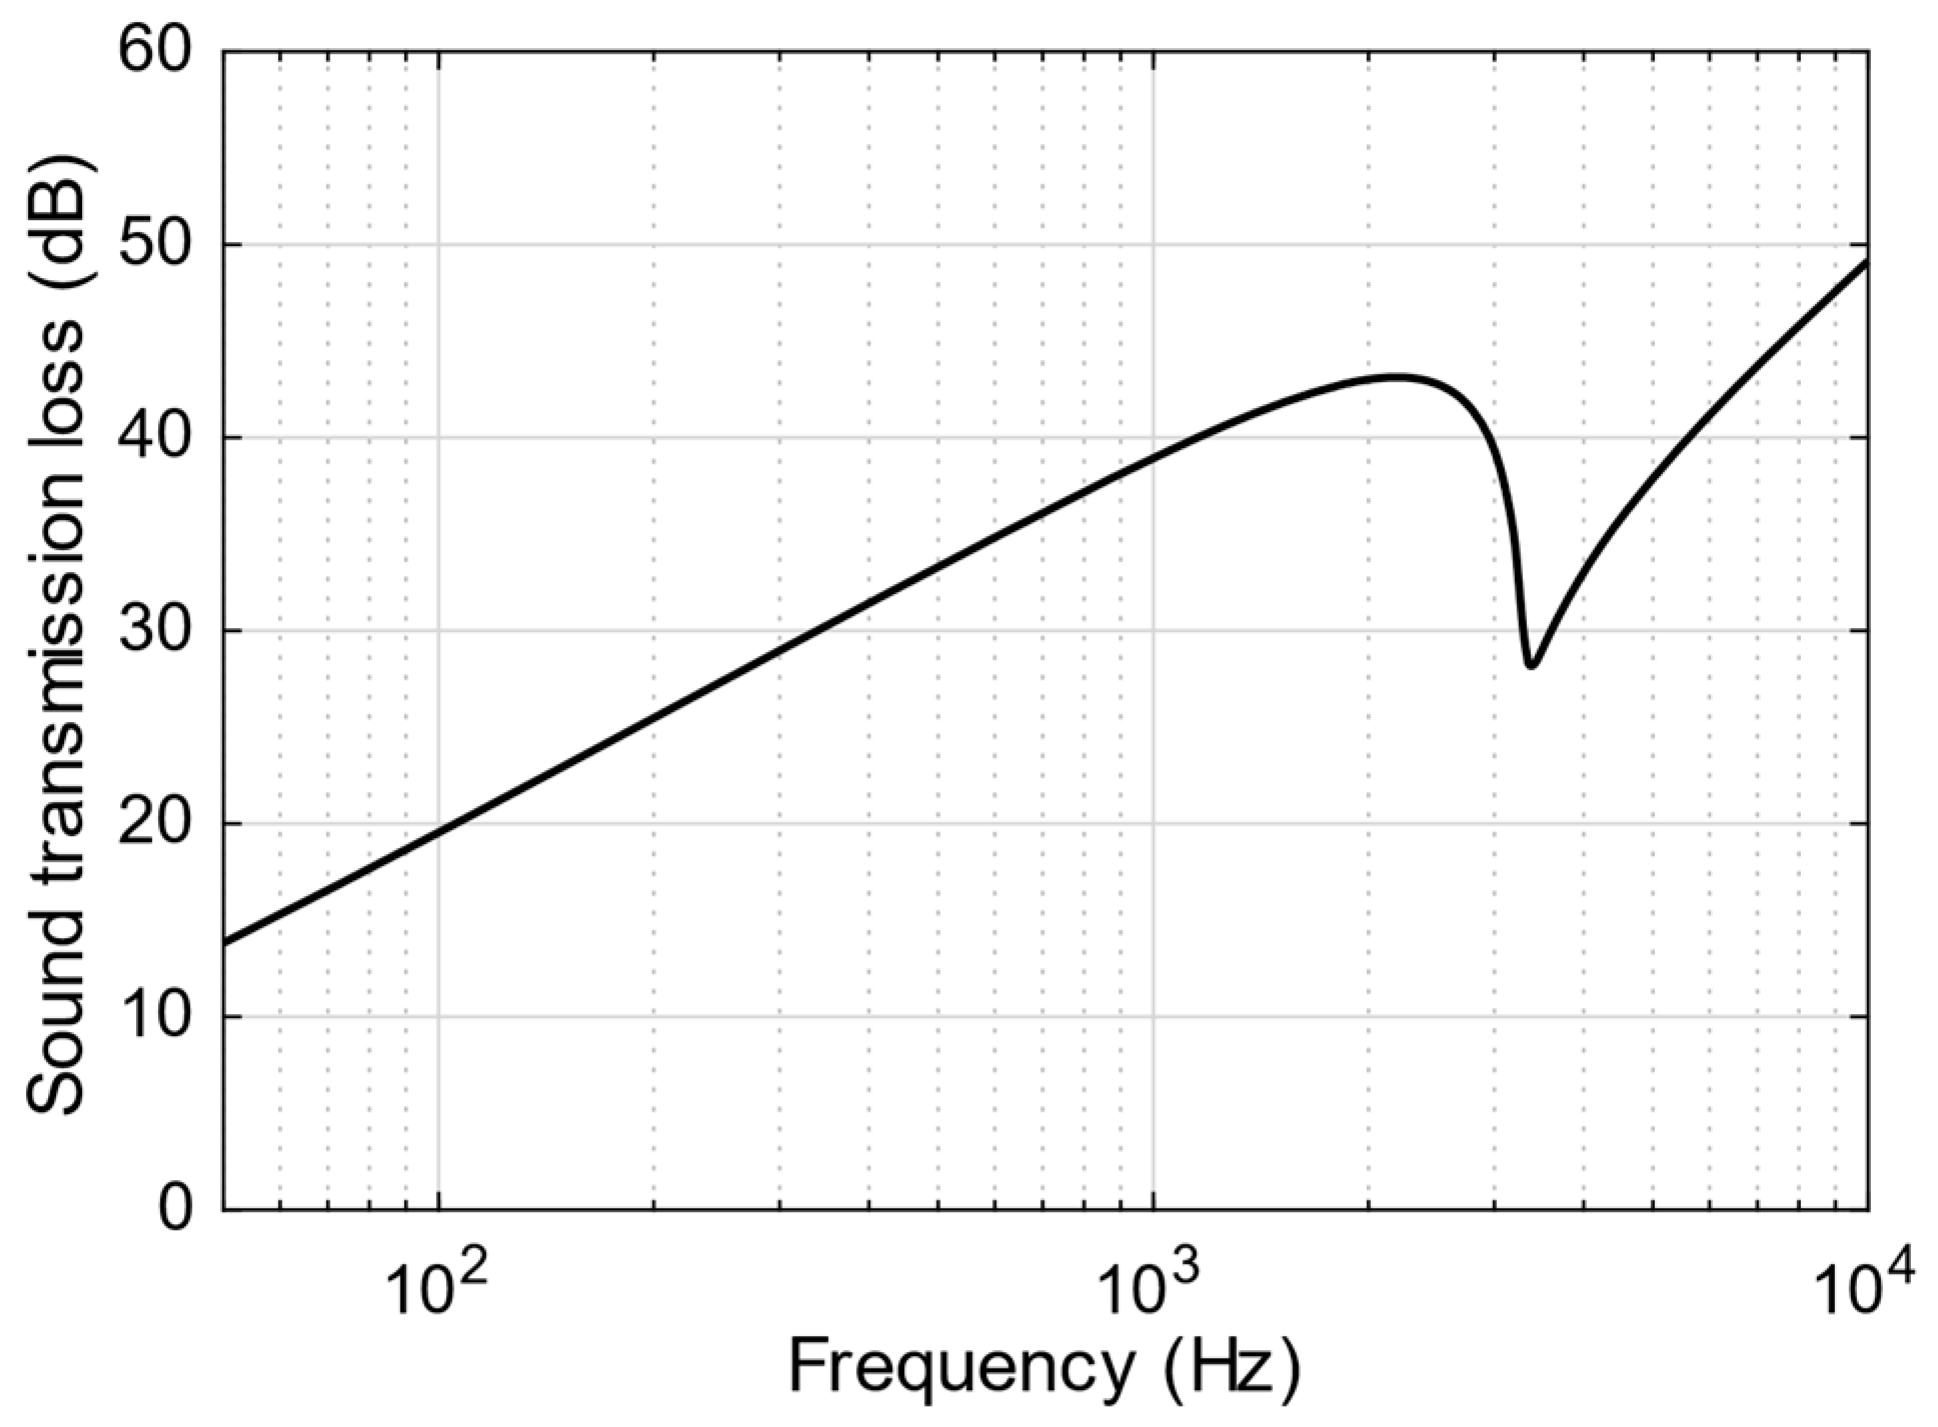
If no solid connection is realized between the vibrating surfaces and the sound insulating panels, and the shell is tailored to the circuit breaker box size, the resulting sound energy level radiated by the point source representing the TSG can be estimated by subtracting the sound transmission loss of the insulating panel from the measured sound energy level of the source. Figure 18 shows the sound transmission loss of a composite panel made of two external aluminum 4-mm sheets sandwiching a 10-mm polystyrene core (overall mass per unit area 22 kg m−2), determined according to the method outlined in [44]. Based on this model, the designed insulating shield should allow to achieve an average single-valued sound reduction index of 37 dB.
The estimated sound transmission loss values as a function of frequency have been subtracted from the sound energy level of the unshielded device (C–O event). The resulting value of LJ = 93 dB has been used to characterize the shielded TSG in the noise mapping software, so to predict the effect of the designed insulation on the sound pressure level distribution. Figure 19 reports the simulated noise map after the intervention.
The predicted A-weighted sound pressure level due to the transmission line and the shielded TSG is now 28 dB(A) at 20 m distance from the point source. Since the shield attenuates the peak, the correction for the impulsive nature of the sound is reduced as well. The time history of the shielded impulse has been reconstructed by subtracting the attenuation frequency spectrum from the unshielded noise spectra recorded instant by instant. This made it possible to calculate a new adjustment of 5.7 dB, and to obtain a new rating level of 28 + 5.7 ≈ 34 dB(A), well below the background noise level. The peak level heard at the receiver decreases from 110 dB(C) to 87 dB(C). In reminding that the TSG operation is occasional and caused by emergencies, this analysis shows the validity of the proposed mitigation intervention.
5. Conclusions
This paper presents an original solution to upgrade a high-voltage overhead transmission line, aiming to align the structure to the state-of-the-art in terms of technology, safety and environmental impact. The innovative installation of the tele-switchgears directly on trellises, conceived by the Torino Transmission Operating Area of Terna with the collaboration of the University of Brescia and the University of Padova, allows reducing visual intrusion, land use and costs while increasing the system resilience. On the other hand, the noise impact on the population living nearby needs to be investigated, thus a thorough noise impact assessment has been carried out by the authors.
The sound power level generated by the corona discharge effect in average rain conditions has been computed from the voltage gradients of each conductor and other line parameters, resulting well below the background noise. The sound emitted by the tele-switchgear has been experimentally found to be significant. The sound power levels of the two types of sources have been fed as input to a professional software, by means of which the sound pressure levels have been mapped and the impact on the closest receivers has been evaluated. Simulation results have been analyzed considering the Italian legislative framework and international good practice recommendations.
The noise generated by the switching operations of the tele-switchgears is a transient event which can occur without prior notice and that can be heard by the local population. Although the maintenance intervention fulfills the Italian legislation prescriptions, a possible solution to mitigate the acoustic impact of the transmission system has been proposed and simulated, showing that shielding the noise generated by the tele-switchgears with suitable materials can be an effective way to comply with the relevant regulations, without sacrificing efficient technical solutions.
Finally, the investigated solution composed by trellis-mounted tele-switchgears is a concrete opportunity for increasing the performances of transmission systems, particularly in proximity of sensible loads. While evident advantages in terms of visual impact and dimensions are provided, the developed model demonstrates that suitable shields can limit the noise impact significantly within admitted thresholds.
Therefore, the study represents a new concept of approaching the sustainable design of this type of actions, and it can be adopted and extended to meet some of the challenges that lie ahead in the near future for power transmission.
Acknowledgments
The authors would like to thank Luca Biancardi, Dario Gamba and Dario Polinelli (AOT Torino, Terna) for their contribution in the experimental measurements.
Author Contributions
E.A.P. developed the noise mapping models, performed sound power measurements and wrote the paper. F.B. and A.D. analyzed the specifications of the power line, adapted the corona noise prediction code and carried out the simulations. R.S. conceived the idea of an unconventional application of the tele-switchgears and supervised the work.
Conflicts of Interest
The authors declare no conflict of interest.
References
- Lienert, P.; Sütterlin, B.; Siegrist, M. Public acceptance of high-voltage power lines: The influence of information provision on undergrounding. Energy Policy 2018, 112, 305–315. [Google Scholar] [CrossRef]
- Park, C.Y.; Han, S.H.; Lee, K.-W.; Lee, Y.M. Analyzing drivers of conflict in energy infrastructure projects: Empirical case study of natural gas pipeline sectors. Sustainability 2017, 9, 2031. [Google Scholar] [CrossRef]
- Doukas, H.; Karakosta, C.; Flamos, A.; Psarras, J. Electric power transmission: An overview of associated burdens. Int. J. Energy Res. 2011, 35, 979–988. [Google Scholar] [CrossRef]
- Elliott, P.; Wadley, D. Coming to Terms with Power Lines. Int. Plan. Stud. 2012, 17, 179–201. [Google Scholar] [CrossRef]
- Ceglarz, A.; Beneking, A.; Ellenbeck, S.; Battaglini, A. Understanding the role of trust in power line development projects: Evidence from two case studies in Norway. Energy Policy 2017, 110, 570–580. [Google Scholar] [CrossRef]
- Cain, N.L.; Nelson, H.T. What drives opposition to high-voltage transmission lines? Land Use Policy 2013, 33, 204–213. [Google Scholar] [CrossRef]
- Moura, M.D.C.; Diniz, H.H.L.; Droguett, E.L.; da Cunha, B.S.; Lins, I.D.; Simoni, V.R. Embedding resilience in the design of the electricity supply for industrial clients. PLoS ONE 2017, 12, e0188875. [Google Scholar] [CrossRef] [PubMed]
- Reichl, J.; Schmidthaler, M.; Schneider, F. The value of supply security: The costs of power outages to Austrian households, firms and the public sector. Energy Econ. 2013, 36, 256–261. [Google Scholar] [CrossRef]
- Shivakumar, A.; Welsch, M.; Taliotis, C.; Jakšić, D.; Baričević, T.; Howells, M.; Gupta, S.; Rogner, H. Valuing blackouts and lost leisure: Estimating electricity interruption costs for households across the European Union. Energy Res. Soc. Sci. 2017, 34, 39–48. [Google Scholar] [CrossRef]
- Sullivan, M.J.; Vardell, T.; Johnson, M. Power interruption costs to industrial and commercial consumers of electricity. IEEE Trans. Ind. Appl. 1997, 33, 1448–1458. [Google Scholar] [CrossRef]
- Fortes, M.Z.; Ferreira, V.H.; Zanghi, R. Fault Diagnosis in Transmission Lines: Trends and Main Research Areas. IEEE Lat. Am. Trans. 2015, 13, 3324–3332. [Google Scholar] [CrossRef]
- Moro, F.; Turri, R. Accurate calculation of the right-of-way width for power line magnetic field impact assessment. Prog. Electromagn. Res. 2012, 37, 343–364. [Google Scholar] [CrossRef]
- Bignucolo, F.; Coppo, M.; Savio, A.; Turri, R. Use of rod compactors for high voltage overhead power lines magnetic field mitigation. Energies 2017, 10, 1381. [Google Scholar] [CrossRef]
- World Health Organization. Night Noise Guidelines for Europe; WHO Regional Office for Europe: Copenhagen, Denmark, 2009; ISBN 978-92-890-4173-7. [Google Scholar]
- King, E.A.; Murphy, E. Environmental noise—‘Forgotten’ or ‘Ignored’ pollutant? Appl. Acoust. 2016, 112, 211–215. [Google Scholar] [CrossRef]
- Silva, L.T.; Mendes, J.F.G. City Noise-Air: An environmental quality index for cities. Sustain. Cities Soc. 2012, 4, 1–11. [Google Scholar] [CrossRef]
- Hume, K.I.; Brink, M.; Basner, M. Effects of environmental noise on sleep. Noise Health 2012, 14, 297–302. [Google Scholar] [CrossRef] [PubMed]
- Alves, J.A.; Silva, L.T.; Remoaldo, P.C. The influence of low-frequency noise pollution on the quality of life and place in sustainable cities: A case study from Northern Portugal. Sustainability 2015, 7, 13920–13946. [Google Scholar] [CrossRef] [Green Version]
- Moorhouse, A.; Waddington, D.; Adams, M. Procedure for the Assessment of Low Frequency Noise Complaints; Department for Environment Food and Rural Affairs (DEFRA): London, UK, 2011.
- Vos, J. On the relevance of shooting-noise-induced sleep disturbance to noise zoning. In Proceedings of the 8th International Congress on Noise as a Public Health Problem, Rotterdam, The Netherlands, 29 June–3 July 2003; Foundation ICBEN: Schiedam, The Netherlands, 2003; pp. 205–207. [Google Scholar]
- Yang, K.-H.; Lee, D.-I.; Hwang, G.-H.; Park, J.-H.; Chartier, V.L. New formulas for predicting audible noise from overhead HVAC lines using evolutionary computations. IEEE Trans. Power Deliv. 2000, 15, 1243–1251. [Google Scholar] [CrossRef]
- Wan, B.; He, W.; Pei, C.; Wu, X.; Chen, Y.; Zhang, Y.; Lan, L. Audible noise performance of conductor bundles based on cage test results and comparison with long term data. Energies 2017, 10, 958. [Google Scholar] [CrossRef]
- Li, Q.; Rowland, S.M.; Dupere, I.; Shuttleworth, R. Acoustic noise evaluation for overhead line conductors using an anechoic chamber. IEEE T. Power Deliv. 2017, 32, 1835–1843. [Google Scholar] [CrossRef]
- Donini, A.; Spezie, R.; Cortina, R.; Piana, E.A.; Turri, R. Accurate prediction of the corona noise produced by overhead transmission lines. In Proceedings of the AEIT International Annual Conference: Sustainable Development in the Mediterranean Area, Energy and ICT Networks of the Future, Capri, Italy, 5–7 October 2016; Institute of Electrical and Electronics Engineers Inc.: Piscataway, NJ, USA, 2017. [Google Scholar]
- Piana, E.A.; Donini, A.; Spezie, R.; Turri, R.; Cortina, R. Prediction of the audible noise generated by corona discharge on a power transmission line: A model validation. In Proceedings of the 24th International Congress on Sound and Vibration (ICSV), London, UK, 23–27 July 2017; International Institute of Acoustics and Vibrations: Auburn, AL, USA, 2017. [Google Scholar]
- Varivodov, V.N.; Kovalev, D.I.; Krupenin, N.V.; Khrenov, S.I.; Mirzabekyan, G.Z. The current state and possibilities for development of switchgears for a voltage of 6–35 kV. Russ. Electr. Eng. 2017, 88, 503–508. [Google Scholar] [CrossRef]
- Janssen, A.L.J.; Dufournet, D.; Ito, H.; Shperling, B. Investigations on requirements for UHV/EHV AC switchgear by CIGRE study committee A3. IEEE Trans. Power Deliv. 2015, 30, 377–384. [Google Scholar] [CrossRef]
- International Organization for Standardization. ISO 3746:2010—Acoustics—Determination of Sound Power Levels and Sound Energy Levels of Noise Sources Using Sound Pressure—Survey Method Using an Enveloping Measurement Surface over a Reflecting Plane; International Organization for Standardization: Geneva, Switzerland, 2010. [Google Scholar]
- International Council on Large Electric Systems. CIGRE WG 01 Addendum to Doc. 20: Interferences Produced by Corona Effect of Electric Systems; International Council on Large Electric Systems: Paris, France, 1997. [Google Scholar]
- Ni, Y.; Zhang, G.Z.; Zhang, X.W.; Lu, Y.; Zhang, Y.M.; Chen, Y.C. Assessment and treatment of noise in UHV AC test base. High Volt. Eng. 2009, 35, 1856–1861. [Google Scholar]
- Hu, S.; Wu, X.; Ouyang, L. The research on the noise control optimization scheme of the 110kv new generation smart substation. In Proceedings of the 24th International Congress on Sound and Vibration (ICSV), London, UK, 23–27 July 2017; International Institute of Acoustics and Vibrations: Auburn, AL, USA, 2017. [Google Scholar]
- International Organization for Standardization. ISO 9613-1:1993—Acoustics—Attenuation of Sound during Propagation Outdoors—Part 1: Calculation of the Absorption of Sound by the Atmosphere; International Organization for Standardization: Geneva, Switzerland, 1993. [Google Scholar]
- International Organization for Standardization. ISO 9613-2:1996—Acoustics—Attenuation of Sound during Propagation Outdoors—Part 2: General Method of Calculation; International Organization for Standardization: Geneva, Switzerland, 1996. [Google Scholar]
- Kephalopoulos, S.; Paviotti, M.; Anfosso-Lédée, F. Common Noise Assessment Methods in Europe (CNOSSOS-EU); Publications Office of the European Union: Luxembourg, 2012. [Google Scholar]
- Italian Parliament Law 26 October 1995, n. 447—Framework Law on Environmental Noise, 1995. Available online: http://www.gazzettaufficiale.it/atto/serie_generale/caricaDettaglioAtto/originario?atto.dataPubblicazioneGazzetta=1995-10-30&atto.codiceRedazionale=095G0477 (accessed on 11 January 2018).
- Iannace, G.; Maffei, L. Attenuazione del rumore ambientale attraverso una finestra aperta. Riv. Ital. Acust. 1995, 19, 5–6. [Google Scholar]
- International Organization for Standardization. ISO 226:2003—Acoustics—Normal Equal-Loudness-Level Contours; International Organization for Standardization: Geneva, Switzerland, 2003. [Google Scholar]
- International Organization for Standardization. ISO/R 1996:1971—Acoustics—Assessment of Noise with Respect to Community Response (Withdrawn); International Organization for Standardization: Geneva, Switzerland, 1971. [Google Scholar]
- International Organization for Standardization. ISO 1996-1:2016—Acoustics—Description, Measurement and Assessment of Environmental noise—Part 1: Basic Quantities and Assessment Procedures; International Organization for Standardization: Geneva, Switzerland, 2016. [Google Scholar]
- Berglund, B.; Lindvall, T.; Schwela, D.H.; World Health Organization. Occupational and Environmental Health Team. In Guidelines for Community Noise; World Health Organization: Geneva, Switzerland, 1999. [Google Scholar]
- Baker, D. Application of noise guidance to the assessment of industrial noise with character on residential dwellings in the UK. Appl. Acoust. 2015, 93, 88–96. [Google Scholar] [CrossRef]
- British Standards Institution. BS 4142:2014—Methods for Rating and Assessing Industrial and Commercial Sound; British Standards Institution: London, UK, 2014. [Google Scholar]
- Nordtest. NT ACOU 112—Acoustics: Prominence of Impulsive Sounds and for Adjustment of Laeq; Nordtest: Espoo, Finland, 2002. [Google Scholar]
- Piana, E.A.; Nilsson, A.C. Prediction of the sound transmission loss of sandwich structures based on a simple test procedure. In Proceedings of the 17th International Congress on Sound and Vibration (ICSV), Cairo, Egypt, 18–22 July 2010; Volume 1, pp. 109–116. [Google Scholar]
- Piana, E.A.; Petrogalli, C.; Paderno, D.; Carlsson, U. Application of the wave propagation approach to sandwich structures: Vibro-acoustic properties of aluminum honeycomb materials. Appl. Sci. 2018, 8, 45. [Google Scholar] [CrossRef]
Figure 1.
Satellite picture of the site where the transmission line at hand runs through. Node T2 is the junction between the main line and the line dedicated to the steel plant.
Figure 1.
Satellite picture of the site where the transmission line at hand runs through. Node T2 is the junction between the main line and the line dedicated to the steel plant.

Figure 2.
3D model of the tele-switchgear (TSG) used to disconnect the power line nodes.

Figure 3.
Three possible solutions to install maneuver devices: (a) ground station in correspondence of the junction (plan view); (b) substation close to trellis (plan view); and (c) installation on trellises (front view).
Figure 3.
Three possible solutions to install maneuver devices: (a) ground station in correspondence of the junction (plan view); (b) substation close to trellis (plan view); and (c) installation on trellises (front view).

Figure 4.
Example of TSG installation in a high-voltage substation.

Figure 5.
Sketch of the measurement positions. It can be observed that the sound pressure level decay per doubling of distance is about 6 dB.
Figure 5.
Sketch of the measurement positions. It can be observed that the sound pressure level decay per doubling of distance is about 6 dB.

Figure 6.
Time history of the noise generated by the TSG. First event: O–C–O; second event: C–O.

Figure 7.
Sound energy level spectra associated to the TSG O–C–O (solid line) and C–O (dotted line) events.
Figure 7.
Sound energy level spectra associated to the TSG O–C–O (solid line) and C–O (dotted line) events.

Figure 8.
Example of variability in the relative position of the conductors along the transmission line. The installation of two TSGs is planned on trellises T1 and T4.
Figure 8.
Example of variability in the relative position of the conductors along the transmission line. The installation of two TSGs is planned on trellises T1 and T4.

Figure 9.
Sound power level due to corona discharge from each of the segments in which the line between trellises T1 and T2 has been divided for the simulations (spatial discretization: 10 m).
Figure 9.
Sound power level due to corona discharge from each of the segments in which the line between trellises T1 and T2 has been divided for the simulations (spatial discretization: 10 m).

Figure 10.
Relative positions of the receivers with respect to the main sources.

Figure 11.
Noise map relative to the contribution of corona noise alone. A vertical section is shown in correspondence of the closest receivers.
Figure 11.
Noise map relative to the contribution of corona noise alone. A vertical section is shown in correspondence of the closest receivers.

Figure 12.
Example of time history of measured background noise (solid line). Dashed line: predicted LE,corona due to corona noise alone in correspondence of Receiver 3.
Figure 12.
Example of time history of measured background noise (solid line). Dashed line: predicted LE,corona due to corona noise alone in correspondence of Receiver 3.

Figure 13.
Spectrum (solid line) obtained by background measurements, including corona noise. Dashed lines represent equal-loudness-level contours (phon).
Figure 13.
Spectrum (solid line) obtained by background measurements, including corona noise. Dashed lines represent equal-loudness-level contours (phon).

Figure 14.
Noise mapping of the overall infrastructure emission: equivalent sound pressure level, with three impulsive events in 15 min.
Figure 14.
Noise mapping of the overall infrastructure emission: equivalent sound pressure level, with three impulsive events in 15 min.

Figure 15.
Noise mapping of the overall infrastructure emission: equivalent sound pressure level during the whole night-time reference period.
Figure 15.
Noise mapping of the overall infrastructure emission: equivalent sound pressure level during the whole night-time reference period.

Figure 16.
Sketch of the TSG. The circuit-breaker drive is the main noise source.

Figure 17.
TSG with drives shielded by polystyrene enclosures.

Figure 18.
Estimated sound transmission loss of the panels selected to reduce the TSG noise emissions.
Figure 18.
Estimated sound transmission loss of the panels selected to reduce the TSG noise emissions.

Figure 19.
Noise mapping of the overall infrastructure emission: equivalent sound pressure level with three impulsive events in 15 min, after the installation of noise shields around the TSGs.
Figure 19.
Noise mapping of the overall infrastructure emission: equivalent sound pressure level with three impulsive events in 15 min, after the installation of noise shields around the TSGs.


Table 1.
Comparison between the TSG installation solutions shown in Figure 3. Increasing number of bullets indicates increasing convenience.
Table 1.
Comparison between the TSG installation solutions shown in Figure 3. Increasing number of bullets indicates increasing convenience.
| No. | Description | Land Use/Visual Pollution | Weather Resilience | Cost Savings | Required Permissions | Quietness |
|---|---|---|---|---|---|---|
| 1 | Single ground station | • | •• | • | • | •• |
| 2 | Two substations | •• | •• | •• | • | •• |
| 3 | Two TSGs mounted on trellises | ••• | ••• | ••• | ••• | • |
© 2018 by the authors. Licensee MDPI, Basel, Switzerland. This article is an open access article distributed under the terms and conditions of the Creative Commons Attribution (CC BY) license (http://creativecommons.org/licenses/by/4.0/).
Share and Cite
MDPI and ACS Style
Piana, E.A.; Bignucolo, F.; Donini, A.; Spezie, R. Maintenance of a High-Voltage Overhead Transmission Line: Sustainability and Noise Impact Assessment. Sustainability 2018, 10, 491. https://doi.org/10.3390/su10020491
AMA Style
Piana EA, Bignucolo F, Donini A, Spezie R. Maintenance of a High-Voltage Overhead Transmission Line: Sustainability and Noise Impact Assessment. Sustainability. 2018; 10(2):491. https://doi.org/10.3390/su10020491
Chicago/Turabian StylePiana, Edoardo Alessio, Fabio Bignucolo, Alberto Donini, and Roberto Spezie. 2018. "Maintenance of a High-Voltage Overhead Transmission Line: Sustainability and Noise Impact Assessment" Sustainability 10, no. 2: 491. https://doi.org/10.3390/su10020491
Note that from the first issue of 2016, this journal uses article numbers instead of page numbers. See further details here.