Management of Power Quality Issues from an Economic Point of View
by
Horia Gheorghe Beleiu
1,*, 
Ioana Natalia Beleiu
2,
Sorin Gheorghe Pavel
1 and
Cosmin Pompei Darab
1 1
Department of Electrical Power System and Management, Faculty of Electrical Engineering, Technical University of Cluj-Napoca, 28 Memorandumului Street, 400114 Cluj-Napoca, Romania
2
Department of Management, Faculty of Economics and Business Administration, Babes-Bolyai University, 58-60 Teodor Mihali Street, 400591 Cluj-Napoca, Romania
*
Author to whom correspondence should be addressed.
Sustainability 2018, 10(7), 2326; https://doi.org/10.3390/su10072326
Submission received: 26 May 2018
/
Revised: 15 June 2018
/
Accepted: 3 July 2018
/
Published: 5 July 2018
Abstract
:In a context with an increased level of competitiveness, companies are more and more interested in aspects concerning sustainable development. The implications of inadequate power quality (PQ) can determine important financial losses and influence companies’ sustainable development through the generated effects. This article aims to facilitate the management of PQ by proposing a method for estimating the economic consequences of a poor PQ, with priority for the disturbances with significant economic effects. To determine the total cost for each type of PQ perturbation that may occur a classification of cost categories was made such as interruptions, process slowdowns, equipment failure, equipment downtime, reduced energy efficiency, lower product quality, lower labor productivity, and other indirect costs. Each PQ disturbance affects the final end-user differently. For calculating the total value for each type of PQ issues, different calculation formulas have been proposed so that each perturbation includes only those components associated with that perturbation. A case study was used to validate the proposed method. Also, the paper includes a technical and economic analysis of the possible compensation solutions for PQ disturbances that may affect the studied company. In conclusion, an understanding of PQ issues’ consequences and an appropriate approach to PQ compensation solutions can be beneficial to any electrical power end-user.
1. Introduction
In a dynamic environment with a growing level of competitiveness, there is the question of progress towards economic development without exhausting natural resources or affecting the environment. In 1987, sustainable development was defined by the World Commission on Environment and Development in the Brundtland Report as the “development that meets the needs of the present without compromising the ability of future generations to meet their own needs” [1]. The Brundtland report is considered a moment of reference in the development of the concept, which is continually evolving and receives growing attention at micro and macroeconomic level. In 1992 in Rio de Janeiro the Earth Summit (also known as the United Nations Conference on Environment and Development (UNCED)) took place to discuss international economic development and environmental protection issues [2]. More is needed than internal changes and adapted management systems for companies to accelerate their approach to sustainability [2] since the concept is not just important for business but also incredibly complex. The importance of sustainable development has been acknowledged by the European Union when EU representatives signed the Rio Declaration and engaged in developing a cross-sectoral sustainable development strategy [3].
At the European level, sustainable development is an important challenge, being included as a fundamental objective in the Amsterdam Treaty from 1997. The Sustainable Development Strategy of the European Union, adopted by the European Council in the year 2006, addresses in an integrated manner economic, social, and environmental issues, in accordance to the objective of life quality continuous improvement and well-being for current and future generations [4]. Sustainability requires integration of economic, social, and environmental perspectives [3]. Adopting a sustainable initiative does not ensure success [5], but it is used as a fundamental objective of development and can make organizations, regions, and countries stronger and more competitive. Blackburn argues that approaching sustainability at a business level can help a company avoid problems and identify new opportunities [5]. Pursuing sustainability is about many issues that usually generate visible short-term effects, as well as mid- and long-term benefits [5]. Focusing on sustainable development will also contribute to raising the standard of living by improving the quality of life and well-being of present and future generations, economic development, and the social system as well as protecting the environment.
Concz et al., mention that optimized, win–win solutions, adapted for specific situations and conditions can make the concept of sustainability operational, in some cases are required new types of technologies that ensure the transition to sustainable practices [2]. The economically viable development principle is achieved when companies remain competitive, innovative, and resilient, focusing on economic success, not just on financial results [3]. Power quality generates short-, mid-, and long-term effect on businesses. On the other hand, an inadequate level of power quality usually leads to financial losses, adverse social consequences (such as a deteriorated relationship with main stakeholders or health problems for employees), and unsustainable use of resources. In this context, the current research addresses the economic implications of power quality issues, aspects that can influence the sustainable development of companies. Electrical power is a product and like any product, must meet quality requirements. The term power quality (PQ) has become common since 1980 and describes how available electrical power at the point of use is compatible with the requirements of the equipment connected at that point and at that time [6].
However, electrical power is a special product. The possibility of storing electrical energy in a significant quantity is limited, so it is consumed when it is generated. The measurement and assessment of the delivered PQ must be made when consumed. The PQ measurement is complex because the supplier and the user, whose sensitive electrical equipment is also a source of disturbance, approach the issue from different perspectives.
The continuous deployment of renewable power plants brings a considerable change that is currently facing the power system industry. The manipulation of renewable energy sources could become a challenge due to their intermittency and variation. During the last century, wind power plants have been the renewable technology with the most significant growth of installed bases across the world, especially in the European Union [7,8].
For electrical equipment to function correctly, it is necessary to supply the electrical power at a voltage in a particular band, around the nominal value. Much of the equipment currently used, especially electronic devices and computers, require a good PQ. However, the same equipment often distorts the supply voltage of the installations due to their nonlinear characteristics, i.e., they lead to the occurrence of a non-sinusoidal current when applying a sinusoidal voltage. Thus, maintaining a satisfactory quality of electrical power is a shared responsibility of the electrical power supplier and user [9].
Current technology development, which results in increasing adoption of the local generation and storage capacities, is pushing towards the adoption of a smart grid paradigm. A useful technical solution for enforcing a limitation of various types of PQ disturbances is based on power electronics to increase energy transmission capacity, improve voltage stability and dynamic behavior, control power flow, and ensure a better power quality at distribution inside accepted boundaries [10].
One of the main reasons to justify the interest shown in the PQ field is that modern equipment is more sensitive to the reduction of the PQ since it has electronic devices and control systems based on microprocessors whose operating characteristics are affected by disturbances in the power supply. Also, concerns for the impact of new smart technologies on existing electrical distribution systems [11] and increasing yields in electrical power generation, transport, and use determined the widespread introduction of power electronics to control energy conversion processes and adaptive equipment for managing the power factor. On the other hand, consumers became more aware and better informed about the impact of different electromagnetic disturbances (random, semi-permanent, or permanent) on electrical equipment and technological processes (including on the quality of the final product) and, as a result, suppliers are asked to provide electrical power at the contracted quality parameters. Last but not least, the increasing complexity of energy systems and mutual influences between them and users, as well as between end-users connected to the same power system, is noticed.
The importance of the topic addressed in this article is underlined by research conducted at the European Union’s level. Thus, the European Copper Institute (ECI) conducted a series of interviews and surveys over a period of two years in eight European countries, across different sectors of activity [12]. The analyzed sectors account for approximately 38% (€6843 billion) of the total of €17,956 billion, representing the turnover of the 25 EU countries at the time of the study, and electrical power consumption of 1862 TWh (70%) of the 2650 TWh consumed by this region. For a more precise analysis of the economic consequences of poor PQ, the companies were divided according to their activity into two categories: ‘industry’ and ‘services’.
Costs due to unsatisfactory PQ in the analyzed countries represent over €25 billion in the EU economy for the year of study. Over 90% of these losses were in the industry sector. The relatively small proportion for the service sector is probably determined by the underestimation of PQ costs or the difficulty of delimiting losses caused by unsatisfactory electrical power and other causes. The study shows that, in the industrial sector, the estimation of the losses due to unsatisfactory electrical power represents 4% of the annual turnover, and in services, the estimate of the losses due to unsatisfactory electrical power represents 0.14% of yearly turnover [9].
Among the industrial companies studied, the most significant losses occur in manufacturing companies with a continuous process, and lower losses in the metallurgical, food, and beverage industries and in the general production processes. In the services sector, the highest losses occur in hospitals, according to the European Copper Institute [9].
Voltage sag and short interruptions account for 60% of total industry costs and 57% of the total sample. The impact of PQ disturbances is classified into voltage sags (23.60%), short interruptions (18.80%), long interruptions (12.50%), harmonics (5.40%), fluctuations and surges (29%), and others. The voltage sags in the industry are almost twice as frequent in the services sector. The frequency difference is also high in case of overvoltage and voltage variations in the industry, relative to services. On average, the number of short interruptions that has been measured is approximately six, and this is three times higher than the number of long interruptions. The number of recorded voltage sags is about two times higher than short interruptions [9]. The average of disturbances is lower in the service sectors.
The companies targeted by this study invest €297.5 million annually for compensation solutions for various PQ issues. The results of the survey can be synthesized as follows [9]:
- the cost per voltage sag is between €2120 and €4682;
- each short interruption is on average 3.3 times more expensive for industry and 9 times higher for services;
- the average cost of long interruptions is €91,021;
- estimated expenses for overvoltage and transient phenomena range from €120,000 to €180,000.
The article includes a theoretical part addressing the economic effects of a poor PQ to end-users, the methods available in the literature for estimating the financial damage incurred by end-users, depending on the variation of PQ indicators and the compensation solutions for voltage sags and short interruptions. One of the contributions included in this section is the graphical presentation of the economic consequences of a poor PQ.
The main objective of the current research is to facilitate the management of power quality through developing a method for estimating the economic consequences of a poor PQ to end-users. In the practical part of the paper, using the proposed method, the cost of voltage sags and short interruptions over a one-year period is calculated, and the possible compensation solutions are analyzed from a technical and economical point of view. The principal conclusion of the research is that poor PQ can generate negative effects on companies’ development, which can be prevented by carefully selected compensation solutions properly integrated into a consumer’s electrical system.
2. Effects of the PQ Disturbances to End-Users
Many definitions approach the concept of quality. In general, the quality of a product is represented by all its features to meet users’ needs. PQ is defined by the totality of electro-energetic situations, manifested by deviations of voltages, currents, or frequencies, leading to the improper operation or malfunction of the equipment [13]. Another definition states that PQ represents the degree of compliance with the acceptable limits of some electrical parameters (voltage, frequency, distortion, unbalanced) [14]. On the other hand, the PQ represents the electrical characteristics related to the voltage frequency, amplitude and voltage variation, voltage sags, voltage symmetry on the three phases, flicker, harmonics and inter-harmonics, and temporary and transient overvoltage [15]. Another definition identified in the literature suggests that PQ represents the level of electric energy quality at a point in the power system, assessed by a set of reference parameters [16].
The positive side of each of the above definitions is that it highlights certain aspects that are defining the concept of PQ. Summing up the quality concepts in general and the system of quality indicators, the following definition is proposed in [6]:
PQ is a complex concept of estimating the quality level of the electrical power product, expressed by a system of indicators whose values determined for a particular point of the electrical network, and a specific period can be compared with the appropriate optimal or acceptable values.
Although the demands of electrical power end-users are increasing, the ‘product’ of electrical power can never be perfect, therefore end-users need to take technological measures to protect their facilities, and suppliers need to act to improve the delivered PQ. Because electromagnetic disturbance makes both the economic and functional parameters of the power supplier and the end-users increasingly sensitive to disturbances, a permanent concern for the PQ is needed, PQ planning and monitoring, standardization of disruptive emissions, and establishment of compatibility levels. A poor PQ leads to implications with different forms of manifestation, depending on the specificity of the activity sector.
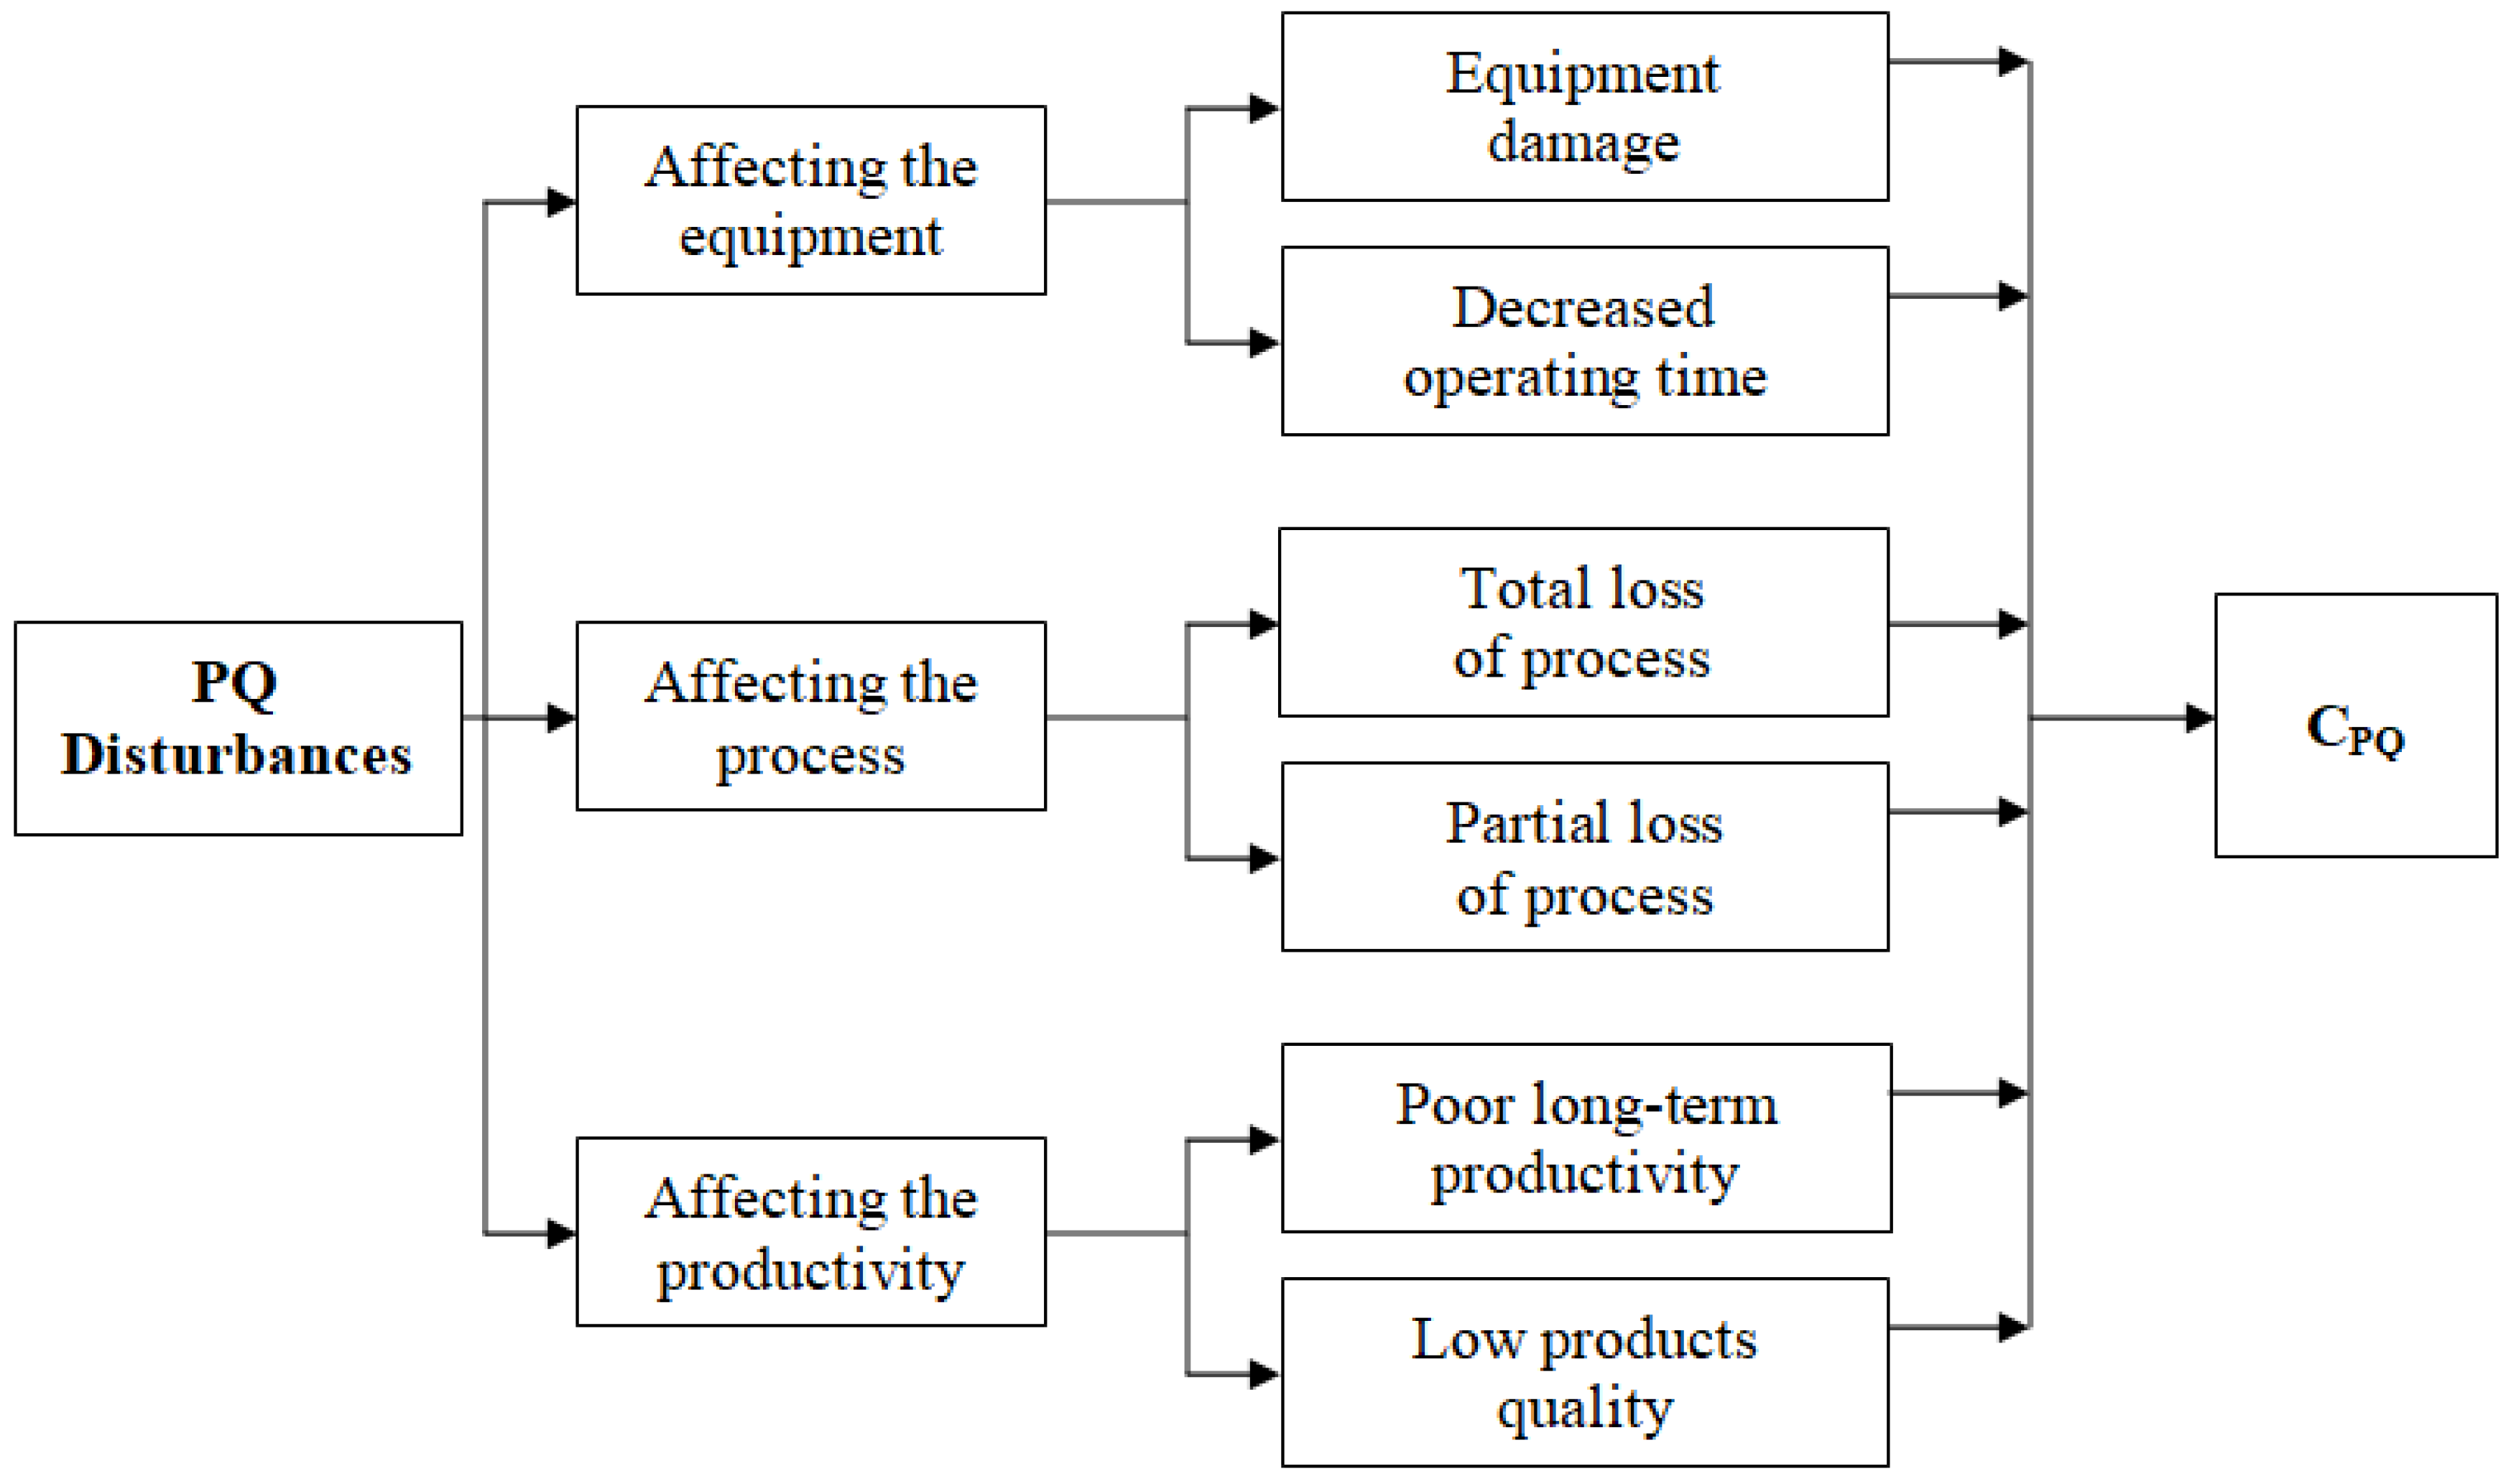
The economic effects of poor PQ can be divided into three categories:
- partial or total loss of one or more processes (e.g., loss of control due to a voltage sag);
- poor long-term productivity or low product quality (e.g., because of employee fatigue due to flicker);
- increased costs due to reduced equipment life, leading to premature failure (e.g., overheating of transformers due to harmonics).
These effects occur at very different time scales. For example, voltage variations of about (5 ÷ 10)% around the nominal value, with a period of (5 ÷ 30) minutes, can affect the regular operating regime in both the suppliers and the end-users facilities. The failure of a process triggered by a PQ event such as voltage sag has immediate consequences, followed by a recovery period in which additional costs may arise. It is relatively simple to identify or predict the damages resulting from this type of event. The economic consequences of the PQ disturbances are summarized in Figure 1 and are grouped into three categories that affect equipment, process, or productivity.
Apart from economic damages, social effects may also occur, being more difficult to assess. For example, the supply voltage level and voltage fluctuations significantly affect the quality of electrical lighting, which affect the visual perception of objects, details, and graphics. The productivity and quality of work are influenced. Lack of PQ also contributes to eye fatigue, so in some cases, the health of employees may be affected [17].
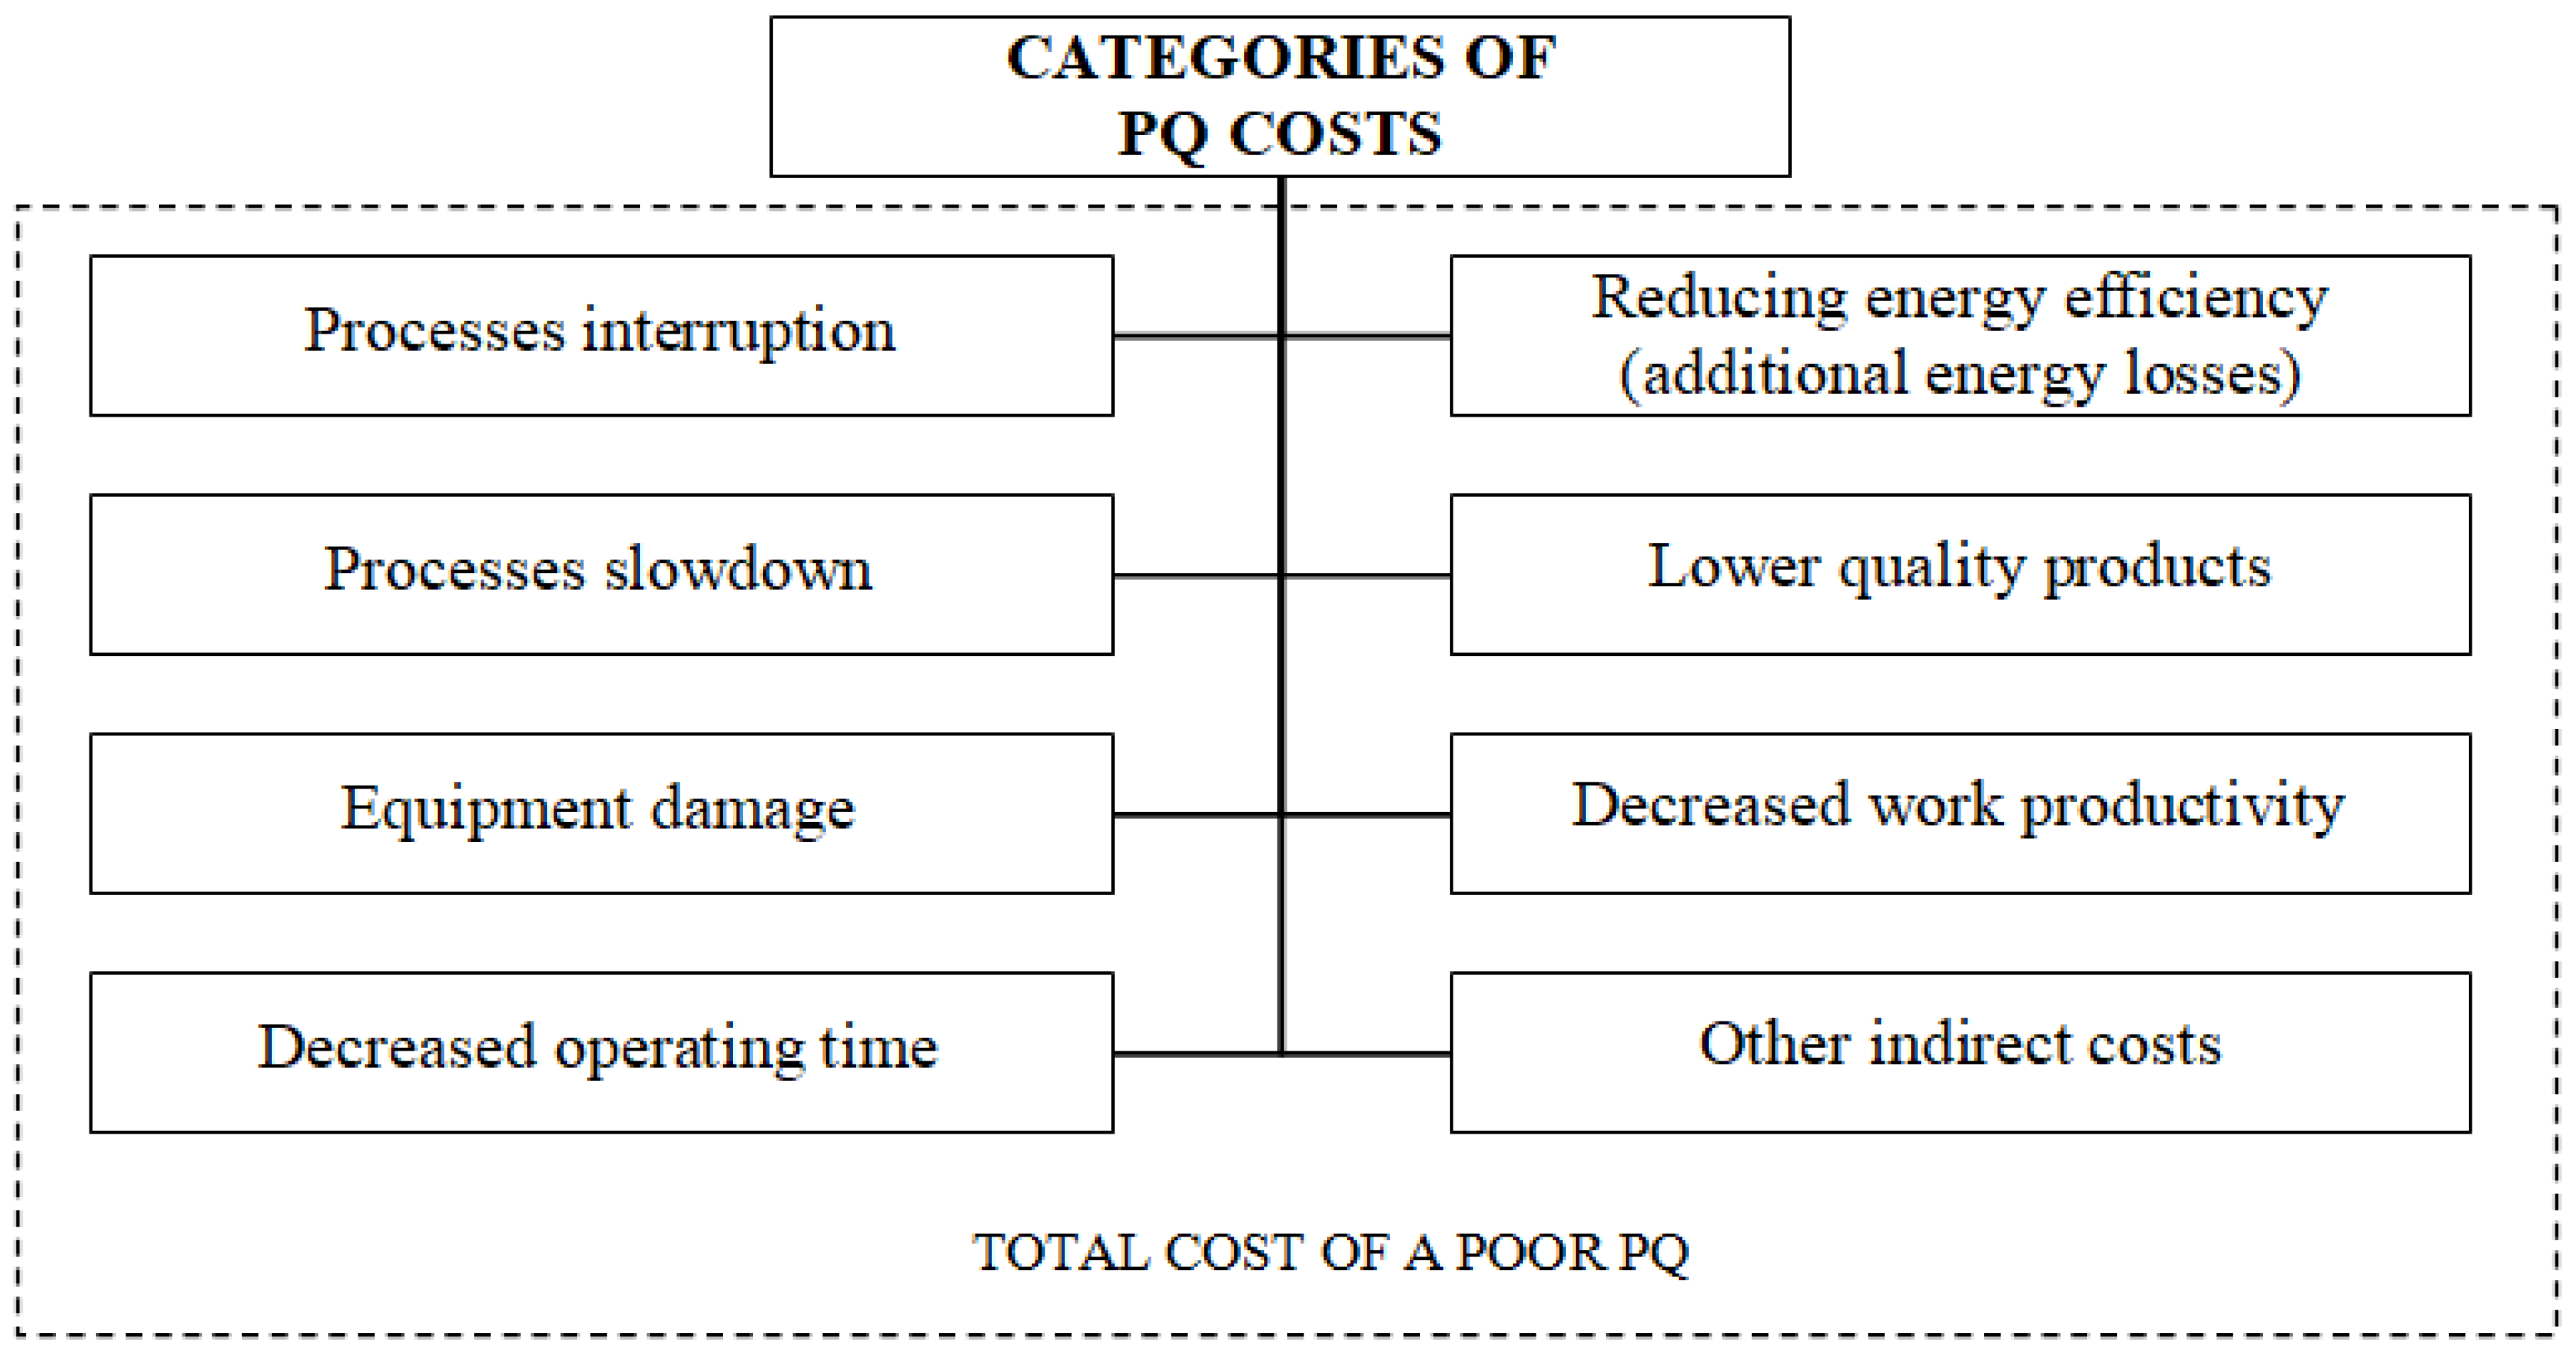
The classification of the cost categories that may occur, presented in Figure 2, enables ud to calculate the total cost for each type of disturbance. The cost categories due to PQ disturbances refer to process interruptions, process slowdowns, equipment failure, equipment downtime, reduced energy efficiency, lower product quality, lower labor productivity, or other indirect costs.
3. Methods for Estimating the Effects of a Poor PQ
Determining the effects of PQ issues can be done by applying methods of analytical and statistical estimation. Analytical determination methods are appropriate when all the elements analyzed, from the operating conditions of the system to the discount rate, are known with certainty, in which case the analysis is made for existing systems whose operating conditions are repeatable and well defined. Statistical methods are necessary when some of the variables of the problem are uncertain, such as system design or construction, or if the expansion or restructuring of a system is planned [18,19,20,21].
3.1. Analytical Method of Damage Assessment Concerning the Undisturbed Situation
Considering the probable average decrease in revenue (VNr), as compared to the value (VNn) achievable under a reference supply, as a measure of the likely average damage incurred by power supplied end-users having different quality parameters than nominal ones, the variation in the income of an economic agent under the influence of supply conditions can be expressed as [22]
where ΔVPM is the variation in production value versus the value of the considered reference case, and ∆CPM is the full cost variation of production compared to the reference case cost.
The probable average variation in the income obtained by an economic agent in producing the output compared to the possible benefit under the reference supply conditions can be expressed as [23]
where Qi, Qni represent the number of products in the assortment made i, over the analyzed period, fed under PQ precarious conditions, i.e., the number of products, characterized by an ideal supply;
- Ppi—the production price of the type i product, generally established for reasons independent of the power supply conditions;
- Ck,i—the specific cost of type k for making the type i product.
If giving values to k for specific product i, the structure of production costs can be highlighted. Both the number of products made during the study period and some related production costs can be influenced by the power supply quality.
Based on these results, the income variation can be determined in comparison to the income achieved under the reference conditions, i.e., the amount of possible damage incurred by the economic operator during the period when is supplied with electrical power at a different level from the nominal value. The structure of production costs in industrial enterprises is summarized Table 1 [23].
Where it is possible to recover unrealized output by increasing the working time, the value of the ∆VPM produced in the studied different supplying regimes may be considered the same as in the reference regime. In this hypothesis, the change in income under the influence of power supply conditions can be expressed by the difference in manufacturing costs per unit of the product [24]
Other categories of expenditure are affected by the PQ conditions, depending on the product’s specificity and the machinery involved in the production process, the organization of work, etc.
This method of assessing damages regarding the undisturbed situation has practical limitations, because it is difficult to estimate the specific cost of making a product under considered optimal conditions of the power supply. Moreover, not many companies fully understand the PQ concept, and are not monitoring the PQ indicators, so that it is not possible to establish the moment when the electrical power supplied to the final end-user was unaltered.
3.2. Statistical Method for Analyzing Economic Effects due to a Poor PQ
The deterministic correlation between quality indicators and end-user damages allows obtaining useful information for assessing the permissible levels of quality indicators (perturbation level) for each end-user [24]. In real cases, most of the time, the electrical sizes on the feed bars can be defined only statistically, showing deviations around an average value, and a normal distribution function can be attached to the variation of the quality indicators.
In practical cases, the relationship between damage D and the quality indicator (for the analyzed example, the U amplitude of the voltage on the supplying bars) can be expressed in the form of a second-degree polynomial
where in the coefficients a and b correspond to the regression curve of each end-user. Typically, the voltage variation on the supplying bars can be defined by a normal distribution law (Gauss)
in which it was noted with σU the standard deviation of the distribution.
To a critical damage value, Dcr (maximum permissible) is corresponding a value Ucr below which the voltage cannot be reduced because the damage exceeds the allowable amount. Determination of value Ucr is essential for determining the range of bar voltage variation and, accordingly, the measures to be adopted for each end-user.
If the probability density p(ΔU) of the voltage variation function on the supplying bars is known, the corresponding probability P(ΔU) theoretically results
The above expression is used to calculate the probability density of the damage assignment function because of the PQ parameters variation supplied to end-users.
If it is considered a second-degree polynomial dependence between damage and the variation of the quality parameters
and
If, for example, a normal distribution of voltage deviations on the supplying bars, the damage probability density p(D) is considered
The use of the normal distribution of the voltage variation density for calculating the damage often results in near-realistic results. For more accurate calculations, the distribution of voltage variations can be considered as defined by a truncated distribution. Also, in many cases, reducing PQ indicators below a certain threshold (below the value) leads to production waste, which, from a mathematical point of view, leads to constant damage independent of the quality indicator’s value [25]. This methodology allows acceptable values of the PQ indicators delivered to the end-user to be determined on a case-by-case basis, starting from the admissible value of the damage.
4. Compensation Solutions for Voltage Sags and Short Interruptions
Electrical loads—such as programmable logic controllers, relays, power supplies, contactors, and drive motors—are common elements in the automated processes of business with continuous activity. Voltage sag causes errors in the process that can quickly lead to cascade shutdown of the entire process. The resulting downtime may be costly and may consist of production losses.
A low voltage sag of up to 70% of the nominal voltage (i.e., a 30% reduction), less than 100 milliseconds, may cause the system to fall automatically, resulting in estimated annual losses of €10 billion. Although the effects of PQ problems may be more extensive for large-scale processes, solutions to address these issues can be expensive for electrical power end-users as well as for network operators that serve them.
For businesses, the complete power quality solution can cost between € 388 and €1165 per kilowatt (kW), excluding equipment installation [12]. For network operators, redesigning the distribution network or making new investments in the supply network infrastructure may lead to prohibitive costs. Fortunately, automated systems can be made more robust relative to voltage sags by using appropriate design techniques for hard and soft electrical systems. These techniques include identifying the types of electrical disturbances likely to occur in an enterprise, identifying components and equipment susceptible to these disturbances, and then focusing on these sensitive elements either by replacing them with more robust ones or by protecting them [12].
The most important methods for limiting the effects of voltage sags are:
- backup generators;
- constant voltage transformers (CVT);
- uninterruptible power supply (UPS);
- dynamic voltage regulators (DVR).
An automatic release of reserves (AAR) system has the function of maintaining continuity in power supply for one or more consumers, in cases of primary power supply interruption, bypassing the power supply to a second electrical power source.
4.1. Constant Voltage Transformers
The flux determines output stability in the transformer core and the voltage generated by the compensation winding. It means that the output voltage can be changed if there are sockets on the transformer.
The cost of a CVT is relatively low compared to other types of voltage regulators. Also, another advantage is minimal maintenance, because there are no moving parts or batteries. The approximate cost of a CVT is €1000/kVA.
4.2. Uninterruptible Power Supply
A UPS system is designed to provide uninterrupted power for the protected load irrespective of the power system conditions. A UPS uses stored energy to provide power to the load if the power supply voltage drops below a specific predetermined value. They are also characterized by the waveform quality of the voltage and current at the input and output. The most common types of UPSs are rectifier/charger, ‘stand-by’ and ‘line interactive’. This solution has a relatively low cost, usually between €100 and €300.
4.3. Dynamic Voltage Regulators
During a voltage sag, a DVR completes the residual voltage with the required voltage, using a transformer connected in series with the load [9]. The load remains connected to the network, and the DVR determines the missing side of the voltage curve and completes it. Depending on the design, the power to fill the load during the voltage sag is provided either from the power supply network or an additional energy storage unit (usually capacitor batteries).
5. Methodology
The objective for this part of the paper is a comparative analysis of various compensating solutions for voltage sags and short interruptions, aiming at diminishing the effects of PQ issues to end-users. For achieving this objective, the research questions formulated are:
- RQ1.
- What is the cost of a poor PQ?
- RQ2.
- What are the compensation solutions for voltage sags and short interruptions in the analyzed case?
The methodology followed is described further in two phases associated with the two research questions. The first phase presents the method for estimating the cost of a poor PQ. In the second phase, the steps required for the economic analysis of compensation solutions for voltage sags and short interruptions for the analyzed end-user are described.
5.1. Cost Determination of a Poor PQ’s Effects
The proposed methodology suggests unifying data collection at the cost of process interrupting for all types of disturbance. Other costs that cannot be attributed to the process interruption (as an immediate effect) are proposed to be collected separately for each phenomenon or a cost assessment using an in-depth interviewing method for the staff responsible for producing internal or maintenance services; and if possible an interview with management responsible for the production process and production costs problems.
The total cost of PQ issues can be calculated with the formula
where CD represents the direct cost due to a poor PQ;
- CI—indirect costs;
- CA—other specific costs;
- Cecon—false economies.
Direct costs usually include costs associated with production in progress, costs with labor, and costs with electrical power. These can be calculated with the relationship
where Cm represents the raw and other materials cost;
- Cen—the electrical power and fuel cost;
- Cℓ—labor cost, defined with the relationship:
- Ch—the cost of a lost working hour;
- Cs—the cost per hour required to compensate for the loss of production, sales, or services (includes overtime).
Indirect costs include:
- costs of slowing down processes; if the equipment or a process is affected by a PQ disturbance, the activity may be reduced (e.g., because only part of the operations is functional, the production takes place at a slower pace or outside the limits specified in the specifications);
- the costs of restarting processes when a process is interrupted; includes auxiliary operations, such as heating, cooling, ventilation, and filtering; these processes need to be restored and checked before the primary process restarts, requiring additional time and labor;
- costs due to equipment damage, destruction may be instantaneous (e.g., damage from mechanical collision) or gradual (e.g., overheating due to the coolant loss), resulting in decreased equipment runtime, increased maintenance, etc.
These costs can be estimated with the relationship
where (CV/Tan) represents the ration between annual sales value and usual working time of the organization for over a year;
- n—the number of hours in which the efficiency is reduced;
- ΔCIP%—the percentage of reduction in activity level; this is the best assessment of performance reduction compared to normal activity from a broader perspective;
- Creb—the cost of reviewing products out of specifications, such as repairing, processing, recycling or dismantling them;
- Ced—the cost of equipment failure (such as the cost of repairing, adjusting and calibrating, the cost of installing new equipment or parts thereof, the cost of hiring equipment to replace damaged ones);
- Cment—maintenance and operating costs (additional charges for extra equipment, additional fees for revisions/ future repairs).
Other process-specific costs may include: penalties due to non-delivery or delay of products under contract terms; environmental fines/sanctions; the loss of evacuating personnel and equipment; the cost of injured staff (including incapacity to work); high insurance rates (equipment, staff health, liability); and hidden costs, such as competition, reputation, customer satisfaction, loss of potential future earnings, employees’ tolerance.
An estimation of this subcategory can be calculated as
To reduce the number of calculations, an overall assessment of the cost of shortening the lifetime of the equipment in distribution systems could be done by dividing equipment into representative categories depending on the type and rated power. Evaluations could be made at various times of the day, at different loading levels, and different ambient temperatures.
To calculate how long the operation of the equipment was affected due to the presence of disturbances concerning the service life under normal conditions—after estimating the shortening of the operation duration—the cost of this phenomenon, C∆f, can be calculated with the relation [22]
where τn represents the operation time without PQ disturbances, in years;
- τf—the operating time with real conditions, when PQ disturbances may occur, in years;
- RA—annual amortization of equipment, monetary units/year;
- CI—replacement cost—removal and installation of equipment that is replaced before its technical operating time, in monetary units.
To complete and correctly calculate the total cost of PQ disturbances, the false savings were taken into consideration, Cecon, due to PQ disturbances. These usually include:
- savings from unused materials/inventory;
- savings from unpaid salaries;
- energy bill savings.
Table 2 summarizes the methodology for estimating the costs determined by PQ disturbances. For the most significant voltage disturbances over the economic consequences of the PQ disturbances, respectively, the voltage sags, harmonics, overvoltages, and voltage pulses, a separate calculation formula is proposed, containing only those cost components which are marked with x in the table, depending on the disturbance type.
5.2. Analysis of Compensation Solutions
Analysis of compensation solutions for voltage sags and short interruptions was conducted as follows:
5.2.1. Estimating Perturbations for Each End-User
It highlights voltage sags and short interruptions, calculated over a period of one year, depending on the voltage sag level [26].
5.2.2. Estimating Costs Associated with Voltage Sags and Short Interruptions
In general, a voltage interruption leads to the interruption of all unprotected production processes. Voltage sags can only partially affect production processes, depending on their amplitude/ severity. The voltage sag severity is characterized by multiplying the base cost of interruption with a correlation factor, representing the relative impact of the voltage sag compared to a short interruption [25]. For example, if the base cost associated with interruption is 1.0, voltage sag of 50% amplitude, which causes 80% of the economic impact of interruption, will have a correlation factor of 0.8.
When correlation factors are applied for the total number of voltage sags and voltage interruptions over a period of one year, the costs of these interferences are expressed in p.u. of the cost of a short interruption. The disturbances number can be added, and their sum represents the cost of all perturbations, expressed in equivalent short interruptions [27,28].
5.2.3. Characterization of Cost-Based Compensation Solutions and Their Efficiency
Compensation solutions’ costs include initial costs, which represent the equipment and installation costs and annual operating costs, the latter including maintenance costs, heat losses, additional battery replacement costs. The efficiency of each compensation solution will be highlighted by the performance of the equipment and the severity of the voltage sag [29,30,31].
5.2.4. Performing the Economic Analysis
In this last step, the leading economic indicators for assessing the impact of an investment project are calculated for each proposed compensation solution: net present value (NPV) of the project, internal rate of return (IRR), payback time (PBT).
Regarding data collection, due to companies’ relatively limited knowledge and interest regarding PQ, we chose a company that understands the importance of PQ for the case study. Based on a preliminary unstructured interview with the manager of the company, we concluded that they are aware that the economic losses generated by poor PQ can influence the development of the company and also can spread to their clients. The company had installed monitoring equipment of the PQ essential indicators, which helped determine the number of perturbations and their severity for one year.
6. Results
The company that agreed to participate in the research is located in the northwest region of Romania and provides design, assembly, and service of mission-critical technologies for data centers, communication networks, and commercial and industrial applications. The number of employees working in the analyzed company is 46.
6.1. Estimating the Voltage Sags and Short Interruptions
From the data collected by the PQ monitoring equipment installed in the end-user power system, resulted in a number (6, 12, and 18, respectively) of voltage sags with the residual voltage below 60%, 75%, and 85% during the year; as well as 3 short interruptions.
6.2. Estimating Costs Associated with Voltage Sags and Short Interruptions
For one year, 39 downtime episodes occurred because of electric voltage sags or short interruptions lasting from 30 cycles to a few seconds, which disrupted work production for an average of 0.5 h. Transactions in progress were lost as well as recent remote deals. Recovery included identifying what needed to be reprocessed, retransmitting the right data from all the remote sites. Applying the proposed method, for estimating the PQ disturbances costs, damage caused by a short interruption were calculated at €6786 for the analyzed case. Table 3 presents the correlation factors for different voltage gauge levels, which are used to estimate the relative impact of voltage sags on the analyzed end-user. By applying these factors to the estimated voltage sags and interruptions, the total cost of PQ disturbances is determined.
By introducing the cost of one interruption, CPQi = €6786, the total costs associated with the voltage sags and short interruptions is €105,861.
6.3. Characterization of Cost-Based Compensation Solutions and Their Efficiency
The initial and operating costs of the compensation solutions for voltage sags and interruptions were estimated in Table 4. These costs depend mainly on the end-user installation.
Depending on the severity of the voltage sags or the short interruptions the efficiency of each compensation solution has been estimated and are presented in Table 5.
6.4. Economic Analysis
At this stage, the compensation solutions are compared by determining the new total cost for each solution after the correction. This cost includes the costs due to the disturbance that could not be eliminated and the annual operating costs for each solution. Yearly savings can be found by lowering new costs in annual costs due to equivalent interruptions. The 10% update rate is considered and the lifetime of the project, T = 10 years. As is presented in Table 6, CVT is the most expensive compensation solution, namely €950,000, and the least costly is AAR, €150,000. The highest annual operating cost is UPS, followed by CVT, DVR, and AAR. The costs of not-removed disturbances are €47,841 for CVT, €35,117 for AAR, €27,270 for UPS, and zero for a DVR. The highest annual savings are obtained with UPS. AAR and CVT solutions generate similar value savings. The DVR generates the smallest savings.
The economic analyses results are concentrated in Table 7. As can be seen, in this case, the DVR and AAR both have positive NPV values. In the case of AAR, the NPV has the highest value, but in this case, the solution involves the existence of a backup power supply capable of dealing with additional tasks in the event of problems to the main power supply. If this backup power supply does not exist, the recommended solution is installing the DVR, this solution having an internal rate of return of 13% and a return on investment in 5.5 years.
7. Discussion
The business risks presented by PQ problems are real, with all industries being exposed to severe financial losses. On the other hand, the prevention of PQ problems is not expensive, starting from simple judicious design techniques, to the provision and installation of adequate protection or compensation equipment. Research in the field so far has attempted to estimate the economic consequences for certain types of PQ disturbances without hierarchizing the financial implications of disturbances for specific types and classes of consumers.
Until now, there is no generally accepted method of estimating the technical and economic consequences of PQ disturbances because these issues affect electrical power end-users differently, depending on the field of activity for each company. Although financial losses resulting from PQ problems may be very high, most end-users are not familiarized with these issues. A recommended solution would be that every company that faces such situations should have dedicated employees in this area.
Although applying the proposed methodology facilitates the management of PQ issues, a generally-accepted solution for reducing the adverse effects of power quality disturbances cannot be recommended. Compensation solutions need to be analyzed in each context and integrated into the company power system. Usually, applying proper compensation solutions reduces economic losses, with the benefits exceeding the costs.
8. Conclusions
This paper presented a systematization of cost types, their synthesis in the total costs method, and the juxtaposition of complementary methods with evolved algorithms leading to a methodological basis allowing the hierarchization of economic consequences of PQ disturbances for each type of consumer.
Using the proposed methodology, a case study has been carried out, and financial losses associated with PQ disturbances for this case have been determined to be €105,861/year. These perturbations that affect the operation in optimal conditions of the analyzed company were identified and the possible technical compensation solutions were examined. After an economic evaluation of these solutions, we recommended installing dynamic voltage regulators, which have an IRR of 13% and a PBT of 5.5 years.
The presented approach facilitates collecting economic data. However, the specificity of various activities does not allow full standardization of this process. Some costs cannot easily be included within the categories presented. In some cases, specific cost categories far outweigh other groups, so that the detailed picture of all effects must be appropriately represented. When there are several types of PQ disturbances, it is necessary to carefully design the assembly of solutions, even integrating them into a single solution, integrated adequately into consumer’s electrical system without leading to amplification or other disturbances.
Author Contributions
H.G.B. conceptualized the framework of the article, contributed to the literature review, developed the methodology and analyzed the results. I.N.B. reviewed the paper, contributed to the literature review and the economic analysis of the compensation solutions. S.G.P. interpreted the results, prepared the conclusions and supervised the teamwork. C.P.D. was responsible for collecting and processing data for the case study. All authors read, revised, and approved the manuscript.
Funding
This research received no external funding.
Acknowledgments
The results presented in this paper were obtained with the support of the Technical University of Cluj-Napoca through the research contract no. 1986/12.07.2017, internal competition CICDI-2017.
Conflicts of Interest
The authors declare no conflict of interest.
References
- The World Commission on Environment and Development. Our Common Future; Oxford University Press: Oxford, UK, 1987; ISBN1 10 019282080X. ISBN2 13 9780192820808. [Google Scholar]
- Cończ, E.; Skirke, U.; Kleisen, H.; Barber, M. Increasing the Rate of Sustainable Change: A Call for a Redefinition of the Concept and the Model for its Implementation. J. Clean. Prod. 2007, 15, 525–537. [Google Scholar] [CrossRef]
- Gareis, R.; Huemann, M.; Martinuzzi, A. What Can Project Management Learn from Considering Sustainability Principles? Proj. Perspect. 2011, 33, 60–65. [Google Scholar]
- European Commision. Sustainable Development in the European Union—2009 Monitoring Report of the EU Sustainable Development Strategy; European Commision: Brussels, Belgium, 2009; ISBN 978-92-79-12695-6. [Google Scholar]
- Blackburn, W. The Sustainability Handbook; Environmental Law Institute: Washington, DC, USA, 2008; ISBN 978-1138990098. [Google Scholar]
- Maier, V.; Pavel, S.G.; Beleiu, H.G. Power Quality; UT Press Publisher: Cluj-Napoca, Romania, 2012; ISBN 978-973-662-784-2. [Google Scholar]
- Nieto, A.; Vita, V.; Maris, T.I. Power quality improvement in power grids with the integration of energy storage systems. Int. J. Eng. Res. Technol. 2016, 5, 438–443. [Google Scholar]
- Nieto, A.; Vita, V.; Ekonomou, L.; Mastorakis, N.E. Economic analysis of energy storage system integration with a grid connected intermittent power plant, for power quality purposes. WSEAS Trans. Power Syst. 2016, 11, 65–71. [Google Scholar]
- Targosz, R.; Manson, J. Pan-European Power Quality Survey. In Proceedings of the 2007 9th International Conference on Electrical Power Quality and Utilisation, Barcelona, Spain, 9–11 October 2007. [Google Scholar] [CrossRef]
- Ceaki, O.; Seritan, G.; Vatu, R.; Mancasi, M. Analysis of power quality improvement in smart grids. In Proceedings of the 2017 10th International Symposium on Advanced Topics in Electrical Engineering (ATEE), Bucharest, Romania, 23–25 March 2017; Volume 10, pp. 797–801. [Google Scholar] [CrossRef]
- Seritan, G.; Triştiu, I.; Ceaki, O.; Boboc, T. Power quality assessment for microgrid scenarios. In Proceedings of the 2016 International Conference and Exposition on Electrical and Power Engineering (EPE), Iasi, Romania, 20–22 October 2016; pp. 723–727. [Google Scholar] [CrossRef]
- Beleiu, H.G. Technical and Economic Implications of a Poor PQ to Consumers; Technical University of Cluj-Napoca: Cluj-Napoca, Romania, 2011. [Google Scholar]
- Darie, S. Electrical Engineering Assisted by Computer. Aspects Regarding Power Quality; Course Notes; Techincal University of Cluj-Napoca: Cluj-Napoca, Romania, 2007. [Google Scholar]
- El-Gammal, M.A. Costs of Custom Power Devices Versus the Financial Losses of Voltage Sags and Short Interruptions: A Techno-economic Analysis. Int. J. Comput. Electr. Eng. 2010, 2, 900–907. [Google Scholar] [CrossRef]
- Maier, V.; Moldovan, H.A.; Beleiu, H.G.; Mureşan, P.D. Power Transformer Electrical Parameters Determination by Monitoring Permanents Regimes. In Proceedings of the 3rd International Conference on Modern Power Systems 2010, Cluj-Napoca, Romania, 18–21 May 2010; pp. 229–232. [Google Scholar]
- Khoucha, F.; Lagoun, S.M.; Marouani, K. Hybrid Cascaded H-Bridge Multilevel-Inverter Induction-Motor-Drive Direct Torque Control for Automotive Applications. IEEE Trans. Ind. Electron. 2010, 57, 892–899. [Google Scholar] [CrossRef] [Green Version]
- Sharma, A.; Rajpurohit, B.S.; Singh, S.N. A Review on Economics of Power Quality: Impact, Assessment and Mitigation. Renew. Sustain. Energy Rev. 2018, 88, 363–372. [Google Scholar] [CrossRef]
- Dugan, R.C.; McGranaghan, M.F.; Santoso, S.; Beaty, H.W. Electrical Power Systems Quality, 2nd ed.; McGraw Hill Companies: New York, NY, USA, 2004. [Google Scholar]
- Chapman, D.; Targosz, R. Collecting Economic Data in Power Quality Survey; Tech. Rep.; Leonardo Energy, 2009. [Google Scholar]
- Lachugin, V.F.; Panfilov, D.I.; Smirnov, A.N.; Obraztsov, S.A.; Ryvkin, A.A.; Shimina, A.O. A Multifunctional Device for Recording the Monitoring of Electric Power Quality and for Fault Finding on Electric Transmission Lines. Power Technol. Eng. 2013, 47, 29–36. [Google Scholar] [CrossRef]
- McGranaghan, M.F.; Surya Santoso, S. Challenges and Trends in Analyses of Electric Power Quality Measurement Data. EURASIP J. Adv. Signal Process. 2007, 2007, 057985. [Google Scholar] [CrossRef]
- Iordache, M.; Conecini, I. Power Quality; Editura Tehnica: Bucharest, Romania, 1997. [Google Scholar]
- Iordache, M.; Conecini, I. Technical and Economic Implications of the PQ with Application to Industrial Electrical Supplies; Editura Tehnica: Bucharest, Romania, 1996. [Google Scholar]
- Albert, H.; Gheorghe, S.; Golovanov, N.; Elefterescu, L.; Porumb, R. Power Quality. Contributions. Results. Perspectives; AGIR Publisher: Bucharest, Romania, 2013; ISBN 978-973-720-497-4. [Google Scholar]
- Elbasuony, G.S.; Aleem, S.H.E.A.; Ibrahim, A.M.; Sharaf, A.M. A Unified Index for Power Quality Evaluation in Distributed Generation Systems. Energy 2018, 149, 607–622. [Google Scholar] [CrossRef]
- Maier, V.; Pavel, S.G.; Beleiu, H.G.; Buda, C. Survey Regarding Additional Indicators for Voltage Sags. In Proceedings of the 2016 International Conference on Development and Application Systems (DAS), Suceava, Romania, 19–21 May 2016; pp. 103–107. [Google Scholar] [CrossRef]
- Otcenasova, A.; Bodnar, R.; Regula, M.; Hoger, M.; Repak, M. Methodology for Determination of the Number of Equipment Malfunctions Due to Voltage Sags. Energies 2017, 10, 401. [Google Scholar] [CrossRef]
- Moreno-Garcia, I.M.; Moreno-Munoz, A.; Gil-de-Castro, A.; Bollen, M.; Gu, I.Y.H. Novel Segmentation Technique for Measured Three-Phase Voltage Dips. Energies 2015, 8, 8319–8338. [Google Scholar] [CrossRef] [Green Version]
- McGranghan, M.F.; Roettger, B. Economic Evaluation of Power Quality. IEEE Power Eng. Rev. 2008, 22, 8–12. [Google Scholar] [CrossRef]
- Thasananutariya, T.; Chatratana, S.; McGranaghan, M.F. Economic Evaluation of Solution Alternatives for Voltage Sags and Momentary Interruptions. Electr. Power Qual. Util. 2005, 1, 17–25. [Google Scholar]
- Torres, A.P.; Roncero-Sanchez, P.; Batlle, V.F. A Two Degrees of Freedom Resonant Control Scheme for Voltage-Sag Compensation in Dynamic Voltage Restorers. IEEE Trans. Power Electron. 2018, 33, 4852–4867. [Google Scholar] [CrossRef]
Figure 1.
Economic consequences of PQ disturbances.

Figure 2.
Classification costs due to PQ disturbances.


Table 1.
Production costs structure in industrial enterprises.
| k | Type of Costs | Symbol | The Significance of the Cost of Production |
|---|---|---|---|
| 1 | Direct costs, Cki = Cd,i | C1i = CM,i | Cost of raw materials and other materials for the establishment of the product unit i; |
| 2 | C2i = CFM,i | Cost of staff salaries required for the establishment of the product unit i; | |
| 3 | C3i = CE,i | Cost of fuel and electrical power used for technological purposes per unit of product i; | |
| 4 | C4i = CCAS,i | Related contributions, taxes, CAS, per unit of product i; | |
| 5 | Indirect costs, Cki = Cind,i | C5i = CED,i | General expenses with defective equipment, per unit of product i; |
| 6 | C6i = CIP,i | General costs of process slowdown, per unit of product i; | |
| 7 | C7i = Cment,i | Maintenance and operating costs of the product unit i; | |
| 8 | Other costs | C8i = Creb,i | Losses accruing waste per unit of product i; |
| 9 | C9i = Cpen,i | Penalties, accidents, offsets, per unit of product i; | |
| 10 | C10i = −Cec,i | False savings. |
Table 2.
Costs structure and significance due to PQ disturbances.
| k | Cost type | Symbol | Cost Significance | CPQvs | CPQh | CPQov |
|---|---|---|---|---|---|---|
| 1 | Direct costs, CD | Cm | the cost of raw and other materials | x | ||
| 2 | Cen | the cost of electrical power and fuel | x | x | ||
| 3 | x | |||||
| 4 | Indirect costs, CI | Creb | the cost of reviewing products out of specifications | x | ||
| 5 | Ced | the cost of equipment failure | x | x | x | |
| 6 | Cment | maintenance and operating expenses | x | x | x | |
| 7 | CIP | x | x | x | ||
| 8 | Other costs, CA | Cpen | penalties due to non-payment or delay products in contractual terms | x | x | |
| 9 | Cmed | fines/environmental sanctions | x | x | ||
| 10 | Casig | high insurance rates | x | |||
| 11 | C∆f | x | x | |||
| 12 | False economies, Cecon | −Cecon | fake savings (electrical power, unused materials, unpaid salaries) | x | x | |
| Total cost: | ||||||
Table 3.
Correlation factors and total interruptions equivalent.
| Disturbance Category | Correlation Factor | Event Number/Year | Total Interruption Equivalent |
|---|---|---|---|
| Interruption | 1 | 3 | 3 |
| ∆Urg > 60% | 0.85 | 6 | 5.1 |
| ∆Urg >75% | 0.40 | 12 | 4.8 |
| ∆Urg > 85% | 0.15 | 18 | 2.7 |
| Total | 15.6 | ||
Table 4.
Cost of compensation solutions.
| Compensation Solution | Initial Costs, Euro | Operating Costs (% Initial Costs/Year) |
|---|---|---|
| CVT | 950/kVA | 1% |
| UPS | 500/kVA | 5.5% |
| DVR | 300/kVA | 1% |
| AAR | 150,000 | 0.5% |
Table 5.
Compensation solution efficiency.
| Compensation Solution | Interruption | ∆Urg < 60% | ∆Urg < 75% | ∆Urg < 85% |
|---|---|---|---|---|
| CVT | 0 | 80% | 100% | 100% |
| UPS | 100% | 100% | 100% | 100% |
| DVR | 0 | 30% | 90% | 100% |
| AAR | 80% | 75% | 65% | 50% |
Table 6.
Total cost for each solution.
| Compensation Solution | CVT | UPS | DVR | AAR |
|---|---|---|---|---|
| Solution cost, in € | 950,000 | 500,000 | 300,000 | 150,000 |
| Annual operating cost, in € | 9500 | 27,500 | 3000 | 750 |
| Not-removed disturbances cost, in € | 47,841 | 27,279 | 0 | 35,117 |
| Annual savings, in € | 69,082 | 78,361 | 55,020 | 69,994 |
Table 7.
Economic analysis results.
| Method | CVT | UPS | DVR | AAR |
|---|---|---|---|---|
| NPV, in € | −477,746 | −16,823 | 34,612 | 254,620 |
| IRR, in % | −5 | 9 | 13 | 46 |
| PBT, in years | 13.8 | 6.4 | 5.5 | 2.1 |
© 2018 by the authors. Licensee MDPI, Basel, Switzerland. This article is an open access article distributed under the terms and conditions of the Creative Commons Attribution (CC BY) license (http://creativecommons.org/licenses/by/4.0/).
Share and Cite
MDPI and ACS Style
Beleiu, H.G.; Beleiu, I.N.; Pavel, S.G.; Darab, C.P. Management of Power Quality Issues from an Economic Point of View. Sustainability 2018, 10, 2326. https://doi.org/10.3390/su10072326
AMA Style
Beleiu HG, Beleiu IN, Pavel SG, Darab CP. Management of Power Quality Issues from an Economic Point of View. Sustainability. 2018; 10(7):2326. https://doi.org/10.3390/su10072326
Chicago/Turabian StyleBeleiu, Horia Gheorghe, Ioana Natalia Beleiu, Sorin Gheorghe Pavel, and Cosmin Pompei Darab. 2018. "Management of Power Quality Issues from an Economic Point of View" Sustainability 10, no. 7: 2326. https://doi.org/10.3390/su10072326
Note that from the first issue of 2016, this journal uses article numbers instead of page numbers. See further details here.