Peak Carbon Emissions in China: Status, Key Factors and Countermeasures—A Literature Review


School of Management, China University of Mining and Technology, Xuzhou 221116, China
*
Authors to whom correspondence should be addressed.
Sustainability 2018, 10(8), 2895; https://doi.org/10.3390/su10082895
Submission received: 6 July 2018
/
Revised: 7 August 2018
/
Accepted: 7 August 2018
/
Published: 15 August 2018
(This article belongs to the Section Energy Sustainability)
Abstract
:China is continually increasing its efforts to reduce carbon emissions due to dual pressure domestically and internationally. Specifically, China has committed to achieving peak carbon emissions no later than 2030. As an international goal, carbon emission peak in China has generated considerable research interest. However, most scholars only focus on a partial aspect of peak carbon emissions. Through a review of literature from numerous sources, this paper provides a more systematic analysis than previously available of how China can reach its peak carbon emissions as early as possible. This study first elaborates the status of peak carbon emissions in China from regional and sectoral perspectives and summarizes the various predictions. Then, five main driving factors of carbon emission peak in China are investigated, i.e., economic development, urbanization, energy-related issues, foreign direct investment and technology, and transportation. Corresponding to these five factors, some specific and practical recommendations are proposed. Furthermore, regional differences and spatial “spillovers” must be taken into account, thereby achieving a “win-win” solution with respect to the integration of emission mitigation and economic development, as well as reaching the desired target of peak carbon emissions.
1. Introduction
With the intensification of actions to address climate change, an increasing number of scholars have paid attention to carbon emissions caused by the burning of fossil fuels. International negotiations on the issue of climate change have become a competition of self-interests among countries. The issue of greenhouse gas emission peak also has become the focus of international climate negotiations in recent years [1]. IPCC AR5 further confirmed that the greenhouse gas emissions from human activities are the major causes of current climate change [2]. Recently, some studies have shown that CO2 and global temperature may not be coupled as tightly as previously believed, some other physical mechanisms are also possible candidates for causing the contemporary global warming [3], but each country should not reduce the urgency to regulate anthropogenic carbon emissions because of a possible connection between carbon emissions and biodiversity extinction [4].The main sources of anthropogenic carbon emissions are fossil fuels, and of these, coal produces the largest emissions. To achieve the goal of 2 °C temperature control, countries must strengthen actions to reduce greenhouse gas emissions. However, the global carbon emissions have presented unprecedented rise. Accordingly, China, the world’s largest carbon emitter, is facing increasing pressure in international climate negotiations to reduce carbon emissions [5,6,7]. Undoubtedly, China will play an important role in global mitigation process.
Besides the pressure internationally, domestic pressure also advances the process of carbon emissions reduction [8]. For a long time, extensive economic development dependent largely on coal consumption has caused considerable carbon emissions. At present, China’s environmental carrying capacity is approaching its upper limit [9]. Environmental constraints will force China to optimize its mixture of energy sources and to follow a development trend ofdecarbonization and hydrogenation [10,11].
Meanwhile, as the largest developing country in the world, China is still at the stage of industrialization and urbanization, and there is an urgency for economic and social development. To achieve the peak of carbon emissions, great challenges must be overcome [12,13]. With the rapid development of industrialization and urbanization, China’s energy consumption has continued to grow rapidly. Fast-growing Gross domestic product (GDP), low efficiency of energy utilization, an unsustainable energy mix and industrial structure biased to heavy industry have become important forces driving the growth of energy consumption [14,15,16]. Furthermore, coupled with the different trading openness and levels of science technology, the development gap between regions is even wider than that of decades ago, which leads to the distinct gaps of the status and abatement potentials of carbon emissions in different regions [17]. Large volume and fast growth of China’s energy consumption, and the high dependence on imports will not improve in the near future. By 2030, China’s energy demand will be at least double that of 2005, half of which comes from coal, and the shares of oil and natural gas will reach 80% and 42%, respectively [18]. Furthermore, in 2015 China overtook the USA as the biggest importer of crude oil. Based on the need for low-carbon development, China’s provinces must understand their future carbon emission trends and their peak carbon emission situation, to formulate and implement policy for low-carbon development in the future.
To respond the concern of the international community about whether China would contribute to global climate change goals and share the burden of obligation, a joint USA-China Statement on Climate Change was signed in 2014. In the statement, China anticipated that carbon dioxide emissions would peak in approximately 2030. Furthermore, China committed itself to realizing this target as soon as possible, increasing the proportion of non-fossil energy in primary energy consumption to around 20% in 2030 and reducing the unit GDP carbon by 60–65% than that in 2005 [1]. These targets represent China’s debut carbon emission peak commitments. In the Paris Climate Change Conference of 2015, China reaffirmed these series of targets [19], and the low-carbon commitments not only represent China’s positive efforts towards energy system optimization but also become substantive constraints for the future development of energy and industry [20].
Achieving the carbon emission peak is an inevitable problem in responding to climate change and sustainable development. This goal is not only an external requirement imposed by the current international negotiations on climate change, but also an inherent requirement of environmental and national transformation and development facing China. Through the carbon emission peak, the upper limit of carbon emissions due to Chinese industrialization and urbanization has been quantified; thus, high energy consumption and high emissions must be limited to a controllable and stable range. The steps to achieve the carbon emission peak represent an important development process in which important considerations must be addressed. These considerations include how to achieve a low-carbon transition smoothly, realize the peaking target without sacrificing social and economic development excessively, and balance economic development and environmental sustainability. All these become the primary prerequisites for China to achieve its carbon emission peak target [21].
In addition to carbon emission peak, the Chinese government also intends to create a growth point in the new normal economic development and explore a novel developmental path different from the traditional models of industrialization and urbanization in developed countries. However, since 1980, China’s carbon emissions have exhibited an overall upward trend. Thus, achieving the emission peak as early as possible requires overcoming enormous challenges, such as coordinating economy, energy, and technology. Other inherent problems, such as the imbalance of regional development and serious differences between urban and rural areas, also must be addressed. Therefore, whether and how China can achieve the peak of carbon emissions has become an intense topic in recent years. However, to our knowledge, previous studies cannot provide more detailed and explicit information about the characteristics of peak carbon emissions in China. Through the systematic review of the existing literature, we investigate the peak carbon emissions in China from the perspectives of three economic regions and some key industries, thereby obtaining an in-depth understanding of the trend and status of peak carbon emissions in China. In addition, relational influence factors and recommendations are also taken into consideration. This paper contributes to the literature by filling the above-mentioned research gaps.
The remainder of the paper is organized as follows. Section 2 analyzes the status of the carbon emission peak in China from the perspective of regional and institutionalization. Section 3 discusses five influential driving factors of the carbon emission peak in China. Section 4 presents enlightenment and recommendations for achieving carbon emission peak in China. Section 5 concludes this study.
2. Status Analysis of the Carbon Emission Peak in China
2.1. Status of Carbon Emissions and Forecasts of Peak Carbon Emissions in China
The global economic growth rate was 3.1% in 2016 [22], while carbon emissions have not changed for three consecutive years since 2014 according to the International Energy Agency. It means the current growth in emissions can be considered almost negligible when compared to the 1.9% annual growth rate in carbon emissions from 1990 to 2012 [23]. Although China accounts for 30% of the total global carbon emissions and in the meantime China’s GDP growth rate has reached 6.7%, carbon emissions have decreased by 1%. These suggest that with the upgrading of technology and the optimization of China’s energy mix, it is possible to limit the continuous growth of carbon emissions without sacrificing economic benefits. With the popularization of low-carbon consciousness and the improvement of technology, China has adjusted to a more sustainable development pattern than before.
China’s energy mix and energy efficiency have been significantly improved [24]. In 2016, the total annual energy consumption was 43.6 metric tons (Mt) of coal equivalent (an increase of 1.4% over the previous year). Furthermore, the total energy production has decreased by approximately 5.1% annually. Oil and natural gas consumption have increased by 5.5% and 8%, respectively; electricity consumption has increased by 5% and the installed electrical power capacity has reached 1.65 billion kW. The installed electric power infrastructure has become increasingly clean. Non-fossil energy power generation installed capacity accounts for 36.1% of the total volume, an increase of 2% compared with the previous year. More importantly, as the main source of carbon emissions, coal consumption has decreased by 4.7% and its proportion in total energy consumption has decreased to 62%. Hydropower, wind power, nuclear power, natural gas, and other clean energy sources now account for 19.7% of total energy consumption, an increase of 1.7% compared to the previous year.
However, challenges in the carbon emission mitigation process must be acknowledged. Because the historical base of Chinese carbon emissions is large, emissions are still in a slow growth trend. In addition, the coal-based energy consumption pattern will not experience a complete turnaround in the short term. On the one hand, China needs to control the annual growth rate of carbon emissions to no more than 1% to achieve the peaking target [6]. On the other hand, China is still in the stage of industrialization and urbanization, and large-scale infrastructure construction means that the construction and transportation sectors are gradually but consistently replacing the industrial sector as the major energy consumers. In addition to the above three high energy consumption sectors, the emerging service industry and residents living as part of domestic activities should also be attached great importance to mitigate carbon emissions [25].
The Chinese government is making use of policy support and strengthening technology promotion and other means to reduce carbon emissions. What should be mentioned is that China has changed its policy on importing foreign waste and improved the recycling standards recently. Four categories of high-polluting refuse are banned from entering China, including waste plastics, unsorted waste paper, waste textile raw materials and vanadium slag. Although the recyclables can be used as cheap raw materials for industrial production, a big share of foreign waste are unrecyclable and harmful for human health, and finally they will be burnt, buried, and discarded randomly, thereby leading to water and soil pollution. In addition, there exist lots of illegal smuggling of hazardous waste. As we all know, China is one of the most populous countries in the world, and mountains of newly-generated waste domestically has put much pressure on environment. As China’s economy enters the new normal, economic development and environmental protection are of equal significance. The pursuit of GDP growth is no longer at the cost of environment deterioration. In fact, China now is increasing its efforts to protect ecological environment by domestic recyclables recycling, such as enhancing waste sorting and power generation by burning garbage.
The dilemma of mountainous garbage pending disposal in the USA, the UK and Canada results from the fact that there is large amount of newly-generated garbage, high recycling standards, high processing cost, and little waste disposal plant. For example, the EU recycling market is flooded with low-quality waste plastics not meeting the EU recycling standards, most of which were still sold to China before. Thus, the current dilemma should not be entirely paid by China at the cost of domestic environment. Maybe China’s policy on foreign waste will result in an increase in global carbon emissions in a short time. However, with no regard for the global environment, developed countries should not produce substantial waste and ask other countries to pay the price. Rather, all developed and developing countries should make efforts to advocate low-carbon consumption and reduce waste generation, such as reducing the use of non-degradable plastic products. Furthermore, it is necessary for developed countries to improve the sorting technology and reduce the proportion of non-recyclable pollutants, thereby decreasing the embedded carbon emissions towards China; specifically, Sweden and Switzerland have good performances on refuse disposal.
Although the increased urbanization rate and rapid economic growth have resulted in a decrease in CO2 emissions per unit GDP, the level of per capita CO2 emissions is still increasing (see Figure 1), which indicates carbon emission mitigation is a long and arduous task [21]. It should be noted that carbon emission efficiency in China has increased during 1990–2012. This is because China’s carbon emission efficiency improvement is largely due to the structural improvement of approaching the efficiency frontier, such as upgrading industrial structure, rather than technology progress [26]. However, the marginal cost increases as the efficiency frontier approaches. Therefore, additional increase in efficiency will be increasingly difficult to attain owing to gains already realized.
Table 1 specifies that the predicted time span for reaching the carbon emission peak in China is mostly from 2020 to 2040 according to different scenarios in different studies, and the period between 2030 and 2040 is mostly recognized. Wang et al. [16] analyze the emission peak of the industrial sub-sectors in China separately and state that low energy consumption sectors have a high possibility of achieving the emission peak target between 2020 and 2030. Niu et al. [27] evaluate 13 combinations of assumptions about GDP, energy intensity and multiple emission intensity modes, and find that the most achievable and feasible combination results in carbon emission peak in 2034. Mi et al. [28] suggest that if the carbon emission peak in 2026, approximately 21.64 Gt of CO2 must be reduced during 2015–2035. Because researchers adopt various standards to measure GDP, the comparability among studies is relatively low. However, considering predictions by He [12] and Mi et al. [28], the emission peak year would occur in the period 2025–2030 at an annual average GDP growth rate not exceeding approximately 5%. Energy consumption estimated by He [12] and Bi [29] is approximately 1000 Mt of coal equivalent. Furthermore, Chai and Xu [14] and Bi [29] predict that the China’s population in the emission peak year will be approximately 1.4 billion. Chai and Xu [14] also forecast that because carbon emissions will increase faster than population in the future, China’s total and per capita carbon emissions may peak in the same period, which is different from traditional industrialized countries.
2.2. Regional Analysis of Peak Carbon Emissions in China
Because of the vast territory, provinces in China have different natural conditions and resource endowments, which result in diverse industrial structures and energy structures. When the developed provinces reach the carbon emission peak, the less-developed areas may reach the peak a few years later. For example, Du et al. [33] point out that peak carbon emissions have been achieved only in Beijing and Shanghai at present; therefore, distributing peak carbon emission targets equally to each province is not rational. Instead, to achieve peak carbon emission targets based on overall fairness and recognize regional differences, most scholars believe emission targets should be determined on a regional basis, and it is essential to divide China into the Eastern region, Central region, and Western region to study specific problems according to the geographical orientations. China’s regional carbon emissions present obvious spatial agglomerations [34]. Some studies suggest that the Eastern region ranks the first in per capita and total carbon emissions, and that the emissions in the Central and Western regions are much lower [35]. Li et al. [36] find that the causes of carbon emissions are complicated across different regions, which include several driving factors and varying potentials of carbon intensity. Thus, Shimada et al. [37] conclude that it is important to integrate local characteristics into a national scenario so that the national peak carbon emission target can be allocated to different regions effectively.
2.2.1. Peak Carbon Emissions in the Eastern Region
Among the three regions in China, the Eastern region dominates national economic development and has almost reached the post-industrial stage. After a long period of industrialization in this region, the total carbon emissions and per capita carbon emissions are the highest among the three economic regions [17], and the rate of increase in carbon emissions is the fastest. However, with the upgrading of industrial structure, the focus of development will gradually transit to the tertiary industry that relies less on fossil fuels, so the growth rate of emissions may be reduced in the near future [38]. Affected by the large proportion of capital- and technology-intensive industries, carbon intensity and energy intensity in the Eastern region are significantly lower than those in the Central and Western regions. It specifies that economy and environment in the Eastern region have a good coordinated developmental relationship, which has become the benchmark for carbon mitigation in China [39].
For the two most economically important cities in China, Beijing, and Shanghai, where urbanizations are relatively higher than other cities, Liu et al. [40] suggest that both cities have a decreasing fraction of emissions from energy-related industrial sources, accompanied with rising emission contributions from household electricity usage and the transportation sector. The total amount of peak CO2 emissions in Beijing could reach 165 million Mt in 2019 [41]. In addition, energy intensity is the strongest factor affecting the ability of Tianjin (Which also is an important Municipality in the Eastern region) to achieve carbon emission peak, and energy efficiency is the main way to control carbon emissions [42]. Luan [43] evaluates the reasons for increased carbon emissions in Shandong province and finds that the main factors are increases in population, per capita GDP and coal and oil consumption; furthermore, the consecutive decrease of energy intensity has a strong negative effect on carbon emissions. Furthermore, Shandong province is predicted to reach the carbon emission peak in 2024 under an energy-saving scenario. Gao et al. [39] estimate that in Jiangsu, Zhejiang and Guangdong provinces, economic development is the leading factor that increases carbon emissions, and energy efficiency is the dominant factor contributing to controlling carbon emissions.
Overall, for the Eastern region, economic growth is the main reason for increasing carbon emissions, while energy intensity reduction is the main reason for decreasing carbon emissions. The predicted period for reaching peak carbon emissions is 2020–2025.
2.2.2. Peak Carbon Emissions in the Central Region
The Central region is located between the Eastern and Western regions. On the one hand, because of its adjacency to the eastern provinces, the economy of the Central region is driven by the economic radiation from the Eastern region. On the other hand, the Central region has abundant energy resources with 80% of China’s coal reserves and serves as the energy supplier for the Eastern region. Moreover, the Central region accounts for a significant proportion of global production-based and consumption-based carbon emissions [44]. Affected by the above two aspects, the carbon emissions and carbon intensity in the Central region rank the second among the three regions, but the decline rates of carbon emissions and carbon intensity rank first among three regions. The Central region constitutes 35% of China’s viable carbon emission mitigation [17] and has the highest convergence speed (μ = 0.0561) of carbon emissions [45]. It indicates that the Central region has good potential to balance economic development and carbon emission reduction.
Taking Jilin province as an example, Ma [46] concludes that the driving factors of carbon emissions in Jilin are population size, economic development, industrial structure, energy intensity and energy mix. Energy intensity is the most important factor for reducing carbon emissions. A low-carbon scenariois expected to coordinate economic development and carbon emissions reduction in Jilin province simultaneously, and under this scenario the carbon emission peak is predicted to occur in 2030. Wang et al. [47] state that population and urbanization only affects the peak value of carbon emissions; however, per capita GDP, carbon emission intensity and the proportion of the second industry influence both the time and magnitude of the peak. Moreover, they describe the present development path in Jilin as an “Energy saving-Low carbon scenario”, and it will transit to a low-carbon scenario gradually by developing low-carbon strategies. The prediction for Jilin province to achieve peak carbon emissions under the “Energy saving-Low carbon scenario” is 2029, while the peak year is 2036 under the low-carbon scenario.
For the populous province of Henan, Liu et al. [48] find that economic activity is a dominant factor of carbon emissions growth, and the emission reduction is due to both structural adjustment and energy intensity. Zhao et al. [44] suggest that the year of peak carbon emissions in Henan will be 2025 under a low-carbon scenario considering carbon compensation and absorption.
Therefore, population size, economic development, industrial structure, urbanization, and energy intensity all have some effects on carbon emissions in the Central region, and the predicted interval for realizing peak carbon emissions is approximately 5 years later than that in the Eastern region.
2.2.3. Peak Carbon Emissions in the Western Region
The Western region is a relatively less-developed area among the three regions. With vast territory and abundant resources, diverse climate and complex topography make the natural conditions relatively harsh. Its levels of economic and technology development are much lower compared with the Central and Eastern regions, which results in that the Western region emits surplus CO2 resulting from production inefficiency [17]. As a partial consequence, the total carbon emissions and per capita carbon emissions in the Western region are the least in the three regions. Nevertheless, because this region is limited by the levels of economic conditions and technology, the emission growth rate is relatively high [34,38]. Xu et al. [49] find that in the Western region, especially the Northwest, the energy mix and energy intensity have slight effects on emission mitigation because of the region’s stronger dependence on fossil fuels. Thus, although the cardinal number of carbon emissions in the western region is relatively small, the less-developed economy and technology as well as higher energy dependency cause the outlook for realization of peak carbon emissions in the Western region is not optimistic.
Guo [50] concludes that the level of economic development, energy mix, population, industrial structure, low-carbon policy, and level of technology are the main factors affecting carbon emissions in Gansu province, which is a typical case of western region. According to the current development situation in Gansu, analysis of various scenarios indicates that the scenario involving moderate assumptions of emission growth is more in line with low-carbon development objectives in the future. The value of peak carbon emissions is predicted as 251 million Mt in 2030. Deng et al. [51] suggest that technology and wealth are two necessary factors to reach the carbon emission peak in five Northwest provinces. If the decline rate of carbon intensity is faster than the growth rate of economic and social development, the carbon emissions will peak earlier. Under the low-carbon scenario, the carbon emission peak will appear in five Northwest provinces in 2025. Feng and Wang [52] consider that for Shaanxi province, industry is the main sector producing carbon emissions, accounting for 93.6% of the total emissions. For Shaanxi province, the outflow expansion effect, investment expansion effect and input-output coefficient change effect are the main factors that increase carbon emissions; conversely, the inflow substitution effect and energy consumption intensity change effect are the main factors that reduce carbon emissions, and its peak carbon emissions (448 million Mt) under a low-carbon scenario will be achieved in 2030. By using a benchmark model, Liang et al. [53] find that population, GDP, urbanization, industrial structure, and energy mix will be the important driving forces for carbon emissions growth in Chongqing city. The year of peak carbon emissions in Chongqing is predicted to be 2025, with the value of 305.4–338.6 million Mt.
Briefly, economic development, energy mix and industrial structure play major roles in influencing carbon emissions in the Western region, and the predicted date for reaching peak carbon emissions is similar to the peaking interval in the Central region.
By using Three-hierarchy meta-frontier DEA (Data Envelopment Analysis), Feng et al. [54] decompose carbon emission efficiency for different industries, and then calculate carbon reduction potential from the perspectives of management, technology, and structure. Figure 2 shows that due to the relatively high-level technology, the Eastern region has the highest carbon emission efficiency in the primary and tertiary industries; by contrast, low-carbon emission efficiency in the Central and Western regions is mostly caused by technical inefficiency. The big differences in emission efficiency between the secondary industry and other industries indicate poor performance in structural efficiency, which is most notable in the Eastern and Central regions. Furthermore, Figure 3 specifies that these potentials are obviously unbalanced in the three regions. Technical potential is the most necessary part of carbon emission reduction in the Mainland China, Western and Central regions. Nevertheless, in the Eastern region, the management potential dominates carbon reduction potential, and structural potential does not have advantage either in regions or in the whole Country. In addition, the potential for reaching carbon emission peak through economic efficiency may be greater in the Western region [49].
2.3. Industry Analysis of Peak Carbon Emissions in China
As an indispensable aspect of industrial production and daily life, the industrial sector plays a significant role in the final realization of the carbon emission peak target [55]. Emission mitigation will have different levels of negative impact on all industries in China. Liu et al. [31] find high-energy-consuming industries and energy-intensive industries will suffer the most, while such low-emission industries as agriculture, food, trade, and services will suffer less. Because the energy industries account for the largest share of fossil energy consumption, they are considered to be high carbon-emission industries. Due to the upstream and downstream industry linkage effect, some non-energy industries are also affected by performance of the energy industries. Against the background of carbon emission reduction, overall investment will decline, which will lead to a decrease in construction demand and induce a series of industry diffusion effects. For example, as producers of raw materials for construction, the steel and cement industries would greatly suffer the negative impact of a construction slow-down. As the imposition of a carbon tax and other reduction measures directly increase the usage cost of input production energy in non-energy sectors, low-emission industries such as agriculture, food, trade, and services would experience rising production costs that result in falling output and rising prices. However, because the outputs of such industries are the necessities of life and are relatively less affected by direct demand, the output change of these industries is relatively weak (See Figure 4). According to Wang and Feng [56], the secondary industry sector should play a dominant role in CO2 emission mitigation in China. Their studies specify that reaching peak carbon emissions is conducive to adjusting and optimizing the industrial structure.
2.3.1. Carbon Emissions in the Iron and Steel Industry
The iron and steel industry produce the third largest amount of carbon emissions in China, behind that of the power industry and petrochemical industry [57]. Xu and Lin [58] indicate that the main factors affecting carbon emissions in the iron and steel industry are the levels of industrialization, energy efficiency, urbanization, and energy mix. Industrialization dominates carbon emissions in the iron and steel industry, and its effect on carbon emissions gradually decrease spatially from the Eastern region to the Western region partly due to the impact of urbanization on carbon emissions, which is mainly led by the rapid growth of private car ownership and real estate requiring large amounts iron and steel [59]. In addition, because of the huge differences in regional research and development (R&D) investment, the impact of energy efficiency on carbon emissions in the Eastern region is more significant than that in the Central and Western regions. The potential for upgrading the energy mix in the iron and steel industry will increase with the increasing R&D investment in energy conservation technology and the expanding use of clean energy.
2.3.2. Carbon Emissions in the Power Industry
The Chinese State Information Center points out that to achieve a carbon emission peak in 2030, emissions need to be reduced by 17 billion Mt under existing policy, in addition, the principal technology reduction potential would come from the development of renewable energy, nuclear power and natural gas power generation in the power generation industry. These changes will contribute 8.4 billion Mt to the emission-reduction capacity, accounting for half of all reductions. Therefore, the power industry has become the key sector designated to reach the carbon emission peak in advance of other sectors. However, the reduction potential of fuel replacement in the electricity industry is only 2.6 billion Mt, so the remaining 5.8 billion Mt of reduction needs to be achieved by developing renewable energy technology [60].
Wang et al. [61] find that the low-carbon trend of electric power industry would play an important role in achieving peak carbon emissions in China, and it is predicted that electric power carbon emissions in 2030 will reduce by 0.2 Gt due to a decline in the share of coal-fired power generation from 66% in 2020 to 56% in 2030 with the increase in gas and other non-fossil fuels such as hydro, wind and solar. Therefore, China should reform the coal price mechanism and introduce more natural gas supply sources, so that the power industry will use natural gas as an alternative to coal more broadly [61,62]. Go a step further, Yang and Lin [62] conclude that economic activities and power consumption intensity are the main driving forces of emission growth in the power industry; the improvement of energy efficiency is the main reason for reducing carbon intensity and is the greatest contributor to carbon emission reduction in the electric power industry. Cheng and Xing [63] quantify the inherent requirements and impact of energy power development on reaching the target of peak CO2 emissions in 2030, besides controlling total energy consumption, they also conclude that it is of great importance to develop clean power generation to reach the peak as early as possible and reduce the peak value. The increasing proportion of clean power used by new power generation equipment will make electric power has a more prominent “carbon advantage” compared with other energy. In reality, power generation through wind and solar power depends largely on meteorological conditions, which is not the case with hydro and nuclear power.
Considering different peak carbon emission scenarios, Zhang and Zhang [64] analyze the different changes that will occur in the power industry. Under the medium-speed scenario, carbon emissions in China will not reach a peak for a long period, but the power industry still faces fast structural adjustment. Under this scenario, peak of coal-fired power generation will reach in 2025–2030, after that non-fossil energy power generation will begin to gradually scale up and become the key power generating energy source on a large scale (See Figure 5). Under the high-speed scenario, carbon emissions in China will peak during 2020–2025, coal-fired power generation capacity will peak around 2020, and non-fossil energy will develop more intensively and make a massive substitution for coal in power generation. Meanwhile, since China’s economic development has entered a new normal phase, its economic structure has successfully turned to lower energy-consuming industries, and the growth rate of electricity demand will continue to decrease. Because of the dual pressures of supply and demand, coal-fired power generation capacity will continuously decrease after peaking.
2.3.3. Carbon Emissions in the Cement Industry
According to the Report Research Center, coal consumption accounts for 53.47% of industry’s energy consumption in 2016, which indicates coal consumption is the most significant contributor to carbon emissions of industry and will remain so in the long term. Specifically, the cement industry is the third largest coal-consumption unit in China, ranking after the power, iron and steel industries [65]. Thus, it is urgent to optimize the energy mix in the cement industry. As a significant emission source [35], the cement industry is faced with enormous pressure to mitigate carbon emissions.
Limestone decomposition and coal combustion are the main sources of carbon emissions in the cement production process. According to China’s cement energy consumption level, it can be estimated that producing each Mt of cement would emit 0.7–0.8 Mt CO2 [66]. To better investigate China’s cement industry conditions, Lin and Zhang [67] modify the Kaya identity analysis. Through the Kaya model the factors affecting the industry’s carbon emissions are summarized as energy mix, energy intensity, labor productivity and industrial scale. Among these, labor productivity is the main driving force that increases carbon emissions, and the decrease in energy intensity is the main reason for carbon emission mitigation. Large-scale infrastructure construction requires a large amount of cement, but the carbon emissions associated with this demand cannot be completely mitigated by technological advances such as energy recovery. Therefore, carbon emissions in the cement industry will continue to grow in the next few years; accordingly, energy shortages, environmental degradation, carbon emissions and other challenges will be inevitable. Gao et al. [68] state that the share of emissions generated by fuel burning is reduced lightly and the increase rate of the percentage of process emissions becomes stable for cement industry. They also predict that emission amount will be reduced to 856.62–957.91 Mt in 2020 and find that energy efficiency will be primary factor affecting emission mitigation.
2.3.4. Carbon Emissions in Other Industries
China is a big agricultural country, and agricultural sector’s carbon emissions account for 17% of total national emissions. Gao and Song [69] find a spatial correlation exists in the distribution of carbon emissions from agriculture sector in China, which can further verify the agricultural carbon emission performance of a certain province is related or convergent with the efficiency value of the neighboring provinces; nevertheless, since 2000 the degree of correlation has become weaker [70]. Bao [71] states that a positive spatial correlation effect of agricultural carbon emissions is significant at the national scale, as well as in the Eastern and Central regions, while the correlation effect in the Western region is non-significant. The growth of the agricultural economy and the expansion of the agricultural labor force promote the overall agricultural carbon emissions levels, while decrease in the amount of arable land, improvements in agricultural technology and production efficiency help to reduce agricultural carbon emissions. Xu and Lin [72] find that because of the disparities of agricultural fixed asset investment and crop exports, the impact of economic development on carbon emissions in the Central region is more powerful than that in Eastern and Western regions. Therefore, policy makers should fully consider the spatial non-stationary when designing emission-reduction policies, thus promoting the balanced development of low-carbon agriculture among 3 regions; farmers should reduce the consumption of harmful inputs such as chemical fertilizers and pesticides, in addition, it is necessary to adopt a three-dimensional breeding mode such as biogas tanks to reduce dependence on fossil fuels [69,72].
Tourism sector makes up 2.71% of the total carbon emissions of all industries in China, which indicates tourism sector plays an important role in reducing CO2 emissions in China. Zhang [73] emphasizes some influencing factors of carbon emissions from the tourism sector, such as tourism carbon intensity, low-carbon transportation, education about a low-carbon environment, carbon sink density and sewage treatment. Tao [74] analyzes the driving forces more specifically, and points out that the total carbon emissions of domestic tourists are notably higher than those of international tourists, but per capita carbon emissions of the former are much lower than those of the latter. The number of tourists and their consumption levels are the main drivers of total carbon emissions, while the decreasing energy intensity and optimizing energy mix in the sector have certain negative effects on carbon emissions. Airline travel and self-driving are the two main sources of carbon emissions from tourist traffic. Furthermore, luxury-style hotels have become the dominant carbon emitters for tourist accommodation. Compared with sightseeing, leisure travel produces higher per capita carbon emissions; therefore, there is greater emission-reduction responsibility in leisure travel.
Although the food industry is not an emission intensive industry on the surface, it still accounts for 2.84% of China’s total industrial energy consumption [75], therefore, it also contributes much to the increase in industrial carbon emissions. Lin and Lei [76] conclude that energy intensity is the most important factor decreasing carbon emissions in the food industry, while industrial activity is the most important factor increasing carbon emissions. Industrial scale usually contributes to the increase in emissions. However, both carbon intensity and energy mix have volatile effects on emissions in different time intervals. Similarly, Lin and Xie [75] state that although the food industry is not a carbon emission-intensive industry, its large scale cannot be underestimated for emission reductions in the industry. However, they recognize carbon emissions in the food industry are mainly affected by total output and energy intensity, and the latter’s impact is more remarkable. Urban residents consume more processed food products than rural residents, which means the terminal consumption of urban residents accounts for a greater proportion of carbon emissions in the food industry. Furthermore, the impacts of import substitution and export expansion on carbon emissions of food industry are relatively weak.
3. Analysis of Factors Influencing Carbon Emissions
To explore how China can achieve the carbon emission peak on schedule, it is essential to comprehensively analyze the main factors that cause increased emissions. Understanding these factors can help break emission-reduction bottlenecks and lead to targeted actions to realize the carbon emission peak sooner. Based on the status of regional and industrial carbon emissions, many studies attribute the growth of China’s carbon emissions to five main causes: economic development, urbanization, energy-related issues, foreign direct investment (FDI) and technology, and transportation.
3.1. Economic Development
Historically, economic development and structural features are tied closely with carbon emissions [77,78]. Economy cannot develop without energy, and the burning of fossil-based energy sources is one of the leading causes of carbon emissions. China’s economy is likely to continue to grow and develop, resulting in increased carbon dioxide emissions. Thus, among the five influencing factors economic growth is the most significant reason for increased carbon emissions. China contributes significantly to global carbon emissions, moreover, its emissions are still rapidly increasing because the impact of economic development on emissions growth is greater than that of technological progress and industrial structure changes on emission reduction. Thus, research on how the economic development influences carbon emissions has become a topical issue [15,16,27,28].
Through evaluating the relationship between emission mitigation and economic growth, Mi et al. [28] find that the earlier China’s CO2 emission peak, the smaller the country’s GDP loss will be. According to their projection, China’s annual average GDP growth rate will exceed 5% over the next 20 years, and the carbon emission peak may occur by 2026. Taking 2026 as the peaking target year, China’s cumulative GDP must decrease by 16.45% and this reduction will lead to a corresponding decrease in added value in most sectors. However, several sectors will benefit from an earlier carbon emission peak, such as the machinery and education sectors. If national GDP surpasses the current growth rate (at 7.6% in the base year of 2013) and reaches a higher level, the annual total emission index will not peak by the end of 2035. If the GDP growth rate remains relatively slow (decelerating from 7.6% at an annual rate of 0.1%), the total carbon emissions will peak sooner, but the living standards of residents will hardly improve; only when GDP is at a medium growth rate (decelerating from 7.6% at an annual rate of 0.05%) can economic development and environmental protection both be taken into account [27]. The increase in energy consumption is the inevitable cost of rapid economic growth [79,80], which will consequently lead to substantial carbon emissions. Liu et al. [31] recognize various situations of carbon emissions under different GDP growth rate scenarios (i.e., 7%, 8%, 9% and 10%) through an “Economy-Energy-Carbon Emission” model. The results indicate a higher economic growth rate will lead to greater energy consumption and more total CO2 emissions. With the GDP growing, the use of either traditional or renewable energy resources would rise. Furthermore, the carbon emission intensity will decrease with an increase in the economic growth rate.
Although an earlier peaking time for carbon emissions results in better control of emission amounts, the huge opportunity cost of reaching an earlier peak cannot be ignored [81]. If the emission peak occurs prior to 2030, the loss in average annual GDP will be significant and the impact on GDP will not become positive until several years after the peaking year. The emission peaking time is determined by composite costs, specifically either China’s economic development or global social welfare will be affected by China’s emission peaking target.
From the perspectives of industries, Wang et al. [82] infer that increases in carbon emissions in some regions are driven by the development of the rural economy, especially the rise of tourism and its related industries. By contrast, according to the view of Mi et al. [28], China’s economic growth has been based mostly on the developments of heavy industry and manufacturing, whose energy intensity is 14 times greater than that of the tertiary industrial activities. Therefore, carbon emissions can be limited effectively by increasing the proportion of the tertiary industry in the economy. As the world’s largest exporting country, China’s net exports of embodied carbon emissions are much greater than those of other countries. Qi et al. [83] suggest that large exports of embodied CO2 emissions in China have vitiated the domestic environment. Furthermore, outputs from the machinery and equipment industry have comprised large portions of China’s export-embodied CO2 rather than products from energy-intensive industries, such as iron and steel industries. Provided that the exported production is increased to a more advanced economic level, about 90% of China’s reduction in emissions would be counteracted. Thus, Wang et al. [84] recognize that optimizing the country’s industrial structure and developing the emerging low-carbon industry may become more powerful ways to lower CO2 emissions for China’s major cities compared to the scenario where reducing carbon emissions at the expense of economic growth.
From a regional perspective, Zhou et al. [13] find that a faint decoupling nexus between carbon emissions from industrial energy use and economic growth exist in most regions of China during most periods. Chen and Yang [85] state the economic effect has the most powerful positive influence on carbon emissions, which is more forceful in less-developed provinces (especially those featuring heavy industry) than in developed regions (See Figure 6). Wang et al. [15] also consider economic development to be the largest driver of increased carbon emissions, moreover, they indicate the Central and Western regions have a faster economic growth rate than the Eastern region, resulting in a higher carbon dioxide emissions growth rate. Due to a wide income gap between urban citizens and rural residents, Zhang and Tan [86] hold that this gap leads to large difference in consumption behavior; thus, the effect of income disparity on carbon emissions exhibits rural-urban discrepancies.
3.2. Urbanization
The effect of urbanization on carbon emissions is a dual mechanism that affects carbon emissions oppositely. Most countries have experienced the process of urbanization before carbon emission peak, and the urbanization rate has exceeded 70%. According to National Bureau of Statistics of China, household energy consumption accounts for 12.8% of total final energy consumption in 2016, and the household sector has become the second largest energy consumer sector just after industry [87], which has led to great challenges for setting reduction targets in energy intensity and carbon dioxide emissions. Furthermore, more attention must be paid to research on the impact of urban lifestyle on carbon emissions to reach the carbon emission peak faster [14,25,88,89,90].
For urbanization-related driving factors, Zhao et al. [90] find that population is the source of carbon emissions. In addition, the effect of urbanization on carbon emissions, the change of urban energy consumption patterns and the progress of technology can affect the “carbon source”, while urban metabolism and the change of land use can affect the “carbon sink”. Yang and Feng [25] indicate economic development is the most outstanding driver of regional carbon dioxide emissions during the process of urbanization compared with other factors such as structure change, energy intensity and social changes. Meanwhile, by altering the mode of energy utilization and transportation, urbanization has significantly affected regional carbon emissions. From the regional view, Liu et al. [89] and Zhao et al. [90] find that urbanization level plays a more significant role on carbon emissions in high-emission cities. An 1% increase in industrialization level would lead to an 1.3% increase in carbon emissions in the high-emission cities, which is larger than the increment of 0.7% in the low-emission cities. Yang and Feng [25] find that significant regional differences exist in influencing mechanisms of urbanization on regional CO2 emissions, because the factors that affect social and economic development trends vary across different provinces (see Figure 7).
The great disparities between urban and rural areas result in differences between lifestyle and related CO2 emissions in China, and residential energy-related CO2 emissions. Zha et al. [91] find that energy intensity and income contribute the most to the variations in residential CO2 emissions for urban and rural areas in China. For urban areas, the population effect is the main factor that increases residential CO2 emissions and the effect shows the trend of increase. However, in rural China, this effect has steadily decreased since 1998. As residential energy consumption can be divided into direct and indirect parts, Zhang and Tan [86] indicate that different lifestyles affect associated carbon emissions through both direct energy consumption and indirect energy consumption embedded in services and the production, consumption, and disposal of goods such as clothes, food, housing, and travel. Wang and Yang [92] investigate the indirect carbon emissions from household consumption in urban and rural areas. The results indicate that the Engel coefficient made the outstanding contribution to the Energy Ecological Footprint (EEF) in both urban and rural households. Furthermore, the EEF of indirect energy use for urban residents is increasing while it is decreasing for rural residents. Urbanization level and per capita income are positively influencing carbon emissions in urban areas but have negative effects in rural areas. The Engel coefficient and energy intensity have negative effects on carbon emissions in urban areas, but positive effects in rural areas. Only the proportion of the tertiary industry can boost EEF in both rural and urban areas.In fact, residential consumption structure (denoted by Engel coefficient) is an important factor influencing the indirect energy demand-related carbon emissions of both urban and rural residents. In addition, the Engel Coefficient is a good indicator to represent residents’ living habits, which has a significant effect on carbon emissions [93].
3.3. Energy-Related Issues
China’s energy intensity is much higher than that in advanced economies, and the state of energy utilization technology lags behind developed countries by nearly 20 years. The present situation shows the great challenge of controlling China’s carbon emissions, which in turn indicates that there is great potential for mitigating these emissions.
Based on the Dynamic GTAP-E Model, Liu et al. [31] examine 4 different peaking scenarios and reveal that although the proportions of different energy sources in the energy mix vary, there is an obvious trend that oil, natural gas, and non-fossil energy will become increasingly important over time (see Figure 8). Though China rely largely on technological progress to reduce carbon emissions in the next several decades, energy mix will play an increasingly important role in this process. To promote energy system transformation, favorable conditions must be created to make the impacts of technology and energy mix on carbon emission reduction gradually oversteps the economic impact on carbon emission growth [27].
Wang and Zou [81] find that in the next 5–10 years, coal consumption and emissions from energy-intensive sectors will reach their peaks, and energy conservation will be mainly achieved by industrial structural changes. In the next 10–20 years, primary energy consumption and emissions will reach their peaks. Chai and Xu [14] suggest that the earlier the peak of carbon emissions is reached, the lower the per capita energy consumption will be, accordingly, the peak energy consumption will be followed by the emission peak. An advanced energy mix of lower coal consumption to gain environmental co-benefits can form synergies between energy and climate security policies.
According to He [12], China’s total energy demand will continue to increase by approximately 1.0–1.5% annually until year 2030; however, to reach the CO2 emission peak, new and renewable energy will need to increase by 6–8% annually, accordingly, in the emissions peaking year the share of new and renewable energy is expected to make up 20% of the total primary energy consumption. Han et al. [94] state that coal demand is more sensitive than the demand for other energy sources; thus, rigorous carbon emission mitigation will cause an obvious limitation on coal consumption, but the demand for natural gas and non-fossil energy will grow substantially. Therefore, sufficient non-fossil energy must be guaranteed to meet the increased energy demand for achieving the CO2 emission peak.
An increase in energy efficiency could lead to greater energy consumption because the marginal cost of energy service is decreasing with the improvement of energy efficiency, thereby generating the rebound effect of energy resource [27,95,96]. Accordingly, it is found that the decrease in energy intensity may result in the increase in energy consumption [97]. Fortunately, if energy mix becomes cleaner, even higher energy intensity will not produce excessive emissions. Nevertheless, universal access to clean energy and the implementation of emission-reduction technologies require reliable technology and strong economic conditions to support them. Thus, the high cost of developing and using energy-saving technology will hinder the low-carbon development process. At the same time, the rapid increase in energy prices under a price-control mechanism is adverse to the improvements on the residents’ living standards. Thus, the transformation of China’s energy system needs to go through a long change process driven by continuous efforts of both government and industry.
Wang et al. [16] state that, for low energy-consumption sectors, the decrease in energy intensity is the main driving factor to reduce carbon emissions, and the 2020 and 2030 mitigation targets can be achieved in the base scenario; the carbon intensity of high-emission sectors will merely decrease by 14% in 2030 compared to the 2005 level, the emission mitigation effectiveness of high-emission sectors is relatively low. Thus, it is urgent to improve energy efficiency in high energy-consumption sectors. These projections are also supported by Wang et al. [82]. It shows that due to the high dependency of industrial energy consumption on coal, the increase in the proportion of secondary industry will cause an increase in CO2 emissions. Therefore, more attention is to be paid to the energy consumption of energy-intensive industries.
From a regional view, Chen and Yang [85] indicate that although energy-related carbon emissions diminish spatially from the Eastern region to the Western region (Figure 9), the production activity effect and production sector intensity effect are dominant positive and negative driving factors for carbon emissions in all provinces, respectively. More specifically, it should be noted that the percentage of industrial energy-related carbon emissions has decreased each year in the Central region and in the Beijing-Tianjin region, while the reverse is true in the Northern coastal regions [13]. For other regions, the proportion of industrial energy-related carbon emissions has remained stable.
3.4. Foreign Direct Investment and Technology
Today, with the rapid development of global economic integration, FDI, a fluid complex of capital and technology elements, is a powerful driving force behind economic growth. As a developing country, international investment and trade have become important parts of China’s economic activities. Therefore, in addition to its own economic development mode and energy consumption structure, China’s carbon emissions will also be affected by FDI [98,99].
On the one hand, FDI will reduce the China’s carbon emissions by introducing low-carbon industry standards and clean technology through high-tech investment. Through empirical studies, Wang and Liu [100] find that an 1% increase in China’s importation of carbon emission technology would reduce per capita carbon emissions by 0.07%. Perkins and Neumayer [101] indicate that technology importation is helpful for enhancing CO2 efficiency in the imports that are tied with more pollution-efficient countries. However, neither transnational linkages through exports nor the inward FDI has any influence on domestic pollution-efficiency. Yao [102] concludes that there is a significant negative correlation between FDI and carbon intensity; in which case the introduction of FDI can effectively reduce carbon intensity in China. Because technological progress can effectively promote the reduction of energy intensity and improve energy efficiency, the spillover of FDI will play an impressive role in promoting the technological upgrading of a host country’s production. Zhao et al. [103] and Li et al. [36] find that the promotion of technological innovation capability in a region will not only has a slight positive impact on reducing its own carbon emissions, but also generally produce a positive spatial spillover effect on its neighboring regions (see Figure 10). The technology effect on carbon emissions diminishes spatially from the Middle-East region to the West and North-East regions, which is roughly similar to the science and technology development level of different regions.
On the other hand, some scholars hold that FDI also brings some low-tech investment which will increase carbon emissions through expanding production scale, increasing energy consumption and transferring high-carbon industry. Grimes and Kentor [104] reveal the positive impact of FDI on carbon emissions in the host country, because foreign investment is mainly concentrated in those energy-intensive industries; furthermore, transnational corporations may relocate highly polluting industries to countries with few environmental regulations. Niu and Hu [98] reach a similar conclusion and show that an 1% increase in the import level of technology leads to an approximately 0.09% increase in per capita carbon dioxide emissions. Although FDI has a long-term negative co-integration relationship with China’s carbon emission intensity and energy consumption intensity, the increase in large-scale carbon dioxide emissions caused by technology introduction has surpassed the negative effect of optimizing energy mix and improving technology. Consequently, FDI significantly increases China’s carbon dioxide emissions through the scale effect. From the regional view, the reaction of carbon dioxide emissions to technology import changes can be expressed as emission–technology elasticity coefficient, which is the highest in the Eastern region followed by Central and Western regions. The inflow of FDI increases carbon emissions in both short-run and long-run periods, and the short-term coefficient is higher than the long-term coefficient [105]. The high-carbon economic development model of China is the main driving factor that attracts FDI into high carbon-emission and high energy-consumption industries. To sum up, although FDI may bring clean and low-carbon technologies into China, the mitigation effect of FDI is offset partly by the introduction of high-emission industries.
Lin [106] concludes that there is a long-term co-integration relationship between FDI and carbon dioxide emissions in China. FDI from Hong Kong, Macao and Taiwan causes the greatest increase in emissions; investments from Japan, Singapore, Korea, Europe, and the USA reduce the emissions, and FDI from Western countries contributes to higher emission mitigation. At the regional level, FDI in the Eastern region reduces carbon dioxide emissions, and FDI in the Central region has the opposite effect. However, in the Western region 99% of carbon emissions are not significantly influenced by FDI. The impact of FDI in three categories of industries is diverse specifically: for capital- and technology-intensive industries, FDI can effectively reduce the carbon emissions; however, FDI increases emissions in resource-intensive industries, and has no obvious impact in labor-intensive industries.
Zhou et al. [13] confirm that China’s carbon mitigation technology lags behind developed countries, its contributions to economic growth and industry energy carbon emission decoupling are limited. Technological progress is decomposed by Liu et al. [99] into technology introduction and technological innovations which both have negative effects on carbon emissions and are conducive to improving the quality of atmospheric environment. Of the two aspects, the reduction effect of technology innovations is more obvious. There is a significant negative correlation between R&D expenditure and carbon intensity; thus, improvement in the level of independent research and development could accelerate China’s reduction of carbon emissions and carbon intensity [102].
3.5. Transportation
With the acceleration of industrialization and urbanization, China’s economic and social development is becoming more inseparable from the guarantee of “complete transportation system”; consequently, transportation has a more realistic significance for Chinese economic development and ecological protection than previously [107].
At present, China’s level of car ownership is relatively low and the proportion of energy consumption due to private vehicle usage lags behind that in developed countries. However, with the continued growth of GDP and improvement of citizens’ income, the private car ownership will continually rise. For every 1% increase in household car ownership of urban residents, indirect energy consumption will increase by 0.2545% [108], therefore, the transportation industry will result in greater energy consumption and carbon emissions in the future. The emergence of new energy vehicles such as electric cars can meet people’s demand for car ownership while contributing to carbon reduction. Electric cars have higher fuel efficiency than traditional internal combustion vehicles when the upstream power generation technology remains unchanged, electrification can achieve a 3–36% carbon emission reduction effect under different hypothetical scenarios. If clean power generation technology is applied, this reduction space may be further increased [109,110]. In reality, the rapid increase in passenger and freight traffic already has increased the demand for transportation energy, especially the demand for fossil fuels. In the long term, China’s transport sector carbon emissions will exhibit an upward trend. Currently, transportation is the fastest growing sector in terms of energy demand and greenhouse gases emissions, so transportation sector will play a major role in energy conservation and carbon reduction [90,110].
According to the division of transportation modes into overland, waterway, railway and air, Zhao et al. [90] find that the former two modes are the main sources of traffic carbon emissions, accounting for nearly 95% of total carbon emissions in the transportation sector. Industrial structure has main effect on carbon emissions from the four modes, and emission intensity has a slight effect on emission differences among these modes. Zhang [111] suggests that transportation turnover volume and fuel efficiency are two factors affecting carbon emissions for civil aviation, and through autoregressive distributed lag modeling it is found that the factors influencing transportation turnover volume are GDP per capita and population size. Compared with freightage, passenger transport is the more influential factor of energy conservation and emission reduction in China’s transportation industry [107]. Energy mix improvement within the transportation industry will enable great potential for energy saving and emission reduction, but the promotion of energy efficiency policies will have relatively limited effects.
China’s traffic carbon emissions exhibit spatial variations [41,112]. In the Eastern coastal developed areas, the amount of traffic carbon emissions is high. In the Western region traffic carbon emissions are relatively low because western provinces are mainly economically less-developed areas and sparsely populated areas. Both studies also point out that with time going by, the emission gaps between China’s provinces and cities are shrinking. It means the time effect on traffic carbon emissions is negative and the effectiveness of reduction measures is increasing annually, thus, per capita carbon emissions will be reduced, whose decline rate will be increased gradually.
In the long run, the positive influencing factors of traffic carbon emissions are (in descending order) per capita GDP, average vehicle energy consumption and urban built-up area [112]. Similarly, Lin and Benjamin [110] examine the impacts of various factors on carbon emissions from the transportation sector and rank the impacts from large to small as carbon intensity, GDP, energy intensity and urbanization. From the Opposite side, Yang et al. [41] recognize that public transportation development has a significant negative influence on the growth of per capita carbon emissions.
4. The Path to Carbon Emission Peak in China
Data in Figure 11 show that in the middle of the 1990s, non-OECD countries gradually exceeded OECD countries and became the main sources of global carbon emissions. In the period 1990–2040, the actual and projected dynamic trends of global carbon emissions are similar to non-OECD countries. In 2007, China surpassed the USA as the greatest emitter, and after the inflection point, the change of emissions gradually becomes smooth and close to the trend of OECD countries.
Data from Chai and Xu [14] are summarize in Figure 12 and Figure 13, which suggest that when developed countries reached the total carbon emission peak, their urbanization rate exceeded 70%, and the per capita GDP exceeded 20,000 USD (at 2015 constant prices). When per capita carbon emission peak, the urbanization rate and per capita GDP of each country are slightly different from the values when total carbon emissions peak, but the overall trend is similar; the emissions per capita are basically below 20 tons. When taking amounts of typical countries’ total and per capita carbon emission peaks as targets, China’s predicted peak years are roughly 20–50 years behind those countries. These data further indicate that urbanization and economic development levels are highly related with carbon emission peak.
The experiences of developed countries provide a guide to development of the carbon emission peak in China. However, unlike developed countries whose total carbon emission peaks frequently occurred later than the per capita peaks, total and per capita carbon emissions in China are likely to peak in a similar period because population growth in China is expected to be much slower than emission growth in the next decades. Economic growth and the acceleration of urbanization result in the increase carbon emissions, while technological progress and energy structure optimization reduce emissions. However, the negative effect of technological progress is far greater than that of energy structural change. By contrast, economic development plays more important roles in increasing energy consumption and CO2 emissions than urbanization. Thus, compared with developed countries, China has a great potential for energy conservation and emission reduction because of the relatively higher speed of technological progress and economic growth [14,27].
Furthermore, among the various influencing factors mentioned in Section 3, Du et al. [35] argue that economic development, technology progress and industrial structure are the most important factors affecting China’s CO2 emissions, while the impacts of energy structure and urbanization level are insignificant. This finding may not be surprise to us. Because of the long-term dependence on coal consumption caused by China’s energy endowment, there is still a long way to optimize energy structure by increasing the share of non-fossil fuels in a short time. Furthermore, an urban resident usually causes more CO2 emissions than a rural resident [113]; however, urbanization process has the advantages of energy-intensive utilization and high household energy utilization efficiency, thereby contributing to reducing CO2 emissions, the two opposing forces may contradict each other. Zhao et al. [90] recognize energy consumption, technology and a province’s energy infrastructure should be controlled. Among several influencing factors, Ouyang and Lin [8] point out that urbanization has the greatest effect on growth rates of energy consumption and CO2 emissions. Considering the above-mentioned, the following strategies are developed, which conform to China’s reality.
4.1. Economic Development Model and Residents’ Consumption Behavior
With rapid economic development and expansion of the construction infrastructure, the proportion of household energy consumption in carbon emissions will gradually increase. China is experiencing a shift from being a traditional agricultural society to a modern industrial and urbanized society. The urbanization process determines the lifestyle of residents, so a growing number of newly urbanized residents will change their energy consumption behaviors by enjoying more modern energy services. Furthermore, an increasing number of people will tend to consume more energy to obtain high-quality life, which imposes more pressure on energy conservation and emission reduction [92,114,115].
Therefore, governments should introduce the concept of a “low-carbon city” vigorously, raise awareness of a low-carbon economy, cultivate low-carbon lifestyle, improve the energy usage in residents’ homes and increase public services that facilitate low-carbon living [16,25,27,90]. Additionally, China should take such fundamental measures as optimizing economic structure, promoting a sustainable low-carbon economic pattern, abandoning the obsolete development model (over-reliant on high energy-consumption and high-emission industries) and expanding the tertiary industry representative of a low energy-consumption economy. Furthermore, the overall social income level is to be improved and the social and public welfare should be enriched to reduce the burden of public consumption and release the huge consumption potential. These objectives can be achieved by means of reducing economic dependence on fixed asset investment and low-end exports, thereby promoting domestic consumption, and maintaining sustainable economic growth [62,82,92,116].
As a necessary part of residents’ daily life, transportation also makes a large contribution to carbon emissions. Therefore, the following ways are specified to reduce per capita carbon emissions in the transportation industry. They comprise planning the construction of transportation to achieve an agglomeration effect, providing a mature public transport system, promoting the change of travel mode, and taking specific control measures for passenger transportation departments, such as improving the standard of vehicle occupancy. The city population density, the size of built-up area and the density of urban roads should also be controlled according to a rational plan [41,90,107]. Wang et al. [82] suggest developing a highly energy efficient transport mode and promoting China’s transport energy savings during urbanization process. According to Lin and Benjamin [110] the integration of energy intensity and carbon intensity reductions can dramatically reduce carbon emissions in the transportation industry, and carbon intensity has a more profound impact in the long run.
4.2. Industrial Structure and Production Process
China has entered a period of deep adjustment of industrial structure, and industrial upgrading is also one of the main ways to reduce emissions. As a large agricultural country, agricultural production is not only China’s carbon source but also carbon sink. It will increase carbon emissions through land use change and increase carbon sink through land remediation and intensive use. Industry is the dominant force in China’s real economy growth while it still presents the characteristics of high energy consumption, high emissions, and low efficiency. The tertiary industry represented by transportation and tourism has gradually become an important support for China’s modern economic growth. Yang and Feng [25], Jia [42] and Wang et al. [117] indicate that during the process of improving the living standards of domestic residents, the consumption behaviors of China’s urban residents have deeply affected national industrial structure. Furthermore, emission mitigation will be costly and difficult without fundamental shifts in the development paths. Thus, optimizing the industrial structure is urgently required and of great importance for saving energy, thereby increasing energy efficiency, and reducing emissions.
Wang et al. [16] and Niu et al. [27] suggest that optimizing the layout of industrial space, controlling the capacity expansion of energy-intensive industries, and transferring high energy-consuming industries are effective means of controlling carbon emissions. Wang et al. [16] state that policy makers should formulate targeted emission-reduction policies for different sectors under a comprehensive consideration. For the energy-intensive industry, controlling industrial scale and resolving significant overcapacity are effective measures to reduce carbon emissions [116]. Gao et al. [68] suggest that emission reduction in the production process also should focus on encouraging these industries to change the traditional production modes, thereby leading to energy conservation and pollution reduction. Gao and Song [69] find that optimizing the agricultural structure and encouraging the use of environmentally friendly agricultural production factors such as organic fertilizers will be useful to reduce carbon emissions in the agricultural sector. For light industry such as food production, Lin and Xie [75] and Lin and Lei [76] demonstrate that it is necessary to increase energy efficiency, upgrade energy consumption structure and develop large-scale food enterprise groups by integrating food companies. It is supposed to promote deep processing by further refining the semi-finished products, increasing the added value of production, and taking high-quality production to replace mass production characterized by low added value, thereby contributing to efficiently reducing energy consumption and carbon emissions. Furthermore, exploiting the potential of the tertiary industry can reduce carbon emissions effectively without impairing economic development [25,99].
4.3. Optimization of Energy Usage to form an Excellent Ecological Environment
Energy consumption and carbon emissions are directly related in a fossil-fuel economy. He [12] and Mi et al. [28] hold the view that it is necessary for China to optimize energy mix, thereby achieving the CO2 emission peaking target and substantially promoting the low-carbon development transformation. In addition, China needs to achieve the co-benefits of CO2 emissions reduction on energy conservation and environmental protection before carbon emission peak.
Figure 14 and Figure 15 clearly present that by the end of 2014, the dependence on coal in China had not diminished. In fact, the proportion of carbon emissions produced by coal combustion presented a steep upward trend, accounting for approximately 80% of the total emissions. In terms of global carbon emission sources, coal, liquid fuels, and gas fuels all showed the growth trends. However, a more balanced distribution among these sources was found in worldwide compared with China. Therefore, more efforts are required to optimize energy mix in China.
Yang and Lin [62] and Zha et al. [91] find the types and quality of fuels play an important role in reducing carbon emissions. However, coal still plays a dominant role in electricity production and presents an upward trend; thus, it is a big challenge to encourage this energy-intensive industry to use more fuels of lower emission coefficients. Governments could initiate industrial differentiation policy and encourage key industrial sectors to achieve a reduction in fossil fuels consumption by setting and implementing stage-specific and region-specific CO2 emissions reduction goals or peak targets [12,119]. Wang et al. [120] suggest that rising energy prices can stimulate emission reduction but at a high cost, whereas the alternative policy of using clean energy instead of high-carbon energy has great potential for emission reduction and will not hinder economic development.
Generally, many scholars [62,68,82,89,91,103] conclude that a variety of strategies can be used to mitigate CO2 emissions and CO2 emission intensity effectively. These measures include guiding enterprises to increase the diversity of energy mix, improving energy utilization technology, expanding the use of new energy, increasing the proportion of clean energy use, and increasing the share of hydropower and nuclear power. At the same time, waste materials can be used to bring more environmental benefits, the scope of renewable energy utilization can be expanded, and efforts can be made to achieve terminal energy conservation.
However, because most new sources of energy are expensive and typically suitable for a single application, new energy can become an alternative energy source but will struggle until becoming the main energy source. Currently, there are some disputes about the utilization of nuclear power as a way to mitigate carbon emissions. Some scholars argue nuclear energy maybe become more fossil-fuel intensive than traditional fossil fuels by midcentury, as mining of the uranium resource and processing of low grade ore will consume greater fossil-fuel energy. As a result, nuclear energy will perhaps become more carbon intensive even than coal. Therefore, nuclear could not completely solve the CO2 problem. In addition, it is worth noting that China has abundant shale oil and gas reserves, but mining technology is not mature, especially for the shale oil. The mining of shale oil and gas has strict requirement for technology. For example, the mining process of fracturing method in densely populated areas may lead to environmental problems, such as water pollution and earthquake. It will be helpful to learn experience from countries such as the USA and Canada with advanced mining technology and low mining cost. Moreover, for some regions with special geological structure, it is still necessary to independently develop mining technology according to local conditions. Therefore, the potential development of China in shale oil and gas industry is expected to be attractive and promising in the future. Maybe the share of coal consumption is likely to be overtaken by other energy resources in China. Coupled with China’s coal de-capacity policy, the current development of shale industry will be helpful in stabilizing China’s energy supply structure. In other words, it can effectively alleviate the excessive dependence on coal consumption caused by China’s energy endowment of rich coal, lean oil, and little natural gas, thereby leading to decreasing carbon emissions and achieving peak carbon emissions sooner [121].
Luan [43] and Wang and Zou [81] find that decreasing energy intensity, optimizing energy mix and improving energy efficiency have been and will remain effective ways to mitigate CO2 emissions, as well as realize sustainable development without damaging economic development.
Zhao et al. [90] confirm that blindly slowing down the pace of urbanization cannot solve the carbon emission problem from the source; rather, improving the quality of urbanization and increasing investment in the ecological environment and pollution control can be helpful to achieve emission reduction. In the process of urbanization, attention must be devoted to the construction of ecological environment, such as expanding the amount of green space to increase carbon sink. He [12], Wang and Liu [100] and Lin [106] propose that governments should gradually improve environmental standards, strengthen low-carbon environmental regulations, improve relevant carbon emissions control policies and regulations, establish a carbon tax and carbon financial systems, promote environmental law enforcement, and establish a cooperating social responsibility system. These techniques can increase the emission cost of high-emission enterprises, promote the internalization of environmental costs, rationalize the price system of resource products, continuously improve environmental access standards and resource tax, and accelerate the formation mechanism of resource products pricing. Besides, national carbon emission cap and carbon trading system also become important parts of China’s ecological civilization system.
4.4. Further Enhancing the Development of FDI and Technology Progress
FDI can promote China’s economic growth and international trade. Meanwhile, large-scale foreign capital enters the high energy-consumption and high carbon-emission industries, thereby producing many products with high embodied carbon content in China. In fact, this process transfers up to 10 million Mt of carbon emissions annually to China, which will deteriorate China’s natural environment. Therefore, the “transfer carbon emissions” caused by FDI cannot be ignored [14,106]. Furthermore, it is necessary to enhance the ability to absorb and utilize the technology spillover effect of FDI, thereby contributing to reducing domestic carbon emissions. Go a step further, increasing R&D investment and policy support, and developing sustainable economic system and society are the best ways to increase the effectiveness of technological progress in mitigating carbon emissions caused by GDP growth [27]. Technological improvements in energy saving and carbon reduction are the most important factors to mitigate carbon dioxide emission, moreover, the improvements of energy efficiency and carbon emission efficiency are important to curb CO2 emission growth rate [12,15,116]. Therefore, the innovation of advanced energy technology and international cooperation should become strong supports for energy revolution.
The development of low-carbon technology in China should not only undertake independent innovation, but also must actively seek international technical cooperation and make full use of the “clean development mechanism”. At the national level, the government needs to expand the scale and intensity of FDI, improve the quality of investment, optimize the industrial distribution of FDI to provide a good capital basis for introducing carbon emission controls, and cooperate with domestic and international advanced research institutions to achieve technological innovation. Currently, because the introduction of sophisticated technology capital in China is still limited, the government should encourage foreign investment in high-technology industries and limit the entry of foreign capital into low-technology and energy-intensive industries. Governments also should further increase efforts to introduce foreign funds to primary industry, optimize the investment structure of the secondary industry, guide the distribution of funds to the tertiary industry and provide preferential terms for FDI. Furthermore, it is vital for governments to promote international technical cooperation in low-carbon technology for enhancing local competitive advantage.
At the enterprise level, several techniques can help the electricity industry and high energy-consuming industries achieve carbon emission peak by stages. These include enhancing eliminating backward production capacity such as enterprises with lower production techniques and higher resources consumption and emissions than industry averages. At the same time, it is of great importance to increase investment in R&D and popularize energy-saving and emission-reduction technologies to high energy-consuming industries. In summary, improving national independent research and the development level of low-carbon techniques would ensure the realization of carbon emission reduction targets [6,16,42,100,102,106].
From a regional perspective, Feng et al. [54] argue that the interchange of technology throughout China cannot be ignored. Li [79] suggests that attention should be paid to the mutual influences of technological progress among regions in the process of carbon emission peak, thereby activating the benign interaction of regional technological progress. Adopting differentiated FDI policy can promote industrial gradient optimization [106]. FDI in the Eastern region which is mostly market-seeking would be conducive to reducing carbon emissions, so it is necessary to increase efforts to attract foreign capital. For the Central and Western regions, most FDI is resource-seeking and will significantly increase carbon emissions. Therefore, local governments should limit investment in high-emission industries and instead guide capital into the tertiary industry characterized by low carbon emissions. Meanwhile, China also needs to enhance the preferential FDI policies in the Central and Eastern regions in a timely manner. Park et al. [122] and Zhang [123] state that due to differences in climate, economic circumstances, and carbon emission efficiency, achieving China’s carbon emission peaking target requires combining various technologies across various regions as well as formulating zone-division and time-phased carbon emission control targets scientifically.
The historical cases of emission peaks in industrialized countries are of great significance for developing countries. Chai and Xu [14] find that for China, the gradual reduction of carbon emissions is more suitable than other approaches to achieve the carbon emission peak, and the transfer process will be smoother. By reducing carbon intensity and then controlling the total emission amounts, China can fully realize the peaking of carbon emissions and the abatement of carbon emissions.
5. Conclusions
This study systematically reviews a wide range of literature about the carbon emission peak in China. The comprehensive review provides valuable suggestions for different regions and different industries to help China achieve its carbon emission peak as early as possible.
In accordance with this review of literature, the following conclusions can be drawn. (1) Carbon emissions in China are still in an increasing trend. Mitigating emissions will be a long and arduous task. According to most research, the peaking year is projected to be in the period 2020–2040 with carbon emission peak of 10 Gt; some scholars also indicate China’s total and per capita carbon emissions may peak in the same period, which will be different from traditional industrialized countries. (2) Among China’s three economic regions, the Eastern region is the largest in term of total carbon emissions and per capital carbon emissions, and will be the first region to achieve carbon emission peak. The Central region has the best potential to reduce emissions, and its predicted interval for realizing peak carbon emissions is approximately 5 years later than that in the Eastern region. Because of its less-developed economic and high coal consumption, the ability of the Western region to realize carbon emission peak is questionable. Generally, the factors affecting carbon emissions in these three regions are mainly concentrated on economic development, energy intensity and industrial structure. (3) From an industrial perspective, the secondary industry (including energy-intensive sectors such as the iron, steel, power, and cement industries) is a dominant contributor to carbon emissions in China, and energy efficiency, industrialization and urbanization are primary influencing factors of carbon emissions in these industries. Some scholars also study other industries which seem less relevant with carbon emissions such as agricultural, tourism and food sectors; however, the results show that their carbon emissions should not be underestimated. (4) Most scholars suggest that the growth of economic output has the greatest effect on increasing CO2 emissions, and most efforts should be directed to decrease energy intensity as a way to mitigate carbon emissions. (5) Furthermore, significant reduction in emissions through energy intensity and lifestyle change is important to achieve a low-carbon economy. Specifically, given the regional disparities of energy intensity among regions, the Western region has the highest level of energy intensity followed by the Central region and Eastern region [80], and the opportunity for contributing to peak emissions through decreasing energy intensity is distributed unequally across China. Thus, designing emission mitigation policies requires considering regional inequalities of energy intensity.
Overall, the path to achieve China’s carbon emission peak should emphasize a qualified urbanization process, rational industrial structure upgrading, energy mix improvement and energy-saving technology promotion. All these comprehensive measures should be coordinated, in addition, regional differences and spatial spillover effects are to be fully considered. If well integrated, these measures can fulfill both new normal economic development and desired carbon emission peaking optimal target at the same time [55,81].
Author Contributions
F.D. conceived the idea of this study; F.D., Y.H. and B.Y wrote the paper.
Funding
This work was supported by the National Natural Science Foundation of China (Grant No. 71573254), Jiangsu Education Science Project (Grant No. B-b/2015/01/027), and Jiangsu Funds for Social Science (Grant No.17JDB004).
Conflicts of Interest
The authors declare no conflict of interest.
References
- Dong, F.; Long, R.; Yu, B.; Wang, Y.; Li, J.; Wang, Y.; Dai, Y.; Yang, Q.; Chen, H. How can China allocate CO2 reduction targets at the provincial level considering both equity and efficiency? Resour. Conserv. Recycl. 2018, 130, 31–43. [Google Scholar] [CrossRef]
- Intergovernmental Panel on Climate Change (IPCC). Fifth Assessment Report (AR5); United Nations: New York, NY, USA, 2013. [Google Scholar]
- Davis, W.J.; Taylor, P.J.; Davis, W.B. The Antarctic Centennial Oscillation: A Natural Paleoclimate Cycle in the Southern Hemisphere That Influences Global Temperature. Climate 2018, 6, 3. [Google Scholar] [CrossRef]
- Davis, W.J. The Relationship between Atmospheric Carbon Dioxide Concentration and Global Temperature for the Last 425 Million Years. Climate 2017, 5, 76. [Google Scholar] [CrossRef]
- Xu, B.; Lin, B. Assessing the development of China’s new energy industry. Energy Econ. 2018, 70, 116–131. [Google Scholar] [CrossRef]
- Ma, D.; Chen, W. Analysis of China’s 2030 Carbon Emission Peak Level and Peak Path. Chin. Popul. Resour. Environ. 2016, 26, 1–4. (In Chinese) [Google Scholar]
- Dong, F.; Yu, B.; Hadachin, T.; Dai, Y.; Wang, Y.; Zhang, S.; Long, R. Drivers of carbon emission intensity change in China. Resour. Conserv. Recycl. 2018, 129, 187–201. [Google Scholar] [CrossRef]
- Ouyang, X.; Lin, B. Carbon dioxide (CO2) emissions during urbanization: A comparative study between China and Japan. J. Clean. Prod. 2017, 143, 356–368. [Google Scholar] [CrossRef]
- Xu, L.; Du, J.; Wang, W. Evolutionary game analysis on rural water environmental governance. Chin. Popul. Res. Environ. 2017, 5, 17–26. (In Chinese) [Google Scholar]
- Lin, B.; Li, J. Transfromation of China energy structure under environmental governance constraints: A peak value analysis of coal and carbon dioxide. Soc. Sci. Chin. 2014, 9, 84–107. (In Chinese) [Google Scholar]
- Cheng, Q. The research about Energy Structural Optimization in China under the Carbon Emission Peak Target. Master’s Thesis, Graduate School of Chinese Academy of Social Sciences, Beijing, China, 2015. (In Chinese). [Google Scholar]
- He, J. An analysis of China’s CO2 emission peaking target and pathways. Adv. Clim. Chang. Res. 2014, 5, 155–161. [Google Scholar] [CrossRef]
- Zhou, X.; Zhang, M.; Zhou, M.; Zhou, M. A comparative study on decoupling relationship and influence factors between China’s regional economic development and industrial energy–related carbon emissions. J. Clean. Prod. 2016, 142, 783–800. [Google Scholar] [CrossRef]
- Chai, Q.M.; Xu, H. Modeling an emissions peak in China around 2030: Synergies or trade-offs between economy, energy and climate security. Adv. Clim. Chang. Res. 2014, 5, 169–180. [Google Scholar] [CrossRef]
- Wang, Q.; Chiu, Y.H.; Chiu, C.R. Driving factors behind carbon dioxide emissions in China: A modified production-theoretical decomposition analysis. Energy Econ. 2015, 51, 252–260. [Google Scholar] [CrossRef]
- Wang, J.; Zhao, T.; Wang, Y. How to achieve the 2020 and 2030 emissions targets of China: Evidence from high, mid and low energy-consumption industrial sub-sectors. Atmos. Environ. 2016, 145, 280–292. [Google Scholar] [CrossRef]
- Wei, C.; Ni, J.; Du, L. Regional allocation of carbon dioxide abatement in China. Chin. Econ. Rev. 2012, 23, 552–565. (In Chinese) [Google Scholar] [CrossRef]
- British Petroleum (BP). Energy Outlook 2012; British Petroleum: London, UK, 2012. [Google Scholar]
- Rhodes, C.J. The 2015 Paris climate change conference: COP21. Sci. Prog. 2016, 99, 97–104. [Google Scholar] [CrossRef] [PubMed]
- International Energy Agency (IEA). Energy and Climate Change, World Energy Outlook Special Report; IEA: Paris, France, 2015. [Google Scholar]
- Liang, L.; Wu, W.; Lal, R.; Guo, Y. Structural change and carbon emission of rural household energy consumption in Huantai, northern China. Renew. Sustain. Energy Rev. 2013, 28, 767–776. [Google Scholar] [CrossRef]
- International Monetary Fund (IMF). World Economic Outlook; IMF: Washington, DC, USA, 2016. [Google Scholar]
- Energy Information Administration (EIA). International Energy Outlook; Energy Information Administration (EIA): Washington, DC, USA, 2016.
- British Petroleum (BP). Energy Outlook 2017; British Petroleum: London, UK; U.S. Energy Information Administration (EIA): Washington, DC, USA, 2017.
- Yang, D.; Feng, L. Examining the effects of urbanization and industrialization on carbon dioxide emission: Evidence from China’s provincial regions. Energy 2017, 125, 533–542. [Google Scholar]
- Li, T.; Fu, Q. Study on China’s Carbon Dioxide Emissions Efficiency. Stat. Res. 2011, 7, 63–70. (In Chinese) [Google Scholar]
- Niu, S.; Liu, Y.; Ding, Y.; Qu, W. China’s energy systems transformation and emissions peak. Renew. Sustain. Energy Rev. 2016, 58, 782–795. [Google Scholar] [CrossRef]
- Mi, Z.; Wei, Y.M.; Wang, B.; Meng, J.; Liu, Z.; Shan, Y.; Liu, J.; Guan, D. Socioeconomic impact assessment of China’s CO2 emissions peak prior to 2030. J. Clean. Prod. 2017, 142, 2227–2236. [Google Scholar] [CrossRef]
- Bi, C. Scheme and Policies for Peaking Energy Carbon Emissions in China. Chin. Popul. Res. Environ. 2015, 25, 20–27. (In Chinese) [Google Scholar]
- Li, Y.; Sun, L.; Feng, T.; Zhu, C. How to reduce energy intensity in China: A regional comparison perspective. Energy Policy 2013, 61, 513–522. [Google Scholar] [CrossRef]
- Liu, Y.; Cai, S.; Zhang, Q. The Economic Impact of China’s Carbon Dioxide Emissions to Peak in 2025, 2030 and 2040—Based on the Dynamic GTAP-E Model. Manag. Rev. 2014, 12, 3–9. (In Chinese) [Google Scholar]
- Qu, S.; Guo, C. Forecast of China’s carbon emissions based on STIRPAT model. Chin. Popul. Res. Environ. 2010, 20, 10–15. (In Chinese) [Google Scholar]
- Du, K.; Xie, C.; Ouyang, X. A comparison of carbon dioxide (CO2) emission trends among provinces in China. Renew. Sustain. Energy Rev. 2017, 73, 19–25. [Google Scholar] [CrossRef]
- Huang, G.; Ouyang, X.; Yao, X. Dynamics of China’s regional carbon emissions under gradient economic development mode. Ecol. Indic. 2015, 51, 197–204. [Google Scholar] [CrossRef]
- Du, L.; Wei, C.; Cai, S. Economic development and carbon dioxide emissions in China: Provincial panel data analysis. Chin. Econ. Rev. 2012, 23, 371–384. (In Chinese) [Google Scholar] [CrossRef]
- Li, A.; Zhang, A.Z.; Zhou, Y.X.; Yao, X.Z. Decomposition analysis of factors affecting carbon dioxide emissions across provinces in China. J. Clean. Prod. 2017, 141, 1428–1444. [Google Scholar] [CrossRef]
- Shimada, K.; Tanaka, Y.; Gomi, K.; Matsuoka, Y. Developing a long-term local society design methodology towards a low-carbon economy: An application to Shiga Prefecture in Japan. Energy Policy 2007, 35, 4688–4703. [Google Scholar] [CrossRef]
- Li, J.; Chen, W. Study of driven factors of provincial CO2 emission in China based on directional distance function approach. J. Hefei Univ. Technol. 2012, 35, 381–386. (In Chinese) [Google Scholar]
- Gao, C.; Liu, Y.; Jin, J.; Wei, T.; Zhang, J.; Zhu, L. Driving forces in energy-related carbon dioxide emissions in east and south coastal China: Commonality and variations. J. Clean. Prod. 2016, 135, 240–250. [Google Scholar] [CrossRef]
- Liu, Z.; Liang, S.; Geng, Y.; Xue, B.; Xi, F.; Pan, Y.; Zhang, T.; Fujita, T. Features, trajectories and driving forces for energy-related GHG emissions from Chinese mega cites: The case of Beijing, Tianjin, Shanghai and Chongqing. Energy. 2012, 37, 245–254. [Google Scholar] [CrossRef]
- Yang, W.; Li, T.; Cao, X. Examining the impacts of socio-economic factors, urban form and transportation development on CO2 emissions from transportation in China: A panel data analysis of China’s provinces. Habitat Int. 2015, 49, 212–220. [Google Scholar] [CrossRef]
- Jia, X. Strategic Research of Tianjin Industrial Development within the Carbon Dioxide Emission Peak. Master’s Thesis, Tianjin University of Science &Technology, Tianjin, China, 2014. (In Chinese). [Google Scholar]
- Luan, S.S. The Prediction on Carbon Emissions and the Path Analysis on the Reduction of Carbon Emissions of Shandong Province. Master’s Thesis, Ocean University of China, Qindao, China, 2012. (In Chinese). [Google Scholar]
- Zhao, R.Q.; Liu, W.; Liu, Y.; Ding, M.L.; Zhang, Z.P.; Wang, J. Prediction of carbon emission peak value of Henan province based on carbon budget estimation. Bull. Soil Water Conserv. 2016, 36, 78–83, 89. (In Chinese) [Google Scholar]
- Dong, F.; Li, X.; Long, R.; Liu, X. Regional carbon emission performance in China according to a stochastic frontier model. Renew. Sustain. Energy Rev. 2013, 28, 525–530. [Google Scholar] [CrossRef]
- Ma, Z. Study on Peak Prediction of Carbon Emission and Control Strategies in Jilin Province. Ph.D. Thesis, Jilin University, Jilin, China, 2014. (In Chinese). [Google Scholar]
- Wang, S.; Fang, C.; Guan, X.; Pang, B.; Ma, H. Urbanisation, energy consumption, and carbon dioxide emissions in China: A panel data analysis of China’s provinces. Appl. Energy 2014, 136, 738–749. [Google Scholar] [CrossRef]
- Liu, L.; Wang, S.; Wang, K.; Zhang, R.; Tang, X. LMDI decomposition analysis of industry carbon emissions in Henan Province, China: Comparison between different 5-year plans. Nat. Hazards 2016, 80, 997–1014. [Google Scholar] [CrossRef]
- Xu, S.C.; Han, H.M.; Zhang, W.W.; Zhang, Q.Q.; Long, R.Y.; Chen, H.; He, Z.X. Analysis of regional contributions to the national carbon intensity in China in different Five-Year Plan periods. J. Clean. Prod. 2017, 145, 209–220. [Google Scholar] [CrossRef]
- Guo, Z.L. Study on Peak Prediction of Carbon Emission and Control Strategies in Gansu Province. Master’s Thesis, Lanzhou University, Lanzhou, China, 2015. [Google Scholar]
- Deng, X.; Sun, H. Forecast of the Northwest Five Provinces’ Carbon Emissions Based on STIRPAT Model. Ecol. Econ. 2016, 32, 36–41. (In Chinese) [Google Scholar]
- Feng, Z.X.; Wang, A.J. Carbon emission factor decomposition and carbon peak prediction in Shaanxi Province. J. Southwest. Univ. Nat. (Hum. Soc. Sci.) 2016, 8, 112–119. (In Chinese) [Google Scholar]
- Liang, M.; Wang, Y.; Wang, G. China’s Low-carbon-city Development with ETS: Forecast on the Energy Consumption and Carbon Emission of Chongqing. Energy Procedia 2014, 61, 2596–2599. [Google Scholar] [CrossRef]
- Feng, C.; Zhang, H.; Huang, J.B. The approach to realizing the potential of emissions reduction in China: An implication from data envelopment analysis. Renew. Sustain. Energy Rev. 2017, 71, 859–872. [Google Scholar] [CrossRef]
- Long, R.; Shao, T.; Chen, H. Spatial econometric analysis of China’s province-level industrial carbon productivity and its influencing factors. Appl. Energy 2016, 166, 210–219. [Google Scholar] [CrossRef]
- Wang, M.; Feng, C. Decomposition of energy-related CO2 emissions in China: An empirical analysis based on provincial panel data of three sectors. Appl. Energy 2017, 190, 772–787. [Google Scholar] [CrossRef]
- Xu, R.; Xu, L.; Xu, B. Assessing CO2 emissions in China’s iron and steel industry: Evidence from quantile regression approach. J. Clean. Prod. 2017, 152, 259–270. [Google Scholar] [CrossRef]
- Xu, B.; Lin, B. Regional differences in the CO2 emissions of China’s iron and steel industry: Regional heterogeneity. Energy Policy 2016, 88, 422–434. [Google Scholar] [CrossRef]
- Ma, D.; Chen, W.; Yin, X.; Wang, L. Quantifying the co-benefits of decarbonisation in China’s steel sector: An integrated assessment approach. Appl. Energy 2016, 162, 1225–1237. [Google Scholar] [CrossRef]
- China Shipbuilding Industry Corporation (CSIC). Power Industry Is the Main Force of Carbon Emission Reduction; Chinese State Information Center: Beijing, China, 2016. (In Chinese)
- Wang, Z.X.; Zhang, J.J.; Li, P.; Fan, Y.; Shi, L.N. Estimate of China’s energy carbon emission peak and analysis on electric power carbon emissions. Adv. Clim. Chang. Res. 2014, 5, 181–188. [Google Scholar] [CrossRef]
- Yang, L.; Lin, B. Carbon dioxide-emission in China’s power industry: Evidence and policy implications. Renew. Sustain. Energy Rev. 2016, 60, 258–267. [Google Scholar] [CrossRef]
- Cheng, L.; Xing, L. Analysis of Requirement and Impact of Power Development under the Peak Carbon Emissions in 2030. Elec Power 2016, 49, 174–177. (In Chinese) [Google Scholar]
- Zhang, X.F.; Zhang, B. The Peak Value of China’s Carbon Emissions and Its Far-Reaching Impact on the Power Industry. Available online: http://news.bjx.com.cn/html/20160411/723575.shtml (accessed on 5 July 2018). (In Chinese).
- China Industry Report Research Center (CIRRC). Cement Sewage Standard Is Tightening and the Substandard Enterprises Should Be Forced Out; CIRRC: Beijing, China, 2013. (In Chinese) [Google Scholar]
- Reduce Carbon Emission. Cement Industry in the Action. Available online: http://www.cbeex.com.cn/article//zxdt/hbxw/201301/20130100043689.shtml (accessed on 6 July 2018). (In Chinese).
- Lin, B.; Zhang, Z. Carbon emissions in China’s cement industry: A sector and policy analysis. Renew. Sustain. Energy Rev. 2016, 58, 1387–1394. [Google Scholar] [CrossRef]
- Gao, T.; Shen, L.; Shen, M.; Liu, L.; Chen, F.; Gao, L. Evolution and projection of CO2 emissions for China’s cement industry from 1980 to 2020. Renew. Sustain. Energy Rev. 2017, 74, 522–537. [Google Scholar] [CrossRef]
- Gao, M.; Song, H.Y. Dynamic Changes and Spatial Agglomeration Analysis of the Chinese Agricultural Carbon Emissions Performance. E. Geo. 2015, 35, 142–148. (In Chinese) [Google Scholar]
- China Council for International (CCFI). The People’s Republic of China Initial National Communication on Climate Change; CCFI: Beijing, China, 2004. [Google Scholar]
- Bao, Z. Empirical Study on Regional Disparity and Its Influencing Factors of Agricultural Carbon Emissions Distribution in China. Master’s Thesis, Shandong University of Finance and Economics, Jinan, China, 2014. (In Chinese). [Google Scholar]
- Xu, B.; Lin, B. Factors affecting CO2 emissions in China’s agriculture sector: Evidence from geographically weighted regression model. Energy Policy 2017, 104, 404–414. [Google Scholar] [CrossRef]
- Zhang, J. Evaluating regional low-carbon tourism strategies using the fuzzy Delphi-analytic network process approach. J. Clean. Prod. 2017, 141, 409–419. [Google Scholar] [CrossRef]
- Tao, Y. The Measurement and Factors Decomposition for Carbon Emission of Regional Tourism—Taking Jiangsu Province as Example. Ph.D. Thesis, Nanjing Normal University, Nanjing, China, 2015. (In Chinese). [Google Scholar]
- Lin, B.; Xie, X. CO2 emissions of China’s food industry: An input–output approach. J. Clean. Prod. 2015, 112, 1410–1421. [Google Scholar] [CrossRef]
- Lin, B.; Lei, X. Carbon emissions reduction in China’s food industry. Energy Policy 2015, 86, 483–492. [Google Scholar] [CrossRef]
- Yang, C.; Schneider, S.H. Global carbon dioxide emissions scenarios: Sensitivity to social and technological factors in three regions. Mitig. Adapt. Strateg. Glob. Chang. 1997, 2, 373–404. [Google Scholar] [CrossRef]
- Cutlip, L.; Fath, B.D. Relationship between carbon emissions and economic development: Case study of six countries. Environ. Dev. Sustain. 2012, 14, 433–453. [Google Scholar] [CrossRef]
- Li, B. District Technological Innovation Capacity and Carbon Emission Per Capita of China—An Empirical Analysis Based on Spatial Econometric Model of Provincial Panel Data. Soft Sci. 2013, 27, 26–30. (In Chinese) [Google Scholar]
- Dong, F.; Yu, B.; Zhang, J. What Contributes to Regional Disparities of Energy Consumption in China? Evidence from Quantile Regression-Shapley Decomposition Approach. Sustainability 2018, 10, 1806. [Google Scholar] [CrossRef]
- Wang, Y.; Zou, L.L. The economic impact of emission peaking control policies and China’s sustainable development. Adv. Clim. Chang. Res. 2014, 5, 162–168. [Google Scholar] [CrossRef]
- Wang, K.; Zhang, X.; Yu, X.; Wei, Y.M.; Wang, B. Emissions trading and abatement cost savings: An estimation of China’s thermal power industry. Renew. Sustain. Energy Rev. 2016, 65, 1005–1017. [Google Scholar] [CrossRef]
- Qi, T.; Winchester, N.; Karplus, V.J.; Zhang, X. Will economic restructuring in China reduce trade-embodied CO2 emissions? Energy Econ. 2014, 42, 204–212. [Google Scholar] [CrossRef]
- Wang, S.; Liu, X.; Zhou, C.; Hu, J.; Ou, J. Examining the impacts of socioeconomic factors, urban form, and transportation networks on CO2 emissions in China’s megacities. Appl. Energy 2017, 185, 189–200. [Google Scholar] [CrossRef]
- Chen, L.; Yang, Z. A spatio-temporal decomposition analysis of energy-related CO2 emissions growth in China. J. Clean. Prod. 2015, 103, 49–60. [Google Scholar] [CrossRef]
- Zhang, C.; Tan, Z. The relationships between population factors and China’s carbon emissions: Does population aging matter? Renew. Sustain. Energy Rev. 2016, 65, 1018–1025. [Google Scholar] [CrossRef]
- National Bureau of Statistics of China (NBSC). China City Statistical Yearbook; NBSC: Beijing, China, 2017.
- Fan, J.L.; Yu, H.; Wei, Y.M. Residential energy-related carbon emissions in urban and rural China during 1996–2012: From the perspective of five end-use activities. Energy Build. 2015, 96, 201–209. [Google Scholar] [CrossRef]
- Liu, Z.; Li, L.; Zhang, Y.J. Investigating the CO2 emission differences among China’s transport sectors and their influencing factors. Nat. Hazards 2015, 77, 1323–1343. [Google Scholar] [CrossRef]
- Zhao, X.; Burnett, J.W.; Lacombe, D.J. Province-level convergence of China’s carbon dioxide emissions. Appl. Energy 2015, 150, 286–295. [Google Scholar] [CrossRef]
- Zha, D.; Zhou, D.; Peng, Z. Driving forces of residential CO2 emissions in urban and rural China: An index decomposition analysis. Energy Policy 2010, 38, 3377–3383. [Google Scholar]
- Wang, Z.; Yang, L. Indirect carbon emissions in household consumption: Evidence from the urban and rural area in China. J. Clean. Prod. 2014, 78, 94–103. [Google Scholar] [CrossRef]
- Wang, Y.; Zhao, T. Impacts of urbanization-related factors on CO2 emissions: Evidence from China’s three regions with varied urbanization levels. Atmos. Pollut. Res. 2018, 9, 15–26. [Google Scholar] [CrossRef]
- Han, X.; Jiao, J.; Liu, L.; Li, L. China’s energy demand and carbon dioxide emissions: Do carbon emission reduction paths matter? Nat. Hazards 2017, 86, 1333–1345. [Google Scholar] [CrossRef]
- Gillingham, K.; Rapson, D.; Wagner, G. The Rebound Effect and Energy Efficiency Policy. Rev. Environ. Econ. Policy 2016, 10, 68–88. [Google Scholar] [CrossRef]
- Greening, L.A.; Greene, D.L.; Difiglio, C. Energy efficiency and consumption—The rebound effect—A survey. Energy Policy 2000, 28, 389–401. [Google Scholar] [CrossRef]
- Liddle, B. Electricity intensity convergence in IEA/OECD countries: Aggregate and sectoral analysis. Energy Policy 2009, 37, 1470–1478. [Google Scholar] [CrossRef]
- Niu, H.; Hu, J. Empirical Research on Relationship between FDI and CO2 Emissions in China. J. Int. Trade 2011, 5, 100–109. (In Chinese) [Google Scholar]
- Liu, W.D.; Xu, X.M.; Niu, D.X. Research on the Impact of Technology Import and Technology Innovation on the Peak of Carbon Emissions in China. Techno. Econ. Manag. Res. 2016, 9, 3–9. (In Chinese) [Google Scholar]
- Wang, Z.; Liu, F. The research about the impact of FDI on China’s carbon emission. Econ. Res. Guid. 2013, 119, 3–4. [Google Scholar]
- Perkins, R.; Neumayer, E. Transnational linkages and the spillover of environment-efficiency into developing countries. Glob. Environ. Chang. 2009, 19, 375–383. [Google Scholar] [CrossRef] [Green Version]
- Yao, Y. Research on the Effect of Foreign Direct Investment on Carbon Intensity of China. Ph.D. Thesis, Nanjing University of Aeronautics and Astronautics, Nanjing, China, 2012. (In Chinese). [Google Scholar]
- Zhao, X.; Burnett, J.W.; Fletcher, J.J. Spatial analysis of China province-level CO2 emission intensity. Renew. Sustain. Energy Rev. 2014, 33, 1–10. [Google Scholar] [CrossRef]
- Grimes, P.; Kentor, J. Exporting the Greenhouse: Foreign Capital Penetration and CO2 Emissions 1980–1996. J. World Syst. Res. 2003, 9, 261. [Google Scholar] [CrossRef]
- Yi, Y.C.; Guan, W.J.; Gao, Y.F. Empirical Research on the Relationship between FDI and CO2 Emissions in China—The Empirical Research Based on ARDL. J. Guizhou Univ. Financ. Econ. 2015, 33, 58–65. (In Chinese) [Google Scholar]
- Lin, J. FDI and China’s CO2 Emissions: A Multi-perspective Panel Data Analysis. Ph.D. Thesis, East China Normal University, Shanghai, China, 2014. (In Chinese). [Google Scholar]
- Nian, J. Underlying Factors for Transport Sector CO2 Emissions STIPPAT Model Basing on Regional Panel Date in China; Xiamen University: Xiamen, China, 2014. (In Chinese) [Google Scholar]
- Shen, J.; Sun, H.; Cheng, J. Energy Consumption and Influence Factors of Urban Residents in China. J. Bejing Inst. Technol. (Soc. Sci. Ed.) 2016, 1, 45–53. (In Chinese) [Google Scholar]
- Huo, H.; Zhang, Q.; He, K.; Yao, Z.; Wang, M. Vehicle-use intensity in China: Current status and future trend. Energy Policy 2012, 43, 6–16. [Google Scholar] [CrossRef]
- Lin, B.; Benjamin, N.I. Influencing factors on carbon emissions in China transport industry. A new evidence from quantile regression analysis. J. Clean. Prod. 2017, 150, 175–187. [Google Scholar] [CrossRef]
- Zhang, Z. An Empirical Study on Carbon Emission Peak Value of China’s Air Transport Industry. Master’s Thesis, Civil Aviation University of China, Tianjin, China, 2015. (In Chinese). [Google Scholar]
- Zhang, T.; Zeng, A. Spatial Econometrics Analysis on China Transport Carbon Emissions. Urban Dev. Stud. 2013, 20, 14–20. (In Chinese) [Google Scholar]
- Dong, F.; Bian, Z.; Yu, B.; Wang, Y.; Zhang, S.; Li, J.; Su, B.; Long, R. Can land urbanization help to achieve CO2 intensity reduction target or hinder it? Evidence from China. Resour. Conserv. Recycl. 2018, 134, 206–215. [Google Scholar] [CrossRef]
- Bosetti, V.; Carraro, C.; Tavoni, M. Timing of Mitigation and Technology Availability in Achieving a Low-Carbon World. Environ. Resour. Econ. 2012, 51, 353–369. [Google Scholar] [CrossRef] [Green Version]
- Yang, M.; Yu, X. Energy efficiency to mitigate carbon emissions: Strategies of China and the USA. Mitig. Adap. Strateg. Glob. Chang. 2017, 22, 1–14. [Google Scholar] [CrossRef]
- Xu, B.; Lin, B. Assessing CO2 emissions in China’s iron and steel industry: A nonparametric additive regression approach. Renew. Sustain. Energy Rev. 2017, 72, 325–337. [Google Scholar] [CrossRef]
- Wang, Q.; Wu, S.D.; Zeng, Y.E.; Wu, B.W. Exploring the relationship between urbanization, energy consumption, and CO2 emissions in different provinces of China. Renew. Sustain. Energy Rev. 2016, 54, 1563–1579. [Google Scholar] [CrossRef]
- Carbon Dioxide Information Analysis Center (CDIAC). National CO2 Emission in China (Mainland); Carbon Dioxide Information Analysis Center (CDIAC): Oak Ridge, TN, USA, 2016. (In Chinese)
- Wang, Z.; Zhu, Y.; Zhu, Y.; Shi, Y. Energy structure change and carbon emission trends in China. Energy 2016, 115, 369–377. [Google Scholar] [CrossRef]
- Wang, Z.; Zhu, Y.; Peng, Y. Carbon emissions trends with optimal balanced economic growth of China and the USA and some abatement options for China. J. Georgr. Sci. 2013, 23, 991–1004. [Google Scholar] [CrossRef]
- Ma, Y.; Cai, X.; Zhao, P. China’s shale gas exploration and development: Understanding and practice. Pet. Explor. Dev. 2018, 4, 589–603. (In Chinese) [Google Scholar] [CrossRef]
- Park, C.; Rui, X.; Hanaoka, T.; Kanamori, Y.; Masui, T. Impact of Energy Efficient Technologies on Residential CO2 emission: A Comparison of Korea and China. Energy Procedia 2017, 111, 689–698. [Google Scholar] [CrossRef]
- Zhang, Y. Review of Economic Research on Regional Carbon Emission Reduction. Acad. Res. 2017, 1, 102–109. [Google Scholar]
Figure 1.
Chinese carbon emission trend during 1990–2012. Date resource: EIA [23].
Figure 1.
Chinese carbon emission trend during 1990–2012. Date resource: EIA [23].

Figure 2.
Industrial carbon emission efficiency in different regions. Date resource: Feng et al. [54].
Figure 2.
Industrial carbon emission efficiency in different regions. Date resource: Feng et al. [54].

Figure 3.
Potential of carbon emission reduction in different regions (Unit: 100 million tons). Date resource: Feng et al. [54].
Figure 3.
Potential of carbon emission reduction in different regions (Unit: 100 million tons). Date resource: Feng et al. [54].

Figure 4.
Changes in industry output of different peaking year (cumulative impact in 2050, %). Date resources: Liu et al. [31].
Figure 4.
Changes in industry output of different peaking year (cumulative impact in 2050, %). Date resources: Liu et al. [31].

Figure 5.
Proportion and increase ratio of coal-fired energy and non-fossil energy in power industry. Date resource: Zhang and Zhang [64].
Figure 5.
Proportion and increase ratio of coal-fired energy and non-fossil energy in power industry. Date resource: Zhang and Zhang [64].

Figure 6.
Economic effect on carbon emissions in national wide. Date resource: Chen and Yang [85].
Figure 6.
Economic effect on carbon emissions in national wide. Date resource: Chen and Yang [85].

Figure 7.
Urbanization effect on carbon emissions in national wide. Date resource: Yang and Feng [25].
Figure 7.
Urbanization effect on carbon emissions in national wide. Date resource: Yang and Feng [25].

Figure 8.
Energy structural change at different scenarios. Data resource: Liu et al. [31].
Figure 8.
Energy structural change at different scenarios. Data resource: Liu et al. [31].

Figure 9.
Energy-related carbon emissions in national wide. Date resource: Chen and Yang [85].
Figure 9.
Energy-related carbon emissions in national wide. Date resource: Chen and Yang [85].

Figure 10.
Reduction technology effect on carbon emissions in national wide. Date resource: Li et al. [36].
Figure 10.
Reduction technology effect on carbon emissions in national wide. Date resource: Li et al. [36].

Figure 11.
World energy-related carbon emission trend (billion metric tons). Date resource: EIA [23].
Figure 11.
World energy-related carbon emission trend (billion metric tons). Date resource: EIA [23].

Figure 12.
Total carbon emission peak in typical countries and regions. Date resources: Chai and Xu [14].
Figure 12.
Total carbon emission peak in typical countries and regions. Date resources: Chai and Xu [14].

Figure 13.
Per capita carbon emission peak in typical countries and regions. Date resources: Chai and Xu [14].
Figure 13.
Per capita carbon emission peak in typical countries and regions. Date resources: Chai and Xu [14].

Figure 14.
Main resources of emissions from fossil fuels in China (in thousand metric tons). Date resource: CDIAC [118].
Figure 14.
Main resources of emissions from fossil fuels in China (in thousand metric tons). Date resource: CDIAC [118].

Figure 15.
Main resources of emissions from fossil fuels in the world (in billion metric tons). Date resource: EIA [23].
Figure 15.
Main resources of emissions from fossil fuels in the world (in billion metric tons). Date resource: EIA [23].


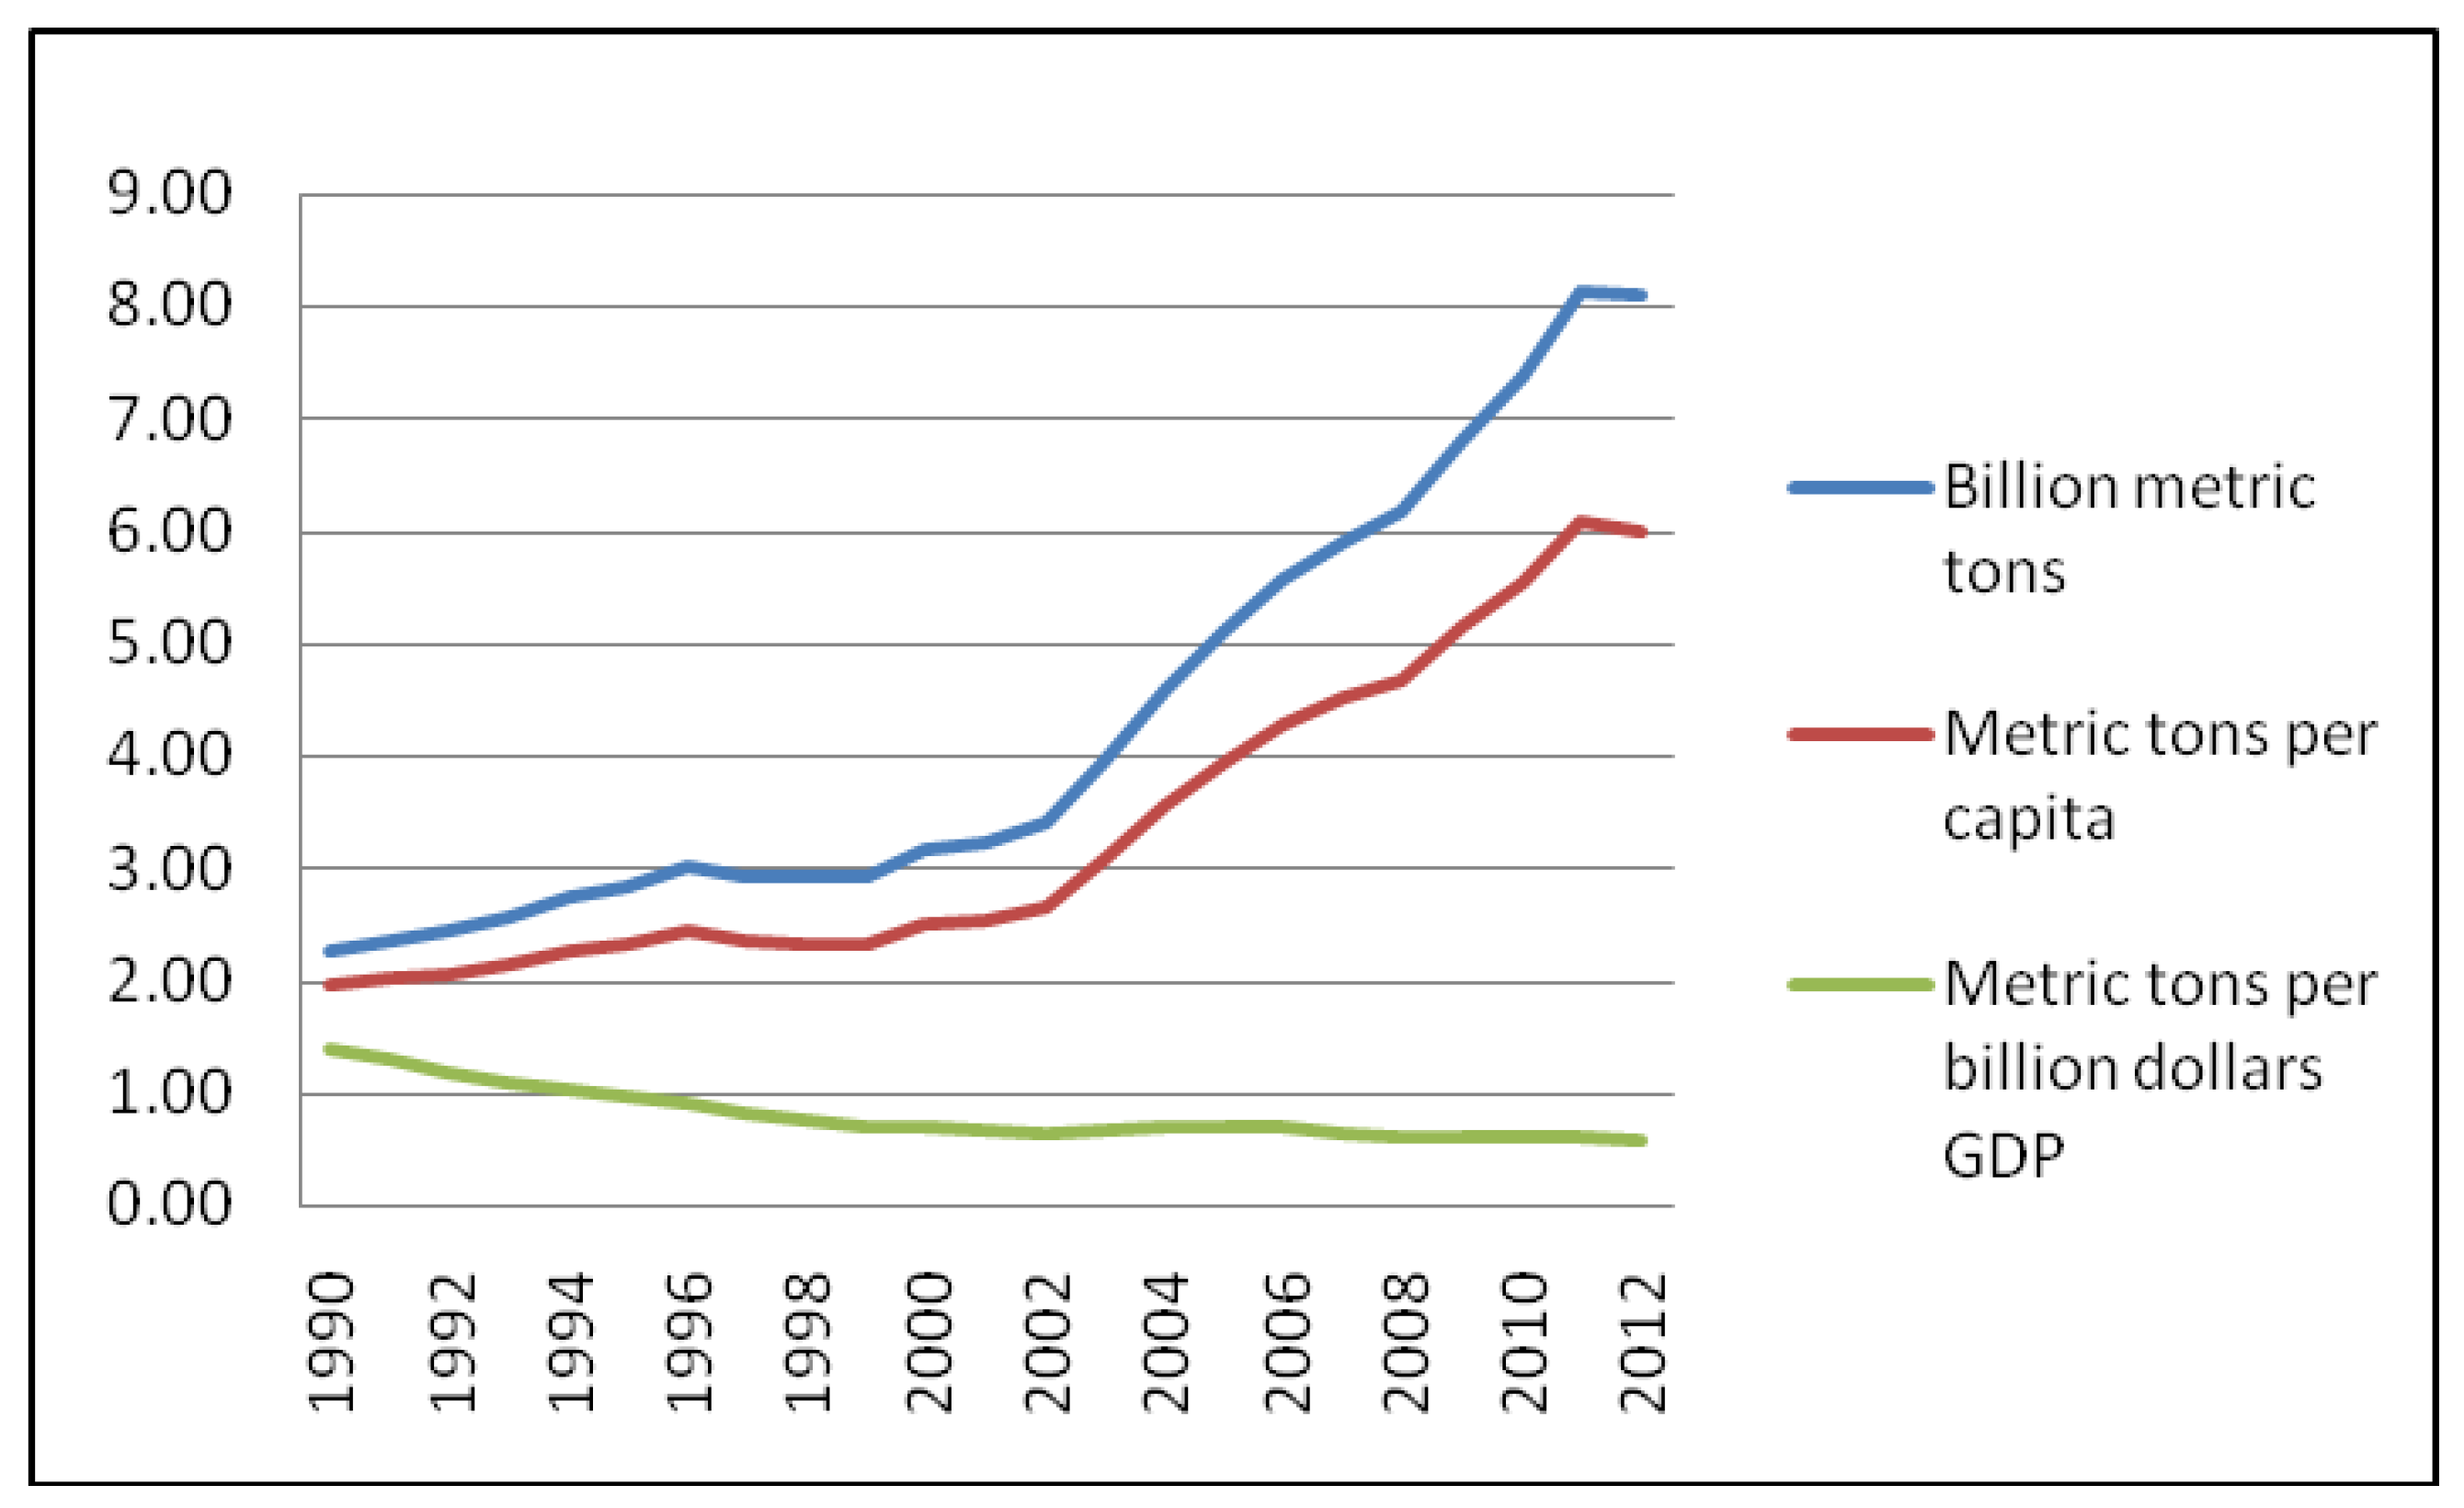
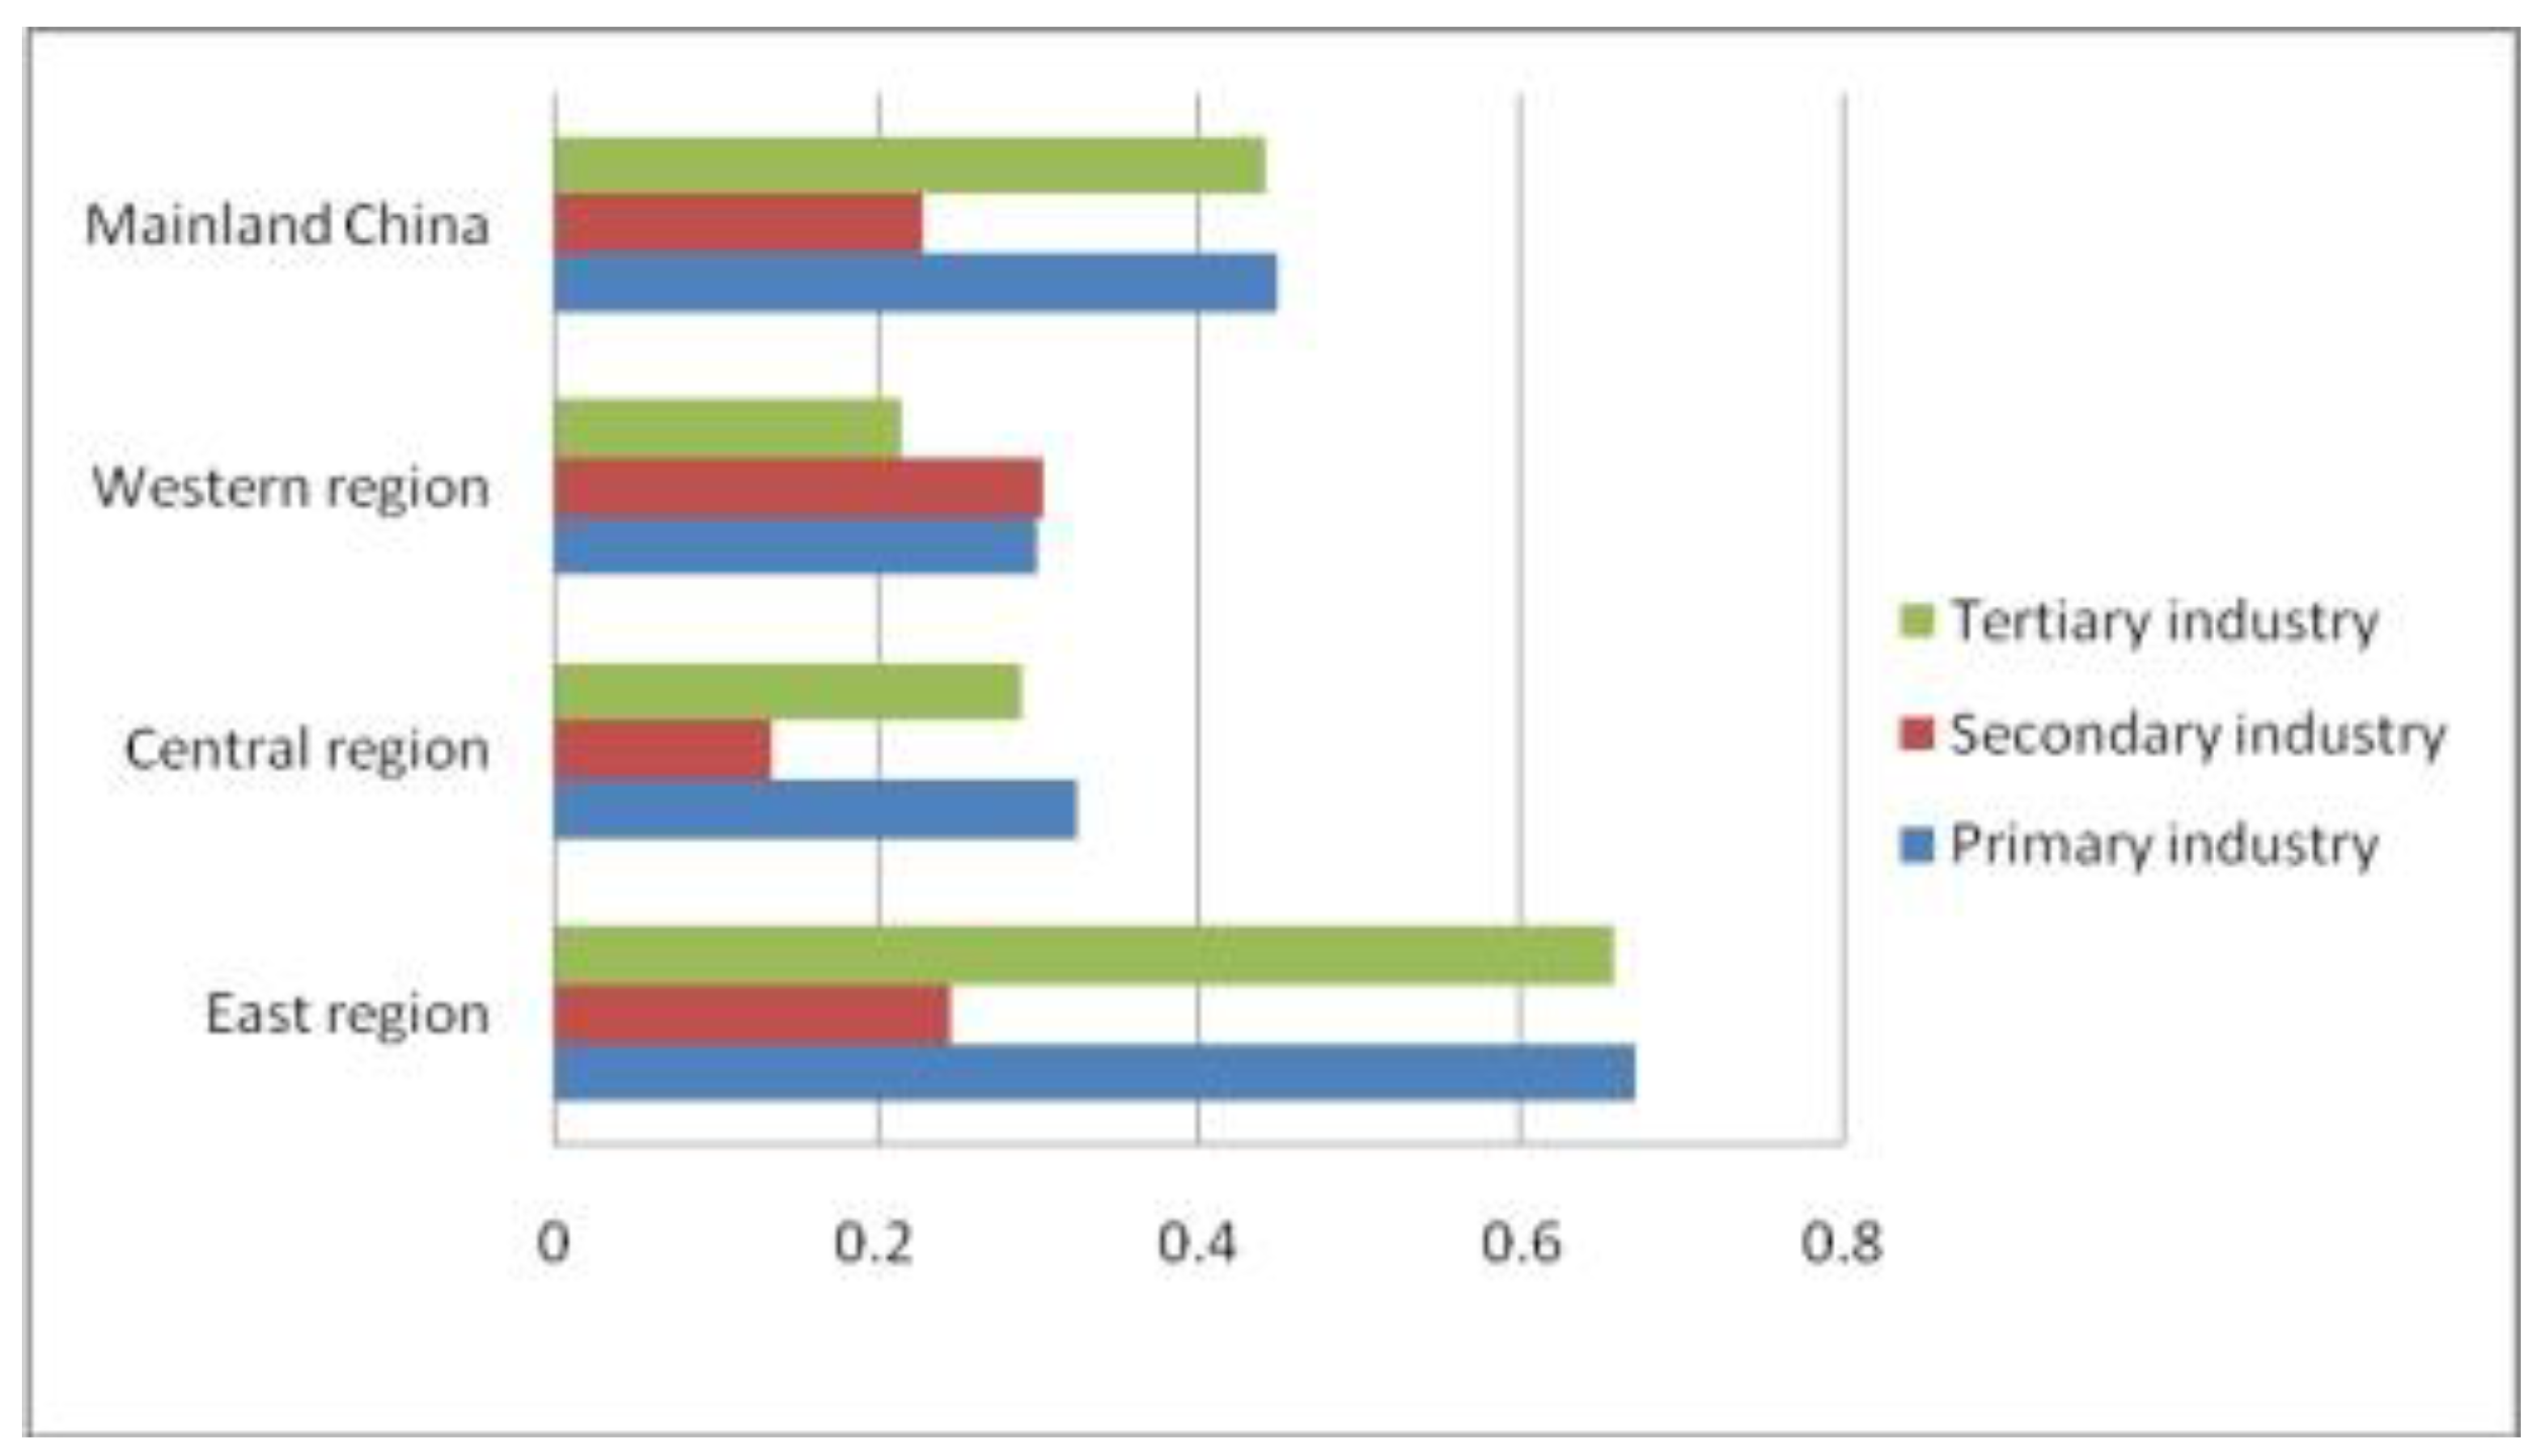
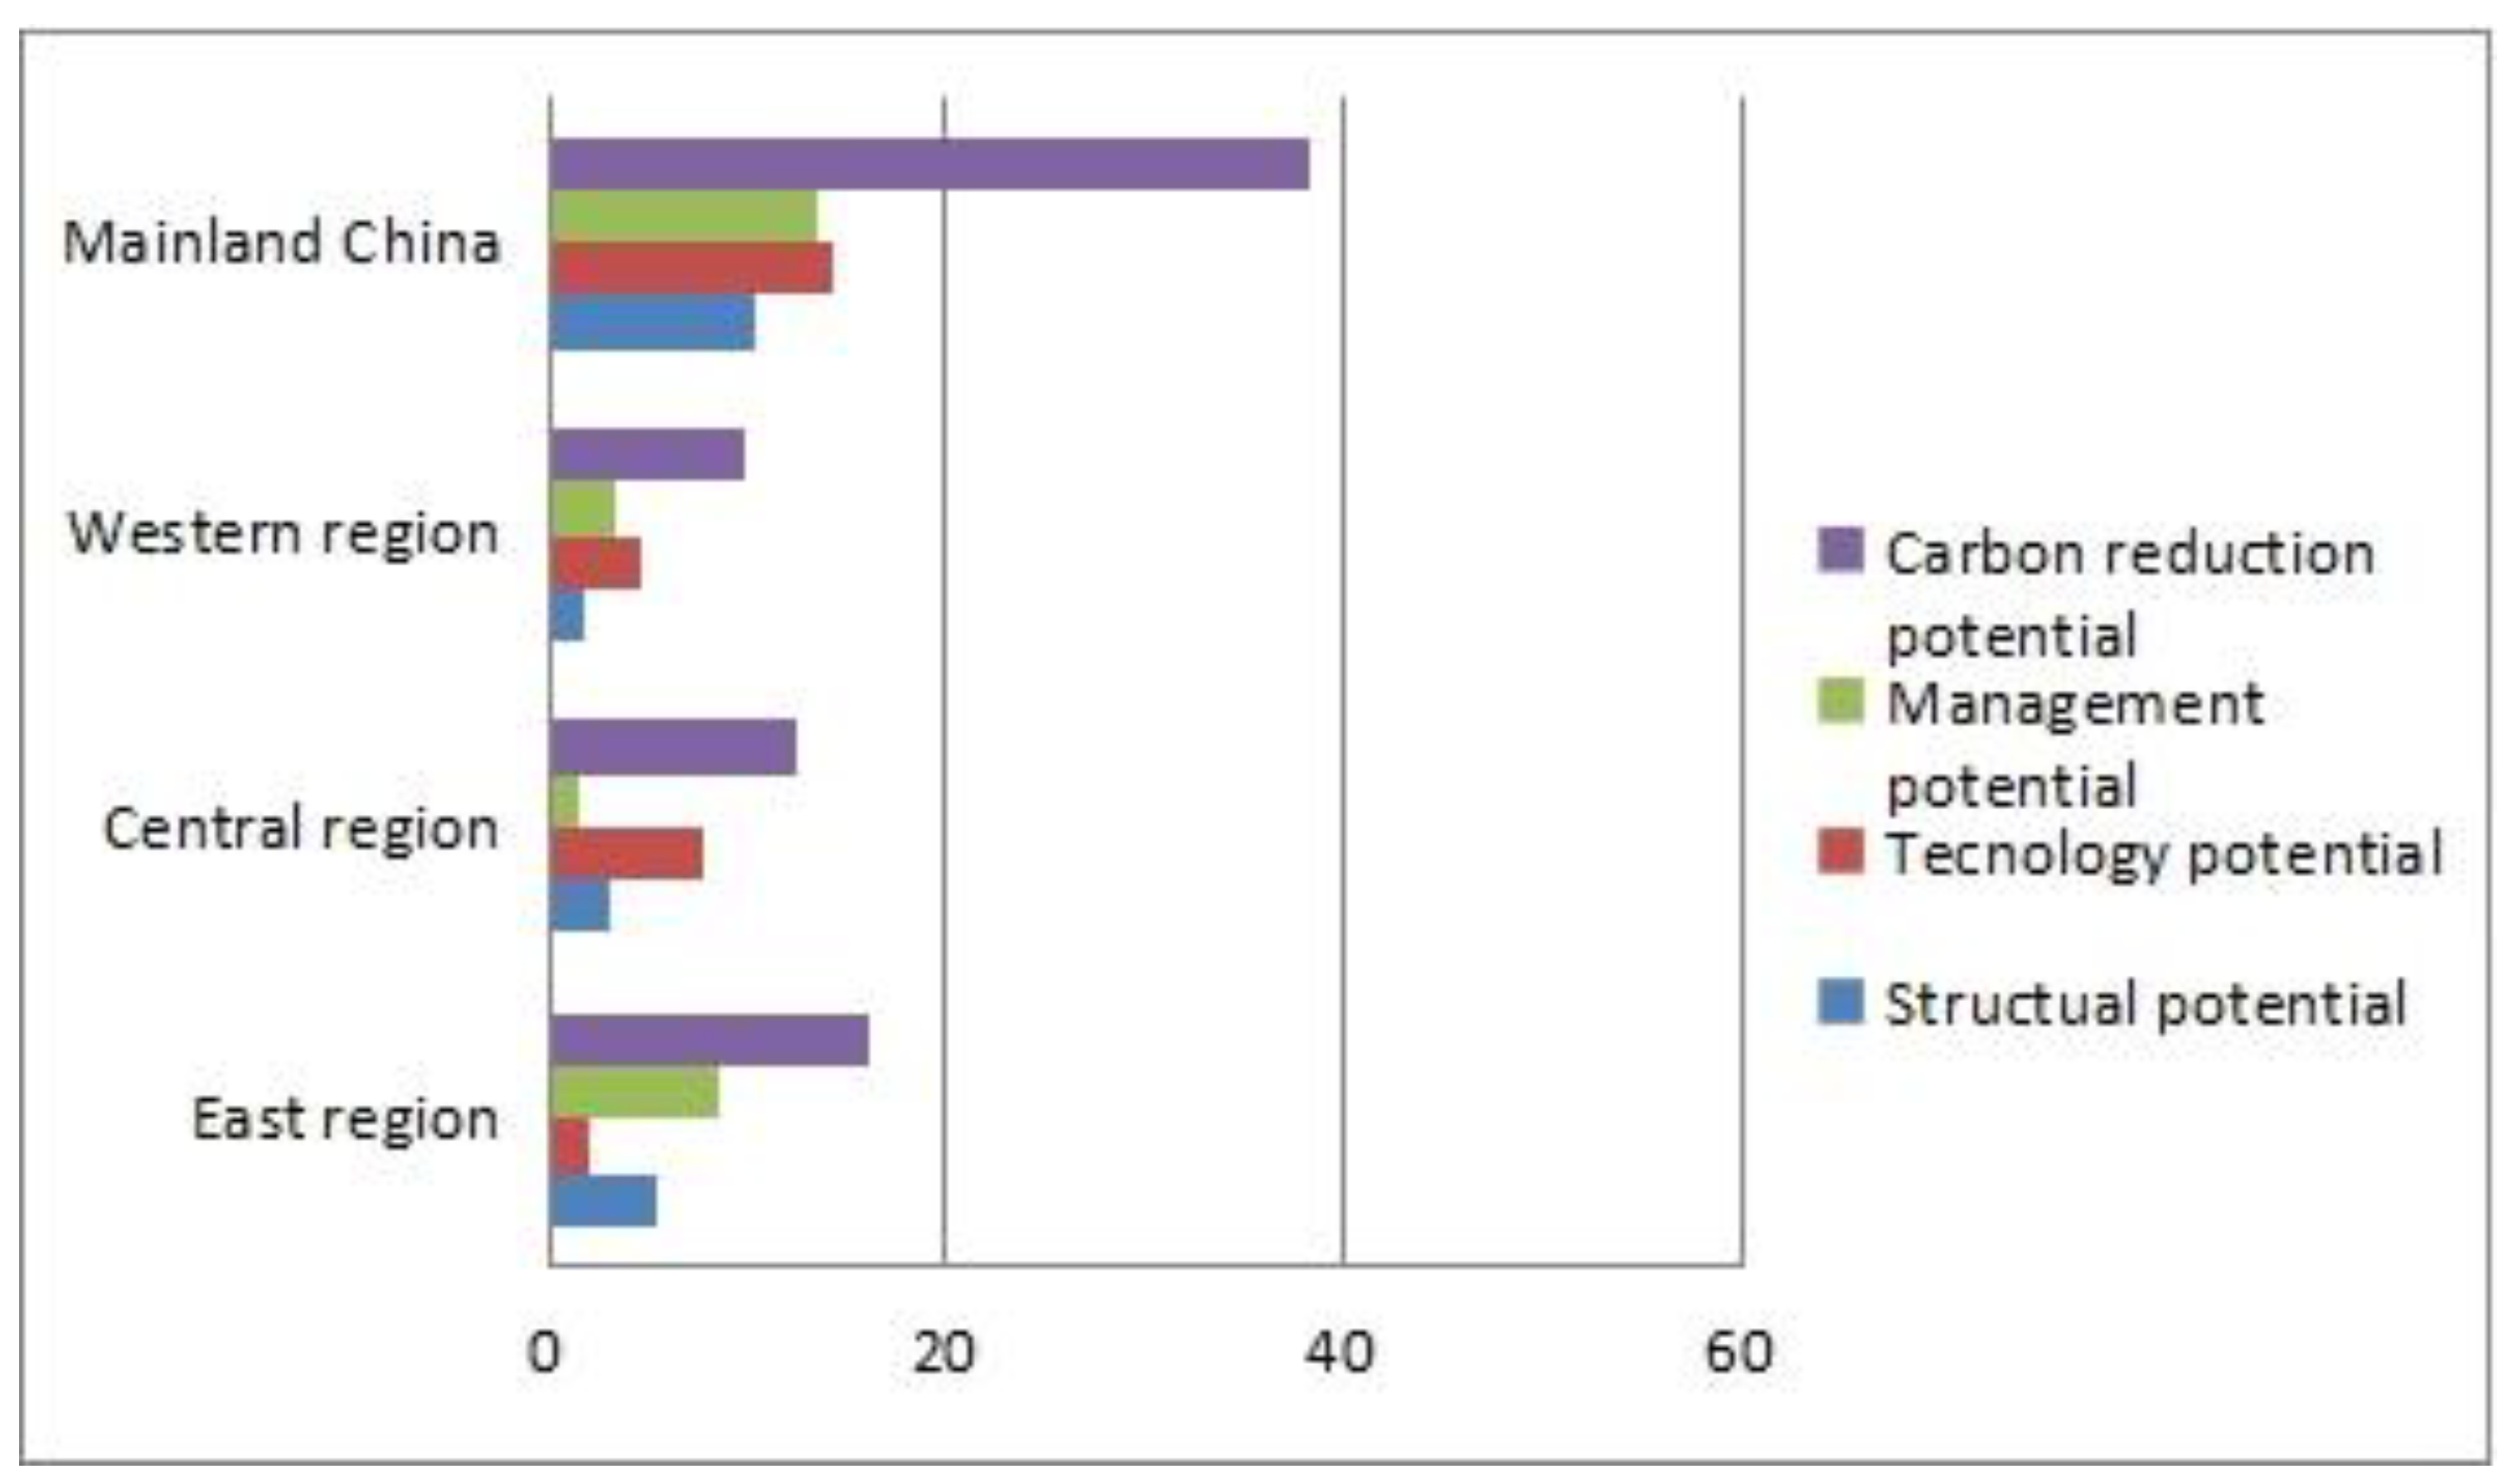
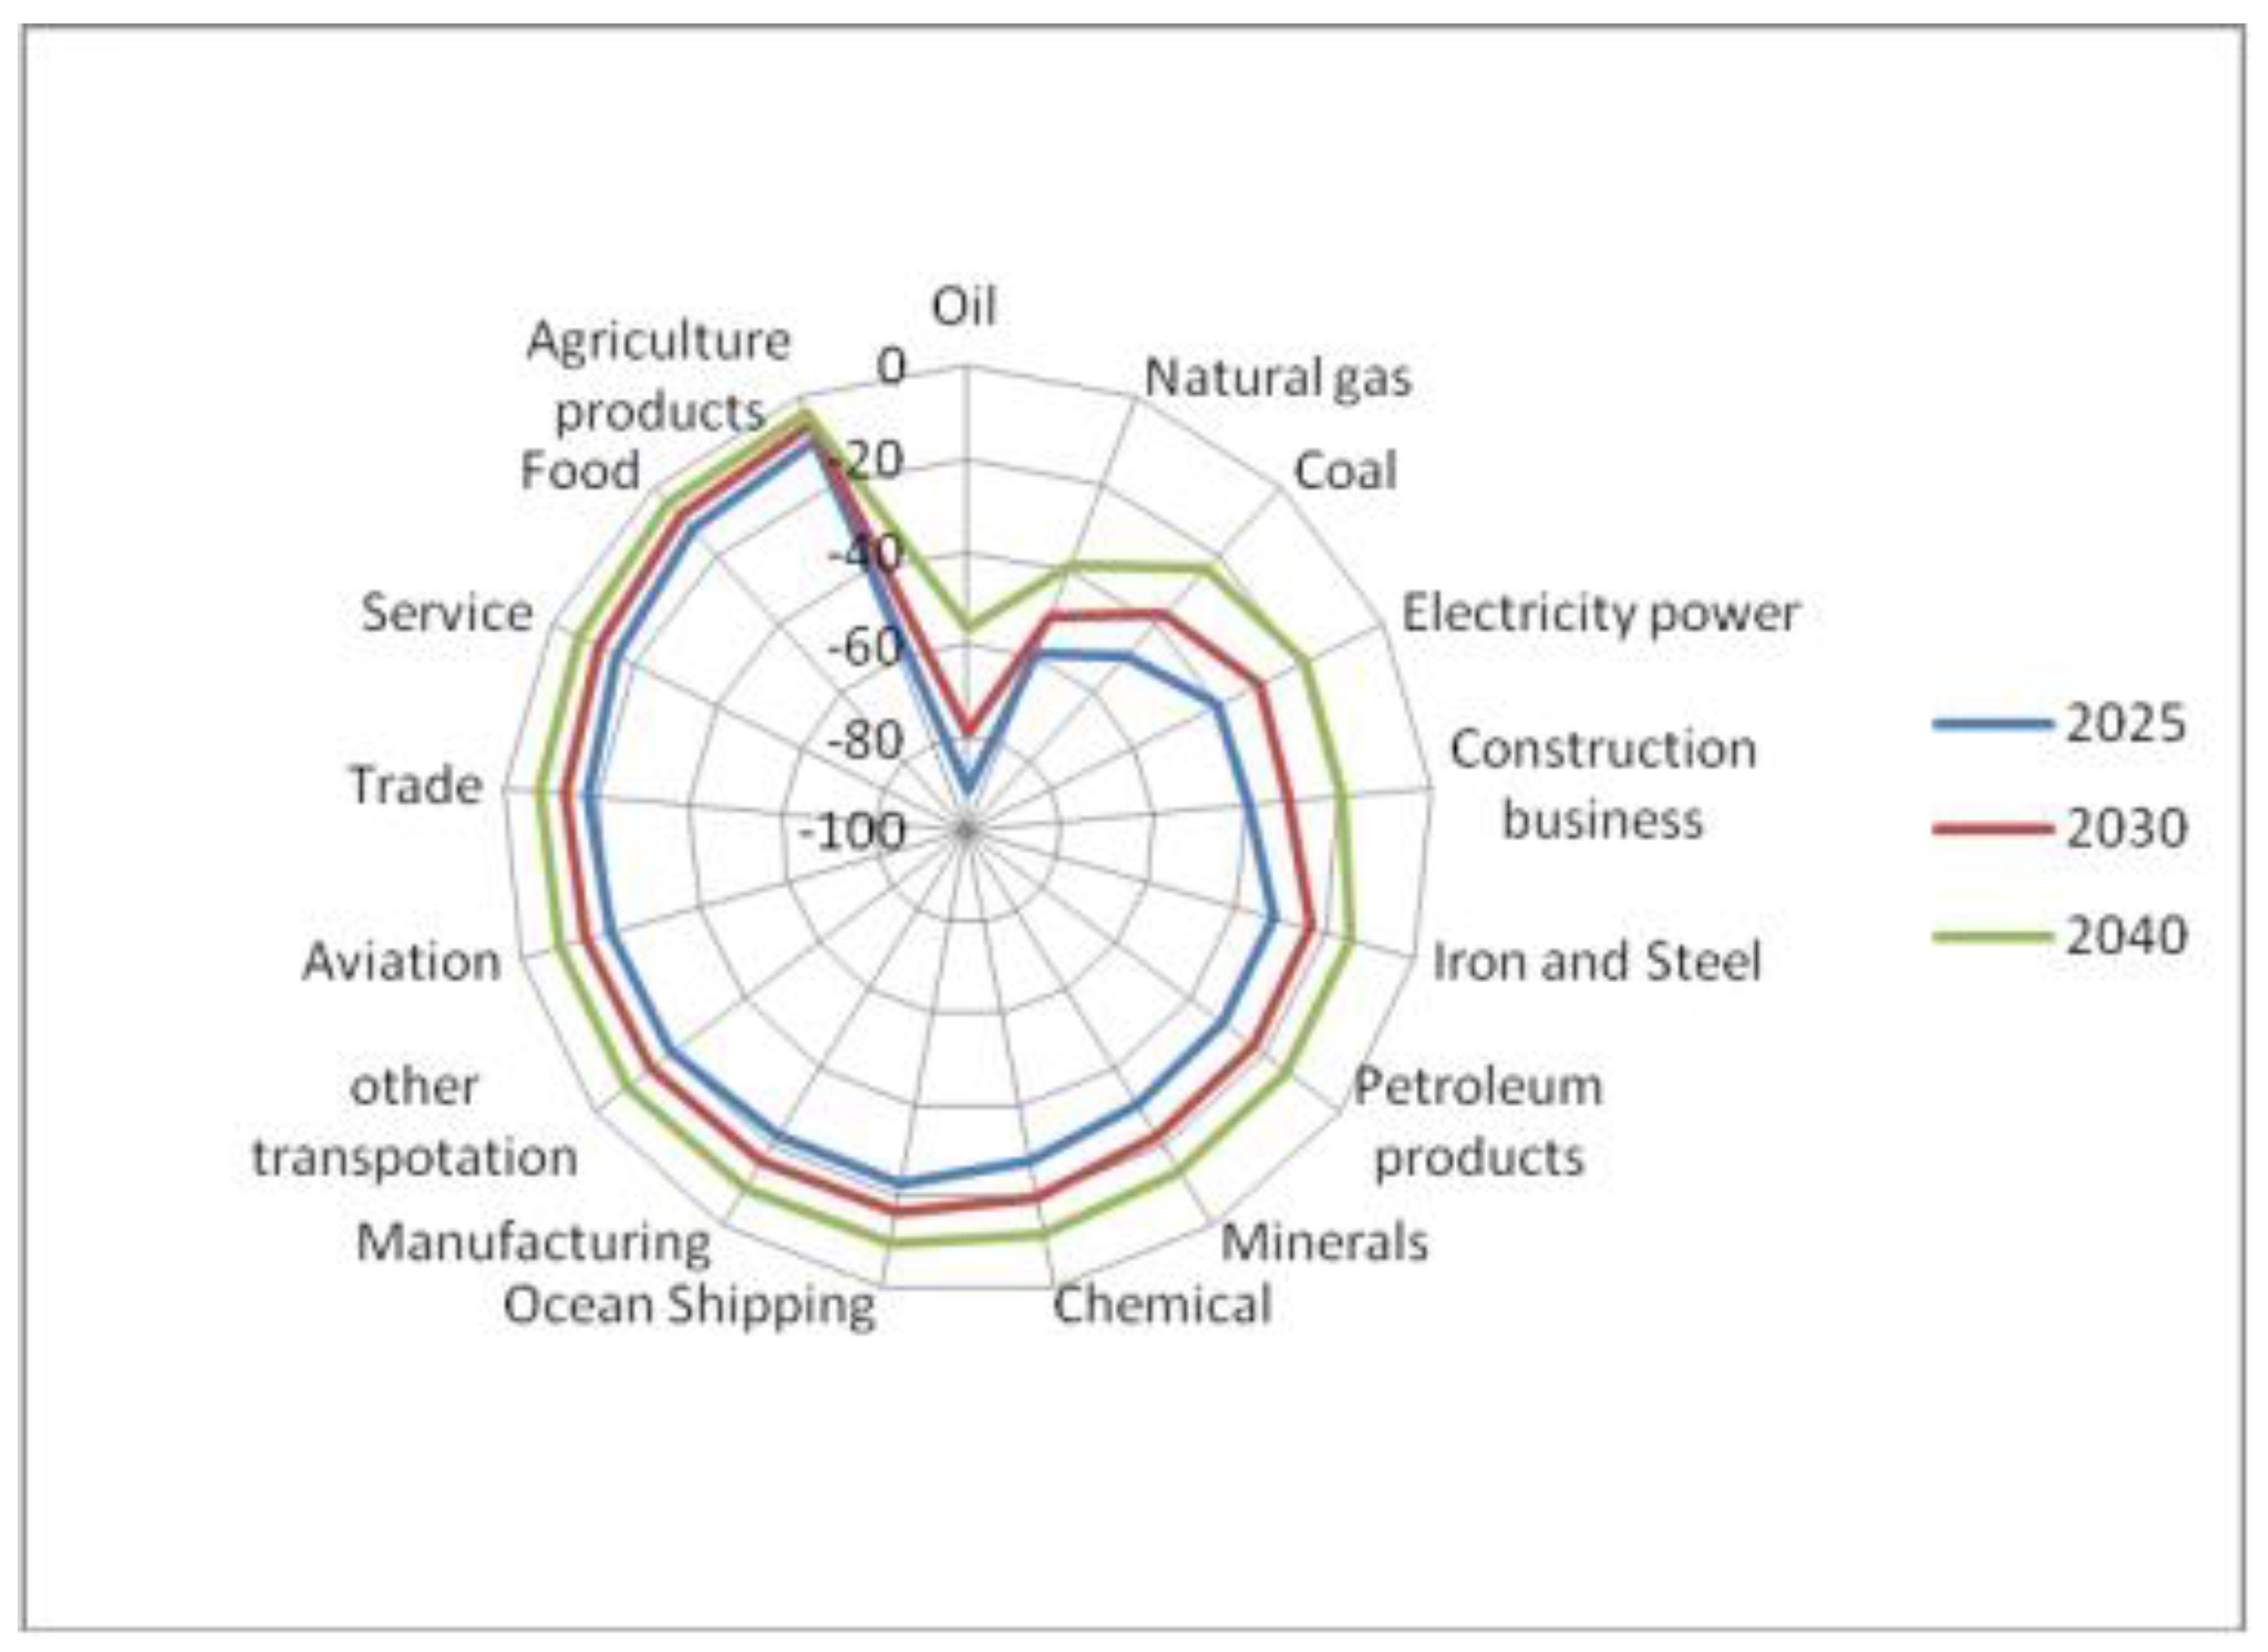
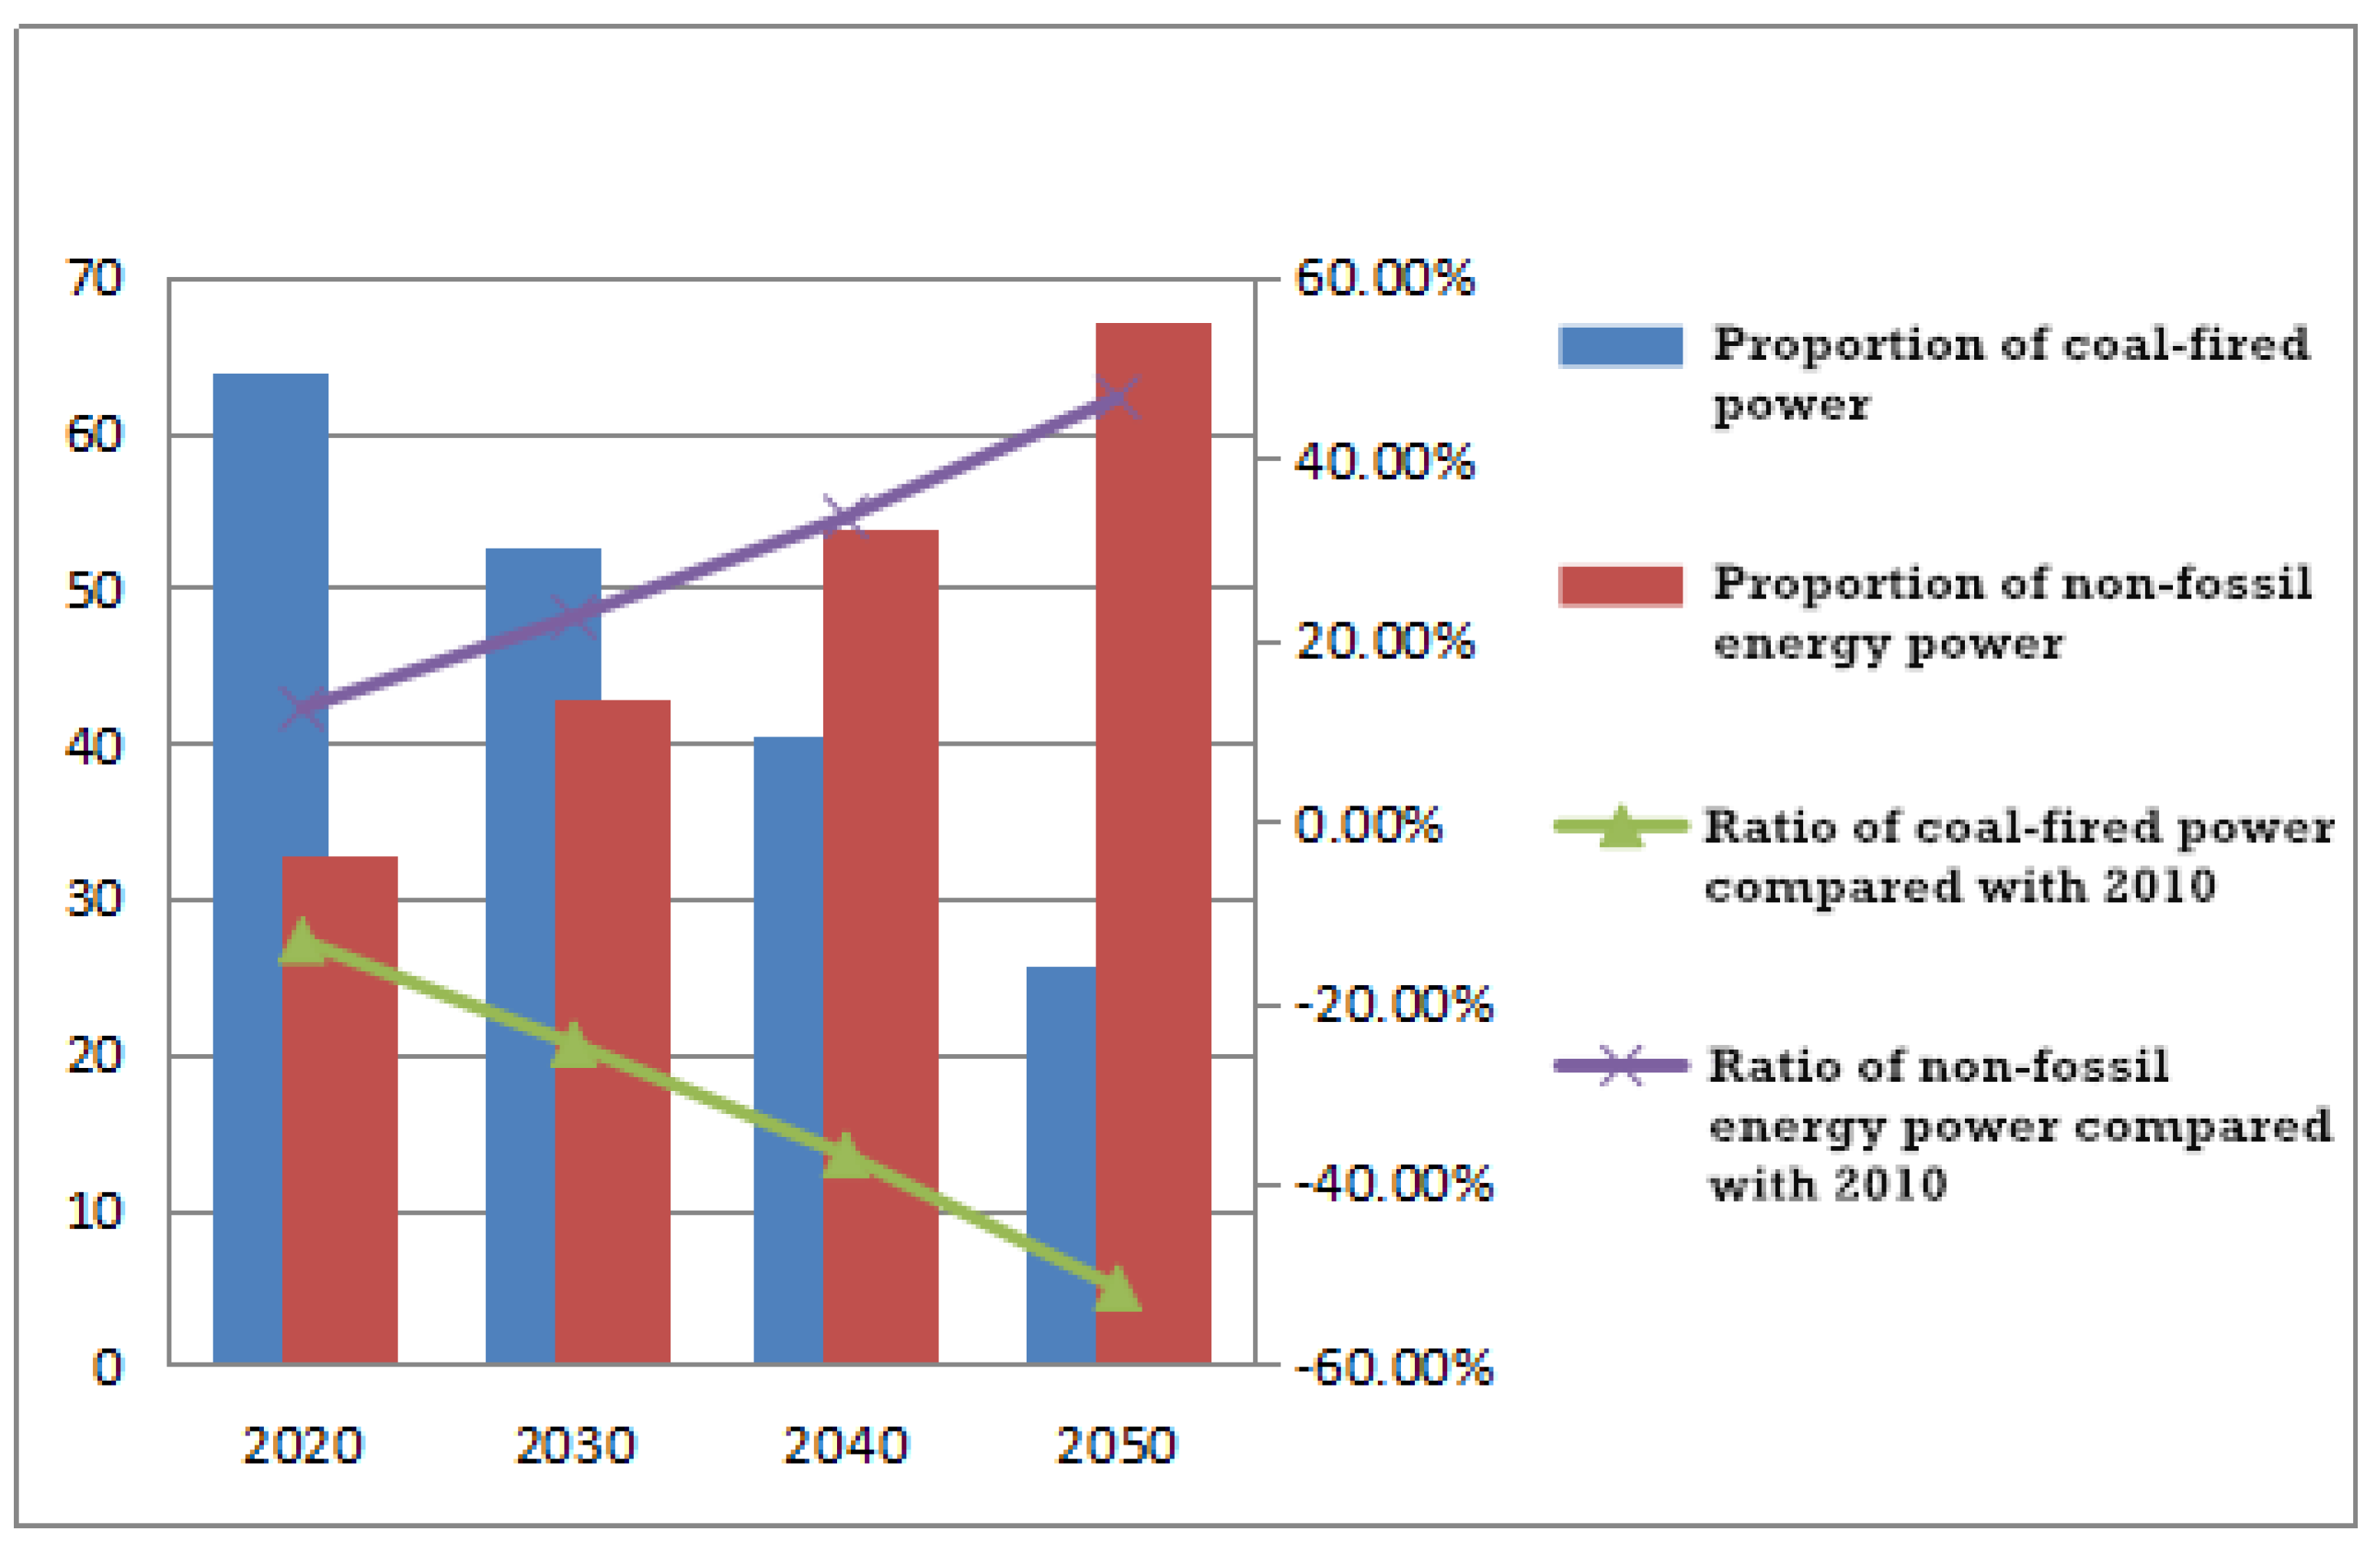
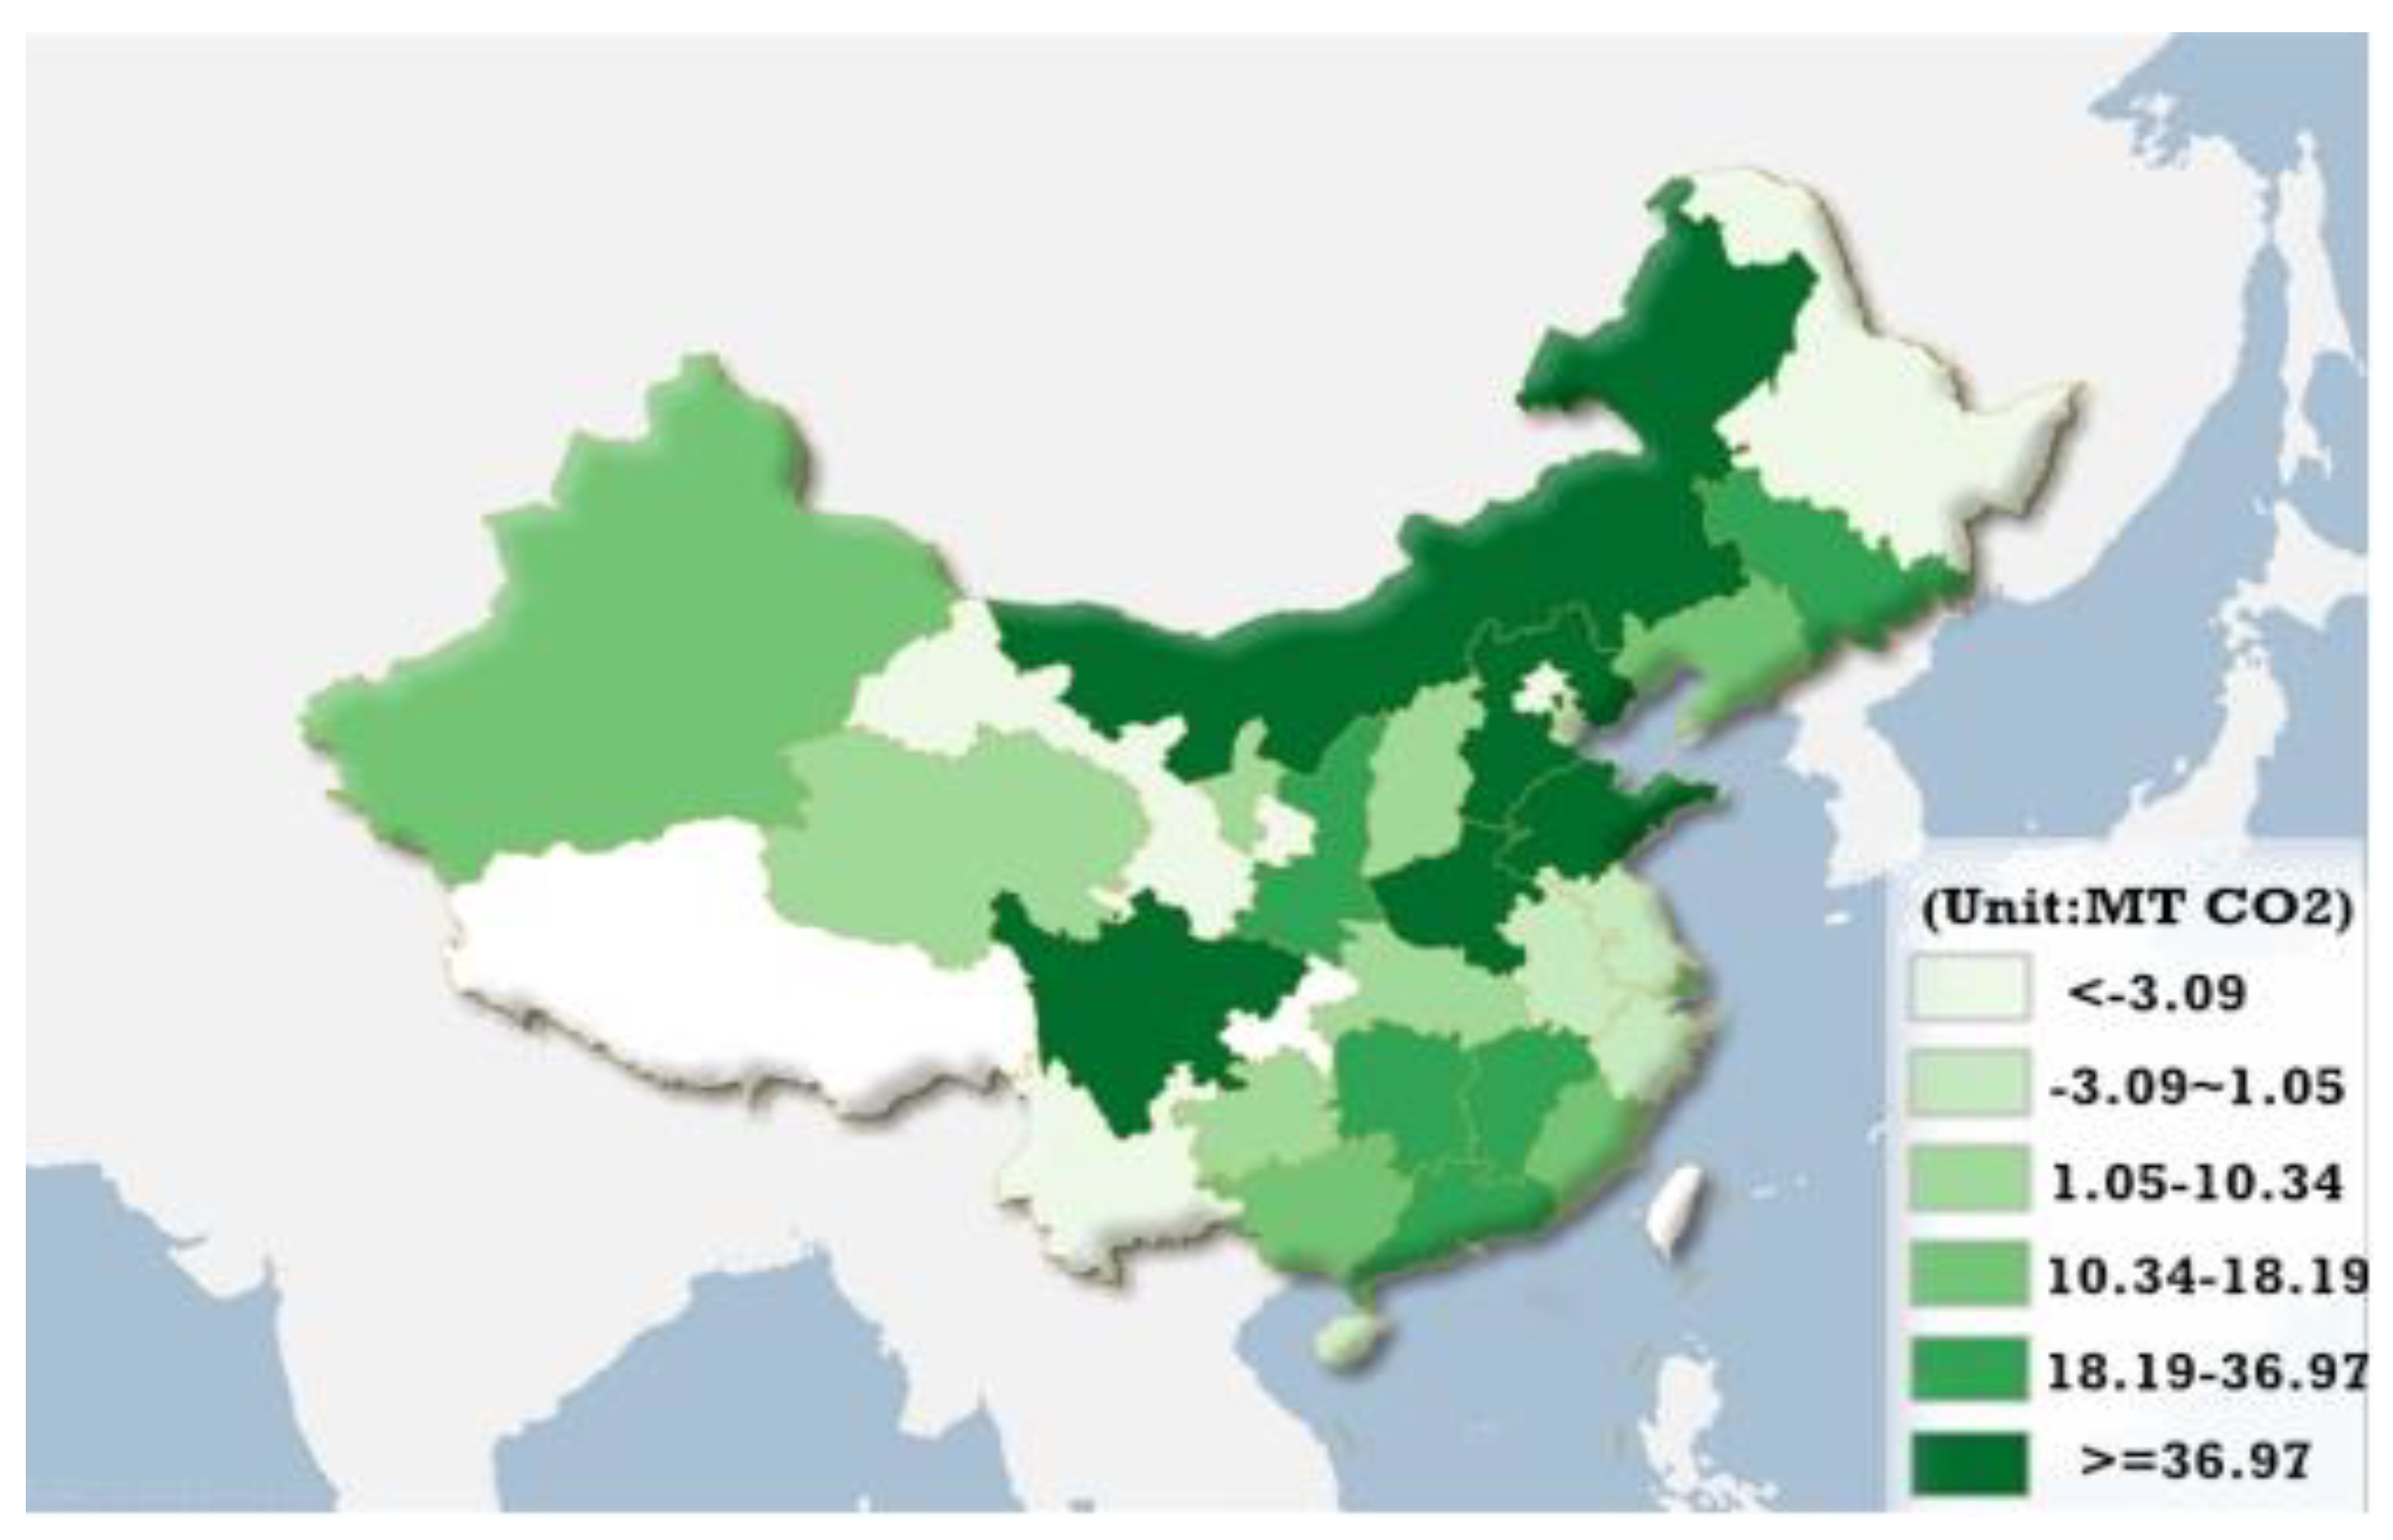
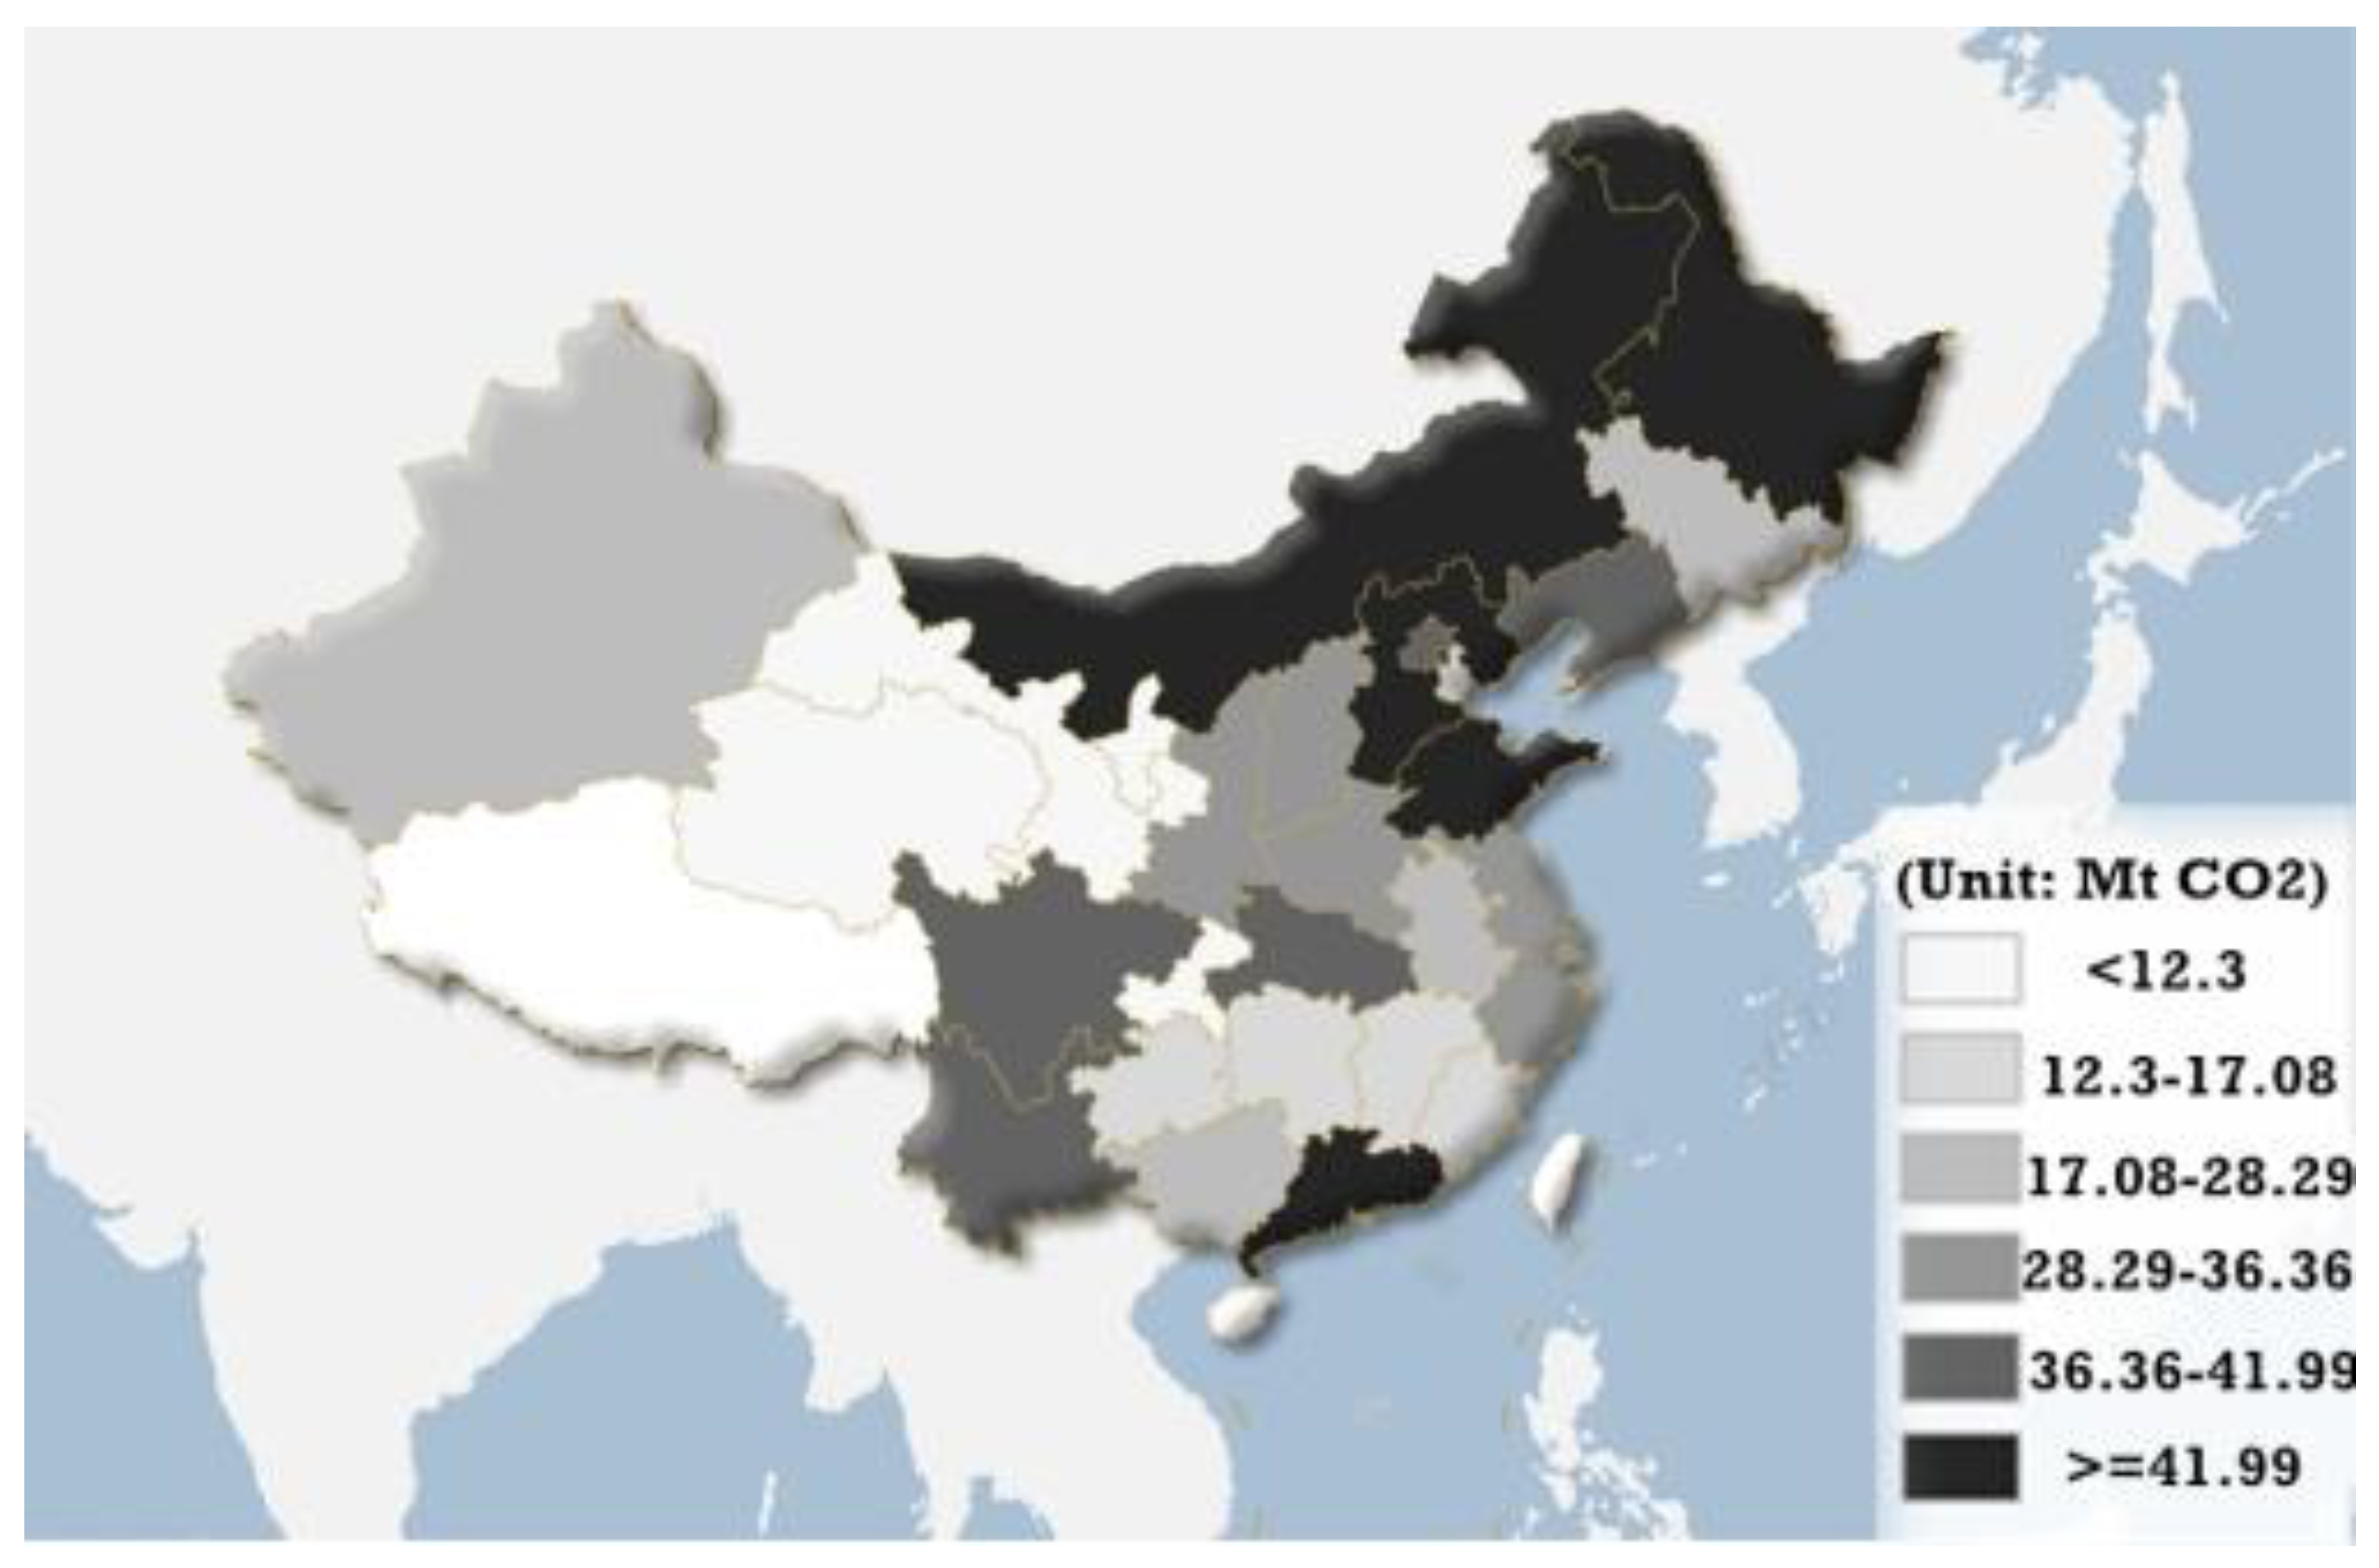
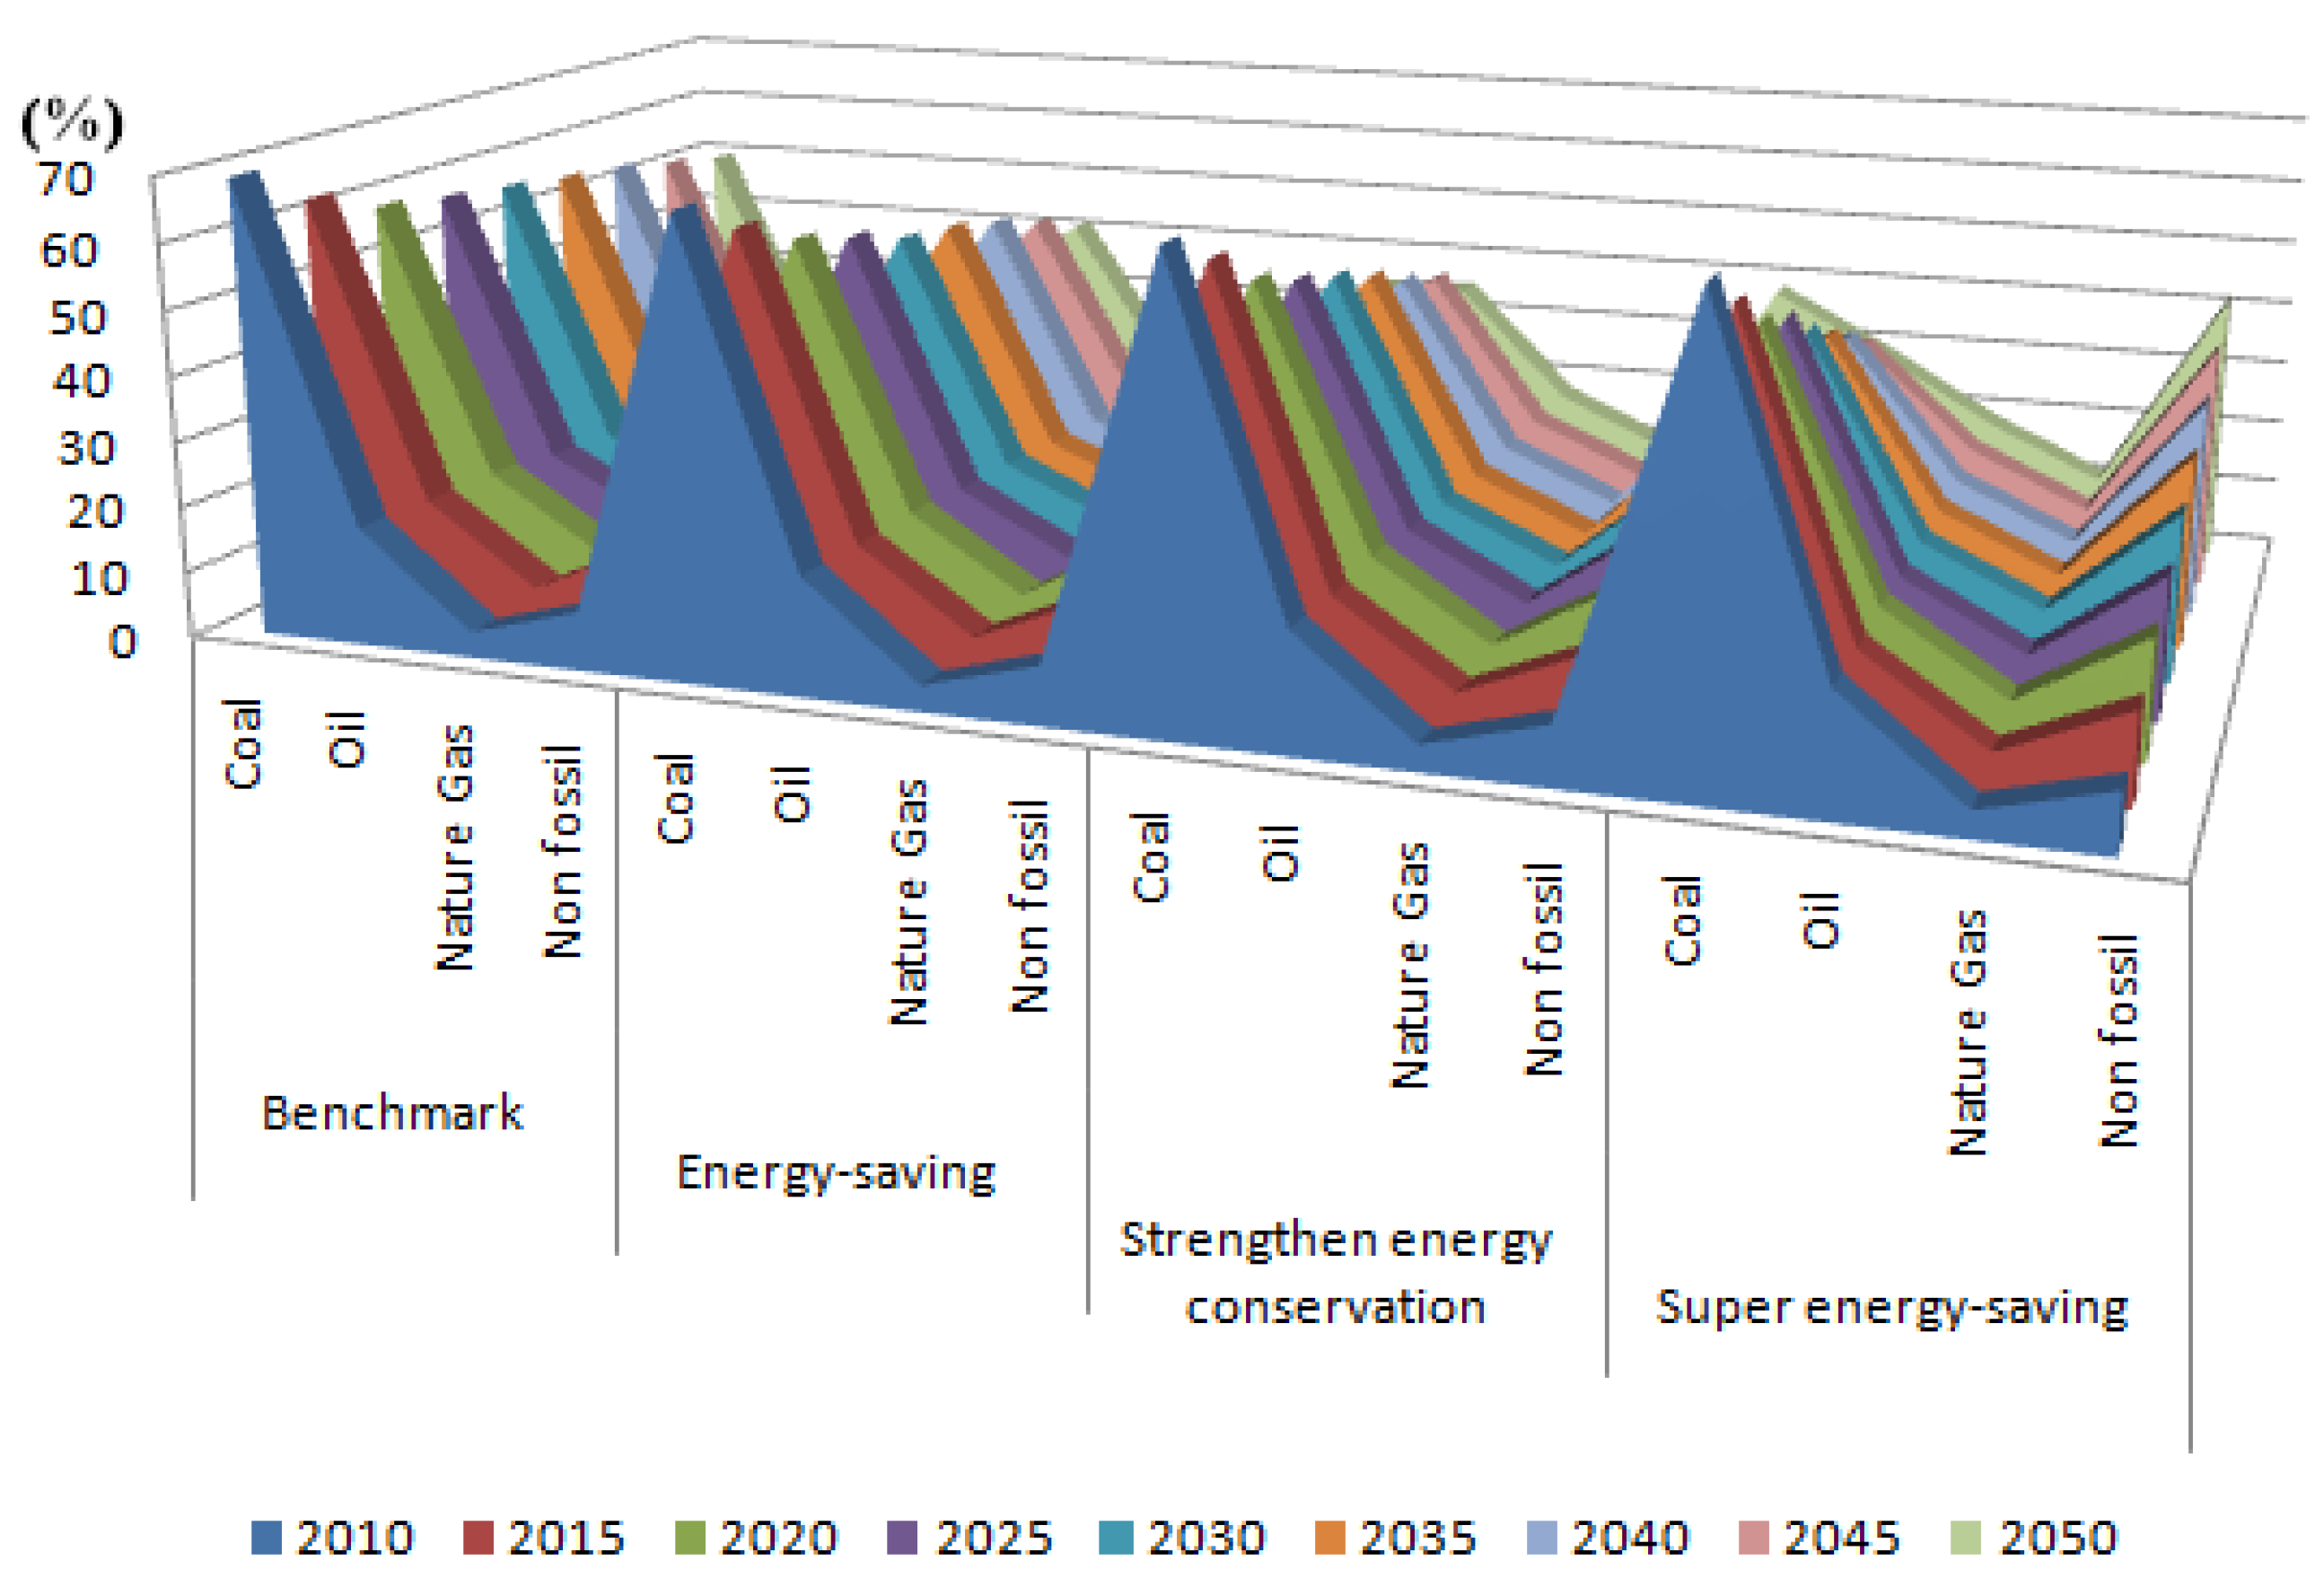
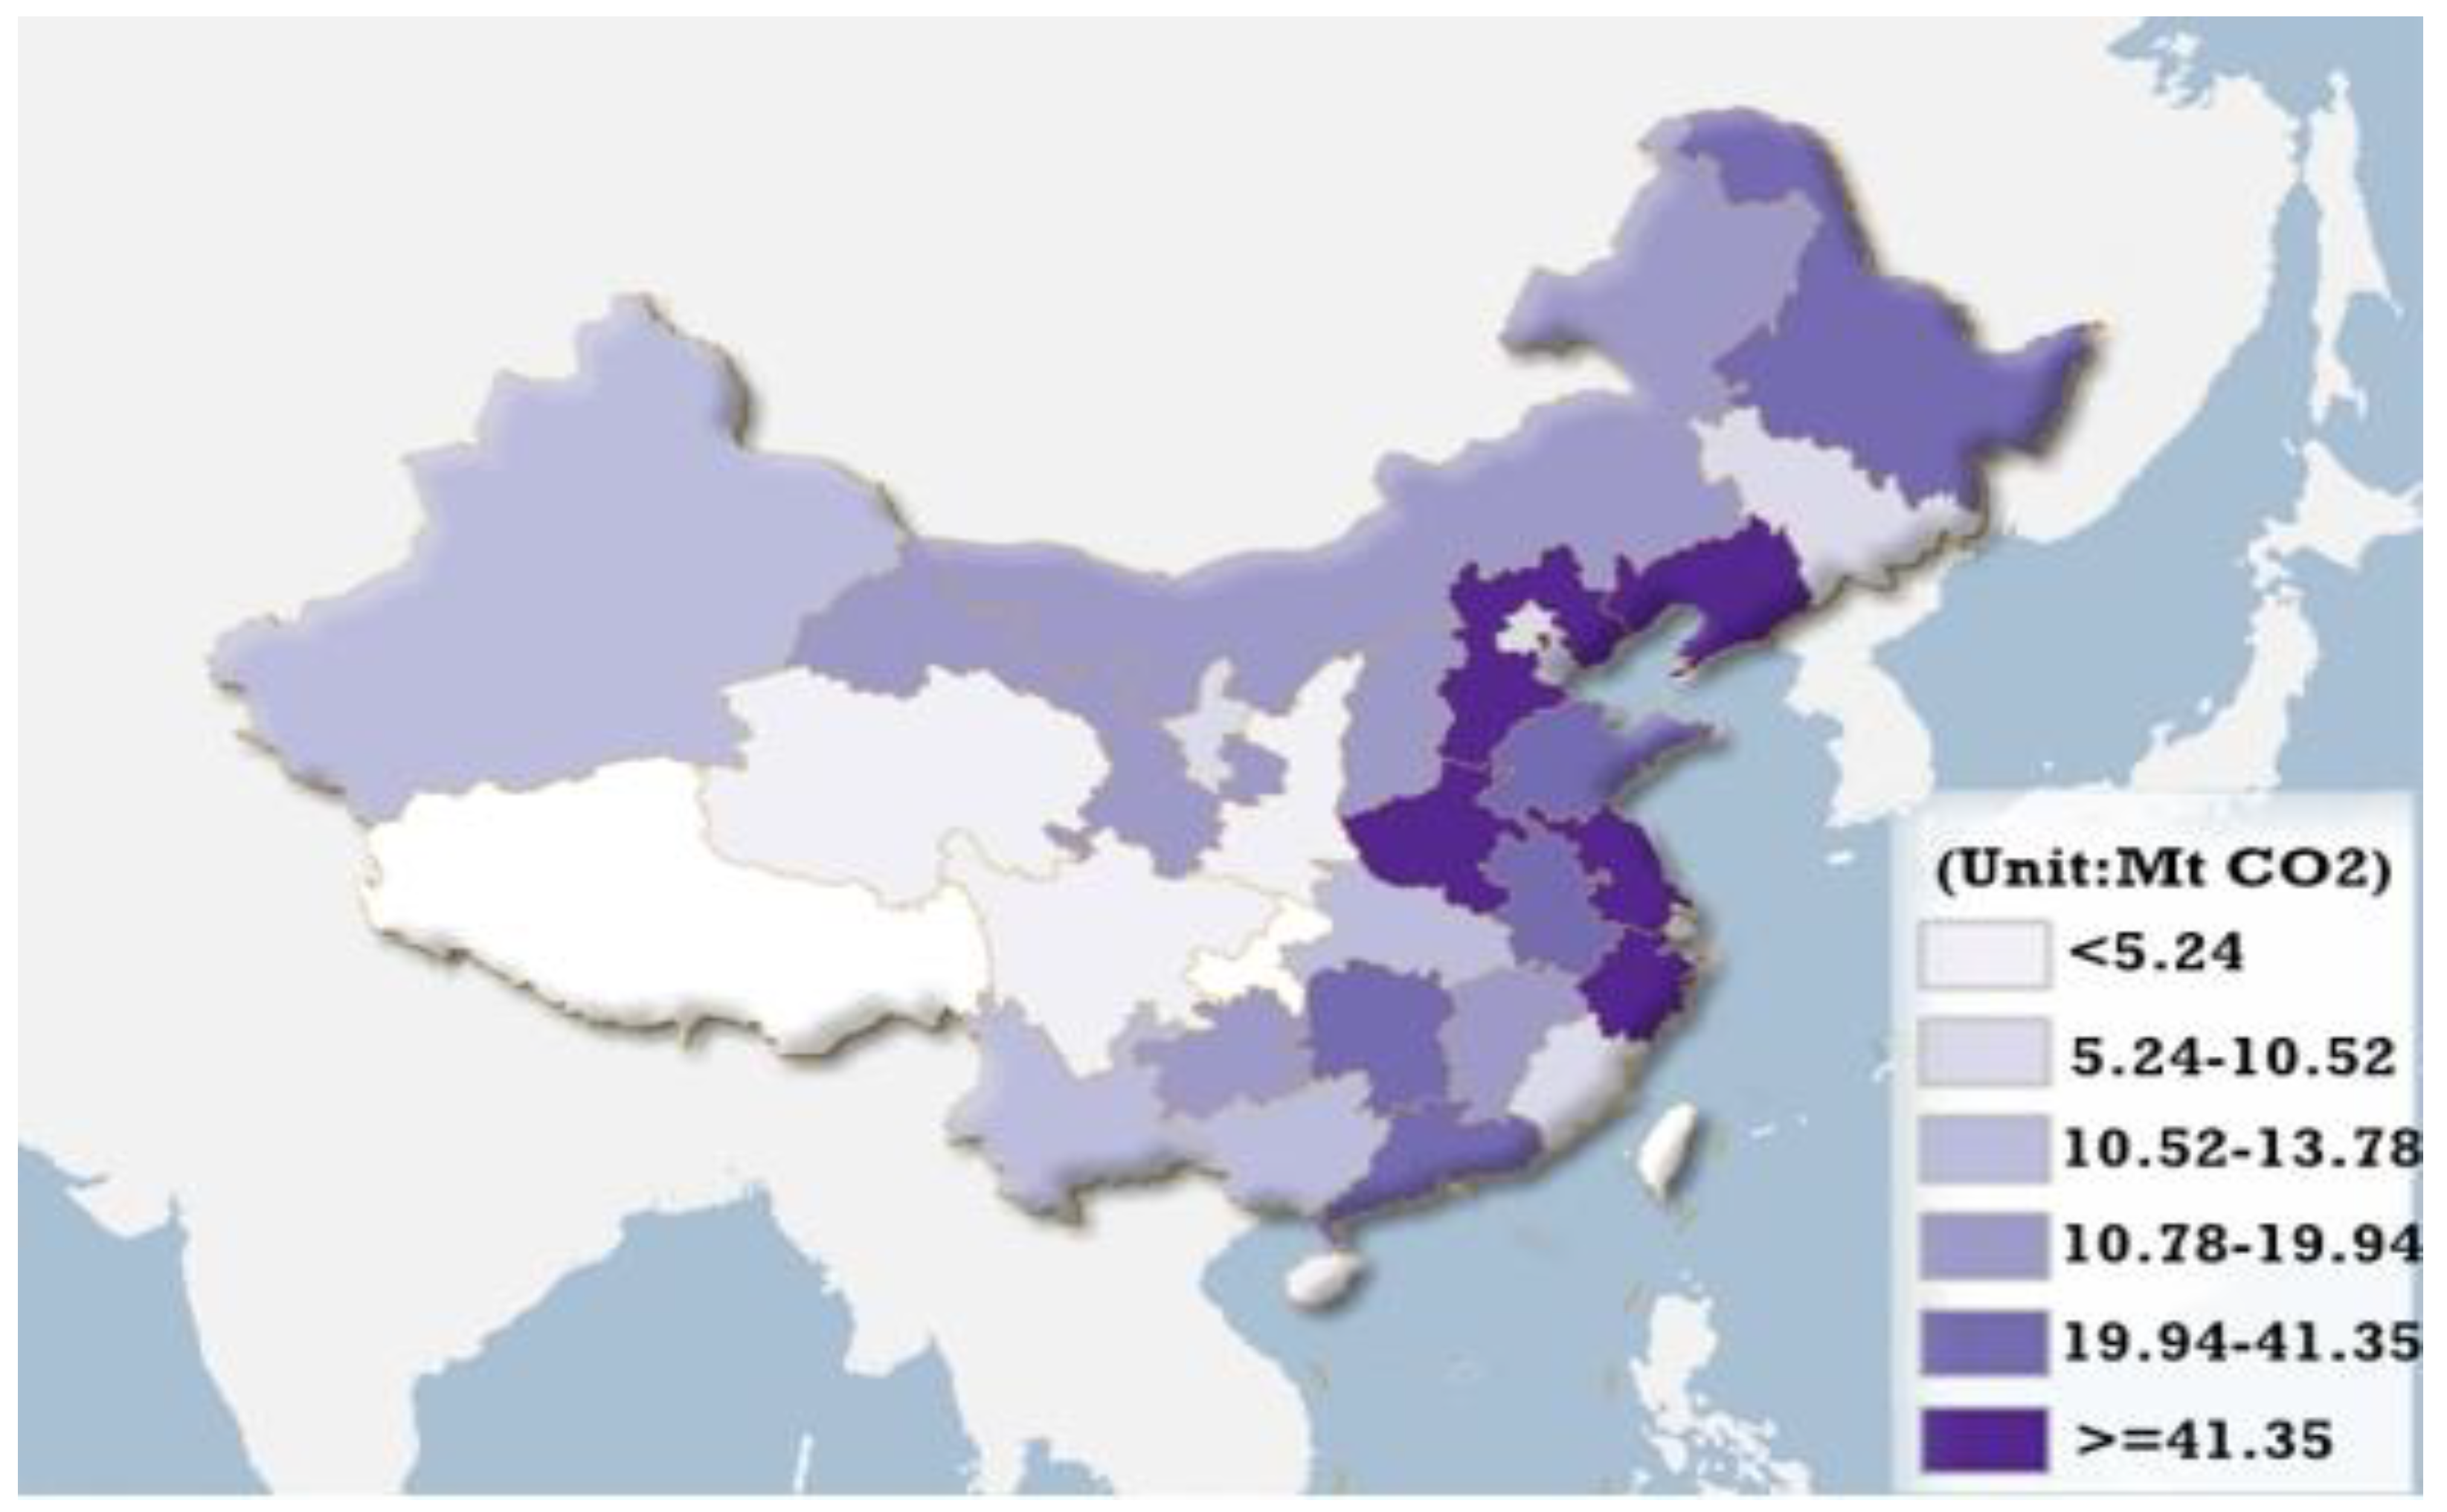
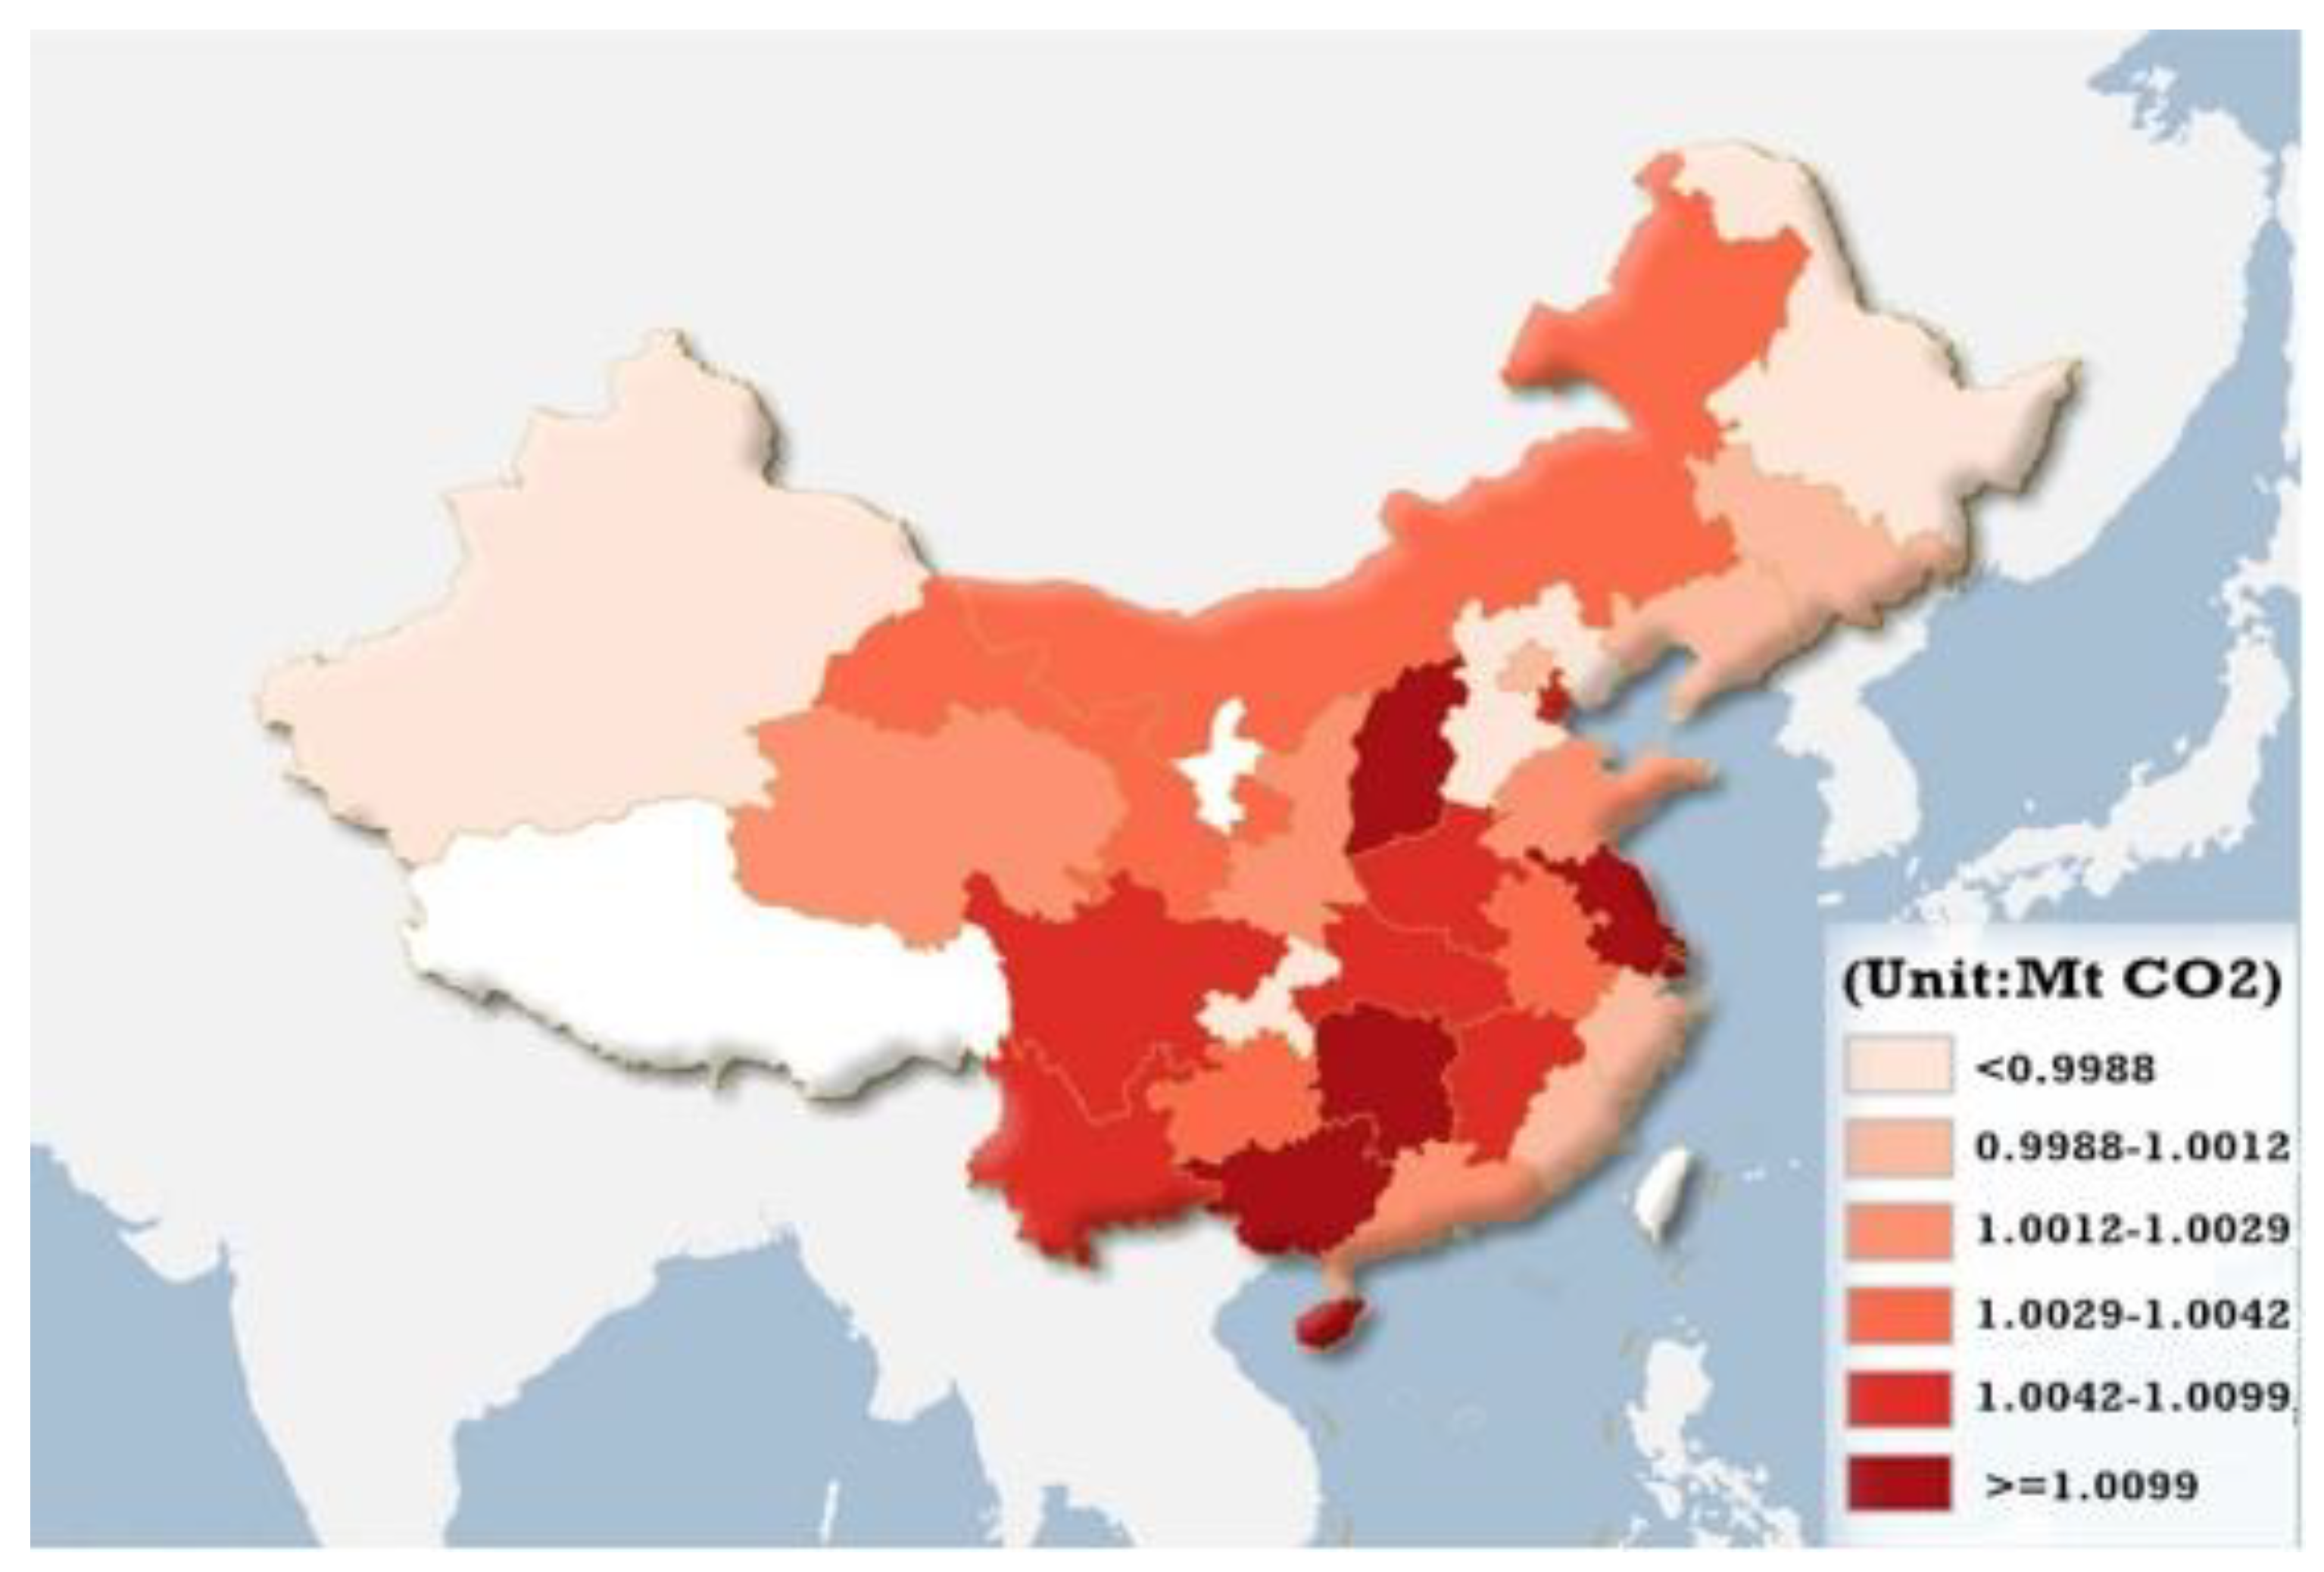
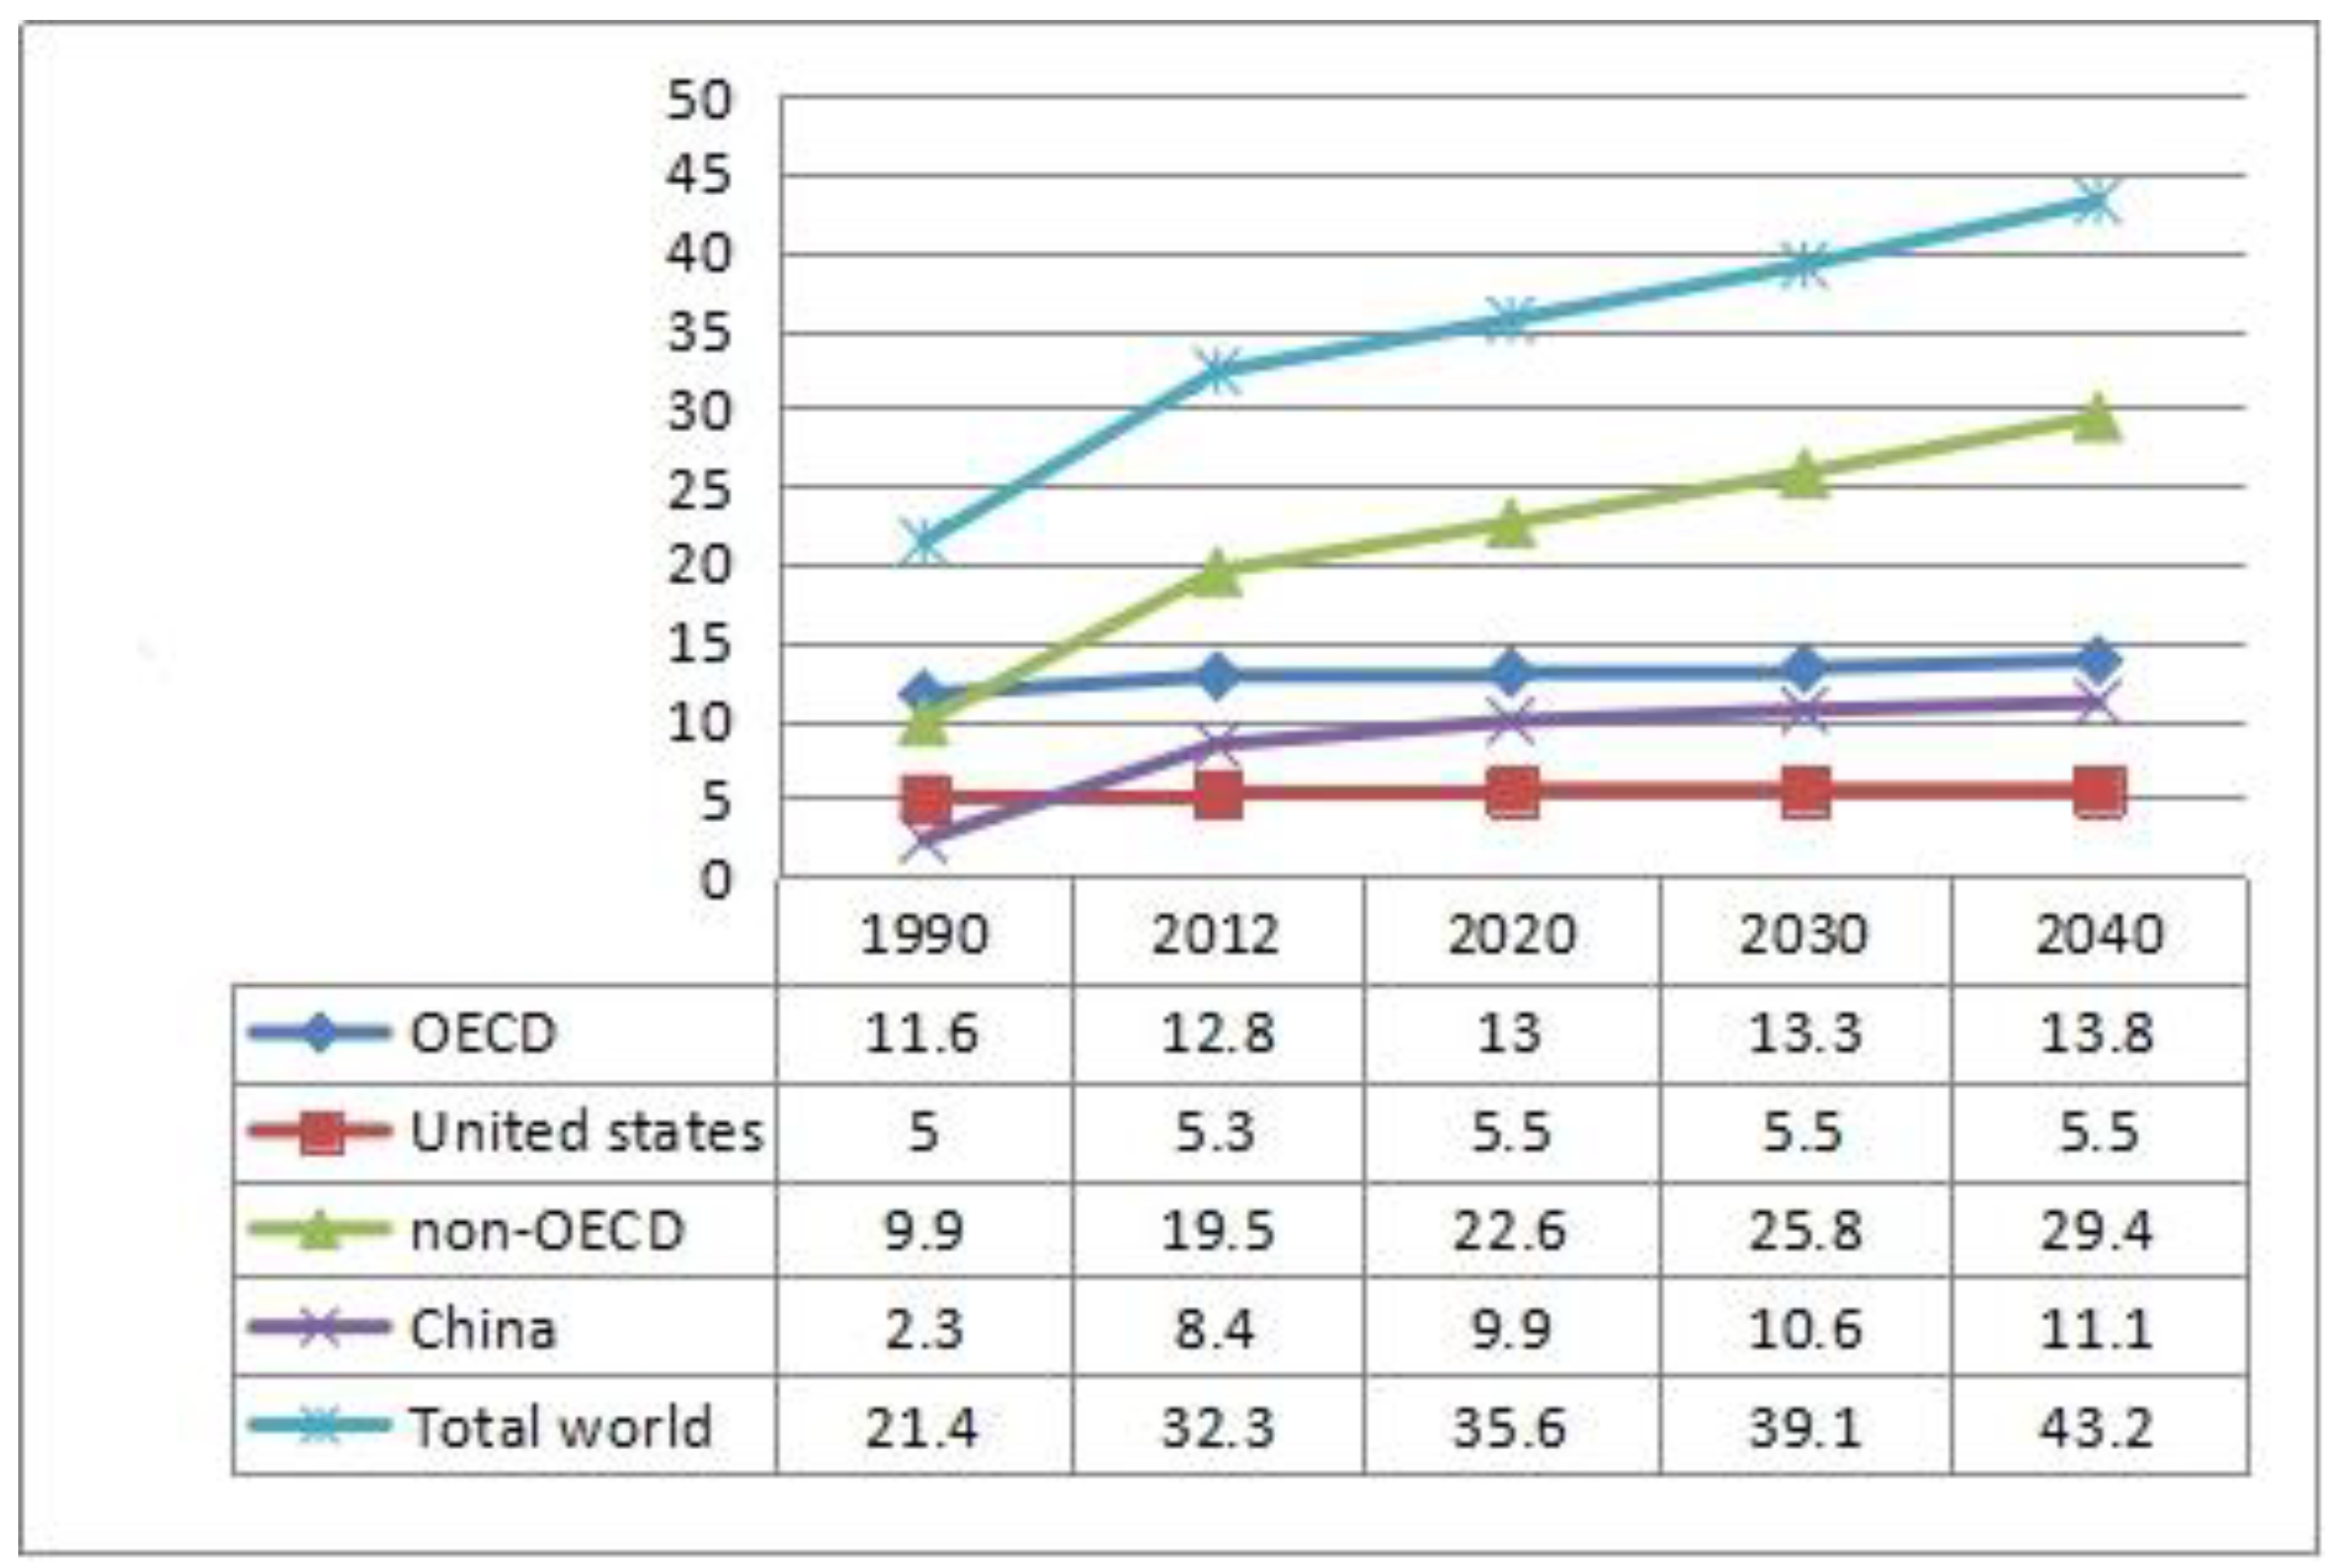
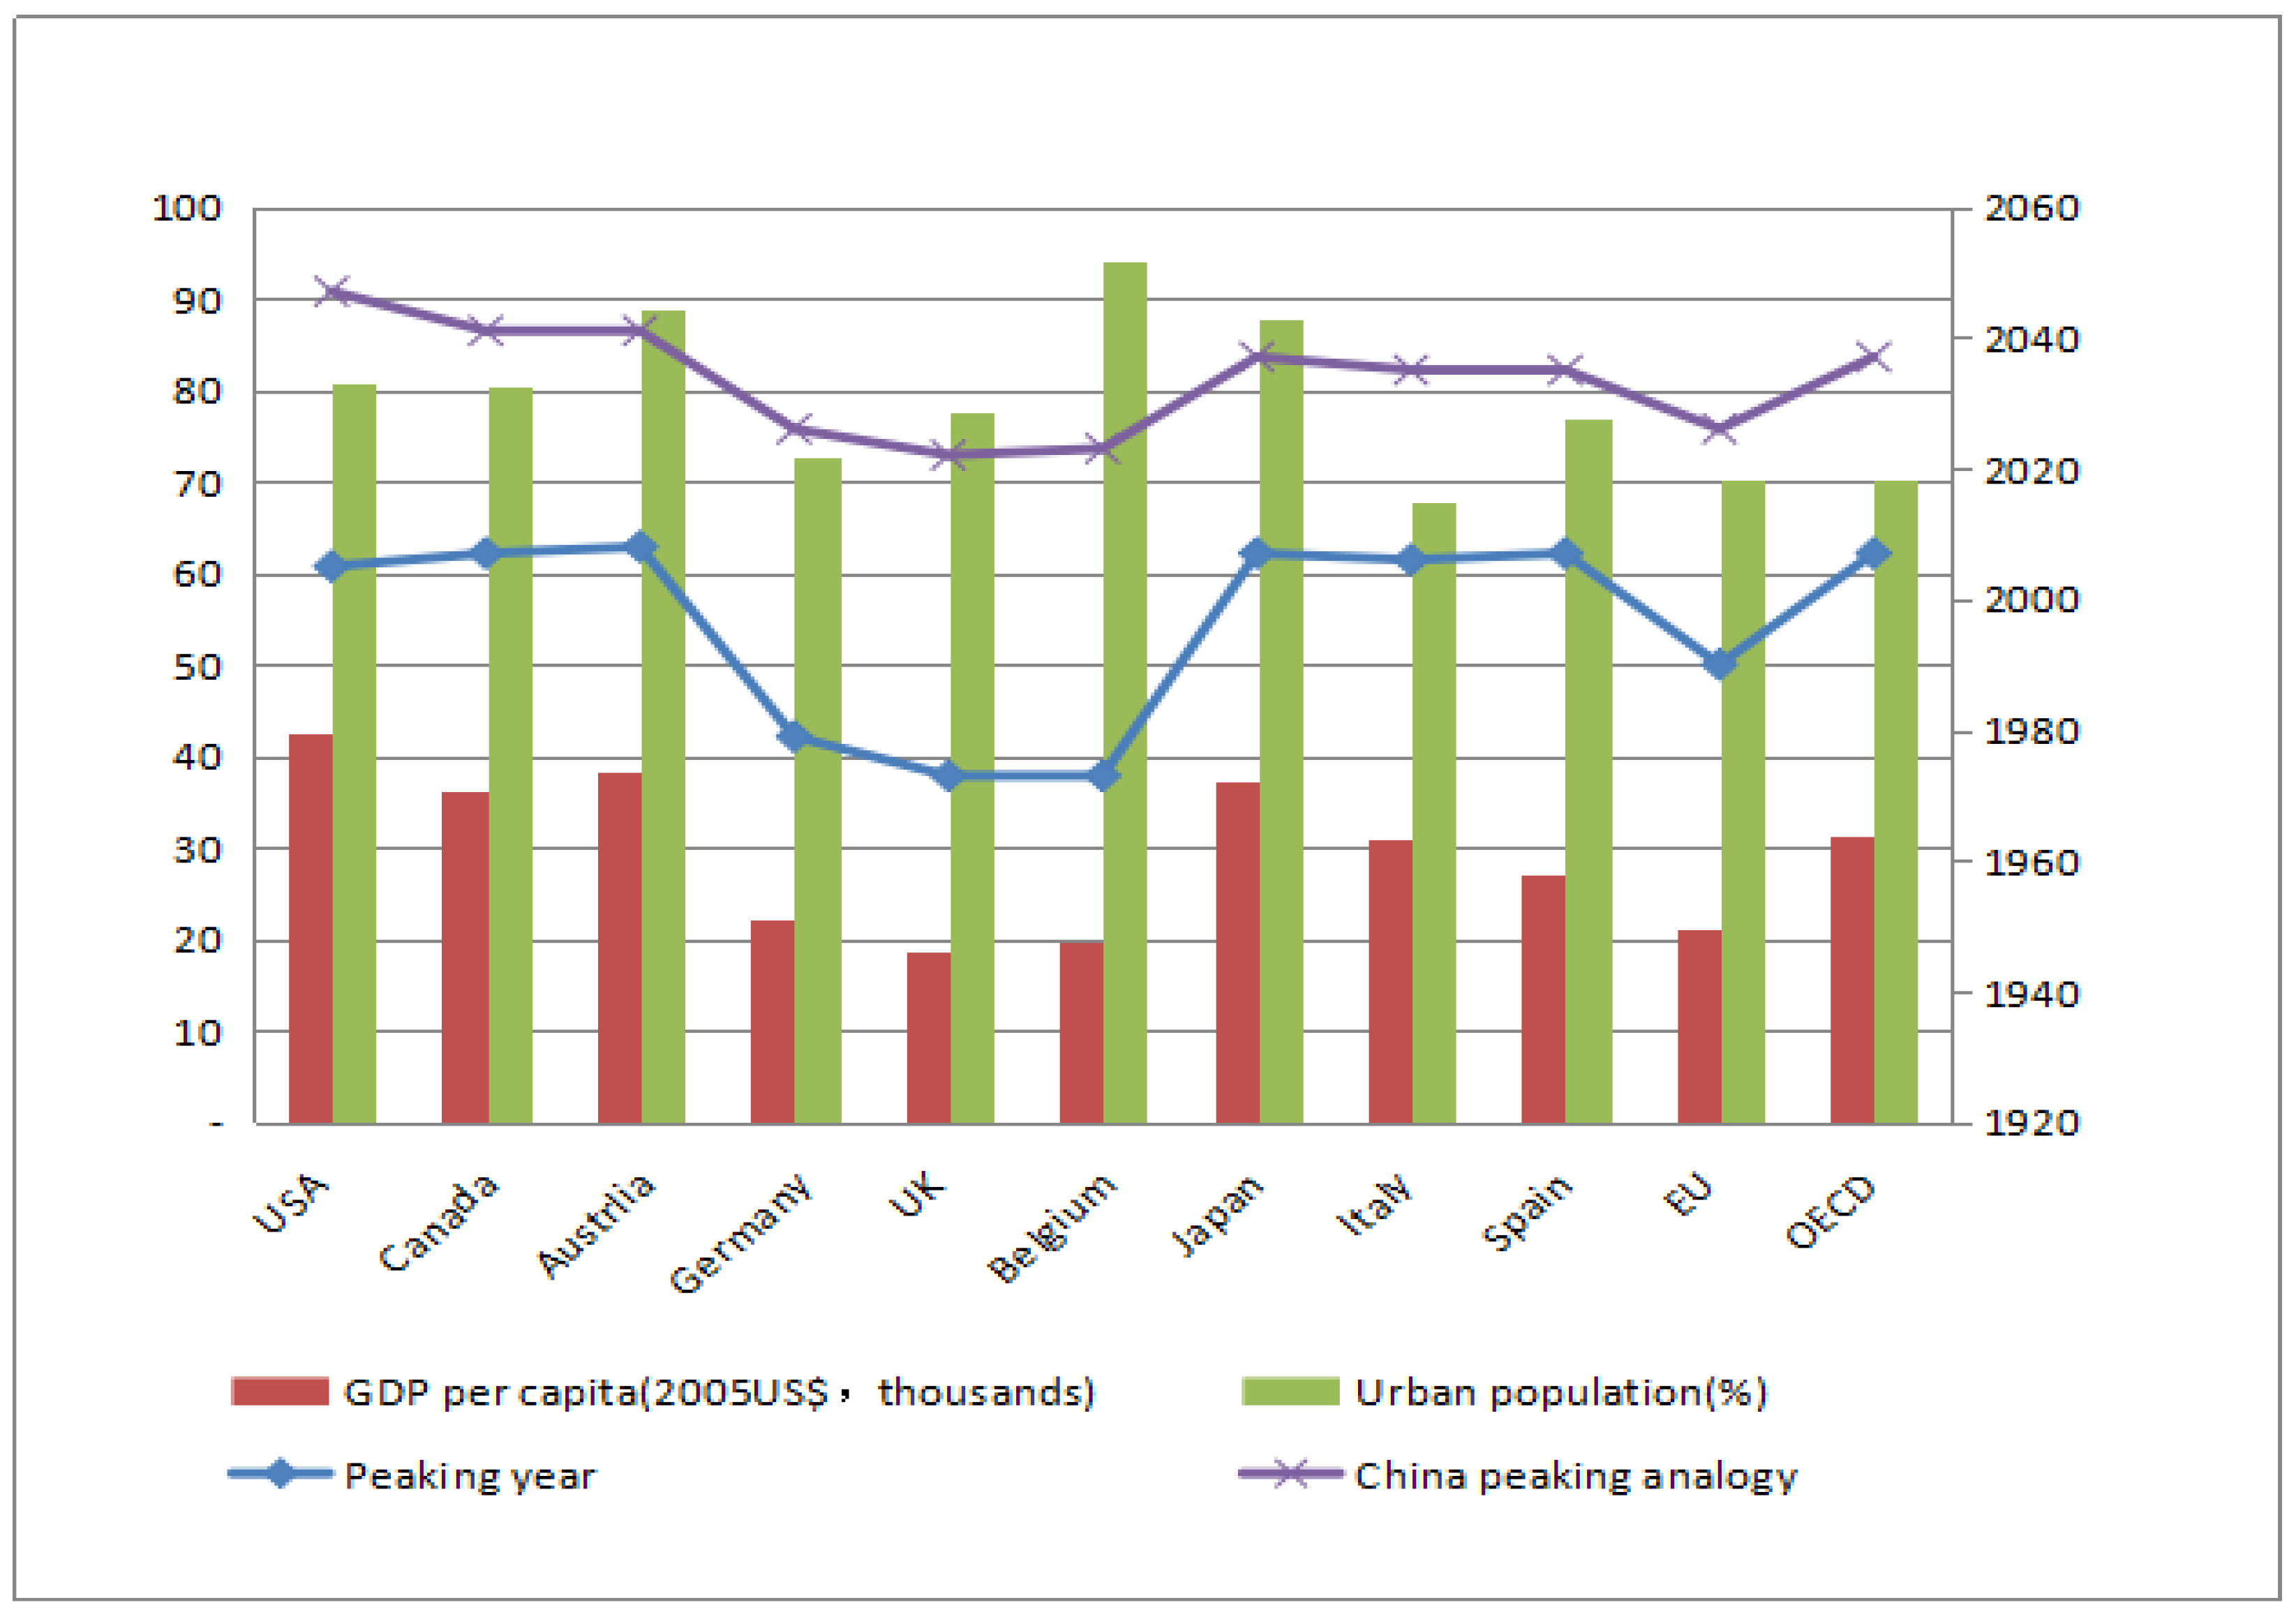
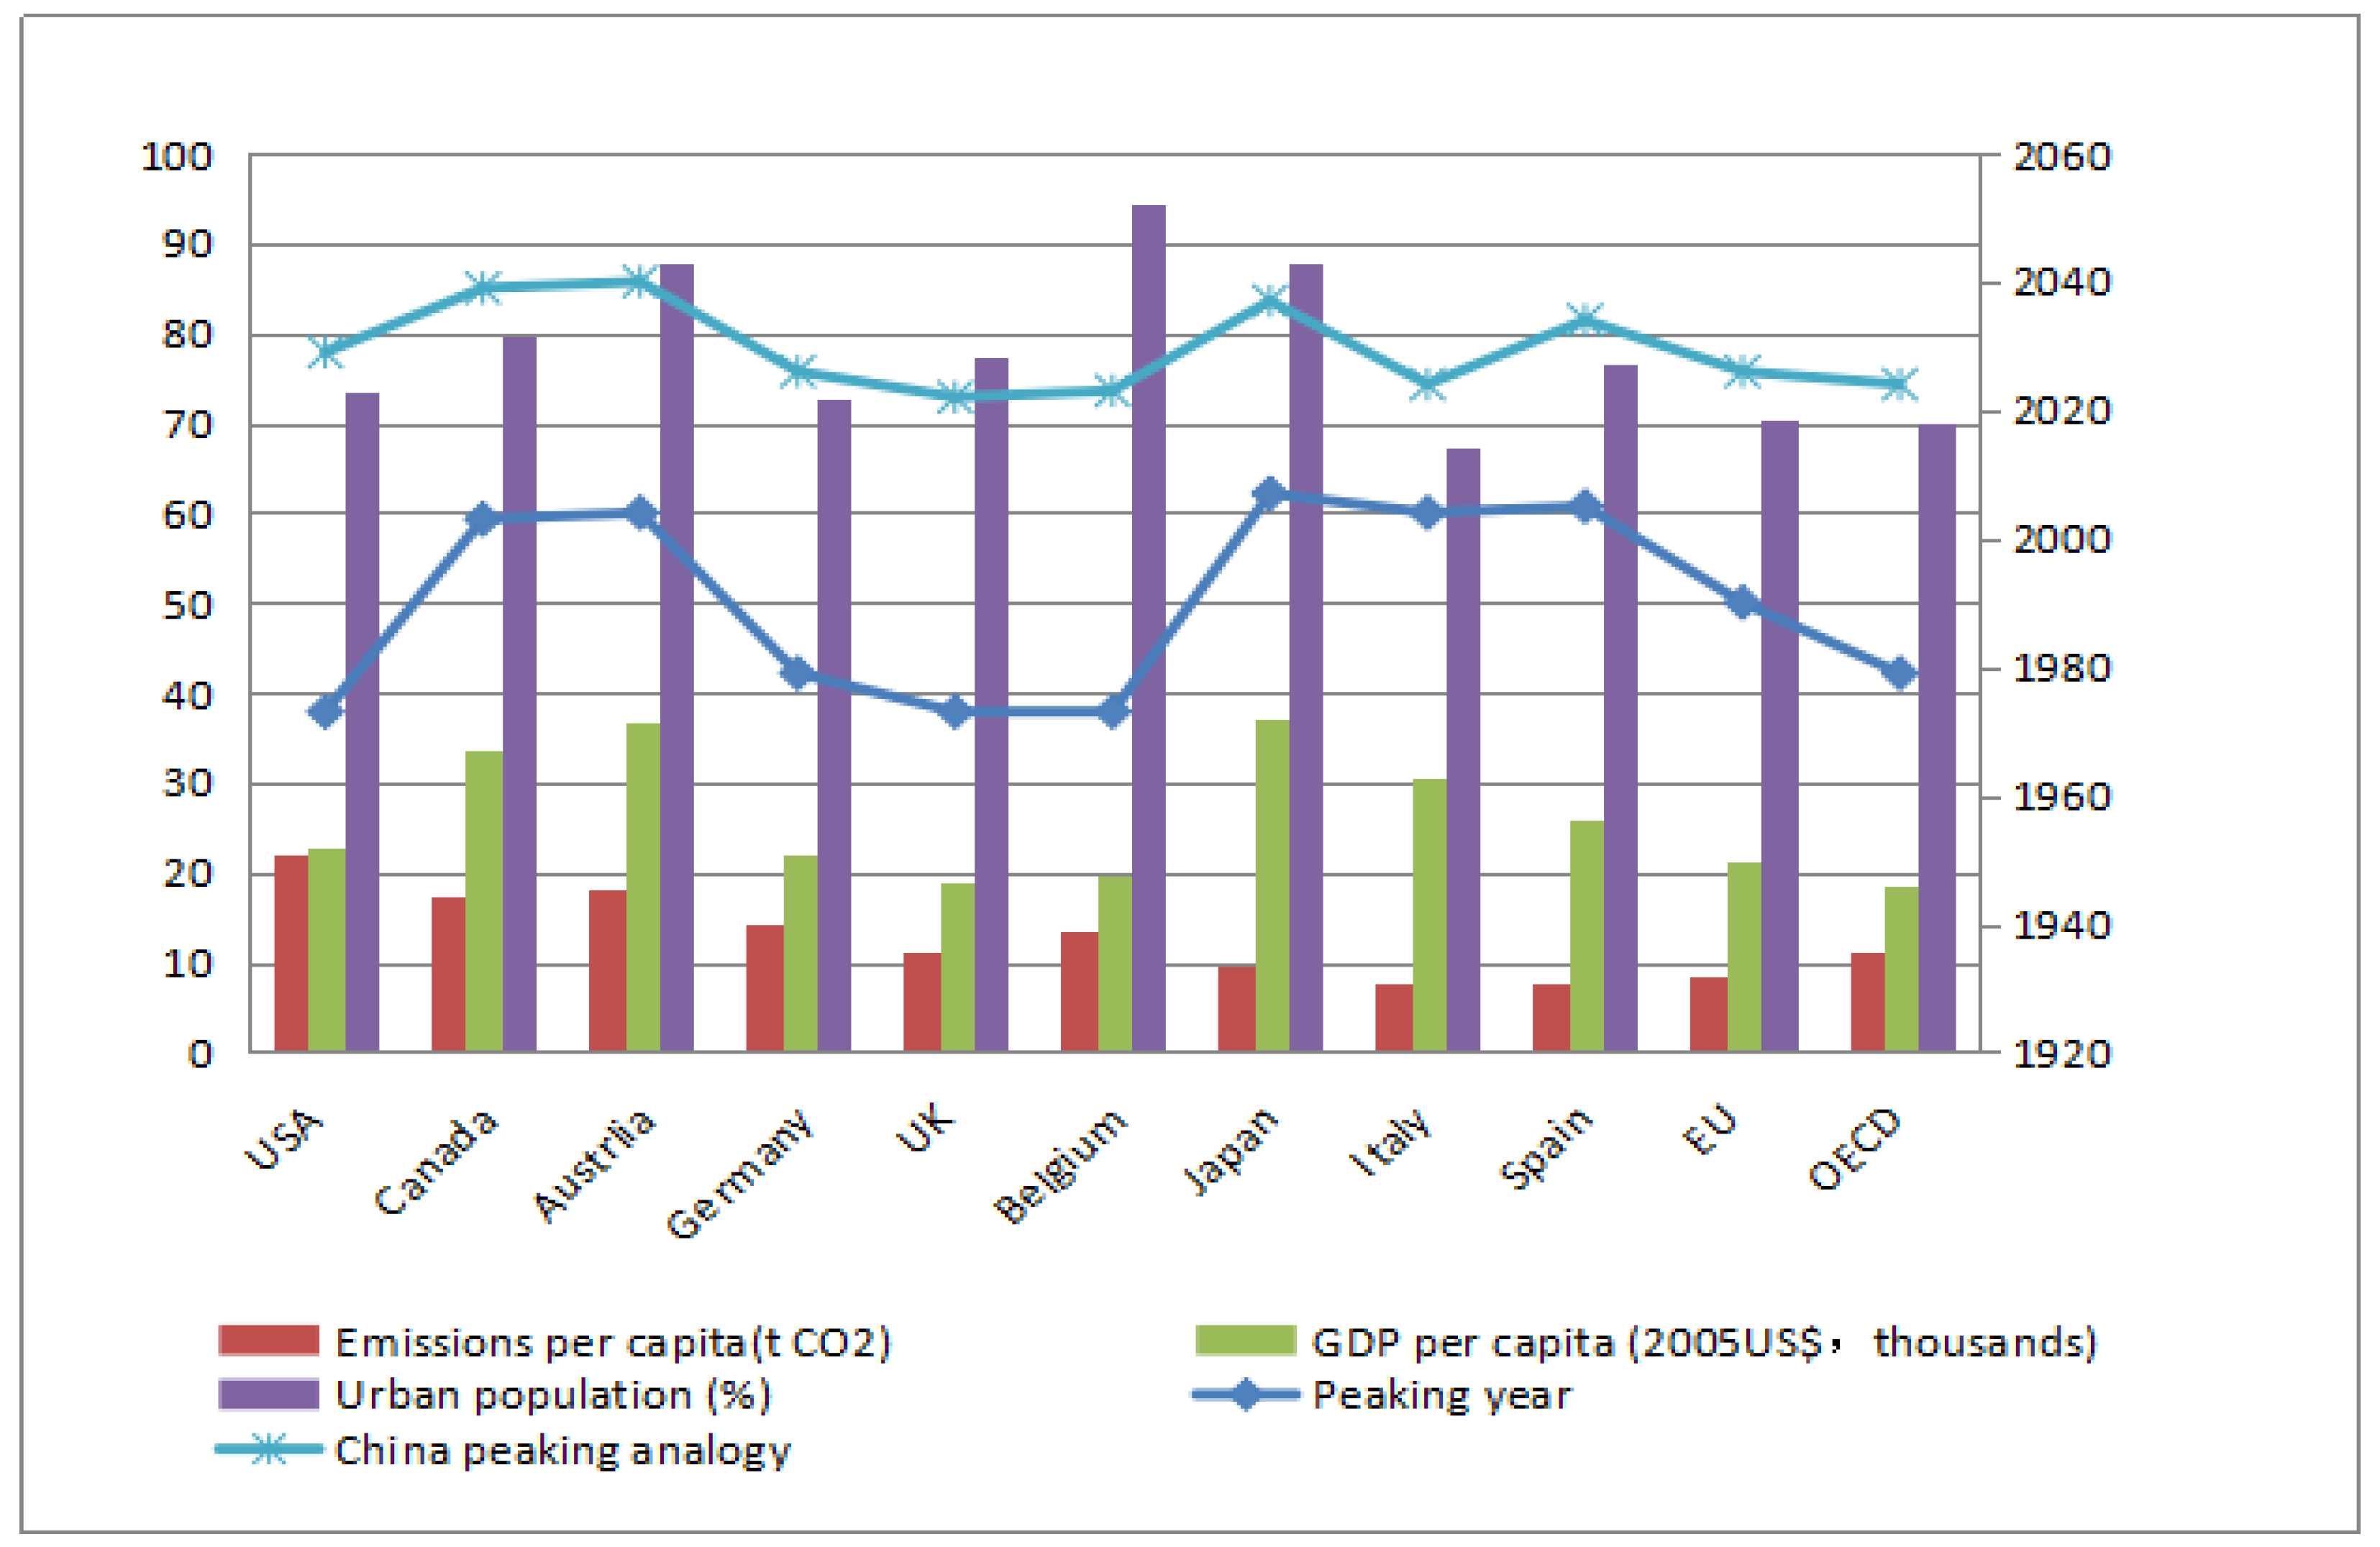
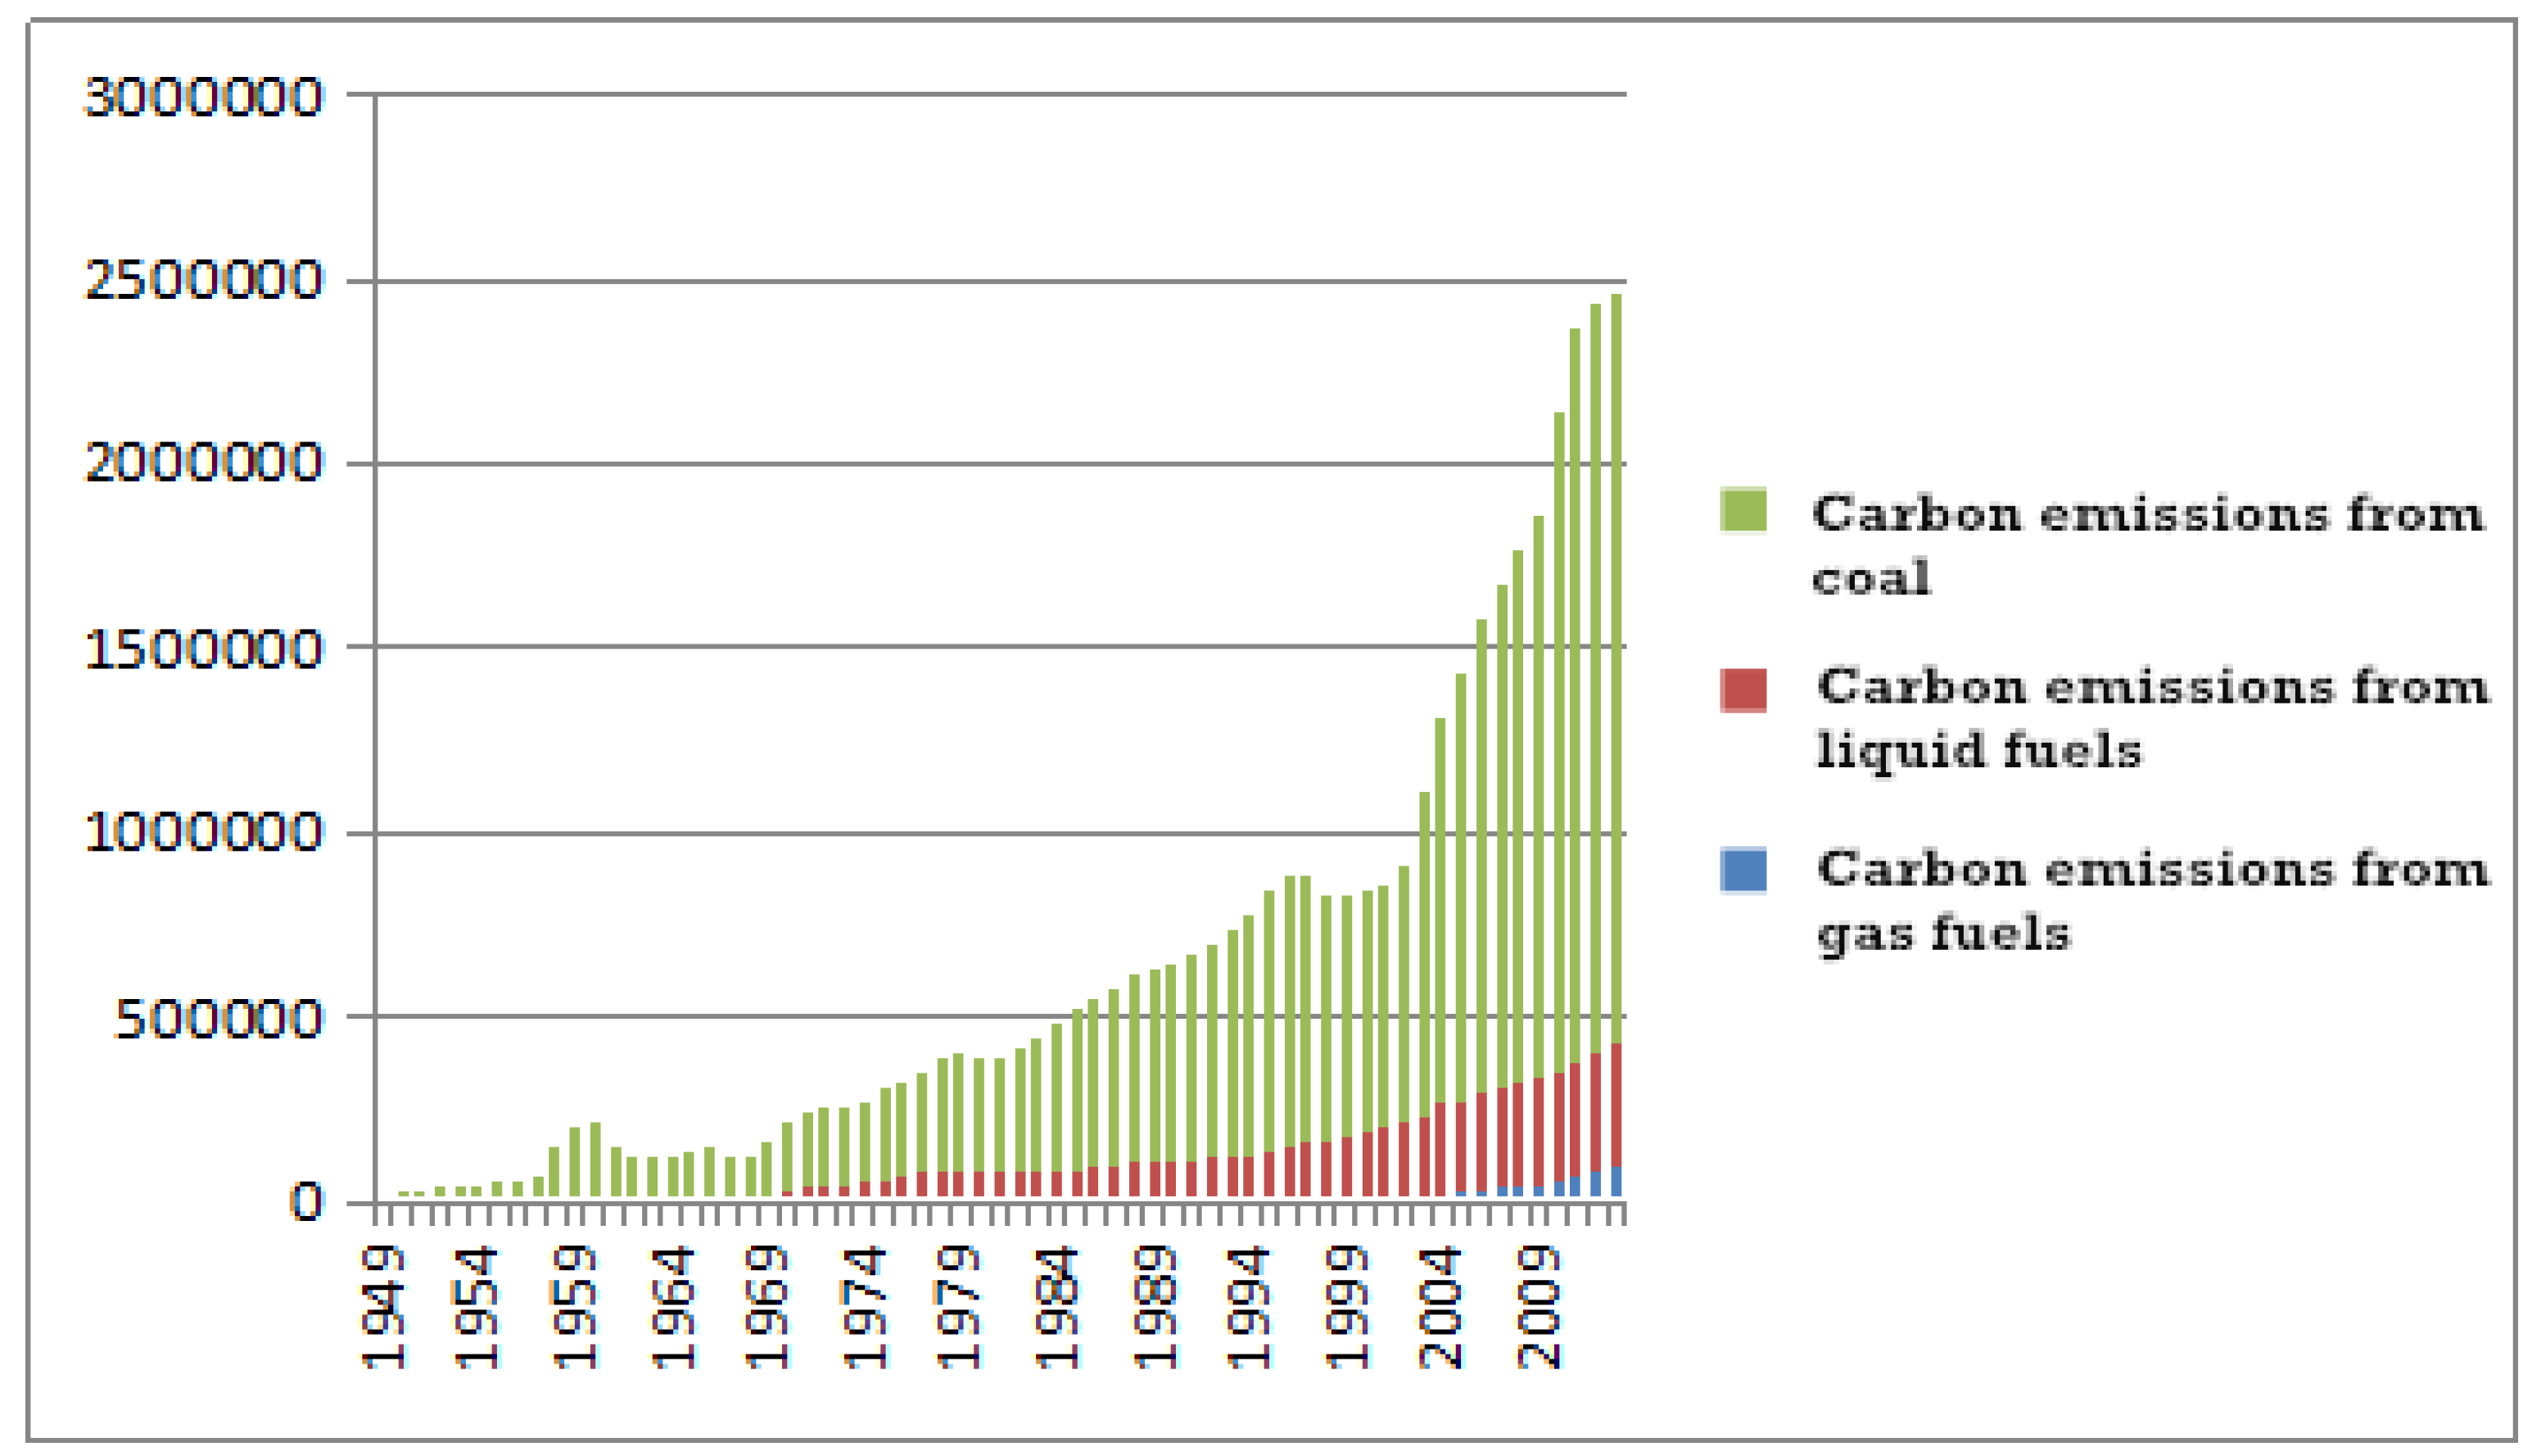
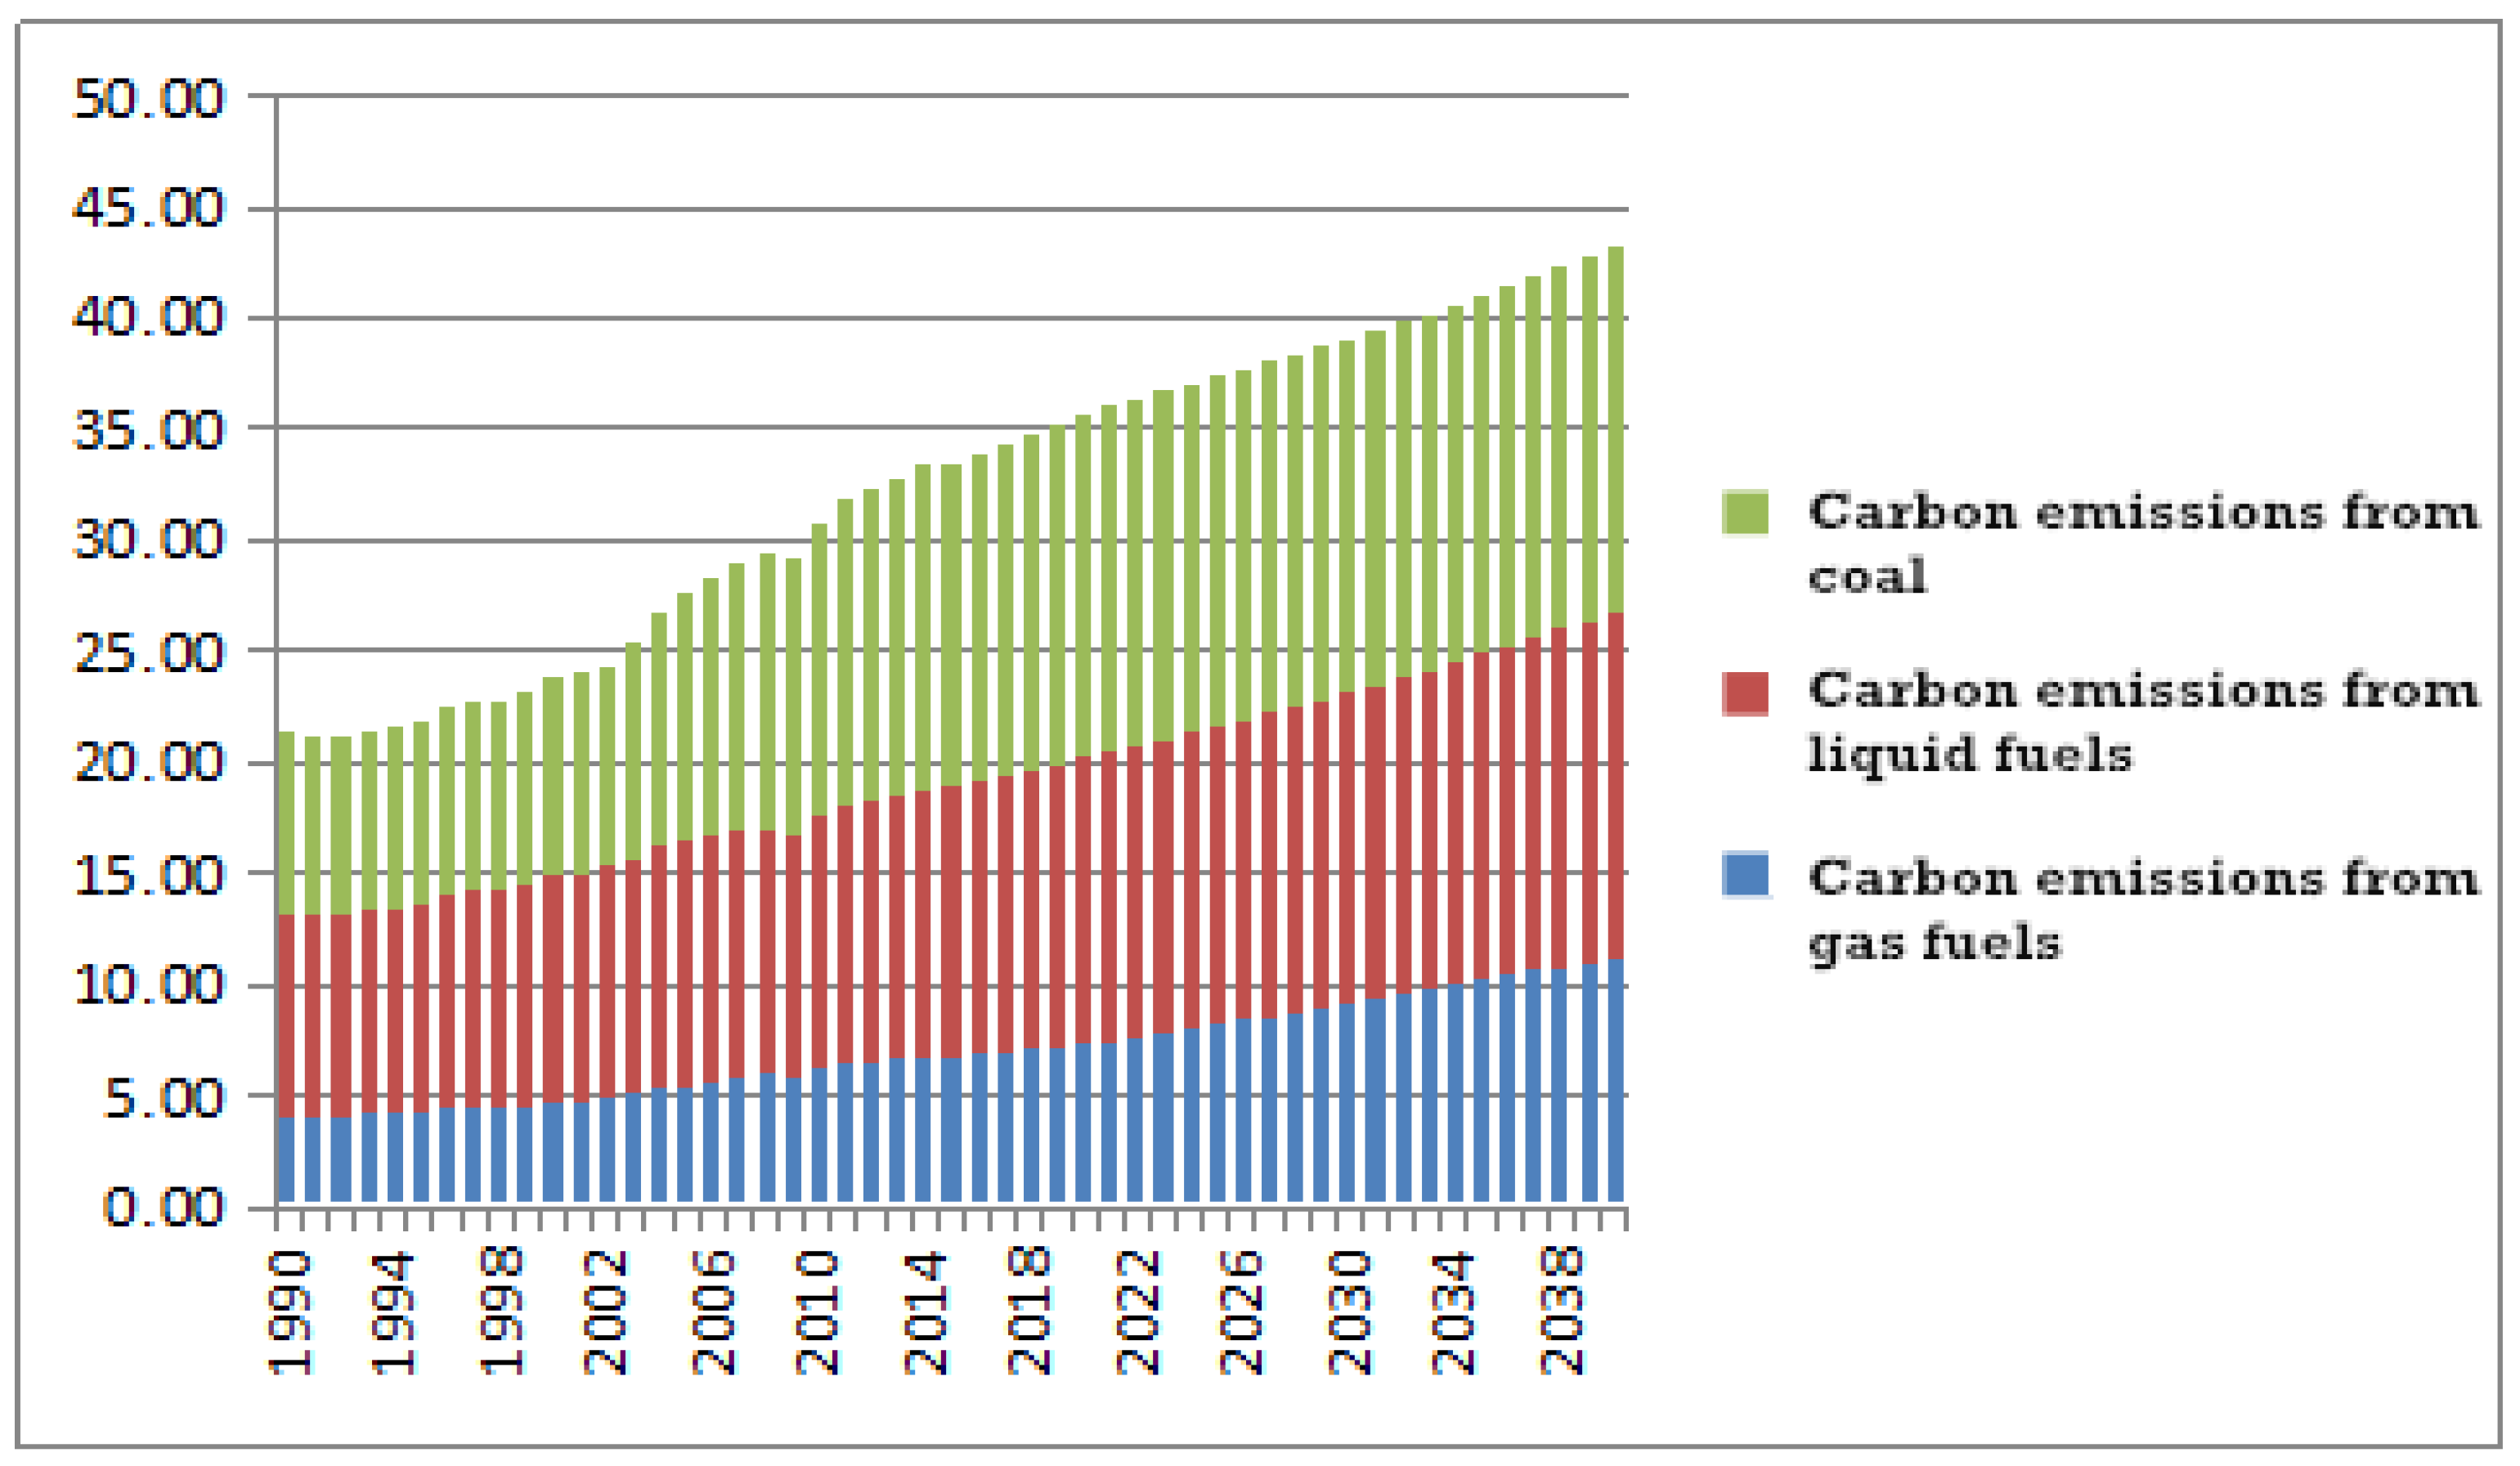
Table 1.
Scenario analysis of peak carbon emissions.
| Authors | Peak Year | GDP | Carbon Emissions | Carbon Emission Intensity | Energy Consumption | Energy Intensity | Population |
|---|---|---|---|---|---|---|---|
| (Compared to 2005 level, under BAU) | (100 Million) | ||||||
| Chai and Xu [14] | 2020 | 379.4% | 13.9 | ||||
| 2030 | 620.3% | 13.9 | |||||
| 2040 | 876.8% | 13.6 | |||||
| (Annual growth rate) | (Gt) | (Annual decreasing rate) | (Mtce) | (Annual decreasing rate) | |||
| He [12] | 2020 | 7.0% | 10.6 | 4.7% | 5250 | 3.4% | |
| 2030 | 5.0% | 11.7 | 4.2% | 6420 | 3.2% | ||
| (Billion CNY at 2005 constant prices) | (Gt) | kg/CNY | |||||
| Li et al. [30] | 2020 | 670, 665.67 | 10.9 | 0.16 | |||
| (Gt) | Change in peak year (t/CNY) | ||||||
| Liu et al. [31] | 2025 | 9.7 | 0.56 | ||||
| 2030 | 10.6 | 0.51 | |||||
| 2040 | 11.9 | 0.41 | |||||
| (Annual growth rate) | (Gt) | ||||||
| Mi et al. [28] | 2026 | ࣙ5% from 2015 to 2035 | 11.2 | ||||
| (Per capita in 2050, USD) | (Gt) | (Peaking period) | |||||
| Qu and Guo [32] | 2035 | 30,000 | 11.5 | 2030s | |||
| 2038 | 48,000 | 9.2 | 2040s | ||||
| 2042 | 18,000 | 11.6 | 2020s | ||||
| (Industrial sector under BAU, Gt) | (Mt/BY) | ||||||
| Wang et al. [16] | 2020 | 9.1 | 0.29 | ||||
| 2030 | 17.0 | 0.19 | |||||
| (Trillions of dollars) | (Trillion units) | (Kg oil equivalent/USD) | |||||
| Niu et al. [27] | 2025 | 10.2 | 2.8 | 0.32 | |||
| 2028 | 11.8 | 2.9 | 0.28 | ||||
| 2029 | 12.3 | 3.3 | 0.32 | ||||
| 2034 | 18.4 | 3.54 | 0.25 | ||||
| (Gt) | (Mtce) | (100 Million) | |||||
| Bi [29] | 2020 | 8.3 | 4260 | 14.44 | |||
| 2030 | 9.4 | 5038 | 14.65 |
Note: BAU represents Business as usual; CNY represents China Yuan; BY represents Billion Yuan; All units are same to those in the referenced papers.
© 2018 by the authors. Licensee MDPI, Basel, Switzerland. This article is an open access article distributed under the terms and conditions of the Creative Commons Attribution (CC BY) license (http://creativecommons.org/licenses/by/4.0/).
Share and Cite
MDPI and ACS Style
Dong, F.; Hua, Y.; Yu, B. Peak Carbon Emissions in China: Status, Key Factors and Countermeasures—A Literature Review. Sustainability 2018, 10, 2895. https://doi.org/10.3390/su10082895
AMA Style
Dong F, Hua Y, Yu B. Peak Carbon Emissions in China: Status, Key Factors and Countermeasures—A Literature Review. Sustainability. 2018; 10(8):2895. https://doi.org/10.3390/su10082895
Chicago/Turabian StyleDong, Feng, Yifei Hua, and Bolin Yu. 2018. "Peak Carbon Emissions in China: Status, Key Factors and Countermeasures—A Literature Review" Sustainability 10, no. 8: 2895. https://doi.org/10.3390/su10082895
Note that from the first issue of 2016, this journal uses article numbers instead of page numbers. See further details here.