Review

A Systematic Review of Smart Real Estate Technology: Drivers of, and Barriers to, the Use of Digital Disruptive Technologies and Online Platforms

Faculty of the Built Environment, University of New South Wales, Kensington, 2052 Sydney, Australia
*
Author to whom correspondence should be addressed.
Sustainability 2018, 10(9), 3142; https://doi.org/10.3390/su10093142
Submission received: 15 August 2018 / Revised: 28 August 2018 / Accepted: 30 August 2018 / Published: 3 September 2018
(This article belongs to the Special Issue Real Estate Economics, Management and Investments)

Abstract

:
Real estate needs to improve its adoption of disruptive technologies to move from traditional to smart real estate (SRE). This study reviews the adoption of disruptive technologies in real estate. It covers the applications of nine such technologies, hereby referred to as the Big9. These are: drones, the internet of things (IoT), clouds, software as a service (SaaS), big data, 3D scanning, wearable technologies, virtual and augmented realities (VR and AR), and artificial intelligence (AI) and robotics. The Big9 are examined in terms of their application to real estate and how they can furnish consumers with the kind of information that can avert regrets. The review is based on 213 published articles. The compiled results show the state of each technology’s practice and usage in real estate. This review also surveys dissemination mechanisms, including smartphone technology, websites and social media-based online platforms, as well as the core components of SRE: sustainability, innovative technology and user centredness. It identifies four key real estate stakeholders—consumers, agents and associations, government and regulatory authorities, and complementary industries—and their needs, such as buying or selling property, profits, taxes, business and/or other factors. Interactions between these stakeholders are highlighted, and the specific needs that various technologies address are tabulated in the form of a what, who and how analysis to highlight the impact that the technologies have on key stakeholders. Finally, stakeholder needs as identified in the previous steps are matched theoretically with six extensions of the traditionally accepted technology adoption model (TAM), paving the way for a smoother transition to technology-based benefits for consumers. The findings pertinent to the Big9 technologies in the form of opportunities, potential losses and exploitation levels (OPLEL) analyses highlight the potential utilisation of each technology for addressing consumers’ needs and minimizing their regrets. Additionally, the tabulated findings in the form of what, how and who links the Big9 technologies to core consumers’ needs and provides a list of resources needed to ensure proper information dissemination to the stakeholders. Such high-quality information can bridge the gap between real estate consumers and other stakeholders and raise the state of the industry to a level where its consumers have fewer or no regrets. The study, being the first to explore real estate technologies, is limited by the number of research publications on the SRE technologies that has been compensated through incorporation of online reports.

1. Introduction

Real estate, globally, has attracted huge financial investment in recent years. Since 2012, real estate technology based companies have raised almost $6.4 billion in funding across 817 deals in the United States alone [1]. Real estate technology is defined as the hardware gadgets, online platforms and software tools used by different participants in the real estate industry, including real estate-focused lenders, brokers, property owners, investors, and managers, as well as the consumers to collect and distribute data related to the real estate industry [1]. However, as the report of CB-Insights [2] and Warburton [3] points out, the global industry is lagging the technology curve by five years, a point also made by Ferren Bran at the RealCOMM conference [4]. Contrary to its industrial counterparts, almost a third of the global real estate industry, worth $11 trillion, is managed on spreadsheets; innovative information technology (IT) tools are missing in action. Yet innovative and disruptive technologies are an integral part of the modern world [5]. Disruptive technologies, a term coined by Professor Clayton Christensen and colleagues, are defined as a set of technologies that displaces the existing methods or technologies and shakes up the industry to open new avenues for innovation and business development [6]. On the one hand, they are revolutionising the modern world; on the other, they present a challenge for traditional industries such as construction and real estate. While such digital technologies are vital for an industry’s growth, their adoption and usage are always questioned, perhaps due to their disruptive nature [7]. As a result, disruptive technologies have been reviewed and assessed in various industries according to such criteria as computer education and students’ perspectives [8], radical technology development in value-added supply chains [9], enhancing learners’ experience in massive open online courses [10], risk management using disruptive technologies [11], social relations in higher education [12], clinical trials [13] and others. The stated studies provide useful insights into how disruptive technologies may be applied, but until now their application to real estate has not been reviewed [14]. The current study reviews the potential application of various disruptive technologies to real estate to highlight their importance, current uses and applications, and how they can be used to address the needs of real estate stakeholders.
A growing concern for the industry is the increase in post-purchase or post-rental regrets that consumers have been reporting [15]. According to Trulia [15], 44 per cent of real estate consumers (almost one in two) regret their purchase or rent decision. The main causes of these regrets are a lack of information about properties and the complexity of the purchase process, whereby key information including fees remains hidden. When consumers later discover such details or fees, their regrets are compounded. Chen et al. [16] argue that 30 per cent of Chinese residential consumers and 46 per cent of homebuyers regret their decisions; their detailed investigation highlighted a key cause of regret as being a lack of information. Similarly, Marte [17] says that 22 per cent of respondents to a survey quoted a lack of information as a key cause of regret. Such regrets can be eliminated or reduced by drawing on disruptive technologies to furnish consumers with sufficient, detailed information before they make real estate decisions. This could tackle the problem of post-purchase regret. This study, therefore, aims to explore the adoption of various disruptive technologies and their potential usefulness in providing detailed information to consumers, so minimising regrets.
This paper investigates the potential of different disruptive technologies in the real estate sector and utilizes the Big9 technologies to address the key regrets of real estate stakeholders. A special focus is on the regrets related to lack of information that may be addressed through proper utilization of the Big9 technologies. Therefore, the paper introduces the term SRE and reviews key factors that convert traditional real estate into SRE, with the focus on technology and online platforms. Therefore, this paper: (1) reviews the technological aspects of SRE—its user centredness, sustainability and technological innovation; (2) explores online dissemination platforms such as websites, smartphone technologies and social media; (3) identifies real estate stakeholders and investigates their needs and interactions; (4) identifies the Big9 technologies and performs an opportunities, potential losses and exploitation levels (OPLEL) analysis for each technology; (5) integrates the Big9 technologies, dissemination platforms and stakeholder needs through a holistic technology adoption model (TAM) framework that incorporates them into online real estate platforms and results in greater consumer satisfaction as well as reduced regrets. This paper offers insights into: the key components of smart real estate management (SREM) (distinguishing it from traditional, rigid real estate management); disruptive Big9 technologies and their use for addressing a lack of information provided to consumers; and stakeholder needs and the dissemination of information to them through a conceptual TAM framework.

1.1. Technological Disruption and Innovation in the Real Estate Industry

Although the global real estate industry has fallen behind the curve of information technology (IT)-based innovation, instead relying on traditional transaction methods, investment in real estate technologies is on the rise. This shows the business appeal of the industry to investors and potential clients. For evidence, look at the $1.5 billion global investment in 2015 and the $1.6 billion invested in the first half of 2016. In this context, the US is seen as the centre of commercial real estate and its technological advance [18]. A report published by Forum [19] compared countries on seven criteria related to technological advance and adoption capability. These included: network readiness, which measures the capacity of countries to leverage internet and communication technologies (ICT) for increased competitiveness and wellbeing; the availability of the latest technologies such as mobile 4G, 5G and Big Data incorporation; individuals using the internet; firm-level technology absorption; the capacity for innovation; business-to-consumer internet use, and government success in ICT promotion. Table 1 shows how the US, Britain and Australia rank among 139 countries according to these seven criteria. These three countries were selected because data was available for each criterion; other countries lacked some data. Table 1 shows the clear dominance of the US in terms of technological advancement and readiness for innovation. But Britain leads when it comes to individual use of the internet, business-to-customer internet use and government success in ICT promotion. The rankings show the overall position of the countries among the 139 investigated. The value is out of seven and shows the extent to which a criterion is being adopted in the studied country. Overall, the top three countries for technology adoption readiness as the report states are Singapore, Finland and Sweden respectively. All the values were obtained through a global questionnaire; the assessment was based on how the respondents scored to attain a holistic value. The values show that the US, Britain and Australia are leveraged to adopt and implement the latest technologies. The findings also highlight the likelihood of obtaining benefits from an investment in these countries, specifically in relation to online real estate. These benefits are more likely because internet-based innovations have been implemented successfully and there exists a readiness to adopt them. Positive government strategies further incentivise investors, explaining why nations such as the US are attracting huge investments (as evident from the $6.4 billion in funding that has flowed its way since 2012). Among the countries studied, the US ranks the highest on most criteria followed by Britain and Australia respectively.
Such big investments and the readiness of some countries to embrace technological disruption encourage the movement towards smart real estate (SRE) that is more sustainable and augmented by technology. Various real estate start-ups have emerged as technological tycoons, including Trulia [20], Zillow [14] and Redfin and Trulia [20,21]. Ms Pitman, working with the smart city-focused CityConnect program in Australia, quotes start-ups Zillow, WeWork and Airbnb as key enablers of SRE and smart cities. She says technological solutions to real estate problems are at the core of the smart-city revolution. City densification and the jobs they accumulate make real estate technology and built-environment solutions more critical to good city functioning. By improving market transparency, adapting to evolving customer desires, facilitating speedier transactions and enhancing asset utilisation, as well as regulatory requirements [22], the industry can reduce friction in the market.

1.2. Smart Real Estate (SRE): Definition, Core Components, Technologies and Stakeholders

Innovative technologies and their use are common to smart cities and the real estate industry. Technology has always been an indicator of smartness [23]. A key determinant of the “smart city” globally is whether it adopts the latest disruptive technologies [24]. A smart city uses various collections of electronic data as well as technologically advanced sensors to manage its assets and resources efficiently [25]. While technologies change over time, becoming more complex, it is the adoption capability and its open, innovative nature that makes a city, or real estate, smart [5,26,27]. Thus, smart cities need SRE and smarter management to succeed. So, it is imperative to develop assessment criteria for SRE in order to turn the dream of the smart city into reality.
SRE, like smart cities, can be assessed according to various parameters. In the absence of a globally accepted definition of SRE, the current review looks at relevant studies to develop a definition. Allameh et al. [28] say user-centredness is a key component, and a virtual reality-based experiment elicits user preference for buying or using a smart home. Miller et al. [29] stress that sustainability is required if real estate is to become smarter and attract greater global investment. Miller [30] stresses innovation and says the industry needs to demonstrate its smarts by enlisting virtual showcases, crowdfunding, AI, smart homes, online marketplaces and smartphone apps. Shulman [31], in speaking of the technological needs of Smart Real Estate, presents the example of Airbnb, highlighting that it raised $10 billion in early 2014 and therefore gained greater market capital than such well-known hotels as the Hyatt. Summarising these findings and studies, this review defines SRE as: “A property or land that uses various electronic sensors to collect and supply data to consumers, agents and real estate managers that can be used to manage assets and resources efficiently. The key features are user-centredness, sustainability and the use of innovative and disruptive technologies in such a way as to attain holistic benefits that are otherwise not attainable”.
A boom in the demand for “sustainability” and “smartness” has led to these terms often being used in conjunction. Cities contribute more than 70 per cent of world greenhouse gases while occupying only 2 per cent of global land area. Changes in climatic conditions, such as rising sea levels and global urbanisation, call for more ecofriendly buildings. It has been estimated that by 2020 all buildings in countries with advanced economies will have a sustainability rating [32]. This need for sustainability requires due attention. Real estate, valued at $215 billion in 2015 and rising, attracts investors because of its return potential. If it is to continue attracting investors, it needs to be sustainable [29]. By 2020, investable real estate will have risen by more than 55 per cent since 2012 [32]. While “going green”, “clean energy”, and “building for the future” are critical concepts, sustainability holds a key position in SRE.
Smart real estate management refers to the cumulative management of SRE that keeps the core principles of innovative technology adoption, sustainability and user-centredness at its core. This is not only restricted to infrastructure but includes asset and resource management. In a similar vein to smart cities and disruptive innovations, SREM’s key technologies include drones, the internet of things (IoT), clouds, software, big data, 3D scanning, wearable technologies, virtual and augmented realities (VR and AR), and artificial intelligence (AI) and robotics [30]. These technologies, referred to as the Big9, are critical to SRE and are the focus of the reviews undertaken in this study. Other technologies may exist in addition to these Big9 technologies in other fields such as cryptocurrencies, 4G and 5G networks, Water harvesting from air, high speed travels, self-driving cars, renewable energies, medical innovations and others as provided in the 100 latest disruptive technologies report by Richard of the What’s Next: Top Trend website [33]. The current study considers only the Big9 technologies mainly due to their established or published potential in the real estate sector. The remaining are not included in the study since these are either irrelevant to the SRE sector or, are too nascent to be analysed for their applications. Some key concepts, definitions and explanations pertinent to SRE, its technologies and stakeholders are given in Table 2.

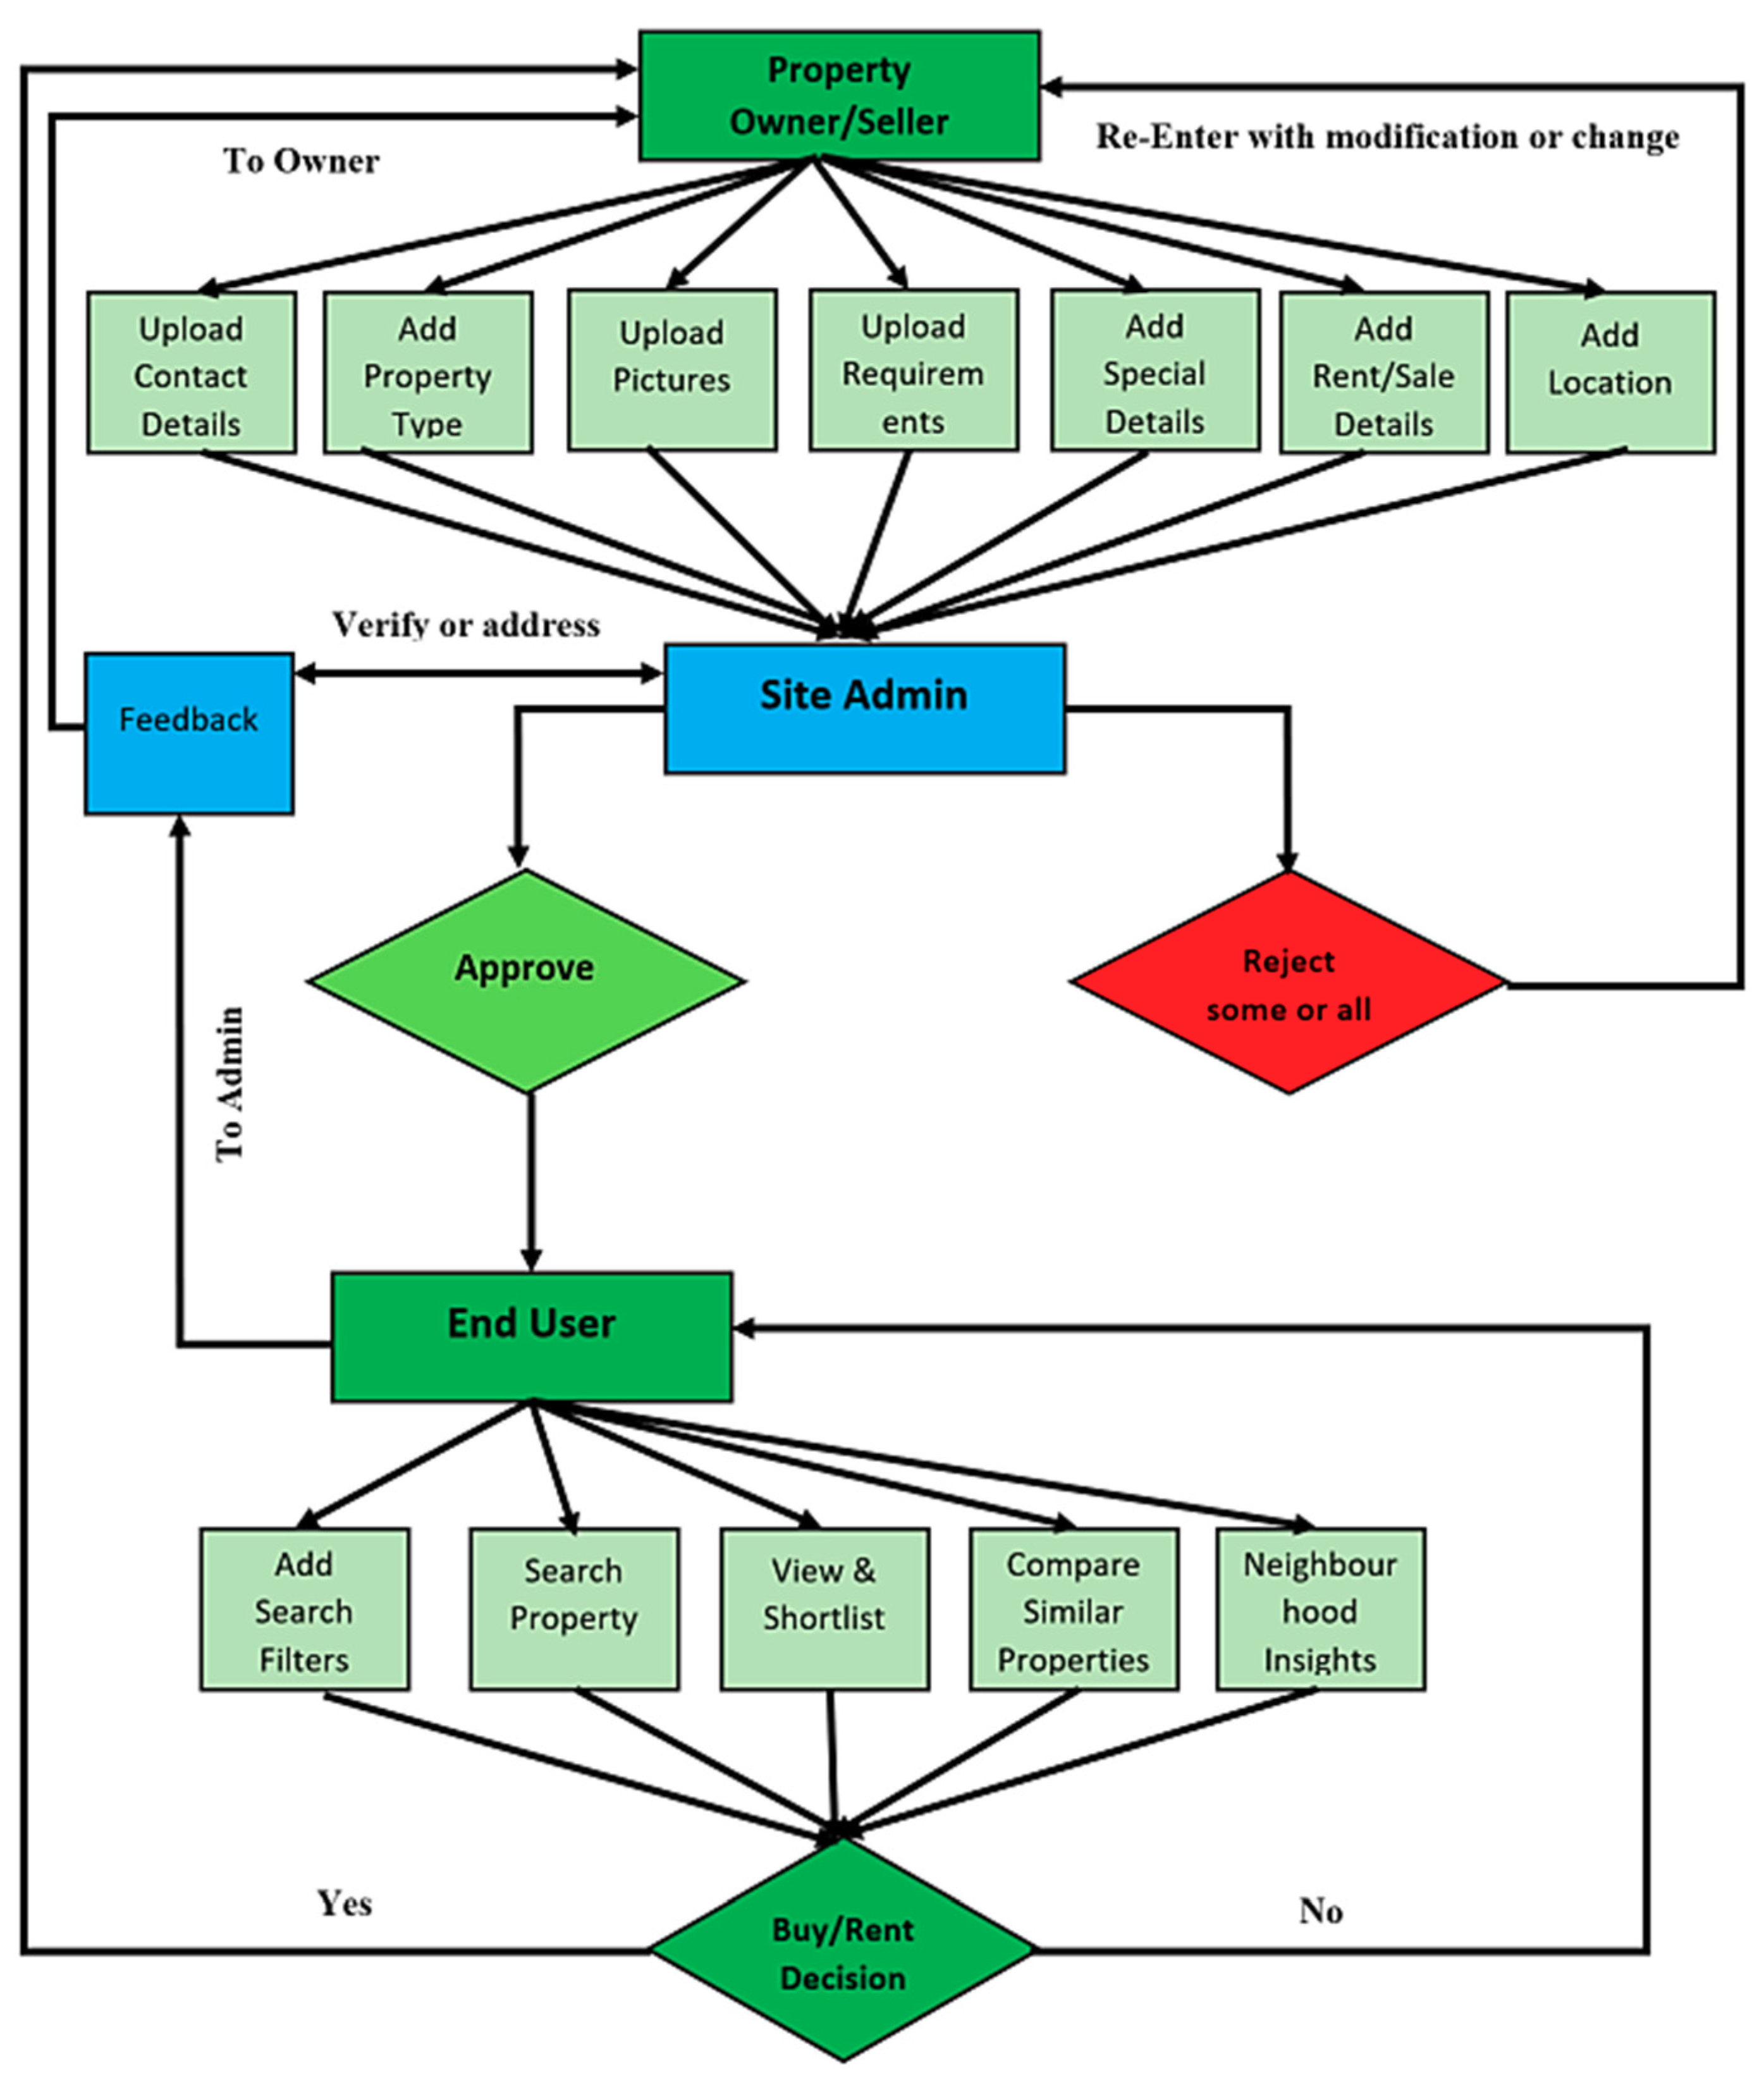
1.3. Online Rent or Buy Process

The stakeholders described in Table 2 have various needs and requirements that can be addressed by Big9 technologies. For example, big data analytics can address the consumer’s need for neighbourhood information. Such technologies should have a role in the search process when a potential consumer looks for properties to shortlist. Figure 1 shows a typical property search from the moment that a seller/owner uploads property detail. The website administrator may then accept the search terms or seek their modification, and properties are eventually presented to the consumer who wants to rent or purchase one.
Although the scope of SRE is vast and covers many domains, the current study focuses on buyer-seller interactions and the disruptive technologies that can improve them. Based on a review of literature about online real estate searches, such as the work of Grant and Cherif [46], Rae and Sener [47], and Rae [48], consumers’ online behaviour can be summarised by Figure 1. It illustrates the mechanism for posting a property online and how potential consumers search, view and select properties. It also shows a number of requirements for a property to be posted online.
In a high-tech, SRE environment, sophisticated platforms are required to disseminate property information to consumers, who comprise the payers in the real estate industry. Disruptive technologies such as neighbourhood analytics derived from big data and VR-based virtual tours are usually disseminated online for the benefit of consumers. Online platforms that disseminate SRE technology include websites, smartphone technologies such as apps, and social media such as Facebook, Instagram, WhatsApp and YouTube. Zillow uses websites to provide prices for existing properties and predict new prices in any given neighbourhood through its “Zestimate” function. Other information that can be delivered online includes crime rates, walking scores and transit scores that tell consumers the safety, walkability and ease of travel in a particular neighbourhood [49].
Real estate agents use online platforms to present their properties to potential buyers or renters. The information they provide can prevent consumer regrets that arise from ill-informed decisions and so reduce the post-purchase friction between agents and consumers.
Once a website’s requirements are completed, an administrator can approve or reject some or all the features. In the case of rejection, the owner must modify the property or its details, or upload missing components. In the case of approval, the property becomes visible to potential buyers or renters. Consumers use online filters to find properties that meet their requirements. The website displays properties that match these requirements and generates a shortlist or selection. Consumers can also provide feedback or demand further information of the property owner. In the latter case, the request is sent first to the administrator, after whose approval it is forwarded to the property owner and vice versa before a deal is finalised. Thus, while technology is important, the dissemination mechanism occupies a critical position.
Dissemination mechanisms and technological adoption go hand-in-hand, since proper dissemination encourages adoption and vice versa [49,50]. Adoption is the incorporation of technology by accepting and subsequently using it for various functions. Technology is adopted properly and made available to end users using a TAM. TAM has been employed to integrate technologies and IT-based dissemination platforms. It links the technologies to be disseminated through proper adoption while keeping user satisfaction at its core [51,52]. In the current study, a TAM framework is proposed to meet stakeholder needs through various disruptive technologies.

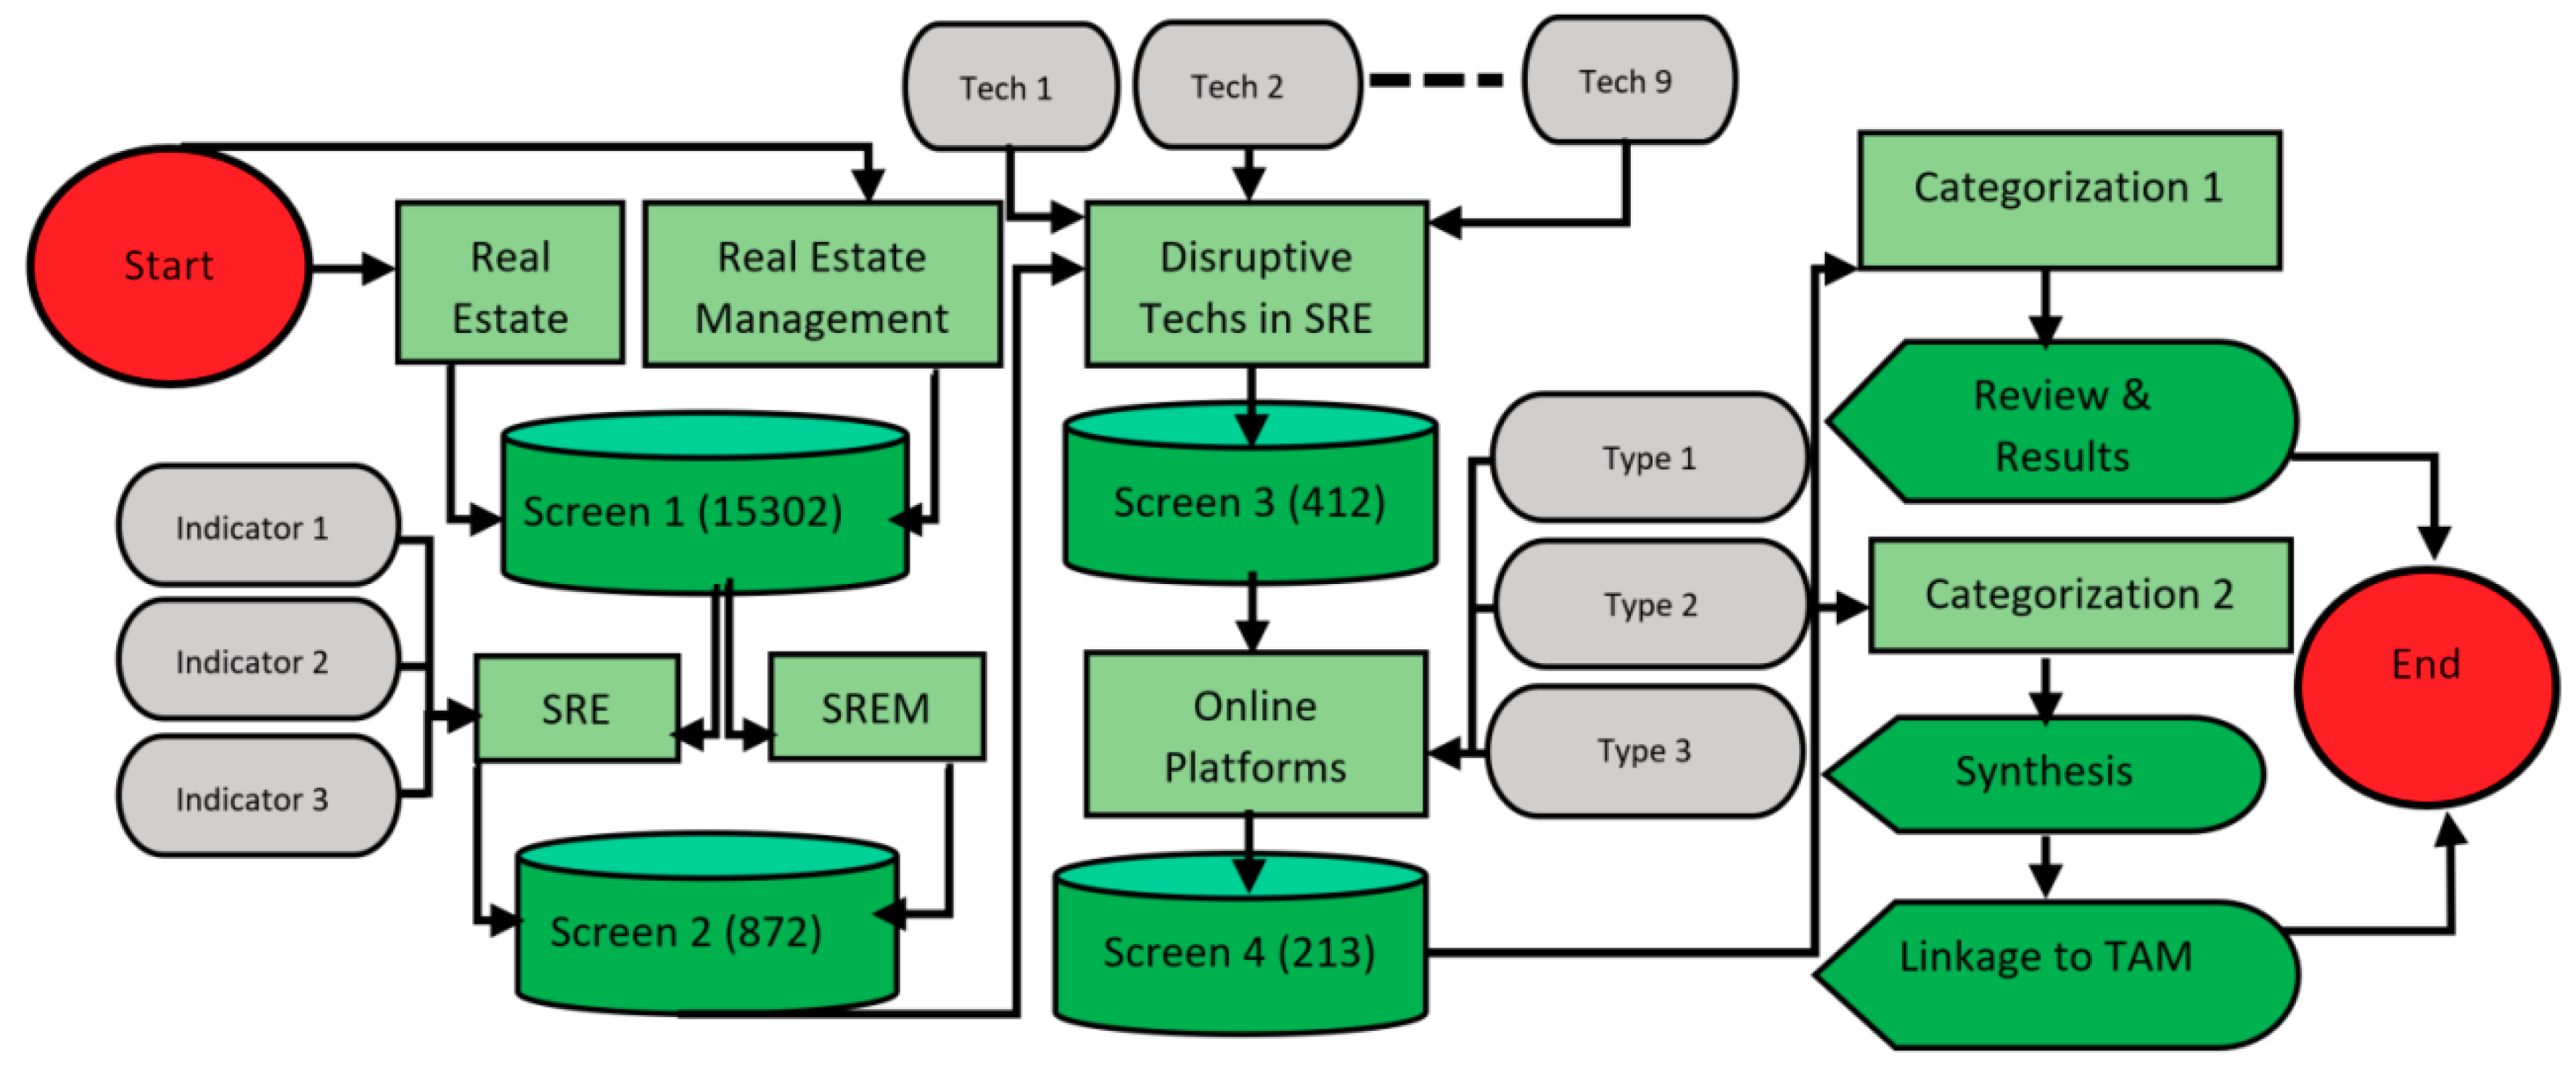
2. Materials and Methods

To begin with, this paper systematically reviews the published literature on real estate and its technologies, which the authors gathered through online search engines such as Google Scholar, ASCE Library, Scopus, Web of Science and others. Both keyword and semantic searches were used to search the literature. The selected literature was then categorised into core components of SRE, dissemination mechanisms and Big9 technologies. OPLEL were tabulated for each of the Big9 technologies. The basic and secondary needs of four key real estate stakeholders—consumers, agents and associations, government and regulatory authorities and complementary industries—were highlighted through an SRE stakeholder analysis. Next, an analysis involving how (process, need and mechanism), what (technology), and who (stakeholder) highlights the use of technology in addressing stakeholder needs with special focus on reducing consumers’ regrets. Additionally, the paper discusses data collection and the dissemination framework. Finally, it hypothetically links identified technologies and stakeholder needs with traditional TAM drivers to hypothesise a conceptual framework for the adoption of technology in real estate.
The method used in this study comprises keyword searches, screenings and categorisation. Keyword searches used the terms “Real Estate”, “Real Estate Technologies”, “Smart Real Estate”, “Real Estate Technology Adoption”, “Technology Dissemination in Real Estate”, “Information Dissemination in Real Estate” and “Smart Real Estate Management”. Search tools included popular and powerful search engines such as Google Scholar, the American Society of Civil Engineers (ASCE) library, Taylor & Francis Online, Emerald Insight, Science Direct, Web of Science and Scopus databases. The search process involved keyword and Symantec searches where key phrases such as “role of technology in real estate” were applied. Identical keywords and associations between them were used to search each database. For example, “Real Estate Tech OR Real Estate Technology OR Disruptive Technologies in Real Estate OR Smart Real Estate OR Real Estate Technology Acceptance OR Real Estate Technology Adoption” AND “Information dissemination OR Web based dissemination OR Apps for dissemination” AND “NOT information retrieval”. The search strings were carefully designed to exhaust each database, as shown in Table 3.
All the selected articles were written in English and articles in the form of editorials, notes, errata, letters or comments were excluded. A total of 139 articles matched the search parameters: 47 from Web of Science, 40 from Scopus and 52 from Google Scholar and others. Overall, Google Scholar yielded the highest number of results, with 6542 articles, followed by Web of Science with 5896 and Scopus with 5761. After applying the search filters, Google Scholar yielded 1300 results, and after adjusting for duplicates and restrictions this fell to 52. Similarly, for Web of Science and Scopus, the corresponding results were 1142 and 407, which were restricted to 47 and 40 respectively. The leading reasons for rejecting or excluding the articles from the review were the outdated focus (pre-2010), non-focus, and non-presence of the keywords in the title or abstract, non-English language and duplications.
Figure 2 details the search mechanisms used in this study. The screens refer to the results obtained from the search engines mentioned above; new additions relate to either a keyword used in conjunction with a previously used keyword or a new search engine/database. Such screening has been used: to extract literature pertinent to clinical information [53], in social science literature reviews [54], and for PRISMA analysis that incorporates systematic reviews and meta-analysis to extract preference-based information [55]. The purpose of the screen here is to omit irrelevant information in accordance with the study objectives and to keep a tight focus on disruptive technologies in SRE. Four screens were used, in which Screen 1 limits the literature to real estate, Screen 2 in general limits the literature to SRE, Screen 3 adds the technology aspect to the literature and Screen 4 adds aspects of online dissemination.
Screen 1, for example, yielded 15,302 results for real estate and real estate management that were too generic; only a few of those papers focused on technology in real estate. As a result, the keyword “smart” was used in Screen 2 to yield 872 papers that focused on SRE and SREM. A review of relevant studies highlighted three indicators of SRE, including user centredness, sustainability and innovative technologies. These three are represented by indicators 1 to 3 in Figure 2. They provided key terms for searching and subsequent screening in Screen 2. From there, the focus was refined and reduced to disruptive technologies, taking a leap from the “technology” indicator. Nine key disruptive technologies (the Big9) provided the search focus using the defined databases in Screen 3 and yielded 412 results. These Big9 technologies clustered around three domains—data mining, networking, and hardware. They include: drones, IoT, big data, 3D scanning, VR and AR, software as a service (SaaS), clouds, AI and robotics, and wearable tech. Thus Screen 3 used these Big9 technologies as keywords and so the results were refined further. Turning the focus to online technologies, three types of dissemination platforms were investigated to highlight the use of the online technologies mentioned and to observe the dissemination mechanisms. The three platforms in focus were websites, smartphone applications, and social media. These three platforms were used as keywords in Screen 4, yielding 213 relevant results.
The screening process revealed that very few papers exist on the subjects in focus. Therefore, to augment the number of relevant publications, the search was enhanced to include online reports, webpages and magazines. As a result, 213 relevant publications were retrieved in total. This enhancement was deemed necessary because the final selection of 139 papers (as shown in Table 3) had not covered some aspects of SRE and its technologies. This was due mainly to a dearth of literature on specific technologies and the nascency of SRE. The scope of the study had to be widened, and this was achieved through the inclusion of reports and webpages. To tackle the process of reinventing the wheel, papers published before 1 January 2010 were discarded. This kept the focus on recent disruptive technologies. The exception to this rule was the inclusion of several earlier articles that contained basic definitions and so prevented extravagant claims or the reinvention of key terms.
Once the 213 relevant publications from all sources had been retrieved, two types of categorisations were performed. Categorisation 1 focused on three key criteria: SRE core components, marketing and business, and information dissemination systems. Technology is a core component of SRE. It has been studied in three distinct domains—networking tools, data mining technologies, and data collection technologies—each with Big9 technologies as sub domains. Thus, a total of nine technologies were in focus, and OPLEL tabulations were performed for each. Publications were reviewed accordingly, and the results are compiled in the results section of this study. These publications were reviewed by all the authors and combined to discern the holistic essence of the retrieved publications. Additionally, to tackle the authors bias, multiple rounds of reviews were carried out. In each round, the articles shortlisted by one author were reviewed by the others and its relevance verified for inclusion in the shortlist. Thus, three rounds of review were conducted where all the retrieved publications were reviewed by the authors and its inclusion in the study justified. This process not only focused the inclusion of publications in the review process but was extended to the findings as well. Thus, all the shortlisted publications and their findings were cross-verified by all authors.
Categorisation 2 linked key SRE technologies with the tasks or processes performed through them using stakeholder analysis for enhancing SRE and SREM. Thus, key stakeholders affected by these technologies are the focus of categorisation 2, which deals with the what (technology), who (stakeholder) and how (needs and processes) of each technology as well as pertinent examples and uses in the field.

3. Search Results and Selected Publications

Synthesising the 213 retrieved publications began by categorising them and counting them according to categorisation 1 (Big9 technologies). Three types of publication were distinguished: journal/conference papers, online source publications, and others (for example, books and theses). Journal/conference publications were categorised as technology, case study or review-based papers. Online sources were distributed into reports and webpages. The “others” category comprised of thesis and book chapters.
The synthesis based on these divisions is shown in Table 4, which allots the publications to each of the mentioned categories. The “general” column refers to publications on real estate and “technologies” in general; these cannot be categorised into a specific technology. The MultiTech column lists publications that discuss two or more technologies. Starred cells represent papers counted as MultiTech papers. For example, two papers discuss multiple technologies: one each for big data and IoT. Thus 2* means there are two such papers, and the big data and IoT columns are starred accordingly to highlight where these papers have been counted. It must be noted that MultiTech papers are counted as single publications to avoid doubling, as represented by the starred cells.
Because of the breakdown in Table 4, the total portion of journals/conferences, online sources and others is 65.3 per cent, 29.1 per cent, and 5.6 per cent respectively. Thus, in line with academic publications, the retrieved publications are dominated by journal/conference-based research publications. Technology-based papers represent the highest share of papers, which aligns with the aims of this study.
It is also noted that very few review papers exist on individual disruptive technologies, and no other study to date has covered these. The proportion of review papers focusing on individual technologies among the studied literature here is 5.6 per cent, which indicates a lack of review focus in this area. Furthermore, technologies such as IoT, VR and AR, wearable tech and SaaS have not been covered by comprehensive reviews, as shown by the results of the current study’s search method. Therefore, the Big9 technologies as they apply to the real estate domain have fallen through a review gap.

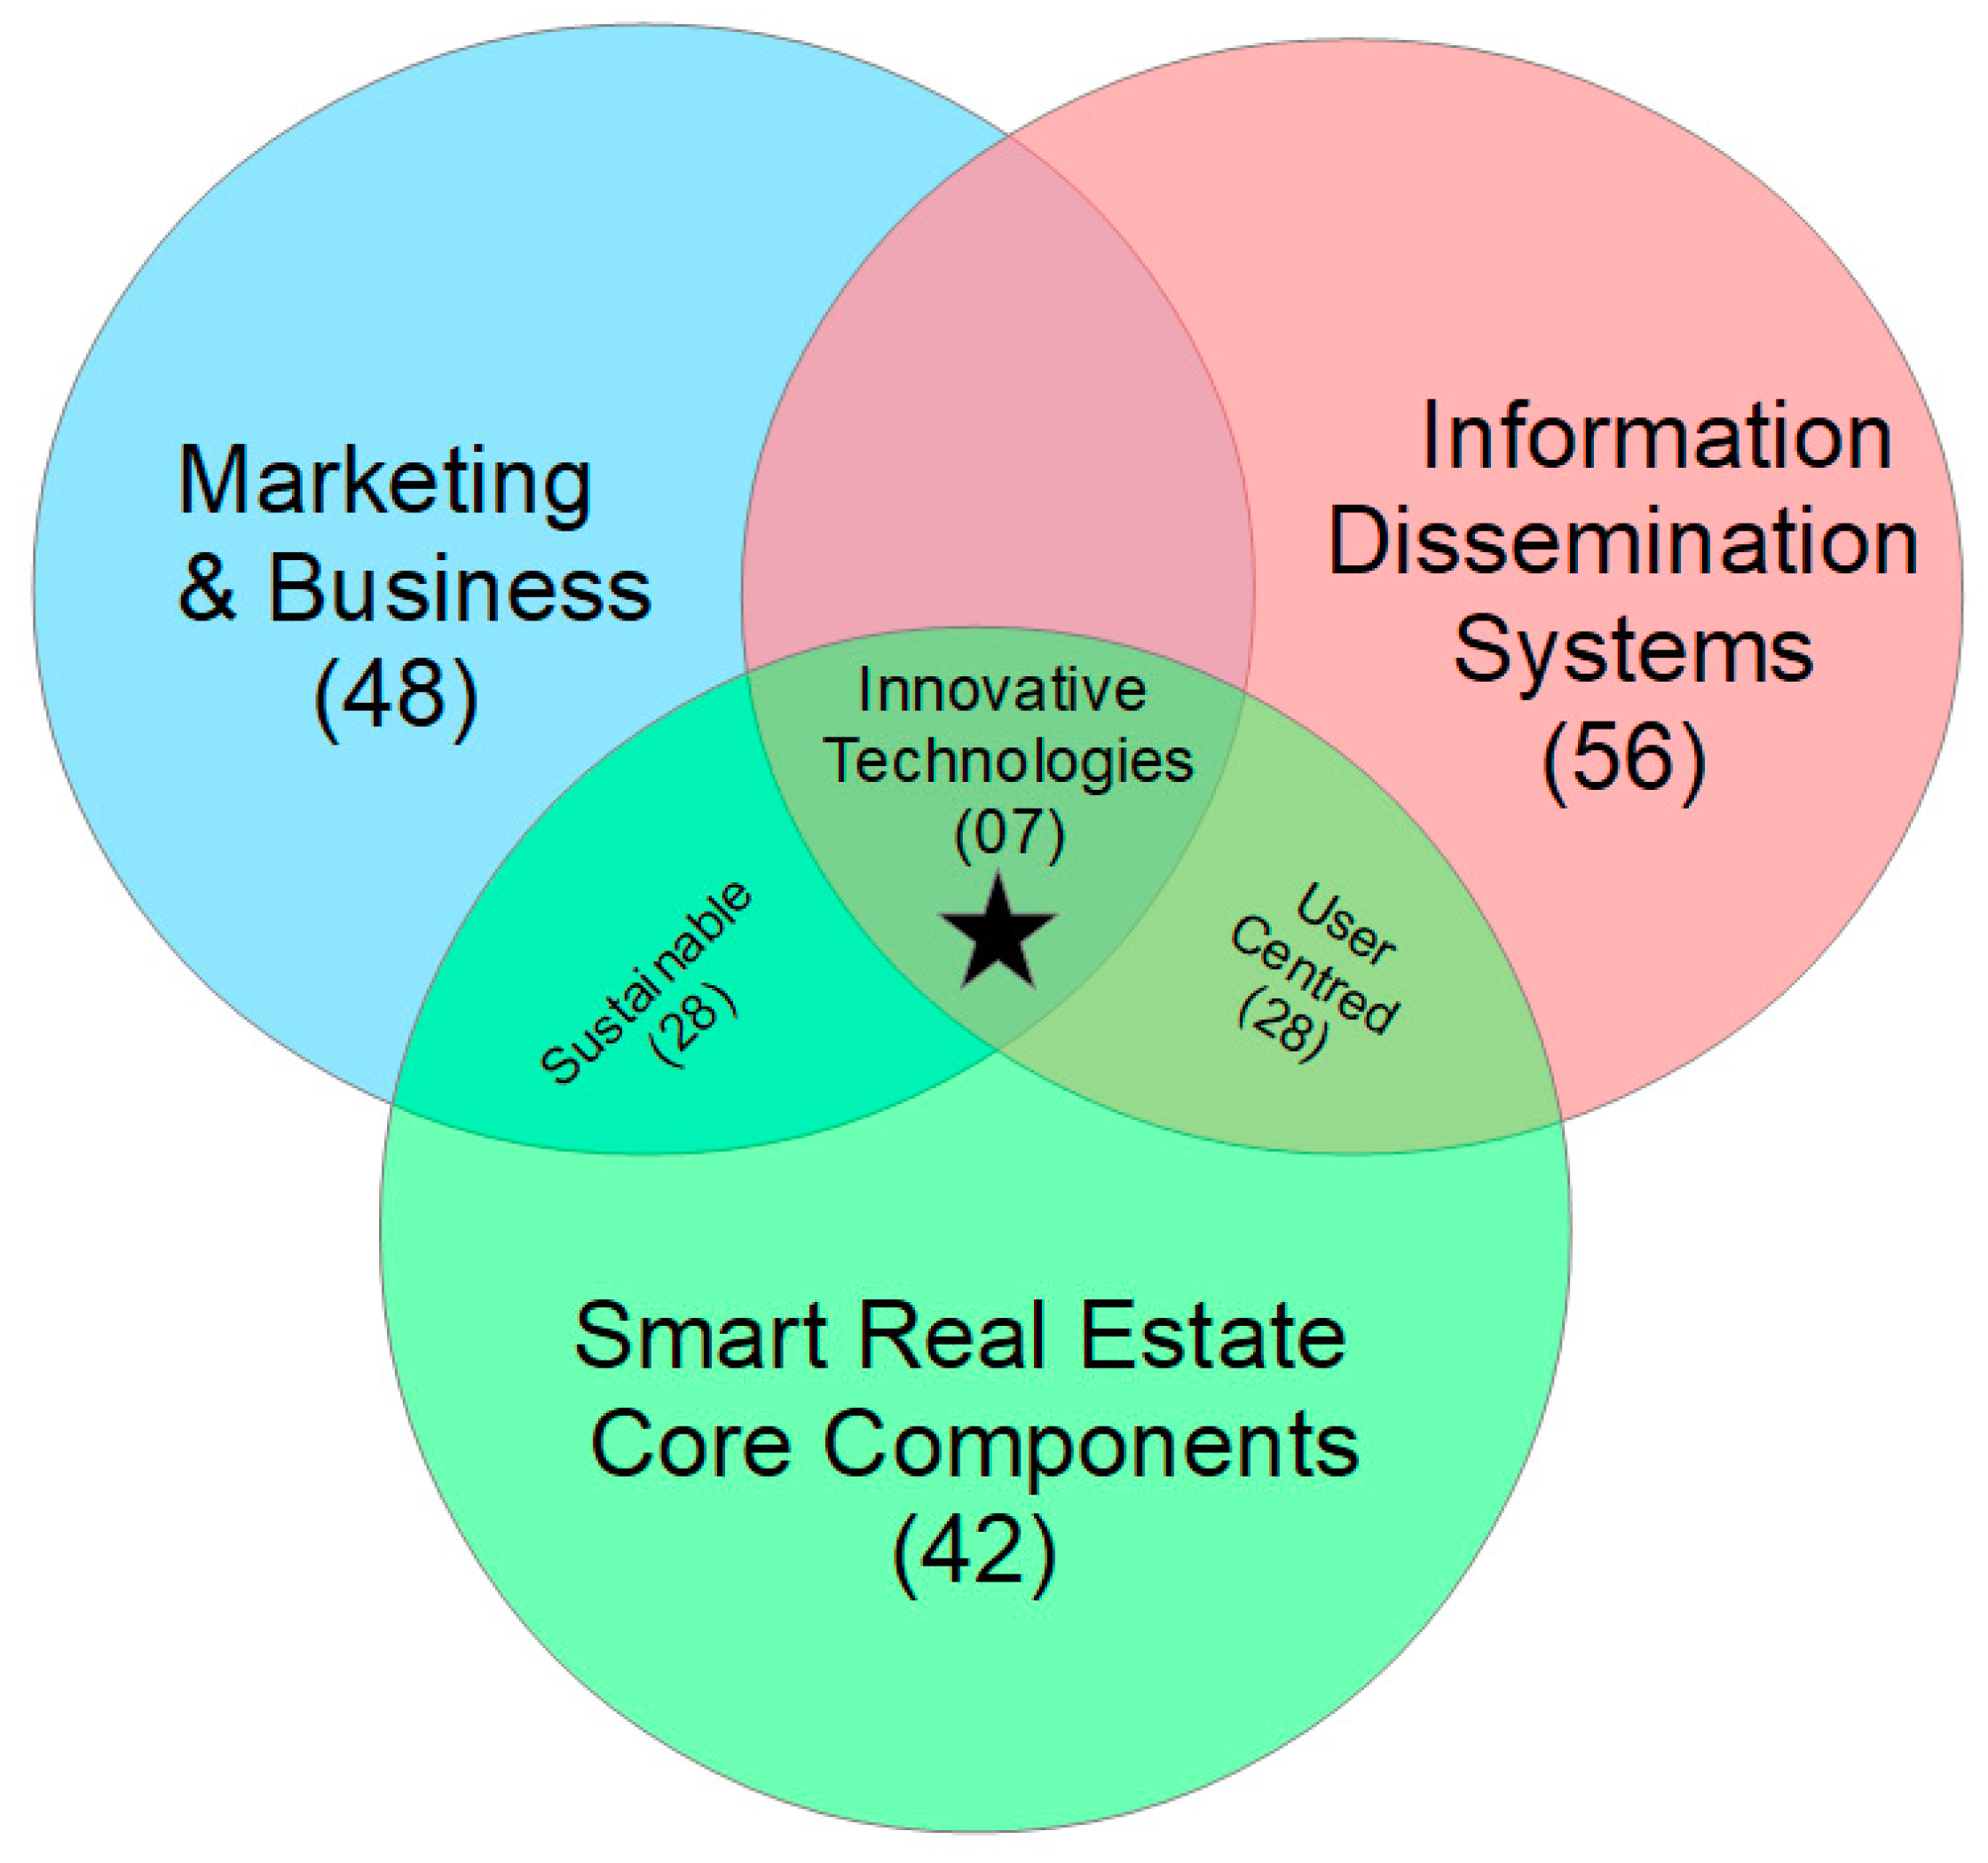
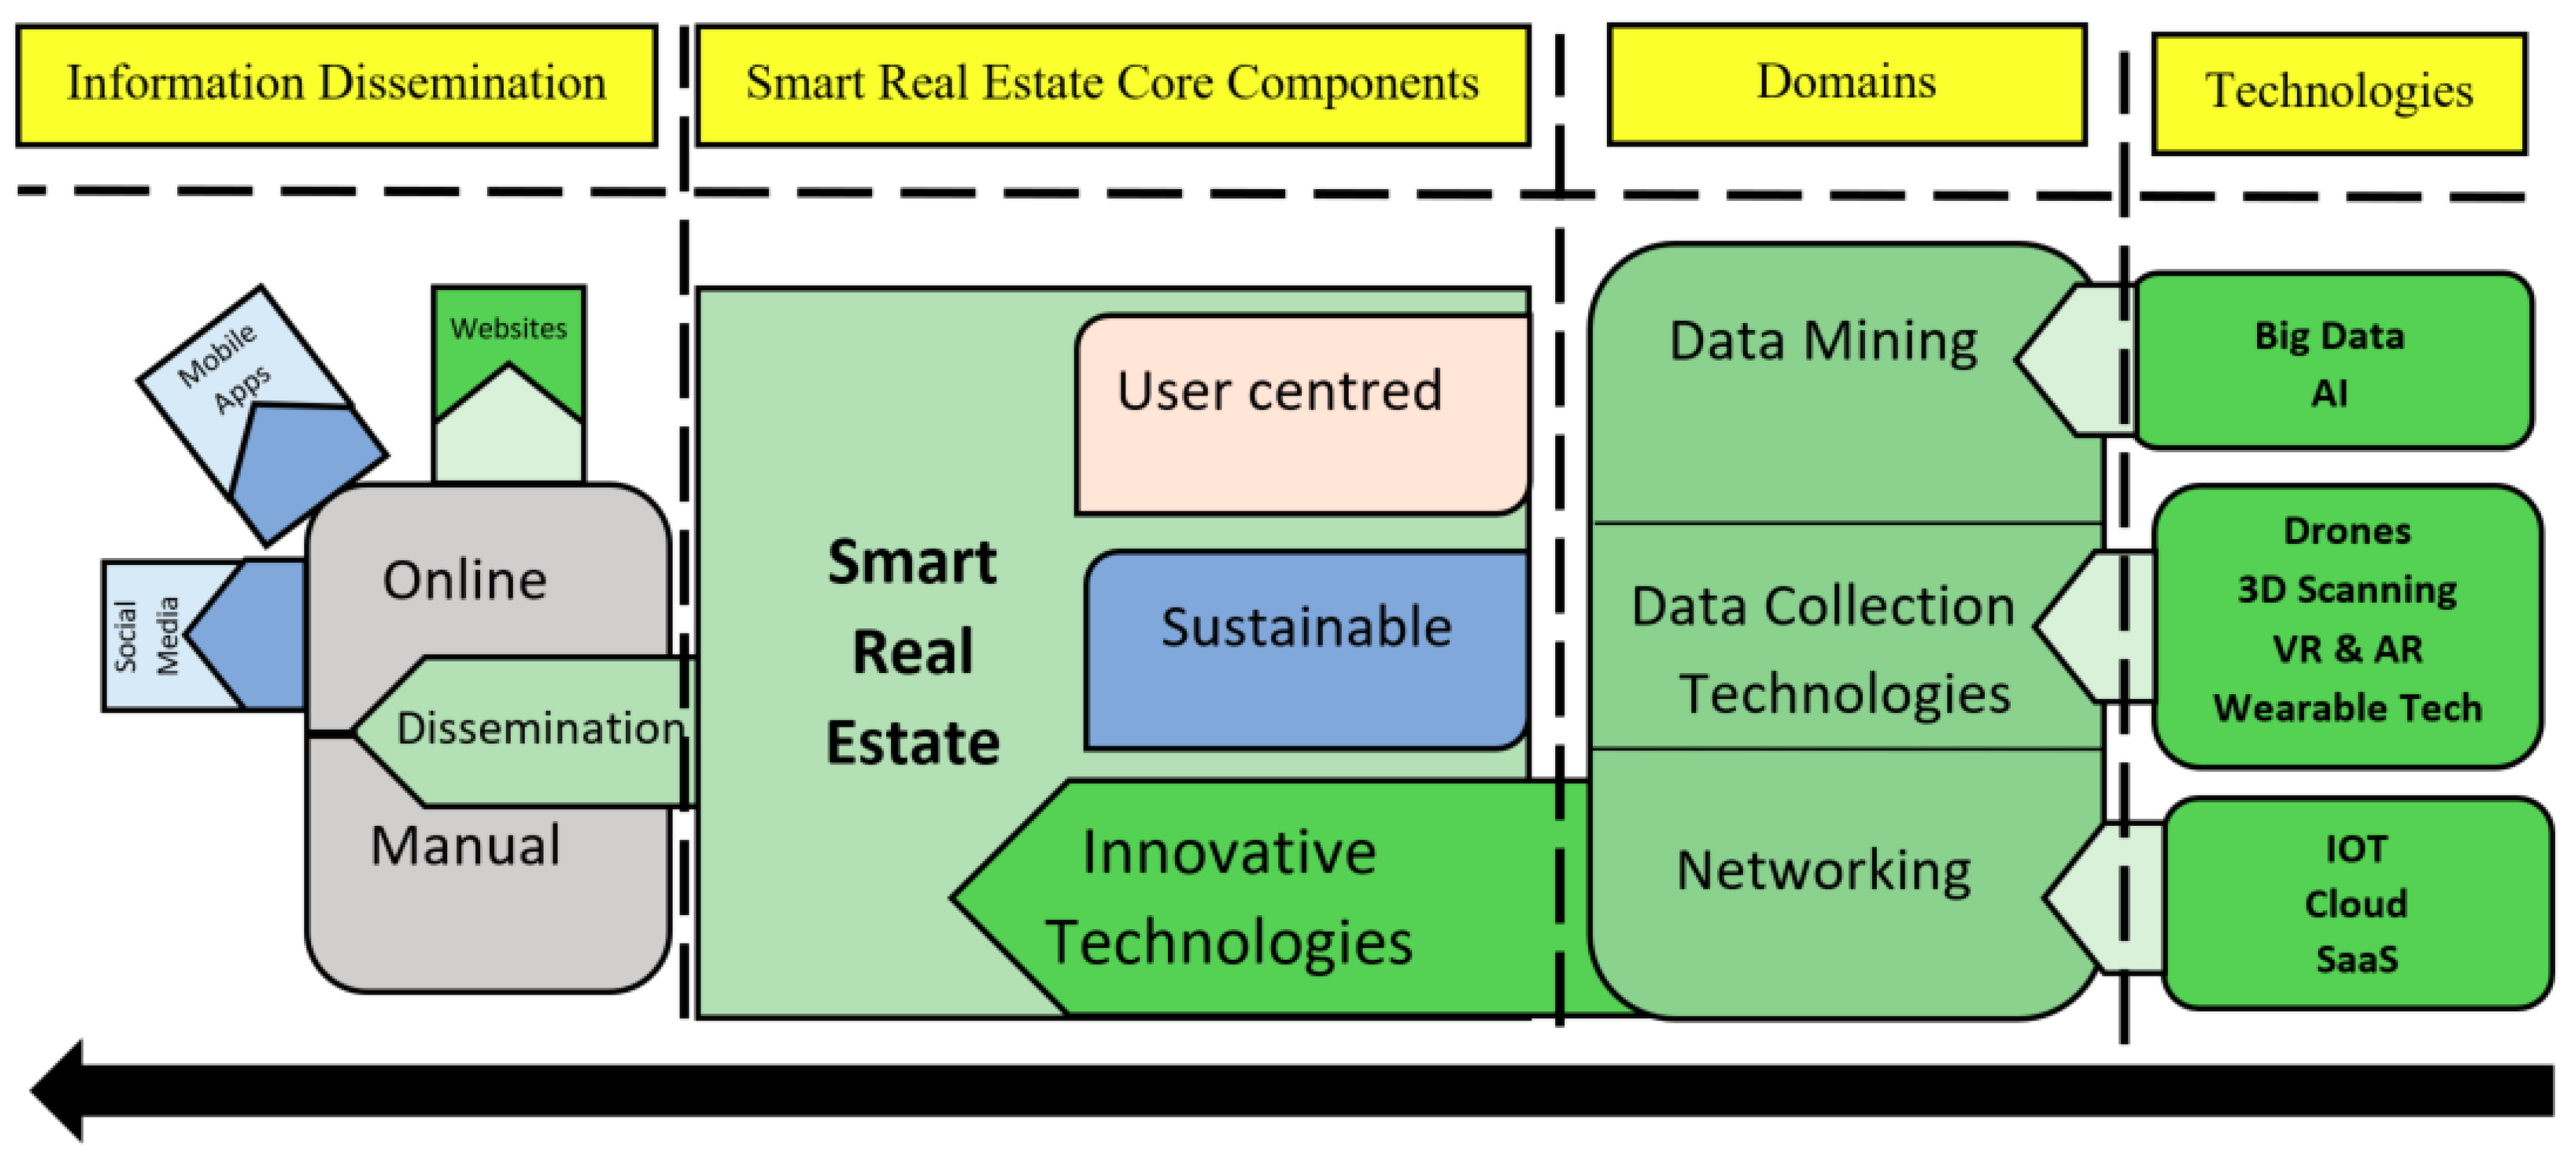
4. The SRE Conceptual Model and Definitions of its Key Components

Figure 3 focuses on categorisation 1 for the current study, where three critical aspects of SRE—core real estate components, information dissemination systems, and marketing and business—are considered. Analysis yielded 48 publications for marketing and business, 56 for information dissemination systems, and 42 for core SRE components. Twenty-eight publications were identified as merging SRE core components and marketing and business within the domains of innovation and sustainability. Thirty-two publications were classified as merging SRE core components and information dissemination systems within the domain of user centredness. Only seven publications, comprising one journal paper, one conference paper and five online webpage articles, were identified as sitting within the domain of innovative technologies.
It must be remembered that “innovative technologies” in Figure 3 incorporates dissemination mechanisms and marketing, along with the Big9 technologies. Thus, the number of publications on SRE technologies is very limited. Once again, this points to a large research gap in the real estate literature. The zone with a star indicates shared components of SRE, information dissemination systems, and marketing and business, in accordance with categorisation 1. Sustainability falls into the domains of SRE core components and marketing and business; user centredness is common to SRE core components and information dissemination systems, while innovative technologies are at the core of all domains. Thus, SRE in the current study covers three key components: innovative technologies, sustainability and user-centredness. Because there is little relevant literature and what there is fails to address buyer-seller interactions, the current study focuses on SRE technologies. An OPLEL analysis was carried out on each of the Big9 technology and tabulated to fill lacunae in the literature. This OPLEL analysis highlights statistics for each technology. In order to reach the acceptable level of intersubjectivity, multiple steps were carried out. Firstly, the OPLEL analyses tables were scrutinised by all the authors and interdepartmental discussion was conducted among the research cohort working on real estate domain. Secondly, the keywords were pre-agreed by all the authors for categorizing the statements as an opportunity, potential loss or exploitation level. Lastly, in case of any ambiguity, the authors of the shortlisted publications were contacted for clarification and upon reception of reliable and clear explanation, the statements were placed in the suitable domains. This was aimed at ensuring the inter-researcher reliability and validity.
Figure 4 is an extended diagram with a core bubble of the Big9 technologies and the three online dissemination mechanisms in focus here. These components all have dependent key variables and aspects that are discussed subsequently while keeping SRE as the core focus.

4.1. User-Centredness

One of the key criterion for assessing “smartness” is user-centredness [51,52]. Terms such as consumer satisfaction, customer value, customisation and other concepts are sometimes used in lieu of user-centredness [56]. Understanding this empowers organisations to cater to consumer needs by adapting to or introducing new and disruptive technologies that can attract new consumers, retain existing ones, and lead to more and improved business.
For the benefit of consumers, both smart cities and smart homes propound such key domains as privacy, multi-functionality, flexibility, the facility to work from home, tele-activity and time-saving measures [28]. Allameh [23] says the key domains of user-centredness in SRE involve changes in technology, lifestyle and space. Technological changes include smart kitchen tables with touchscreen surfaces, hot zones, temperature controls, appliances with multimedia networking, online recipe guides, dynamic cooking panels and sensor technologies that recognise user activity. There are smart walls that enable changeable scenery and entertainment, touch-sensitive interactive electronic devices, internet-based tele-activities such as tele-education and tele-caretaking, environment control systems such as HVAC, and lighting systems. There are also smart furnishings, with embedded computers that are interconnected and thus allow easy and flexible moving. These may be sensitive to user preference, responsive and programmable; they are interactive due to touchscreens and multifunctional, enabling virtual activities, entertainment and environment control [34]. Similarly, there are smart living spaces and smart garages.
The main aim of smart technologies—be they kitchens, TVs, furnishings or living spaces—is consumer satisfaction [51,52]. Other aims may include wellbeing, ease of use, enhanced productivity, perceived enjoyment, immersion, playfulness and personalisation [26,27]. Consumer satisfaction has three levels: physical, functional and psychological. Physical comfort involves temperature, lighting, sound, air and safety. Functional comfort revolves around consumers’ needs and their interaction with the environment through the intelligent design of space and technology. Psychological satisfaction refers to human lifestyles and needs; it is achieved through the smart integration of technology and space with a person’s everyday life.

4.2. Sustainability

In line with the triple-bottom line, sustainability in cities must cover social, environmental and financial aspects [57]. According to Addae-Dapaah [58], the sustainability facets of SRE include price, reliability, technology, effectiveness and environmental effects. Miller [29] highlights SRE sustainability concerns as governance and policy issues, valuation, investment, management, finance issues, adaptation and redevelopment. Wise [57] points to social aspects of sustainable cities and real estate and argues that opportunities such as volunteering, education and training can help attain smartness because they increase social bonds and community pride. Robinson and McAllister [59] say eco-certified real estate assets and buildings are usually overpriced and often not sustainable; superficially, the value offered by such assets may not be offset by their high costs. Crosby [60] says the absence of a real estate market valuation and lending model has increased sustainability concerns. The author says such a system could balance real estate booms with uplift in financial downfalls and counteract severe and unsustainable rises. According to Deloitte [61], sustainability in SRE can be achieved by assessing the energy and environmental efficiency of buildings, performing sustainability-related risk assessments, and using locale-specific tools for effective implementation. Critical to achieving sustainability in SRE are plans to track environmental, social and governance key performance indicators (KPIs) as part of performance measurement and decision support, obtaining environmental certifications and compliance, and conducting external assurance.

4.3. Innovative Technologies

Another key indicator of smartness is technological innovation and its adoption [62]. SRE, as in smart cities, is innovative and adopts disruptive technologies. The four forces of smart cities highlighted by Angelidou [62] include innovation and knowledge, a technology push, urban futures, and application pulls. Tukiainen [63] says smart cities and SRE improve everyday life, conduct consumer experiments, implement the latest technologies, and innovate. Innovation translates ideas or inventions into services or goods, creating value or meeting consumer demands in the process. In doing so, it yields financial benefits [64]. Innovation aims to take advantage of potential solutions and associated case-based facilitation to add value for business benefits.
According to Tangkar and Arditi [65], the key innovation models in construction and real estate are incremental, radical, autonomous, and systemic. The process from innovation to adoption moves through six cyclic steps: need, creation, invention, innovation, diffusion and adoption. Thompson [66] discusses five key aspects of innovation, namely: research, development, production, marketing and feedback. Furthermore, the four contexts of innovation are political, social, economic and technological. According to Blayse and Manley [67], the key influences on real estate innovation are clients and manufacturers, production structure, consumer–industry relations and industry–external relations, procurement systems, regulations and associated standards, and the quality and nature of organisational resources. Key aspects of SRE include digital technologies and their associated adoption, virtual showcasing, crowdfunding, AI, smart homes, online marketplaces and smartphone apps [30]. Virtual real estate science and technology parks are also significant to real estate innovation as they explore new ways of adopting disruption. For example, a science and technology park were established in Portugal as part of an online innovation project under the umbrella of a virtual European network of science and technology parks. The key thematic areas for this endeavour are technology assessment and watch, networking, audits, marketing innovation and financing innovation [68]. Innovation in real estate is, therefore, multi-dimensional.
SREM revolves around high-tech, innovative technologies. It is the adaptive nature of SRE that distinguishes it from traditional real estate. Innovative and disruptive technologies make SREM challenging yet rewarding. The management of these technologies creates a make or break situation, where properly managed SRE can yield greater financial and business benefits while mismanaged technology, where understanding is lacking, can result in huge financial loses. Globally, investment in eeal estate technologies has surged. In 2016 alone, $2.6 billion was raised by private real estate tech start-ups across 235 deals, setting a record in both deals and dollar value. Funding for real estate technology companies rose 40 per cent in the same year [1]. Recently, the online real estate company OpenDoor Labs® introduced a unique model for buying and selling homes. It has raised as much as $350 million in three years [69]. Its business model includes purchasing a home directly from the homeowner, improving it by installing the latest technologies and gadgets for virtual tours, and listing it on the market as fast as possible. It might be called tech-enabled house flipping. The company gains from the appreciation in the property price and protects itself from losses by taking a fee from the homeowner related to the estimated value of the property and associated market risks. For the home seller, potential benefits include faster and simpler sales and lower real estate transaction costs because the model avoids commissions. OpenDoor Labs also provides more information to consumers because they can extract data from installed gadgets and tools. When they get their hands on more information, consumers tend to be more satisfied and more inclined towards buying or using a home. Faster sales result and the company makes good money from its transactions. The process also eliminates consumer regrets by supplying more information. Airbnb, an online hoteling service that offers private accommodation in people’s homes, is another example. It features cheap and convenient rooms that appeal to clients with limited finances [31]. In early 2014, Airbnb received venture financing of $10 billion, which is greater than the market capitalisation of the Hyatt hotel group.
Real estate technology is the combination of online platforms and software tools that are used by industry stakeholders, including investors, brokers, real estate-focused lenders and property owners, mortgage providers and managers, as well as consumers [2]. The category includes online real estate rental and buying guides. These tech companies reportedly rely on the use of clouds, software, big data, IoT, drones, 3D scanning, wearable tech and gadgets, VR and AR and AI and robotics. If made available to consumers, information from these Big9 technologies could avert regrets by informing consumers and so empowering them to make better decisions. In general, these technologies can be divided into three domains: data-mining technologies, data-collection technologies and networking tools.

5. A Review of State-of-the-Art Technology

This section, as mentioned in the methodology, reviews Big9 technologies for their applications in real estate. The opportunities presented, current exploitation level and potential losses due to non-usage are tabulated for each technology. This section also discusses the role of each technology in answering, reducing, or eliminating consumer regrets.

5.1. Data-Mining Technologies

Data mining is the process by which large data sets are sorted to identify patterns and establish relationships between the data sets and so solve problems through data analysis [70]. It allows organisations to predict trends, learn about consumers and decrease business costs. In real estate it has been used to develop early warnings and forecasts [71], providing multimedia-based real estate services over the internet [72], and other applications. It comes in different forms but the current study looks at big data [73] and AI and robotics [74,75].

5.1.1. Big Data

Big data, as suggested by the name, refers to a huge volume of data that cannot be easily processed by traditional software [76]. Winson-Geideman and Krause [20] define it as a collective term for larger and interrelated databases as well as the associated processes for extracting useful knowledge from the digital data stream. Although many definitions exist for big data, almost all of them have three common data-mining characteristics: massive data volume, processing speed and data coverage [77].
In terms of real estate management, and more specifically SREM, speed and analysis are key components. Big data offers these attributes through what is known as “big data analytics” [78]. Real estate contains a wide set of data, and in the absence of big data analytics based on data-mining techniques, complicated analyses consume a lot of time. Big data thus frees real estate organisations, agents and professionals to focus on their core roles and leave the analysis to technology. This is achieved through “data-centricity”, which places better, reliable, more accessible and relevant data at the core of decision making to boost productivity [3]. Big data may enable real estate organisations to integrate financial, marketing, sales, e-commerce and consumer surveys to obtain a holistic view of the business performance and achieve overall organisational goals.
Distinctive values that big data offers the real estate domain include saving time, speedy sales, consumer insights, consumer accessibility to aid better decision making, and empowering real estate owners to understand trends and patterns that in itself can help to overcome inefficiencies and reach target buyers or renters [78,79]. Some practical examples of online real estate websites that use big data are Realestate.com.au, Zillow.com and Domain.com.au. These websites not only provide core residential insights for consumers but also neighbourhood insights, crime rates, market accessibility, sale patterns, average property prices and travel rates [49]. A key regret for real estate consumers, as highlighted by Phillimore [80], is their lack of foresight about a neighbourhood. People not only regret leaving their old neighbourhoods but are also uncomfortable about moving into neighbourhoods they know little about. This is where big data analytics come in. Big data can provide neighbourhood insights such as the average time people spend in the neighbourhood, common professions, the median age and the livability rating. This information is produced by algorithms that mine huge volumes of data obtained through various ongoing surveys, the results of which can be disseminated online to consumers and empower better decision making while eliminating regrets. The OPLEL analysis for big data is shown in Table 5.
Examples and uses of big data in real estate include databases of building performance by Prudential Real Estate Investors and USAA Real Estate Company [83] and BEM Prototype for online collaborative searching [84]. Other uses include real estate development and marketing [78], property value analysis by Zillow.com, crime rate indices, and value forecasting.

5.1.2. Artificial Intelligence (AI) and Robotics

AI refers to the performance of complex and intelligent functions such as those done by the human brain but with computers and intelligent programs and minimal human intervention [85]. Robotics involves AI-equipped robots conducting complicated tasks with precision [86]. Initially used in the medical field to enhance the capacity of people with physical disabilities to carry out complex operations with high levels of precision, robotics are increasingly welcomed in construction and real estate [75]. AI is growing fast and has been adopted by various industries. It is expected that global AI revenue will be about $36.8 billion by 2025. By the end of 2018, it is predicted that AI will be used by 75 per cent of developer teams in one or more real estate business applications or services [87].
According to Bock [88], the construction field shows that automated technology, microsystems technology and robot systems are continually being merged with the built environment and thus becoming inherent to building components and elements as well as furniture. In real estate, AI and robotics offer driverless cars to transport clients and customers to property sites, 3D renderings of interior spaces, and the collection of waste materials and recycling. They can also help with routine inspections and maintenance and the cleaning of hard to reach places [3]. Furthermore, AI helps real estate agents to screen potential customers by gathering information from data-mining search algorithms. It also helps them to sharpen marketing strategies and to reach potential clients through social media and emails, thereby streamlining their work flows. Such immersive systems and mechanisms aim to inform consumers from the very start of their property hunt. AI-based systems can link consumers to their dream homes through filters that allow them to nominate the items they deem necessary. Such intelligent matching can avert regrets that arise from human error. AI bots can also assist consumers to refine their search and find relevant properties based on the big data sets used by AI through predictive analysis. AI-based voice recognition is another application that can provide useful information to consumers, in turn reducing information-related regrets among end users. The OPLEL analysis for AI and robotics is shown in Table 6.
Examples of AI in real estate include blockchain taxation, smart property ownership, and automated renting [91]. There is the detection of concrete swap-based tax fraud schemes [92] and unit selling price prediction in Bari Italy [93], and many other applications, including real estate business forecasting [85], sales renaissance by LG to cut off customer visits to service centres [94] and machine learning-based sale and build decisions [95].

5.2. Networking Tools

Networking is the use of digital telecommunications to enable devices over a network to share resources with each other. These computing devices exchange data through wired or wireless connections using data links [96]. Networking has been used in various domains in real estate, such as co-ordinating multi-site construction projects through federated clouds [97], door detection in the indoor environment [98], reconstruction and modelling of as-built 3D pipelines and more [99]. There are various networking applications in real estate, but the current study has restricted its focus to clouds, IoT and SaaS.

5.2.1. Clouds

Traditionally, a company’s IT infrastructure was situated locally, with all servers networked and data centres onsite. This not only consumes a lot of space but also gives rise to security concerns and other hazards. Cloud computing resolves these issues by allowing an organisation to access data and software applications over the internet rather than on a hard drive. In the internet age, this access is particularly favoured by the younger generation. About 60 per cent of respondents in a US survey indicated a willingness to adopt and invest in cloud computing over the next year [100]. Cloud computing in real estate increases scalability, flexibility, device integration and data security while reducing IT costs through networking [101].
According to Mladenow [102], cloud computing in real estate has three-fold benefits that relate to high-valued objects, longer time periods and different actors in the industry. Data archiving and storage for valuable assets would cost a lot in the absence of clouds. The benefits of cloud computing attract larger investments, as evident in Warburton [3], who quotes the global cloud computing market as reaching a value of $270 billion with an expected growth of 30 per cent from 2015 to 2020. In real estate, the use of clouds can reduce communication requirements, as highlighted by Carter [103]. A lack of communication can promulgate regrets, as consumers may consider it to be the intentional withholding of information. Cloud-based software such as PropertyMe grants access to agents, consumers and owners and shares key requirements such as maintenance and renovation information among stakeholders. It also makes the financial details of the properties accessible to stakeholders, thereby reducing regrets by providing more information. The OPLEL analysis for clouds is shown in Table 7.
Clouds are used in real estate for: optimising the total cost of ownership and elastic resource utilisation [110], Platform as a Service (PaaS) as used in Google Engine, Microsoft Azure, Force platform and Salesforce.com, and Infrastructure as a Service (IaaS) as used in Amazon EC2 and Flexiscale [111]. EPIQR®, developed by CalCon, provides a building lifecycle management option. FlowFact AG® is a German tool that is also used in Switzerland and Austria to match customers and agents with properties. MaklerManager® is used in Germany for real estate portfolio management [102].

5.2.2. Software as a Service (SaaS)

Generally, software in tech industries operates under the umbrella of Software as a Service (SaaS). It provides remote access and the functionalities of software through web-based networked services rather than existing on a user’s PC [112]. Access is provided over the internet and it offers a cost advantage for users as well as agents.
Its major advantages for investors and property managers include the integration of huge, multifamily organisations across portfolios through the networking of different software. It also makes the integration of multiple solutions easier by accommodating different property management services under one umbrella, along with the potential to scale a changing portfolio up or down. Not surprisingly, the adoption of SaaS from 2015 to 2016 increased 21 per cent [113,114].
Most real estate agents find they need to spend time outside the office to meet customers and present properties. SaaS enables them to increase business by remote access. It has been used in such areas of real estate management as construction, client management, marketing, billing, maintenance, retailing, customer relations management, E-marketing and lease administration [3,7,115,116]. SaaS-based software packages such as RealSpace and PropertyBase enable the sharing of information about maintenance, security, lease and tenancy, contracts and work orders among key stakeholders, including consumers. Such features can deliver the type of information that consumers need to reduce post-purchase regrets. The OPLEL analysis for SaaS is shown in Table 8.
Examples of SaaS in real estate include Immoware24, a German company that supports property managers with order processing, accounting, bookkeeping, customer management and diverse administrative tasks. Onventis provides account support and e-auction in real estate [102]. Management Reports International uses SaaS model for vendor support. And Honest Buildings, eBid eXchange and Vendor INSIGHT use SaaS for supplier management [3].

5.2.3. Internet of Things (IoT)

IoT, a term coined and first used by Kevin Ashton in 1999, refers to internet-based, networked physical devices that can sense the physical aspects of the world such as temperature, humidity, illumination and other attributes [120]. Yang [121] defines it as a novel internet-based paradigm that connects a variety of things or objects around us through wireless or wired technologies for attaining desired goals. A stand-out characteristic is the “intelligence” of these devices, which enables them to self-configure using sensors, rather like the human nervous system.
By 2020, it is estimated that the IoT will have more than 21 billion connected devices and thus be worth more than $7 trillion. From 4.9 million things connected in 2015 to 3.9 billion connected in 2016, the increase has been huge, and the trend is continuing upwards [122]. This trend shows the development of smarter cities, secured routers and enhanced artificial intelligence. In real estate and property management, IoT devices are used to monitoring buildings and their surroundings constantly to control temperature, relative humidity, indoor air quality, and lighting levels. Building management systems can thus be interconnected with tenants’ own systems, allowing a novel level of control and effective monitoring. For agents, tenants and property owners, air-conditioning, security, power and fire systems monitoring and control in real-time is a distinct advantage [123,124,125]. Key applications include understanding and reacting to an occupant’s behaviour, proactive repair and maintenance, linking security systems to smartphones and wearables, digitised logistic management, push notifications that enhance security and sensor-based dust bins to inform local authorities of the need for a clean-up [125,126]. Other applications include the Entrance Guard System, the Intelligent Residential District, Smart Homes, and Intelligent Communities [123]. Such comprehensive connectivity informs consumers more fully and thus can prevent information-related regrets. It keeps users more immersed and connected to the environment, inducing a sense of being at home and of ownership. These elevated feelings promote a positive attitude in stakeholders and so reduce regrets. The OPLEL analysis for IoT is shown in Table 9.
Examples of IoT in real estate include the real-time production logistics synchronisation system [127] and Fog computing for wind farms, smart grids and smart cities [128]. Domotics home automation device units and Nest temperature controllers are other examples.

5.3. Data Collection Technologies

Data collection technologies concern hardware and gadgets. These are physical and tangible components of any system, which combine in a systematic way to achieve value for a product or service [131]. Gadgets used in real estate include those for digital story telling that rely on augmented information [132], collaborative decision making through VR and BIM integration [133], real-time tracking for near-miss accidents [134] and as-built modelling using Lidar and 3D laser scanning [135], among others. Various data collection tools and gadgets have been developed over the years to augment real estate practices. The current study looks at drones, 3D scanning, wearable tech and VR and AR.

5.3.1. Drones

Drones are highly accurate unmanned aerial vehicles that are controlled by remote control or a ground control station [136]. They were initially used in warfare but have recently been introduced into property and real estate management to obtain 3D views and photographic functions for data collection [75].
The US has encouraged the use of drones to enhance the buying and selling of real estate. Aerial videos and images provide more information and visual insights to consumers. Drones allow agents and property managers to obtain views and present them to potential consumers that would otherwise be unavailable. Consumers can see the broad expanse of a property’s views, and check the distances to neighbouring houses and facilities, without being there in person. Results, include reduced inspection times and enhanced sales [137,138]. On average, 49 per cent of drones are used in real estate; the US is at 72 per cent, France at 52, Britain at 48, and Germany at 24. In total, 72 per cent of agents report using drones for aerial photography and 48 per cent for surveying [136].
Drones armed with high-resolution cameras that have aerial as well as wall-climbing capabilities are changing perspectives of properties as well as the marketing of real estate [139]. They are saving the expense of planes and helicopters and offering buyers a new perspective for viewing entire properties and neighbourhoods. Indoor wall-climbing drones can cling to ceilings and capture the entire area for potential clients [140,141]. Pictures taken by drones provide wider and more comprehensive angles for consumers, meaning they can see more of a property and so make better informed decisions [139]. Drone images can show sun paths, nearby greenery, locales and distances to parks, schools and amenities. Inside the house, high quality, zoomable images can show finer details at angles that are otherwise inaccessible to consumers. The result is more information for consumers that can promote positive decision-making and prevent post-purchase regrets. Although such aerial views raise privacy and security concerns, associations such as the Federal Aviation Authority (FAA) of the US have begun to hand out licences for drones used in real estate, making them attractive to investors and realtors. The OPLEL analysis for drones is shown in Table 10.
Examples of the use of drones in real estate include aerial photography and property marketing by KnightPrank® UK [142], automated mapping such as Drone2 mapping for ArcGis, and Phathom3 by SkyMedia NorthWest that makes volumetric calculations [143]. Skylark drones are used for 3D pictures and the development of land surface data [144].

5.3.2. 3D Scanning

3D scanning is another game changer. It is a disruptive data collection technology that was introduced only recently. Hand-held scanners such as Lidar are used increasingly in real estate and construction to produce as-built drawings that provide digital data that can be used to revise drawings or track maintenance and repairs [148]. Mobile scanners based on laser scanning technologies are increasingly welcome in this domain too. Not only are these scanners 50 per cent less costly, but they also assist construction managers to update data efficiently and revise drawings through updated multi-dimensional models [149]. A recent study that involved a survey of online real estate platforms concluded that by using these advanced visualisation tools, property managers could communicate more easily with consumers, and consumers could examine properties more easily from the point of view of their requirements without a physical inspection. 3D modelling, views and pictures provide customers with more credible and reliable property information that is mutually beneficial to key stakeholders: property owners, consumers and real estate agents [135]. Another application of 3D scanning relates to heritage conservation and recording [150]. Here, scanned models can make restoration, renovation and preservation works easier for government officials and archaeological departments.
Real estate consumers can obtain a more realistic image and feel for properties from collections of scanned drawings and images in the absence of personal inspections. This information can reduce buyer remorse. Such drawings and scans can also provide a realistic view of a property’s layout and design, allowing consumers to plan any changes, renovations or additions they might want to make. Mahdjoubi et al. [151] argue that 3D-scanned real estate can be merged with building models to provide information to consumers and thereby promote sales. Such matched, spatial information can eliminate regrets, especially those arising from a misapprehension of the layout of a property. The OPLEL analysis for 3D scanning is shown in Table 10.
Examples and uses of scanning include Leica Nova MultiStation MS60 and Trimble SX10 laser response for 3D modelling and structural monitoring [152], as well as Mobile LIDAR for rapid as-built BIM [153]. The Riegl LMS-Z210 3D laser scanner and PolyWorks software for 3D modelling that use point data are other examples. LMS-Z210 3D is used for powerful 3D image-based data collection [154].

5.3.3. Wearable Technology

Wearable technology and gadgets comprise electronic devices that have been incorporated into clothing or wearable accessories—such as helmets and walkie-talkies—for data collection [155]. Most of these gadgets use the internet, sensors and scanners with one-way or two-way communication between the gadget and a receiver, allowing real-time communication between the device and consumers [156]. Devices include glasses, walkie-talkies, hats, body kits, cuffs, jewellery, commuter trucker jackets, smart eyewear, fitness jackets, rings, watches and bracelets [157,158]. By wearing such devices, consumers can remain connected to a building and obtain real-time updates about maintenance, fire hazards, gas leaks and other issues. This immersive connectivity forges a stronger association between the user and the building, allowing them to take greater involvement in daily decision-making and even develop a greater affection for the property. Such connection (and affection) reduces regrets that might otherwise arise from a lack of information, particularly after purchase. Useful data can also be recorded, without further intervention, to inform subsequent tenants or owners about the property.
In the context of real estate, wearable technologies have great potential. They can keep track of maintenance and equipment, provide visual alerts for building components and display public data to potential buyers [3]. Moreover, integrating gadgets with building management systems supplies such benefits as the extraction of as-built drawings and fault detection. These give consumers greater knowledge and so empower them to make more informed decisions [159]. The OPLEL analysis for wearable tech is provided in Table 11.
Examples of wearable tech in real estate include devices that monitor worker health and safety [160], real-time labour and equipment [156]. Jewellery such as Pesciolino Robot, Funny Penguin Twinkling Light and Cavallino Filoguidat, hailing from Rome, Italy, are experimenting with body mediation applications in real estate [161]. Smart watches for health services, location, tracking and monitoring, such as the Apple smart watch, are another application [162]. And smart bracelets have been developed by Agile UX for real estate [163].

5.3.4. Virtual Reality (VR) and Augmented Reality (AR)

Although significantly different, the terms VR and AR are often used in conjunction. But let us differentiate the two. Simply put, VR is concerned with creating virtual worlds without referencing the real world; AR is about augmenting or adding to the real world, thus creating a blend of real life and digital reality [164]. Globally, it has been predicted that there will be 216 million AR/VR gamers by 2025, $22.8 million AR/VR glasses shipped globally by 2022, and a $215 million AR/VR market size by 2020 [165].
VR and AR tech has already attracted huge investment, raising about $13 billion in 2017 alone. This makes its way to real estate consumers in the forms of home touring and sales efficiency, buying sight-unseen, fix and flips for rehabilitation, quality advertisements and improved tenant communication. But all key industry stakeholders can benefit. Architectural firms do so from pre-visualisation, walk-throughs and consumer requirements gleaned from virtual interactions. Developers can create virtual showrooms and display properties rather than investing in replicas. Technologists, by integrating VR and AR with BIM, can easily collaborate with construction professionals throughout the construction process. The consumer can get a feel for a property and envision their plans for it through walk-throughs and 3D experiences [135,166].
VR can also be a rescue tool given that 87 per cent of managers want to improve their communication with tenants and 80 to 90 per cent of properties are vacant within 10 months of a lease due to misleading advertisements [103]. By 2025, the VR and AR market in real estate is expected to reach at least $80 billion. The key benefits of these technologies are time savings, global buying and selling, tackling intangibility, and narrowing the interest pool for buyers [170]. Further opportunities include virtual property showcases, guided visits, interactive visits, virtual staging, architectural visualisation and virtual commerce [171]. Using visualised tours and visits, consumers can get a feel for a property before inspecting it in person. They can change layouts and designs and interact with the building to obtain a realistic feel for it. Such immersed visualisations can improve consumer feelings about a property and increase their purchase confidence because of the information they have gathered. Such elevated confidence and abundant information can tackle post-purchase regrets. The OPLEL analysis for VR and AR appears in Table 11.
Examples and uses of VR and AR in real estate are diverse. ArX Solutions creates pre-construction virtual designs of apartment buildings using 360-degree cameras and VR headsets. Sotheby’s International Realty in Los Angeles uses VR to tour potential buyers through their multimillion-dollar properties using the company-owned Samsung Gear VR headset. Common Floor Retina, a VR real estate company, provides its own cardboard headsets coupled with a smartphone application to provide remote tours for potential buyers [172]. Vuforia, an augmented reality app for smartphone devices, uses computer vision technology to recognise and track planar images and simple 3D objects such as boxes and furniture in real-time [173]. Aurasma, an East London company, uses smartphone AR video to generate 4D advertisements. Smartphone AR is used in Mexico city for outdoor commercial spaces [174].

6. Disseminating Information to Consumers in Smart Real Estate

Dissemination platforms provide a mechanism for distributing technologies and making them available to consumers. Like the technology itself, the dissemination mechanism is of great importance; a poor dissemination mechanism can restrict the reach of the technology and, therefore, result in both financial losses and a loss of consumer appeal. Several mechanisms exist to disseminate information and they can be divided into two key groups: manual clusters and online clusters, as shown in Figure 4. This study reviews online dissemination mechanisms. However, it restricts its attention to platforms such as smartphone apps, websites and social media sites, including YouTube and Facebook.

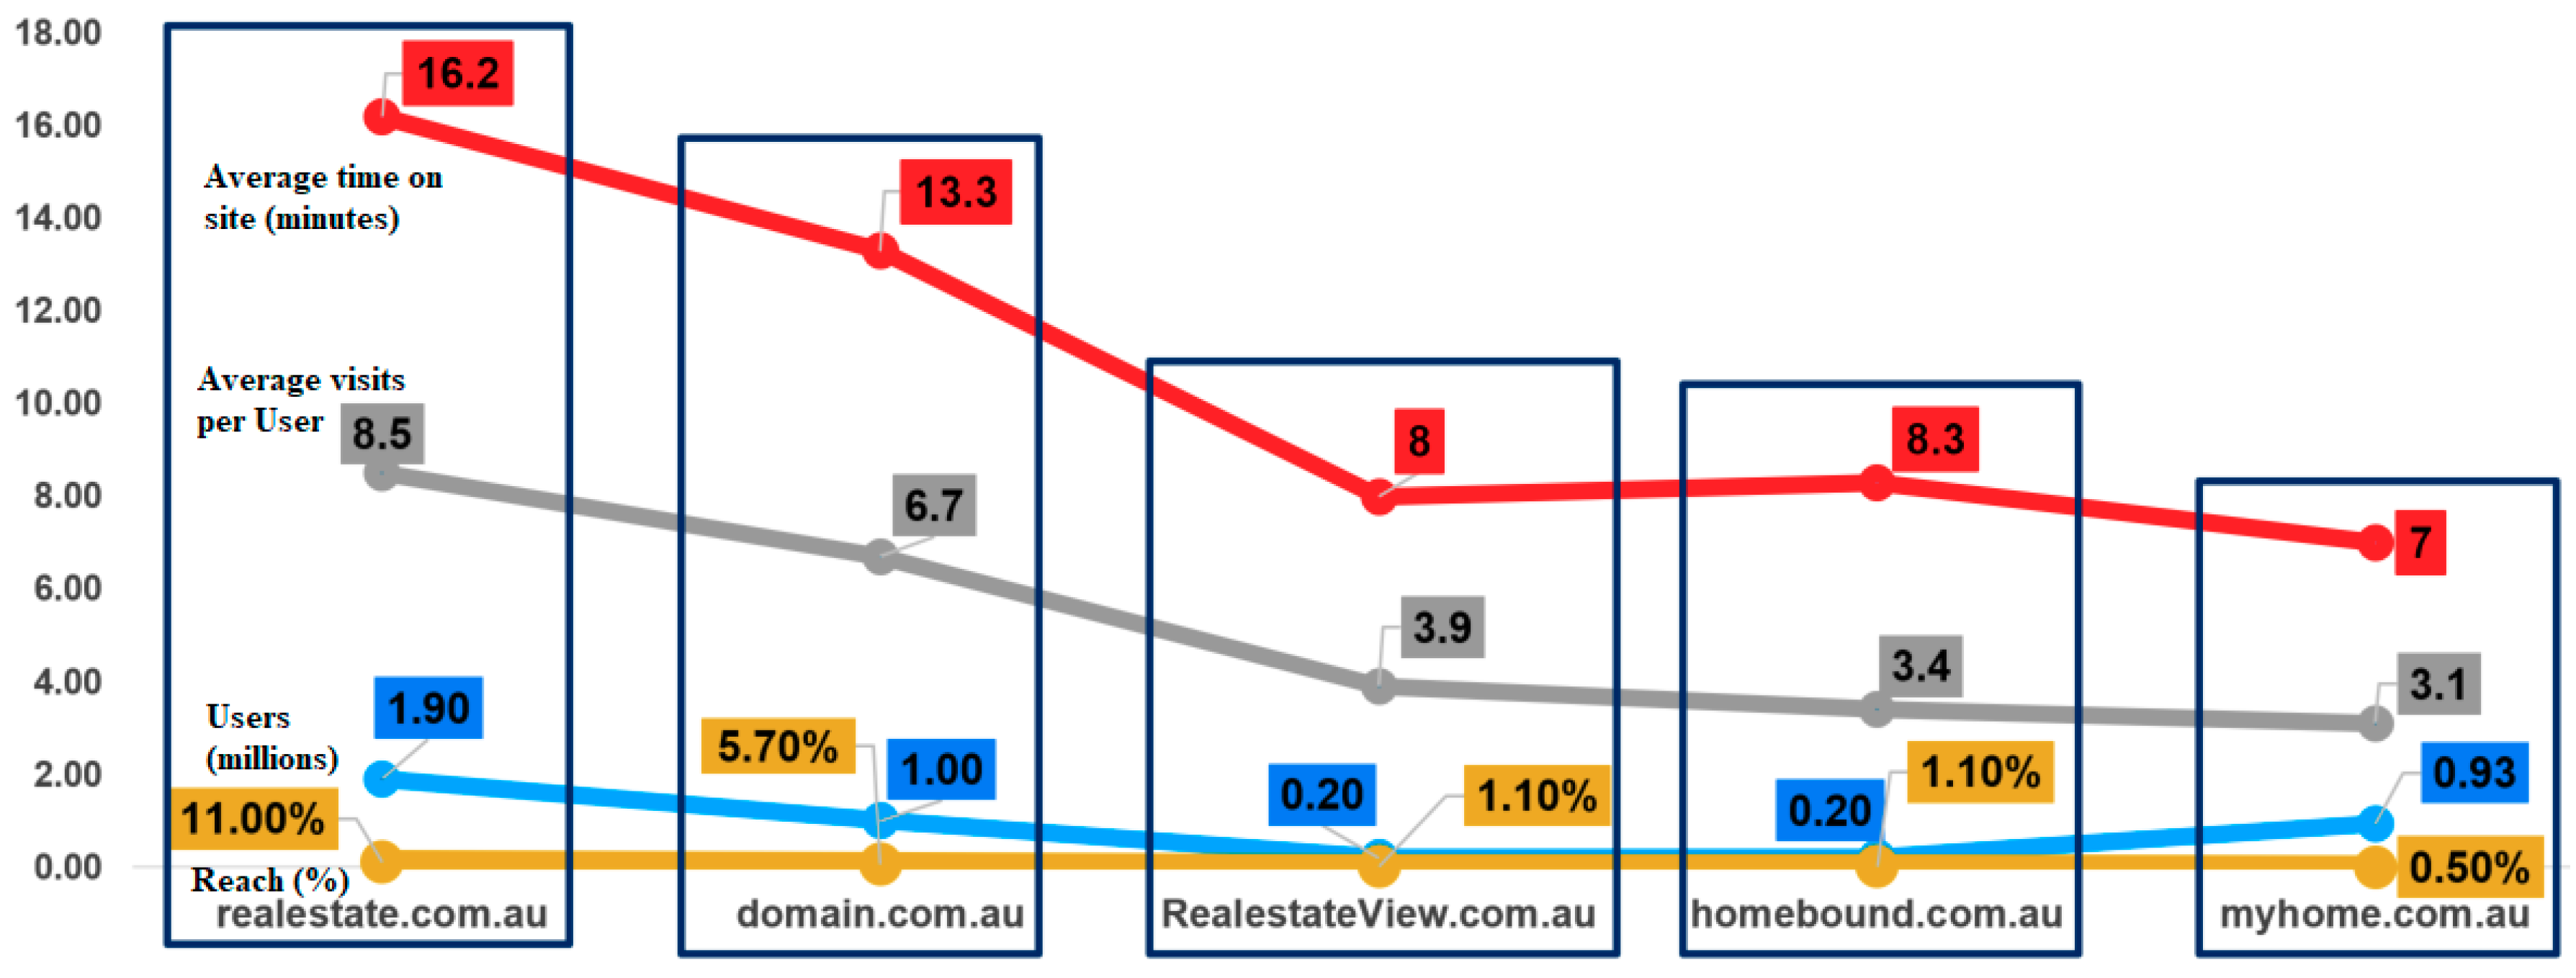
6.1. Information Dissemination on Real Estate Websites

Websites are one of the most useful and powerful platforms for disseminating information online. However, at present almost none of them use disruptive technologies to disseminate information to consumers; such technologies are limited to agents and their organisations. If made accessible to consumers, this information could enhance satisfaction levels and attract more interest. In the modern era, almost all of the market leaders in real estate have a well-known and easily accessible website. According to REALTORS [175], 95 per cent of online home searches involve websites. This huge proportion indicates a reliance on websites for online searching, making it one of the hot areas of research in real estate. Websites come with various features and add-on tools for better presentation and ease of consumer use. These include photos, videos, 3D images, virtual tours, interactive maps and neighbourhood information [49,50]. The survey of REALTORS [175], found that 89 per cent of respondents reported photos as very useful, 85 per cent backed information about properties, 50 per cent said virtual tours were very useful, 44 per cent cited neighbourhood information as very useful, and 41 per cent found interactive maps very useful.
In terms of their uptake of disruptive technologies, however, real estate websites lag by some margin. A recent study by Ullah [49], based on a SWOT analysis, found that half of the top 10 studied websites in Australia and the US presented more than 50 per cent improvement opportunities. On the one hand, this points to a good investment opportunity; on the other hand, it shows a lack of disruptive innovation and growth in real estate technology. According to Zillow.com, an average buyer spends 12 weeks and investigates 12 homes before deciding whether to rent or buy. From the studied total, 51 per cent of those surveyed said finding the right house using website information was the most difficult part of the process [176]. Homes.com reported consumers taking 60 days to make that decision. Nine per cent of Australian home seekers spend more than two years looking online for a home [177].
Various websites exist for the purpose of renting or buying real estate. These include Zillow.com, Rent.com, Realestate.com.au, Domain.com.au, Flatmate.com, Trulia.com, Realtor.com and Homes.com. These offer distinct advantages while competing to be market leaders. Figure 5, developed from Batten [178] and Stewart [179], shows the number of consumers, website reach, average visits per consumer and average time spent on a website by consumers for the top five Australian real estate websites. It clearly shows that websites with greater reach and consumer interactivity attract more consumers, and vice versa. These statistics give rise to two key questions: why do some websites get fewer visitors than others? How can online information be improved to facilitate consumers and attract more of them? Ullah [49] recommends using 3D visualisation, VR technology, 360-degree images and cameras and interactive gaming to enhance website visits and attract more consumers.
Since most online information is disseminated through real estate websites, it is imperative that the information available on these websites be enhanced to prevent consumer regrets. This improvement can take the form of accurate, detailed and reliable information being made available to consumers. With improved information, consumers would be better able to make decisions that avert post-purchase regrets.

6.2. Smartphone Applications for Disseminating Information to Real Estate Consumers

Smartphone technologies and apps have disrupted global industries. You might call this the era of the smart and the compact; the real estate industry is also observing online applications-based disruption from powerful, smartphone applications and gadgets. A survey by REALTORS [175] found that among information sources used to search for homes, 72 per cent of searches take place on smartphone apps; 52 per cent of millennials use such apps for this purpose, 48 per cent of generation X and 33 per cent of young boomers. By contrast, 94 per cent of realtors reported using mobile phones daily, fuelling the attraction of these technologies to inverstors.
Various smartphone apps have been developed over time to promote real estate. “Juwai” is an app for a Chinese audience. It has been integrated with a Chinese social channel and has online Chinese social media features. Not surprisingly, it attracts a big audience among both Chinese and English speakers [180]. What makes it stand out is its multi-language feature, which has been clustered with firewall architecture to allow access from outside China, unlike local websites. However, there are clear improvements that could be made to the service to attract a larger audience, given for starters the absence of virtual tours and big data analytics.
“HAYBOL” is an android-based apartment locator app that aims at being used by a particular community, specifically students, as they search for boarding houses or apartments [181]. It presents convenient and affordable housing based on location-specific parameters. StereoCam3D is an android smartphone app that enables the capture of real-time 3D pictures and videos using VR and image stitching [182].
Tablet PCs are also offering distinct advantages. For instance, a realtor from John L. Scott Real Estate reported using a tablet PC to bring his office closer to its clients. He held meetings with clients in coffee shops near their locations. Using the wireless network provided at the coffee shop, the realtor could pull all the relevant information needed to answer consumer questions and promote the business [183]. So far, hundreds of apps have been developed for both real estate agents and consumers. Some of the key apps for agents or owners include Premier Agent®, OpenHome Pro®, DotLoop®, RPR Mobile®, Spotio®, DocuSign®, GoConnect®, EverNote® and Buffer®. For end users, there are apps such as Zillow.com, Trulia.com, Apartments.com, Realor.com, RealEstate.com.au, Hotpads.com, Domain.com.au and Rent.com. Although these websites and apps offer quality services, Technology Adoption and its usage in disseminating information to consumers is limited. If these apps were fine-tuned to provide reliable and abundant information based on the Big9 technologies, consumers would gain reliable and accurate information, make better decisions as a result and be happy with those decisions. Apps related to property valuation that offer abundant and accurate information could also help to improve the decision-making process and reduce consumer regrets.

6.3. The Role of Social Media in Disseminating Information to Real Estate Consumers

Social media includes computer and internet-mediated tools and devices that allow the creation, sharing or exchange of information over networks and in virtual communities [184]. Social media and communications influence both private and business interactions. With the introduction of online marketplaces such as Facebook Market, the role of social media in online information dissemination and business has increased. Social media platforms such as Facebook, Twitter, YouTube and WhatsApp are disrupting and revolutionising the online real estate business [50]. As a result, all major real estate service providers are ensuring they have a social media presence through Facebook pages, YouTube channels, WhatsApp groups, LinkedIn and Twitter. This has given rise to the concept of online quotes and a real-time presence for agents, either in the form of a human or of a bot that can answer frequently asked questions.
According to Lu [185], social media presence can enhance a buyer’s trust by 51 per cent and increase their purchase intention by 44 per cent. Shelton [186] used two years of tweets from two places in the US to develop a novel conceptual model based on social media that predicts the interaction, movement and mobility of people in subsequent real estate development. Zamani and Schwartz [187] used Twitter language to predict real estate market outcomes and conclude that real estate business (marketing and commerce) is the most affected domain. Technology is the most effective component of real estate development.
Rauniar [188] highlights the considerable increase in consumers’ trust and intention to buy as well as the perceived usefulness of a product by its presence on social media, specifically Facebook. Facebook hosts various groups that buy and sell properties. These are particularly well known to younger generations and students who use the internet.
WhatsApp groups and LinkedIn also host real estate offerings such as neighbourhood sales groups and bulk property postings. Another key introduction agent is ResearchGate, which is akin to social media for researchers and provides a space for new ideas in research to be shared among real estate researchers. A key advantage of social media platforms such as Facebook and YouTube is their flexibility in hosting lengthy and informative videos produced at a high quality. Such video-based immersive information can better inform consumers about their potential investments. These visualisations and other forms of immersion have the likelihood of reducing purchase or rent regrets. YouTube offers 360-degree videos that enable consumers to visit and feel properties expansively from their home computers or mobile phones. These provide a great deal more information than 2D photographs, which can hide defects. High-quality 360-degree videos and the flexibility they offer consumers to see the whole picture of a property before its purchase and before an in-person tour can reduce consumer regrets.
Pertinent studies show that online technologies are available but their rate of adoption and incorporation into business-oriented real estate is low. To increase the adoption rate, it is imperative to improve information dissemination mechanisms, by introducing technology-derived analytics such as big data-based informatics and neighbourhood analytics. According to Wang et al. [189], a key barrier to the adoption of such technology is the risk-averse nature of organisations. Traditional organisations prefer “playing it safe” and are usually closed to innovation; risks associated with new technologies are exaggerated instead of being viewed as hurdles associated with any normal process. Other actors hindering adoption are government policies and the risk perception of external stakeholders. Similarly, utility expectations, status gains and loss avoidance, external influences, associated costs and quality-related concerns hinder the adoption process [190]. Other concerns include data usability, privacy and security that are generally associated with innovation and open-mindedness [191]. To increase the rate of adoption, a broader awareness in tandem with policy change is required, while addressing security and privacy concerns. In this context, the introduction of FAA laws in the US, whereby locals can use drones for photography up to a specified height and in certain areas, is a positive step. The implications of this policy and its potential downsides are yet to be observed due to its relative newness. Nevertheless, similar policy changes are needed to pave the way for technology adoption by real estate websites.

7. Technology Adoption Models (TAM)

This section reviews the literature to identify key factors that may affect a consumer’s decision to accept and continuously use SRE technology. The TAM, introduced by Fred Davis in 1989, is an information systems theory that models the use and acceptance of technologies by users [36]. Davis [37] introduced five key components of TAM: perceived usefulness, perceived ease of use, user satisfaction, behavioural intention to use, and actual use. According to Davis, perceived usefulness is the degree to which the use of a system can increase the user’s job performance. Perceived ease of use is the perception that a system is free of effort. User satisfaction is the accomplishment of a user through functions of the system. Behavioural intention to use is the change in behaviour of the user towards more use of the system. Finally, actual use is the increased use of a system after change in behaviour and satisfaction.
TAMs have been used in various studies of information technology and integrated disciplines. They have been used in supply chain management to investigate the resources and theoretical factors of operations [192]. In agriculture, they have been used to measure the effects of social networks [193]. Nguyen [194] used them to explore why the incorporation of technology adoption drivers failed in small businesses. Song [190] used them to explore and augment smartphone technology adoption in China. Sepasgozar [195] used them in relation to construction equipment technologies to investigate the link between customer decision-making processes and the use of construction equipment.
Although extensive applications of TAM exist in global industries, exploration of it in real estate has not been thoroughly reported. In fact, the application of TAM to online retail, websites and e-commerce is the closest reported use of TAM for online real estate management. The key terms and pertinent factors to TAM have been defined in Table 12.
In general, however, the applications of TAM have been generously explored, with considerable research put into identifying additional factors intrinsic to it, thus augmenting the original TAM model. For example, Venkatesh [202] integrated control, intrinsic motivation and emotions with TAM. Hornbæk and Hertzum [201] report a perceived enjoyment, absorption, beauty, flow, goodness, trust, distancing, perceived control, playfulness, usability, self-efficacy and other attributes as key additions to TAM. Jasperson [197] reported systems quality; Lu [199] reported service quality, and Benbasat and Barki [196] reported information quality as key expansions of TAM. Taking a leap from these useful studies, the current study considers six key expansions of TAM: three each for perceived usefulness and perceived ease of use. These are: information quality, systems quality and self-efficacy for perceived usefulness; and service quality, playfulness and usability, and perceived enjoyment for perceived ease of use.

8. Stakeholder Analysis

As part of categorisation 2 of the methodology, stakeholder analysis was performed on the retrieved publications. To systematise this analysis, four key stakeholders were established: consumers (buyers/sellers), agents and associations (AA), government and regulatory authorities (GRA), and complementary industries (CI). The analysis aimed to identify the basic and secondary needs of key stakeholders and observe their interactions. This aids observations of potential areas in which Big9 technologies may be applied to address stakeholder needs. Table 2 provides the definition of these stakeholders considering the reviewed literature.
The identified stakeholders interact in various ways with one another, but the consumer is the central focus of the system, as shown in Figure 6. Both AA and CI provide services to consumers in exchange for revenues. These two stakeholder groups facilitate one another through referrals to keep each other in business. CI provides services to AA in return for revenues. Similarly, GRA protects consumers against unethical and unprofessional practices by AA, CI and others. In return, consumers pay taxes to oil the GRA wheels [44,45]. GRA also supports CI in the form of loans, regulations and protections in return for taxes. AA are supported by GRA and in return are taxed, and compliance with codes, regulations and public safety is ensured [42,43]. Figure 6 shows the interactions of the key stakeholders and how they facilitate one another.
After identifying and defining key stakeholders, the next step in systematic synthesis is the identification of stakeholder needs. The needs of the identified stakeholders are highlighted and presented in Figure 7. Both basic (shown in bold) and key secondary needs were identified. For example, a consumer’s basic need is to buy or sell property. A key secondary need is living in a desirable neighbourhood, with a preference for a suitable and livable neighbourhood that provides desired facilities and amenities [170]. Such preferences vary according to the consumer. For example, one consumer may esteem travel time and distance to his workplace over the nearby presence of restaurants and markets. One may prefer bus stations and hospitals in the neighbourhood; another might be more concerned about the crime rate. These needs are dynamic and change from consumer to consumer, so it becomes not only difficult to formulate a consistent mechanism for facilitating all types of consumers, but their input also becomes vital to the regular updating of services provided [171]. Other consumer needs include, but are not limited to, pricing, mortgages, website search filters and the co-ordination of stakeholders [177].
GRA’s basic need is providing the protection of citizens. Citizens are not limited to consumers, but include AA, CI and others. Thus, GRA protects all stakeholders in return for taxes. To safeguard against the misuse of business power and maintain ethical processes, GRA have such secondary needs as the formulation of standards, ethical codes, and regulations [42,43]. These are made available to AA and CI. Public copies of these codes are also available to consumers as part of the Global Right to Information Act, so an interested consumer can read their rights. The economic growth of the state and political support are other needs of GRA, but the people are the key pillars of a government’s make-or-break scenarios. Therefore, a critical balance must be sought by government that avoids imposing onerous and impossible-to-follow regulations on agencies that could result in the loss of business while eschewing such leniency that leads to the exploitation of consumers by AA or CI. Similarly, keeping the taxes optimal and payable is a key requirement for GRA [175].
A basic need of AA is profit, which is generated by services for consumers. Services include meetings with consumers, keeping track of listings and ensuring that sellers and buyers are matched according to their availability and demands. These needs give rise to secondary requirements such as networking. For example, a consumer may demand that an AA provide him or her with legal assistance. For this, the AA uses his or her network and may refer to a suitable and reliable law firm from CI. Thus, networking and cross referrals are also needs of AA. Other needs include support from GRA and associations, work ethics, and raising their business reputation to increase profitability [40,41].
CI, like AA, has a basic need to make a profit by facilitating consumers and AA. For this to succeed, the secondary needs of networking and referrals play a key role. For example, the two-way process of referral between CI and AA helps both stakeholders to increase their business and profits, since both have profit as their basic need [176]. CI keeps good networking and business relations with AA and consumers, whereas support to them is provided by GRA in return for tax [177].

9. Stakeholder Synthesis

Having identified key stakeholders and established their needs, the last and most important step in synthesis for stakeholder analysis is the exploration of what, who and how for the identified Big9 Disruptive Technologies, as shown in Table 13. In this part, stakeholders’ needs are synthesised according to the impacts of disruptive technologies using a what, who and how analysis. This is done in the light of how SRE can be facilitated through technology, with key questions being: what kind of technology, who as a stakeholder is affected directly by it and how are these stakeholders affected in terms of processes and dissemination mechanisms? This information, if disseminated properly, has the potential to reduce regrets among consumers that arise from a lack of information and its associated bad decision-making. Three processes are considered in this study—buying, selling and facilitating—since consumers are at the core of this study and they can either buy or sell something or be facilitated for it by other stakeholders, as shown in Table 13. Further resources used for disseminating technologies and making them available to key stakeholders are also part of the analysis. These are categorised into two parts: technology, and its dissemination. They are further divided into two sub parts: detection and storage for technology, and control and output for dissemination. Big data, cloud, SaaS and IoT are classified as storage technologies; drones, 3D scanning, wearable tech, VR and AR and AI and robotics are classified as detection technologies.
As an example, consider big data from Table 13 as a disruptive technology. It affects AA, consumers, GRA and CI directly, due to the needs of business, profits and networking. The use of big data has yielded considerable uplift for websites such as Zillow.com, where key big data-based statistics such as market price fluctuations, crime rates and average time spent on a property by consumers are presented [78]. These statistics help consumers by providing market awareness, increasing understanding of the process, and presenting features and requirement needs [49]. Consumers thus become more market aware and tend to make more decisions about buying or renting. Such awareness eliminates regrets related to bad decision-making that may ensue from a lack of information. For GRA, ethics and regulatory challenges are presented by big data disruption: the fine line between what is personal and should not be used by AA or CI for big data statistics and what can be used must be revisited repeatedly to ensure that no citizen’s privacy or security rights are violated [78,79]. For CI, big data increases referrals as contributions by a specific CI tilts user tendencies towards their services.
Thus, in all its operations, big data affects stakeholders through three key processes: buying, selling and facilitating. In terms of dissemination, big data is mainly shared through statistical and graphical outputs. Online media such as websites, social media platforms and electronic gadgets are used as a source of buyer demands and requirements collected through various search engines, page views, transaction records and other sources. Since the statistics are collected from consumer inputs, big data necessarily takes consumer requirements into account and provides pertinent analytics that address consumer needs. Such analytics may eliminate consumer regrets.
Big data has been used by Zillow.com to evaluate property prices and crime rates. Market leading real estate companies such as Prudential Real Estate Investors and USAA Real Estate Company have used it to generate performance databases. Other key components of data mining are AI and robotics, which affect AA, GRA and CI using websites, apps and gadgets. These draw on search histories, speech recognition and sensors and are used in various real estate processes. All the Big9 technologies that can address stakeholder needs, as well as dissemination mechanisms, are shown in Table 13.
Figure 8 displays the schematics for technology-based detection and dissemination, based on Table 13. It indicates detection hardware installed inside an apartment for sale and how potential buyers can access the information. It also presents the roles of key stakeholders. For example, consider two types of drones: aerial drones that collect information based on distances to places and that click aerial photographs; and wall-mounted drones that can produce high-quality images for internal views as well as generate 3D images. 3D scanners are also present as they can generate 3D drawings for maintenance data and 360-degree images for enhanced viewing. Other gadgets with applications include wearable tech and VR glasses, which people inside the house can use to collect VR-related data for simulations and to receive alerts about maintenance or other requirements. All these technologies are connected online to databases and storage servers where cross-communications take place. The databases are equipped with AI and use big data algorithms to generate information. These databases are connected to servers and receive and send information using clouds. These servers act as information hubs for data collected by the technological gadgets and are controlled by web administrators at real estate agencies and associations.
This process involves installing gadgets and data collection tools in the apartment or house that is for sale. These detect and collect information through built-in functions and scanning. This information is sent to databases that are equipped with artificial intelligence and use big data and IoT-based algorithms to separate useful data from the set. This information is stored on servers that use clouds and SaaS, so that consumers and agents can manage and control the output. CI has partial access to this data and can help agents through referrals; they also benefit from cross referrals. Information is passed through ethics checks and government regulations and regulatory authorities before it is released to buyers. Finally, the refined data is made available to potential consumers to aid their real estate decision. Thus, the displayed data occupies a critical position in the buy/rent decision. Such information, after passing through defined checks and regulations, is not only abundant and accurate but also reliable. As a consequence, consumer regret is less likely to arise from poor quality information. Such enhanced decision-making can bridge the gap between real estate consumers and service providers such as agents, website managers and agencies.
Owing to the importance of information and the use of Big9 technologies for its generation, a framework is needed that integrates technologies using a TAM model and so adds value to real estate buy/rent decisions. This is likely to eliminate consumer regrets because the information generated will be based on technology and free of human interference and manipulation. The information can be made available directly to consumers, after passing ethics tests and regulation checks. Furthermore, the position of the key stakeholders who use the technology is not jeopardised but strengthened. For example, real estate agencies and associations control the servers and databases. Complementary industries benefit from referrals and cross referrals. Government provides ethics checks on servers, regulations for agents and agencies, and supports the complementary industries to secure business. Every stakeholder therefore has control over information, yet the level of information made available to the consumer increases. This has the additional benefit of increasing trust between real estate consumers and other stakeholders, which will benefit business and eliminate post-purchase regrets.
The hypothesised TAM framework should operate in such a way that technology is used to upload data to the online platform in line with the needs of the potential consumer. The consumer, who has particular needs, can use the technological applications available to obtain the desired results online. These enhanced results will attract more consumers and enhance their level of satisfaction, which in turn paves the way for more technological adoption in real estate, along with reducing post-purchase regrets. For example, one of the technologies that can be used by CI is wearable tech. It can be used for labour and equipment tracking [156], which opens up more avenues for business as more equipment is sold and demand rises due to the published effectiveness of the gadgets. The need for increased profits by securing more business is addressed through such tracking and monitoring, which in turn provides reliable real-time information and so enhances the information component of the TAM, leading to more perceived usefulness and actual use. Similarly, SaaS, a technology used by both AA and CI, has multiple applications in building maintenance and hazard alerts. It addresses the needs of gaining more business and profit, business networking and referrals and cross referrals between two congruent industries. Increased business enhances the information quality of TAM, whereas the remaining two enhance system quality, thus increasing the perceived usefulness of the technologies and online platforms. Such information is useful for consumers as it enables better decision-making and so eliminates potential regrets related to a lack of accuracy in online information.
Some key needs of consumers, such as crime indices, can be delivered by big data [176]. These indices are computed through big data and IoT-based smart computing and record keeping. An increase or decrease in crime can have an impact on buy/sell decisions, with the data assisting in the filtering process according to neighbourhood preference. This in turns enhances the “perceived enjoyment” aspect of the TAM’s perceived ease of use; the potential buyer thinks more of the enjoyment and quality family time they will spend due to less fear of crime. The user is satisfied and more inclined to purchase the apartment or house. Such enjoyment increases happiness and reduces regrets related to renting or buying properties.
IoT, likewise, can help meet the needs of GRA, which is more concerned with rules and regulations and public safety where information and privacy are concerned. IoT-based intelligent communities offer exclusive access to GRA, which can monitor the entire process and check conformity with business regulations, thus enhancing public safety through the settling of information and privacy concerns. This addresses the service quality aspect of ease of use, and thus paves the way for greater use of the platforms and services. IoT-based data acquisition and provision to consumers can tackle the requirement for abundant data to reduce regrets.
The self-efficacy aspect of a TAM’s perceived usefulness is addressed by the facility of online searching and filters for refining results, features and requirements. These are core concerns of consumers that influence their buy/sell decisions. They can be enhanced by the use of IoT, big data and clouds. Similarly, the aspect of playfulness and usability is enhanced by addressing such needs as understanding the buying/selling process through the uptake of playful technologies such as virtual simulations and game-based interactions. Through simulations and games, potential consumers can walk through an apartment and understand the implications of their future decisions—as well as the associated costs—by virtually adding or removing components. Such playful activities enlighten consumers about a building’s potential usability and enhance their perceived ease of use; the greater the perceived ease of use, the better the consumer’s buy/sell decision and the greater the use of the platforms. Such decisions are more informed than otherwise due to the abundance and accuracy of information provided. This may reduce real estate regrets and bring more business to agencies and agents through recommendations from satisfied consumers.

10. Conclusions

This paper introduced the concept of SRE and defined and presented its core components as sustainability, user centredness, and innovative technologies. Among the innovative technologies, it targeted the Big9 disruptive technologies for disseminating information to real estate consumers. To this end, a total of three disseminating platforms—websites, social media and smartphone applications—were reviewed. The SRE stakeholders in focus were consumers, agents and associations, complementary industries and government and regulatory authorities.
This paper explored the potentials of Big9 technologies in SRE. A comprehensive and systematic review of the Big9 was performed to highlight the fact that the needs of the four key real estate stakeholders could be met by these Big9 technologies. Specifically, the vast potential of the Big9 technologies needs to be transferred to end users, or consumers, who are the actual payers for the technologies and industrial upgrades.
But consumers often have regrets about their buy/rent decisions, and the majority of these relate to a lack of information provided by online channels. In terms of the Big9 technologies, big data-based analytics can offer neighbourhood and locality insights such as crime rates, travel and sale rates, and deliver this data-mined information to consumers according to their queries and requirements, thus helping them to make more informed decisions. This may eliminate their regrets. AI can link consumers to their dream homes because of its predictive analytics and intelligent matching, which not only save time but also provide relevant and detailed property options to consumers, eliminating human error-based regrets. Chat bots and voice recognition tools based on AI may eliminate consumer regrets because they personalise matching and query responses. Such bots also provide financial benefits as they charge 2 per cent commission rather than the 6 per cent that agents charge. Clouds can tackle communication-related regrets by granting consumers access to property details, maintenance schedules, and financial details that increase their access to information. Furthermore, clouds can bridge the gap between agents, consumers and service providers by providing a reliable and active communication link. SaaS-based access to property leases, tenancy and contract documents, security issues and work orders, among other things, can increase a sense of attachment between consumers and their property matters, and also reduce information-related regrets. IoT-based immersive tools make consumers feel more involved and attached to their buildings and properties as they receive alerts and can remotely control their property’s tools, resulting in a sense of ownership and happiness rather than regret, and promoting a positive air between stakeholders. Home automation devices such as Domotics, smart kitchens and smart walls provide ease of use and a relaxing environment. drone-based 3D and 360-degree pictures provide unique, wider angles, detailed and comprehensive pictures and videos that show external details such as sun paths, rooftop conditions, nearby greenery, distances to amenities as well as finer internal details such as fungus growth, crumbling paints, wet corners and others. Such details help consumers to make better decisions and so eliminate information-related regrets. 3D scanning technology provides building and property layouts and drawings that can be merged with building management models to obtain a smart match to space allocation, ensuring a property is utilised well. Similarly, scanned images and layouts can offer consumers the luxury of planning how they will use their property and what changes they desire. This feeling of connection and flexibility can reduce post-purchase regrets that arise among consumers who are not aware of the “fit for purpose” aspect and come to regret their purchase when they discover their property cannot be used as they intended. Wearable techs provide luxury and flexibility to consumers through gadgets and sensors installed at their property. Not only do they provide remote access, but they also gather data based on daily interactions that, if made available to subsequent tenants or buyers, could provide accurate and reliable information to avert purchase regrets. At the same time, the current tenant can obtain visual alerts related to gadgets, equipment, fire hazards, security breaches and maintenance requirements that elevate the sense of ownership and eliminate regrets. Lastly, VR- and AR-based immersive visualisations and 3D tours can help consumers to make better decisions about the purchase or rent of their properties. Such playful attributes and the sense of enjoyment and ability to make changes make consumers more satisfied and eliminate their regrets.
In terms of barriers to the implementation of the Big9 technologies, the traditional rigid mindset of managers, agents and service providers, whereby information is withheld, is a key factor. A rigidity against accepting innovation and an inflexibility towards change among agents, associations and managers is holding the real estate industry back from adopting the Big9 technologies. These technologies can be disseminated to consumers through websites, social media platforms or smartphone apps. Each dissemination mechanism provides resources and platforms for sharing reliable, detailed and accurate information with consumers so that they can make better, more informed decisions. The benefits of the Big9 technologies as outlined in the current study will open discussion and avenues to their adoption, and result in providing more accurate and reliable information to consumers. Based on such high-quality information, consumers can make better decisions and will likely have fewer regrets, if any.

Implications, Limitaions and Future Directions

The current study has practical and theoretical implications. Practically, it provides a mechanism for detecting and disseminating Big9 technology-based information to key stakeholders, especially real estate consumers. In this context, using the information detection and distribution schematics provided in the study, real estate agents and managers can install Big9 technology compatible devices in the properties. This will help collect key information, photos, any discrepancy as well as provide an immersive playful experience to the potential customers to be connected to their future properties through proper information dissemination and immersion using the Big9 technologies. This may increase the sales for the real estate agencies and enhance the trust levels of consumers leading to more consumer satisfaction. Theoretically, it links consumer satisfaction and stakeholder needs to the TAM model, whereby the disruptive technologies can be harnessed to reduce increasing levels of regret among real estate consumers. The framework hypothesised in this study aims to target the gap that exists between the Big9 technologies and consumers through TAM and needs assessment. Each technology addresses core components of TAM, such as perceived ease of use, enjoyment and playfulness whereby consumers are inclined to make behavioural changes to accept and subsequently adopt the technologies. Following the framework as a guideline, web-based programs and extensions and smartphone apps should be provided on online real estate platforms. Such extensions and apps can fill the information void for consumers and equip them with real-time analytics and updates on the localities of their intended properties. Thus, not only is the knowledge gap addressed, but post-purchase regrets can also be controlled as a consequence of the sufficiency and accuracy of the information provided. Furthermore, the holistic considerations of key stakeholders’ needs make the framework a win-win tool for addressing stakeholder needs and business requirements.
This study takes a first step towards adopting disruptive technologies in the real estate industry. It is limited to the Big9 disruptive technologies. Another limitation is the absence of research on such technologies within the industry, which has been compensated by online reports. In future, following similar lines, it will be possible to evaluate the impact of Big9 technologies in terms of how they enhance the industry according to specific stakeholder relations such as the buyer/seller interaction.
Based on the needs of buyers, a technology-based framework can be formulated to help sellers sell their property more conveniently and hence increase its value, thereby increasing overall real estate valuations. Computer programs and web extensions can enhance the “value” aspect of real estate as well as displaying the traditional price and location.

Author Contributions

Conceptualization, F.U. and S.M.E.S.; Methodology, F.U. and S.M.E.S; Software, F.U.; Validation, F.U. and S.M.E.S.; Formal Analysis, F.U.; Investigation, F.U., S.M.E.S. and C.W.; Resources, F.U. and S.M.E.S.; Data Curation, F.U.; Writing—Original Draft Preparation, F.U. and S.M.E.S; Writing—Review & Editing, F.U. and S.M.E.S.; Visualization, F.U. and S.M.E.S.; Supervision, S.M.E.S. and C.W; Project Administration, F.U. and S.M.E.S; Funding Acquisition, S.M.E.S.

Funding

This research received no external funding.

Conflicts of interest

The authors declare no conflict of interest.

References

  1. CB-Insights. Real Estate Tech Funding Reaches New Highs in 2016. Available online: https://www.cbinsights.com/research/real-estate-tech-startup-funding/ (accessed on 26 March 2018).
  2. CB-Insights. Funding to Real Estate Tech Startups Skyrockets in First Half of 2016. Available online: https://www.cbinsights.com/research/real-estate-tech-startup-funding-trends-q2-2016/ (accessed on 26 March 2018).
  3. Warburton, D. The Role of Technology in the Real Estate Industry. Ph.D. Thesis, University of Cape Town, Cape Town, South Africa, 2016. [Google Scholar]
  4. Ferren, B.; Entin, R.; Millsaps, K.; Cocosa, D.; Edwards, M.; Darragh, A. Proceedings of the 17th Annual Realcomm/IBcon Conference, Marriot Rivercenter, San Antonio, TX, USA, 9–10 June 2015; Available online: https://www.24-7pressrelease.com/press-release/406551/realcomm-ibcon-2015-announce-keynote-speakers-renowned-technologist-bran-ferren-to-headline (accessed on 3 September 2018).
  5. Sepasgozar, S.M.; Davis, S.R.; Li, H.; Luo, X. Modeling the Implementation Process for New Construction Technologies: Thematic Analysis Based on Australian and US Practices. J. Manag. Eng. 2018, 34, 05018005. [Google Scholar] [CrossRef]
  6. Danneels, E. Disruptive technology reconsidered: A critique and research agenda. J. Prod. Innov. Manag. 2004, 21, 246–258. [Google Scholar] [CrossRef]
  7. Sepasgozar, S.M.; Davis, S. Construction Technology Adoption Cube: An Investigation on Process, Factors, Barriers, Drivers and Decision Makers Using NVivo and AHP Analysis. Buildings 2018, 8, 74. [Google Scholar] [CrossRef]
  8. Conole, G.; De Laat, M.; Dillon, T.; Darby, J. ‘Disruptive technologies’, ‘pedagogical innovation’: What’s new? Findings from an in-depth study of students’ use and perception of technology. Comput. Educ. 2008, 50, 511–524. [Google Scholar] [CrossRef]
  9. Hall, J.K.; Martin, M.J. Disruptive technologies, stakeholders and the innovation value-added chain: A framework for evaluating radical technology development. R&D Manag. 2005, 35, 273–284. [Google Scholar]
  10. Conole, G. MOOCs as disruptive technologies: Strategies for enhancing the learner experience and quality of MOOCs. RED Rev. Educ. Distancia 2016, 50, 1–18. [Google Scholar] [CrossRef]
  11. Ganguly, A.; Chatterjee, D.; Rao, H. The Role of Resiliency in Managing Supply Chains Disruptions. In Supply Chain Risk Management; Springer: New York, NY, USA, 2018; pp. 237–251. [Google Scholar]
  12. Flavin, M. Disruptive technologies in higher education. Res. Learn. Technol. 2012, 20, 19184. [Google Scholar] [CrossRef]
  13. Dorsey, E.R.; Venuto, C.; Venkataraman, V.; Harris, D.A.; Kieburtz, K. Novel methods and technologies for 21st-century clinical trials: A review. JAMA Neurol. 2015, 72, 582–588. [Google Scholar] [CrossRef] [PubMed]
  14. Ba, S.; Yang, X. Zillow—Online Media Tycoon in US Real Estate Brokerage Industry. In “Internet Plus” Pathways to the Transformation of China’s Property Sector; Springer: New York, NY, USA, 2016; pp. 67–84. [Google Scholar]
  15. Trulia. Real Estate Regrets: Recovery Edition. Available online: https://www.trulia.com/blog/trends/regrets-2017/ (accessed on 25 April 2018).
  16. Chen, J.; Hui, E.C.; Wang, Z. Perceived risk, anticipated regret and post-purchase experience in the real estate market: The case of China. Hous. Stud. 2011, 26, 385–402. [Google Scholar] [CrossRef]
  17. Marte, J. The Biggest Regrets People Have after Buying a Home. Available online: https://www.washingtonpost.com/news/get-there/wp/2017/04/20/the-biggest-regrets-people-have-after-buying-a-home/?noredirect=on&utm_term=.79bc863bc842 (accessed on 8 June 2018).
  18. Zhang, Z.; Qiang, M.; Jiang, H. Finding Academic Concerns on Real Estate of US and China: A Topic Modeling Based Exploration. In Proceedings of the 21st International Symposium on Advancement of Construction Management and Real Estate; Springer: Singapore, 2018; pp. 807–817. [Google Scholar]
  19. Forum, W.E. Innovating in the Digital Economy. In The Global Information Technology Report 2016; Silja Baller, S.D., Lanvin, B., Eds.; Johnson Cornell University: Ithaca, NY, USA, 2016. [Google Scholar]
  20. Winson-Geideman, K.; Krause, A. Transformations in Real Estate Research: The Big Data Revolution. In Proceedings of the 22nd Annual Pacific-Rim Real Estate Society Conference, Queensland, Australia, 17–20 January 2016; pp. 17–20. [Google Scholar]
  21. Guttentag, D. Airbnb: Disruptive innovation and the rise of an informal tourism accommodation sector. Curr. Issues Tour. 2015, 18, 1192–1217. [Google Scholar] [CrossRef]
  22. Cheung, A. How Australia’s Cities of the Future Will Be Shaped by Real Estate Technology Startups. Available online: https://www.commercialrealestate.com.au/news/how-australias-cities-of-the-future-will-be-shaped-by-real-estate-technology-startups/ (accessed on 27 March 2018).
  23. Allameh, E.; Jozam, M.H.; de Vries, B.; Timmermans, H.; Beetz, J. Smart Home as a smart real estate: A state of the art review. In Proceedings of the 18th Annual European Real Estate Society Conference, Eindhoven, The Netherlands, 16–18 June 2011. [Google Scholar]
  24. Gabrys, J. Programming environments: Environmentality and citizen sensing in the smart city. Environ. Plan. D Soc. Space 2014, 32, 30–48. [Google Scholar] [CrossRef]
  25. Cocchia, A. Smart and digital city: A systematic literature review. In Smart City; Springer: Cham, Switzerland, 2014; pp. 13–43. [Google Scholar]
  26. Paroutis, S.; Bennett, M.; Heracleous, L. A strategic view on smart city technology: The case of IBM Smarter Cities during a recession. Technol. Forecast. Soc. Chang. 2014, 89, 262–272. [Google Scholar] [CrossRef]
  27. Nam, T.; Pardo, T.A. Conceptualizing smart city with dimensions of technology, people, and institutions. In Proceedings of the 12th Annual International Digital Government Research Conference: Digital Government Innovation in Challenging Times, College Park, MD, USA, 12–15 June 2011; ACM: New York, NY, USA, 2011; pp. 282–291. [Google Scholar]
  28. Allameh, E.; Heidari Jozam, M.; Vries, B.; de Timmermans, H.; Masoud, M. Smart Homes from vision to reality: Eliciting users’ preferences of Smart Homes by a virtual experimental method. In Proceedings of the First International Conference on Civil and Building Engineering Informatics, Tokyo, Japan, 7–8 November 2013; pp. 297–305. [Google Scholar]
  29. Miller, N.; Sayce, S.; Dixon, T.; Wilkinson, S. Sustainable real estate: A snapshot of where we are. In Routledge Handbook of Sustainable Real Estate; Routledge: Abingdon-on-Thames, UK, 2018; pp. 3–18. [Google Scholar]
  30. Miller, E. Trends and Innovations in the Real Estate Industry. Available online: http://www.innovationmanagement.se/2017/11/21/trends-and-innovations-in-the-real-estate-industry/ (accessed on 5 April 2018).
  31. Shulman, D. Technology vs. Commercial Real Estate: Retail, Office and Hotel Markets Face Major Disruptions. 2014. Available online: http://www.anderson.ucla.edu/lib/email/documents/econ_letter_june_2014.pdf (accessed on 27 March 2018).
  32. PWC. ‘Sustainability’ Transforms Design of Buildings and Developments; PWC Real Estate: Hon Kong, China, 2014. [Google Scholar]
  33. Richard. Table of Disruptive Technologies & Innovation. Available online: https://toptrends.nowandnext.com/2018/03/12/table-of-disruptive-technologies-innovation/ (accessed on 26 August 2018).
  34. Allameh, E.; Heidari Jozam, M.; de Vries, B.; Timmermans, H.; Beetz, J.; Mozaffar, F. The role of Smart Home in smart real estate. J. Eur. Real Estate Res. 2012, 5, 156–170. [Google Scholar] [CrossRef]
  35. Gharaibeh, A.; Salahuddin, M.A.; Hussini, S.J.; Khreishah, A.; Khalil, I.; Guizani, M.; Al-Fuqaha, A. Smart Cities: A Survey on Data Management, Security, and Enabling Technologies. IEEE Commun. Surv. Tutor. 2017, 19, 2456–2501. [Google Scholar] [CrossRef]
  36. Pan, S.; Jordan-Marsh, M. Internet use intention and adoption among Chinese older adults: From the expanded technology acceptance model perspective. Comput. Hum. Behav. 2010, 26, 1111–1119. [Google Scholar] [CrossRef]
  37. Davis, F.D. Perceived usefulness, perceived ease of use, and user acceptance of information technology. MIS Q. 1989, 13, 319–340. [Google Scholar] [CrossRef]
  38. Li, Q.; Wang, Q.; Lin, Z. Effects of consumer visit to online community and product channel on local sales of large consumer goods: Evidence from real estate industry. J. Strat. Inf. Syst. 2017, 27, 191–204. [Google Scholar] [CrossRef]
  39. Yuan, X.; Lee, J.-H.; Kim, S.-J.; Kim, Y.-H. Toward a user-oriented recommendation system for real estate websites. Inf. Syst. 2013, 38, 231–243. [Google Scholar] [CrossRef]
  40. Cucchiarelli, P.; McGreal, S. Real Estate Agents; Elsevier: Amsterdam, The Netherlands, 2012. [Google Scholar]
  41. Gountas, S.; Gountas, J.; Mavondo, F.T. Exploring the associations between standards for service delivery (organisational culture), co-worker support, self-efficacy, job satisfaction and customer orientation in the real estate industry. Aust. J. Manag. 2014, 39, 107–126. [Google Scholar] [CrossRef]
  42. Pan, J.-N.; Huang, J.-T.; Chiang, T.-F. Empirical study of the local government deficit, land finance and real estate markets in China. China Econ. Rev. 2015, 32, 57–67. [Google Scholar] [CrossRef]
  43. Berger, A.N.; Bouwman, C.H.; Kick, T.; Schaeck, K. Bank liquidity creation following regulatory interventions and capital support. J. Financ. Intermediation 2016, 26, 115–141. [Google Scholar] [CrossRef]
  44. Robertson, S.; Rogers, D. Education, real estate, immigration: Brokerage assemblages and Asian mobilities. J. Ethn. Migr. Stud. 2017, 43, 2393–2407. [Google Scholar] [CrossRef]
  45. Chan, S.; Han, G.; Zhang, W. How strong are the linkages between real estate and other sectors in China? Res. Int. Bus. Finance 2016, 36, 52–72. [Google Scholar] [CrossRef]
  46. Grant, D.; Cherif, E. Using design science to improve web search innovation in real estate. J. Organ. Comput. Electron. Commer. 2016, 26, 267–284. [Google Scholar] [CrossRef]
  47. Rae, A.; Sener, E. How website users segment a city: The geography of housing search in London. Cities 2016, 52, 140–147. [Google Scholar] [CrossRef]
  48. Rae, A. Online housing search and the geography of submarkets. Hous. Stud. 2015, 30, 453–472. [Google Scholar] [CrossRef]
  49. Ullah, F.; Speasgozar, S.M.E.; Siddiqui, S.Q. An Investigation of Real Estate Technology Utilization in Technologically Advanced Marketplace. In Proceedings of the 9th International International Civil Engineering Congress (ICEC-2017) “Striving Towards Resilient Built Environment”, Karachi, Pakistan, 22–23 December 2017; Farrukh Arif, S.H.L., Sangi, A J., Eds.; Institute of Engineers Pakistan & NED University: Karachi, Pakistan, 2017; Volume 9, pp. 173–183. [Google Scholar]
  50. Kim, W.; Jeong, O.-R.; Lee, S.-W. On social Web sites. Inf. Syst. 2010, 35, 215–236. [Google Scholar] [CrossRef]
  51. Dalén, A.; Krämer, J. Towards a User-Centered Feedback Design for Smart Meter Interfaces to Support Efficient Energy-Use Choices. Bus. Inf. Syst. Eng. 2017, 59, 361–373. [Google Scholar] [CrossRef]
  52. Shin, J.; Park, Y.; Lee, D. Google TV or Apple TV?—The Reasons for Smart TV Failure and a User-Centered Strategy for the Success of Smart TV. Sustainability 2015, 7, 15955–15966. [Google Scholar] [CrossRef] [Green Version]
  53. Wang, Y.; Wang, L.; Rastegar-Mojarad, M.; Moon, S.; Shen, F.; Afzal, N.; Liu, S.; Zeng, Y.; Mehrabi, S.; Sohn, S. Clinical information extraction applications: A literature review. J. Biomed. Inform. 2017, 77, 34–39. [Google Scholar] [CrossRef] [PubMed]
  54. Papaioannou, D.; Sutton, A.; Carroll, C.; Booth, A.; Wong, R. Literature searching for social science systematic reviews: Consideration of a range of search techniques. Health Inf. Libr. J. 2010, 27, 114–122. [Google Scholar] [CrossRef] [PubMed]
  55. Moher, D.; Liberati, A.; Tetzlaff, J.; Altman, D.G.; Group, P. Preferred reporting items for systematic reviews and meta-analyses: The PRISMA statement. PLoS Med. 2009, 6, e1000097. [Google Scholar] [CrossRef] [PubMed]
  56. Reinhardt, R.; Gurtner, S. Differences between early adopters of disruptive and sustaining innovations. J. Bus. Res. 2015, 68, 137–145. [Google Scholar] [CrossRef]
  57. Wise, N. Outlining triple bottom line contexts in urban tourism regeneration. Cities 2016, 53, 30–34. [Google Scholar] [CrossRef]
  58. Addae-Dapaah, K.; Hiang, L.K.; Sharon, N.Y.S. Sustainability of sustainable real property development. J. Sustain. Real Estate 2009, 1, 203–225. [Google Scholar]
  59. Robinson, S.; McAllister, P. Heterogeneous price premiums in sustainable real estate? An investigation of the relation between value and price premiums. J. Sustain. Real Estate 2015, 7, 1–20. [Google Scholar]
  60. Crosby, N. The Search for a Long Term/Sustainable Real Estate Appraisal/Valuation for Secured Lending. In Proceedings of the 24th Annual European Real Estate Society Conference, Delft, The Netherlands, 28 June–1 July 2017. [Google Scholar]
  61. Deloitte. Sustainable Real Estate: Responsible Property Investment. Available online: https://www2.deloitte.com/lu/en/pages/sustainable-development/solutions/sustainable-real-estate.html (accessed on 4 April 2018).
  62. Angelidou, M. Smart cities: A conjuncture of four forces. Cities 2015, 47, 95–106. [Google Scholar] [CrossRef]
  63. Tukiainen, T.; Leminen, S.; Westerlund, M. Cities as collaborative innovation platforms. Technol. Innov. Manag. Rev. 2015, 5, 16–23. [Google Scholar] [CrossRef]
  64. Kahkonen, K. Role and nature of systemic innovations in construction and real estate sector. Constr. Innov. 2015, 15, 130–133. [Google Scholar] [CrossRef]
  65. Tangkar, M.; Arditi, D. Innovation in the construction industry. Civ. Eng. Dimens. 2004, 2, 96–103. [Google Scholar]
  66. Thompson, B. Innovation in property management. J. Prop. Investig. Finance 2015, 33, 436–445. [Google Scholar] [CrossRef]
  67. Blayse, A.M.; Manley, K. Key influences on construction innovation. Constr. Innov. 2004, 4, 143–154. [Google Scholar] [CrossRef] [Green Version]
  68. Durão, D.; Sarmento, M.; Varela, V.; Maltez, L. Virtual and real-estate science and technology parks: A case study of Taguspark. Technovation 2005, 25, 237–244. [Google Scholar] [CrossRef]
  69. CB-Insights. How This Real Estate Tech Company Pioneered A New Home-Buying Model and Became A Unicorn in 3 Years. Available online: https://www.cbinsights.com/research/report/opendoor-real-estate-teardown-expert-intelligence/ (accessed on 27 March 2018).
  70. Gandomi, A.H.; Sajedi, S.; Kiani, B.; Huang, Q. Genetic programming for experimental big data mining: A case study on concrete creep formulation. Autom. Constr. 2016, 70, 89–97. [Google Scholar] [CrossRef] [Green Version]
  71. Huang, F.; Wang, F. A system for early-warning and forecasting of real estate development. Autom. Constr. 2005, 14, 333–342. [Google Scholar] [CrossRef]
  72. Cao, J.; Chan, J.Y.; Li, H.; Mahdjoubi, L.; Love, P.E. REALMEDIA: Providing multimedia-based real-estate services through the Internet. Autom. Constr. 2001, 10, 275–289. [Google Scholar] [CrossRef]
  73. Kim, S. Forecasting short-term air passenger demand using big data from search engine queries. Autom. Constr. 2016, 70, 98–108. [Google Scholar] [CrossRef]
  74. Cheng, M.-Y.; Hoang, N.-D.; Wu, Y.-W. Hybrid intelligence approach based on LS-SVM and Differential Evolution for construction cost index estimation: A Taiwan case study. Autom. Constr. 2013, 35, 306–313. [Google Scholar] [CrossRef]
  75. Sepasgozar, S.M.; Davis, S.R.; Loosemore, M. Dissemination Practices of Construction Sites’ Technology Vendors in Technology Exhibitions. J. Manag. Eng. 2018, 34, 04018038. [Google Scholar] [CrossRef]
  76. Winson-Geideman, K.; Krause, A.; Lipscomb, C.A.; Evangelopoulos, N. Real Estate Analysis in the Information Age: Techniques for Big Data and Statistical Modeling; Routledge: Abingdon-on-Thames, UK, 2017. [Google Scholar]
  77. Chen, X.; Lu, W. Scenarios for Applying Big Data in Boosting Construction: A Review. In Proceedings of the 21st International Symposium on Advancement of Construction Management and Real Estate; Springer: Singapore, 2018; pp. 1299–1306. [Google Scholar]
  78. Du, D.; Li, A.; Zhang, L. Survey on the applications of big data in Chinese real estate enterprise. Procedia Comput. Sci. 2014, 30, 24–33. [Google Scholar] [CrossRef]
  79. Zhou, L.; Shi, L.; Zhang, S. Database Construction of Real Estate Assessment Based on Big Data. In Proceedings of the 4th International Conference on Computer, Mechatronics, Control and Electronic Engineering, Hangzhou, China, 28–29 September 2015; Atlantis Press: Paris, France, 2015; pp. 92–96. [Google Scholar]
  80. Mathew, P.A.; Dunn, L.N.; Sohn, M.D.; Mercado, A.; Custudio, C.; Walter, T. Big-data for building energy performance: Lessons from assembling a very large national database of building energy use. Appl. Energy 2015, 140, 85–93. [Google Scholar] [CrossRef] [Green Version]
  81. Hoppe, G. 10 Surprising Big Data Statistics. Available online: https://blog.capterra.com/10-surprising-big-data-statistics/ (accessed on 10 April 2018).
  82. Phillimore, J. Housing, home and neighbourhood renewal in the era of superdiversity: Some lessons from the West Midlands. Hous. Stud. 2013, 28, 682–700. [Google Scholar] [CrossRef]
  83. Marr, B. Big Data: 20 Mind-Boggling Facts Everyone Must Read. Available online: https://www.forbes.com/sites/bernardmarr/2015/09/30/big-data-20-mind-boggling-facts-everyone-must-read/#25f3da8a17b1 (accessed on 10 April 2018).
  84. Elmqvist, N.; Irani, P. Ubiquitous analytics: Interacting with big data anywhere, anytime. Computer 2013, 46, 86–89. [Google Scholar] [CrossRef]
  85. Rossini, P. Using expert systems and artificial intelligence for real estate forecasting. In Proceedings of the Sixth Annual Pacific-Rim Real Estate Society Conference, Sydney, Australia, 23–27 January 2000. [Google Scholar]
  86. Kehoe, B.; Patil, S.; Abbeel, P.; Goldberg, K. A survey of research on cloud robotics and automation. IEEE Trans. Autom. Sci. Eng. 2015, 12, 398–409. [Google Scholar] [CrossRef]
  87. Ismail, N. How AI Will Drive Real Estate’s Evolution in 2018. Available online: http://www.information-age.com/ai-will-drive-real-estates-evolution-2018-123469422/ (accessed on 3 April 2018).
  88. Rolls, C. 5 Trends Impacting the Future of Real Estate. Available online: https://www.reinsw.com.au/web/Members/Real_Estate_Journals/201801/5_trends_impacting_the_future_of_real_estate.aspx (accessed on 10 April 2018).
  89. Abramovich, G. 15 Mind-Blowing Stats about Artificial Intelligence. Available online: http://www.cmo.com/features/articles/2017/8/24/15-mindblowing-stats-about-artificial-intelligence-dmexco.html#gs.IujuMlA (accessed on 10 April 2018).
  90. Omohundro, S. Cryptocurrencies, smart contracts, and artificial intelligence. AI Matters 2014, 1, 19–21. [Google Scholar] [CrossRef]
  91. Sileno, G.; Boer, A.; van Engers, T. Reading agendas between the lines, an exercise. Artif. Intell. Law 2017, 25, 89–106. [Google Scholar] [CrossRef] [Green Version]
  92. Bock, T. The future of construction automation: Technological disruption and the upcoming ubiquity of robotics. Autom. Constr. 2015, 59, 113–121. [Google Scholar] [CrossRef]
  93. Morano, P.; Tajani, F.; Torre, C.M. Artificial intelligence in property valuations an application of artificial neural networks to housing appraisal. Adv. Environ. Sci. Energy Plan. 2015, 2015, 23–29. [Google Scholar]
  94. Syam, N.; Sharma, A. Waiting for a sales renaissance in the fourth industrial revolution: Machine learning and artificial intelligence in sales research and practice. Ind. Mark. Manag. 2018, 69, 135–146. [Google Scholar] [CrossRef]
  95. Rafiei, M.H.; Adeli, H. A novel machine learning model for estimation of sale prices of real estate units. J. Constr. Eng. Manag. 2015, 142, 04015066. [Google Scholar] [CrossRef]
  96. White, R.; Banks, E. Computer Networking Problems and Solutions: An Innovative Approach to Building Resilient, Modern Networks; Addison-Wesley Professional: Boston, MA, USA, 2017. [Google Scholar]
  97. Petri, I.; Beach, T.; Rana, O.F.; Rezgui, Y. Coordinating multi-site construction projects using federated clouds. Autom. Constr. 2017, 83, 273–284. [Google Scholar] [CrossRef]
  98. Quintana, B.; Prieto, S.; Adán, A.; Bosché, F. Door detection in 3D coloured point clouds of indoor environments. Autom. Constr. 2018, 85, 146–166. [Google Scholar] [CrossRef]
  99. Patil, A.K.; Holi, P.; Lee, S.K.; Chai, Y.H. An adaptive approach for the reconstruction and modeling of as-built 3D pipelines from point clouds. Autom. Constr. 2017, 75, 65–78. [Google Scholar] [CrossRef]
  100. Schwartz, H. Majority of Professionals Use Multiple Devices at Work More Than 50% of the Time. Available online: https://businessfacilities.com/2015/06/majority-of-professionals-use-multiple-devices-at-work-more-than-50-of-the-time/ (accessed on 28 March 2018).
  101. Dawson, S. Technology: The power of the cloud. J. Real Estate Inst. New South Wales 2016, 67, 35. [Google Scholar]
  102. Mladenow, A.; Novak, N.M.; Strauss, C.; Gregu, M. Clouds and Interclouds in the Real Estate Sector. In Proceedings of the 2015 3rd International Conference on Future Internet of Things and Cloud (FiCloud), Rome, Italy, 24–26 August 2015; IEEE: Piscataway, NJ, USA, 2015; pp. 532–537. [Google Scholar]
  103. Carter, G. 5 Ways VR Is Making the Real Estate Business Better for Everyone. Available online: https://venturebeat.com/2017/08/17/5-ways-vr-is-making-the-real-estate-business-better-for-everyone/ (accessed on 3 April 2018).
  104. Olson, M. Cloud Computing Trends to Watch in 2018. Available online: https://apiumhub.com/tech-blog-barcelona/cloud-computing/ (accessed on 30 March 2018).
  105. Columbus, L. 2017 State of Cloud Adoption and Security. Available online: https://www.forbes.com/sites/louiscolumbus/2017/04/23/2017-state-of-cloud-adoption-and-security/#32dd5f661848 (accessed on 30 March 2018).
  106. Technologies, W. 2017 Cloud Facts and Statistics. Available online: https://www.waterfordtechnologies.com/cloud-computing-stats-2017/ (accessed on 30 March 2018).
  107. WMS, A. The State of the Cloud 2017: Here Come the Enterprises! Available online: https://www.irms360.com/blog_post/state_cloud_2017_here_come_enterprises (accessed on 30 March 2018).
  108. Dion Alley, T.A.; Androvich, J.; Archibald, S.; Baker, A.; Bullock, D.; Fultz, N.; Heusser, S.; Keahey, R.; Krogue, K.; Menon, R.; et al. The Cloud ComputingGuide for Construction. FOCUS, 2012. Available online: http://download.microsoft.com/download/0/0/4/0040A3AC-FC39-441C-B982-D3D8007BBB4D/The-Cloud-Computing-Guide-for-Construction.pdf (accessed on 27 March 2018).
  109. Columbus, L. Roundup of Cloud Computing Forecasts. 2017. Available online: https://www.forbes.com/sites/louiscolumbus/2017/04/29/roundup-of-cloud-computing-forecasts-2017/#4abdf07331e8 (accessed on 30 March 2018).
  110. Li, X.; Li, Y.; Liu, T.; Qiu, J.; Wang, F. The method and tool of cost analysis for cloud computing. In Proceedings of the IEEE International Conference on Cloud Computing, CLOUD’09, Bangalore, India, 21–25 September 2009; IEEE: Piscataway, NJ, USA, 2009; pp. 93–100. [Google Scholar]
  111. Hashem, I.A.T.; Yaqoob, I.; Anuar, N.B.; Mokhtar, S.; Gani, A.; Khan, S.U. The rise of “big data” on cloud computing: Review and open research issues. Inf. Syst. 2015, 47, 98–115. [Google Scholar] [CrossRef]
  112. Cheng, Y.; Chen, Y.; Wei, R.; Luo, H. Development of a Construction Quality Supervision Collaboration System based on a SaaS private cloud. J. Intell. Robot. Syst. 2015, 79, 613–627. [Google Scholar] [CrossRef]
  113. Rohner, P.; Uhl, M.W. The Compensation Portfolio. Finance Res. Lett. 2018, in press. [Google Scholar]
  114. Rentlytics. Available online: https://rentlytics.com/power-of-saas-real-estate-tech/ (accessed on 30 March 2018).
  115. Cusumano, M. Cloud computing and SaaS as new computing platforms. Commun. ACM 2010, 53, 27–29. [Google Scholar] [CrossRef]
  116. Limbasan, A.; Rusu, L. Implementing SaaS solution for CRM. Inform. Econ. 2011, 15, 175. [Google Scholar]
  117. Chan, V. 60 SAAS Statistics That Will Change the Way You Think. Available online: https://content.digitalmediastream.co.uk/blog/60-saas-statistics-that-will-change-the-way-you-think (accessed on 10 April 2018).
  118. Collingwood, N.J. SaaS Company Becomes Largest Provider of Mobile Real Estate Apps in Residential Housing Sector. Available online: https://www.prnewswire.com/news-releases/saas-company-becomes-largest-provider-of-mobile-real-estate-apps-in-residential-housing-sector-262565121.html (accessed on 10 April 2018).
  119. Advice, T. TechnologyAdvice Buyer’s Guide to Real Estate Software. Available online: https://technologyadvice.com/real-estate-software/ (accessed on 10 April 2018).
  120. Wortmann, F.; Flüchter, K. Internet of things. Bus. Inf. Syst. Eng. 2015, 57, 221–224. [Google Scholar] [CrossRef]
  121. Yang, S.-H. Internet of things. In Wireless Sensor Networks; Springer: New York, NY, USA, 2014; pp. 247–261. [Google Scholar]
  122. Symantec, N. 5 Predictions on the Future of the Internet of Things. Available online: https://us.norton.com/internetsecurity-iot-5-predictions-for-the-future-of-iot.html (accessed on 4 April 2018).
  123. Zhilong, T.; Bowen, T.; Yu, H. Applications and Business Models of the Internet of Things Technology in the Real Estate Field. China Real Estate 2015, 18, 006. [Google Scholar]
  124. Dijkstra, M. Blockchain: Towards Disruption in the Real Estate Sector: An Exploration on the Impact of Blockchain Technology in the Real Estate Management Process. Master’s Thesis, Delft University of Technology, Delft, The Netherlands, 2017. [Google Scholar]
  125. Li, C.Z.; Hong, J.; Xue, F.; Shen, G.Q.; Xu, X.; Luo, L. SWOT analysis and Internet of Things-enabled platform for prefabrication housing production in Hong Kong. Habitat Int. 2016, 57, 74–87. [Google Scholar] [CrossRef]
  126. Donovan, N.; Gray, A.; Shaw, R. The Internet of Things and the Real Estate Sector. Available online: https://www.dlapiper.com/en/australia/insights/publications/2018/03/the-internet-of-things-and-the-real-estate-sector/ (accessed on 4 April 2018).
  127. Qu, T.; Lei, S.; Wang, Z.; Nie, D.; Chen, X.; Huang, G.Q. IoT-based real-time production logistics synchronization system under smart cloud manufacturing. Int. J. Adv. Manuf. Technol. 2016, 84, 147–164. [Google Scholar] [CrossRef]
  128. Bonomi, F.; Milito, R.; Natarajan, P.; Zhu, J. Fog computing: A platform for internet of things and analytics. In Big Data and Internet of Things: A Roadmap for Smart Environments; Springer: Cham, Switzerland, 2014; pp. 169–186. [Google Scholar]
  129. NewGenApps. 13 IoT Statistics Defining the Future of Internet of Things. Available online: https://www.newgenapps.com/blog/iot-statistics-internet-of-things-future-research-data (accessed on 10 April 2018).
  130. PostScapes. IoT Market Forecasts. Available online: https://www.postscapes.com/internet-of-things-market-size/ (accessed on 30 March 2018).
  131. Laprie, J.-C.; Arlat, J.; Beounes, C.; Kanoun, K. Definition and analysis of hardware-and software-fault-tolerant architectures. Computer 1990, 23, 39–51. [Google Scholar] [CrossRef]
  132. Edith Burke, M.; O’Callaghan, S.; Quigley, M. The business of digital storytelling: Augmenting information systems with QR codes. J. Syst. Inf. Technol. 2013, 15, 347–367. [Google Scholar] [CrossRef]
  133. Du, J.; Zou, Z.; Shi, Y.; Zhao, D. Zero latency: Real-time synchronization of BIM data in virtual reality for collaborative decision-making. Autom. Constr. 2018, 85, 51–64. [Google Scholar] [CrossRef]
  134. Wu, W.; Yang, H.; Chew, D.A.; Yang, S.-H.; Gibb, A.G.; Li, Q. Towards an autonomous real-time tracking system of near-miss accidents on construction sites. Autom. Constr. 2010, 19, 134–141. [Google Scholar] [CrossRef]
  135. Takin, M.; Peng, J.; Sepasgozar, S.; Ebrahimi, H. A Framework for Using Advanced Visualization Tools for Residential Property Management. In Proceedings of the International Symposium on Automation and Robotics in Construction, ISARC, Taipei, Taiwan, 28 June–1 July 2017; Vilnius Gediminas Technical University, Department of Construction Economics & Property: Vilnius, Lithuania, 2017. [Google Scholar]
  136. Kuzma, J.; O’Sullivan, S.; Philippe, T.; Koehler, J.; Coronel, R. Commercialization Strategy in Managing Online Presence in the Unmanned Aerial Vehicle Industry. Int. J. Bus. Strategy 2017, 17, 59–68. [Google Scholar] [CrossRef]
  137. Luppicini, R.; So, A. A technoethical review of commercial drone use in the context of governance, ethics, and privacy. Technol. Soc. 2016, 46, 109–119. [Google Scholar] [CrossRef]
  138. Newell, C. The use of ‘drones’ in marketing a property for sale. REIQ J. 2017, 2017, 35–37. [Google Scholar]
  139. Sepasgozar, S.M.; Davis, S.; Loosemore, M.; Bernold, L. An investigation of modern building equipment technology adoption in the Australian construction industry. Eng. Constr. Arch. Manag. 2018. [Google Scholar] [CrossRef]
  140. Baker, A. Provocation: Unmanned Aerial Realtors. Cult. Mach. 2015, 16, 1–5. [Google Scholar]
  141. Rao, B.; Gopi, A.G.; Maione, R. The societal impact of commercial drones. Technol. Soc. 2016, 45, 83–90. [Google Scholar] [CrossRef]
  142. Kuzma, J.; Dobson, K.; Robinson, A.; Williams, N. Drones in Business: Can your Organisation Capitalise on this New Technology? Int. J. Bus. Strategy 2016, 17, 59–68. [Google Scholar] [CrossRef]
  143. McNeil, B.; Snow, C. The truth about drones in mapping and surveying. Skylogic Res. 2016, 200, 1–6. [Google Scholar]
  144. Mohan, H. Innovation is the key order in Start Ups–Recent Paradigms in Marketing Vertical. Innovation 2015, 2, 24–30. [Google Scholar]
  145. SoldbyAir. Real Estate Drone Statistics. Available online: https://www.soldbyair.com/real-estate-drone-study (accessed on 11 April 2018).
  146. Young, D. Drones for Real Estate Marketing: Are They Worth It? Available online: http://rismedia.com/2016/12/20/drones-real-estate-marketing/ (accessed on 11 April 2018).
  147. Grand View Research. Scanning Market Analysis by Product (Laser Scanner, Structured Light Scanner, Optical Scanner), by Range (Short Range, Medium Range, Long Range), by Application, and Segment Forecasts, 2014–2025; Grand View Research: San Francisco, CA, USA, 2015. [Google Scholar]
  148. Sepasgozar, S.; Forsythe, P.; Shirowzhan, S. Scanners and Photography: A combined framework. In Australian Universities Building Education Association Annual Conference; Central Queensland University: Brisbane, Australia, 2016. [Google Scholar]
  149. Sepasgozar, S.M.; Shirowzhan, S. Challenges and Opportunities for Implementation of Laser Scanners in Building Construction. In Proceedings of the International Symposium on Automation and Robotics in Construction, ISARC, Auburn, AL, USA, 18–21 July 2016; Vilnius Gediminas Technical University, Department of Construction Economics & Property: Vilnius, Lithuania, 2016; p. 1. [Google Scholar]
  150. Remondino, F. Heritage recording and 3D modeling with photogrammetry and 3D scanning. Remote. Sens. 2011, 3, 1104–1138. [Google Scholar] [CrossRef] [Green Version]
  151. Mahdjoubi, L.; Moobela, C.; Laing, R. Providing real-estate services through the integration of 3D laser scanning and building information modelling. Comput. Ind. 2013, 64, 1272–1281. [Google Scholar] [CrossRef]
  152. Fagandini, R.; Federici, B.; Ferrando, I.; Gagliolo, S.; Pagliari, D.; Passoni, D.; Pinto, L.; Rossi, L.; Sguerso, D. Evaluation of the Laser Response of Leica Nova MultiStation MS60 for 3D Modelling and Structural Monitoring. In Proceedings of the International Conference on Computational Science and Its Applications, Trieste, Italy, 3–6 July 2017; Springer: Cham, Switzerland, 2017; pp. 93–104. [Google Scholar]
  153. Sepasgozar, S.M.; Lim, S.; Shirowzhan, S. Implementation of Rapid As-built Building Information Modeling Using Mobile LiDAR. In Proceedings of the Construction Research Congress 2014: Construction in a Global Network, Atlanta, GA, USA, 19–21 May 2014; pp. 209–218. [Google Scholar]
  154. Arayici, Y. An approach for real world data modelling with the 3D terrestrial laser scanner for built environment. Autom. Constr. 2007, 16, 816–829. [Google Scholar] [CrossRef] [Green Version]
  155. Skibniewski, M.J. Information technology applications in construction safety assurance. J. Civ. Eng. Manag. 2014, 20, 778–794. [Google Scholar] [CrossRef]
  156. Shirowzhan, S.; Sepasgozar, S.; Zaini, I.; Wang, C. An Integrated GIS and Wi-Fi Based Locating System for Improving Construction Labor Communications. In Proceedings of the International Symposium on Automation and Robotics in Construction, ISARC, Taipei, Taiwan, 28 June–1 July 2017; Vilnius Gediminas Technical University, Department of Construction Economics & Property: Vilnius, Lithuania, 2017. [Google Scholar]
  157. Rosalinda, R. Wearable Tech for Real Estate Set to Reshape the Industry. Available online: http://www.jamesdearsley.co.uk/wearable-tech-for-real-estate/ (accessed on 3 April 2018).
  158. Wheatley, M. 4 Pieces of Wearable Tech for ‘Smart’ Real Estate Agents. Available online: http://realtybiznews.com/4-pieces-of-wearable-tech-for-smart-real-estate-agents/98727385/ (accessed on 3 April 2018).
  159. Sepasgozar, S.; Lim, S.; Shirowzhan, S.; Kim, Y. Implementation of as-built information modelling using mobile and terrestrial lidar systems. In Proceedings of the International Symposium on Automation and Robotics in Construction, ISARC, Sydney, Australia, 9–11 July 2014; Vilnius Gediminas Technical University, Department of Construction Economics & Property: Vilnius, Lithuania, 2014; p. 1. [Google Scholar]
  160. Li, R.Y.M.; Ng, D.P.L. Wearable Robotics, Industrial Robots and Construction Worker’s Safety and Health. In International Conference on Applied Human Factors and Ergonomics; Springer: Cham, Switzerland, 2017; pp. 31–36. [Google Scholar]
  161. Ju, A. Functionality in Wearable Tech: Device, as Jewelry, as Body Mediator. In Proceedings of the TEI’16: Tenth International Conference on Tangible, Embedded, and Embodied Interaction, Eindhoven, The Netherlands, 14–17 February 2016; ACM: New York, NY, USA, 2016; pp. 641–646. [Google Scholar]
  162. Smith, N. Wearable Tech: Smart Watches. Eng. Technol. 2015, 10, 20–21. [Google Scholar] [CrossRef]
  163. Kim, K.S.; Mansour, A.-M.; Lundell, J.W. Lessons learned from designing a displayless consumer wearable tech. In Proceedings of the 18th International Conference on Human-Computer Interaction with Mobile Devices and Services Adjunct, Florence, Italy, 6–9 September 2016; ACM: New York, NY, USA, 2016; pp. 585–590. [Google Scholar]
  164. Boga, S.R.C.; Kansagara, B.; Kannan, R. Integration of Augmented Reality and Virtual Reality in Building Information Modeling: The Next Frontier in Civil Engineering Education. In Mobile Technologies and Augmented Reality in Open Education; Kurubacak, G., Altinpulluk, H., Eds.; IGI Global: Hershey, PA, USA, 2018; pp. 1037–1066. Available online: https://www.igi-global.com/chapter/integration-of-augmented-reality-and-virtual-reality-in-building-information-modeling/178245 (accessed on 3 September 2018).
  165. NewsgenApps. 6 VR and AR Statistics: Shaping the Future of Augmented Reality with Data. Available online: https://www.newgenapps.com/blog/6-vr-and-ar-statistics-shaping-the-future-of-augmented-reality-with-data (accessed on 3 April 2018).
  166. Li, M.; Bao, Z.; Sellis, T.; Yan, S. Visualization-aided exploration of the real estate data. In Australasian Database Conference; Springer: Cham, Switzerland, 2016; pp. 435–439. [Google Scholar]
  167. Deacon, H. Smartwatches and Smart Bands Dominate Fast-Growing Wearables Market. Available online: https://www.ccsinsight.com/press/company-news/1944-smartwatches-and-smart-bands-dominate-fast-growing-wearables-market (accessed on 11 April 2018).
  168. Danova, T. The Wearables Report: Growth Trends, Consumer Attitudes, and Why Smartwatches Will Dominate. Available online: https://www.businessinsider.com.au/the-wearable-computing-market-report-bii-2015-7 (accessed on 11 April 2018).
  169. Montreal360. 7 Stats That Will Make You Rethink Virtual Home Tours. Available online: https://www.montreal360virtualtour.com/7-stats-will-make-rethink-virtual-home-tours/ (accessed on 11 April 2018).
  170. Council, F.R.E. Eight Ways Virtual and Augmented Reality Are Changing the Real Estate Industry. Available online: https://www.forbes.com/sites/forbesrealestatecouncil/2017/07/14/eight-ways-virtual-and-augmented-reality-are-changing-the-real-estate-industry/#5b066dc365a3 (accessed on 3 April 2018).
  171. Glebb, B. Five Innovative Ways You Can Use Virtual Reality in the Real Estate Business. Available online: https://rubygarage.org/blog/virtual-reality-in-real-estate (accessed on 3 April 2018).
  172. Brenner, A.J. Virtual Reality: The Game Changer for Residential Real Estate Staging through Increased Presence. CMC Senior Theses. 2017. Available online: https://scholarship.claremont.edu/cmc_theses/1471 (accessed on 27 March 2018).
  173. Sonje, R.D.; Lokhande, R.R.; Joshi, V.V.; Student, B. Virtual Reality for Real Estates. Int. J. Eng. Sci. 2018, 16197. [Google Scholar]
  174. Paredes, A.M. An Examination of Mobile Augmented Reality Apps for the Commercial Real Estate Industry in Mexico City. Master’s Thesis, London School of Business and Finance, London, UK, 2014. [Google Scholar]
  175. National Association of Realtors. Real Estate in a Digital Age2017 Report; National Association of Realtors: Chicago, IL, USA, 2017. [Google Scholar]
  176. Black, W. How Long Is the Average Home Buyer Search? Available online: https://www.zillow.com/advice-thread/How-long-is-the-average-home-buyer-search/455342/ (accessed on 22 October 2017).
  177. Davies, J. How Long Does It Take to Find A House To Buy? Available online: https://www.canstar.com.au/home-loans/how-long-does-it-take-to-find-a-house-to-buy/ (accessed on 22 October 2017).
  178. Batten, G. Real Estate Online Statistics & Demographics—Portals. Available online: https://www.business2.com.au/2010/09/real-estate-online-statistics-demographics-%E2%80%93-portals/ (accessed on 26 October 2017).
  179. Stewart, A. 28 Eye-Popping Real Estate Marketing Statistics. Available online: https://www.paveya.com/28-eye-popping-real-estate-marketing-statistics/ (accessed on 26 October 2016).
  180. Rogers, D. Becoming a super-rich foreign real estate investor: Globalising real estate data, publications and events. In Cities and the Super-Rich; Springer: New York, NY, USA, 2017; pp. 85–104. [Google Scholar]
  181. Consignado, M.L.L.S.; Velasco, M.L.A.; Sanvictores, A.P.A.; Jain, A.M.; Balahadia, F.F. Haybol: An Android-Based Apartment Locator Application. Int. J. Comput. Sci. Res. 2017, 1, 1–9. [Google Scholar] [CrossRef]
  182. Rastogi, U.; Tiwari, R.; Suman, S. StereoCam3D (An Android App. That Lets You Capture Realtime 3D Pics And Videos). Int. J. Sci. Res. Comput. Sci. Eng. Inf. Technol. 2017, 2, 837–840. [Google Scholar]
  183. Krotov, V.; Junglas, I.; Steel, D. The mobile agility framework: An exploratory study of mobile technology enhancing organizational agility. J. Theor. Appl. Electron. Commer. Res. 2015, 10, 1–7. [Google Scholar] [CrossRef]
  184. Thompson, B. Social Media in the Built Environment. In Sustainable Futures in the Built Environment to 2050: A Foresight Approach to Construction and Development; Wiley-Blackwell: Milton, QLD, Australia, 2018; p. 223. [Google Scholar]
  185. Lu, B.; Fan, W.; Zhou, M. Social presence, trust, and social commerce purchase intention: An empirical research. Comput. Hum. Behav. 2016, 56, 225–237. [Google Scholar] [CrossRef] [Green Version]
  186. Shelton, T.; Poorthuis, A.; Zook, M. Social media and the city: Rethinking urban socio-spatial inequality using user-generated geographic information. Landsc. Urban Plan. 2015, 142, 198–211. [Google Scholar] [CrossRef]
  187. Zamani, M.; Schwartz, H.A. Using Twitter Language to Predict the Real Estate Market. In Proceedings of the 15th Conference of the European Chapter of the Association for Computational Linguistics, Valencia, Spain, 3–7 April 2017; pp. 28–33. [Google Scholar]
  188. Rauniar, R.; Rawski, G.; Yang, J.; Johnson, B. Technology acceptance model (TAM) and social media usage: An empirical study on Facebook. J. Enterp. Inf. Manag. 2014, 27, 6–30. [Google Scholar] [CrossRef]
  189. Wang, S.; Feeney, M.K. Determinants of information and communication technology adoption in municipalities. Am. Rev. Public Adm. 2016, 46, 292–313. [Google Scholar] [CrossRef]
  190. Song, J.; Sawang, S.; Drennan, J.; Andrews, L. Same but different? Mobile technology adoption in China. Inf. Technol. People 2015, 28, 107–132. [Google Scholar] [CrossRef] [Green Version]
  191. Picot, S.H.A. Are Users All the Same?–A Comparative International Analysis of Digital Technology Adoption. In Homo Connectus: Einblicke in die Post-Solo-Ära des Kunden; Springer Gabler: Wiesbaden, Germany, 2018; p. 103. [Google Scholar]
  192. Zhang, C.; Dhaliwal, J. An investigation of resource-based and institutional theoretic factors in technology adoption for operations and supply chain management. Int. J. Prod. Econ. 2009, 120, 252–269. [Google Scholar] [CrossRef]
  193. Maertens, A.; Barrett, C.B. Measuring social networks’ effects on agricultural technology adoption. Am. J. Agric. Econ. 2012, 95, 353–359. [Google Scholar] [CrossRef]
  194. Nguyen, T.H.; Newby, M.; Macaulay, M.J. Information technology adoption in small business: Confirmation of a proposed framework. J. Small Bus. Manag. 2015, 53, 207–227. [Google Scholar] [CrossRef]
  195. Sepasgozar, S.M.; Loosemore, M.; Davis, S.R. Conceptualising information and equipment technology adoption in construction: A critical review of existing research. Eng. Constr. Arch. Manag. 2016, 23, 158–176. [Google Scholar] [CrossRef]
  196. Benbasat, I.; Barki, H. Quo vadis TAM? J. Assoc. Inf. Syst. 2007, 8, 7. [Google Scholar] [CrossRef]
  197. Jasperson, J.S.; Carter, P.E.; Zmud, R.W. A comprehensive conceptualization of post-adoptive behaviors associated with information technology enabled work systems. MIS Q. 2005, 29, 525–557. [Google Scholar] [CrossRef]
  198. Mun, Y.Y.; Hwang, Y. Predicting the use of web-based information systems: Self-efficacy, enjoyment, learning goal orientation, and the technology acceptance model. Int. J. Hum. Comput. Stud. 2003, 59, 431–449. [Google Scholar]
  199. Lu, J.; Yao, J.E.; Yu, C.-S. Personal innovativeness, social influences and adoption of wireless Internet services via mobile technology. J. Strat. Inf. Syst. 2005, 14, 245–268. [Google Scholar] [CrossRef]
  200. Ahn, T.; Ryu, S.; Han, I. The impact of Web quality and playfulness on user acceptance of online retailing. Inf. Manag. 2007, 44, 263–275. [Google Scholar] [CrossRef]
  201. Hornbæk, K.; Hertzum, M. Technology acceptance and user experience: A review of the experiential component in HCI. ACM Trans. Comput. Hum. Interact. 2017, 24, 33. [Google Scholar] [CrossRef]
  202. Venkatesh, V. Determinants of perceived ease of use: Integrating control, intrinsic motivation, and emotion into the technology acceptance model. Inf. Syst. Res. 2000, 11, 342–365. [Google Scholar] [CrossRef]
Figure 1. Typical online buy or rent process in SRE.
Sustainability 10 03142 g001
Figure 2. Research method for SRE core components, technologies, online platforms and the incorporation of TAM-based stakeholders’ needs. Note: SRE: smart real estate; SREM: smart real estate management; Tech 1, 2, 3: Technologies 1, 2, 3. The numbers in brackets show the number of retrieved publications.
Sustainability 10 03142 g002
Figure 3. SRE, marketing and dissemination, * Note: Technology (zone with a star) refers to the technologies covering all three domains (marketing and business, information dissemination systems, and SRE core components) at the same time. The numbers in brackets indicate the number of retrieved papers.
Sustainability 10 03142 g003
Figure 4. Technologies and dissemination mechanisms in SRE. * Note: AI: artificial intelligence; VR and AR: virtual and augmented realities; IoT: internet of things.
Sustainability 10 03142 g004
Figure 5. Top 5 Australian real estate website statistics.
Sustainability 10 03142 g005
Figure 6. Key real estate stakeholders’ interactions, * Note: AA: agents and associations; GRA: government and regulatory authorities; CI: complementary industries.
Sustainability 10 03142 g006
Figure 7. Basic and other needs of key real estate stakeholders, * Note: AA: agents and associations; GRA: government and regulatory authorities; CI: complementary industries.
Sustainability 10 03142 g007
Figure 8. Schematics of information detection and dissemination using disruptive technologies. * Note: VR and AR: virtual and augmented realities; AI: artificial intelligence.
Sustainability 10 03142 g008
Table 1. Global technology adoption assessment for the US, Britain and Australia.
Pillar USBritainAustralia
Rank ValueRankValueRankValue
Network readiness55.885.7185.5
Availability of latest technologies26.556.5245.9
Individuals using the internet1387.4% 891.6%1984.6%
Firm-level technology absorption36.1145.7225.6
Capacity for innovation based on adoption capabilities 25.9105.4254.8
Business-to-consumer successful transfer over the internet use26.316.4255.5
Government success in internet and communication technologies (ICT) promotion254.8154.9554.2
Note: The ranking is out of 139 studied countries and the value is out of 7.
Table 2. Key terms used in this paper including their definitions and explanations.
Key-TermExplanation
Smart real estate (SRE)This is an amalgam of user-centred, sustainable and innovative technologies for managing real estate resources efficiently in an urban area, whereby the key information is made available to consumers, managers and agents. The technologies and systems must be sustainable, user-centred and innovative, thereby disrupting traditional practices [28,34].
Smart real estate management (SREM)Just like its industrial doppelganger, the smart city, SREM is the management of the SRE process, including data collection and its processing and dissemination through computers and networked technologies to promote the overall life quality of consumers using real estate services. It has specific measures about privacy and data security [23,28,35].
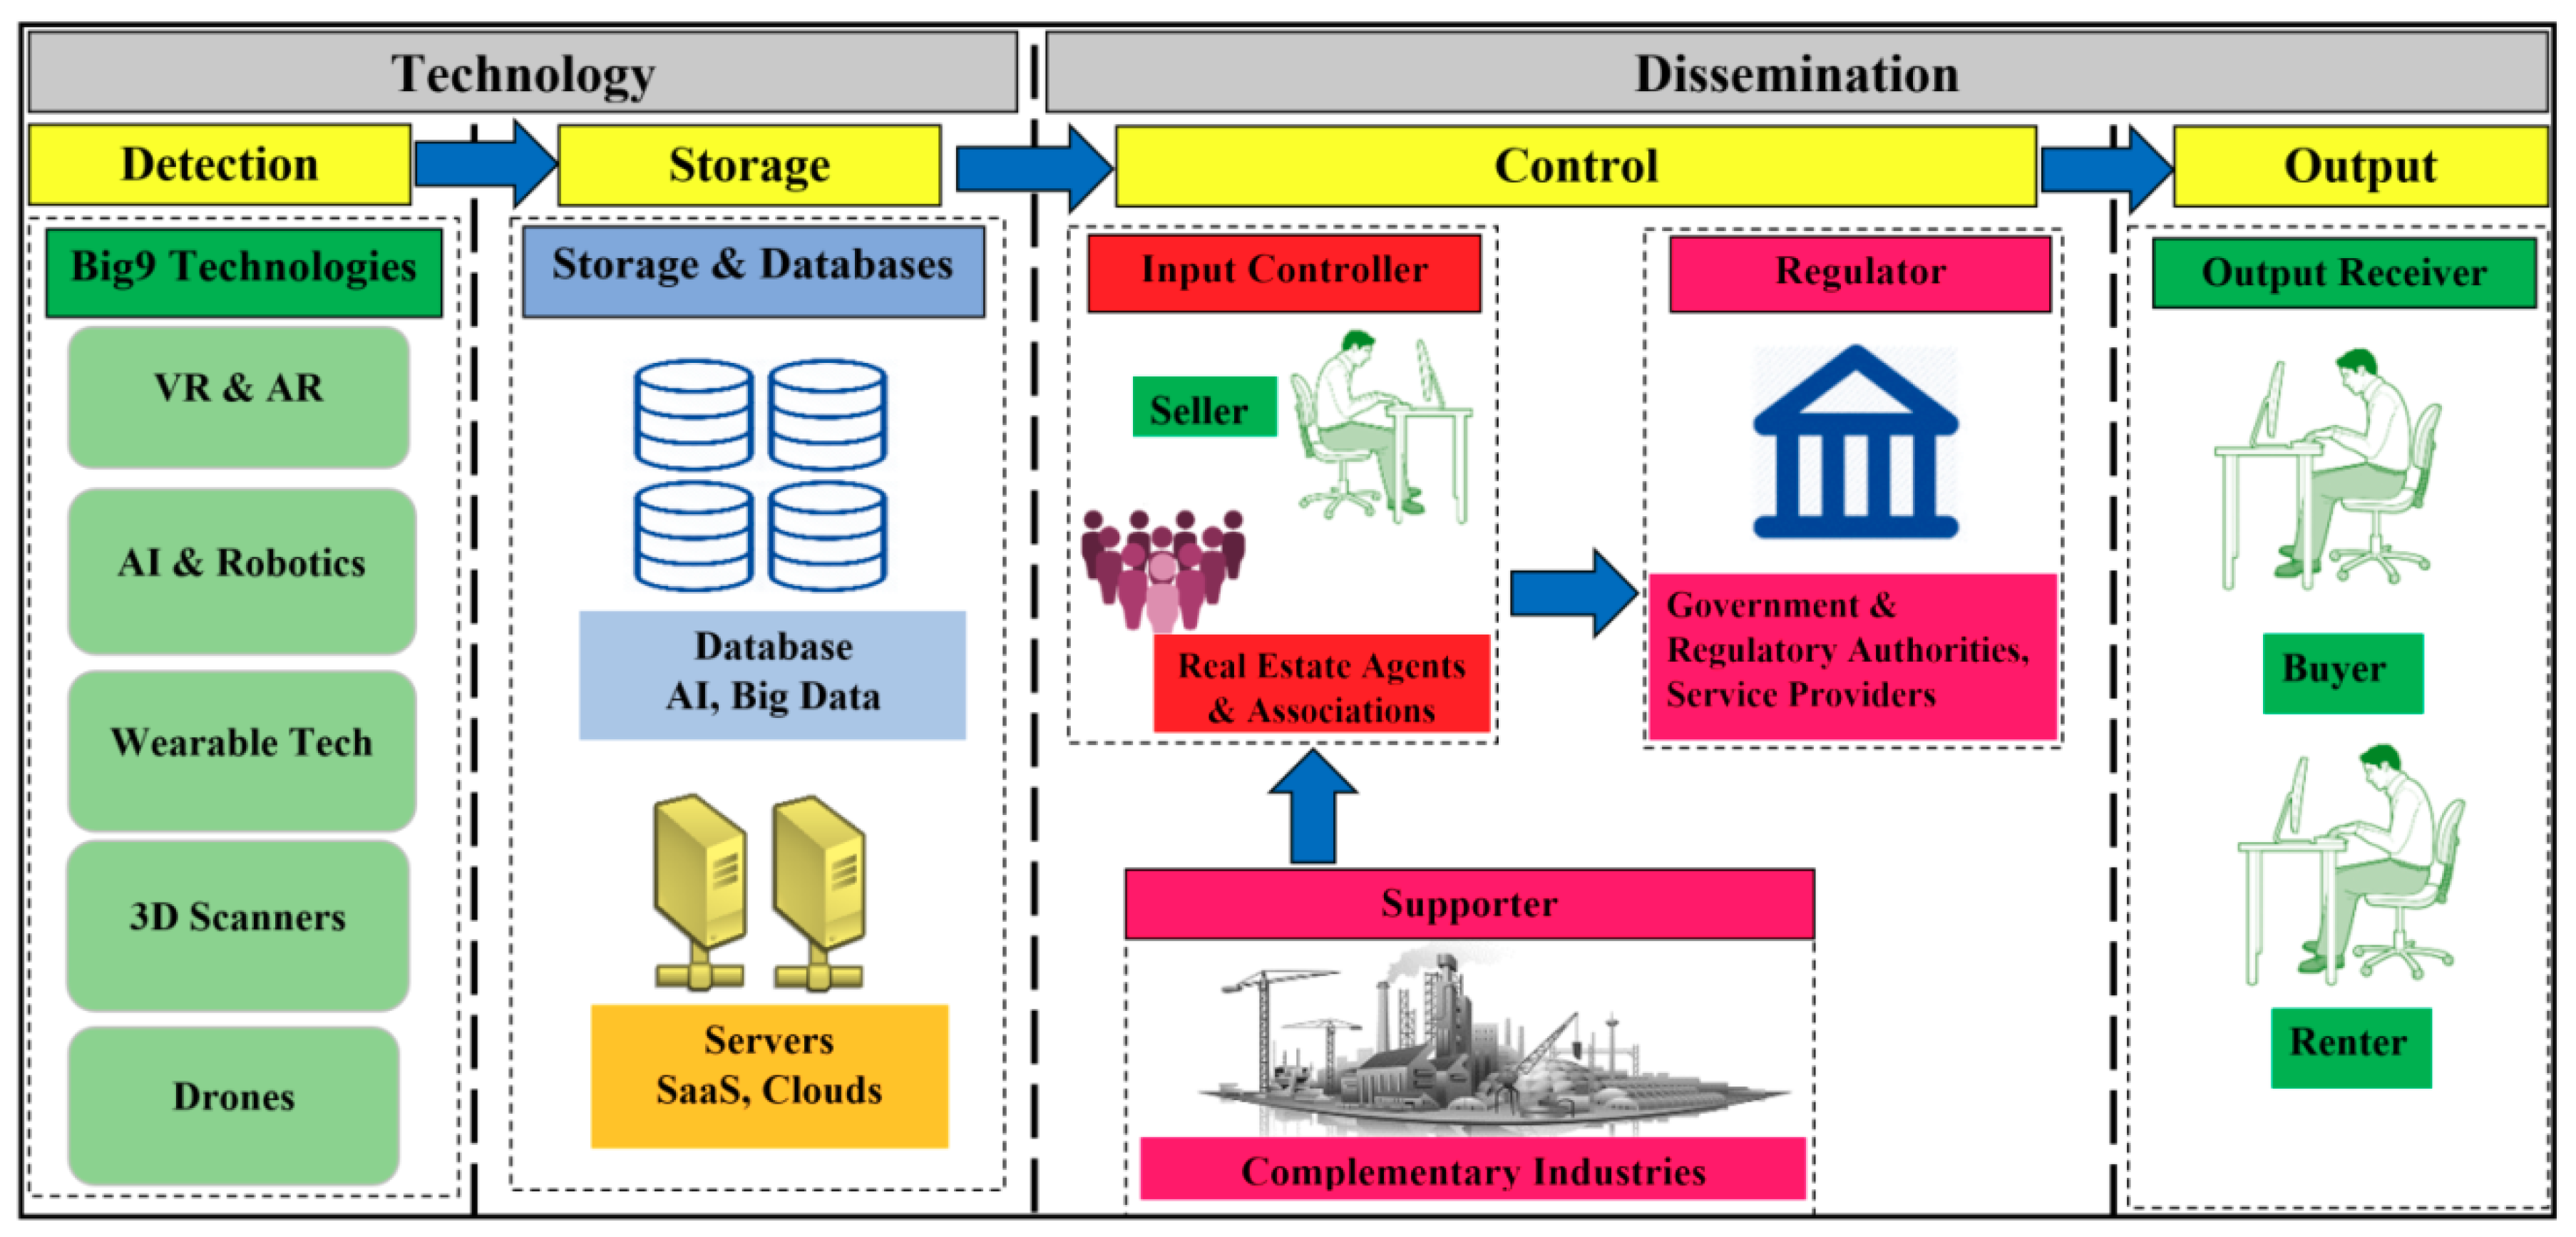
Big9 technologiesThese nine disruptive technologies are the focus of this study. They include big data, virtual and augmented realities (VR and AR), the internet of things (IoT), clouds, software as a service (SaaS), drones, 3D scanning, AI and wearable techs.
Technology adoption model (TAM)This is an information systems theory used for modelling the use and acceptance of technologies by end users. It starts with the perceived ease of use and usefulness to a user of technology that might effect behavioural change as they start to use the technology, thus providing a holistic mechanism [36,37].
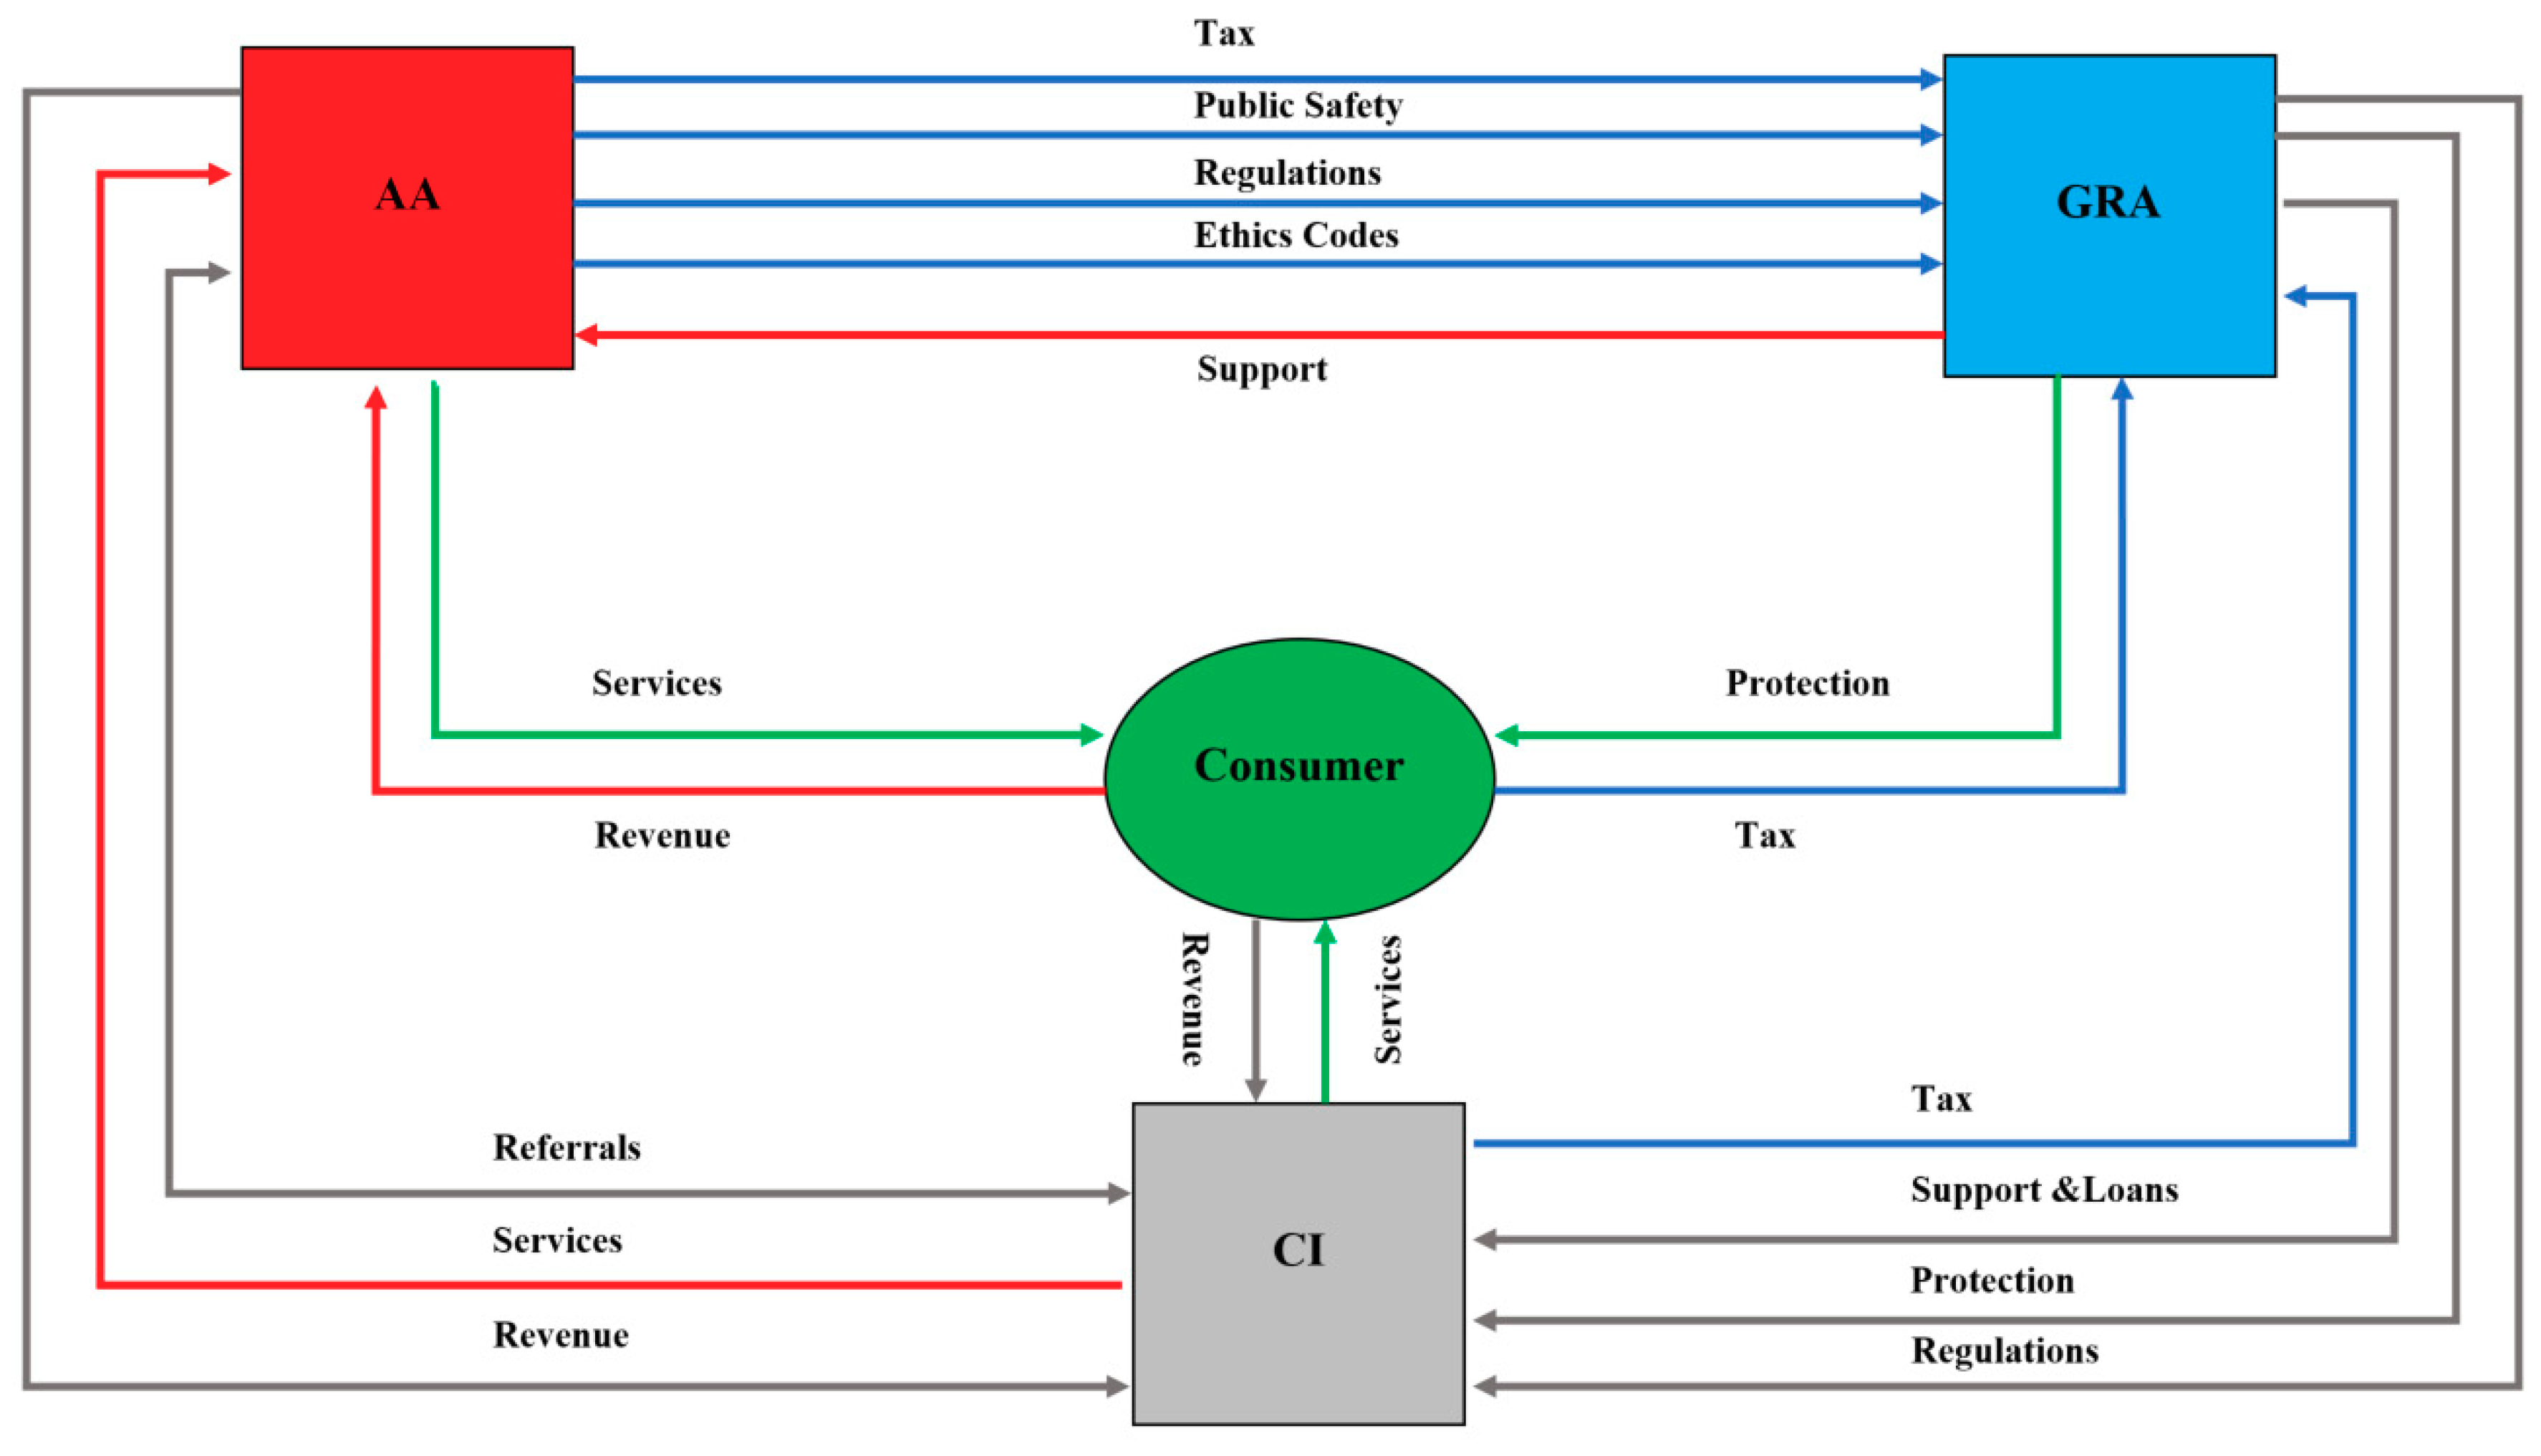
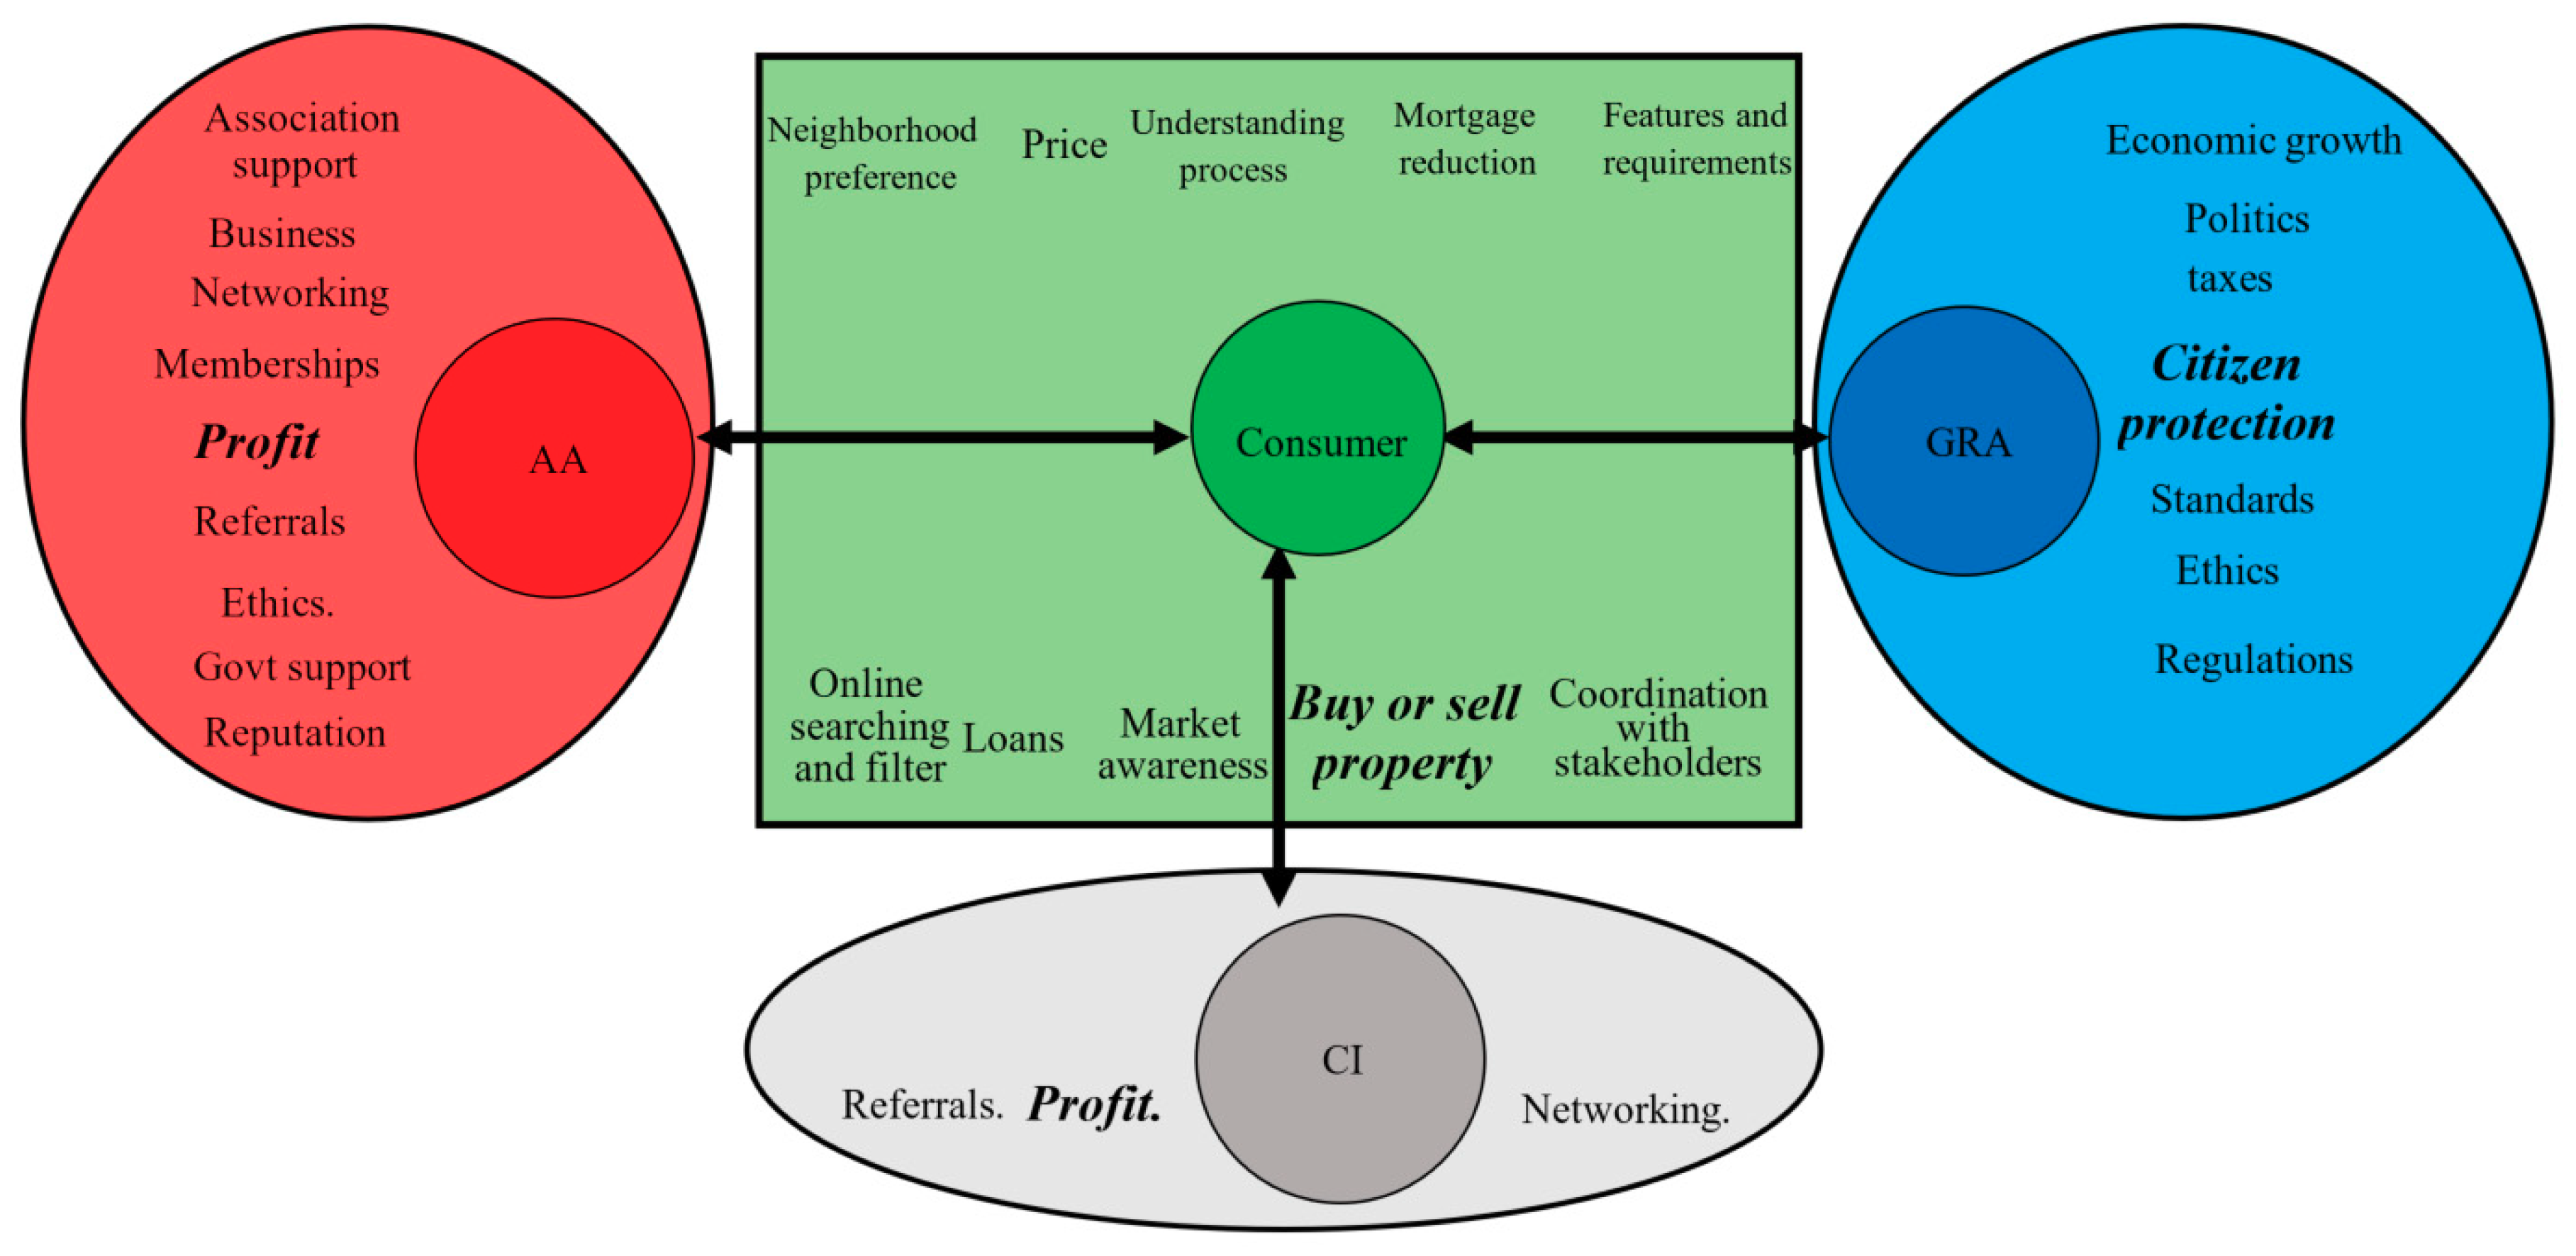
ConsumersThis refers to buyers, renters, end users or sellers of real estate. These are the primary beneficiaries of the transactions because at the end of the process they are the ones with the resources to keep the process alive. They are therefore at the centre of the system [38,39].
Agents and associations (AA)These stakeholders provide services to the consumer in exchange for revenue. This category includes the real estate managers, developers, private investors and other services providing bodies. Associations exist to guide agents and ensure their compliance with codes of ethics and local, state and federal laws [40,41].
Government and regulatory authorities (GRA)Governments aim to protect citizens in exchange for tax revenues. Regulatory authorities exist at local, state and/or federal levels to ensure compliance and to formulate laws for the real estate industry [42,43].
Complementary industries (CI)These industries aim to facilitate consumers, agents and associations in the buying or selling of property. They receive revenues in exchange for their services. They include banks, law firms, inspectors, contractors, lenders and others [44,45]
Table 3. Search strategy and results.
Search EngineStrings and FiltersArticles RetrievedDuplicates
Google Scholar, ASCE Library, Taylor & Francis, Emerald Insight, Science Direct.TOPIC: Real Estate Tech OR Real Estate Technology OR Disruptive Technologies in Real Estate OR Smart Real Estate OR Real Estate Technology Acceptance OR Real Estate Technology Adoption
Information dissemination OR Web based dissemination OR Apps for dissemination
Information retrieval
1 and 2 not 3
English Language Only Limit
2010 and onwards
Editorial or erratum or letter or note or comment
Limit
6 not 7
Remove Duplicates
6542


8760
 
1780
13522
11800
1840
560
1300
 
52
462
 
786


Web of ScienceTOPIC: Real Estate Tech OR Real Estate Technology OR Disruptive Technologies in Real Estate OR Smart Real Estate OR Real Estate Technology Acceptance OR Real Estate Technology Adoption
TOPIC: Information dissemination OR Web based dissemination OR Apps for dissemination
LANGUAGE: (English)
DOCUMENT TYPES: Article OR Abstract OR Book OR Book Chapter OR Meeting Abstract OR Proceedings Paper
Indexes = SCI-EXPANDED Timespan = 2010–2018
TS = “information retrieval”
NOT 4 and 6
NOT Duplicates
5896


7523
 
11853
1256
 
1634
2864
1120
 
47
378
 
695
ScopusTITLE-ABS-KEY (Real Estate Tech OR Real Estate Technology OR Disruptive Technologies in Real Estate OR Smart Real Estate OR Real Estate Technology Acceptance OR Real Estate Technology Adoption
TITLE-ABS-KEY (Information dissemination OR Web based dissemination OR Apps for dissemination)
TITLE-ABS-KEY (Information retrieval)
PUBYEAR AFT 2010 AND LANGUAGE (English)
4 not 3
DOCTYPE Limit
5 and not 6
Not Duplicates
5761


6894
1923
2514
591
184
407
40
171
 
 
196
Grand Total139
Note: ABS: Abstract; KEY: Keywords; DOCTYPE: Document type.
Table 4. A breakdown of the retrieved publications as found in three databases through four screens and online sources from 2010 to 2018.
TypeSub TypeData MiningNetworking ToolsData CollectionDisseminationGeneralMulti TechTotalShare (%)Portion (%)
Big DataAI and RoboticsCloudSaaSIoTDrones3D ScanningWearable TechVR and AR
Journal/Conference papersTechnology-based 6 *5523 *573513362 *904265
Case studies223 *12121111111 *3717
Review papers211 1 *1 241 *125
Online Sources Reports 1 1 312 17729
Webpages22544228529 4521
OthersTheses 1 11 *31 *625
Book chapters1 1 2 1 1 62
Total131017711913121332765 *213
Note: * on a number gives the number of multitech publications. Share shows the percentage of a sub-type of publication whereas portion shows the percentage of the type of publications.
Table 5. Opportunities, potential losses and exploitation levels (OPLEL) analysis for big data.
OpportunitiesPotential LossesExploitation LevelDomainRef
By 2020, 50% of software queries will be over search features, natural language processing, or voice recognition.Three out of 5 leaders fear that inability to adapt to big data will lead to obsolescence.Six million job opportunities. Only 37% success so far. Wal-Mart customers’ transactions provide them with about 2.5 petabytes of data a day.Business intelligence[81]
The digital universe of data to 44 trillion gigabytes (2020). Fifty billion smart devices were connected globally in 5 years A 10% increase in data accessibility results in more than $65 million additional net income. At present, less than 0.5% of all data is ever analysed.In 2017, nearly 80% of photos were taken on smartphones. 73% of organisations had already invested in big data in 2016.Big data revolution[82]
Table 6. OPLEL analysis for artificial intelligence (AI) and robotics.
OpportunitiesPotential LossesExploitation LevelDomainRef
Buyer-seller customisations.
Predictive analytics.
68% automation for agents and auctioneers.
Link 83% people to properties.
PurpleBricks technology bringing commissions down.Manage multiple properties: 200,000 in USA.
Rex bot: answer queries and charges 2% commission only. ‘Rita’: AI digital assistant.
Future of Real Estate[89]
Agenda for next year: 31% of enterprises.
72% business advantage.
61% innovation.
Can manage 85% of customer interactions.
Can manage 40% of mobile interactions.
Can decrease labour productivity by 40%.
AI could jeopardise between 40–75 million jobs worldwide by 2025.AI is being used by 15% of enterprises at present.
77% of consumers use an AI-powered service globally.
Only half of the largest companies with at least 100,000 employees have an AI strategy.
AI as emerging technology[90]
Note: AI: Artificial Intelligence.
Table 7. OPLEL analysis for clouds.
OpportunitiesPotential LossesExploitation LevelDomainRef
73% of companies plan to install software data centres in two years.
Private cloud use shows 77% growth, hybrid 71% and enterprise as 31%.
In future, about 28% of an organisation’s budget will be for clouds.
49% of companies are delaying it due to a lack of skills.Growth from 19% to 57% in the past three years.
46% of organisations are integrating cloud APIs for databases, messenger systems and storage systems.
Cloud adoption and security.[104,105]
25% annual adoption increase 10–30% company growth potential.
41% of businesses plan to invest in clouds.
32% of companies accept they lack skills for it.
52% of companies lack adoption strategies.
30% of Microsoft revenue expected from clouds in 2018.
Amazon uses 31% clouds at present.
Clouds and information technology (IT).[106]
Software-based service to grow by 20% to $46.3bn.
60–70% of all software will be cloud based by 2020.
79% losses in competition by 2011.22% growth rate in 2017.
Spending increase from 4.5 times in 2009 to 6 times through 2020.
Cloud forecasts for business applications.[107,108,109]
Table 8. OPLEL analysis for SaaS.
OpportunitiesPotential LossesExploitation LevelDomainRef
Offer 5 times higher returns.3.2% loss of revenue for fast-growing SaaS-equipped companies with $255 MRR. Median SaaS firms lose about 10% at rate of 0.83% per month. 48% median revenue growth in 2016.
3.9% growth ratio for global SaaS companies.
SaaS oerformance.[117]
Generate 33% per cent more home views per user session.-Smarter Agent Mobile registered more than 4,000,000 unique app downloads in 2014. More than 1 billion properties viewed.Mobile real estate.[118]
Faster follow-up and management abilities of more than 5000 contacts simultaneously.-87% of agents with income over $100,000 use SaaS more.Marketing.[119]
Note: SaaS: software as a service.
Table 9. OPLEL analysis for IoT.
OpportunitiesPotential LossesExploitation LevelDomainRef
The number of IoT devices will increase by 31% to 82.5 million by 2020.
By 2019, 1.9 billion smart home devices are expected to be shipped.
24.75 billion smart clothes are expected to be purchased by 2021.
87% of consumers are unaware of the “IoT”.28.3 million units of IoT devices used in 2016.
Samsung bought SmartThings® to launch itself into smart homes
968,000 smart clothes sold in 2015.
IoT potential[129]
32.4% growth is predicted between 2016 and 2022.
$1.3 trillion to be invested in 2019 with a compound annual growth rate of 17%.
$591.7 billion invested in 2014.
20 billion connected devices counted in 2013.
IoT market forecasts[130]
Note: IoT: internet of things.
Table 10. OPLEL analysis for drones and 3D scanning.
OpportunitiesPotential LossesExploitation LevelDomainRef
83% of home sellers prefer working with an agent who uses drones.
Global real estate drone demands are expected to reach $20.5 billion over 2017–2025.
-3.5x greater customer attraction among agents using drones than their counterparts.Drones future.[145]
Homes with aerial images sell 68% faster than homes with standard images.-Only 9% of agents create listing videos using drones.
403% increase in traffic was noted for an Australian real estate firm with video-based listings.
Real estate marketing.[146]
Structured light scanners are forecast to grow at a CAGR of over 10.4%.
Architectural and engineering usage of 3D scanners will increase by 22% by 2025.
-The 3D laser scanners valued at $3.32 billion generated revenue of about $US2.26 billion in 2015.
Short-range 3D scanners had a market share of over 67.9% in 2015.
Scanners’ market size and trends.[147]
Table 11. OPLEL analysis for wearable tech and VR and AR.
OpportunitiesPotential LossesExploitation LevelDomainRef
Production set to exceed 250 million smart wearables, or 14x more than in 2013.
14 times more sales in 2018 expected as compared with 2013.
-129% increase from 2013.
40% of all wearables are used in North America.
Smart watches and bands.[167]
Expected growth of 35% by 2020.
70% of wearable shipments will be smart watches.
-Apple Watch accounts for 40% count and 48% share of the smart watch market in 2017.Wearables future.[168]
Real estate listings with virtual home tours garner 87% more views.
Virtual tours keep people looking at a website 5 to 10 times longer.
54% of buyers will not look at a property unless it has a virtual tour.6 million people take virtual tours every day.Virtual tours.[169]
VR penetration will reach 25.5% of households by 2021.
VR/AR software revenues to be $2.6 billion by 2025.
-In 2016, 150,000 shipments of AR glasses were made. VR/AR future and market.[166]
Note: VR: virtual reality; AR: augmented reality.
Table 12. A list of selected technology acceptance factors and definitions.
CriteriaDefinitionFactors
Information quality.Reliable and consistent information that inclines a user to use the service [196].Familiar technology, information novelty, 3D models, accurate information, updated information.
Systems quality.Efficient, ethical and smooth systems for delivering and disseminating information [197].Page location, loading speed, loading info structure, website evaluation, website design.
Self-efficacy.The completeness of a platform in terms of more features, more options and filters [198].Content richness, search filters, sorting, maps.
Service quality.Fast, efficient, reliable and responsive services made available to the end user [199].Hyperlinks, customisation, response time, consistent graphics
Playfulness and usability.Offering more interactivity, immersion and gaming attributes to keep the user more involved and enhance use of the platform by attracting more customers [200].Easy return, navigation tools, finding information, learning website.
Perceived enjoyment.The feeling of ease and services at finger tips including neighbourhood aspects for a better lifestyle [201].Data analytics, crime rates, neighbourhood insights, distances to parks, virtual tours.
Table 13. Who, what and how analysis of disruptive technologies for SRE.
WhatWhoHow
TechStakeholders Affected DirectlyNeeds Addressed DirectlyPrimary Dissemination MechanismResources Used
Big dataAABusiness, profit, networkingWebsites, social media and gadgets to facilitate buy, rent or sellLand resources, realties, buyer’s requirement, owner’s info, buyer’s demands, transaction records, page views
ConsumersMarket awareness, Understanding process
Features and requirements
GRAEthics, regulations
CIReferrals
CloudAABusiness, profit, networking, referrals, reputationWebsites, apps, gadgets and social media to facilitate buy, rent or sellInternet connected devices, shared storage, Recent searches, Stakeholder preferences, High-speed internet, Remote access servers
ConsumerBuy or sell, price, stakeholder co-ordination, online searching and filter
CINetworking, profit, referrals
GRAEthics, regulations
SaaSAABusiness, profit, networking, referrals, reputationWebsites, apps, gadgets and social media to facilitate buy, rent or sellComputer software, High speed internet, remote access servers, shared storage
CINetworking, profit, referrals
IoTAABusiness, profit, networkingWebsites and gadgets to facilitate salesTelemetry, sensors, local networks, remote access servers, consumer habits
ConsumerOnline searching and filters, Understanding process, market awareness
CINetworking
GRAEthics, public safety, regulations
DronesAABusiness, profit, ethicsWebsites and gadgets to facilitate buy, rent or sellUAVs, flight routes, wi-fi or bluetooth connectivity
ConsumerNeighborhood preference, features and requirements, buy/sell
CIProfit
GRAEthics, public safety, regulations
3D scanningAABusinessGadgets to facilitate buy, rent or sellLasers, building drawings, training
CIProfit
GRAEthics, public safety, regulations
Wearable techAABusinessGadgets and apps to facilitate buy, rent or sellHuman resources,
Bluetooth/Wi-Fi connectivity,
smart processors
CIProfit, referrals
GRAPublic safety, regulations
VR & ARAABusinessGadgets, websites and apps to facilitate buy, rent or sellVR AR gadgets, Bluetooth or Wi-Fi connectivity, high speed internet, building drawings or plans
CIProfit, referrals
ConsumerNeighborhood preference, features and requirements, Buy or sell, online searching and filters, price
GRARegulations
AI and roboticsAABusiness, profitWebsites, apps and gadgets to facilitate buy, rent or sellSpeech recognition, search history, page views, buyer’s demands and info, sensors
ConsumerMarket awareness, features and requirements
GRAEthics, regulations
Note: AA: agents and associations; CI: complementary industries; GRA: government and regulatory authorities; AI: artificial intelligence, SaaS: software as a service, IoT: internet of things; VR and AR: virtual reality and augmented reality; UAV: unmanned aerial vehicle.

