Article

Spatial Association and Effect Evaluation of CO2 Emission in the Chengdu-Chongqing Urban Agglomeration: Quantitative Evidence from Social Network Analysis

1
School of Management, Xi’an University of Architecture and Technology, Xi’an 710055, China
2
Department of Ecosystem Science and Management, Pennsylvania State University, Forest Resources Building, University Park, PA 16802, USA
3
College of Engineering, University of California Berkeley, Berkeley, CA 94720, USA
*
Author to whom correspondence should be addressed.
Sustainability 2019, 11(1), 1; https://doi.org/10.3390/su11010001
Submission received: 29 October 2018 / Revised: 11 December 2018 / Accepted: 17 December 2018 / Published: 20 December 2018
(This article belongs to the Section Sustainable Urban and Rural Development)

Abstract

:
Urban agglomeration, an established urban spatial pattern, contributes to the spatial association and dependence of city-level CO2 emission distribution while boosting regional economic growth. Exploring this spatial association and dependence is conducive to the implementation of effective and coordinated policies for regional level CO2 reduction. This study calculated CO2 emissions from 2005–2016 in the Chengdu-Chongqing urban agglomeration with the IPAT model, and empirically explored the spatial structure pattern and association effect of CO2 across the area leveraged by the social network analysis. The findings revealed the following: (1) The spatial structure of CO2 emission in the area is a complex network pattern, and in the sample period, the CO2 emission association relations increased steadily and the network stabilization remains strengthened; (2) the centrality of the cities in this area can be categorized into three classes: Chengdu and Chongqing are defined as the first class, the second class covers Deyang, Mianyang, Yibin, and Nanchong, and the third class includes Zigong, Suining, Meishan, and Guangan—the number of cities in this class is on the rise; (3) the network is divided into four subgroups: the area around Chengdu, south Sichuan, northeast Sichuan, and west Chongqing where the spillover effect of CO2 is greatest; and (4) the higher density of the global network of CO2 emission considerably reduces regional emission intensity and narrows the differences among regions. Individual networks with higher centrality are also found to have lower emission intensity.

1. Introduction

Global warming, a result of greenhouse gas (GHG) emissions including carbon dioxide (CO2), has been given importance by governments worldwide. CO2 emissions from fuel combustion in China, the world’s largest producer of CO2 emissions, totaled 8.5 billion tonnes in 2013, which accounted for 25% of global CO2 emissions [1]. Beijing is facing mounting pressure to lower its CO2 emissions. Urban areas are the main space for humans to live and work, and with the acceleration of industrialization and urbanization in China, urban areas have become the main areas of economic activity and also the major source of CO2 emissions, accounting for about 85% of the country’s total GHG emissions [2,3]. Therefore, research on how to achieve low-carbon urban development has become one of the most important policy issues for the Chinese government.
In the process of China’s urbanization, urban agglomerations have replaced single cities and became the most dynamic areas in Chinese economic development [4]. As the most complex urban spatial pattern, urban agglomeration is the agglomeration of urban economies in terms of spatial organization and structure. Meanwhile, urban spatial interactions represent the exchange of multiple regional elements, for example, population, resources, technologies, and so on. Urban economic agglomeration not only affects the energy demand and efficiency of each urban unit, but it also influences energy-related CO2 emission levels and their spatial distribution [5]. In this context, it is necessary to explore the spatial features of CO2 emission at the level of urban agglomeration, which may help in the roll out of efficient policies for coordinated CO2 emission reduction and low-carbon urban development [6].
Because China is in a critical period of urbanization, city-level CO2 emission has been a research focus among scholars, both at home and abroad. Some have focused on the evaluation of CO2 emissions in manufacturing [7], transportation [8,9], households [10,11], and buildings [12,13], and have found that these sectors are the main sources of CO2 emission in urban areas. On the other hand, some scholars have suggested that the driving forces of urban CO2 emission include population [14], the economy [15,16,17], technology [18,19,20], energy structure [21], urbanization [22], and spatial patterns [23,24], and have achieved many valuable conclusions. For example, the growing urban population and changing age structure exert positive effects on city-level emissions, while the downsizing of families and expansion of the migrant urban population fuel emissions [25]; growth in economic activity is the most fundamental contributor to the rising city-level emissions [26,27]; advancing technologies, in particular, breakthroughs in energy are the major means of lowering emissions [28] and rising emissions could be curbed by the adjustment of industrial structure and energy consumption patterns [29,30,31]. Other driving forces involve urbanization and irregular changes in urban spatial patterns [23,24]. Several previous studies have used spatial econometric approaches to explore the spatial aggregation of CO2 emissions, and have found that the top Chinese urban emitters are in the south and east coastal regions, while those contributing the least are from the west and middle regions [32,33,34,35].
However, CO2 emissions are not only a simple urban environmental problem, but can transmit to neighbouring cities through natural factors and economic mechanisms, such as atmospheric circulation and industrial transfer [3]. Therefore, a city’s CO2 emissions are not only affected by factors such as its own energy consumption, but also by the surrounding cities. The increasing dependence on the trends in external force has given rise to distinctive spatial associations and aggregations in city-level emissions [36,37], and the closer two urban areas are, the higher their dependence and aggregation is [38]. Urban agglomerations are the spatial carriers of regional economic integration. This means that local city governments should actively take cooperative measures in the process of carbon emission reduction, and to investigate and control the spatial correlation effects of carbon emissions. Unfortunately, few studies have analyzed the effects of urban agglomeration on carbon emissions from the perspective of spatial interactions. Even though the above studies involved the spatial aggregation of CO2 emissions, they did not systematically address whether spatial aggregation is derived from endogenous or exogenous spatial interactions. Moreover, the widely adopted spatial econometric approach excels at quantifying the aggregation of city-level emissions on the basis of spatial factors but fails to reveal their spatial interactions and the spatial effects of urban agglomeration on carbon emissions.
In urban agglomerations, different urban areas can be linked by spatial interactions in many aspects such as society, economic, energy, CO2 emissions, and so on [39]. The spatial interaction of CO2 emissions between two urban areas may be measured by the point-line interaction structure; however, it is difficult to show the spatial interactions of the whole area. Demonstrating spatial interactions in a network-based way is even more challenging [4]. Networks can identify the mechanisms of the spatial interactions of CO2 emissions and give insight into the changes in spatial interactions. In order to further understand the urban spatial interactions of CO2 emissions in a comprehensive way, a network approach is needed.
Thus, this paper uses social network analysis (SNA) theory to map the spatial interactions of urban CO2 emissions inside urban agglomerations. SNA is a good tool to investigate the network relations and global structure features between individuals within a system. In urban systems, SNA has been applied to measure population migration [40,41,42], urban structure [43], urban construction [44], the urban structure of the ecological relationships [45], and so on.
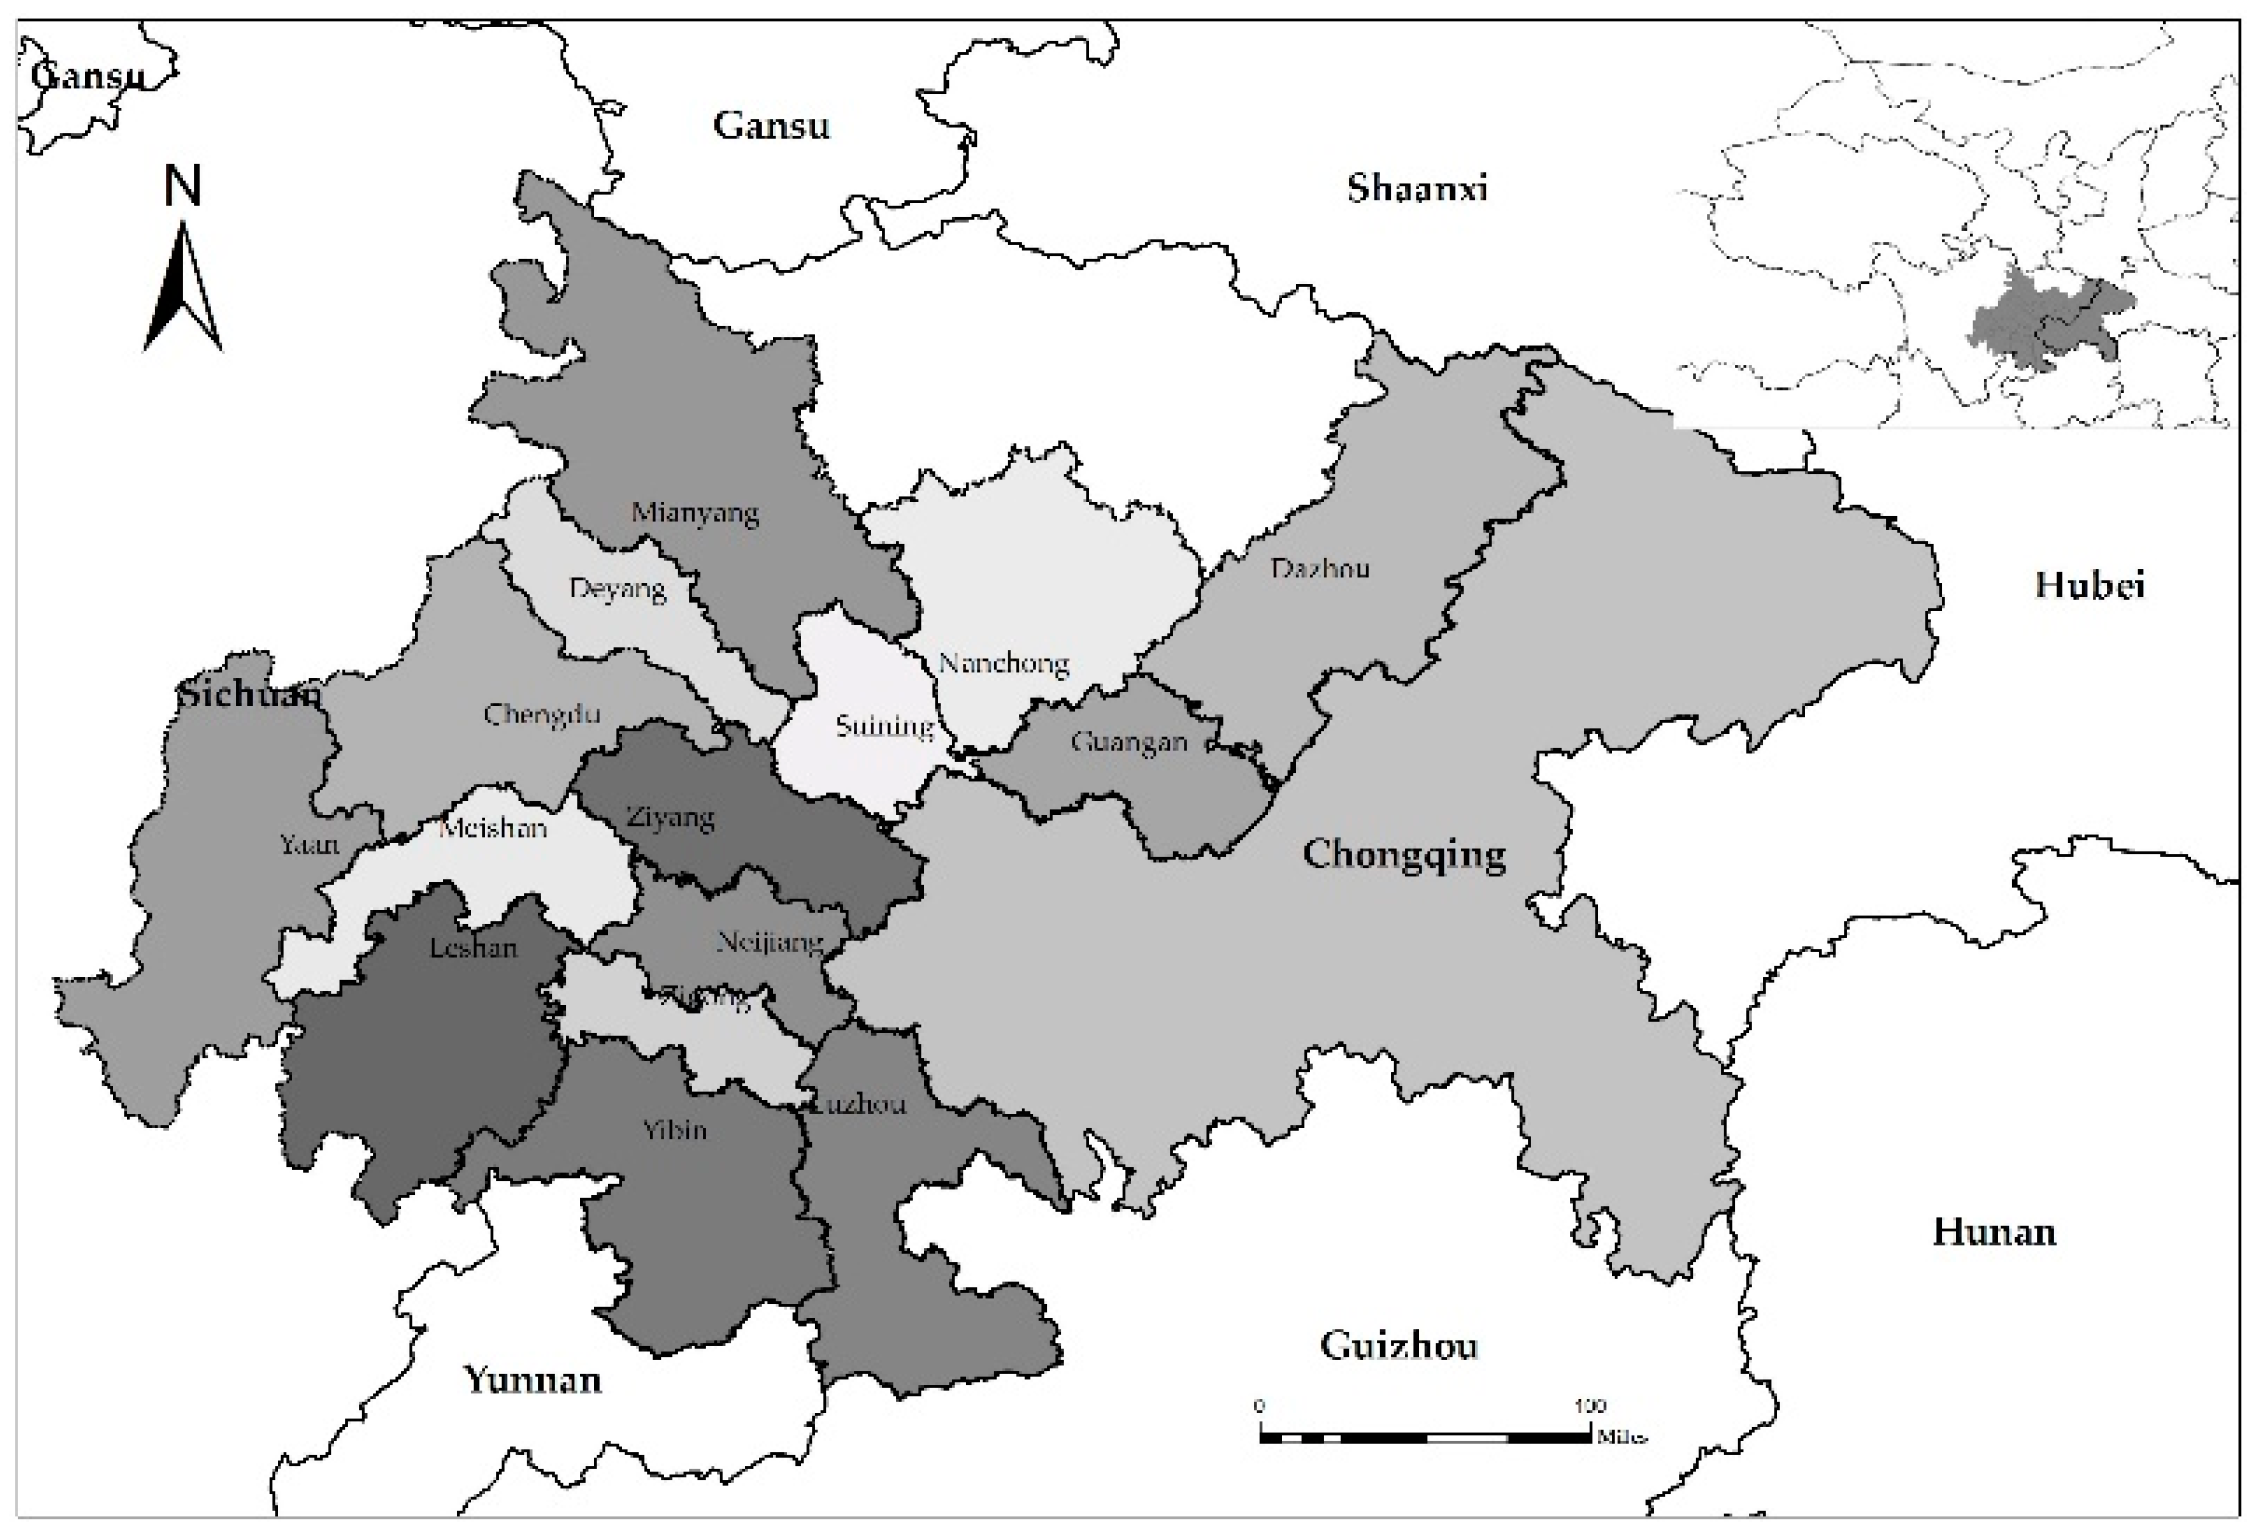
This paper aims to explore the structure and characteristic of spatial interactions of urban CO2 emissions in urban agglomerations. We focused specially on urban agglomeration in Chengdu-Chongqing, Southwest China. Based on the CO2 emission data in 16 sampled urban areas from 2005–2016, we constructed spatial association networks of CO2 emissions and analyzed the structural roles of urban areas in the spatial association networks. Furthermore, we applied a panel regression model to analyze the impacts of the different structural roles of urban areas on CO2 emissions.

2. Study Area, Methods, and Data

2.1. Study Area

The Chengdu-Chongqing urban agglomeration was selected as the spatial study area, since this area is one of the three largest agglomerations along the Yangtze River Economic Zone. By integrating the Yangtze River Economic Zone Strategy with the West Development strategy, this area has taken the lead in developing Western China. According to the Chengdu-Chongqing Urban Agglomeration Development Plan, the area covers Chongqing city and 15 cities in Sichuan Province, including Chengdu, Zigong, Luzhou, Deyang, and Mianyang, as shown in Figure 1. The area stretches over 1.85 million km2, supports 90.94 million residents and its GDP is registered at 0.544 trillion USD, accounting for 1.92%, 6.65%, and 5.49% of the national total, respectively.

2.2. Methods

2.2.1. Constructing a Spatial Association Network of CO2 Emissions

Determining the urban associations of CO2 emission is critical when constructing the spatial association network of CO2 emissions in the Chengdu-Chongqing urban agglomeration. The gravity model is a useful method to measure the forces in space between two regions, which can be used to quantitatively describe the attraction between cities. Since its proposal, the gravity model has been widely used in urban network research, including urban transportation networks [46], migration networks [47,48], and commodity flow networks [49]. In recent years, some scholars have applied it to the field of energy and CO2 emissions. For example, Han, et al. used the gravity model to build a spatial weight matrix based on geographical and economic impact and found that it can improve the spatial associations of CO2 emissions [3].
The basic gravity model assumes that the spatial connection between two cities is proportional to the size of each city and inversely proportional to the distance between the two cities [50]. The basic form is as follows:
I i j = k M i M j D i j b ,
where Iij represents the gravity index, referring to the association between city i and city j, Mi, Mj represents the city size, and Dij represents the distance between two cities. k is the empirical constant and b is the coefficient of friction, which can be obtained after running a regression [50].
Geographical proximity and economic correlation are important factors that influence the spatial layout of economic activities, which directly leads to an increase in energy demand, and thus, the production a large amount of CO2 emissions. Therefore, when constructing an urban CO2 emission association network, geographical distance and economic distance should be considered in combination. Additionally, the population factor has a significant impact on urban CO2 emissions. Therefore, based on the consideration of relevant factors, we improved the traditional gravity model to make it applicable to the construction of inter-city CO2 emission associations. The specific model is as follows:
y i j = k i j P i T i G i 3 P j T j G j 3 D i j , k i j = T i T i + T j
where i and j represent cities, yij is the association intensity of CO2 emissions between city i and city j, P is the size of the population, T is the total urban CO2 emissions, G is the GDP of the urban area, and Dij is the mileage between city i and city j. To avoid the excessive impact of distance on the associations of city-level CO2 emissions, we set the friction coefficient as b = 1. The gravity matrix of CO2 emissions is calculated by Equation (2). In order to reflect the CO2 emission associations between cities more accurately, the average inter-city association intensity in 2005 (the specific value is 1976) was selected as the threshold value in this paper. When the association intensity was higher than the threshold value, we considered that there was a CO2 emission association between cities.
Based on the use of the gravity model to determine the CO2 emission relationships between cities, we constructed the spatial association network of CO2 emissions in the Chengdu-Chongqing urban agglomeration. The CO2 emission spatial association network is represented by a set, A = (E, F), where E = (e1, e2…en) represent the network nodes and the CO2 emission association relations set F as the network edges:
F = { f i j } = { y i j i f y i j 1976 0 o t h e r w i s e ,

2.2.2. Indicators for Analyzing the Spatial Association Network of CO2 Emissions

Overall network indicators: In this paper, three indicators were selected to describe the overall characteristics of the network: the number of association relations, the network density, and the association intensity. The number of association relations (M) refers to the actual number of CO2 emission relationships in the CO2 emission association network, namely, the number of edges.
The network density reveals how dense the associations are—the greater the network density, the closer the associations between nodes in the network, and the greater the influence on the nodes from the network structure. The network density can be calculated as follows:
D = M N ( N 1 ) ,
where D represents the network density, and N refers to the number of nodes.
Individual feature indicators: In this study, three indicators were utilized to indicate the centrality of each node: the degree centrality, the betweenness centrality, and the closeness centrality.
The degree centrality (DC) is used to measure the degree of a node away from the network center, which includes the out-degree and in-degree—the greater the values of these two indicators, the deeper the degree of impact between cities. In this study, we use the weighted out-degree (diout) and in-degree (diin) to measure the central positions of cities in the network. They can be calculated as follows:
d i o u t = i = 1 ( i j ) 16 f i j   and   d i in = i = 1 ( i j ) 16 f j i ,
where diout refers to the CO2 emission impact degree from city i to city j, and diin refers to the CO2 emission impact degree from city j to city i.
The betweenness centrality (BC) is used to measure the control of one node on the associations with other nodes. The greater the betweenness centrality is, the higher the control is, which indicates that the node is closer to the network center. The betweenness centrality can be calculated as follows:
B C = 2 j N k N b j k ( i ) 3 N 2 3 N + 2 ,
where bjk(i) represents the control of node i on node j. bjk(i) = gjk(i)/gjk, gjk refers to the number of shortcuts through node i between node j and node k, gjk(i) refers to the probability that node i is between node j and node k (shortcut refers to the shortest path between two nodes), k ≠ j ≠ i, and j < k.
The closeness centrality (CC) is used to measure a node that is out of the control of the other nodes. With a greater closeness centrality more direct associations between the node and other nodes are found, which indicates that the node is the central actor in the network. Closeness centrality can be calculated as follows:
C C = j = 1 N d i j N 1 ,
where dij is the shortest path between nodes.
Cohesive subgroup: The cohesive subgroup emerges when some objects in a network are closely associated and form a subgroup. In order to explore the internal structure of the carbon emissions spatial correlation network, we divided the entire carbon emissions correlation network into several subgroups and analyzed the spatial spillover effects of carbon emissions among subgroups by image matrices. When implementing the subgroup analysis, the CONCOR (Convergent Correlations) iteration was adopted. CONCOR is a programming model for building subgroups. The maximal segmentation was set as 2 and the convergence was 0.2.
Ucinet is the most widely used software for social network analysis, therefore, we used Ucinet to process data in this paper.

2.3. Data Source and Processing

This study targeted 16 cities in the Chengdu-Chongqing agglomeration from 2005 to 2016 by adopting the gravity model to compute the density of spatial associations in city-level CO2 emissions. In China, the energy balance sheet is drafted by authorities at the national or provincial level. Furthermore, theoretical research and applications concentrate on nationwide and province-level CO2 emissions. Data regarding city-level energy consumption are inaccessible, so we could not obtain the CO2 emission data by the IPCC (Intergovernmental Panel on Climate Change) method. Therefore, based on the IPAT model [51], we adopted Chen’s practice [52]. We built the equation for calculating CO2 emissions as follows:
R C O 2 = P × G D P P × E G D P × C O 2 E ,
where P represents the population, GDP is the city-level gross domestic product, E/GDP is the energy consumption per unit of GDP, CO2/E is the conversion ratio of CO2 to other energies, and E is the consumption of energy. K(104 t CO2/104 t, 108 m3) = CO2/E and K varies in different countries where the technologies and energy structure are different. China has retained its coal-based energy structure; coal consumption accounts for 70% of total energy production, so K can be represented by the conversion coefficient of coal and CO2 dioxide. The conversion coefficient of coal and CO2 dioxide is 2.45; thus, K was set as 2.45 in this study.
The original data used in this empirical study include the populations of the surveyed cities from 2005–2016 as well as their GDP values and energy consumption per unit of GDP, which were sourced from the Sichuan statistical yearbook and Chongqing statistical yearbook (Supplementary Materials). GDP values were deflated by 2005 = 100 to eliminate the impact of prices. Highway mileage was referred to as the measurement of the actual distances between cities in this study as the CO2 emission associations were made by inter-city business ties which depend on highways. The highway mileage data were sourced from the Atlas of Operating Mileage of Chinese Highways.

3. Results and Discussion

3.1. Spatial Distribution Pattern of the Chengdu-Chongqing Urban Agglomeration

The CO2 emissions in all cities of the Chengdu-Chongqing urban agglomeration can be seen in Figure 2. In the sample period, from 2005 to 2016, the amount of emissions generally showed a gradually increasing trend in all cities, while the intensity of CO2 emissions decreased gradually in all cities, especially after 2010. The reason for this is that the Chinese government has paid more attention to energy conservation and emission reduction since 2006. In particular, mandatory regulations were set in the eleventh Five-year Plan of China to reduce the energy consumption per unit of GDP. There are significant features of spatial agglomeration in the urban agglomeration. Chengdu and Chongqing, as the two core cities of the urban agglomeration, contributed as much as 52% of the total CO2 emissions in 2016 and affected the whole spatial distribution of CO2 emissions in the urban agglomeration. For the other cities, closer proximity to the core cities was associated with higher detection of CO2 emissions. Additionally, this spatial aggregation is dynamic, for example, there was a high level of emissions in Leshan alone in 2005, but Neijiang, Yibin, and Luzhou were also affected in 2016, which made southwest Sichuan a gathering area for CO2 emissions.

3.2. Spatial Network Structure of CO2 Emissions in the Chengdu-Chongqing Urban Agglomeration

3.2.1. Global Spatial Network Structure of the Urban Agglomeration

Based on the correlation intensity of CO2 emissions in the Chengdu-Chongqing urban agglomeration calculated by Equation (2), we constructed the carbon emissions spatial association networks from 2005 to 2016, as shown in Figure 3. It is clear that Chengdu and Chongqing are the two core cities in the spatially associated networks of CO2 emissions, because Chengdu and Chongqing, as the economic and commercial centers in the Southwest China, not only affect the economies of the surrounding cities, but also affect the space distribution of carbon emissions. Though the spatial network pattern has changed little during the sample period, the spatial correlations of carbon emissions between cities have become much stronger. These stronger spatial correlations provide an opportunity for coordinated emission reduction between cities, along with the economic integration of the Chengdu-Chongqing urban agglomeration.
Furthermore, we investigated the overall characteristics of the network by using three indicators, the number of association relations, the network density, and the association intensity. The number of association relations and the network density measure the robustness and tightness of the spatially associated networks of CO2 emission, where the greater the number of association relations and network density, the stronger the robustness and tightness of the networks. Figure 4 describes the dynamic evolutionary trend of association relations and network density in the Chengdu-Chongqing urban agglomeration. Figure 4 shows that the two indicators increased from 2005 to 2016. The association relations and the network density were only 44 and 0.183, respectively, in 2005, and they rose to 149 and 0.621 in 2016. The presence of these strong increasing trends reveals that the robustness has become increasingly strong in the spatially associated networks of CO2 emissions. Such robustness might cause the CO2 emissions in one city to affect the surrounding cities. Thus, single-city policies may not achieve the desired effects. On the contrary, more attention should be given to the overall urban agglomeration and inter-city cooperation when determining policies for carbon emission reduction.
Meanwhile, the association intensity of CO2 emissions in the research area increased significantly from 2005 to 2016, with the average intensity rising from 1976 to 7113. This change mainly stemmed from the spatial agglomeration effect of the urban economy, which links the production factors more closely in space, thus increasing the spatial association intensity of CO2 emissions. From a spatial point of view, the distribution of the association intensity is imbalanced. For example, the association intensity between Chongqing and Chengdu is the greatest, 78,792 in 2016, almost 50 times that between Guang’an and Chengdu. Meanwhile, the highest association intensity accounted for 36% of the spatial distribution. Thus, the cities with high association intensity are key areas for carbon emission control, and local governments could reduce future carbon emissions through industrial optimization and technology transfer.

3.2.2. Analysis of the Individual Spatial Network Structure in Cities

To capture the structural pattern of the spatial association network of CO2 emission in the Chengdu-Chongqing urban agglomeration, it was necessary to evaluate the centrality of all cities in the CO2 emission association network. In this study, three indicators were utilized to indicate the centrality of each city: the degree centrality, the betweenness centrality, and the closeness centrality.
The degree centrality measures the degree of a node away from the network center. Table 1 shows the out-degree of 16 cities in various years. From Table 1, we can see that there have been small dynamic changes in position from 2005 to 2016, except for in Guang’an, Dazhou, and Zhangzhou, which illustrates that the location of each city in the network is relatively fixed, even though the out-degree value of each city has increased greatly. Taking 2016 as an example, we can see that the out-degree is strongly related to the economy and location of each city—the higher the level of urban economy and the closer to the core city a city is, the larger the out-degree. The values of Chengdu and Chongqing are much higher than those of other cities—as central cities, they have the capability of strong radiation to their surrounding neighbors and demonstrate strong space spillover effects of CO2 emissions to other areas. The position of Ya’an is at the edge; due to its remote location and weak economy it is not likely to have spatial correlations with other cities.
Table 2 shows the in-degree of 16 cities in various years. From Table 2, it can be seen that there were few dynamic changes in positions from 2005 to 2016, which illustrates that the location of each city in the network is relatively fixed, even though the in-degree values of each city have increased greatly. In 2016, we can see that the in-degree value of Chengdu is the highest, which illustrates that the CO2 emissions of Chengdu are also affected by other cities. As the capital of Sichuan province, Chengdu attracts large amounts of production from surrounding cities. At the same time, the in-degree rank of Chongqing is far lower than its out-degree, which may be related to its separate administrative area. Further analysis found that the other 14 cities all have higher levels of in-degree than out-degree, which shows that these cities have passive positions in the network. Changes in CO2 emissions in these cities are more likely to be due to the impact of Chengdu and Chongqing. In other words, the effect of CO2 emission reduction in these two cities will significantly affect the integral level of CO2 emissions in the entire urban agglomeration.
The betweenness centrality reflects the mediating role of urban individuals. Table 3 lists the results of the degree of betweenness centrality for various years. From Table 3, we can see that the numbers of cities with a betweenness centrality of greater than 0 increased during the sample period, which indicates that the spatial connections between cities have become increasingly complex, and more and more paths of carbon emissions association networks have appeared with the increase in urban agglomeration. Although the ranks of Chengdu and Chongqing are consistently the top two, the index of betweenness centrality has dropped significantly since 2009. This indicates that their bridging roles have weakened. Correspondingly, the “bridge” roles of some sub-centre cities have increased gradually, for example, Deyang, Mianyang, and Nanchong. From a spatial perspective, the above-average cities were Chengdu, Chongqing, Mianyang, and Nanchong in 2016; these cities showed strong “bridge” abilities over the entire spatial network. Thus, these cities contribute more to the achievement of coordinated emission reduction in the cities concerned.
In this paper, the closeness centrality was calculated as shown in Table 4. The closeness centrality indexes of Chengdu and Chongqing were both 100 in the sample period. Meanwhile, the indexes of other cities have increased gradually. For example, only Chengdu and Chongqing had higher than average CC values in 2005, while the number of cities with higher than average CC values rose to eight in 2016 with the addition of Mianyang, Leshan, Luzhou, Yibin, Deyang, and Neijiang. This indicates that the closeness centrality of the above cities increased, transforming the association network of CO2 emission from a double-core to a multi-core. From a spatial perspective, the new members are all economic centers in their regions; their central status in regional development gives them with direct and quicker influence on their surrounding cities. Thus, these cities may build relationships with other cities faster in the spatial association network of CO2 emissions.
Furthermore, in the sample period, the 16 cities in the Chengdu-Chongqing urban agglomeration were categorized into different classes in the association network of CO2 emissions based on their closeness centrality indexes. The results from 2016 are shown in Table 5, and the spatial distribution is shown in Figure 5. It is clear that this urban agglomeration has formed a tertiary system of key cities in CO2 emission. Chengdu and Chongqing are first-class, key cities which transfer CO2 emissions and drive the economic development of surrounding cities through trade and industrial transfer; Deyang, Mianyang, and Nanchong are second-class cities, which are key cities in the Chengdu–Deyang–Mianyang–Leshan urban belt in the south Sichuan area and northeast Sichuan area and connect the first-class cities, Chengdu and Chongqing, with secondary core cities by transferring their CO2 emissions by radiation; and Guang’an, Dazhou, and Ya’an are third-class cities, located at the edge of the association network of CO2 emissions. In the Development Plan for the Chengdu-Chongqing Urban Agglomeration, Zigong, Suining, and Meishan were categorized as cultural tourism cities and ecological garden cities, preventing them from becoming key cities in the association network of CO2 emission. From the perspective of dynamic evolution, the first-class cities did not change during the sample period, while the number of second-class cities increased, which means that the development of regional key cities in Chengdu-Chongqing urban agglomeration has delivered results.

3.2.3. Cohesive Subgroups

By using the CONCOR approach, 16 cities were divided into four subgroups, located in the surrounding area of Chengdu, south Sichuan, northeast Sichuan, and west Chongqing, as shown in Figure 6. The results showed that the subgroup structure did not change from 2005 to 2016, and the cluster results were mainly influenced by the geographic positions of cities, which means that geographically close cities tend to have stronger CO2 emission links, proving the spatial dependence of CO2 emission. Although there were no changes in subgroup structure during the 12-year period, it can be easily seen that the densities of all subgroups are increasing, indicating stronger aggregation and closer CO2 emission connections.
To study the CO2 emission associations between cohesive subgroups, the es were calculated through CONCOR. A higher density indicates a closer association, and the density on the diagonal line refers to the density of the subgroup, i.e., the closeness among cities. Although the subgroup structure has not changed in 12 years, Table 6 shows that the densities of all subgroups are increasing, indicating stronger aggregation and closer CO2 emission connections. In order to show the spillover of CO2 emissions among subgroups clearly and to better reflect the transmission mechanism of CO2 emission among cities, the inter-density and density of subgroups, as well as the overall network density in the same year, are compared in this paper. If the inter-density is higher than overall density, then there is a spillover effect of CO2 emission among subgroups; if the subgroup density is higher than the overall density, this subgroup has a centralized tendency. The specific process was as follows: a value of 1 was assigned to those whose density among cohesive subgroups was higher than the overall network density in the current year, and a value of 0 was assigned to those with a density lower than the overall network density in that year. Through this process, we obtained the image density matrix among cohesive subgroups, as shown in Table 6. It is clear that the spillover effect of CO2 emissions among subgroups did not change, and subgroup 1 showed an intense effect. This is because Chongqing received industrial transfer from east coastal cities and from cities developing in the Yangtze River Economic Zone, which produced a large amount of carbon. Although subgroup 3 did not spill CO2 emissions to other subgroups, it had high aggregation itself. This was caused by the large CO2 emissions from Chengdu, which has great attraction to the surrounding cities and gives this subgroup stronger coherence.

3.3. Spatial Association Effects of CO2 Emission in the Chengdu-Chongqing Urban Agglomeration

The structure is decisive in the manifestation of attribute data, which makes it very useful for analysis. The above analysis of the spatial patterns shows that the Chengdu-Chongqing urban agglomeration has formed a relatively close spatial association network of CO2 emissions. To achieve a reduction in CO2 emissions, it is more meaningful to investigate the influence of the spatial structure on CO2 emissions than the influence of the spatial structure of CO2 emissions alone. Therefore, the CO2 emission reduction effect revealed in this paper is based on the influence of the global network and the individual network of CO2 emissions in the Chengdu-Chongqing urban agglomeration on the regional CO2 emission density and the density differences.

3.3.1. The Association Effect of the Global Network Structure in the Chengdu-Chongqing Urban Agglomeration

The regional CO2 emission intensity and standard deviation of the inter-city CO2 emission intensity were used as the two explained variables, and the network density, which reflects the global spatial network structure was processed through OLS regression (using the natural logarithm as a variable). The time span was from 2005 to 2016, and the results are shown in Table 7. All regression coefficients passed the significance test of 1% and showed rather high association coefficient (R2) scores, which provides evidence that perfect fitting occurred.
The influence of the network density on the regional CO2 emission intensity. According to the regression results generated by model 1 (Table 7), the network density exerts a significant negative effect on regional CO2 emission intensity—the regional CO2 emission intensity decreased by 0.744% when the network density of the association network of CO2 emission increased by 1%. This is because with an increase in network density, the associations of CO2 emissions among all cities in the association network of CO2 emissions grow in number and strength, which narrows the differences in CO2 emission intensity among cities, lowering the regional global CO2 emission intensity.
The influence of the network density on differences in the regional CO2 emission intensity. The standard deviation of the inter-city CO2 emission intensity was used as an indicator of differences in regional CO2 emission intensity in the investigation of the influence of the network density on differences in the regional CO2 emission intensity. The regression results in Table 7 demonstrate that a rise in network density would significantly decrease the differences in regional CO2 emission intensity—the standard deviation of inter-city CO2 emission intensity would drop by 0.928% with a network density increase of 1%, which warns us that regional energy conservation and emission reduction cannot be constrained within one individual city, and a coordinative effort based on regional association is needed.

3.3.2. Association Effect of the Network Structure in Individual Cities

The CO2 emission intensity in each city in the sample period was used as the explained variable, and DC, BC, and CC were defined as explanatory variables. A regression was conducted using panel data to study the influence of the individual network structure on the association network of CO2 emissions. Explained and explanatory variables were set as natural logarithms, and the results are shown in Table 8. Through the Hausman test, model 1 and 2 were run based on the individual fixed effect, while model 3 was based on the individual random effect. The indexes of models 1 and 3 passed the significance test of 1% and the index of model 2 passed the significance test of 10%, indicating that the individual network structure has a significant influence on the CO2 emission intensity. On the whole, an increase in the centrality for the association network of CO2 emissions could significantly decrease the CO2 emission intensity.
The regression results delivered by model 1 show that a 1% increase in degree centrality leads to a 0.635% lower CO2 emission intensity, which proves the feasibility of increasing the degree centrality by lowering the CO2 emission intensity. Since the DC values of Chengdu and Chongqing have been saturated, the focus should be on strengthening the links between second-class key cities and third-tier key cities. For example, the transmission of the economy, energy, technology, and talent among cities with low DC values, like Guang’an, Dazhou, Suining, and Ya’an, should be reinforced to reduce their CO2 emission links and lower the CO2 emission intensity.
The regression results from model 2 indicate that the CO2 emission intensity has slightly increased with a rise in BC, caused by the weakened betweenness roles of Chengdu and Chongqing with the evolution of the association network of CO2 emissions. Links among cities rely less on Chengdu and Chongqing, thus the lowering of BC is beneficial for lowering the CO2 emission intensity. Besides, the regression results of model 3 reveal that CC has a significant negative effect on CO2 emission intensity—a 1% increase in CC leads to a decrease in CO2 emission intensity of 0.659%. Therefore, cities with low CC values, such as Zigong, Suining, Ziyang, Guang’an, Dazhou, and Ya’an, deserve more attention to narrow the differences in CO2 emissions and lower the CO2 emission intensity by increasing the inter-city CO2 emission associations.

4. Conclusions and Policy Implications

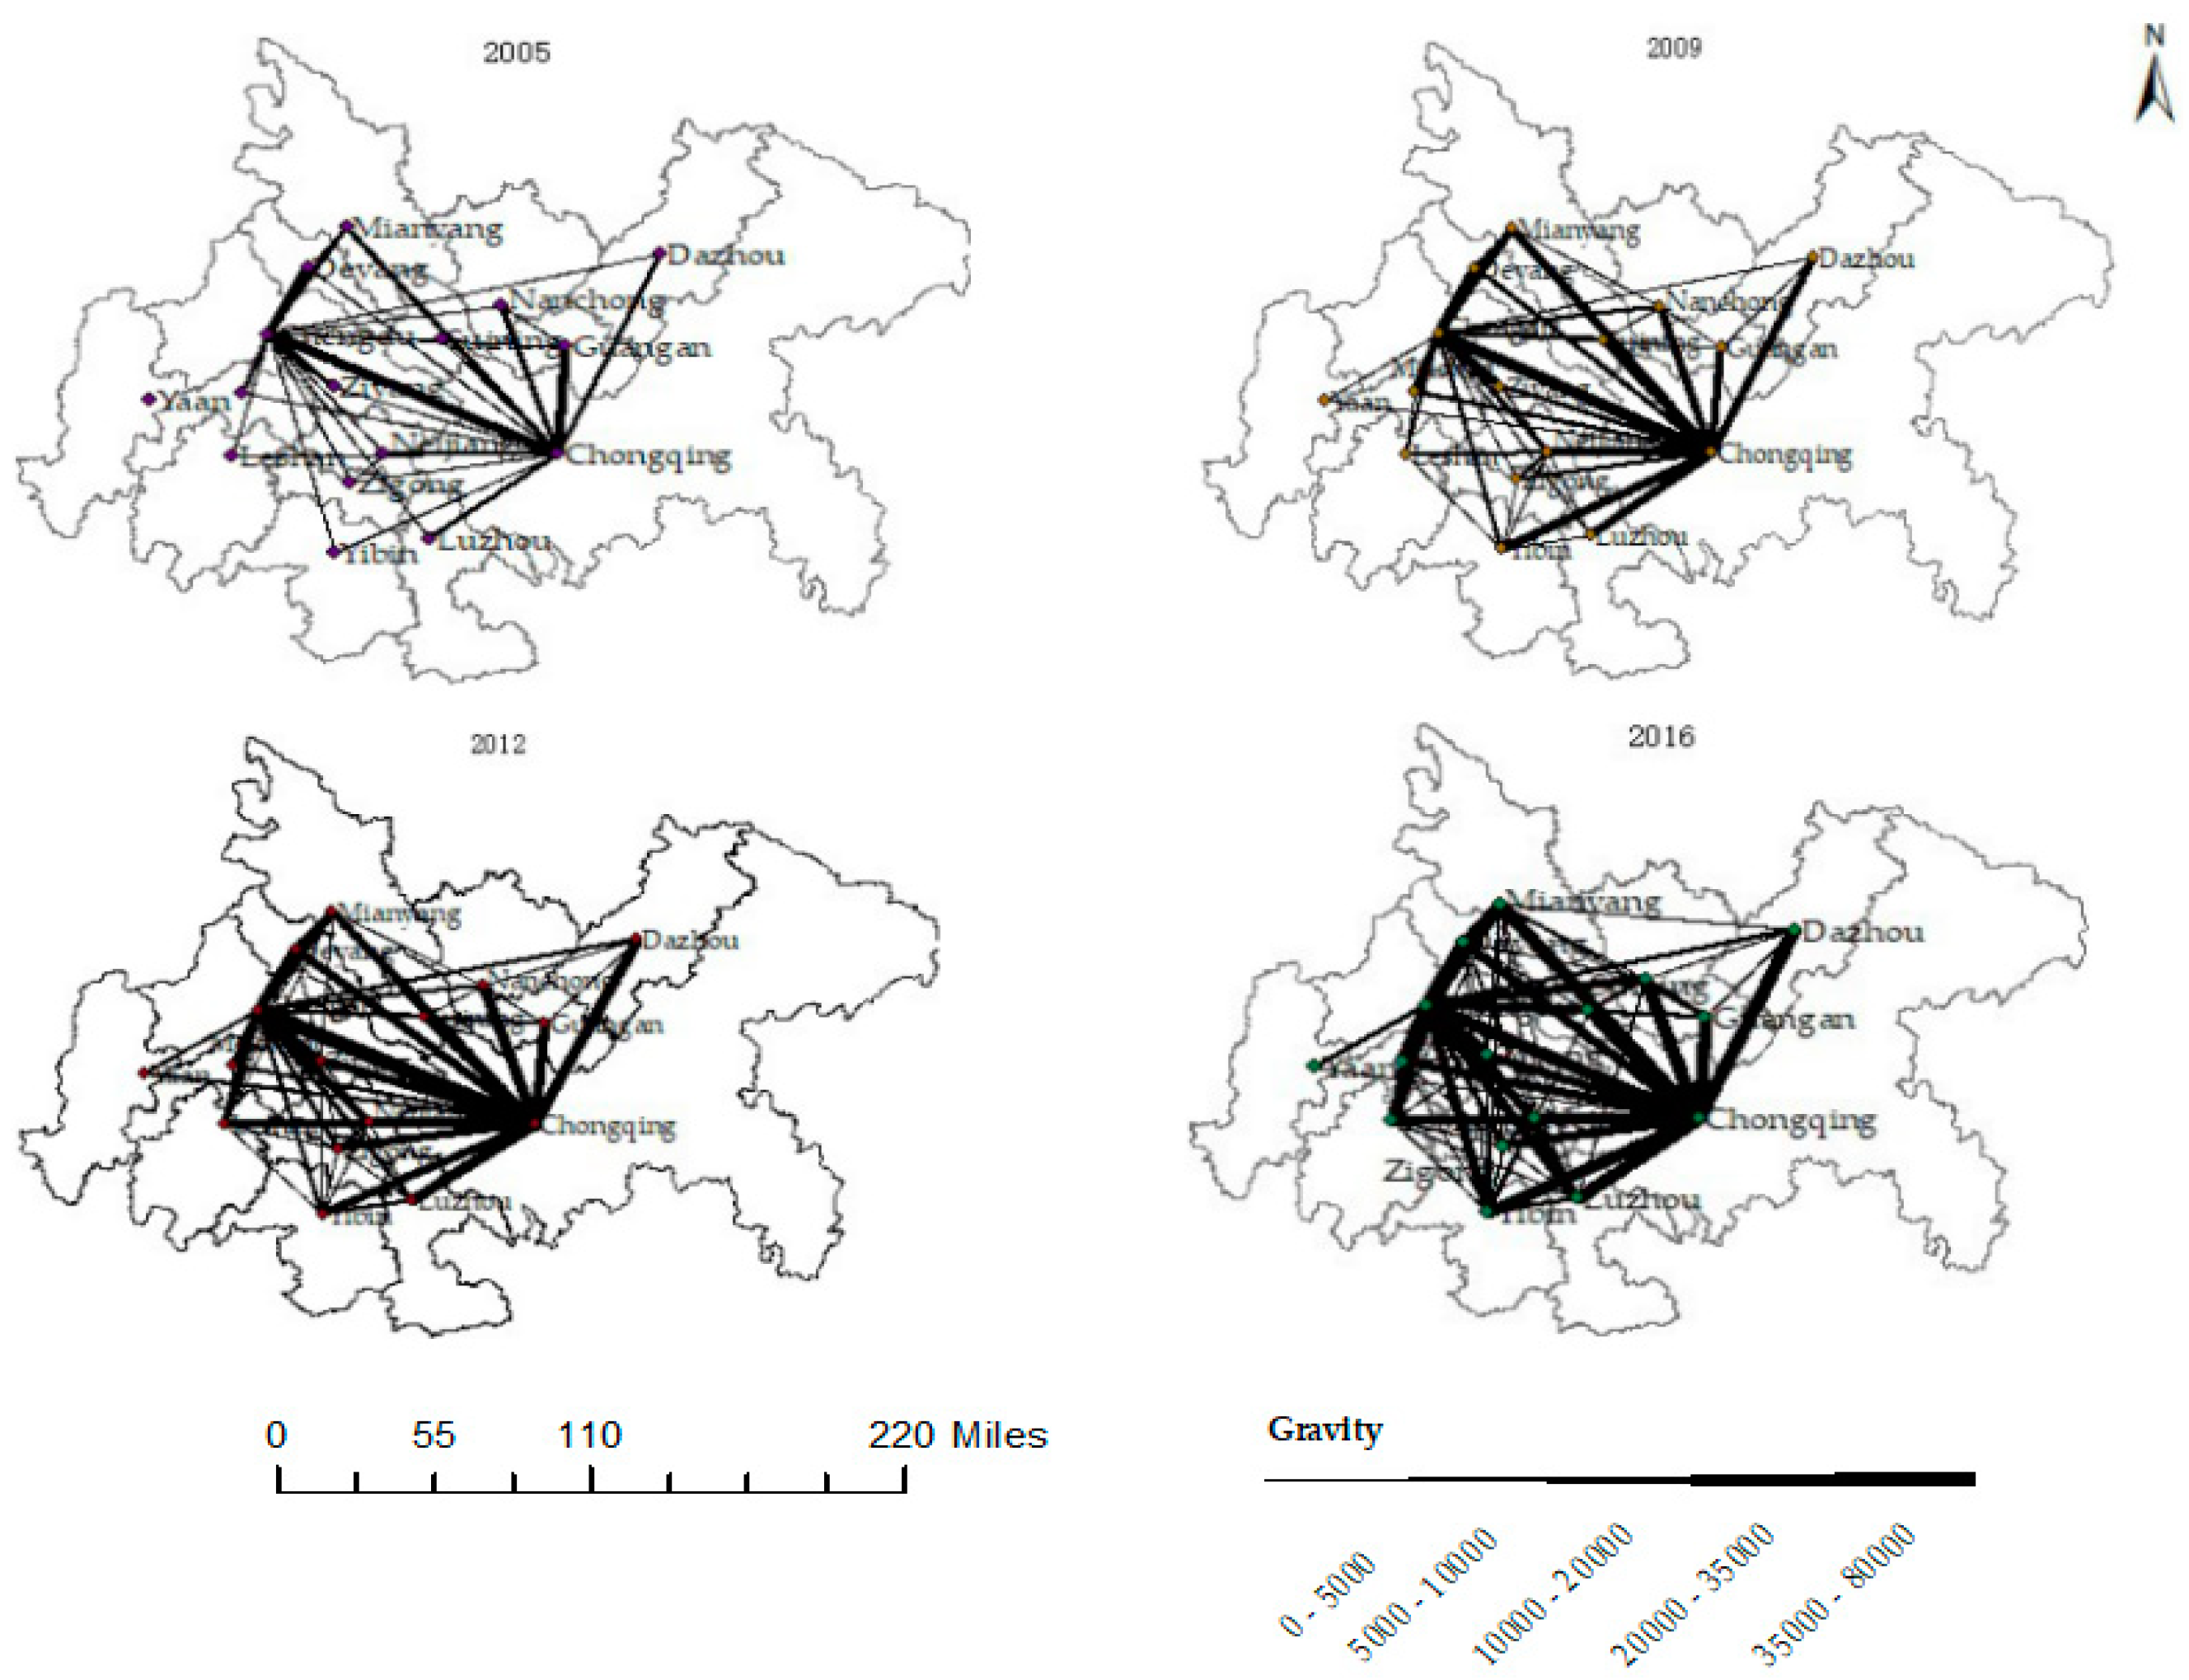
This study explored the spatial structure and effects of the association network of CO2 emissions in the Chengdu-Chongqing urban agglomeration through SNA. By using data from the agglomeration from 2005–2016, an association matrix of CO2 emissions was calculated through a modified gravity model. In addition, the association network of the urban agglomeration was constructed. The structure of the association network of CO2 emissions was investigated by relating it to the global network, individual network, and spatial agglomeration. The study was concluded by examining the structural effects of the association network of CO2 emissions. The major findings are as follows:
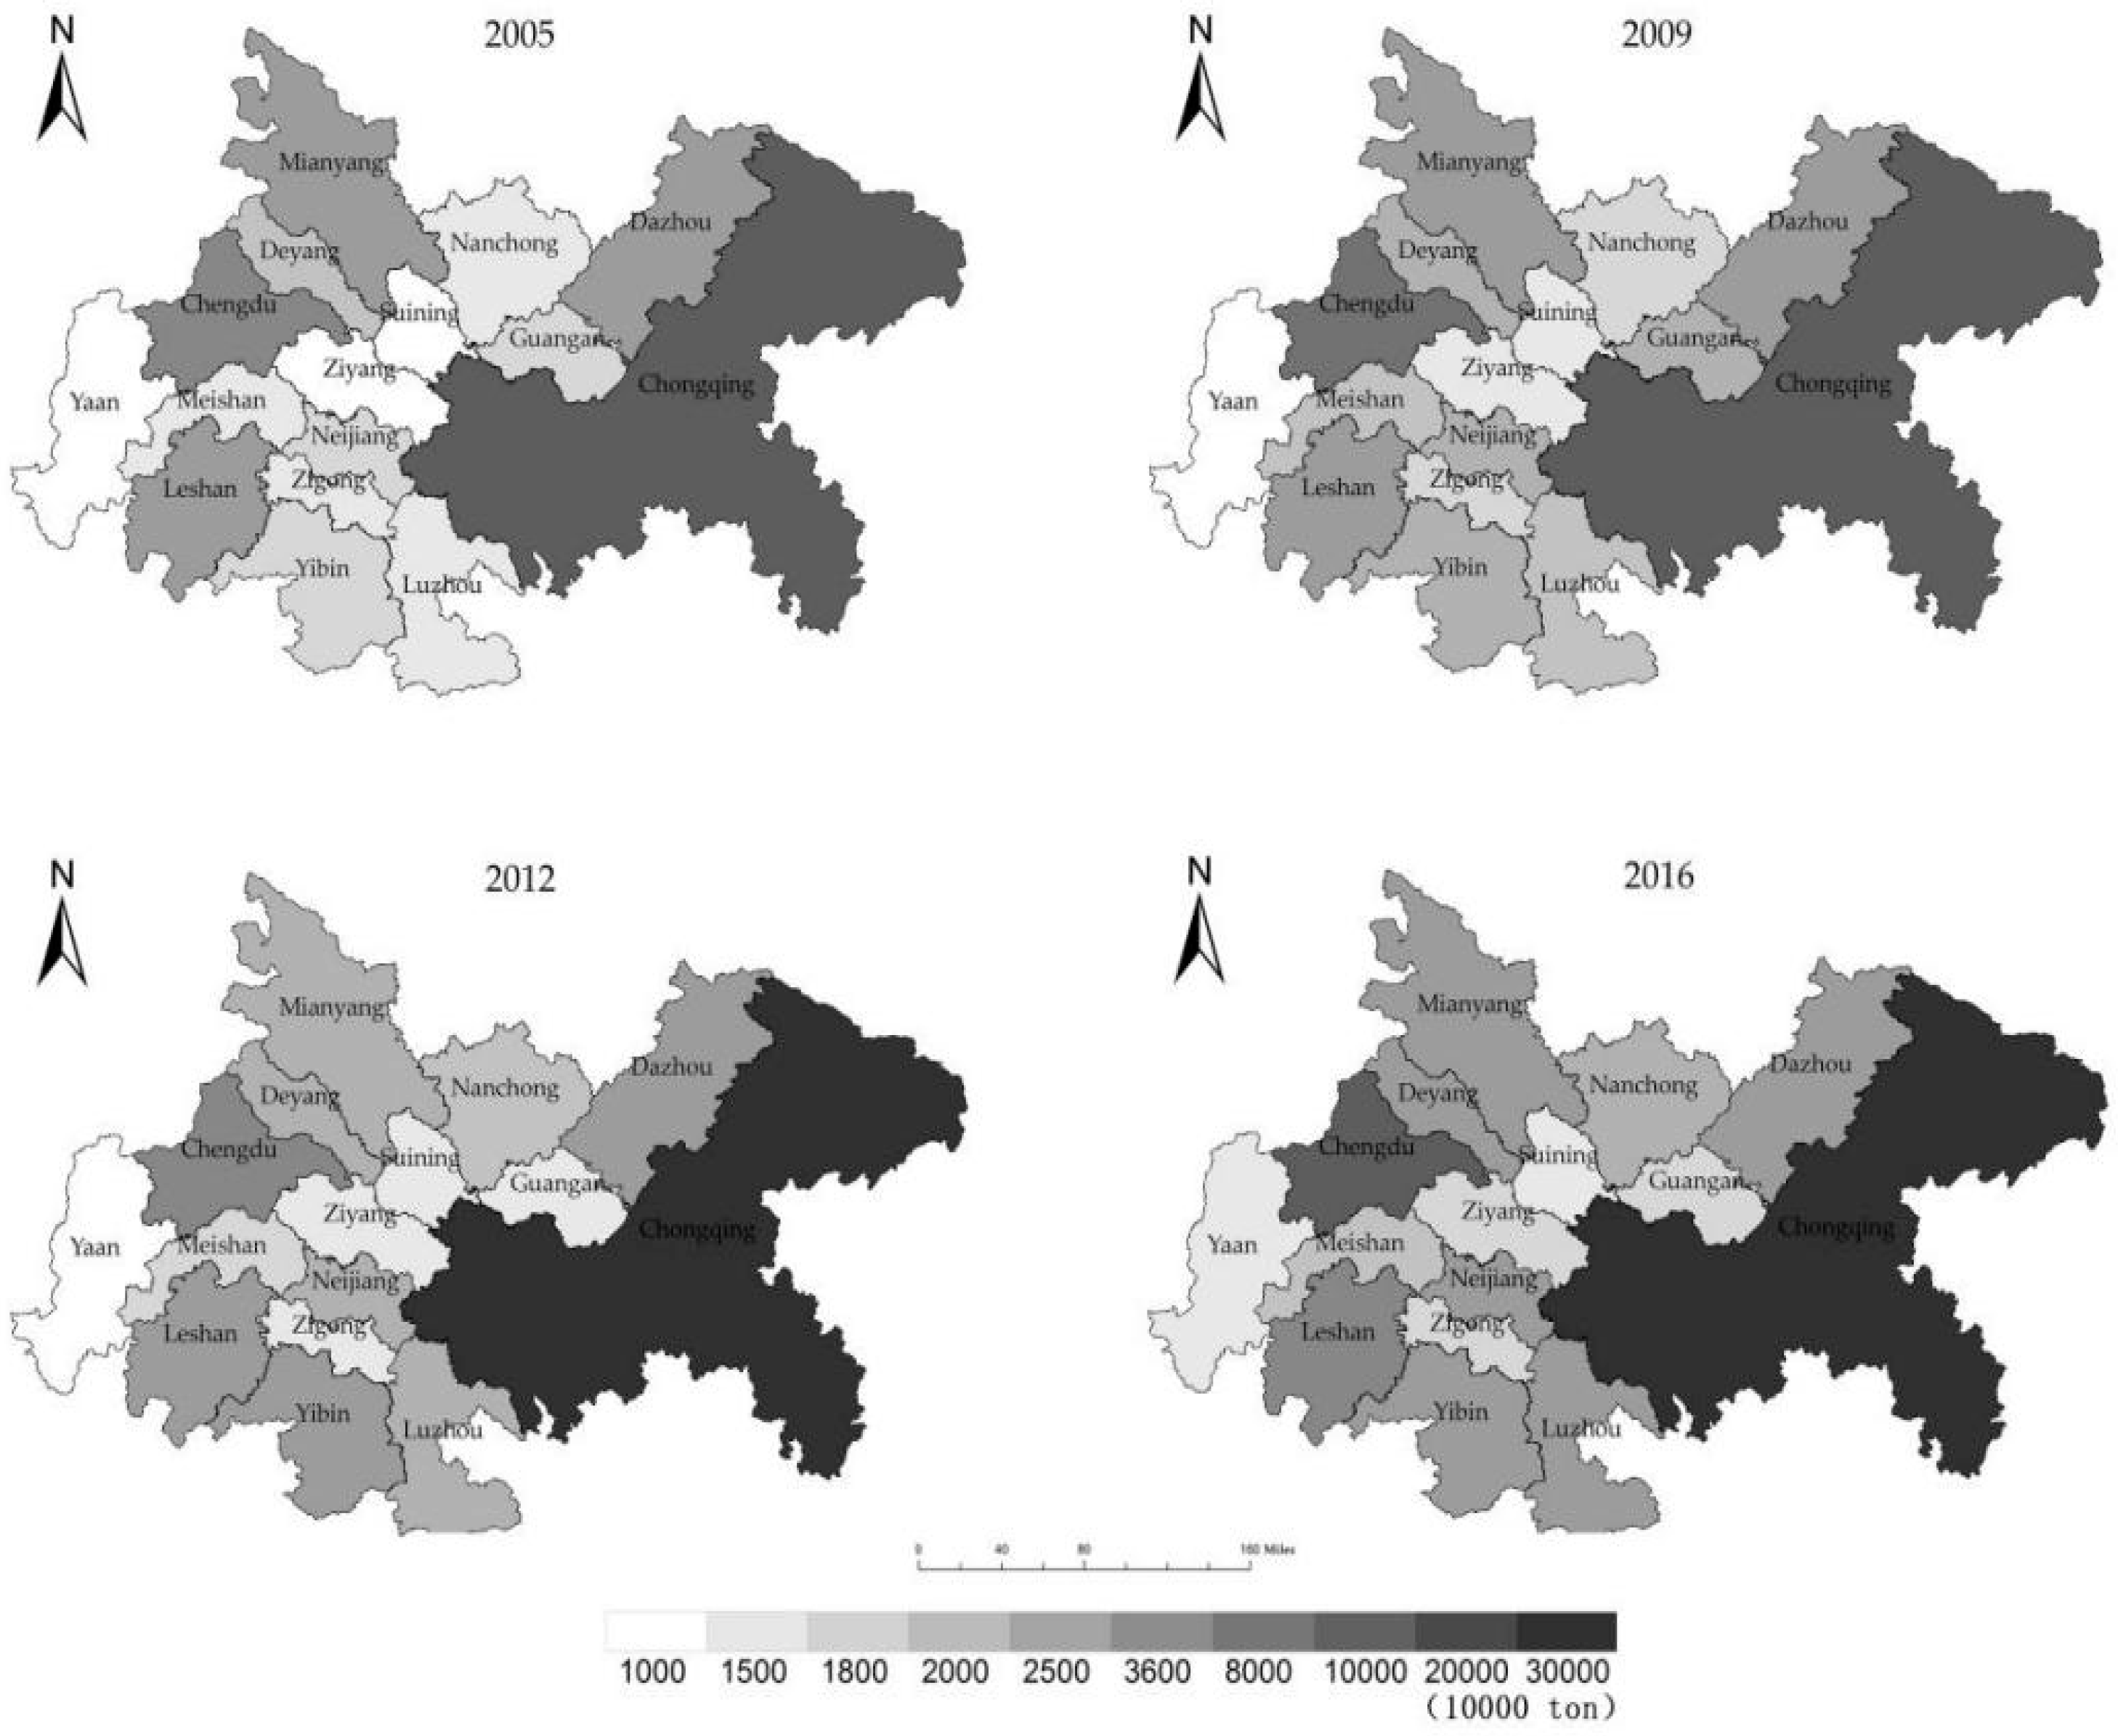
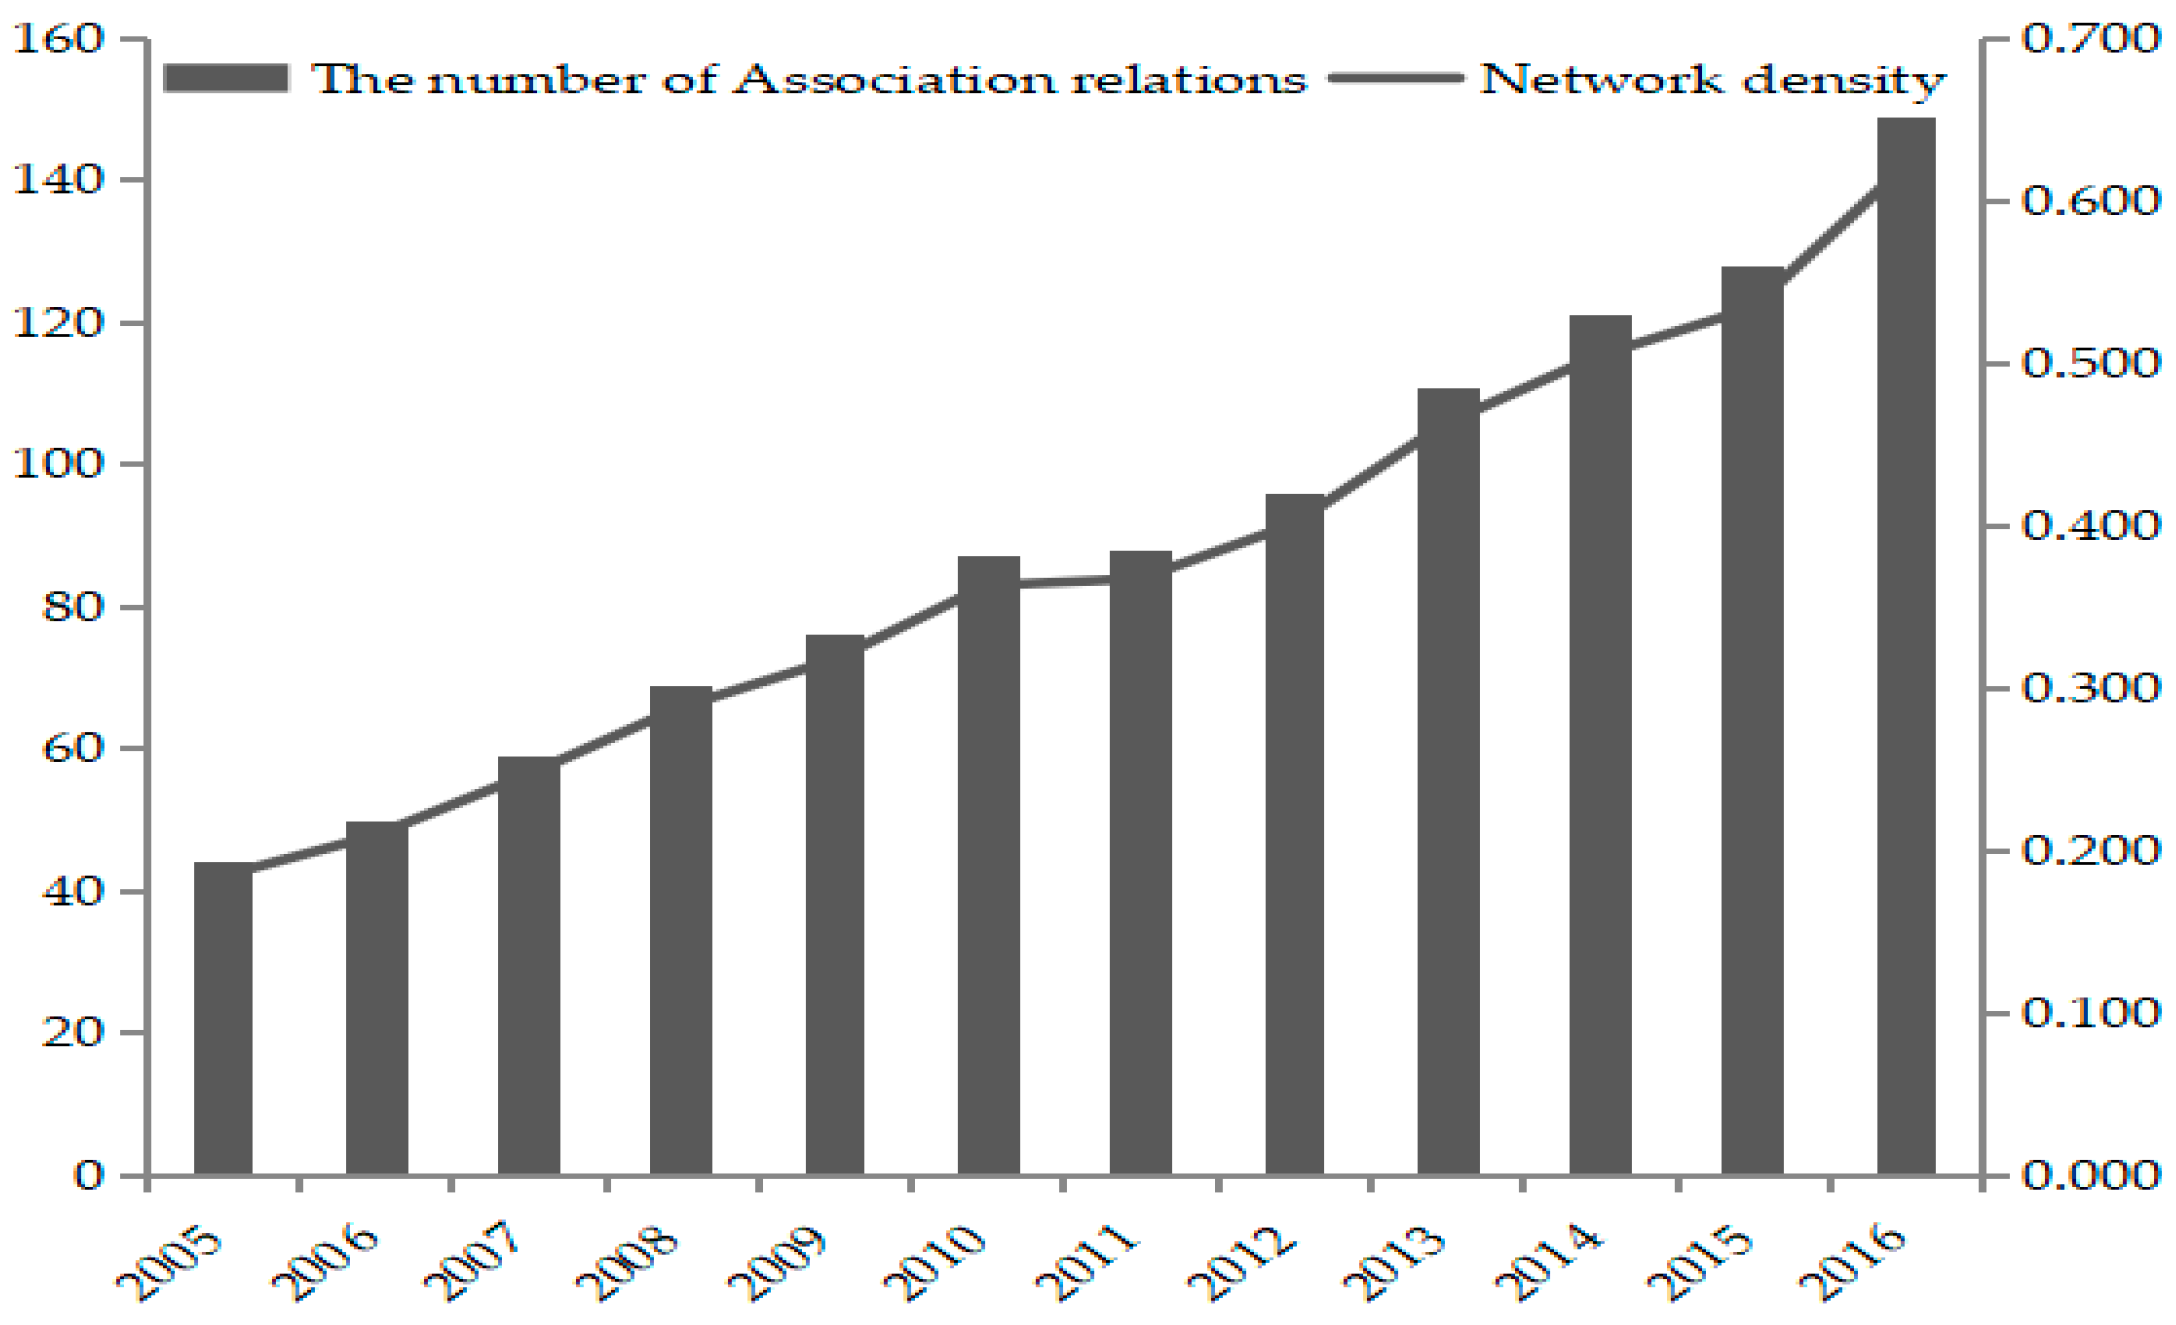
  • The global network structure revealed that the network density and association strength of the spatial association network of CO2 emissions in the agglomeration are increasing on a yearly basis, indicating closer CO2 emission connections among cities in the urban agglomeration. From a static perspective, there are still significant differences in inter-city CO2 emissions, providing evidence of the imbalance in the spatial structure of CO2 emissions within the urban agglomeration.
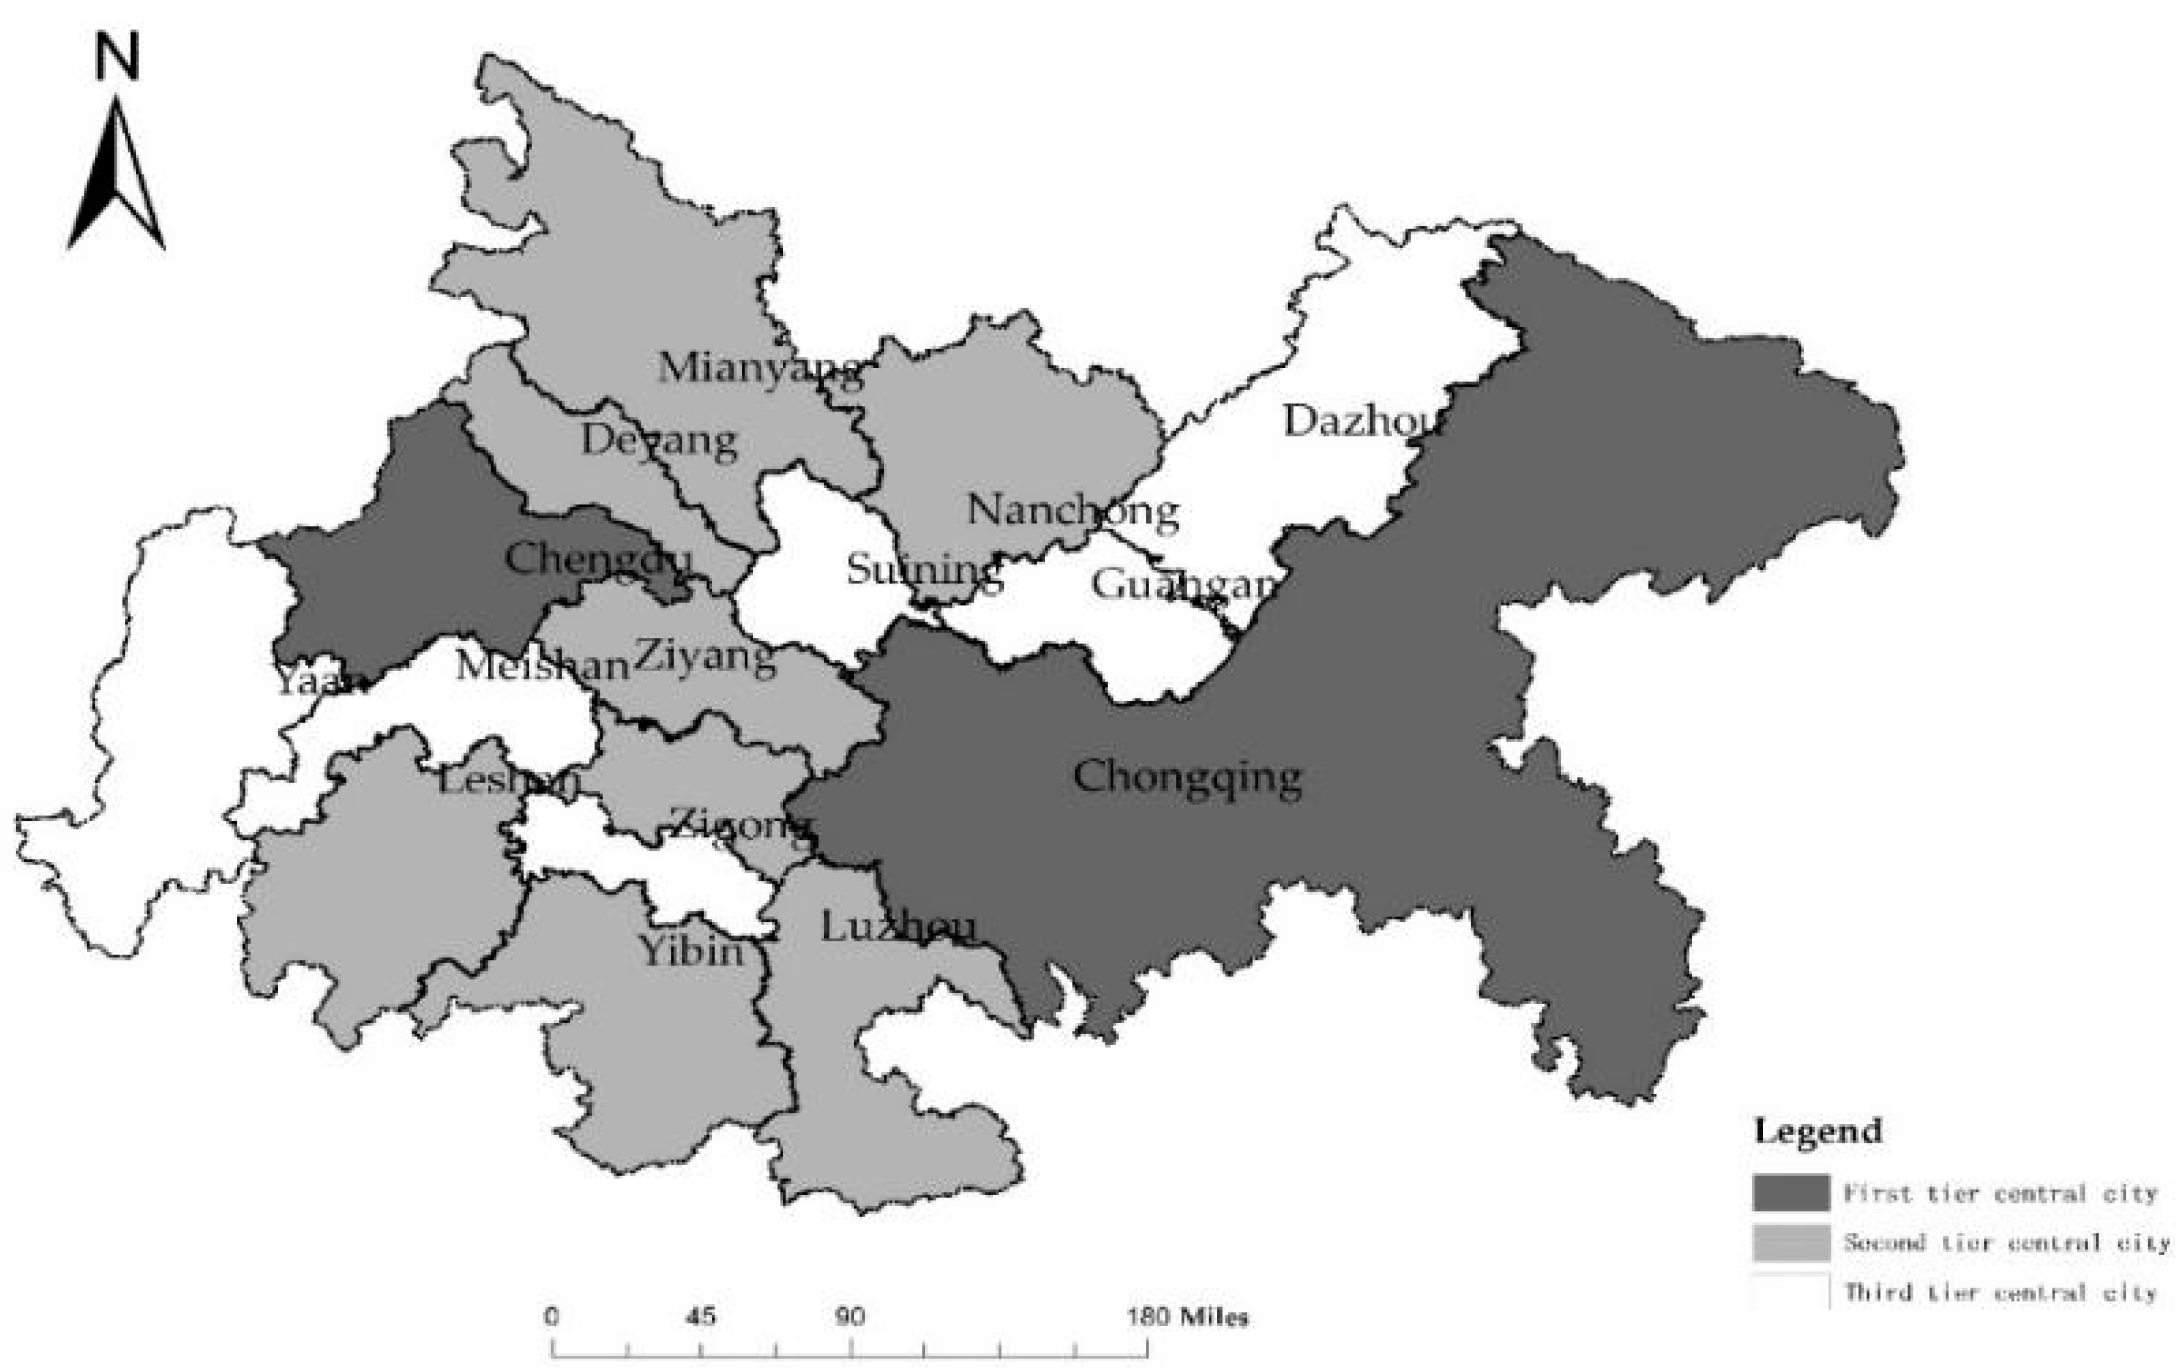
  • The individual network structure indicates that the out-degrees of Chengdu and Chongqing are considerably higher than those of other cities and their in-degrees. This shows that there is a strong spatial spillover effect in Chengdu and Chongqing. The fact that the out-degrees of these cities are much higher than the in-degrees of other cities illustrates that these cities all benefit from CO2 emissions. Before 2011, only Chengdu and Chongqing had higher than average BC values, but Nanchong and Mianyang were also on the list in 2016. In the sample period, the BC values of Chengdu and Chongqing were in decline, which indicates the occurrence of more links for CO2 emission in the second- and third-tier cities. The “bridge” role of the two core cities weakened. Prior to 2016, the cities with higher than average CC values were Chengdu, Chongqing, Deyang, Mianyang, Neijiang, Leshan, Ziyang, Luzhou, and Yibin. This demonstrates the radiation effect of Chengdu and Chongqing and proves that secondary cities are moving toward the network center.
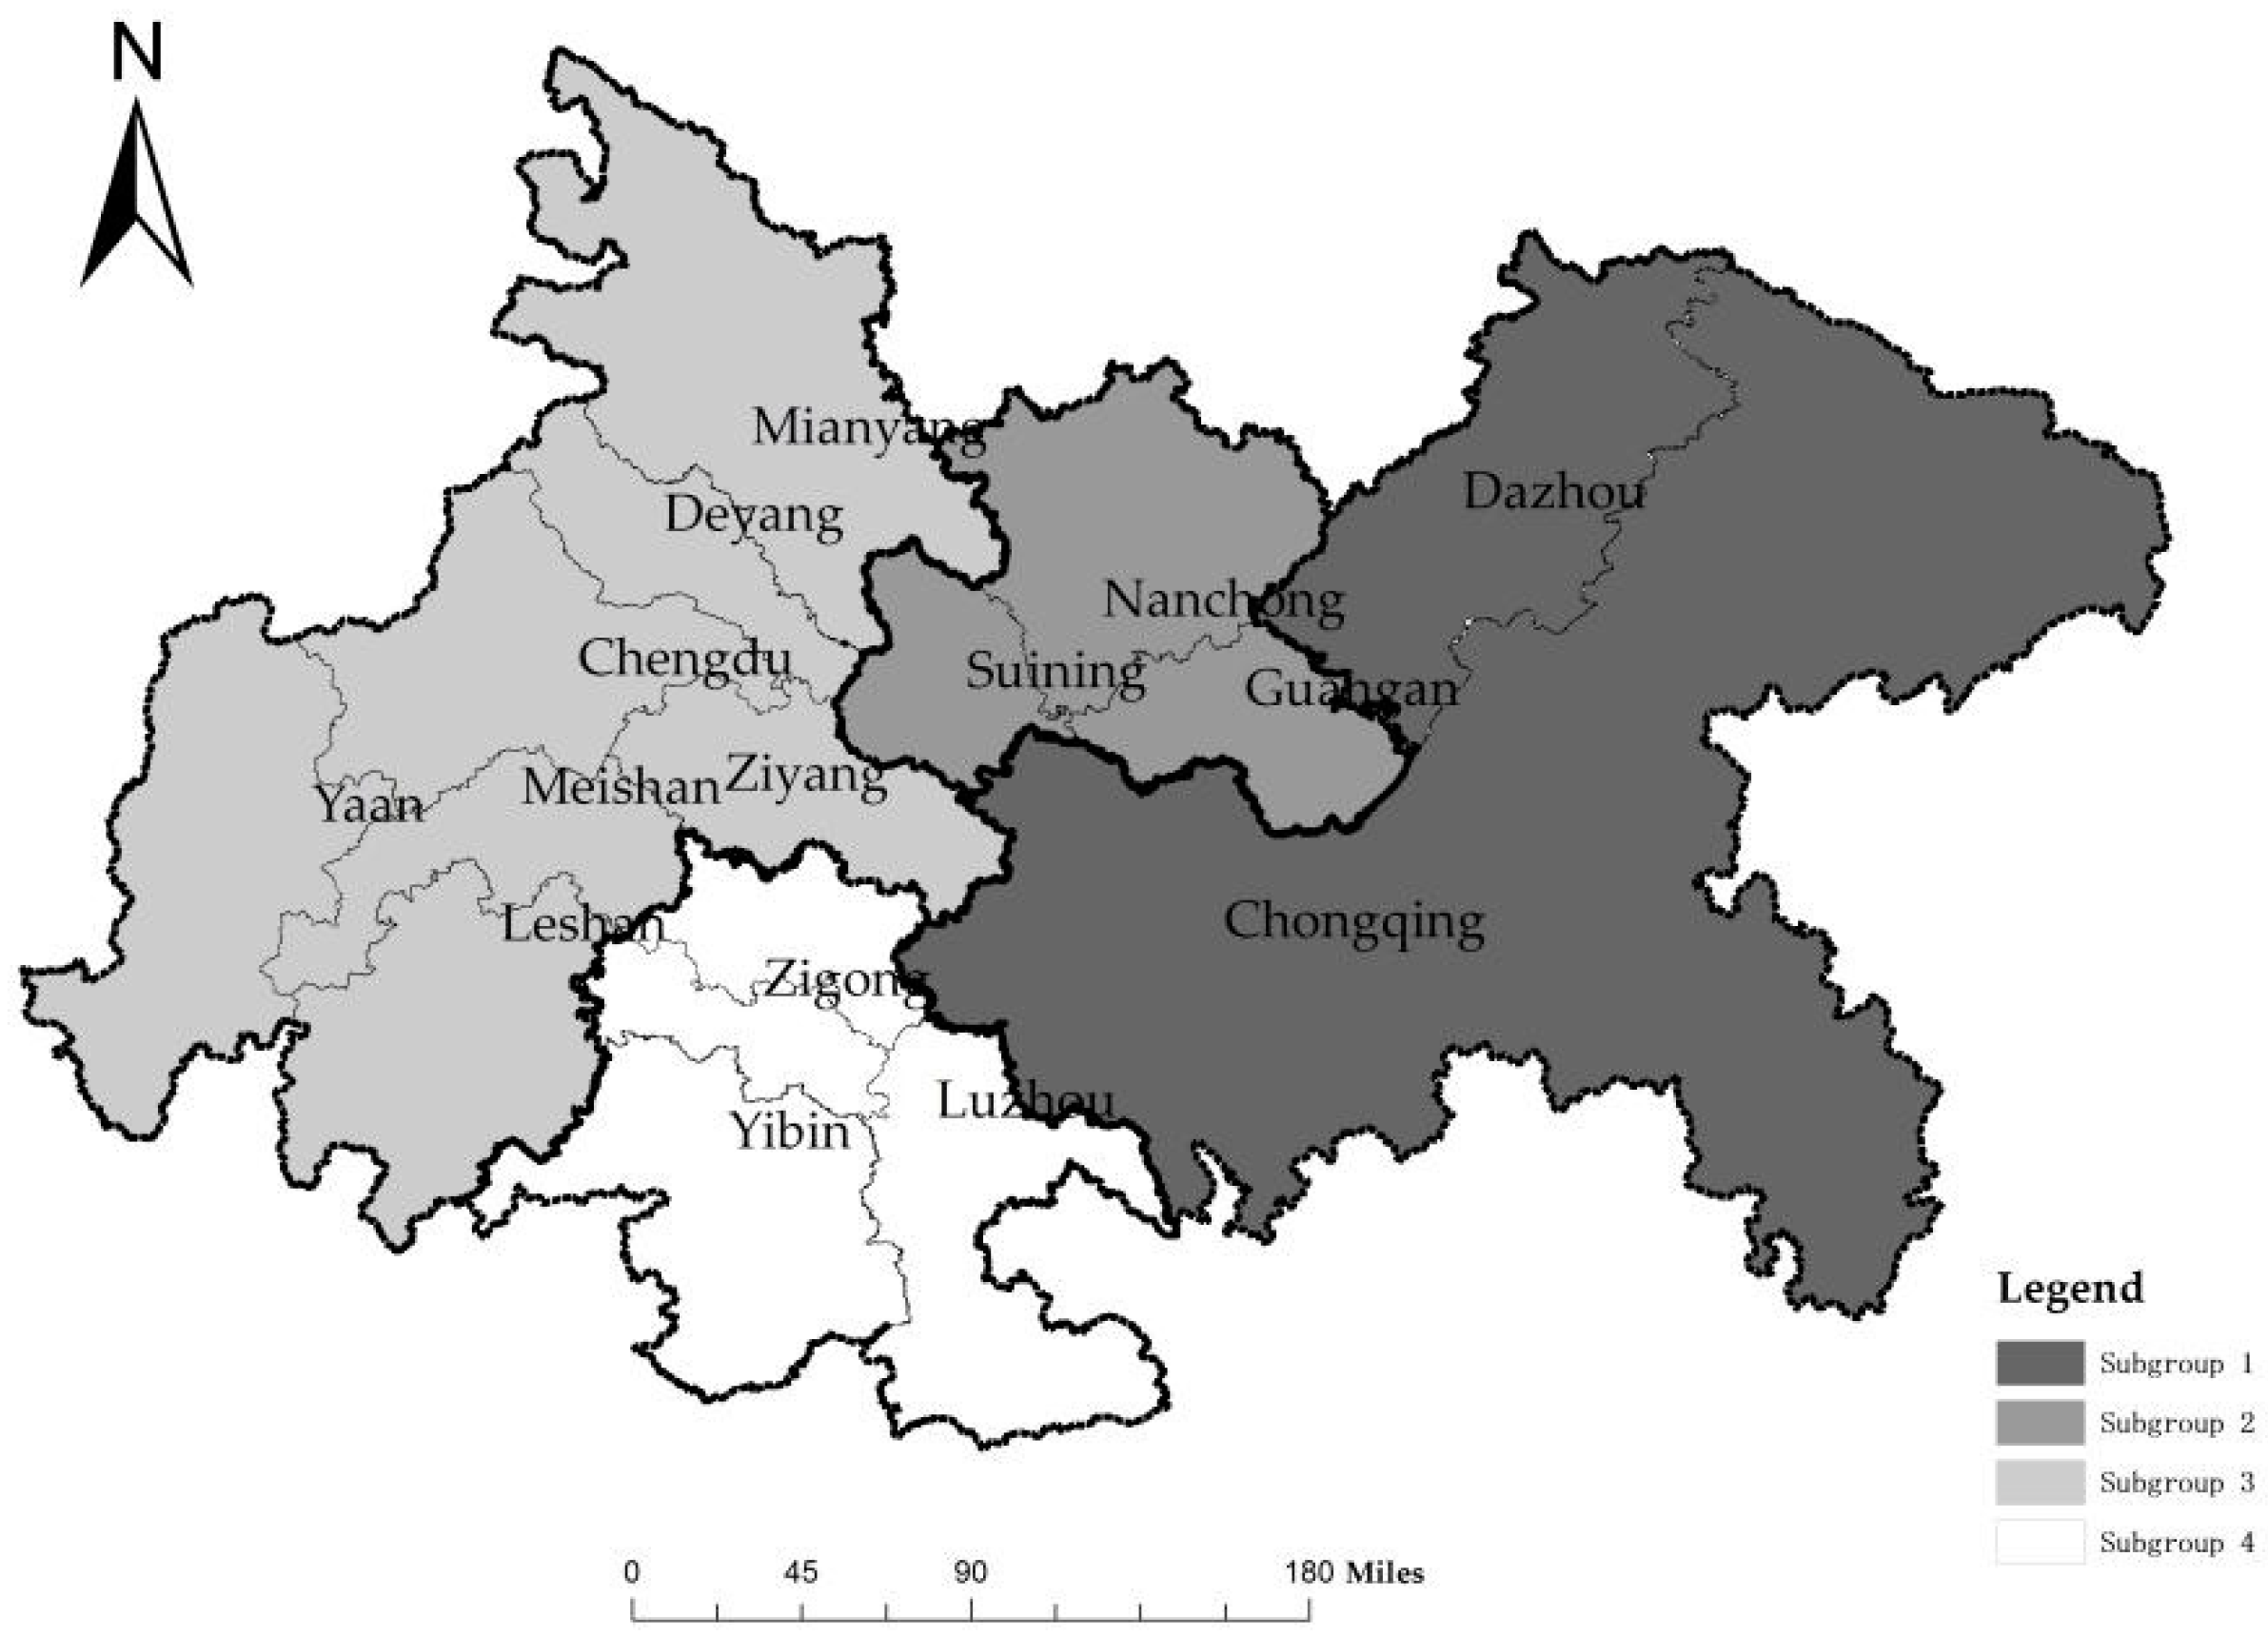
  • The spatial agglomeration assessment revealed that the Chengdu-Chongqing urban agglomeration is divided into four subgroups based on geographic location. The first group, located in west Chongqing, contains Chongqing and Dazhou; the second group, located in south Sichuan, contains Suining, Nanchong, and Guang’an; the third group, located in surrounding Chengdu, contains Chengdu, Mianyang, Deyang, Leshan, Ziyang, Ya’an, and Meishan; and finally, the fourth group, located in northeast Sichuan, contains Luzhou, Yibin, Zigong, and Neijiang.
  • The effect analysis showed that the association network structure of CO2 emissions has a significant influence on the regional CO2 emission intensity and the differences in CO2 emission intensity among cities. The increase in network density not only lowers the regional CO2 emission intensity greatly but can also narrow the differences in inter-city CO2 emission intensity. Meanwhile, increasing node centrality, especially regarding the DC and CC, is beneficial for lowering CO2 emission intensity.
The above research indicates that the success of regional (urban agglomeration) CO2 emission reduction concerns not only individual cities, but the establishment of long-term, coordinated emission reduction mechanisms within the whole region. This should be taken into account during policy making, as explained below.
Firstly, CO2 emissions should be distributed appropriately in the Chengdu-Chongqing urban agglomeration. In order to promote the coordinated development of carbon emission reduction in the urban agglomeration, all regions shall be taken into account during goal setting, which means that the different economic volumes and developing goals of the various cities should be considered, as well as the flow direction and transmission mechanisms of CO2 emission within the urban agglomeration according to the CO2 emission relationships among cities. Thus, the emission reduction plan should incorporate all regions instead of only considering individual needs for development.
Secondly, the association network of CO2 emissions should be optimized in the Chengdu-Chongqing urban agglomeration to take advantage of the core cities with low CO2 emissions, and to promote associations among various cohesive subgroups. The conclusion of the analysis of centrality showed that Chengdu and Chongqing are two core cities in the association network of CO2 emissions, while Mianyang, Deyang, and Nanchong are sub-core cities. To promote the coordinated development of the urban agglomeration, it is important to use the radiation roles of Chengdu and Chongqing and strengthen the influences of sub-core cities. The result of cohesive subgroups indicated that there are more and closer links among subgroups, which should be fully utilized to achieve coordinated emission reduction.
Finally, the promotional roles of the global network structure and individual network structure of CO2 emission should be exerted to lower the regional CO2 emission intensity and narrow the differences in CO2 emission among cities. On one hand, the association network links of CO2 emissions should be increased, which will involve the creation of more channels of CO2 emission flow among cities. On the other hand, the strength of association should be reinforced, which will involve broadening the width of the channel for CO2 emission flow.

Supplementary Materials

The following are available online at https://www.mdpi.com/2071-1050/11/1/1/s1.

Author Contributions

Conceptualization, J.S.; Methodology, Q.F.; Software, X.W.; Validation, J.S.; Formal Analysis, Q.F. and H.F.; Data Curation, X.W. and J.S.; Writing—Original Draft Preparation, Q.F. and J.S.; Writing—Review and Editing, H.F. and W.J.; Visualization, Q.F. and B.C.; Supervision, W.J.; Project Administration, J.S.; and Funding Acquisition, and J.S.

Funding

This research was funded by [National Natural Science Foundation of China] grant number [71874135], [National Natural Science Foundation of China] grant number [51578438], [Ministry of Housing and Urban-Rural Development Project] grant number [2015-R1-009], [Shaanxi Soft Science Research Project] grant number [2015KRM029], [Shaanxi Social Science Fund Project] grant number [2014P03] and [Shaanxi Social Science Fund Project] grant number [2018S09].

Acknowledgements

This work is supported by the National Natural Science Foundation of China (No. 71874135, 51578438), the Ministry of Housing and Urban-Rural Development Project (2015-R1-009), the Shaanxi Soft Science Research Project(2015KRM029), and the Shaanxi Social Science Fund Project (2014P03, 2018S09).

Conflicts of Interest

The authors declare that there are no conflicts of interest regarding the publication of this paper.

References

  1. Wang, Y.; Zhao, H.; Duan, F.M.; Wang, Y. Initial Provincial Allocation and Equity Evaluation of China’s Carbon Emission Rights—Based on the Improved TOPSIS Method. Sustainability 2018, 10, 982. [Google Scholar] [CrossRef]
  2. Mi, Z.F.; Zhang, Y.K.; Guan, D.B.; Shan, Y.L.; Liu, Z.; Cong, R.G.; Yuan, X.C.; Wei, Y.M. Consumption-based emission accounting for Chinese cities. Appl. Energy 2016, 184, 1073–1081. [Google Scholar] [CrossRef] [Green Version]
  3. Han, F.; Xie, R.; Lu, Y.; Fang, J.Y.; Liu, Y. The effects of urban agglomeration economies on carbon emissions: Evidence from Chinese cities. J. Clean. Prod. 2018, 172, 1096–1110. [Google Scholar] [CrossRef]
  4. He, J.H.; Li, C.; Yu, H.; Liu, Y.L.; Huang, J.L. Measuring urban spatial interaction in Wuhan Urban Agglomeration, Central China: A spatially explicit approach. Sustain. Cities Soc. 2017, 32, 569–583. [Google Scholar] [CrossRef]
  5. Chen, L.; Xu, L.Y.; Yang, Z.F. Accounting carbon emission changes under regional industrial transfer in an urban agglomeration in China’s Pearl River Delta. J. Clean. Prod. 2017, 167, 110–119. [Google Scholar] [CrossRef]
  6. Li, L.; Hong, X.F.; Peng, K. A spatial panel analysis of carbon emissions, economic growth and high-technology industry in China. Struct. Chang. Econ. Dyn. 2018. [Google Scholar] [CrossRef]
  7. Li, Z.; Shao, S.; Shi, X.P.; Sun, Y.P.; Zhang, X.L. Structural transformation of manufacturing, natural resource dependence, and carbon emissions reduction: Evidence of a threshold effect from China. J. Clean. Prod. 2019, 206, 920–927. [Google Scholar] [CrossRef]
  8. Kenworthy, J.R. 2.1—Reducing Passenger Transport Energy Use in Cities: A Comparative Perspective on Private and Public Transport Energy Use in American, Canadian, Australian, European and Asian Cities. In Urban Energy Transition, 2nd ed.; Elsevier: Amsterdam, The Netherlands, 2018; pp. 169–204. [Google Scholar]
  9. Gao, Y.; Kenworthy, J.R.; Newman, P.; Gao, W.X. 2.2—Transport and Mobility Trends in Beijing and Shanghai: Implications for Urban Passenger Transport Energy Transitions Worldwide. In Urban Energy Transition, 2nd ed.; Elsevier: Amsterdam, The Netherlands, 2018; pp. 205–223. [Google Scholar]
  10. Zhang, J.J.; Yu, B.Y.; Wei, Y.M. Heterogeneous impacts of households on carbon dioxide emissions in Chinese provinces. Appl. Energy 2018, 229, 236–252. [Google Scholar] [CrossRef]
  11. Liu, X.; Wang, M.; Fu, H. Visualized analysis of knowledge development in green building based on bibliographic data mining. J. Supercomput. 2018. [Google Scholar] [CrossRef]
  12. Wang, D.; Fan, J.; Fu, H.; Zhang, B. Research on Optimization of Big Data Construction Engineering Quality Management Based on RNN-LSTM. Complexity 2018. [Google Scholar] [CrossRef]
  13. Liu, Z.; Cheng, K.; Li, H.; Cao, G.; Wu, D.; Shi, Y. Exploring the potential relationship between indoor air quality and the concentration of airborne culturable fungi: A combined experimental and neural network modeling study. Environ. Sci. Pollut. Res. 2018, 25, 3510–3517. [Google Scholar] [CrossRef] [PubMed]
  14. Wang, P.; Wu, W.S.; Zhu, B.Z.; Wei, Y.M. Examining the impact factors of energy-related CO2 emissions using the STIRPAT model in Guangdong province, China. Appl. Energy 2013, 106, 65–71. [Google Scholar] [CrossRef]
  15. Wang, Z.H.; Yin, F.C.; Zhang, Y.X.; Zhang, X. An empirical research on the influencing factors of regional CO2 emissions: Evidence from Beijing city, China. Appl. Energy 2012, 100, 277–284. [Google Scholar] [CrossRef]
  16. Fu, H.; Liu, X. Research on the Phenomenon of Chinese Residents’ Spiritual Contagion for the Reuse of Recycled Water Based on SC-IAT. Water 2017, 9, 846. [Google Scholar]
  17. Jiang, W.; Zipp, K.Y.; Jacobson, M. Economic assessment of landowners’ willingness to supply energy crops on marginal lands in the northeastern of the United States. Biomass Bioenergy 2018, 113, 22–30. [Google Scholar] [CrossRef]
  18. Leibowicz, B.D.; Krey, V.; Grubler, A. Representing spatial technology diffusion in an energy system optimization model. Technol. Forecast. Soc. Chang. 2016, 103, 350–363. [Google Scholar] [CrossRef]
  19. Jiang, S.; Lian, M.; Lu, C.; Gu, Q.; Ruan, S.; Xie, X. Ensemble Prediction Algorithm of Anomaly Monitoring Based on Big Data Analysis Platform of Open-Pit Mine Slope. Complexity 2018. [Google Scholar] [CrossRef]
  20. Sun, F.; Yao, Y.; Chen, M.; Li, X.; Zhao, L.; Meng, Y.; Sun, Z.; Zhang, T.; Feng, D. Performance analysis of superheated steam injection for heavy oil recovery and modeling of wellbore heat efficiency. Energy 2017, 125, 795–804. [Google Scholar] [CrossRef]
  21. Nie, H.G.; Kemp, R.; Vivanco, D.F.; Vasseur, V. Structural decomposition analysis of energy-related CO2 emissions in China from 1997 to 2010. Energy Effic. 2016, 9, 1351–1367. [Google Scholar] [CrossRef]
  22. Li, P.X.; Sun, W. Temporal Evolution and Influencing Factors of Energy Consumption and Related Carbon Emissions from the Perspective of Industrialization and Urbanization in Shanghai, China. Sustainability 2018, 10, 3054. [Google Scholar] [CrossRef]
  23. Wang, S.H.; Huang, S.L.; Huang, P.J. Can spatial planning really mitigate carbon dioxide emissions in urban areas? A case study in Taipei, Taiwan. Landsc. Urban Plan. 2018, 169, 22–36. [Google Scholar] [CrossRef]
  24. Yang, A.M.; Li, Y.F.; Kong, F.B.; Wang, G.Q.; Chen, E.H. Security control redundancy allocation technology and security keys based on Internet of Things. IEEE Access 2018, 6, 50187–50196. [Google Scholar] [CrossRef]
  25. Yang, Y.Y.; Zhao, T.; Wang, Y.N.; Shi, Z.H. Research on impacts of population-related factors on carbon emissions in Beijing from 1984 to 2012. Environ. Impact Assess. Rev. 2015, 55, 45–53. [Google Scholar] [CrossRef]
  26. Wang, W.W.; Liu, X.; Zhang, M.; Song, X.F. Using a new generalized LMDI (logarithmic mean Divisia index) method to analyze China’s energy consumption. Energy 2014, 67, 617–622. [Google Scholar] [CrossRef]
  27. Sun, F.; Yao, Y.; Li, X.; Yu, P.; Zhao, L.; Zhang, Y. A numerical approach for obtaining type curves of superheated multi-component thermal fluid flow in concentric dual-tubing wells. Int. J. Heat Mass Transfer 2017, 111, 41–53. [Google Scholar] [CrossRef]
  28. Kang, J.D.; Zhao, T.; Liu, N.; Zhang, X.; Xu, S.X.; Lin, T. A multi-sectoral decomposition analysis of city-level greenhouse gas emissions: Case study of Tianjin China. Energy 2014, 68, 562–571. [Google Scholar] [CrossRef]
  29. Zhou, Y.; Shan, Y.L.; Liu, G.S.; Guan, D.B. Emissions and low-carbon development in Guangdong-Hong Kong-Macao Greater Bay Area cities and their surroundings. Appl. Energy 2018, 228, 1683–1692. [Google Scholar] [CrossRef]
  30. Fu, H.; Li, Z.; Liu, Z.; Wang, Z. Research on Big Data Digging of Hot Topics about Recycled Water Use on Micro-Blog Based on Particle Swarm Optimization. Sustainability 2018, 10, 2488. [Google Scholar] [CrossRef]
  31. Sun, F.; Yao, Y.; Li, X. The Heat and Mass Transfer Characteristics of Superheated Steam Coupled with Non-condensing Gases in Horizontal Wells with Multi-point Injection Technique. Energy 2018, 143, 995–1005. [Google Scholar] [CrossRef]
  32. Zheng, S.N.; Alvarado, V.; Xu, P.P.; Leu, S.Y.; Hsu, S.C. Exploring spatial patterns of carbon dioxide emission abatement via energy service companies in China. Resour. Conserv. Recycl. 2018, 137, 145–155. [Google Scholar] [CrossRef]
  33. Kang, L.; Du, H.L.; Zhang, H.; Ma, W.L. Systematic research on the application of steel slag resources under the background of big data. Complexity 2018. [Google Scholar] [CrossRef]
  34. Yang, A.M.; Li, S.S.; Lin, H.L.; Jin, D.H. Edge Extraction of Mineralogical Phase Based on Fractal Theory. Chaos Solitions Fractals 2018, 117, 215–221. [Google Scholar]
  35. Wang, B.; Chen, W.; Wang, J.; Zhang, B.; Zhang, Z.; Qiu, X. Cooperative Tracking Control of Multi-agent Systems: A Heterogeneous Coupling Network and Intermittent Communication Framework. IEEE Trans. Cybern. 2018. [Google Scholar] [CrossRef]
  36. Wang, B.; Sun, Y.F.; Wang, Z.H. Agglomeration effect of CO2 emissions and emissions reduction effect of technology: A spatial econometric perspective based on China’s province-level data. J. Clean. Prod. 2018, 204, 96–106. [Google Scholar] [CrossRef]
  37. Liu, Z.; Liu, Y.; He, B.; Xu, W.; Jin, G.; Zhang, X. Application and suitability analysis of the key technologies in nearly zero energy buildings in China. Renew. Sustain. Energy Rev. 2019, 101, 329–345. [Google Scholar] [CrossRef]
  38. Zhou, C.S.; Wang, S.J. Examining the determinants and the spatial nexus of city-level CO2 emissions in China: A dynamic spatial panel analysis of China’s cities. J. Clean. Prod. 2018, 171, 917–926. [Google Scholar] [CrossRef]
  39. Chen, Y.; Zhou, Y. A study of multifractal measures of the spatial structure of the urban system in Central Plains. Acta Sci. Nat.-Univ. Pekin. 2001, 37, 810–818. [Google Scholar]
  40. Manchin, M.; Orazbayev, S. Social networks and the intention to migrate. World Dev. 2018, 109, 360–374. [Google Scholar] [CrossRef]
  41. Liu, W.; Xu, J.; Li, J. The Influence of Poverty Alleviation Resettlement on Rural Household Livelihood Vulnerability in the Western Mountainous Areas, China. Sustainability 2018, 10, 2793. [Google Scholar] [CrossRef]
  42. Li, P.; Han, Z.; Jia, X.; Mei, Z.; Han, X.; Wang, Z. Analysis and comparison on thermodynamic and economic performances of an organic Rankine cycle with constant and one-dimensional dynamic turbine efficiency. Energy Convers. Manag. 2019, 180, 665–679. [Google Scholar] [CrossRef]
  43. Norbutas, L.; Corten, R. Network structure and economic prosperity in municipalities: A large-scale test of social capital theory using social media data. Soc. Netw. 2018, 52, 120–134. [Google Scholar] [CrossRef]
  44. Yuan, J.F.; Chen, K.W.; Li, W.; Ji, C.; Wang, Z.R.; Skibniewski, M.J. Social network analysis for social risks of construction projects in high-density urban areas in China. J. Clean. Prod. 2018. [Google Scholar] [CrossRef]
  45. Xia, L.L.; Liu, Y.; Wang, X.J.; Tian, X.; Wu, Q.; Zhang, Y.; Liu, G.Y.; Hao, Y. Spatial analysis of the ecological relationships of urban carbon metabolism based on an 18 nodes network model. J. Clean. Prod. 2018, 170, 61–69. [Google Scholar] [CrossRef]
  46. Matsumoto, H. International urban systems and air passenger and cargo flows: Some calculations. J. Air Transp. Manag. 2004, 10, 239–247. [Google Scholar] [CrossRef]
  47. Chun, Y. Modeling network autocorrelation within migration flows by eigenvector spatial filtering. J. Geogr. Syst. 2008, 10, 317–344. [Google Scholar] [CrossRef]
  48. Liu, H.; Fang, C.; Zhang, X.; Wang, Z.; Bao, C.; Li, F. The effect of natural and anthropogenic factors on haze pollution in Chinese cities: A spatial econometrics approach. J. Clean. Prod. 2017, 165, 323–333. [Google Scholar] [CrossRef]
  49. Murat Celik, H.; Guldmann, J.M. Spatial interaction modeling of inter-regional commodity flows. Soc.-Econ. Plan. Sci. 2007, 41, 147–162. [Google Scholar] [CrossRef]
  50. Lao, X.; Zhang, X.L.; Shen, T.Y.; Skitmore, M. Comparing China’s city transportation and economic networks. Cities 2016, 53, 43–50. [Google Scholar] [CrossRef]
  51. Kaya, Y.; Yokobori, K. Environment Energy and Economy; Bookwell Publications: Delhi, Indian, 1999. [Google Scholar]
  52. Chen, F.; Zhu, D.J. Theoretical research on low-carbon city and empirical study of Shanghai. Habitat Int. 2013, 37, 33–42. [Google Scholar] [CrossRef]
Figure 1. Study area.
Sustainability 11 00001 g001
Figure 2. The spatial distribution of CO2 emission in the Chengdu-Chongqing urban agglomeration in 2005–2016.
Sustainability 11 00001 g002
Figure 3. Spatial association network of CO2 emissions in the Chengdu-Chongqing urban agglomeration in 2005–2016.
Sustainability 11 00001 g003
Figure 4. The association relations and network density of CO2 emissions within the Chengdu-Chongqing urban agglomeration in 2005–2016.
Sustainability 11 00001 g004
Figure 5. Spatial distribution of the tertiary system of key cities involved in CO2 emissions in the Chengdu-Chongqing urban agglomeration in 2016.
Sustainability 11 00001 g005
Figure 6. Spatial distribution of cohesive subgroups in the association network of CO2 emissions in the Chengdu-Chongqing urban agglomeration.
Sustainability 11 00001 g006
Table 1. Out-degree of the spatial association network of CO2 emissions in the Chengdu-Chongqing urban agglomeration in 2005–2016.
City2005200920122016
Out-degreeRankOut-degreeRankOut-degreeRankOut-degreeRank
Chengdu1178752213239229810424542172
Chongqing1734251319869148834616509251
Deyang225534367324475583661004
Mianyang235343390523437355703583
Neijiang173735327975456454616795
Zigong1081213201241324388123115812
Leshan160416299716435426576796
Meishan1162511212761126397113523311
Yibin141417261497395077537177
Nanchong128449236929362318500518
Guang’an1281810235361019249142794314
Luzhou10839122047212315729479449
Ziyang817614152261423479132902913
Suining720315134231518728152752815
Dazhou13282824450827616103538610
Ya’an164416289216603016824816
Table 2. In-degree of the spatial association network of CO2 emissions in the Chengdu-Chongqing urban agglomeration in 2005–2016.
City2005200920122016
In-degreeRankIn-degreeRankIn-degreeRankIn-degreeRank
Chengdu52424195122113784411906681
Chongqing30594655729667471131086206
Deyang42131273024210104121477182
Mianyang3569036271348809841239294
Neijiang3151955818558426451153345
Zigong261341248570116925499453113
Leshan2216115405381557790158140315
Meishan268989489551068968109917310
Yibin2553613471141368673119462312
Nanchong3491446410939145931250303
Guang’an2967285445287426971034168
Luzhou26692104957597347381036047
Ziyang3015175529578010661013579
Suining2614311480941267856129723511
Dazhou2373814439341463300148390014
Ya’an978616174931626258163665216
Table 3. Betweenness centrality index of the spatial association network of CO2 emissions in the Chengdu-Chongqing urban agglomeration in 2005–2016.
City2005200920122016
Index (%)RankIndex (%)RankIndex (%)RankIndex (%)Rank
Chongqing12.619228.373221.21729.9022
Chengdu25.238134.802125.527111.2611
Zigong0.000-0.119120.000-0.80310
Luzhou0.000-0.000-0.000-0.9387
Deyang0.000-0.159100.214101.4665
Mianyang0.000-0.71471.16775.3793
Suining0.000-0.000-0.238150.57111
Neijiang0.000-4.04844.52740.9826
Leshan0.000-0.71462.93150.8648
Nanchong0.23837.38138.57132.3814
Meishan0.000-0.23890.31790.000-
Yibin0.000-3.45252.88460.8649
Guang’an0.000-0.31780.000-0.09514
Dazhou0.000-0.159110.000-0.33313
Ya’an0.000-0.000-0.000-0.000-
Ziyang0.000-0.000-0.97780.35112
Table 4. Closeness centrality of the spatial association network of CO2 emissions in the Chengdu-Chongqing urban agglomeration in 2005–2016.
City2005200920122016
Index (%)RankIndex (%)RankIndex (%)RankIndex (%)Rank
Chongqing100.0001100.0001100.0001100.0001
Chengdu100.0002100.0002100.0002100.0002
Zigong55.556460.000765.217578.94710
Luzhou55.556657.6921560.0001283.3337
Deyang55.556560.000865.217783.3335
Mianyang55.5561062.500468.182493.7503
Suining55.556757.6921157.6921378.94711
Neijiang55.556862.500565.217883.3338
Leshan55.556960.000968.182383.3336
Nanchong57.692362.500665.217988.2354
Meishan55.5561157.6921260.0001171.42913
Yibin55.5561262.500365.217683.3339
Guang’an55.5561357.6921357.6921462.50015
Dazhou53.5711457.6921457.6921565.21714
Ya’an53.5711553.5711653.5711653.57116
Ziyang53.5711660.0001065.2171078.94712
Table 5. Key cities at the three levels of CO2 emission in the Chengdu-Chongqing urban agglomeration in 2016.
NumberCity
First-class (2)2Chengdu, Chongqing
Second-class (10)8Deyang, Mianyang, Nanchong, Neijiang, Leshan, Ziyang, Luzhou, Yibin
Third-class (16)6Zigong, Suining, Meishan, Guang’an, Dazhou, Ya’an
Table 6. Density matrix and image matrix for the spatial clustering of CO2 emissions in the Chengdu-Chongqing urban agglomeration in 2005–2016.
YearSubgroupDensity MatrixImage Matrix
12341234
200518906.5008151.3335057.1436148.1251111
21144.8331574.667527.381456.0000000
31635.1431230.7142800.0241253.9290010
4844.750544.083705.8931676.5000000
2009116539.50015079.1679221.71411457.7501111
22118.0002907.667969.667844.5000000
32937.7142215.0004924.8332282.0360010
41593.2501018.1671315.3573145.6670000
2012123132.00021787.33414172.07117570.5001111
22244.0003687.8331236.8571053.3330000
33836.8573031.5726735.0003180.0000010
42165.6251459.4171887.4294451.8330000
2016129762.50029367.83418770.50023474.1251111
23405.6675177.3331722.9051487.0830000
36175.2864484.9529785.5484615.3930010
43263.5002018.7502533.5006102.0830000
Table 7. Results of the effect analysis of the global network structure.
Explained VariableRegional CO2 Emission IntensityStandard Deviation of Inter-City CO2 Emission Intensity
Model(1)(2)
Constant term0.347 ***−1.131 ***
Network density−0.744 ***−0.928 ***
F statistic96.820 ***64.651 ***
R20.9060.866
Note: *** Significant at p < 0.001.
Table 8. Results of the effect analysis of the individual network structure.
Model(1)(2)(3)
Constant term1.385 ***0.402 ***3.647 ***
Degree centrality (DC)−0.635 ***
Betweenness centrality (BC) 0.042 *
Closeness centrality (CC) −0.659 ***
R20.7020.3320.233
Hausman12.697 ***4.629 **0.033
FE/REFEFERE
Note: *** Significant at p < 0.001, ** Significant at p < 0.005, * Significant at p < 0.01, FE: Fixed effect, RE: random effect.

