Sustainable Urban Regeneration for Shrinking Cities: A Case from Japan

1
School of Human Settlement and Civil Engineering, Xi’an Jiaotong University, Xi’an 710049, China
2
School of Architecture and Civil Engineering, Chengdu University, Chengdu 610106, China
3
Department of Architecture, The University of Kitakyushu, Kitakyushu 808-0135, Japan
*
Authors to whom correspondence should be addressed.
Sustainability 2019, 11(5), 1505; https://doi.org/10.3390/su11051505
Submission received: 13 December 2018
/
Revised: 22 February 2019
/
Accepted: 8 March 2019
/
Published: 12 March 2019
(This article belongs to the Special Issue Shrinking Cities—Testing Ground for Sustainability)
Abstract
:Population decline is leading to a shrinking city size in industrialized countries. In some developing countries, because majority of the population is concentrated in big cities, the population in undeveloped cities has begun to decline. Japan experienced rapid urban expansion surrounding industrial districts, including steeply sloped areas, between the 1950s and 1970s. In the past forty years, Japan’s population has decreased, and the average age of the population is increasing. The reduction in the size of cities, following population decreases is becoming an important issue, and the study of sustainable, concentrated urban planning to cope with shrinking city size is, therefore, necessary. We have conducted a case study using Yahatahigashi-ku to determine its redevelopment potential, based on a combination of urban geographic data. This paper (1) presents a typical case study using Geographic Information System (GIS) data to evaluate an aging and shrinking society; (2) explores the GIS design approaches configured for an aging society; and (3) evaluates the optimization of environmental performance for an urban regeneration plan. The primary factors related to this urban design case study included, a declining population, mixed urban land use, and the placement of public facilities. We developed a method involving the slope degree to evaluate land-use to model the importance of informational evaluation in the urban planning process. This method could contribute to the urban regeneration for an aging society and could also be applied to other aging and shrinking cities, in mountainous regions.
1. Introduction
Aging populations and shrinking cities are increasing internationally, in locations such as the United Kingdom, Germany, and Japan [1,2]. In Japan, the aging population and shrinking cities have led to serious problems, which includes declines in community vitality in most of Japan’s secondary cities. As these population changes are expected to continue, sustainable urban design and renovation are becoming increasingly important [3]. Comprehensive information evaluation and analysis is essential for the urban redevelopment process, particularly, given Japan’s population status and geographic characteristics.
1.1. Aging Cities
The global share of people, aged 60 years of age or over, increased from 9.2% in 1990 to 11.7% in 2013, and is expected to continue increasing to reach 21.1%, by 2050 [4]. Currently, approximately two-thirds of the world’s older population is living in developing countries, and by 2050, nearly 80% of the older population will be living in developing countries [4]. Facing the problem of aging cities is, therefore, a global concern, and the World Health Organization published a guide to engage cities in becoming more age-friendly to better tap into the potential that the older population can provide [5], which represents a significant effort to adjust the focus of urban planning, to this aging situation.
An aging society is defined as that in which the percentage of the population over 65 years of age, is higher than 25%. A percentage higher than 50% produces a limitative colony, which is a social community that is difficult to maintain. In Japan, the average life span is 83.7 years, which is the longest in the world [6], so the problem of an aging population is more serious than that faced by most other countries. In 2010, 23.0% of the total Japanese population was aged 60 years or older, and this age group is predicted to reach 39.9%, by 2060 [7], which makes the aging of the population a matter of urgent interest in Japan.
1.2. Shrinking Cities Around the World
The shrinking of cities, as a result of declining urban population has attracted increasing attention within the global scientific community [8]. A shrinking city is defined as an urban area that has experienced demographic decline, economic downturn, and geographic contraction [9]. The technological revolution created a new global economic pattern [10,11], which has led to the outflow of capital and human power [12]. Urban decline during the processes of globalization is more remarkable in cities supported by a single industry [13]. Decreasing birth rates and population size have further accelerated the reduction in the use of urban public facilities in Japan. New housing and community services could promote a greater life quality, and the concentration of urban facilities could increase the urban efficiency. In Japanese cities, the ideal population density, along bus lines, is 40 inhabitants per ha, and 50 inhabitants per ha, along metro lines [14]. Population density appears to have a strong relationship with the quantity of commercial facilities, within a walkable distance [15]. Density values should, therefore, be considered in the process of urban redevelopment, to achieve efficient organization of public transportation and commercial operations. Shrinking cities must be radically redesigned to be both better and smaller [16].
The prevalence of shrinking cities in Japan has recently become a serious issue, particularly as the population growth rate has decreased since 2015 [17]. Shrinking cities have also been observed in other industrial countries, such as the United States, the United Kingdom, and Germany. As of 2016, the estimated population of Detroit, Michigan, was just over 0.677 million, which represents a steep decline from a peak of more than 1.8 million in the 1950s. According to current estimates, Detroit’s population will continue to fall to just 0.61 million people, by 2030. The population of Liverpool, England, and Leipzig, Germany, reached historic peaks in the 1930s, with populations between 0.7 and 0.8 million, respectively [18]. Between 1951 and 2001, the population of Liverpool fell from 790,838 to 439,476 [19]. Leipzig experienced a similar decrease between 1933 and 2001, as the population declined from 713,470 to 493,052, and population density decreased from 5,548 to 1,657 inhabitants/km2 [20]. Facing this declining population and the underutilization of urban spaces, local governments have pursued urban redevelopment projects to create new uses for existing urban spaces [21]. This approach to address the problem of shrinking cities requires a more detailed consideration, as it is clearly a matter of increasing global concern.
1.3. Geographic Information System
Urban planners need to evaluate comprehensive information for urban design. The results of GIS condition analyses enable planners to identify the sites most in need of innovation. Information evaluation, according to GIS, would be a crucial component of this planning method [22,23]. Building information, cartographic documentation, thematic maps, and on-site surveys were combined and evaluated, using the GIS, in an Italian study [24]. Building energy performance [25], health emergency analysis and planning [26], and detailed building typologies [27] have also been assessed, based on GIS.
1.4. Geographic Condition Evaluation
This study proposed the reduction of size and condensing the functions of cities, to solve a few social problems that Japan is currently facing. Efforts to cope with reduced utilization efficiency by reducing city sizes have not been well-executed. These do represent an important aspect of dealing with our globally aging society. This proposal should be qualified to meet the special requirements of older adults, who tend to retain a traditional attitude toward the streets which are no longer suitable for inhabitation. Other newer elements are indispensable to a sustainable city planning, and these new elements could evolve from traditional elements, thus, connecting different generations. This study analyzed factors, such as plot ratio, building type, mixed commercial and residential spaces, and the location of public facilities for older adults.
1.5. Urban Shading Environment
The purpose of shrinking the city’s size is to concentrate its urban functions, and increase its building and population density, in order to increase urban efficiency. This concentration should be balanced with urban environmental changes. Sunlight conditions and shadows from nearby buildings create an important effect on the passive building development, as sunlight on southern exterior walls obtains the best heating conditions in winters [28]. Therefore, the Building Standard Law of Japan established a shadow restriction to ensure residential zones receive sufficient sunlight [29]. The sunlight conditions and shadows from the surrounding buildings are important issues to address during the urban redevelopment process. These conditions should be forecasted and evaluated to regenerate the shrinking cities.
2. Research Methodology
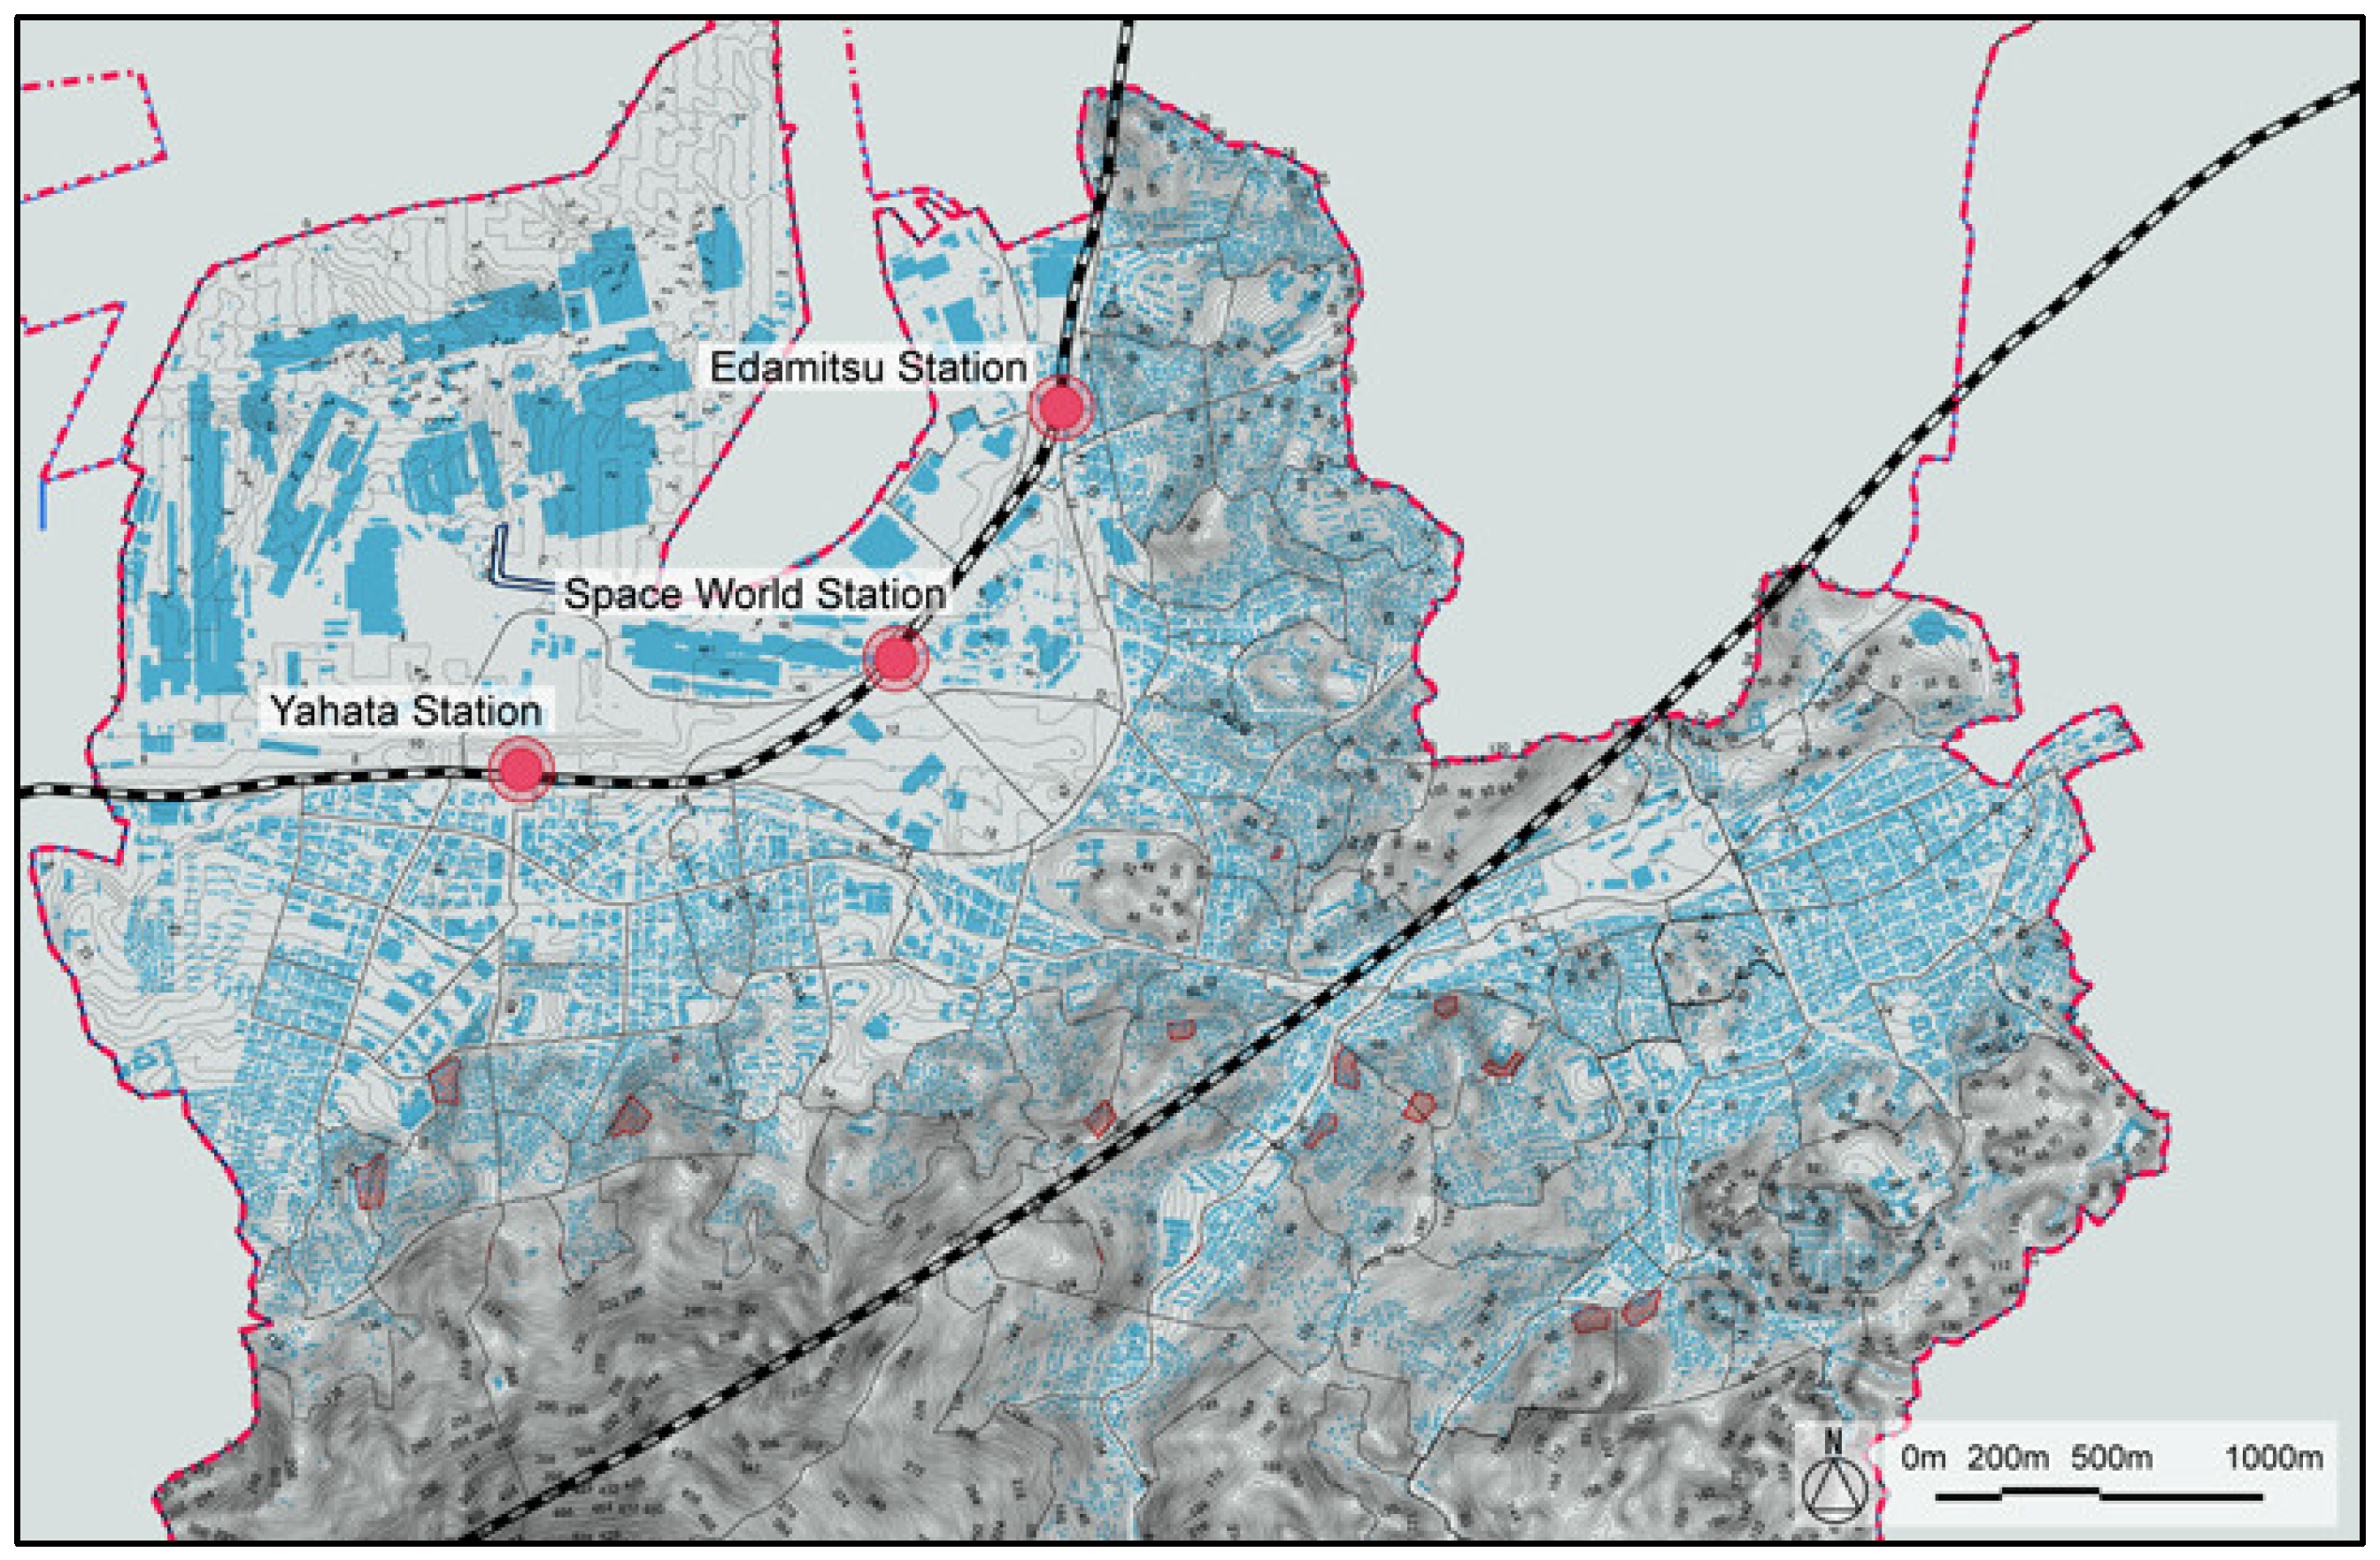
In this study, we analyzed the existing conditions in a selected district, using urban information and proposed a location for urban concentration, based on a comprehensive assessment of the site data. We obtained population data from the government of Kitakyushu. We inspected the current landform situation and distribution of livable facilities in the Yahatahigashi-ku district, by field observation. We collected and synthesized all data using GIS. As shown in Figure 1, Yahatahigashi-ku district is located between a mountain and the seacoast.
To forecast shadow conditions, according to different urban planning methods in the selected regeneration area, we used Jw_cad, which is a Japanese software program for architects and urban planners, designed to provide two- and three-dimensional drawings that forecast continuous shadow conditions in a single day [30].
2.1. The Selected District
We selected the Yahatahigashi-ku district in Kitakyushu, Japan, for this case study. Most of the areas in this district are mountainous, with steep slopes. The residential buildings were built for employees during the period of Japan’s industrialization. From 1960 to 1970, Kitakyushu supported Japan’s rapid economic growth, by aggregating material industries, such as steel, chemical, metal, and ceramic industries. This aggregation began when the government-managed Yahata Steelworks, the largest steelworks company in Asia, was founded in 1901. During that period, to accommodate employees, dwellings were constructed on the mountain, around the industrial area.
Today, the material industry has moved to other Asian countries. High-technology industries, including industrial robots, IC-related products, and biotechnologies, are generated. The retail areas in the Yahatahigashi-ku district are in decline, as the number of deserted houses continues to increase, and a new plan for urban regeneration is expected. The proportion of retirees has increased over the past 50 years, and most of the young people have been fleeing the city, due to the unsuitable living conditions. Young people are moving to more comfortable residential environments, and very few people are moving in, to this area. Thus, the strategy of urban compactness is an appropriate response to address the decline. A proper location for this urban concentration should be indicated, before beginning the urban regeneration.
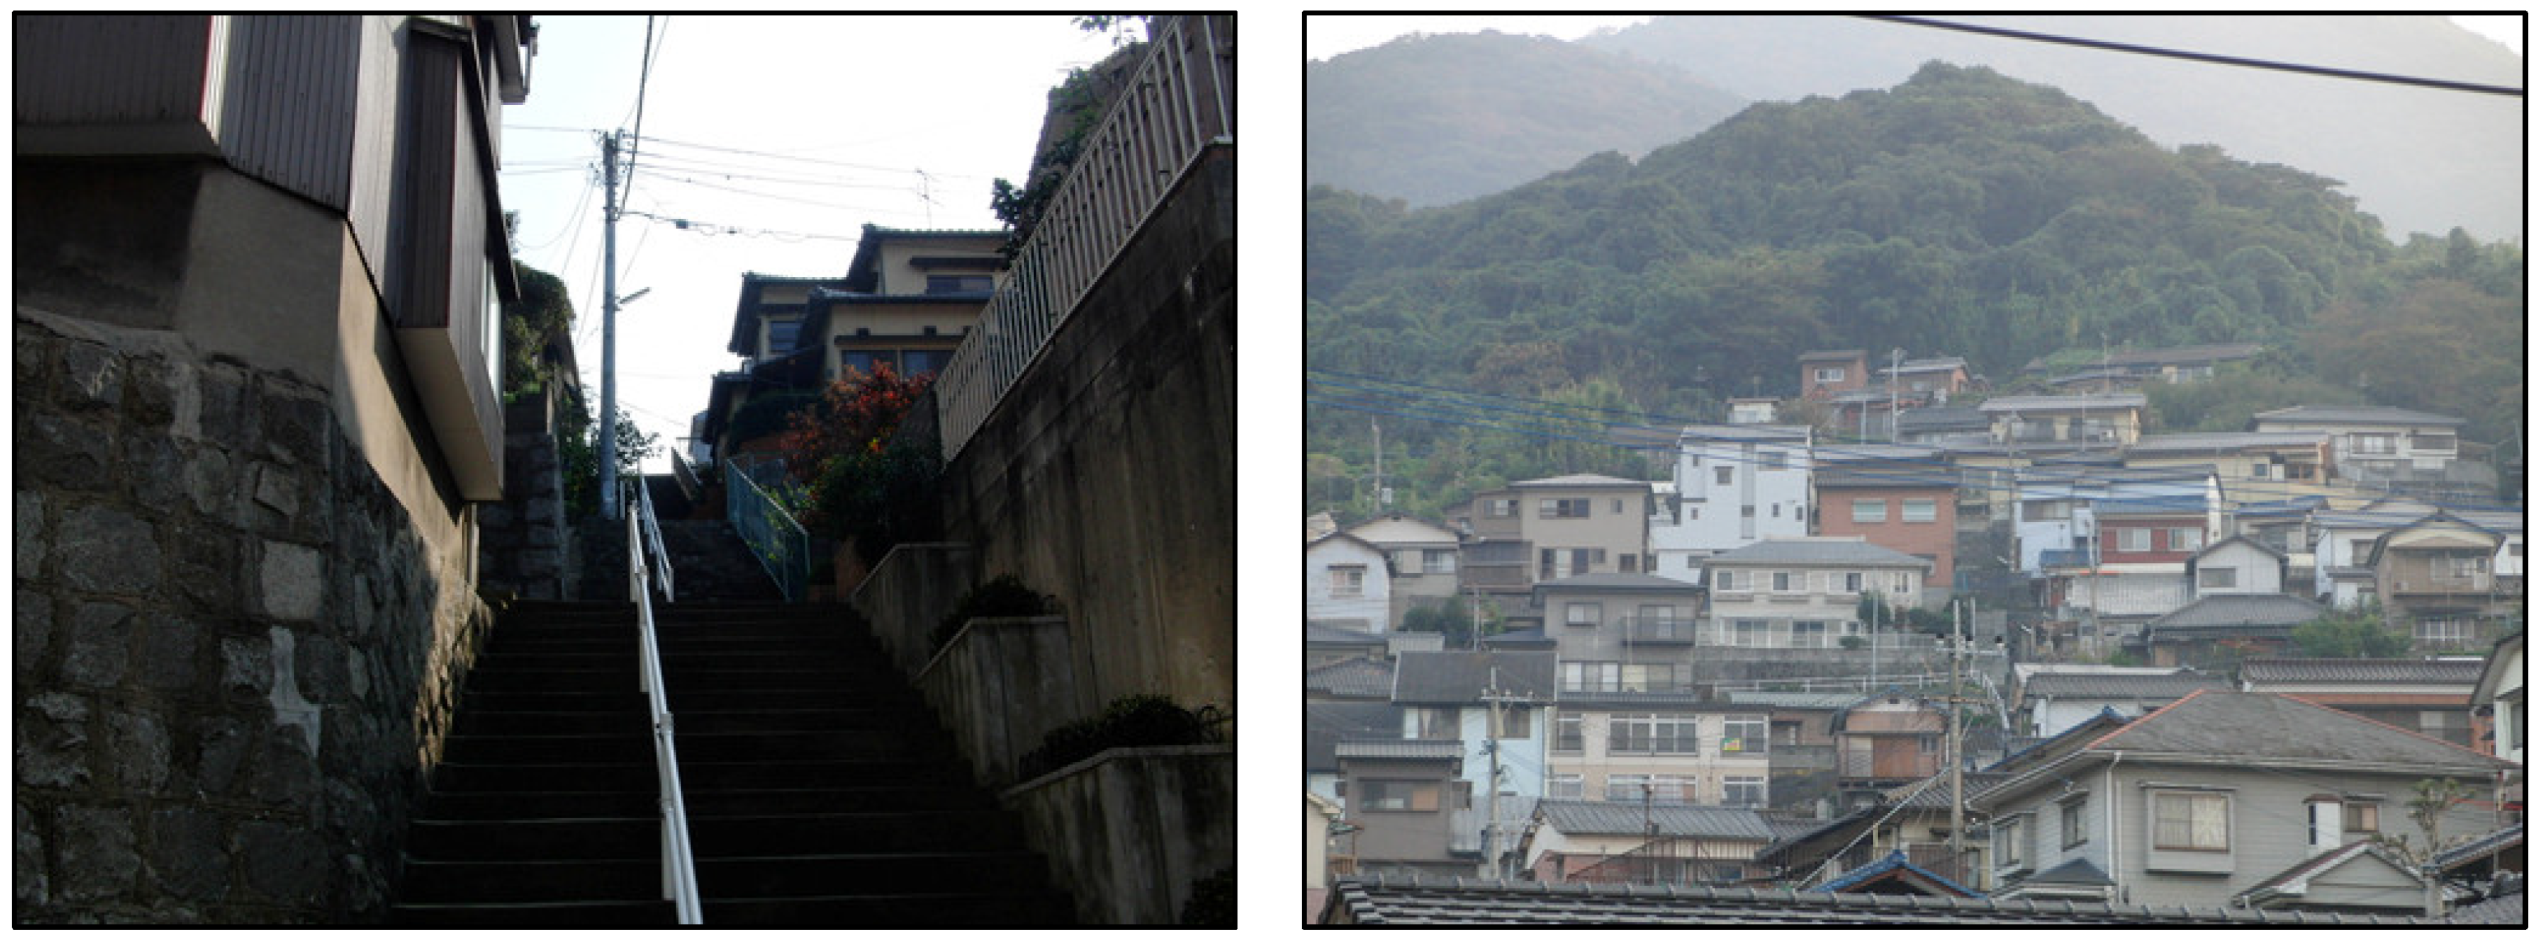
As shown in Figure 2, steeply sloped mountainous areas create a challenging living environment because car access to these areas is non-existent, and it is difficult for residents to carry out daily outdoor activities. As residents age, the inconvenient geography makes it difficult for them to access facilities near their homes. Older residents find it hard to sustain the necessary effort to go to nursing and shopping facilities, daily. The population scale, in turn, affects the efficiency of urban operations, leading to wasted urban energy and compromised community safety. Industrial trends have also changed, and the scale of factories have declined, increasing the possibility of developing flat areas.
The average lifespan of a Japanese wood constructed building is about 30 years [31]. The dwellings in the Yahatahigashi-ku area were built from 1960 to 1970, and have already been in use for about 50 years. Due to a combination of the aging building and inconvenient living environment, some inhabitants have moved out, abandoning their dwellings. Most of the residents of the high slopes are willing to move out, because the area is inconvenient for their changing lifestyle, but many remained because they cannot afford to buy an apartment somewhere else. In the meantime, the local government is trying to help these residents. This case study provides suggestions to the local government for the redevelopment of the lower area of town, which would provide low-cost, subsidized apartment buildings, for this at-risk population. The problems faced by the Yahatahigashi-ku exist throughout Japan, as well as in other industrial countries, and the approach to redevelopment discussed in this paper might be of use, beyond this particular case.
2.2. The Development of the Slope Degree Method
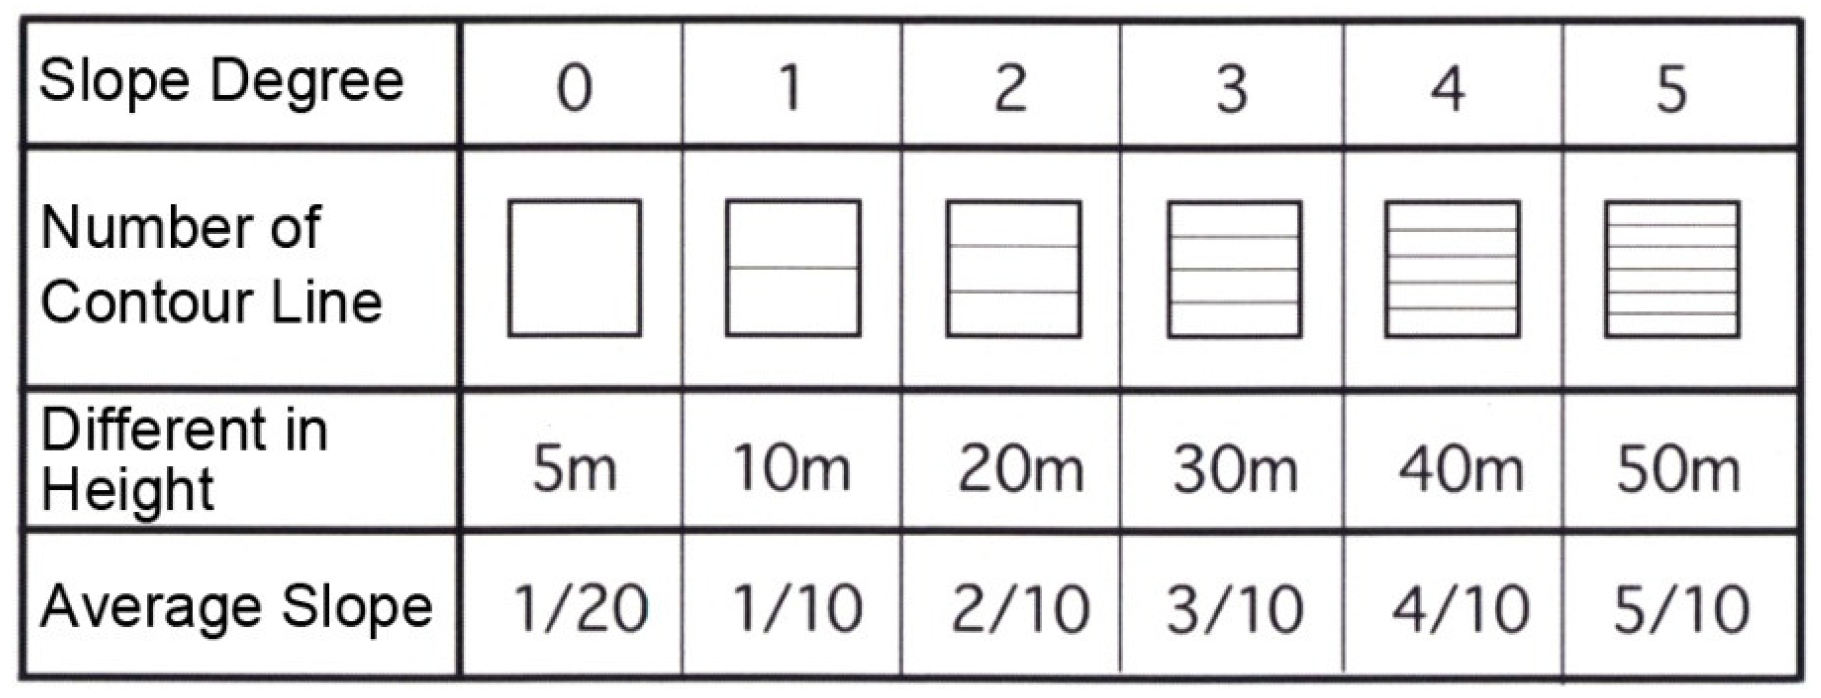
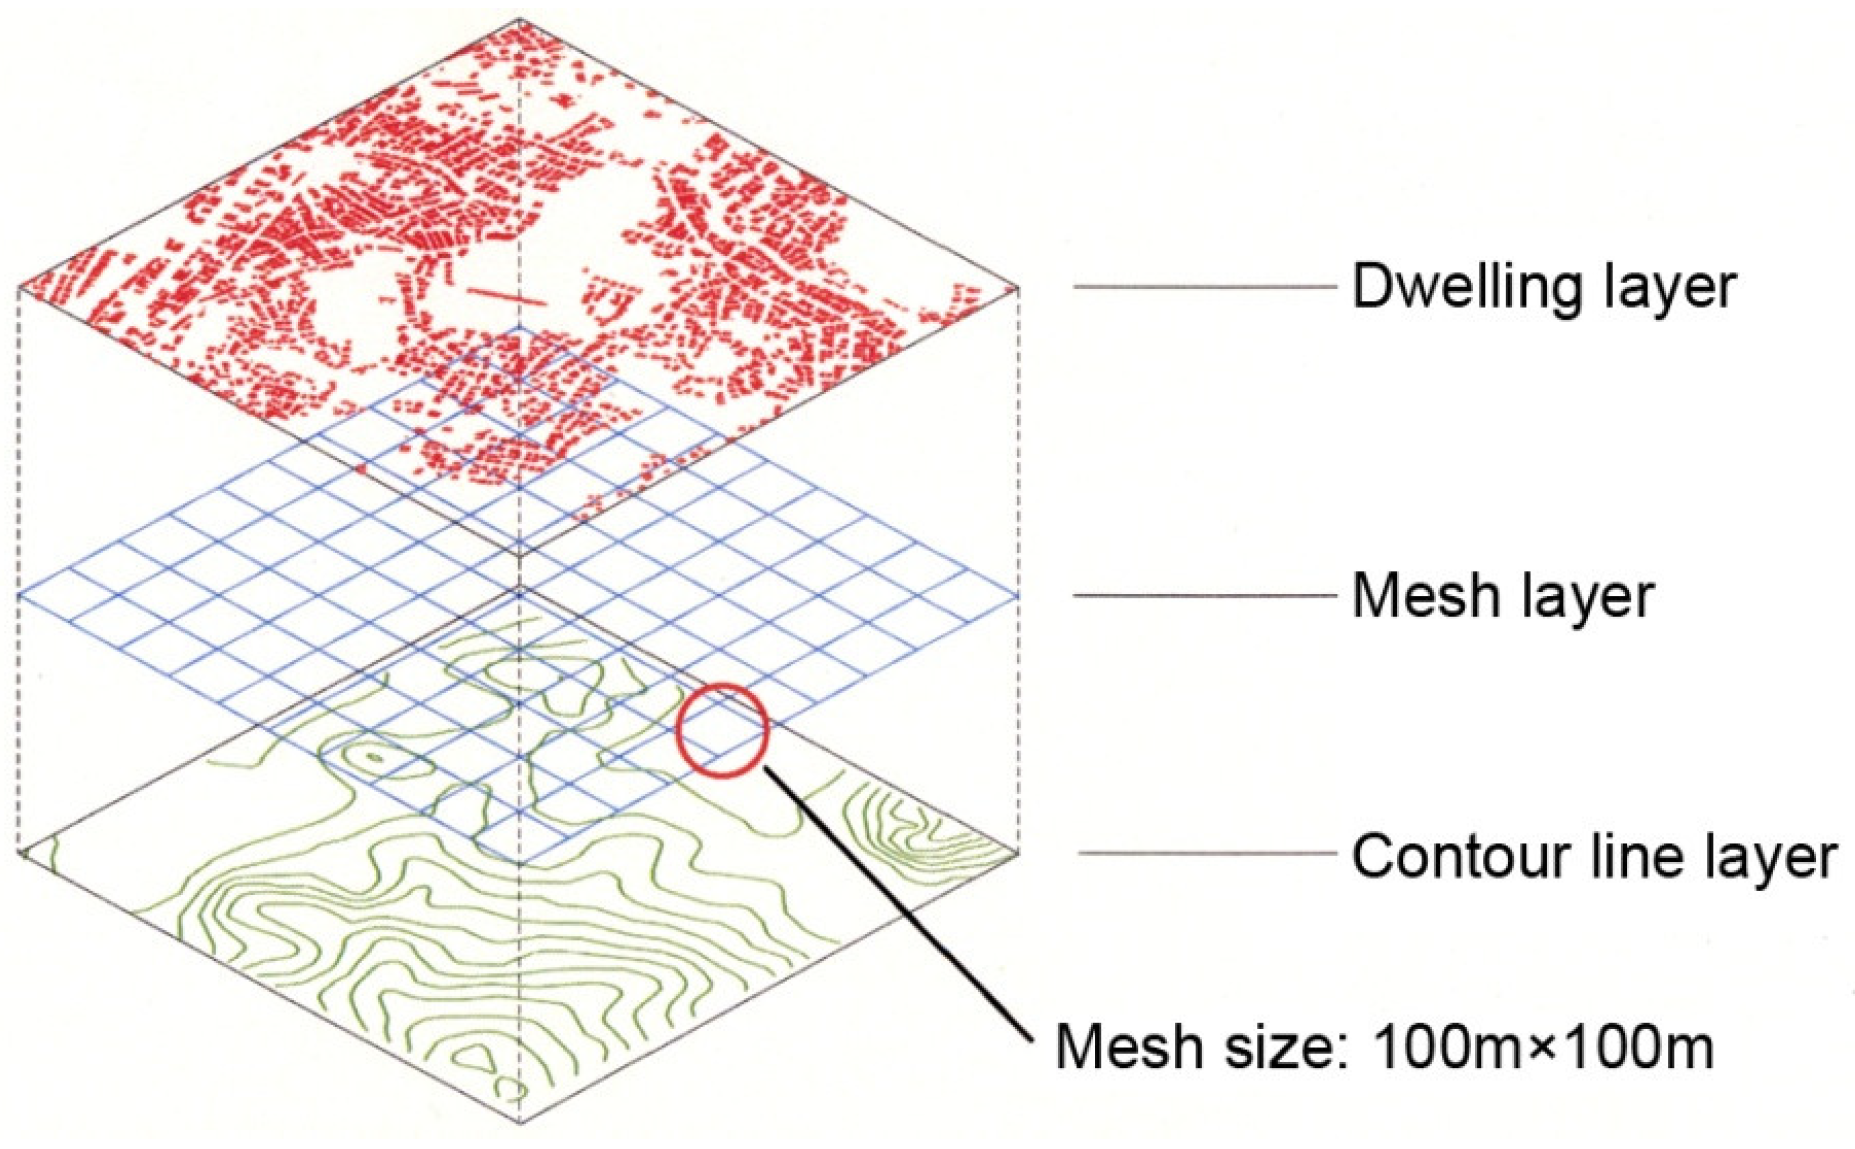
To evaluate the steepness of these areas, we developed the slope degree method as a standard. For a mid- to large-scale urban area, a 100 m × 100 m grid platform is commonly used to reflect the building environment [32,33]. The variations in height and average slope for each 100 m × 100 m mesh can be calculated by counting the number of contour lines in each mesh area, as shown in Figure 3.
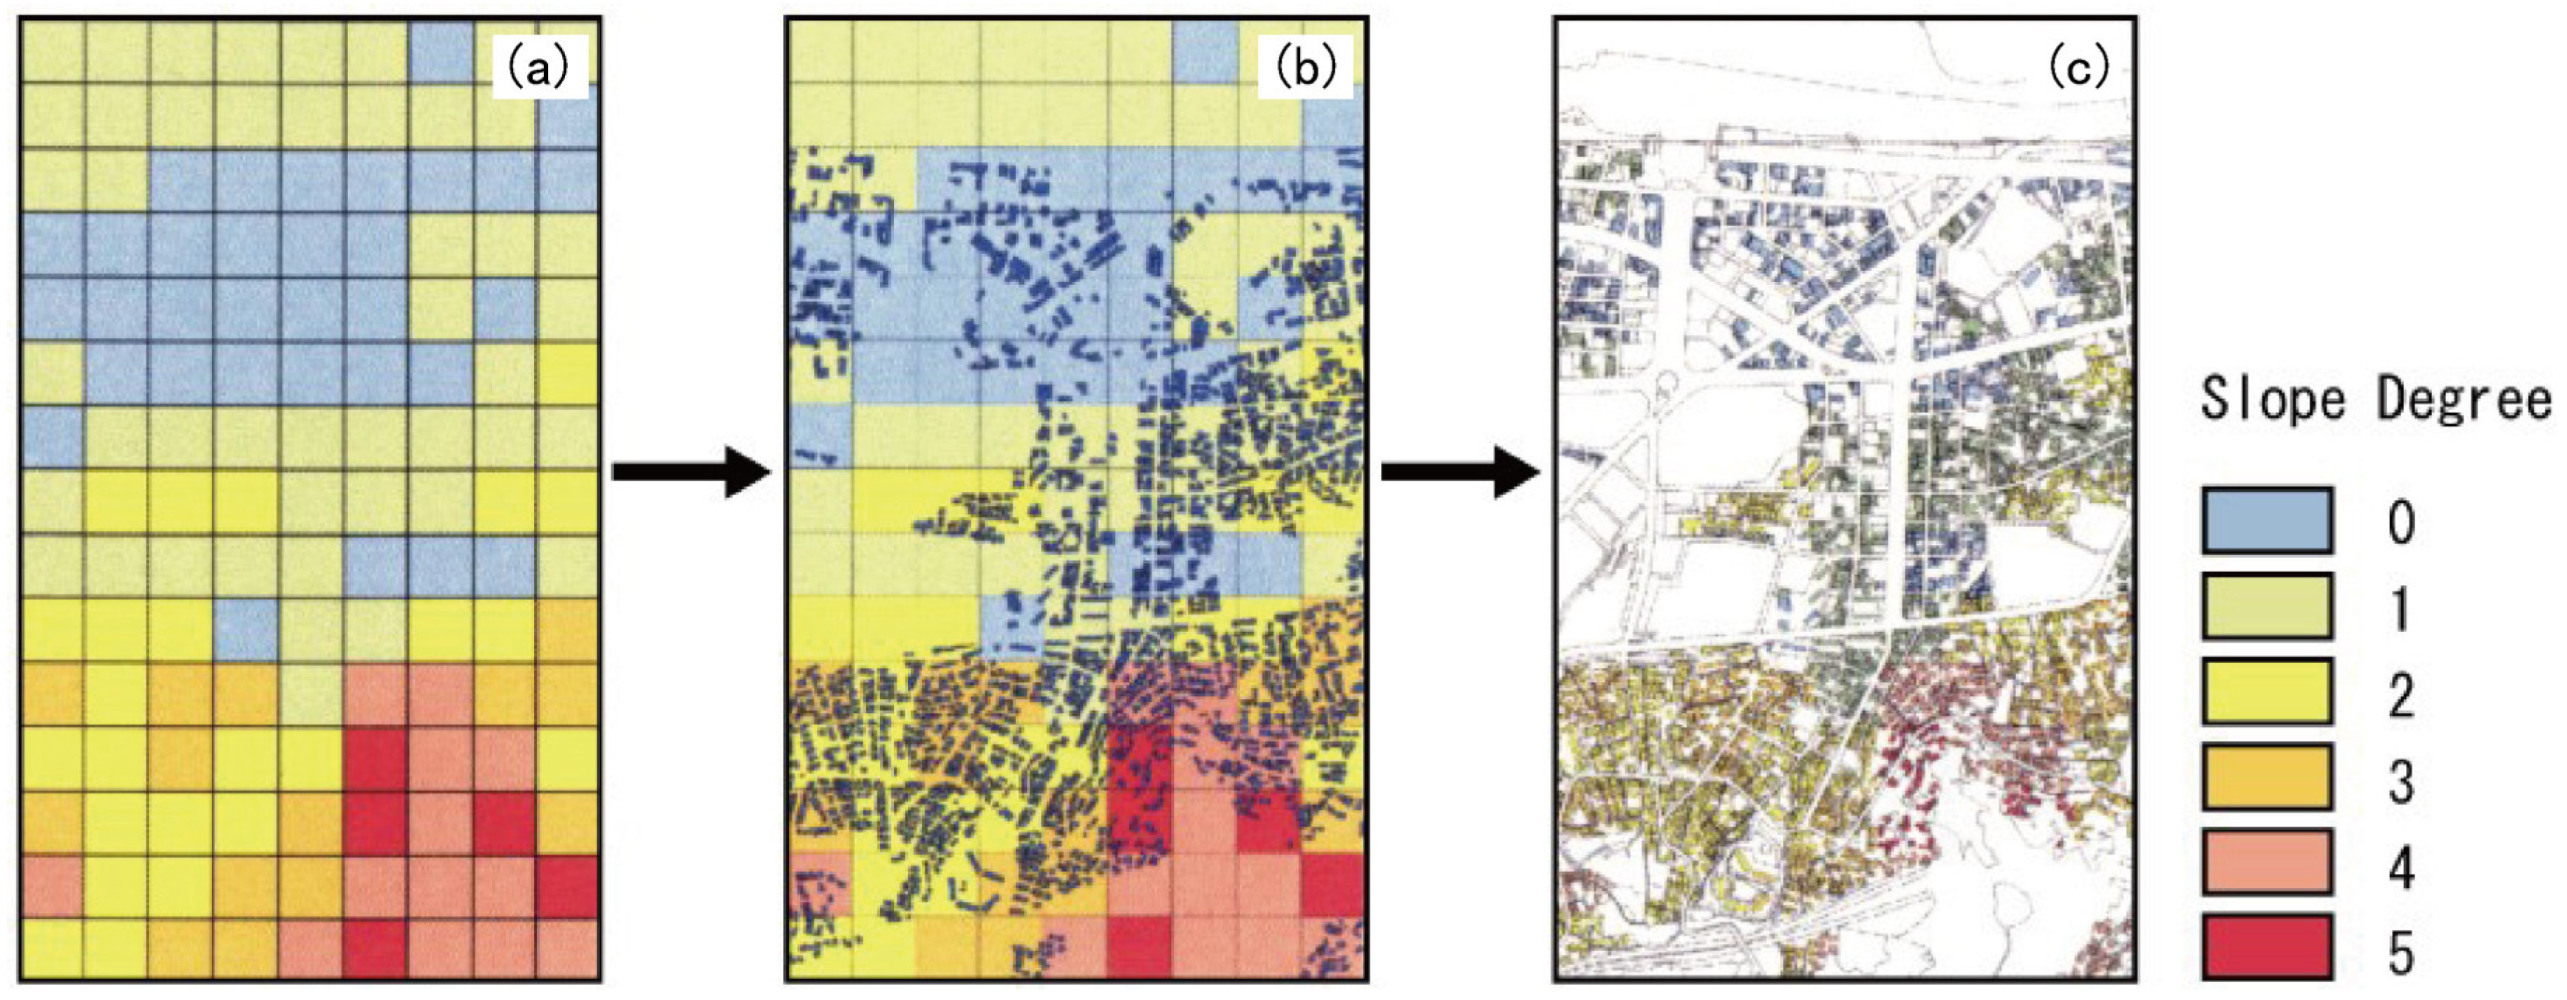
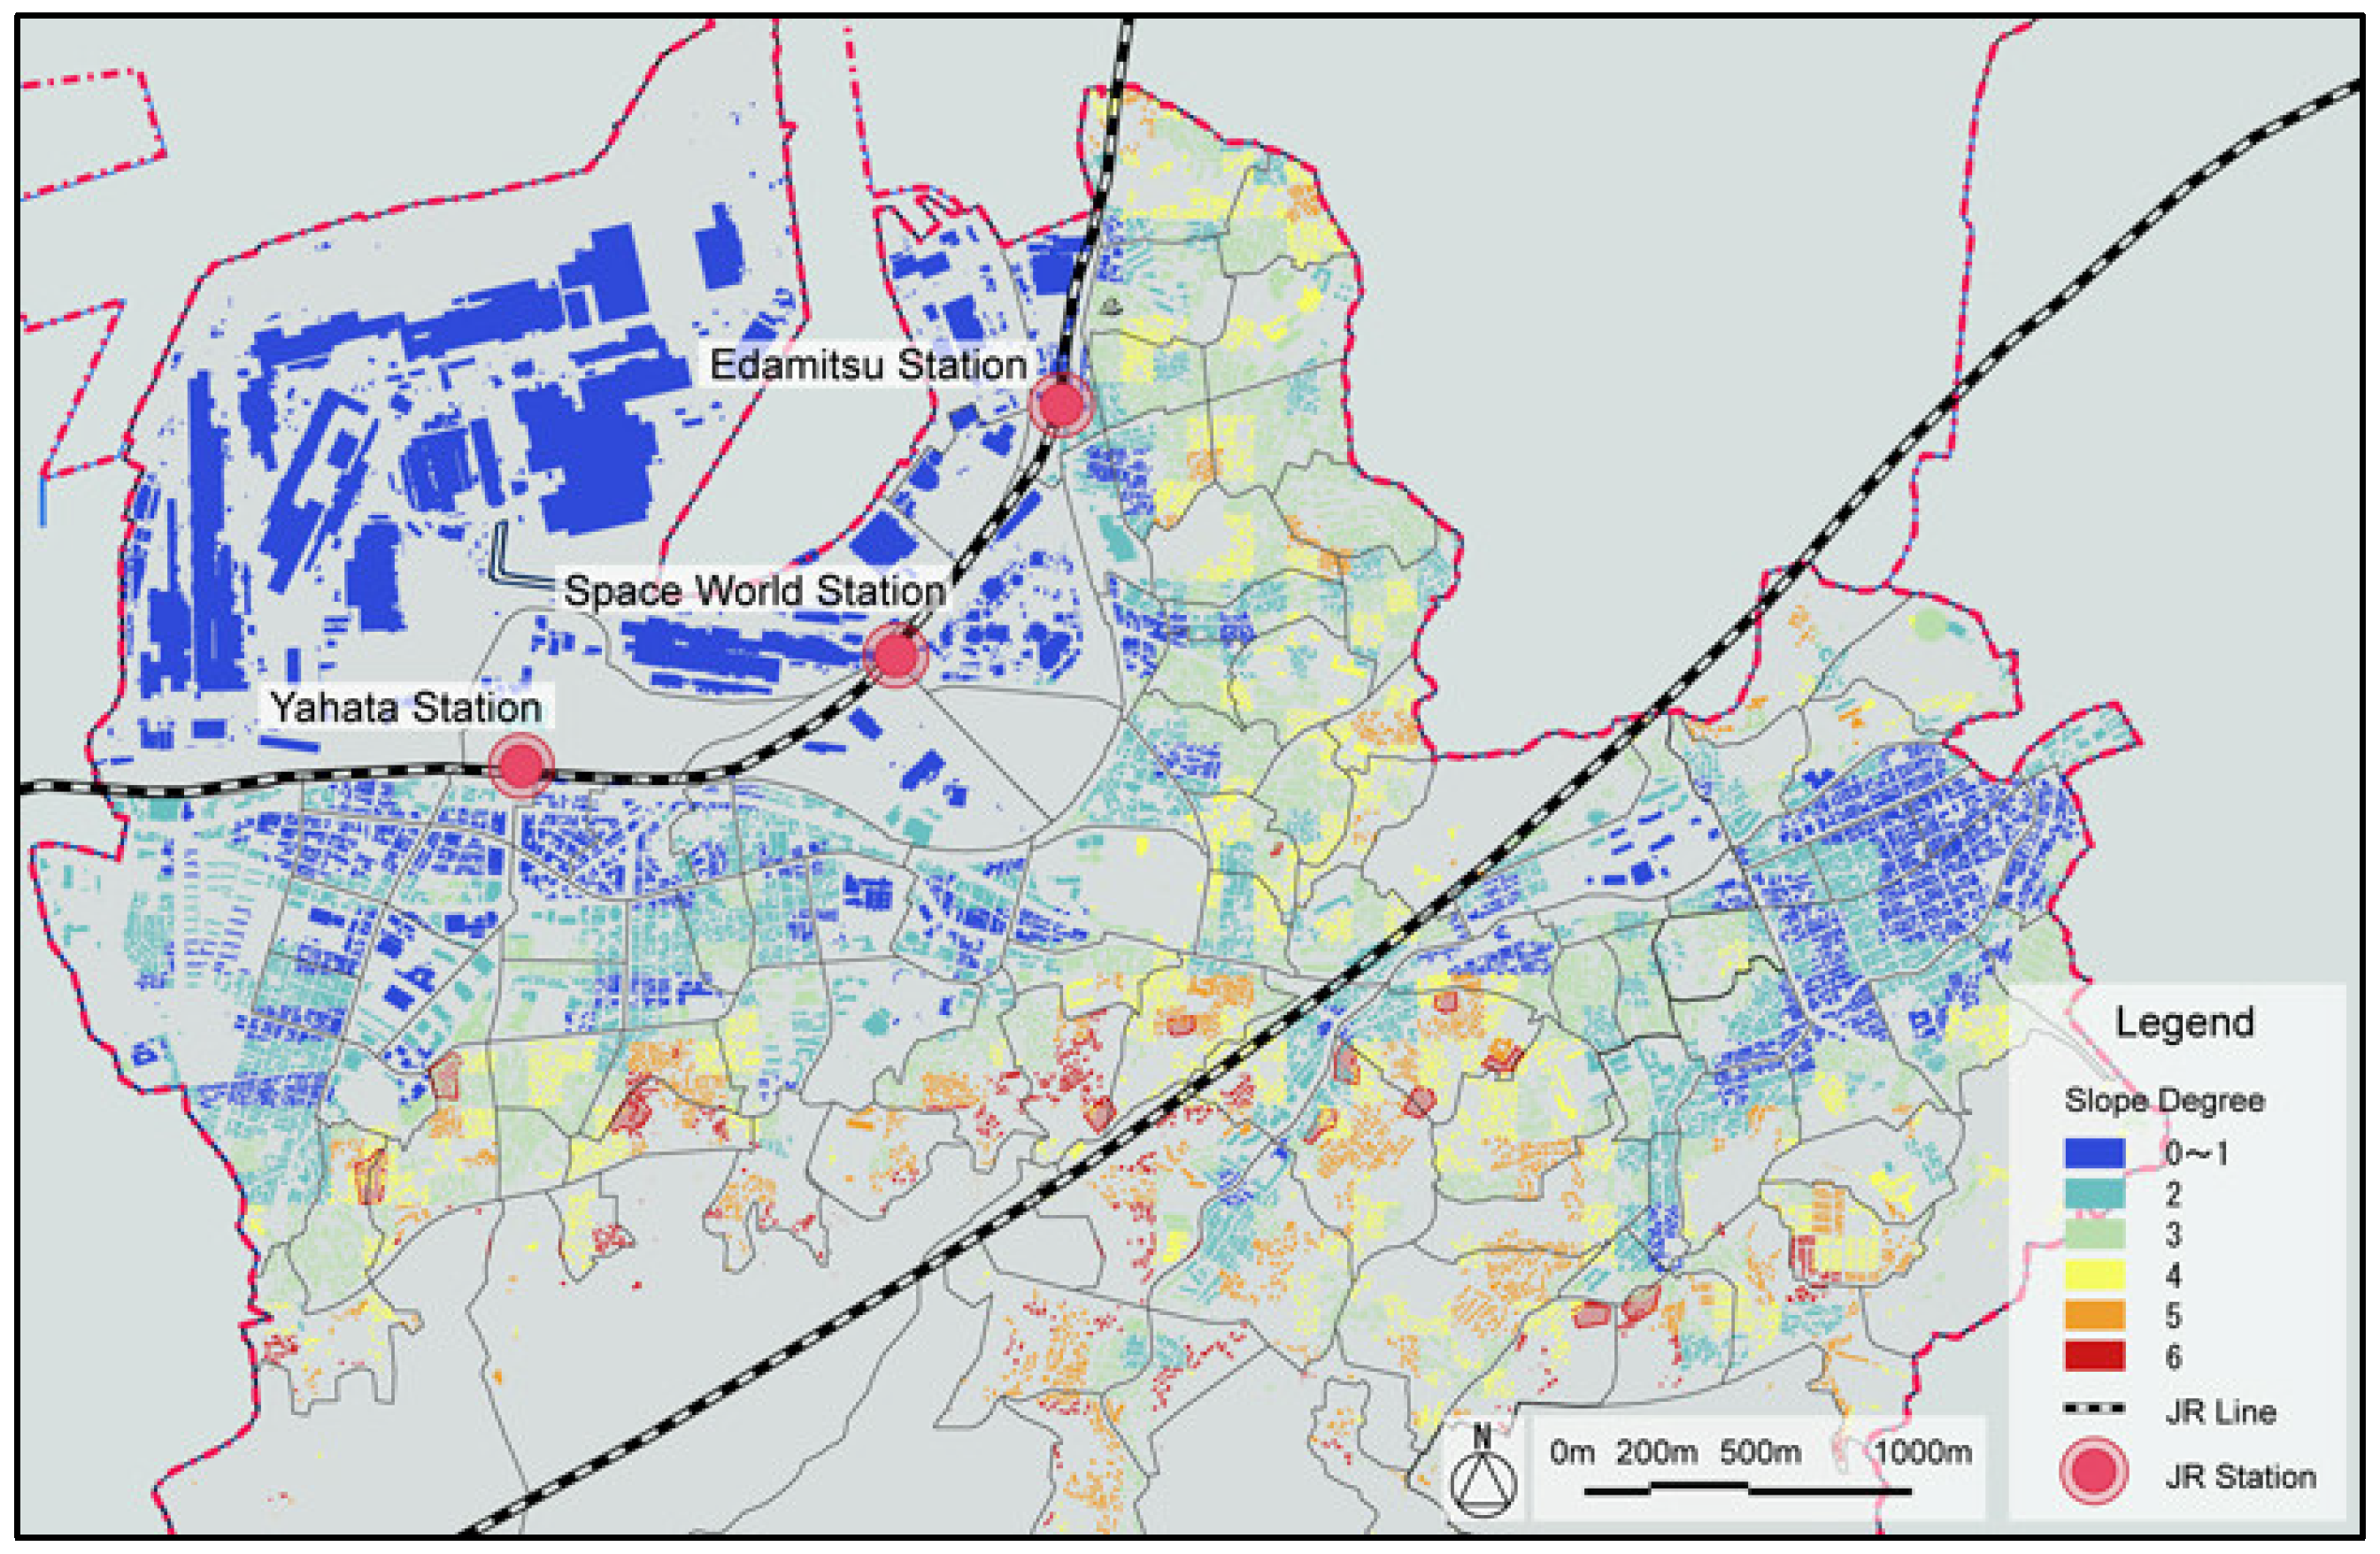
By leveraging the overlapping mesh layer and contour line layer, as shown in Figure 4, we defined the slope degree of each mesh. We then presented the areas of the mesh that overlapped the building layers and color-coded the slope degree for each building, as shown in Figure 5.
By leveraging the overlapping mesh layer and contour line layer, as shown in Figure 4, we defined the slope degree of each mesh. We then presented the areas of the mesh that overlapped the building layers and color-coded the slope degree for each building, as shown in Figure 5.
Slope degree represents the urban geographic characteristics and establishes the relationship between urban information and buildings. This new standard can assist urban planners to better understand the nature of building layout, as they work to carry out building development plans with respect to urban geography. The advantage of this evaluation method is to visually present the distribution of slope. Combining this urban information with the existing buildings could provide a direct reference for related decision making.
2.3. Shadow Area Calculation and Comparison
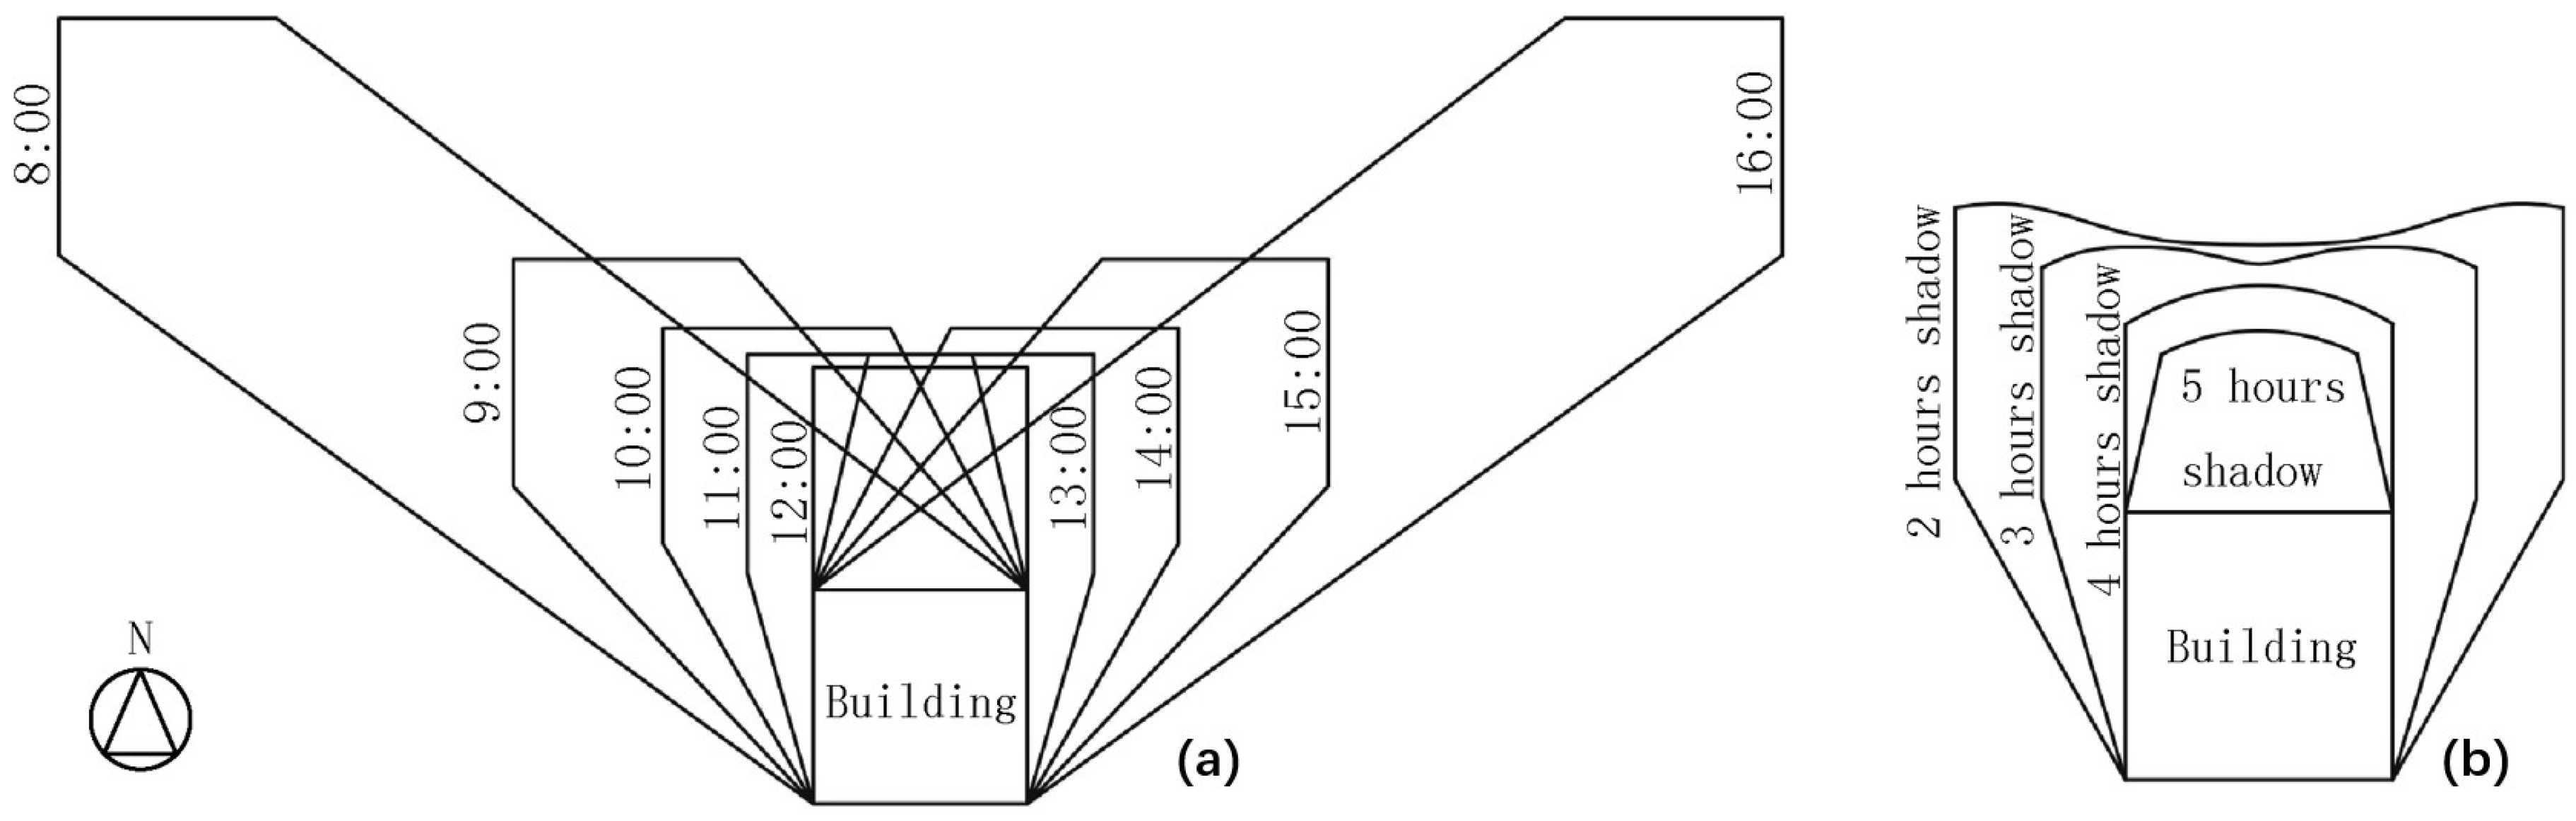
Building create shadows throughout the day. According to Article 56 of the Building Standard Law of Japan, the allowable hours of shadows in different land-use zones are indicated by shadow restrictions, to restrict the building heights for different neighborhoods. This restriction applies to all newly-constructed buildings and reconstructed buildings in Japan and can affect, both, building height and placement. These shady conditions can be evaluated, according to a continuous shadow area that represents the hours each day, during which the buildings might cast shadows, outside their respective areas, as shown in Figure 6. The standard time for environmental shadow evaluation is on the winter solstice, from 8 am to 4 pm. On average, for residential zones, 2-hour shadows are restricted 10 m away from buildings, and 4-hour shadows are restricted 5 m away from buildings [29]. To compare the shady conditions between the two urban regeneration patterns, we used Jw-cad to illustrate the 2-, 3-, and 4-hour shadows for each plan.
3. Geographic and Population Information Analysis
3.1. Urban Geographic
The contour line with 2 m slope and building layout are presented in Figure 7, which shows the relationship between the urban geography and buildings. Factory facilities are located in the beach areas, whereas a great number of dwellings are on the steeply-sloped area of the mountain. This situation stems from the industrial age, during which time the city grew with a rapid population increase. A sustainable urban design is now needed to remediate the access methods for older adults.
Figure 8 shows the slope degree of each building and presents the geographic environments in which the buildings are located. The higher the slope degree, the more difficult for the people to access the urban areas. Additionally, some buildings are situated in an area with a low slope degree, at a high elevation; these buildings are built on the flat area of the mountain. In general, buildings closer to the top of the mountain have a higher slope degree. This poor planning approach has made daily life inconvenient, for the residents in this area.
3.2. Urban Population
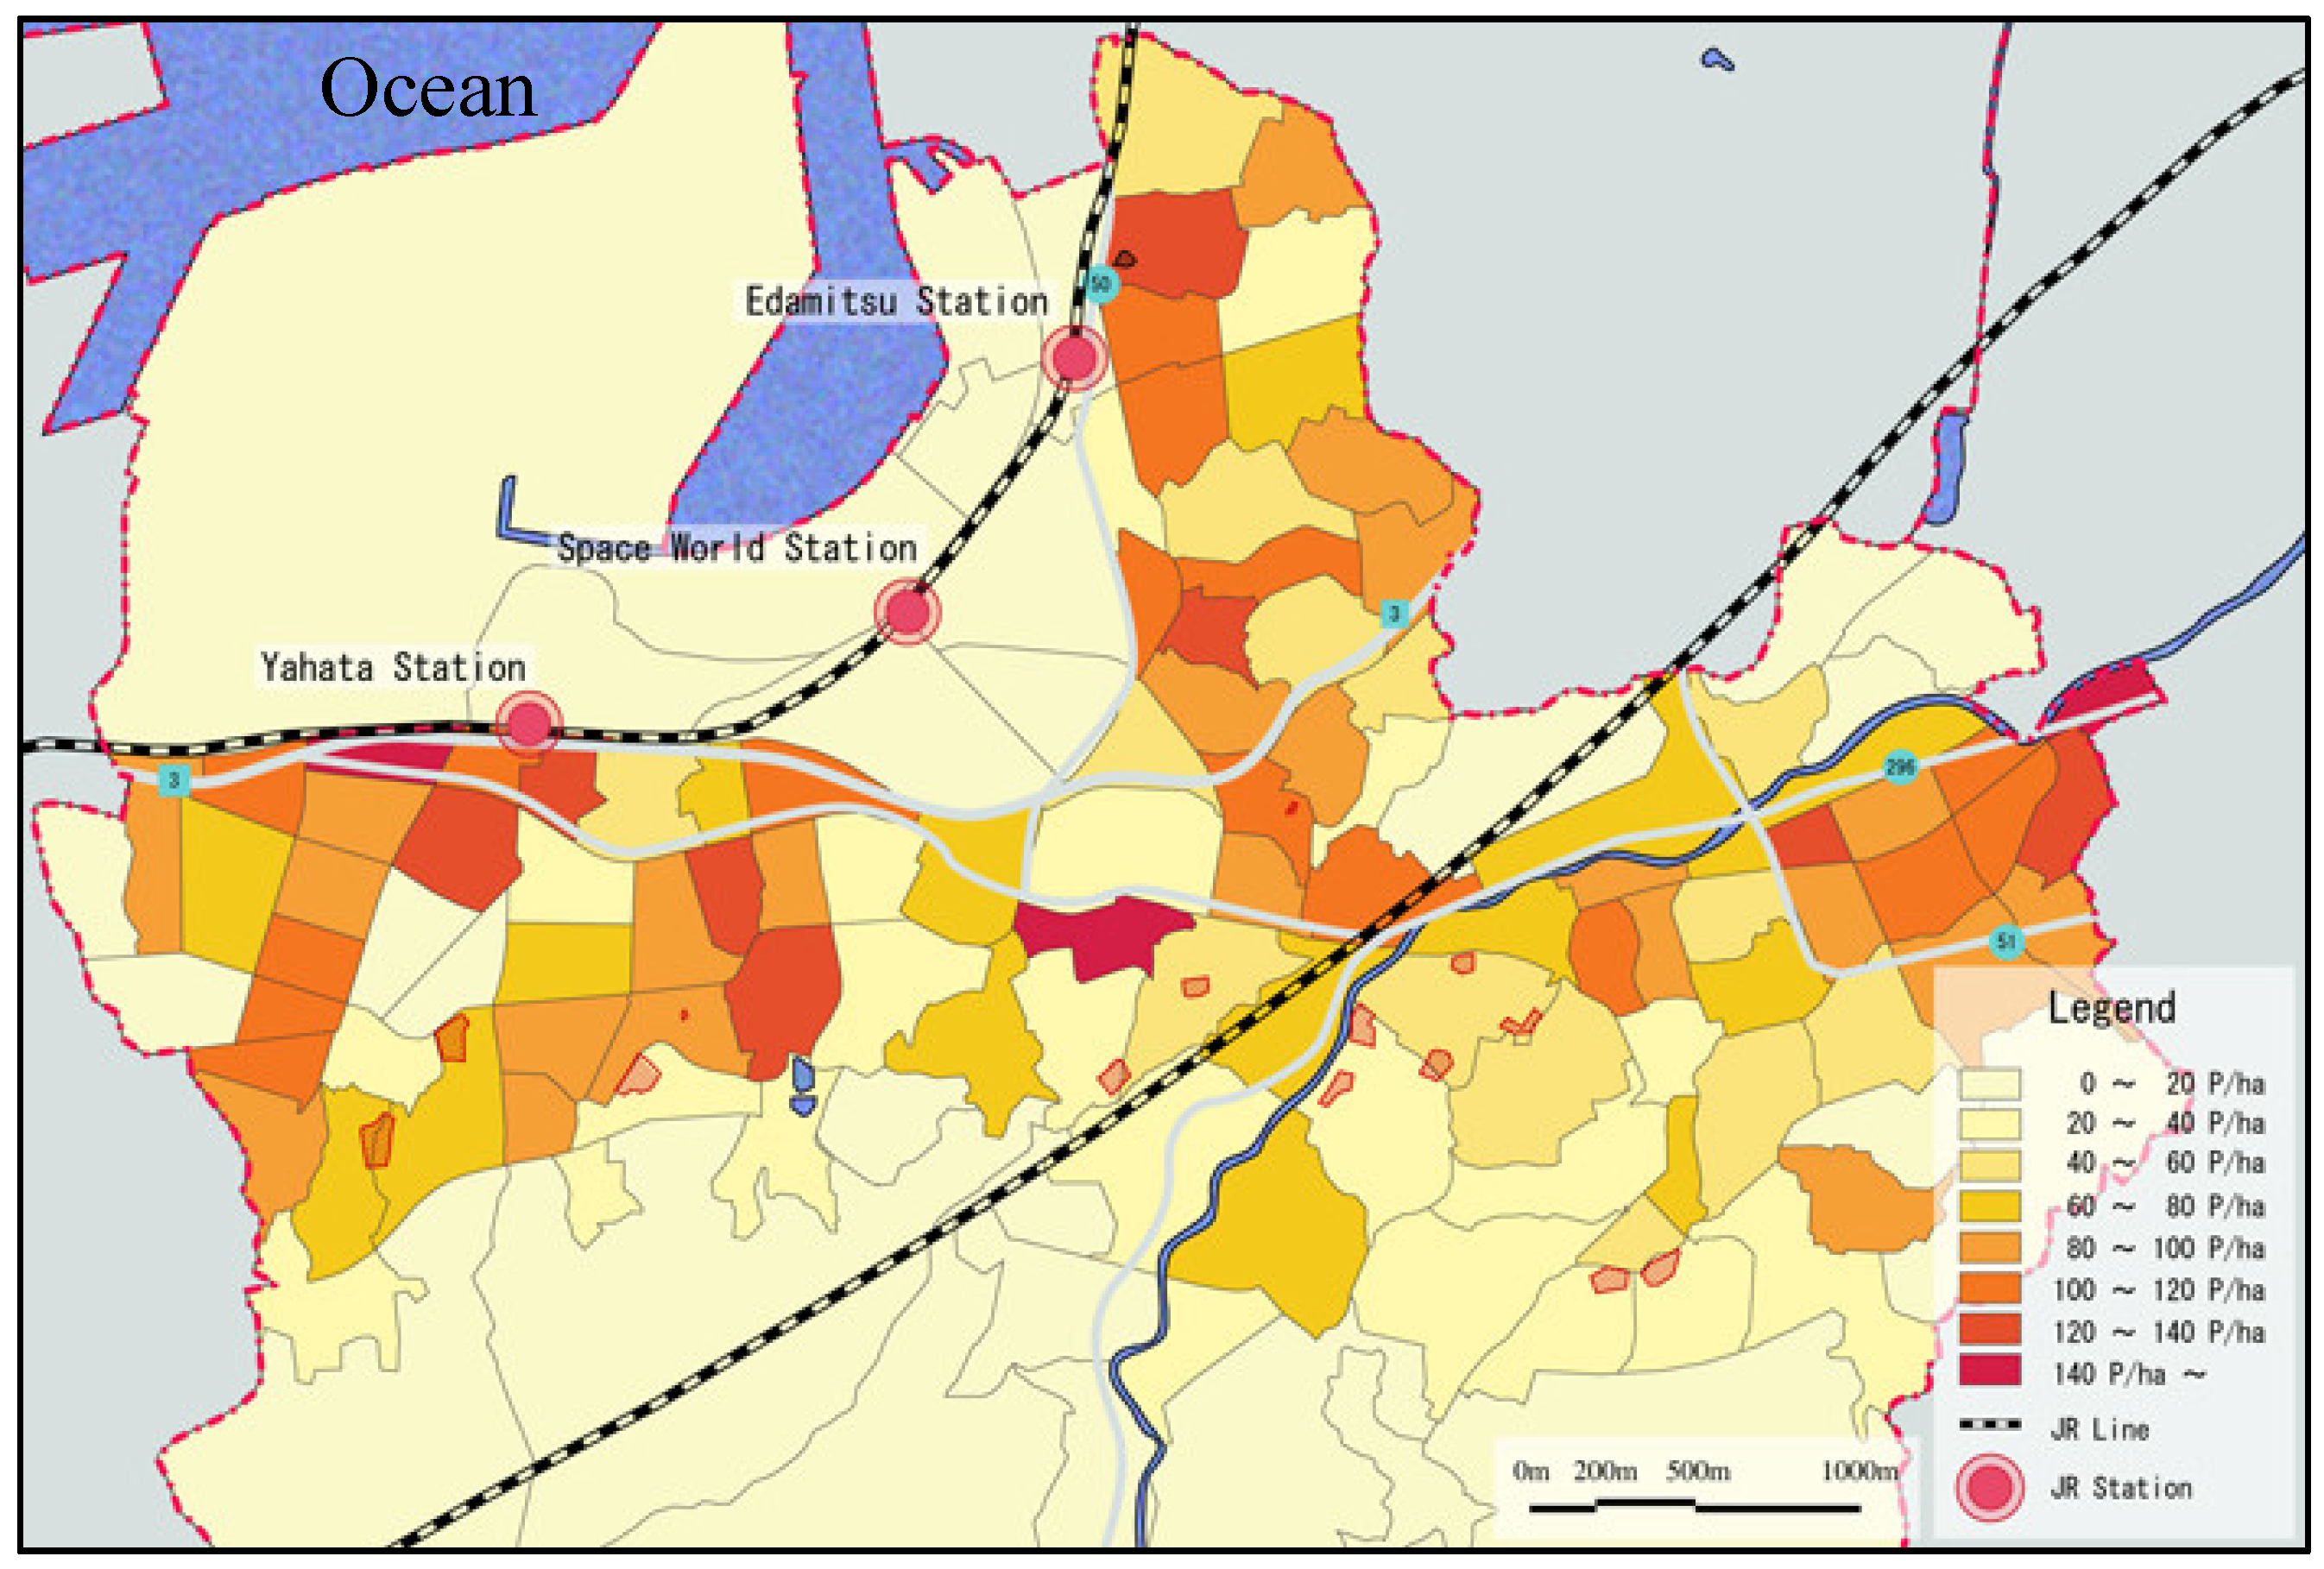
Local activity creates a bustling community, while also improving a city’s atmosphere. Thus, the population and construction both affect local revitalization, and should be analyzed before beginning the urban planning process. As shown in Figure 9, the population density of the towns situated on the sloped area is lower than that in the flat area, because most of the dwellings on the sloped area are isolated houses. Recently, some apartment buildings were built close to the railway station. The population in the flat area is increasing slowly, but the total population of this district continues to decrease, especially in the areas located on the steeply-sloped areas.
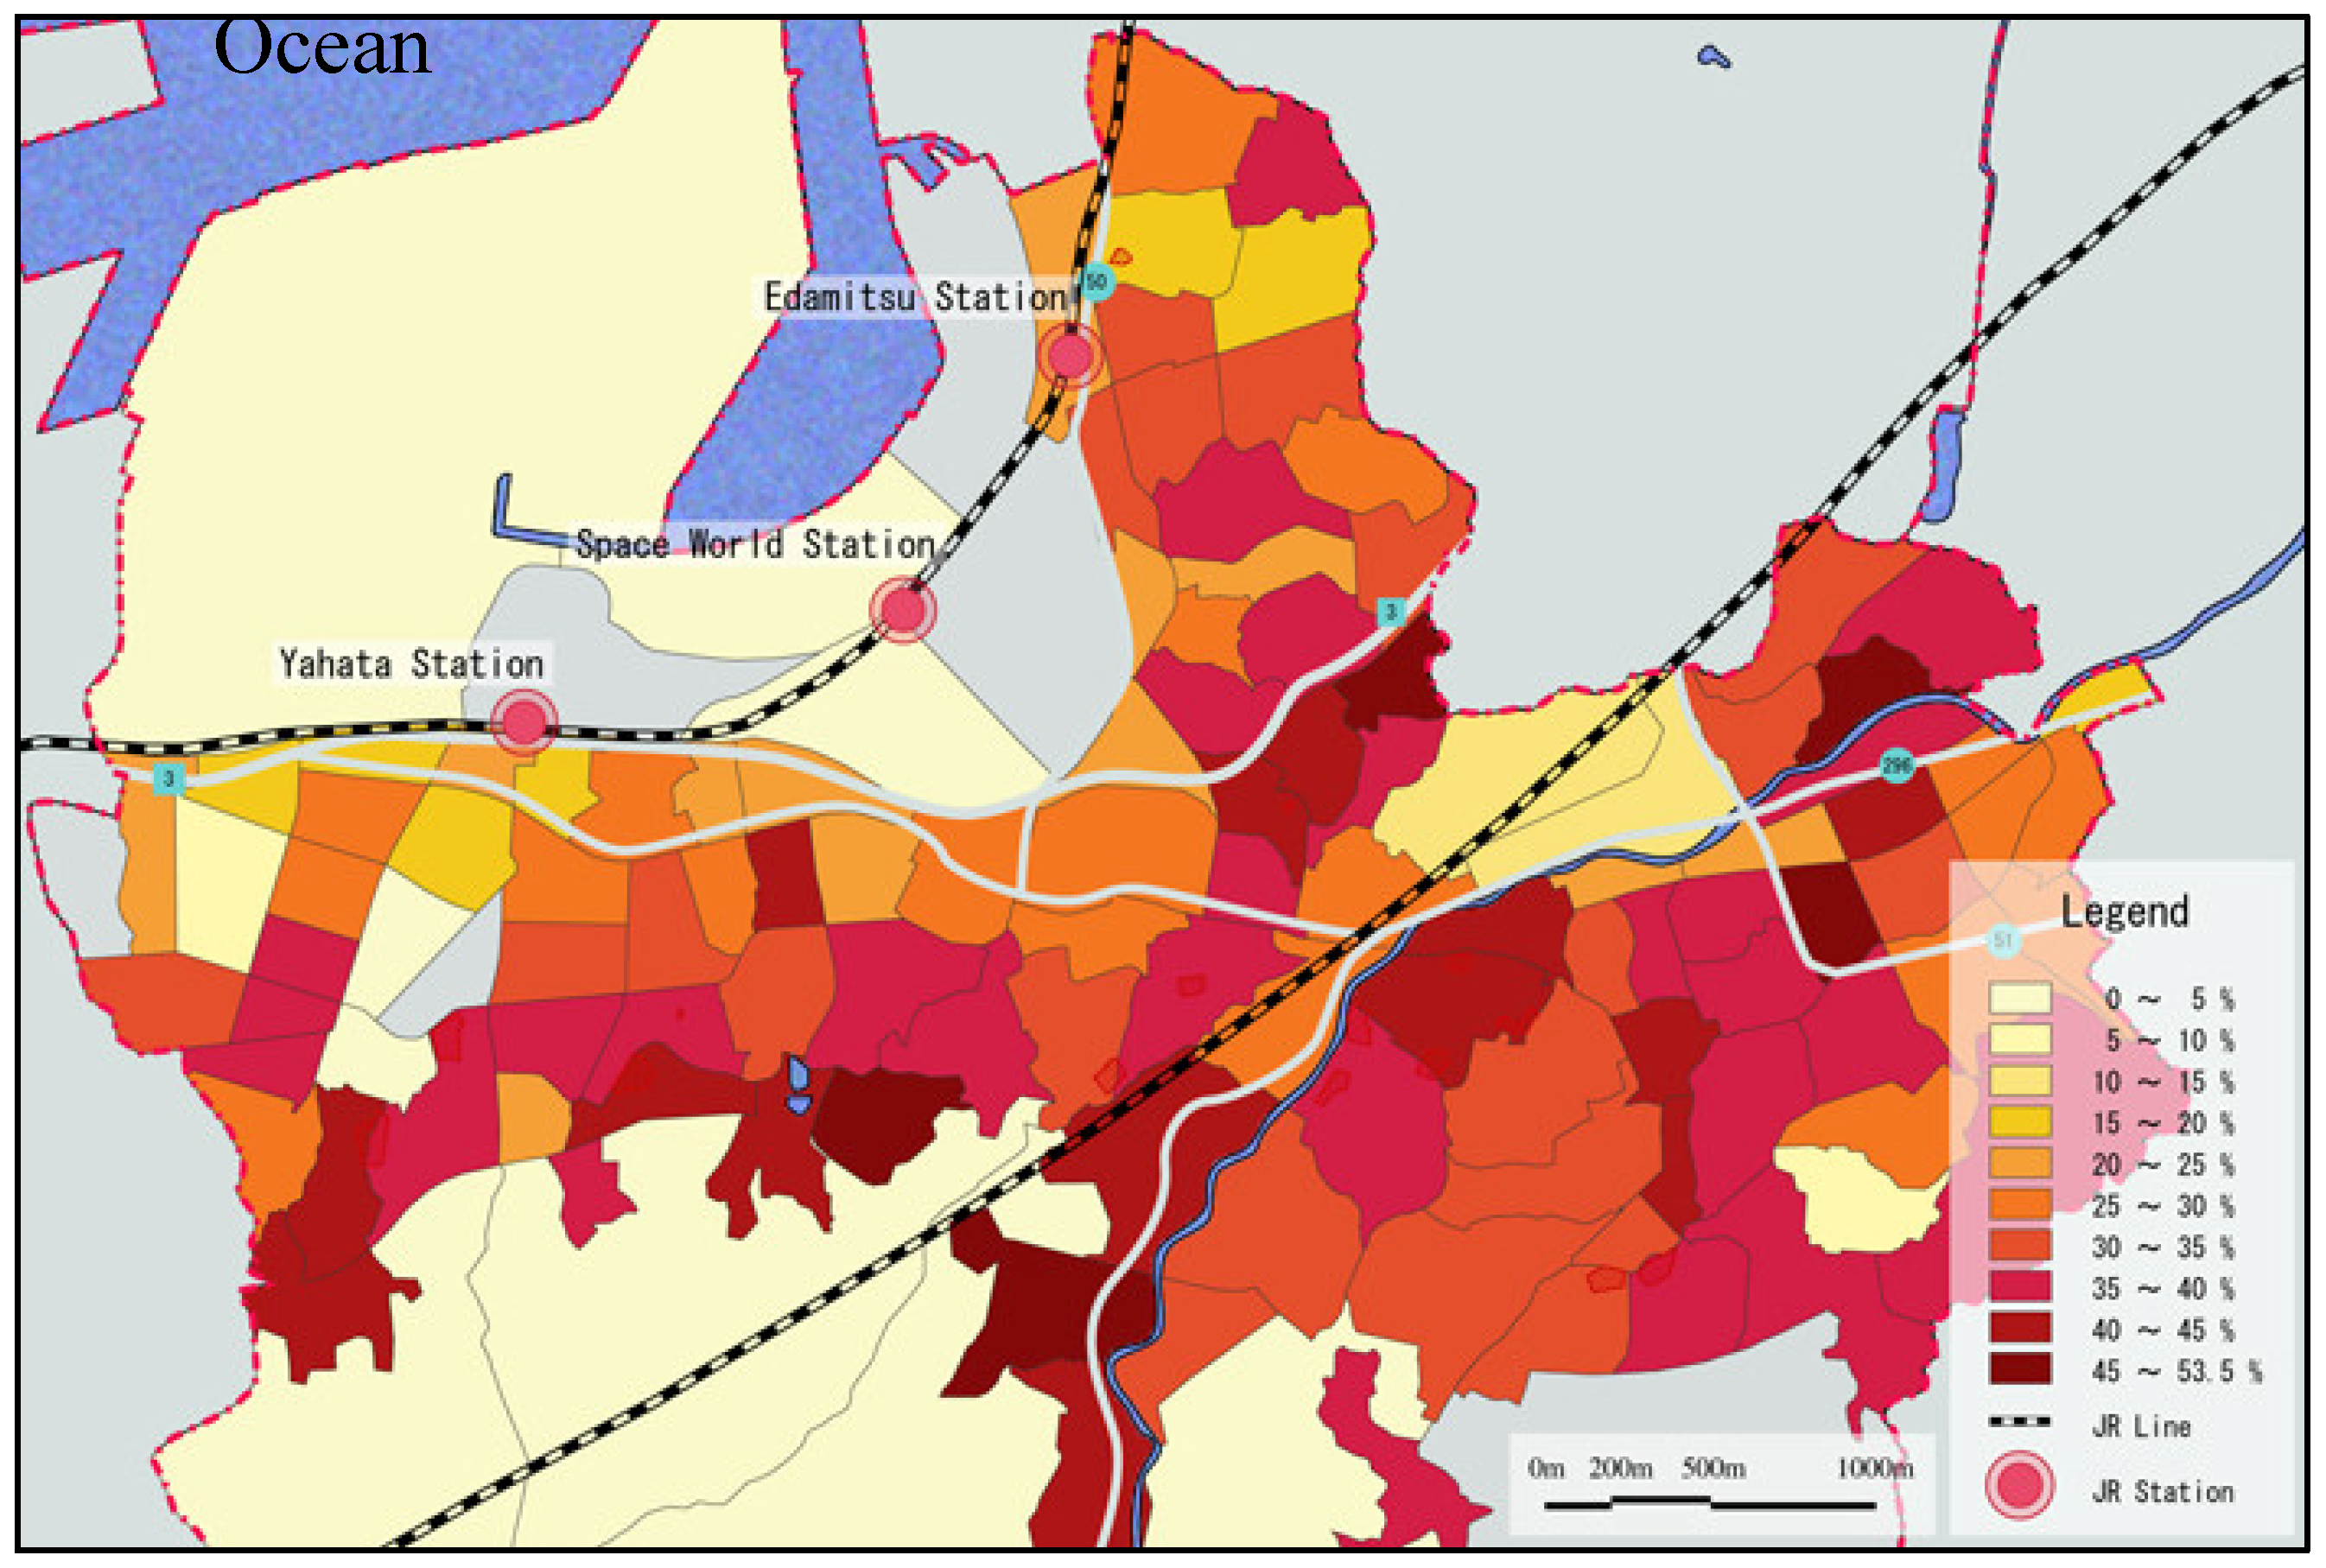
As Figure 10 shows, most of the towns could be identified as having an “aging society” (i.e., the percentage of the population over 65 years of age is higher than 25%). The percentage of the population that is older than 65 years is higher in the steeply-sloped areas, which meets the standard of a “limitative colony” (i.e., the percentage of the population over 65 years is higher than 50%). As seen in Figure 8, these areas are situated along the highly-sloped areas of the mountain.
Thus, if current conditions persist, the population will continue to decrease, and the percentage of elderly residents will continue to increase. Countermeasures should be introduced to this area, immediately, to maintain the vitality.
4. Urban Regeneration Based on GIS Analysis
4.1. GIS Analysis
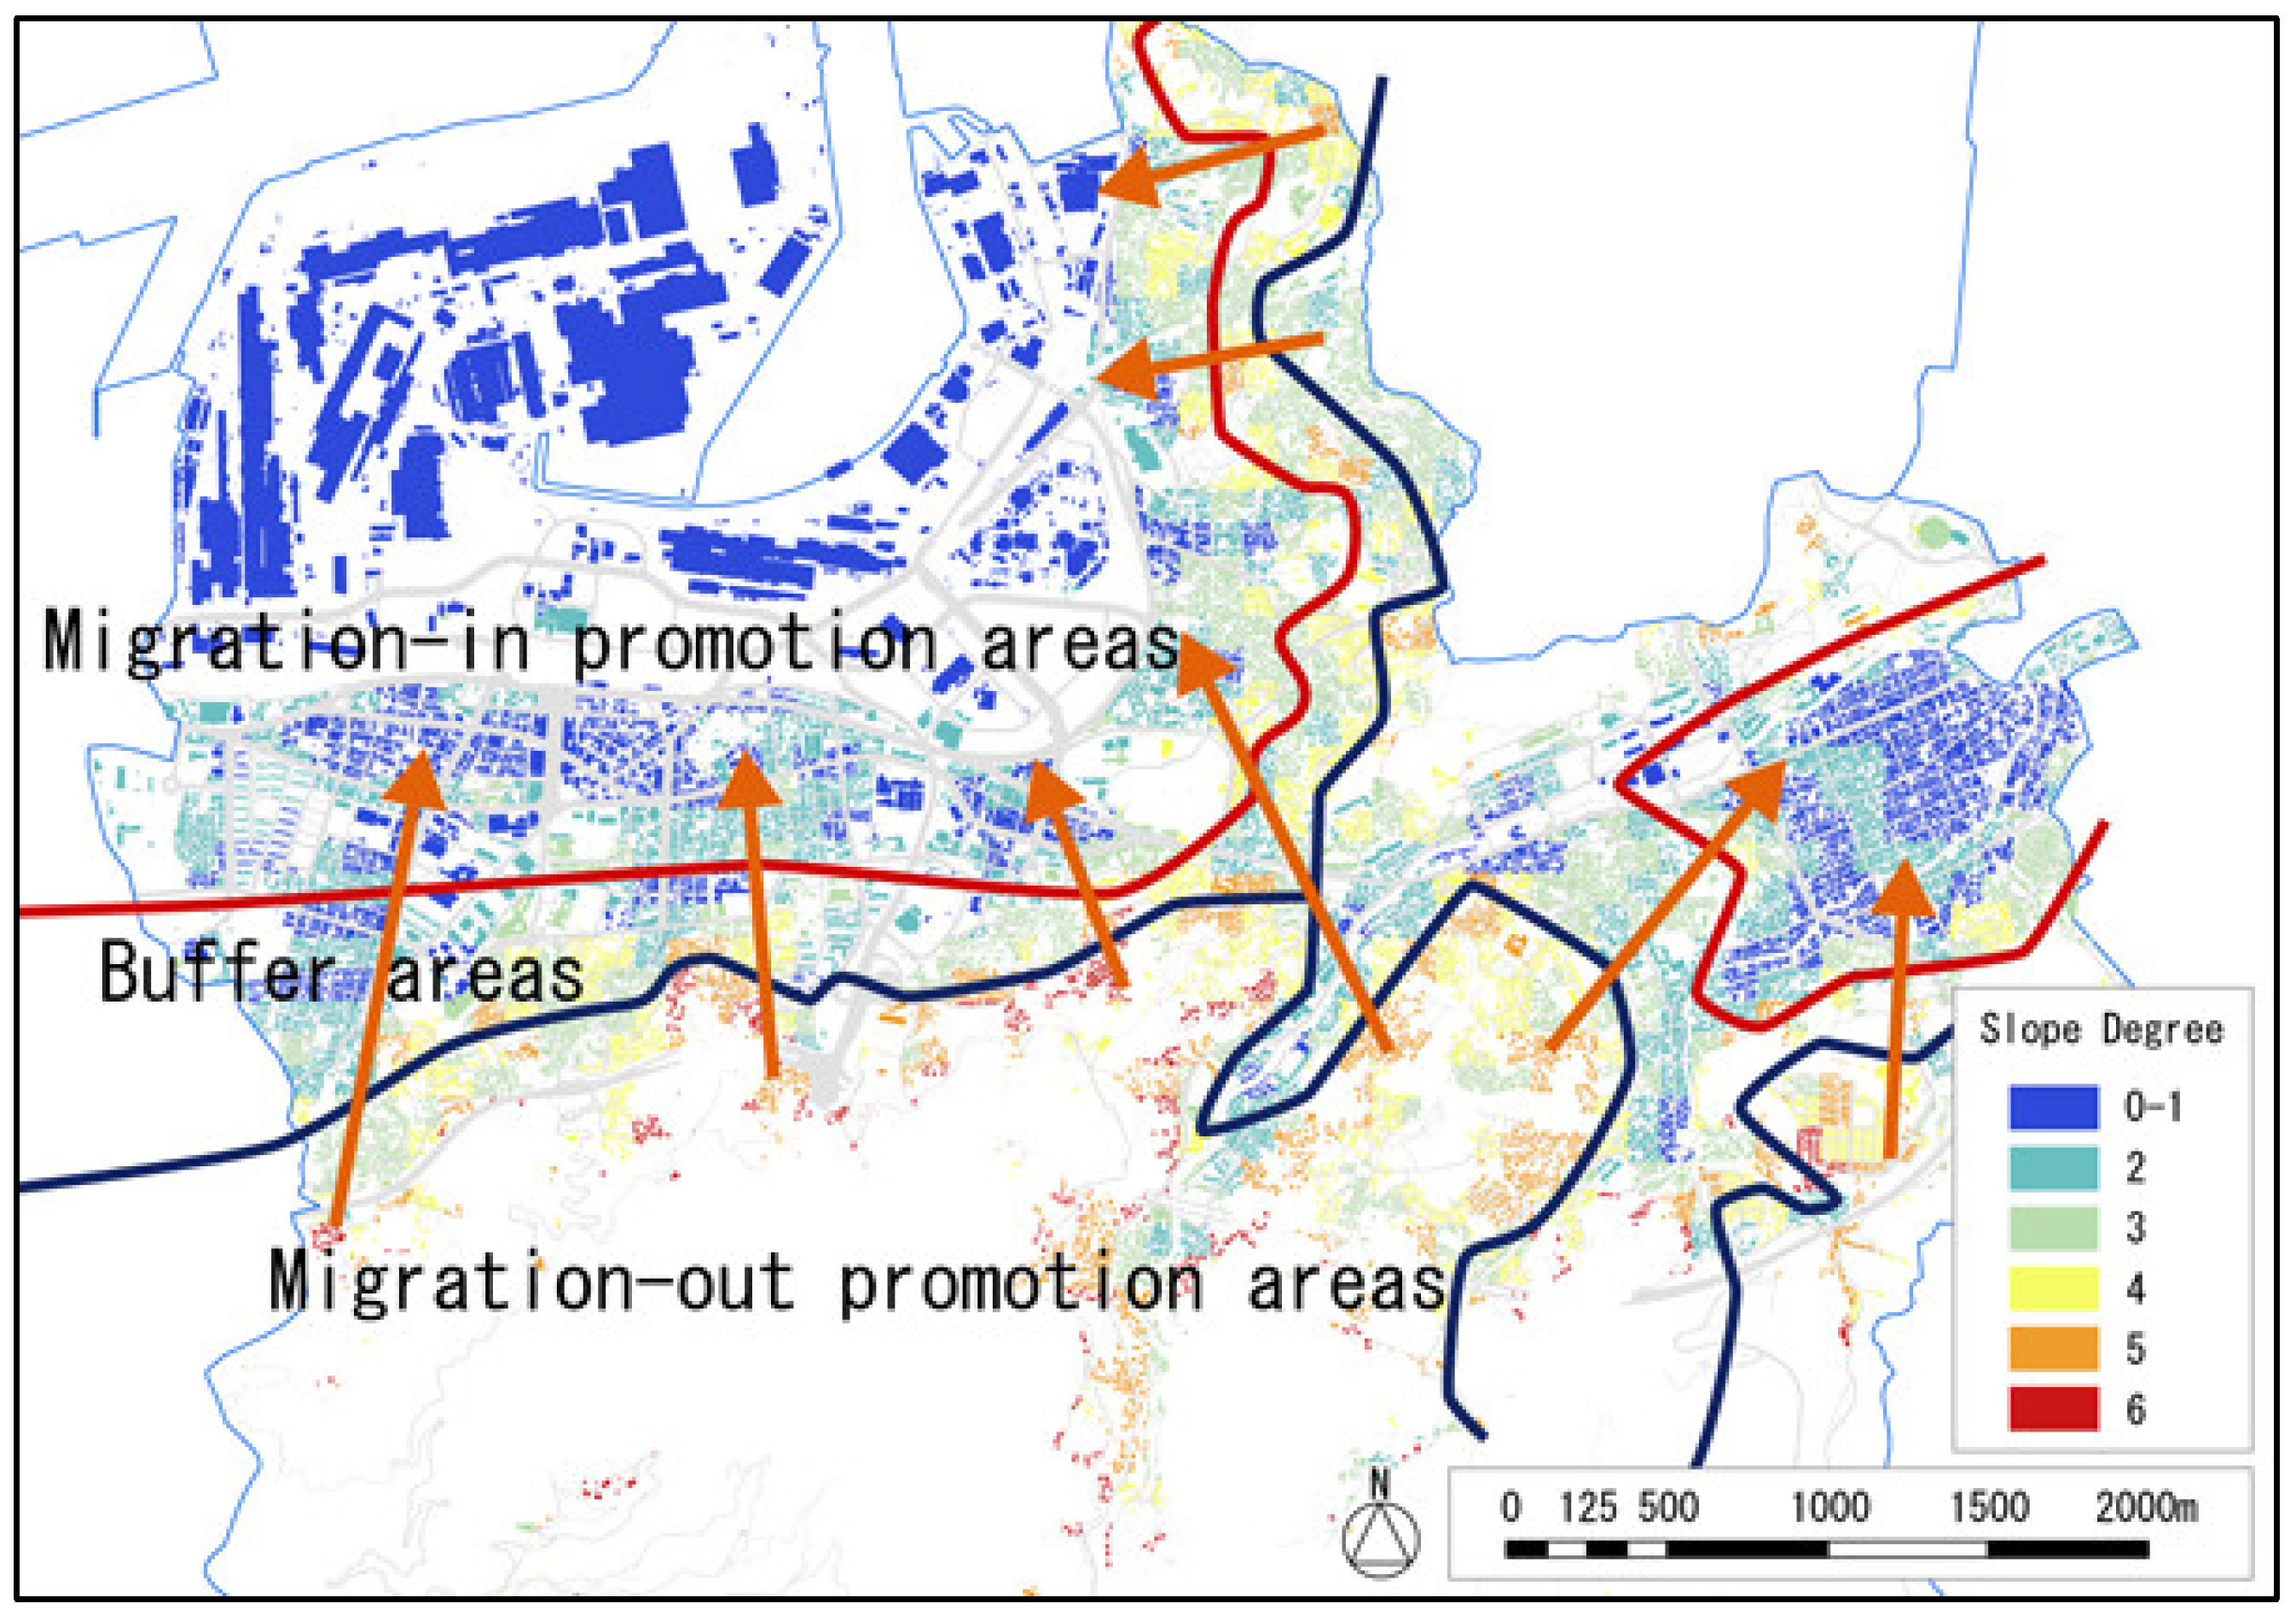
Leveraging the analysis conducted on urban population (see Section 3), using urban geographic data, we created an encompassing redevelopment plan to promote urban vitality. We proposed a migration from the sloped-mountainous area to the flat area, to concentrate the population in this flat area, to create a compact city center, thus, promoting a livable community. We identified the area promoting inward migration, the area promoting outward migration, and the buffer area, using the results through the GIS analysis, as shown in the Figure 11. We selected flat areas to be the object region for inhabitant migration. The migration is expected to concentrate and reduce the city size, thus, improving the efficiency of city services and facilities.
Areas promoting outward migration are those with high slopes, high ratios of elderly residents, elevations higher than 80 m, and slope degrees higher than 5. Residents who live in the steeply-sloped areas should be encouraged to move.
Areas promoting inward migration are flat and offer convenient traffic and public facilities, with elevations lower than 40 m and slope degrees lower than 3. These areas anticipate further enrichment of urban facilities, to promote convenient living.
Buffer areas are the areas between outward migration and inward migration areas. Government offices and universities are currently situated in these areas. Areas of outward migration will become sparsely populated during the process of inward migration. In the buffer areas, sparse landscape, community decay, and crime could be alleviated by adding public facilities and encouraging more human interaction.
A high density of population and buildings are required to support the public facilities operation. Residents living in areas promoting outward migration currently cannot conveniently access these public facilities, and these facilities will continue to decay as population density decreases. Sustainable urban planning must condense these city functions and increase population density to increase urban efficiency. Some problems make it difficult for inhabitants to migrate smoothly, which include economic problems and local community conditions. Minimum living conditions must be maintained for residents who need to continue living in the areas that promote outward migration.
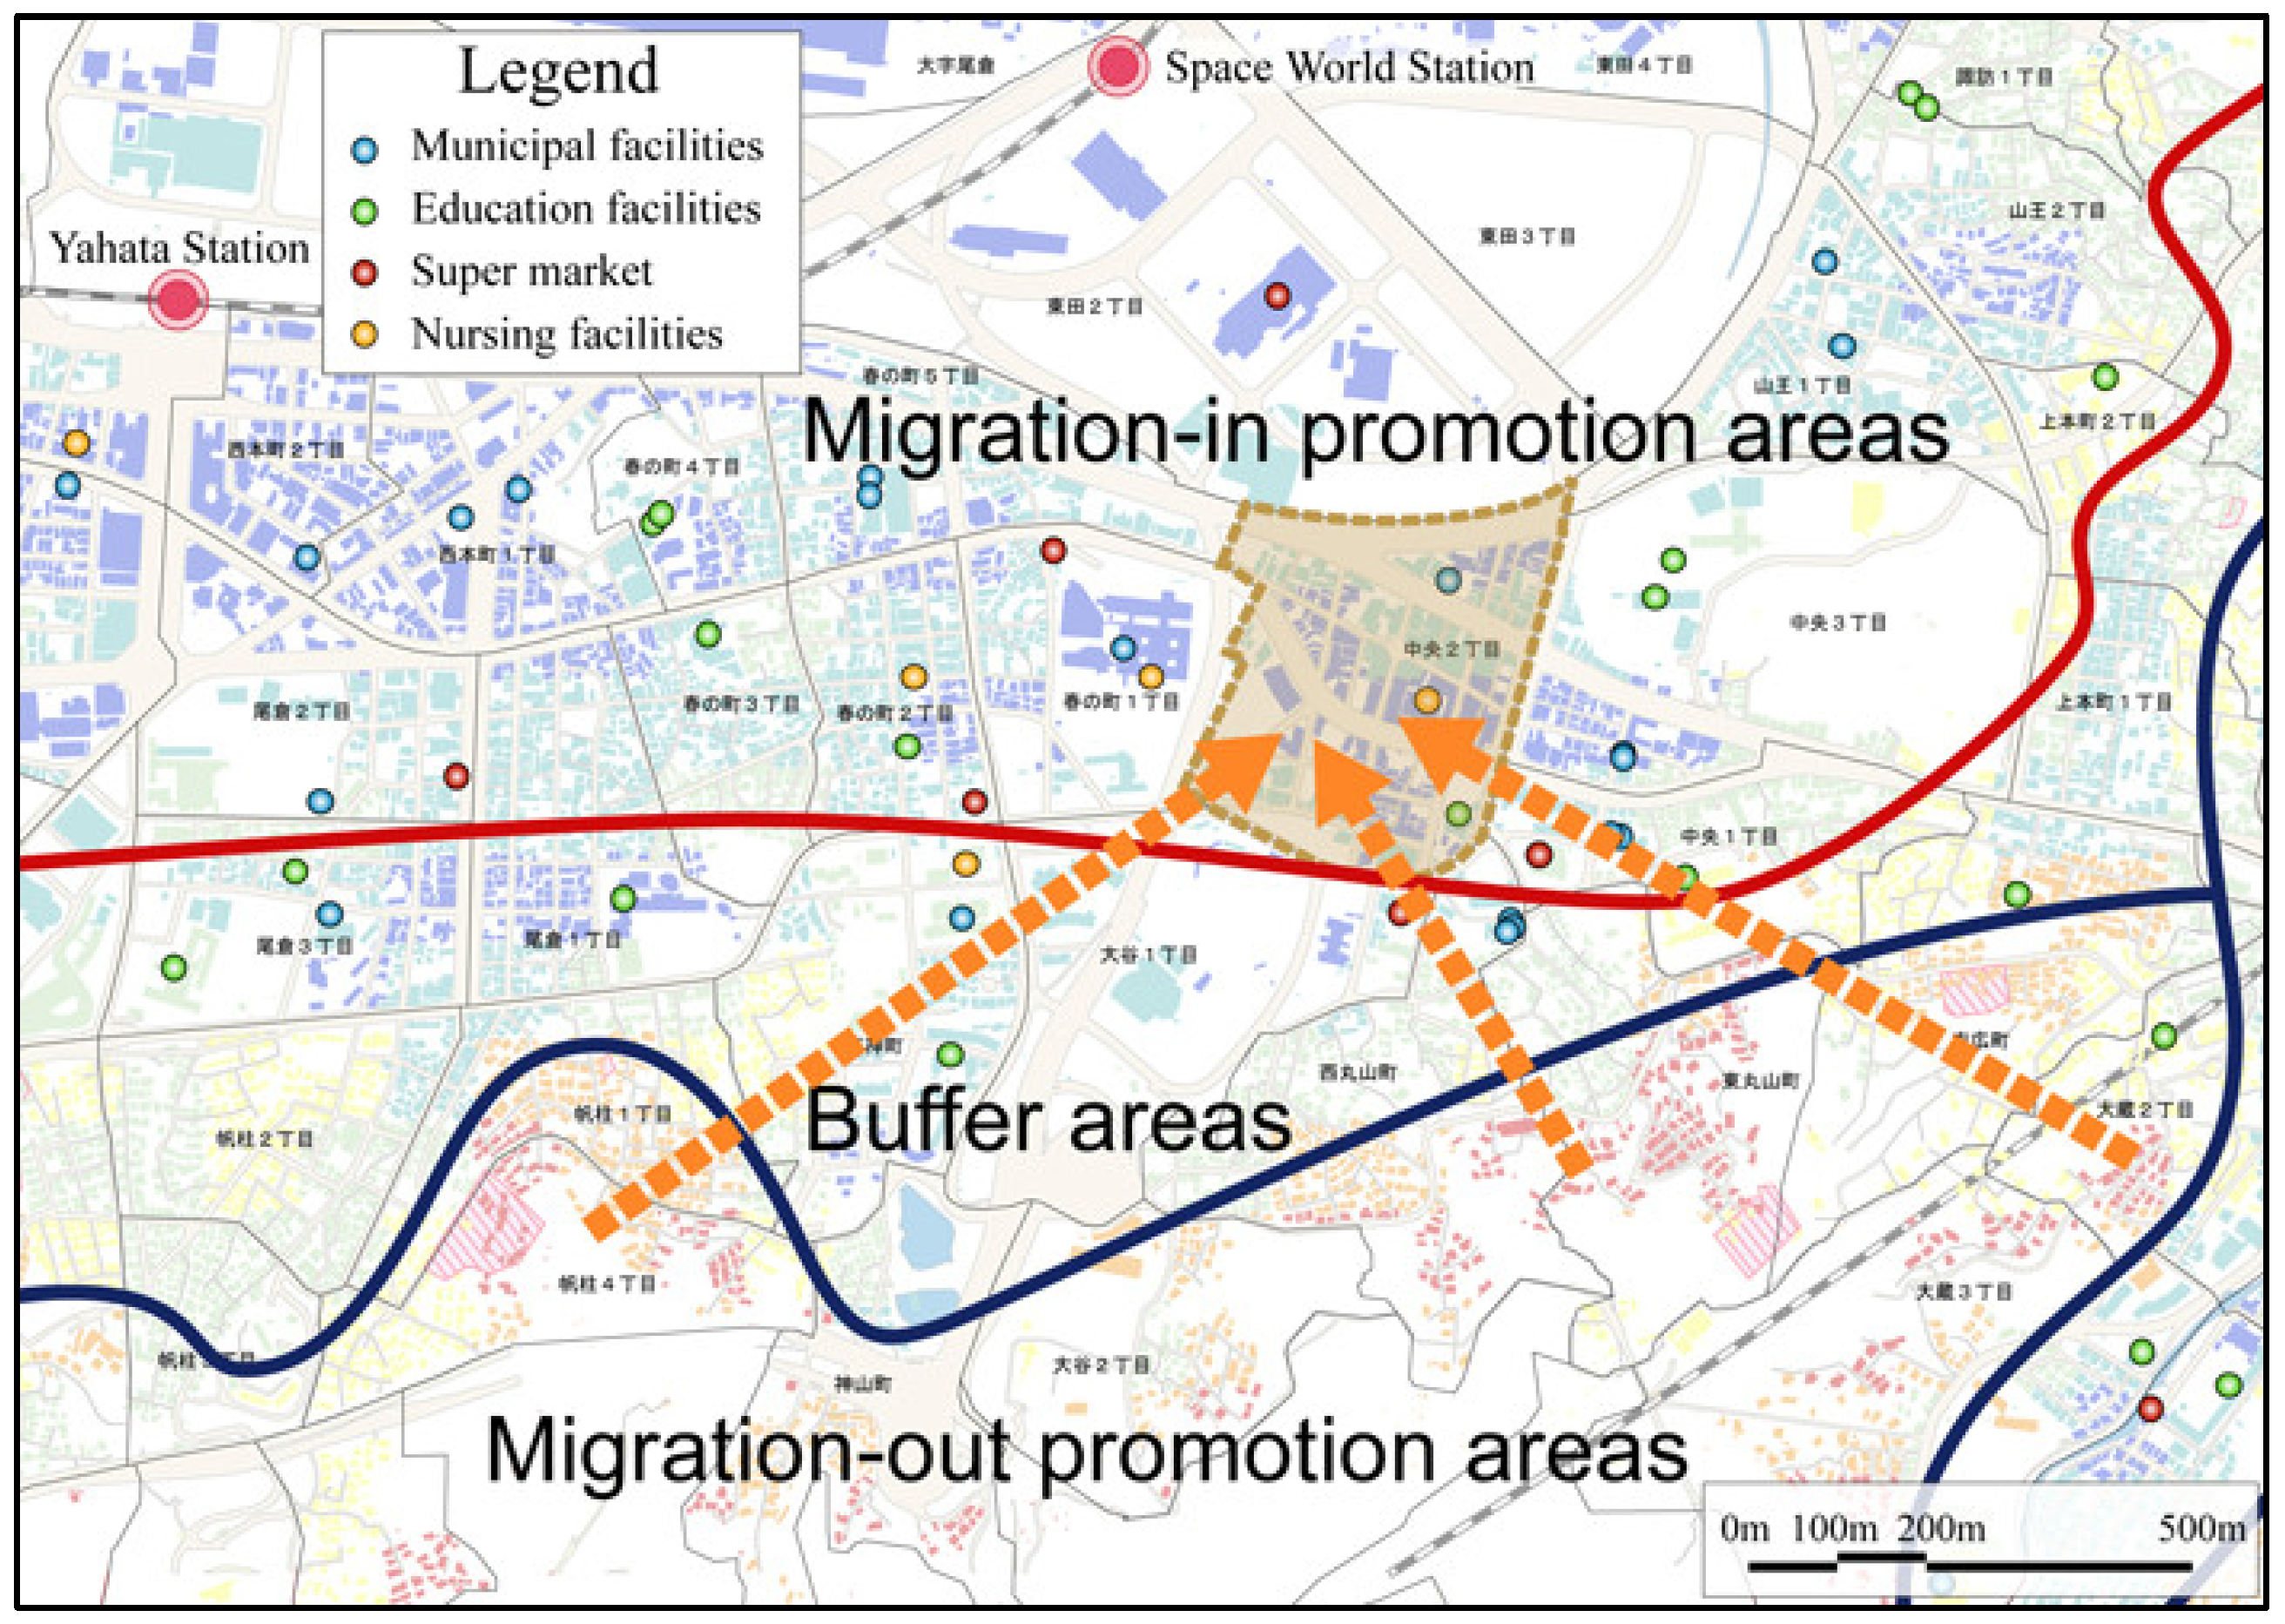
The central zone shown in Figure 12 was a gateway into the residential area, through which employees would pass on their way home from work. This was considered to be a high-level commercial area in the past. Currently, the central zone includes a mix of commercial and residential areas. In this mixed-use area, all necessary city facilities are located within 500 m from the center, which is a reasonable distance to access conveniently. This mixed-use area has the potential to serve as a residential area, promoting inward migration.
4.2. Environmental Shading and the Community Regeneration Plan
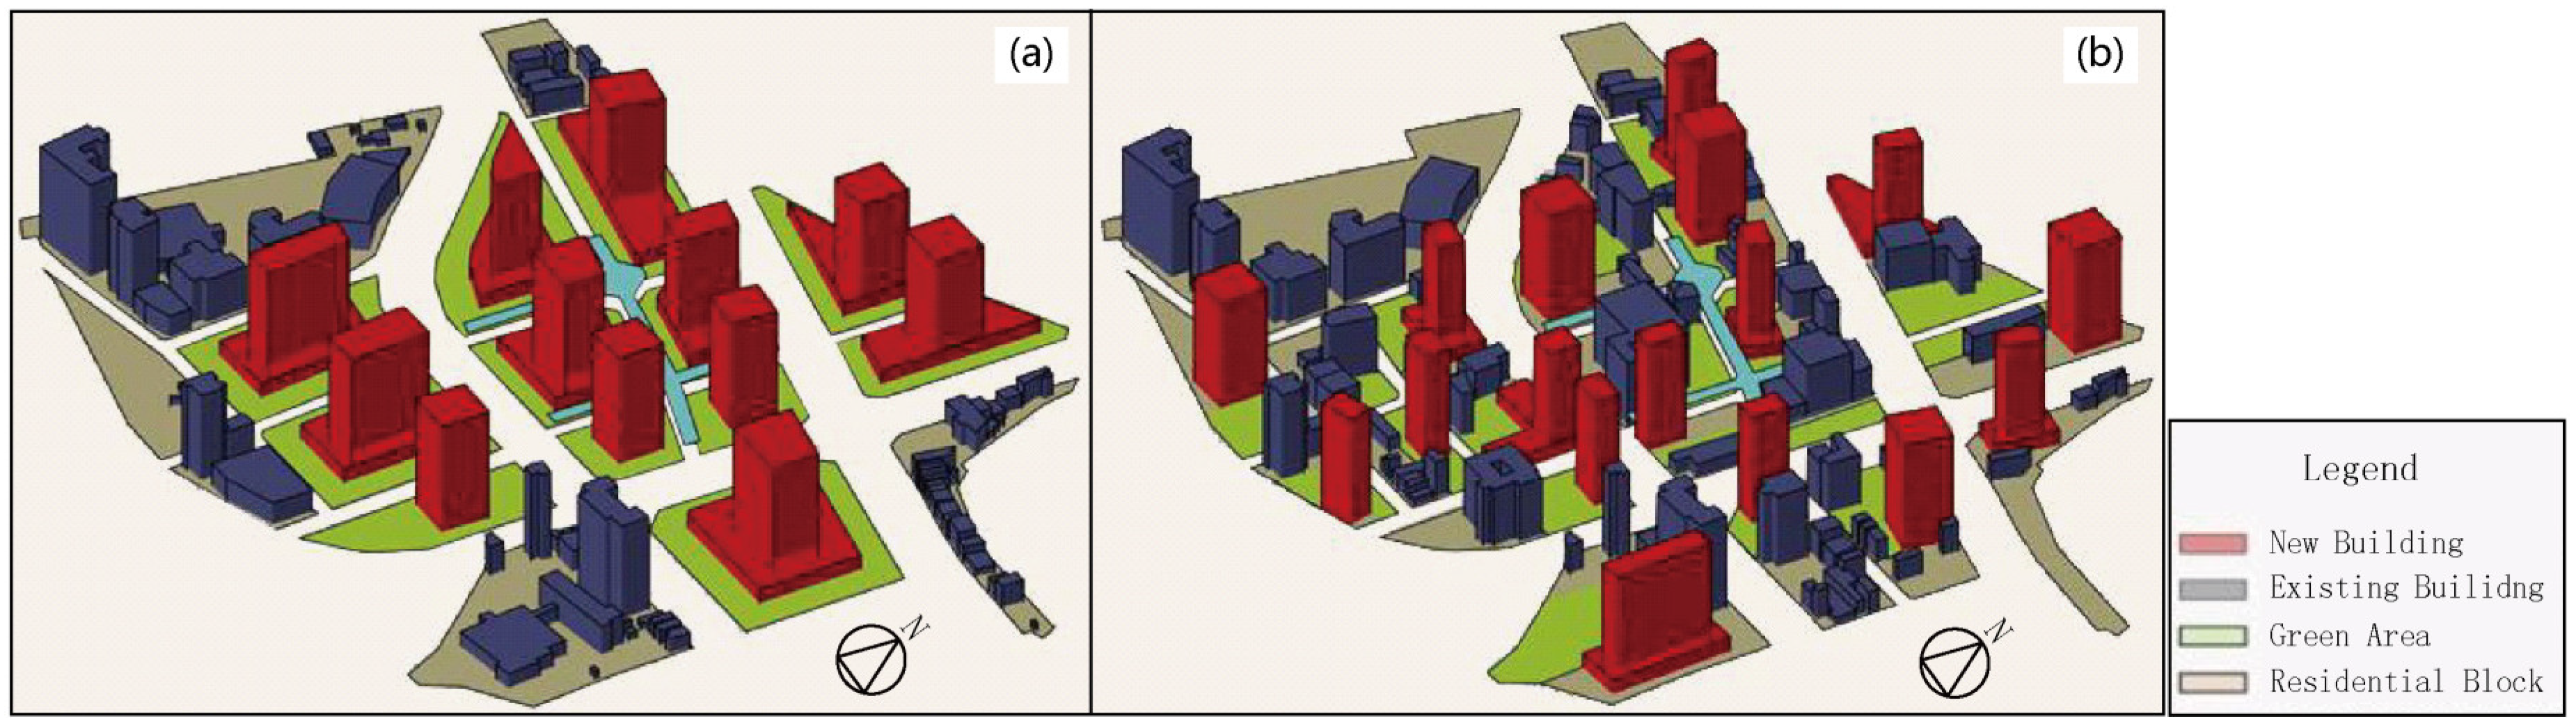
By focusing on the area promoting inward migration (shown in Figure 12), the population capacity of the built environment could be increased, providing more building facilities. We proposed two different redevelopment patterns to meet the existing needs and create a more compact urban center. With the view of adapting new building facilities into the existing urban environment, Figure 13 compares two plans—a composite regeneration plan and a partial regeneration plan. The composite regeneration plan would involve rebuilding whole street blocks with high-volume, mixed-use, high-rise buildings. In this plan, the lower part of the buildings would be for commercial use and the upper part for residential or office use. In the partial regeneration plan, each street block would be partly redeveloped, according to the specific land-use ownership situation.
In our proposed plan, each new apartment building would be 10 floors tall. According to the redevelopment patterns, there would be 6–8 units in the composite regeneration plan, or 4–6 units in the partial regeneration plan. As the average number of inhabitants per family was 2.47 in 2017 [34], the total number of inhabitants for each building would be 148–197, for the composite regeneration plan, or 98–148 for the partial regeneration plan; this would fully support efficient operation of local public transportation.
In the composite regeneration plan, the building layout in the core area would be completely redeveloped. The urban form could, thus, be unified, within all blocks. In the partial regeneration plan, the demolition and redevelopment of the existing buildings could be carried out, according to the individual conditions for each location, and some of the existing buildings would be maintained. Compared to the existing low-rise blocks with narrow streets, the redeveloped plans with the high-rise buildings would create smaller building footprints, larger building setback from the streets, and wider streets. This would provide a greater availability of urban green surfaces, which would potentially reduce the energy consumption for the lower parts of the buildings and promote a healthier urban microclimate [35,36].
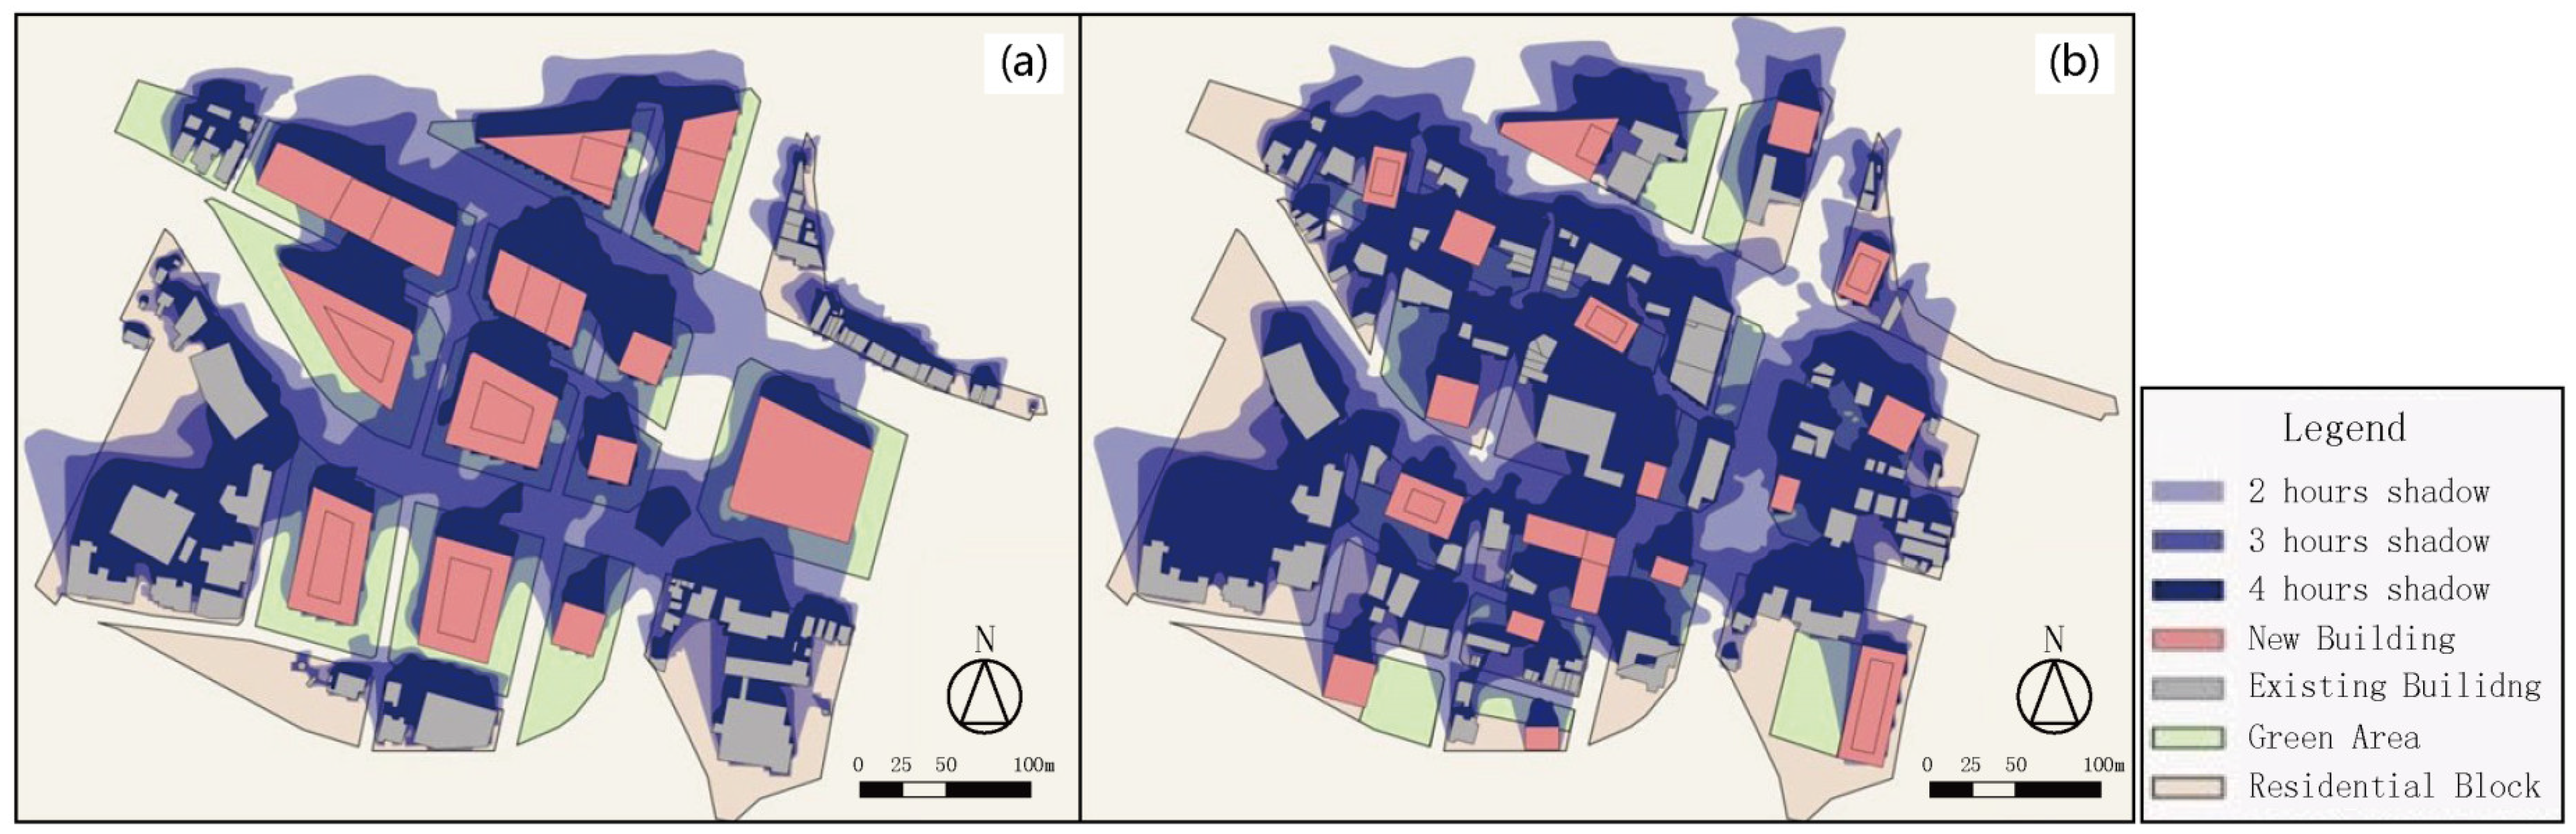
Figure 14 shows the results of the shady condition estimation, for the two regeneration plans. According to Japanese regulations (as discussed above), 4-hour shadows are restricted 5 m away from buildings, on the winter solstice, in residential districts, and the presence of such shadows increases the likelihood of opposition to the redevelopment plan, within the local community. In the partial regeneration plan, almost all buildings remain in poor sunlight conditions, and some are in 4-hour shadow. In the composite regeneration plan, very few buildings experience a 4-hour shadow. Compared with the partial regeneration plan, the composite regeneration plan created superior sunlight conditions, with fewer shady areas.
5. Discussion
To address the current aging society in Japan, this case study combined a variety of data to suggest two potential urban redevelopment plans, to promote urban activity and improve the efficiency of urban service facilities. Urban planners must find the most suitable area to arrange concentrated land use, throughout the planning process. Sustainable urban design requires that new elements be introduced into traditional configurations, while the construction style of buildings in a mixed-use area, can better reflect the character of a district. This case study for the revitalization of the Yahatahigashi-ku can be applied to redevelopment projects, in other shrinking cities.
This study developed and standardized the slope-degree method, using GIS data as a development tool, and identified the importance of geographic information for urban planning. The method for calculating slope degree used in this paper was not the only way to obtain urban slope conditions, and more effective calculation methods should be studied in the future. This paper highlighted the importance of sharing data evaluations, throughout the urban planning process.
After the departure of the inhabitants, empty houses on the high slope areas would become witnesses to the history of Yahatahigashi-ku’s boom years, as a well-developed industrialized city. As with similar sites such as Japan’s Battleship Island in Nagasaki, and the Yokohama Red Brick Warehouse, the unique mountainous landscape of Yahatahigashi-ku has the potential for tourism planning.
This case study proposed and compared two ideal plans for community regeneration. Urban redevelopment usually requires significant time, so that plans can be negotiated with the local citizens. The redevelopment of inward migration promotion areas requires the agreement of all landowners of each existing dwelling, which is one of the most time-consuming aspects for most urban redevelopment cases in Japan. Therefore, the composite regeneration plan that redevelops the whole block, would be more difficult to carry out in reality, than the partial regeneration plan. Future studies should consider the different policies on urban redevelopment and demolition compensation measures.
6. Conclusions
In this paper, we used GIS for site analyses, developed an urban geographic evaluation standard for slope degree, and discussed a proposed urban regeneration plan for the Yahatahigashi-ku, as a case study. The GIS evaluation of the Yahatahigashi-ku revealed that many dwellings in the highly-sloped mountainous areas, created poor living conditions for the older adults. Poor urban planning forced inhabitants to walk everywhere, due to limited vehicular access in the steeply-sloped areas, making it difficult for the older adults who form a high proportion of Yahatahigashi-ku’s population. A GIS evaluation, enabled planners to propose methods for urban regeneration that would require the concentration of city functions, the connection of access points for public facilities, and the improvement of the residential environment. Most of the young people are moving out of the area, and older adults stay back because they cannot afford to move elsewhere. This study suggests that the government provide financial support to the local people for urban regeneration. It was crucial to introduce GIS, to redesign a suitable site for local migration. In this comprehensive evaluation, we selected the central zone as the ideal site for redevelopment, considering the urban and built environment through the redevelopment process. The environmental evaluation of two community regeneration plans demonstrated that a composite regeneration plan created better sunlight conditions.
It is imperative that city planners conduct an evaluation of site information to identify the most suitable area for planning, based on the satisfaction of current residents within their environment. The formulation of a sustainable urban design requires that new elements be introduced into the traditional configuration, especially as the construction styles of buildings in mixed-use areas, reflect the character of each district. This study provides insight into urban redevelopment for shrinking cities in Japan, based on the evaluation of the urban population, geography, and environment. This case study contributes to the literature on urban renovation in Japanese cities, as well as in other cities facing similar situations.
Author Contributions
H.F. and Y.W. contributed equally to this paper. They performed the experiments, analyzed the data, and wrote the paper together.
Funding
This research was funded by the Department of Housing & Urban–Rural Development of the Shaanxi Province China, grant number 2016-RJ17.
Conflicts of Interest
The authors declare no conflict of interest.
References
- Oswalt, P. Volume 1: International Research. In Shrinking Cities; Hatje Cantz: Ostfildern-Ruit, Germay, 2005. [Google Scholar]
- Lee, J.; Newman, G. Forecasting Urban Vacancy Dynamics in a Shrinking City: A Land Transformation Model. ISPRS Int. J. Geo-Inf. 2017, 6, 124. [Google Scholar]
- Grekousis, G.; Mountrakis, G. Sustainable development under population pressure: Lessons from developed land consumption in the conterminous US. PLoS ONE 2015, 10, e0119675. [Google Scholar] [CrossRef] [PubMed]
- United Nations, Department of Economic and Social Affairs, Population Division. World Population Ageing 2013; ST/ESA/SER.A/348; United Nations: New York, NY, USA, 2013.
- World Health Organization (WHO). Global Age-Friendly Cities: A Guide, World Health Organization: Geneva, Switzerland, 2007.
- World Health Organization (WHO). World Health Statistics 2016. Available online: http://www.who.int/gho/publications/world_health_statistics/2016/en/ (accessed on 1 November 2018).
- National Institute of Population and Social Security Research (Japan). Social Security in Japan. 2014. Available online: http://www.ipss.go.jp/s-info/e/ssj2014/PDF/ssj2014.pdf (accessed on 15 April 2017).
- Pallagst, K. Shrinking Cities—Planning Challenges from an International Perspective. Urban Infill, Themenheft—Cities Growing Smaller; Kent State University: Cleveland, OH, USA, 2008; pp. 6–16. [Google Scholar]
- Martinez-Fernandez, C.; Audirac, I.; Fol, S.; Cunningham-Sabot, E. Shrinking cities: Urban challenges of globalization. Int. J. Urban Reg. Res. 2012, 36, 213–225. [Google Scholar] [CrossRef] [PubMed]
- Swyngedouw, E. Globalisation or glocalisation? Networks, territories and rescaling. Camb. Rev. Int. Aff. 2004, 17, 25–48. [Google Scholar] [CrossRef]
- Gereffi, G. The global economy: Organization, governance, and development. In The Handbook of Economic Sociology, 2nd ed.; Smelser, N.J., Swedberg, R., Eds.; Princeton University Press and the Russell Sage Foundation: Princeton, NJ, USA, 2005. [Google Scholar]
- Martinez-Fernandez, C.; Wu, C.T. Stadtenwicklung in einer differenten Wirklichkeit. Schrumpfende Städte in Australien. Berl. Debatte Initial 2007, 1, 45–60. [Google Scholar]
- Bontje, M. Facing the challenge of shrinking cities in East Germany: The case of Leipzig. Geojournal 2004, 61, 13–21. [Google Scholar] [CrossRef]
- Organization for Economic Co-operation and Development (OECD). Compact City Policies (Japanese Version): A Comparative Assessment; OECD: Paris, France, 2012. [Google Scholar]
- Ministry of Land, Infrastructure, Transport and Tourism (MLIT). Population Reduction and the Land Use (Japanese Version); 28 January 2016. Available online: http://www.mlit.go.jp/common/001120157.pdf (accessed on 20 January 2019).
- Rybczynski, W.; Linneman, P.D. How to Save our Shrinking Cities; Public Interest: Boca Raton, FL, USA, 1999; p. 30. [Google Scholar]
- United Nations Population Estimates and Projections. World Population Review. Available online: http://worldpopulationreview.com (accessed on 10 November 2018).
- Couch, C.; Karecha, J.; Nuissl, H.; Rink, D. Decline and sprawl: An evolving type of urban development–observed in Liverpool and Leipzig. Eur. Plan. Stud. 2005, 13, 117–136. [Google Scholar] [CrossRef]
- Couch, C. City of Change and Challenge: Urban Planning and Regeneration in Liverpool; Ashgate Publishing: Aldershot, UK, 2004. [Google Scholar]
- Nuissl, H.; Rink, D. Urban Sprawl and Post-Socialist Transformation: The Case of Leipzig (Germany); UFZ Centre for Environmental Research, Department of Economics, Sociology and Law: Leipzig, Germany, 2003. [Google Scholar]
- Mulligan, H. Environmental Sustainability Issues for Shrinking Cities: US and Europe. In Shrinking Cities, International Perspectives and Policy Implications; Pallagst, K., Wiechmann, T., Martinez-Fernandez, C., Eds.; Routledge: Abingdon, UK, 2014; pp. 279–302. [Google Scholar]
- Bloom, D.E.; Canning, D.; Fink, G. Urbanization and the wealth of nations. Science 2008, 319, 772–775. [Google Scholar] [CrossRef] [PubMed]
- Grekousis, G.; Manetos, P.; Photis, Y. Modeling urban evolution using neural networks, fuzzy logic and GIS: The case of the Athens metropolitan area. Cities 2013, 30, 193–203. [Google Scholar] [CrossRef]
- Dall’O’, G.; Galante, A.; Torri, M. A methodology for the energy performance classification of residential building stock on an urban scale. Energy Build. 2012, 48, 211–219. [Google Scholar] [CrossRef]
- Dascalaki, E.G.; Droutsa, K.G.; Balaras, C.A.; Kontoyiannidis, S. Building typologies as a tool for assessing the energy performance of residential buildings—A case study for the Hellenic building stock. Energy Build. 2011, 43, 3400–3409. [Google Scholar] [CrossRef]
- Grekousis, G.; Photis, Y. Analysing high-risk emergency areas with GIS and neural networks: The case of Athens Greece. Prof. Geogr. 2014, 66, 124–137. [Google Scholar] [CrossRef]
- Loga, T.; Diefenbach, N.; Stein, B.; Balaras, C.A.; Villatoro, O.; Wittchen, K.B. Typology Approach for Building Stock Energy Assessment. In Main Results of the TABULA Project; European Commission: Darmstadt, Germany, 2012. [Google Scholar]
- Yang, L.; He, B.J.; Ye, M. Application research of ECOTECT in residential estate planning. Energy Build. 2014, 72, 195–202. [Google Scholar] [CrossRef]
- Hasegawa, T. Introduction to the Building Standard Law-Building Regulation in Japan. 1-212; Building Center of Japan: Tokyo, Japan, 2013. [Google Scholar]
- Shimizu, J.; Tanaka, Y. Jw_cad. Available online: www.jwcad.net/ (accessed on 15 November 2017).
- Komatsu, Y.; Kato, Y.; Yoshida, T.; Yashiro, T. Report of an Investigation of the Life Time Distribution of Japanese House at 1987—Estimation based on the ledgers of buildings for fixed property taxes. J. Archit. Plan. Environ. Eng. 1992, 439, 101–110. [Google Scholar]
- Jiang, F.; Liu, S.; Yuan, H.; Zhang, Q. Measuring urban sprawl in Beijing with geo-spatial indices. J. Geogr. Sci. 2007, 17, 469–478. [Google Scholar] [CrossRef]
- Miao, S.; Jiang, W.; Wang, X.; Guo, W. Impact assessment of urban meteorology and the atmospheric environment using urban sub-domain planning. Bound. Layer Meteorol. 2006, 118, 133–150. [Google Scholar] [CrossRef]
- Ministry of Health, Labour and Welfare (MHLW). Baseline Survey of National Life on 2017 (Japanese Version). Available online: https://www.mhlw.go.jp/toukei/saikin/hw/k-tyosa/k-tyosa17/index.html (accessed on 20 January 2019).
- Akbari, H.; Pomerantz, M.; Taha, H. Cool surfaces and shade trees to reduce energy use and improve air quality in urban areas. Sol. Energy 2001, 70, 295–310. [Google Scholar] [CrossRef]
- Wang, Y.; Berardi, U.; Akbari, H. Comparing the effects of urban heat island mitigation strategies for Toronto, Canada. Energy Build. 2016, 114, 2–19. [Google Scholar] [CrossRef]
Figure 1.
The location of the Yahatahigashi-ku district (based on Google Maps).

Figure 2.
Images of the residences on the steeply-sloped area.

Figure 3.
Definition of slope degree in each mesh.

Figure 4.
Image of overlapping layers.

Figure 5.
Representation of the building slope degree (a slope degree of each mesh; b: layer overlapping; c: slope degree of each building).
Figure 5.
Representation of the building slope degree (a slope degree of each mesh; b: layer overlapping; c: slope degree of each building).

Figure 6.
Explanation of continuous shadow area (a: hourly shadow area; b: continuous shadow area).

Figure 7.
Landform and building distribution in the Yahatahigashi-ku (2005).

Figure 8.
Slope degree of each building.

Figure 9.
Population density of the Yahatahigashi-ku (2008).

Figure 10.
Percentage of population older than 65 (2008).

Figure 11.
Object region for inhabitant migration.

Figure 12.
The situation of public facilities.

Figure 13.
The image of the two regeneration plans (a: composite regeneration plan; b: partial regeneration plan).
Figure 13.
The image of the two regeneration plans (a: composite regeneration plan; b: partial regeneration plan).

Figure 14.
Shade conditions for the two regeneration plans on the winter solstice (a: composite regeneration plan; b: partial regeneration plan).
Figure 14.
Shade conditions for the two regeneration plans on the winter solstice (a: composite regeneration plan; b: partial regeneration plan).

© 2019 by the authors. Licensee MDPI, Basel, Switzerland. This article is an open access article distributed under the terms and conditions of the Creative Commons Attribution (CC BY) license (http://creativecommons.org/licenses/by/4.0/).
Share and Cite
MDPI and ACS Style
Wang, Y.; Fukuda, H. Sustainable Urban Regeneration for Shrinking Cities: A Case from Japan. Sustainability 2019, 11, 1505. https://doi.org/10.3390/su11051505
AMA Style
Wang Y, Fukuda H. Sustainable Urban Regeneration for Shrinking Cities: A Case from Japan. Sustainability. 2019; 11(5):1505. https://doi.org/10.3390/su11051505
Chicago/Turabian StyleWang, Yupeng, and Hiroatsu Fukuda. 2019. "Sustainable Urban Regeneration for Shrinking Cities: A Case from Japan" Sustainability 11, no. 5: 1505. https://doi.org/10.3390/su11051505
Note that from the first issue of 2016, this journal uses article numbers instead of page numbers. See further details here.