Livelihood Vulnerability of Riverine-Island Dwellers in the Face of Natural Disasters in Bangladesh


1
School of Public Administration, Sichuan University, Chengdu 610065, China
2
Faculty of Agricultural Economics and Rural Development, Bangabandhu Sheikh Mujibur Rahman Agricultural University (BSMRAU), Gazipur 1706, Bangladesh
3
School of Commerce, University of Southern Queensland, Toowoomba Qld 4350, Australia
*
Authors to whom correspondence should be addressed.
Sustainability 2019, 11(6), 1623; https://doi.org/10.3390/su11061623
Submission received: 6 January 2019
/
Revised: 8 March 2019
/
Accepted: 12 March 2019
/
Published: 18 March 2019
Abstract
:Bangladesh is one of the most disaster-prone countries in the world. In particular, its riverine-island (char) dwellers face continuous riverbank erosion, frequent flooding, and other adverse effects of climate change that increase their vulnerability. This paper aims to assess the livelihood vulnerability of riverine communities by applying the Intergovernmental Panel on Climate Change (IPCC) vulnerability framework and the livelihood vulnerability index (LVI). Results indicate substantial variation in the vulnerability of char dwellers based on mainland proximity. The main drivers of livelihood vulnerability are char-dweller adaptation strategies and access to food and health services. The study further reveals that riverbank erosion, frequent flood inundation, and lack of employment and access to basic public services are the major social and natural drivers of livelihood vulnerability. Char-based policy focusing on short- and long-term strategy is required to reduce livelihood vulnerability and enhance char-dweller resilience.
1. Introduction
Natural disasters are regular phenomena in Bangladesh due to the country’s topography, geographical position, and changes in climate over time [1,2]. These disasters often have dire impact on the social and economic activities of delta communities, the most vulnerable regions of the country. The greatest devastation often hits communities living in riverine-island regions (large sandbars that emerge from riverbeds due to silt and alluvium deposition), particularly in the form of dynamic riverbank erosion and accretion [1,3]. These regions, called chars, are known for their multiple natural hazards and social vulnerabilities. Each year, for instance, char dwellers lose considerable amounts of useable land due to continuous riverbank erosion. In addition to natural hazards, char life is hampered by poor communication structures that limit char dwellers’ equal access to the social and economic benefits enjoyed by mainland dwellers [4]. Such challenging conditions are common throughout the many char regions of Bangladesh, which constitute about 5% of both the nation’s total area (7200 sq. km) and population (6.5 million people) [1,5,6]. Equally challenging is the fact that people living in these regions are often unable to migrate and find employment on the mainland.
Due to the displacement caused by challenging conditions, however, char dwellers do frequently migrate across the char regions. According to CARE-Bangladesh [7], about 25% of char families migrated at least three times over the last ten years. According to model-based estimates regarding climate change, Bangladesh is expected to face average annual and seasonal temperature increases of up to 4.7 °C by the end of the century [4]. Rainy seasons appear to be intensifying, while winter seasons are becoming drier. Challenges such as these are harmful not only to human life but also to the landscape that serves as the basis for successful agricultural activity, e.g., cropping patterns, pest infestations, crop yields, and water availability. Char dwellers regularly lose their agricultural assets, crops, livestock, and poultry, as well as the fiscal and human capital needed to maintain economic success and overall survival.
Vulnerability is an emerging concept across disciplines, useful in understanding and assessing the status of people’s condition in the face of natural hazards. The major characteristics of vulnerability are dynamic and influence people’s social and biophysical processes and systems [2]. Significant mobilization is necessary from the government, nongovernmental organizations, researchers, and farmers to develop successful adaptation strategies [8,9]. The people of developing countries are a vulnerable community due to excessive dependency on agriculture and having low income [10]. However, these burdens may fuel the exploration of potential adaptive capacities of resource-poor communities [11,12]. The extent of people’s susceptibility is increased due to the increasing vulnerability to natural hazards of almost all spheres of life, like the social, physical, human, financial, and natural dimensions [13,14]. Though the effect of natural hazards may be occasional, seasonal, or year-round [15,16], the extent of exposure is not the same for all communities.
A context-specific approach is required for exploring and assessing vulnerability to draft proper policy and strategy at all administrative levels and reduce adverse effects on livelihoods [4,17,18]. The interaction between people and their biophysical and social environment is readily used to assess the development-policy framework by using specific indicators [19], representing context-specific adaptation strategies [20], to compare and monitor the extent of vulnerability over time, space, and resource allocation [4,21]. The main challenges of vulnerability assessment are to develop robust and sound measures [22].
This study focuses on riverine-island (char) areas in Bangladeshi deltas. Bangladesh is one of the world’s largest delta areas, with about 230 rivers, including the Ganges–Brahmaputra–Meghna (GBM) River. The adverse impact of natural hazards is generally seen in coastal and riverine islands, which makes dwellers an extremely susceptible community due to their geographical isolation [23,24]. The hazards of isolation of char dwellers are intensified due to the fact that Bangladesh faces heavy rainfall and flooding approximately four months each year [25,26]. Generally, these catastrophic floods cause huge riverbank erosion through morphological dynamism in the GBM river system [23]. Frequent flood inundation causes drastic riverbank erosion, accounting for the loss of about 150,000 square kilometers over the last ten years [27]. According to Center for Environmental and Geographic Information Services (CEGIS) [28], about 20 of 64 districts are prone to riverbank erosion, resulting in losses of 8700 ha of land and the displacement of around 200,000 people each year [23,29,30,31]. Despite such hazards and vulnerability, riverine islanders often choose char areas due to increasing population pressure (156.6 million in 2014 [32]), and cumulative pressure on limited areas of land. Char dwellers are considered the most vulnerable people to natural hazards and the poorest of the poor [33,34,35]. Char areas have no road communication with the mainland or even within char villages, which increases their vulnerability. They can only use local boats (normally used for carrying goods and catching fish in riverine Bangladesh) during the rainy season for their transportation. Chars also lack electricity, health-service, market, and financial-institution facilities, which reduces their resilience capacity [1,23].
Gathering accurate information and in-depth research findings is necessary for the government, nongovernmental organizations, and international donor organizations to develop any program, policy, and strategy for the economic, social, and environmental development for marginalized char dwellers [1,4]. Policy intervention cannot actually occur without understanding the actual situation of char-dweller vulnerability [4,36,37,38]. The government of Bangladesh [24] considers the issue of char-dweller vulnerability an urgent matter to address. This study intends to fill this important gap via employing the IPCC vulnerability framework [2] by developing a livelihood vulnerability index (LVI) and a climate vulnerability index (CVI). It also aims to explore the extent of vulnerability of char dwellers in terms of livelihood and climate change at a rural household level in the chars of Bangladesh.
2. Materials and Methods
A sustainable-livelihood framework was followed to guide vulnerability assessment. Vulnerability context is a major determinant of a sustainable-livelihood framework that is mainly based on 5 livelihood assets, namely, human, social, natural, physical, and financial capital, and directly influences the institutional process, and livelihood strategies and outcomes [39,40].
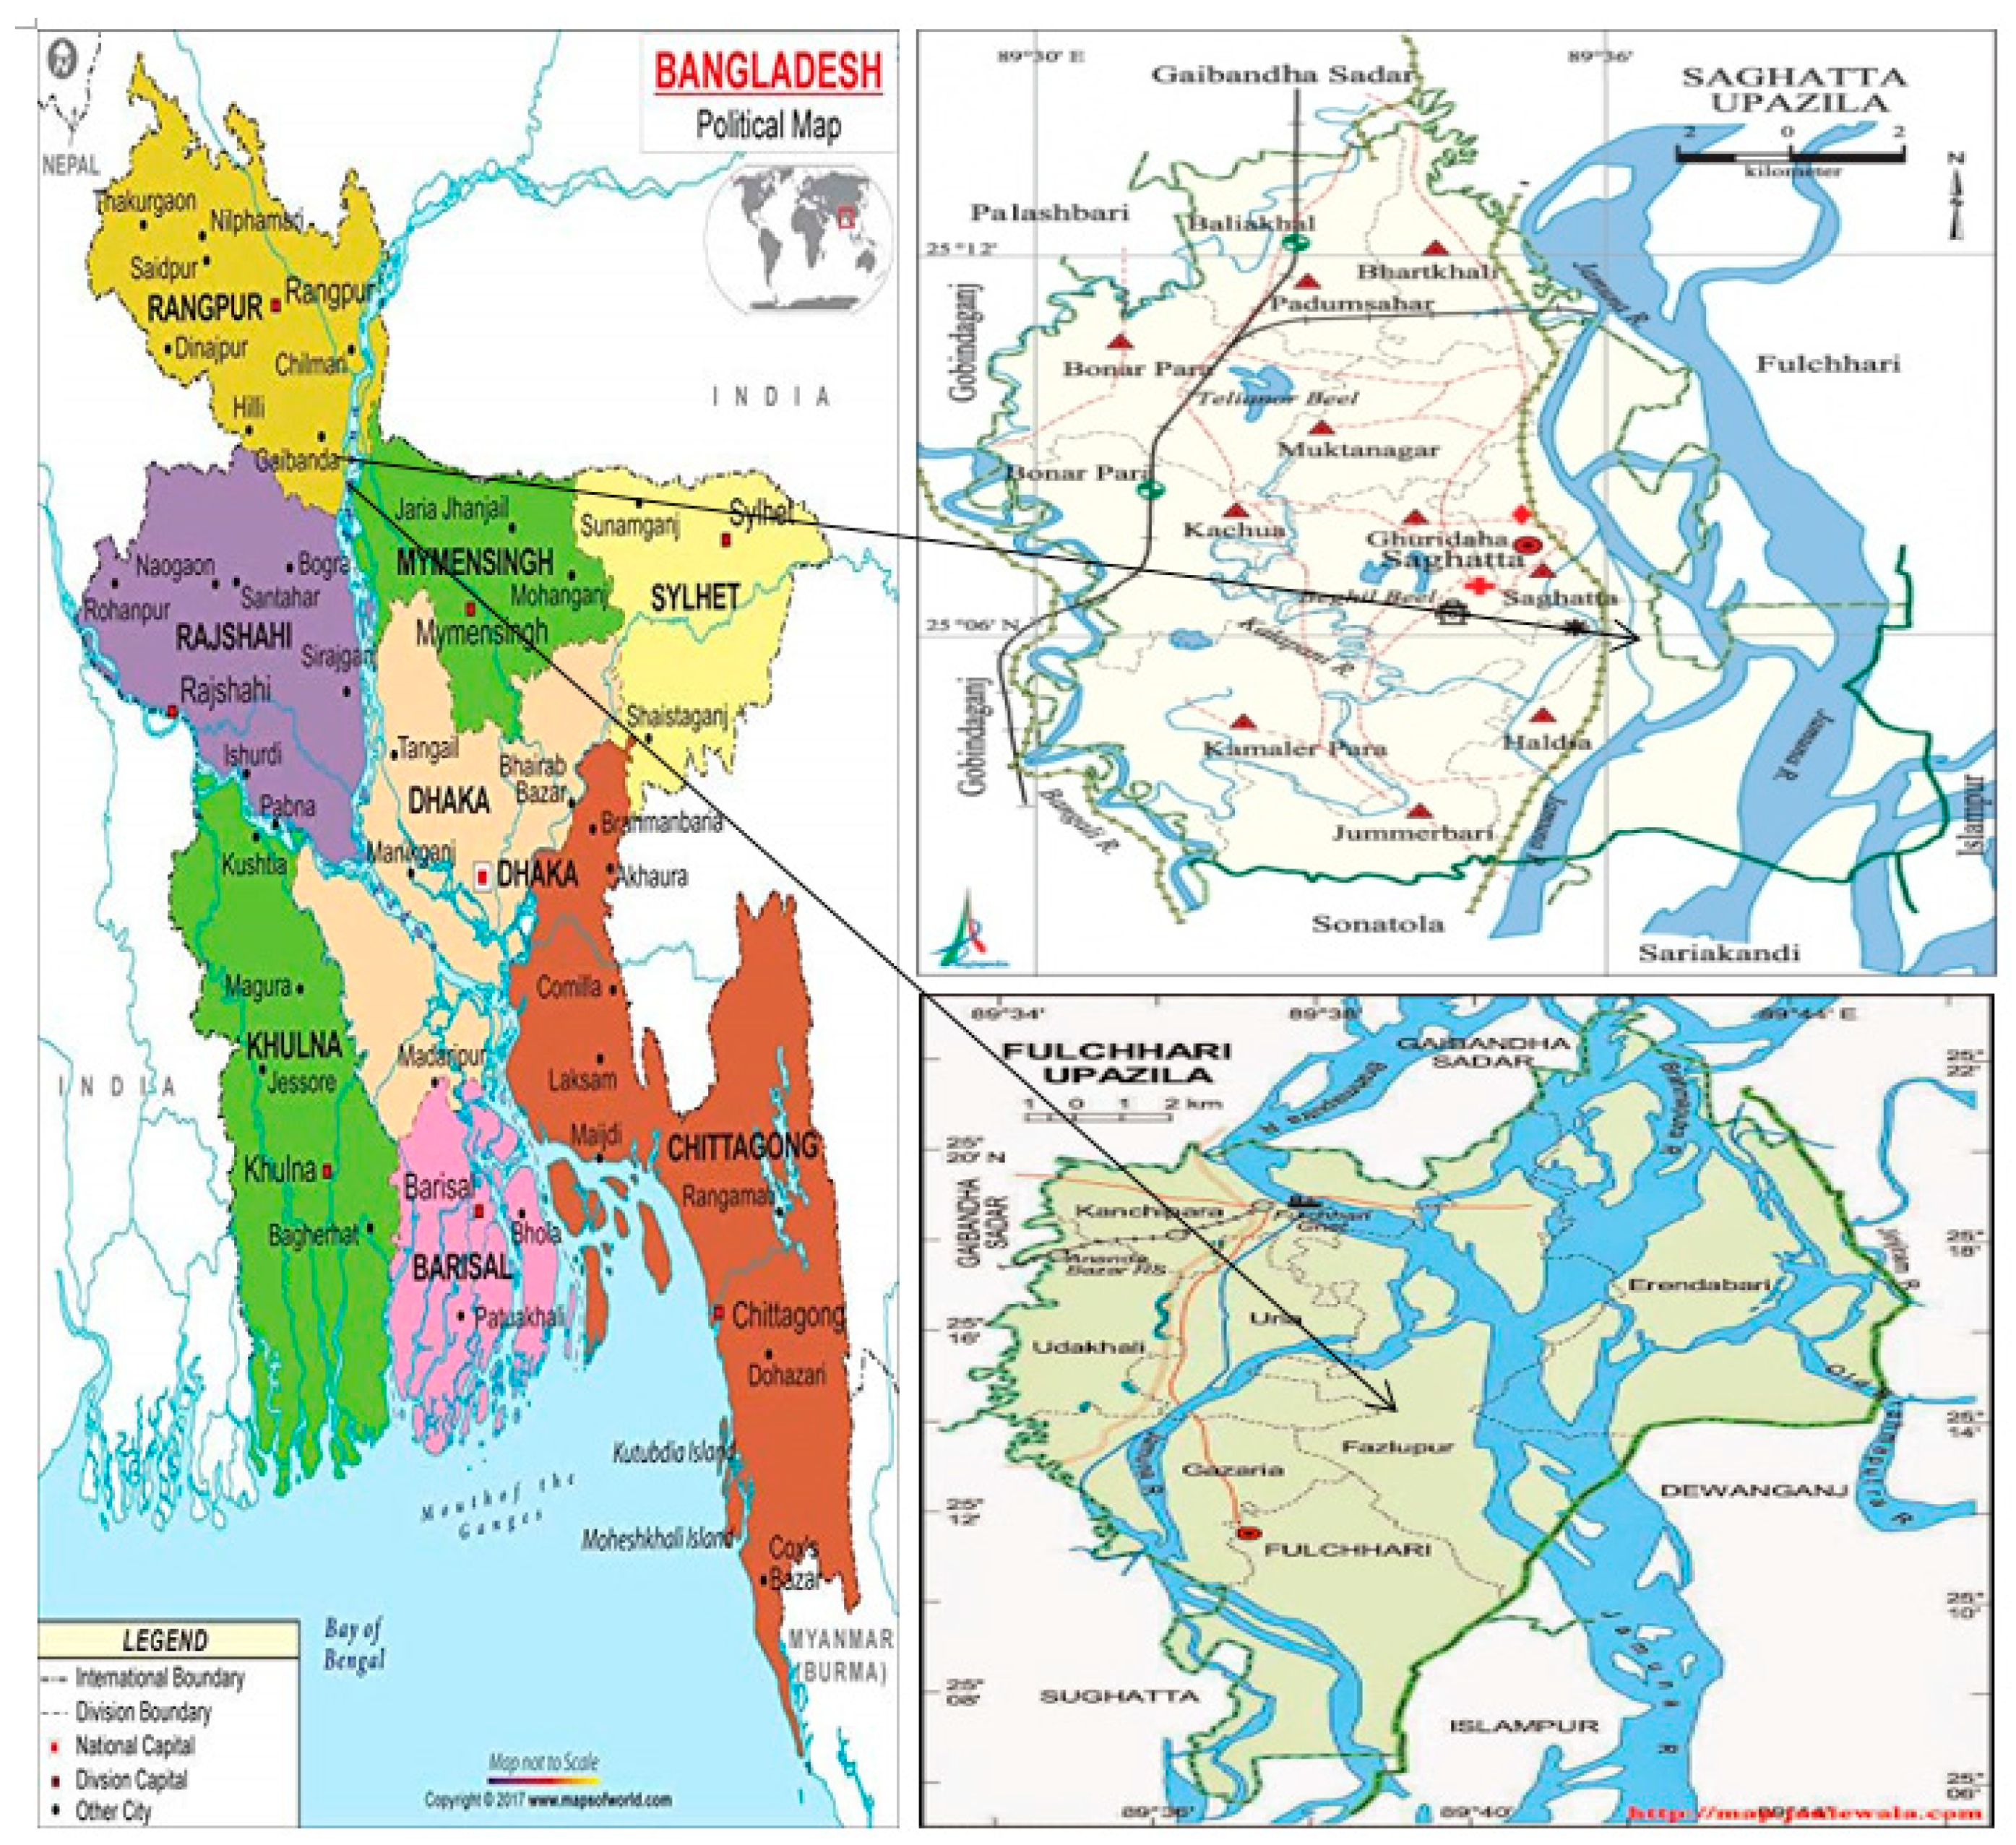
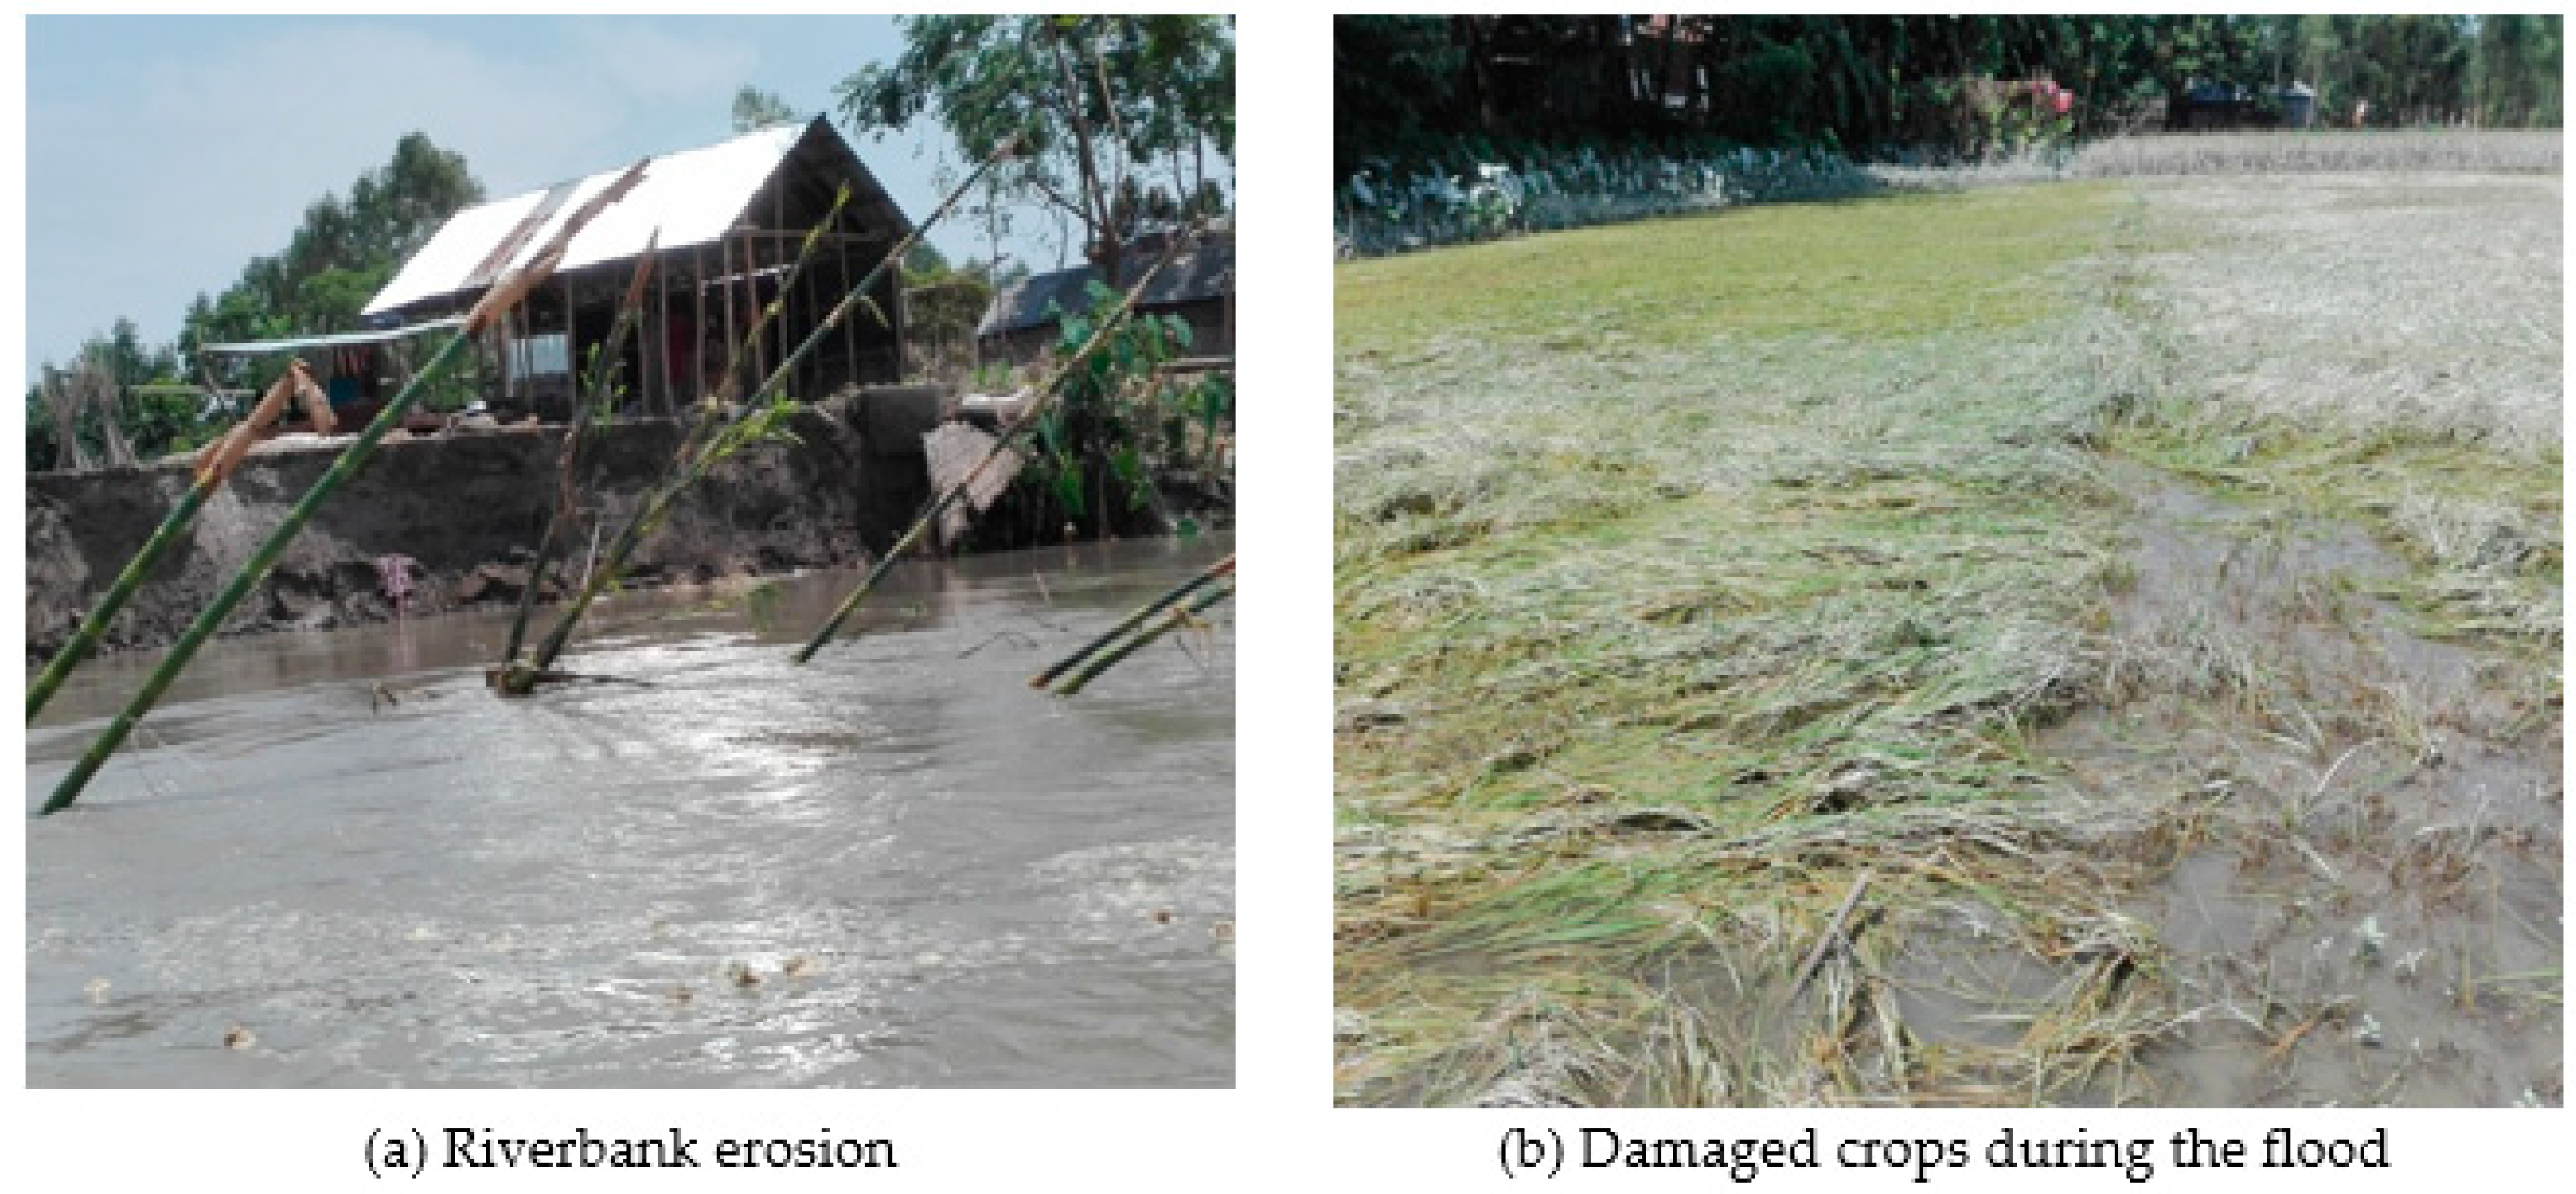
The study chose 2 local administrative units (Upazila) of Gaibandha district, namely, Saghata and Fulchhari Upazila. These areas are around 287 km from the capital of Dhaka and the northern part of Bangladesh (Figure 1). These areas comprise natural-hazard-prone and geographically isolated riverine areas. The study areas are riverine islands (chars) in Jamuna River, which faces huge riverbank loss every year. Frequent flood inundation and riverbank erosion are regular phenomena in these areas (Figure 2). The study areas were purposively selected considering natural-hazard severity, based on obtained information from literature reviews, expert opinions, available reports, and newspapers. The respondents for this study were selected randomly from the study areas.
The study mainly focused on 2 aspects of island char areas; first, char dwellers who live nearer to the mainland, within a 5 km distance from Saghata Upazila; second, those living more than 5 km away from the mainland, in the Fulchhari Upazila headquarters. Both of these areas regularly face the same extent of natural hazards. Each of them, however, has a unique identity with regard to the communication network in Upazila and the district headquarters, education facilities, health facilities, other basic public services, and livelihood assets. The studied villages in Saghata Upazila were Haldia, Patilbari, Garamara, Digalkandi, Guabari, Kanaipara, Kalurpara, Kumarpara, and Hatbari. The distant-island villages in Fulchhari Upazila were Deluabari, Jamira, Bajefulchhari, Kholabari, Pipulia, Tenrakandi, Gabgasi, and Baghbari.
2.1. Data Collection
The study used a questionnaire survey and focus-group discussions (FGDs) for data collection regarding livelihood assets, sociodemographic profiles, vulnerability indicators, and adaptation strategies. The questionnaire pilot was tested on 25 respondents to determine its suitability for the study and avoid any exaggeration in the questionnaire. The sample size was determined by the following formula, developed by Yamane [41]. This formula has been popularly used by researchers (see References [42,43,44,45,46,47]) for determining household sample size for livelihood research:
where n = sample size, N = population, and e = confidence interval.
The total population in the study area was 5666. Therefore, sample size was 374 for this study. Data were collected from the head of every household by face-to-face interviews using a semistructured questionnaire. The questionnaire survey and FGDs for this study were conducted from January to August 2017. Oral consent was taken from the household head prior to the interview. The interviews were done in the local Bengali language and lasted an average of 50 min. One FGD was done comprising 10–12 household heads in every village to record opinions regarding socioeconomic and climate-related variables that were used to validate the obtained data from the questionnaire survey. Differences in vulnerability status between household living nearby villages (in Saghata Upazila), and household living distant villages from the mainland (in Fulchhari Upazila) were determined by chi-square and t-tests.
2.2. Vulnerability Analysis
Vulnerability is a condition of an individual or community to stresses due to changes in socioeconomic and environmental conditions disrupting livelihoods [18]. Vulnerability assessment can identify susceptible people and the context of natural hazards through exploring socioeconomic processes and natural outcomes [1,33,48,49]. According to the IPCC [50], vulnerability is a function of 3 dimensions: exposure, sensitivity, and adaptive capacity.
Vulnerability = ƒ (exposure, sensitivity, adaptive capacity)
Generally, vulnerability is positively related to a system’s exposure and sensitivity, but negatively related to adaptive capacity [1,14]. The livelihood vulnerability of char dwellers was measured by an LVI [4,38] and CVI [51], focusing on major determinants under the appropriate IPCC framework. The IPCC framework uses 3 major factors (exposure, sensitivity, and adaptive capacity) to measure vulnerability. This study used a composite index-oriented LVI, which comprises the human, natural, physical, social, and financial household capital of a sustainable-livelihood framework (SLF) to provide better integration with sensitivity and adaptive capacity. This kind of methodology has been used by other scholars [1,4,52,53,54,55]. The main limitation of SLF is its inability to integrate the indicators of sensitivity and adaptive capacity. In this study, the LVI approach deals with a group of 13 major components consisting of major indicators and subindicators under 5 categories of livelihood capital (human, natural, physical, social, and financial capital). It comprises health, food, water, knowledge, livelihood strategies, land, natural resources, natural disasters, climatic variability, social networks, housing and production means, and agricultural and nonagricultural assets. This context-specific LVI approach can properly explore the real circumstances of livelihood vulnerability caused by natural disasters [38].
Context-specific LVI and CVI were used with a weighted balance and integrated approach. These context-specific LVI and CVI adopted additional components after Hahn et al. [38] and indicators based on study-area context through literature review, expert consultation, and local circumstances. A scale ranging from 0 (least vulnerable) to 1 (most vulnerable) was used to show the vulnerability status of inter- and intragroups of respondents. Though each major indicator comprises some subindicators, each of them equally contributed to the index. Equal weight was given to all components. Since a specific scale was used for the specific component, standardization was done by Equation (1).
where Sv is an original subcomponent value of area v; Smin and Smax are the minimum and maximum value of the subcomponent, respectively. The standardized index was developed by using these minimum and maximum values. A scale ranging from 0 to 100 was used to explore the percentage of some components.
An average of each subcomponent was calculated after standardization by using Equation (2).
where Mvj is the value of major component j for area v; Indexsvi denotes the subcomponent value indexed by i of major component Mj; n represents the number of subcomponents in major component Mj.
The values of 13 major components under the 5 major capitals of livelihood were directly used in Equation (3) or aggregated to 5 livelihood assets (H (human capital), N (natural capital), S (social capital), P (physical capital), and F (financial capital)) before being used in Equation (3) to obtain the weighted average of LVI:
Equation (3) above can also be expressed as Equation (4):
where LVIv is the livelihood-vulnerability index of area v; WMj is the weightage of component j; WH, WN, WS, WP, WF are the weight value of human capital, natural capital, social capital, physical capital, and financial capital, respectively. Equation (4) can be expressed as:
where WH, WF, WW, WKS, WLS, WL, WCC, WNDC, WSN, WHPM, WNAA, WAA, and WFI are the weight of health, food, water, knowledge and skill, livelihood strategies, land, climatic variability, natural disasters and climate variability, social networks, housing and production means, agricultural assets, nonagricultural assets, and finance and income, respectively. Similarly, HV, FV, WV, KSV, LSV, LV, CCV, NDCV, SNV, HPMV, NAAV, AAV, and FIV are the number of indicators under health, food, water, knowledge and skill, livelihood strategies, land, climatic variability, natural disasters and climate variability, social networks, housing and production means, nonagricultural assets, agricultural assets, and finance and income, respectively.
The exposure (Exp) index includes land (L), natural resources (NR), and natural disasters and climate variability (NDC); it was measured as follows (Equation (6)):
where Wexp1, Wexp2, and Wexp3 represent the weight for land (L), climatic variability (CC), and natural disasters (ND), respectively.
The index of sensitivity (Sen) was calculated from health (H), Food (F), and water (W), as follows (Equation (7)):
where Wsen1, Wsen2, and Wsen3 denote weight for health (H), Food (F) and water (W) respectively.
The index for adaptive capacity (Adacap) includes knowledge and skills (KS), livelihood strategies (LS), social networks (SN), household and production means (HPM), agricultural assets (AA), nonagricultural assets (NAA), and finance and income (FI), and was measured as follows (Equation (8)):
where, Wad1, Wad2, Wad3, Wad4, Wad5, Wad6, and Wad7 represent the weight for knowledge and skill (KS), livelihood strategies (LS), social networks (SN), household and production means (HPM), agricultural assets (AA), nonagricultural assets (NAA). and finance and income (FI), respectively.
The weighted average of CVI was calculated from the value of exposure, adaptive capacity, and sensitivity by the following formula (Equation (9)).
where ni is the number of major components in the i-th vulnerability dimensions. The value of each dimension ranged to a maximum value of 1 from a minimum of 0.
2.3. IPCC Framework Approach
The IPCC approach allows to integrate all 11 components into 3 dimensions: exposure, sensitivity, and adaptive capacity. The 3 contributing factors are accumulated in Equation (10).
where LVI – IPCCa is the LVI for a community with a minimum value of −1 (least vulnerable) and maximum value 1 (most vulnerable).
According to some scholars [4,56,57,58,59,60], it is very difficult to choose robust and relevant indicators to properly represent local communities. However, this limitation is addressed through an extensive literature review, direct observations, and expert opinions for obtaining representative and comprehensive results (Appendix A). Indicator-based studies are the best tools to simplify the telling of a complex story. However, indicator choices and weighting are always subjective arguments [1,4,23]. Scholars argued that nonweighted variables would not change the message conveyed through an index in comparison with weighted variables [4,49]. Most vulnerability indices are nonweighted averages of indicators and a weighted average of components [1,4,37,38,51]. Thus, in line with the existing literature, this study also applied equal weighting for all indicators.
3. Results and Discussion
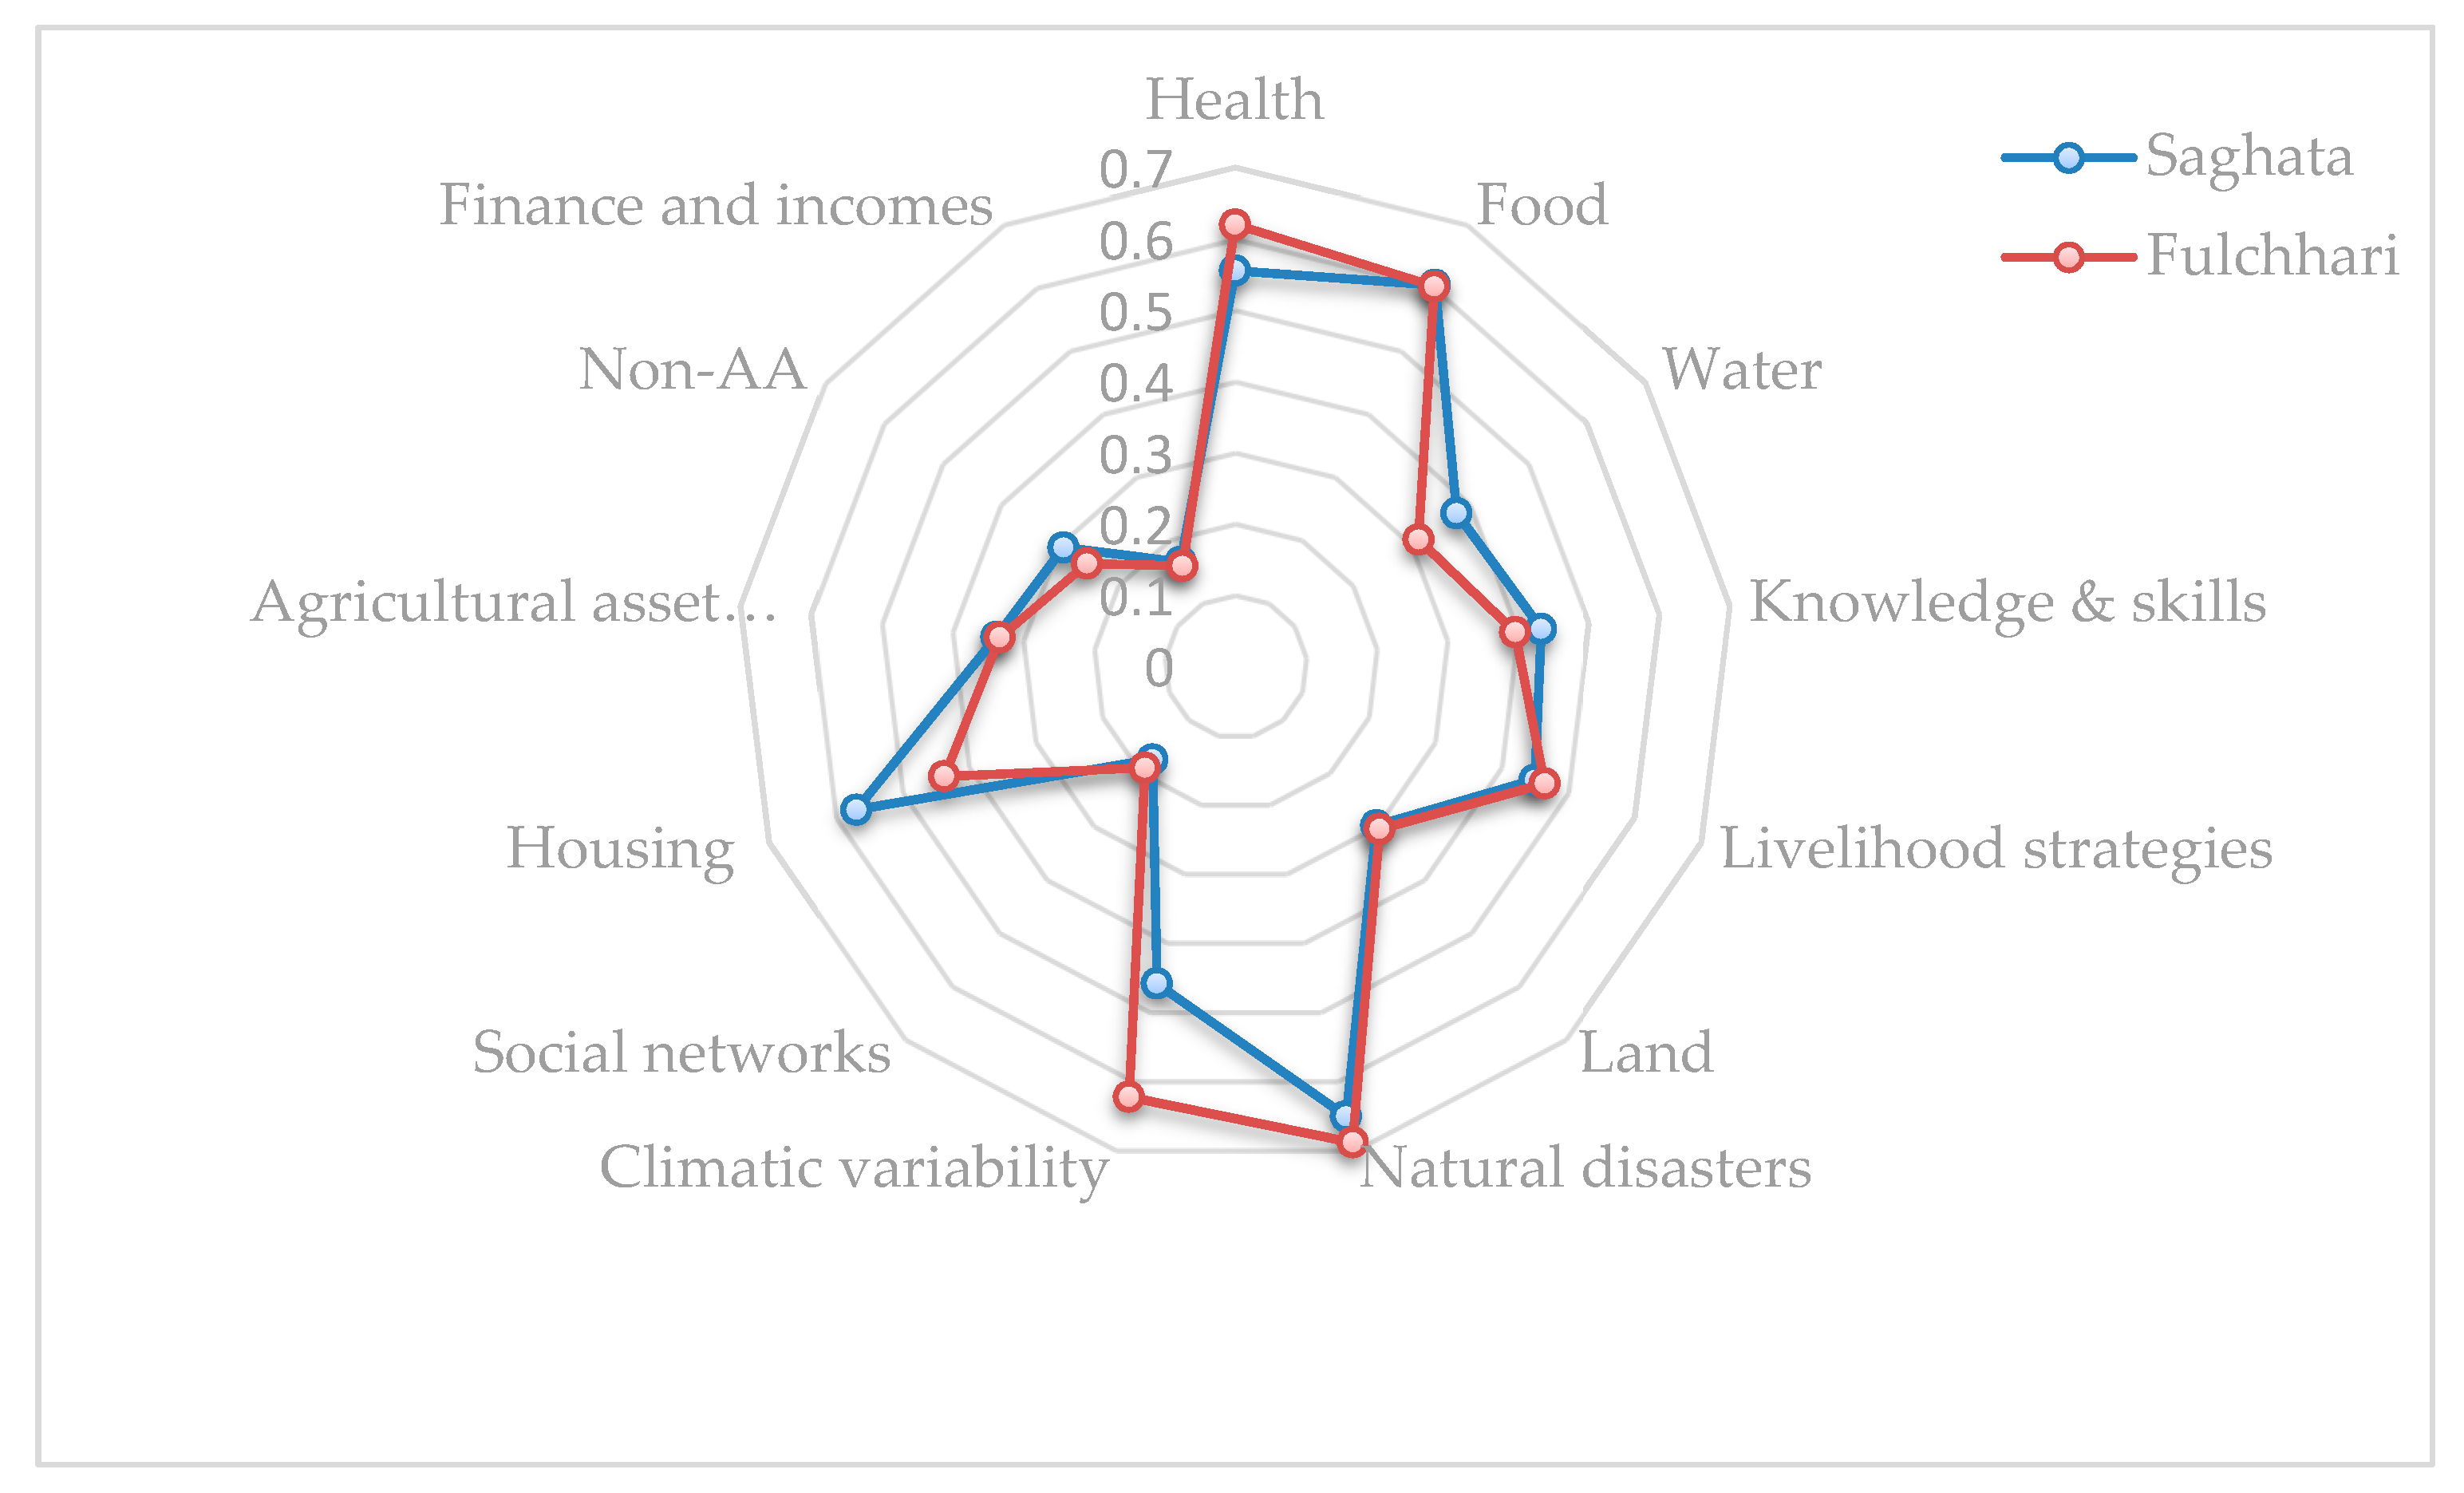
The findings of LVI, CVI, and livelihood vulnerability are interpreted in this section. Figure 3 outlines the influencing factors of vulnerability. It also shows LVI and CVI values, highlighting the major and subcomponents that vary from indicator to indicator, and between Saghata Upazila (within 5 km from the mainland) and Fulchhari Upazila (more than 5 km away from the mainland).
3.1. Livelihood Vulnerability Index
The LVI value of char dwellers in Fulchhari Upazila (0.428) was higher than that of char dwellers in Saghata Upazila (0.417). These values indicate that char dwellers of the study area are vulnerable in terms of their livelihood assets. The char dwellers of the more-distant area were more deprived in terms of basic public services, with less access to education, health, and finances (Appendix B).
Sociodemographic characteristics between the two groups were similar but varied in some subindicators like knowledge and skill, livelihood strategies, health, and water. It was found that female-headed households were more vulnerable than male-headed households in both char areas. The values of knowledge and skill, livelihood strategies, and health of char dwellers of Saghata Upazila, meanwhile, was higher than Fulchhari Upazila.
The index values of land, natural resources, natural disasters, and climate variability of Fulchhari Upazila were slightly higher than those of Saghata Upazila char dwellers due to longtime settlement in their char areas. Similarly, the index value of social networks of Saghata Upazila char dwellers was higher than that of Fulchhari Upazila dwellers. On the other hand, the index values of housing and production means, agricultural assets, nonagricultural assets, of Fulchhari Upazila char dwellers was lower than Saghata Upazila char dwellers. Similarly, financial income index value was also higher in Saghata Upazila than in Fulchhari Upazila.
3.2. Climate Vulnerability Index
CVI values for Saghata Upazila and Fulchhari Upazila char dwellers was high, indicating that char dwellers of both near and distant areas were vulnerable to climatic variability and natural disasters. There was almost no significant difference between them (Table 1), but values were higher than riverbank and mainland dwellers [1].
The values of the major LVI dimensions are shown in Table 1. Significant difference exists between the values of major indicators of vulnerability among char-dweller groups. The value of exposure, sensitivity, and adaptive capacity of char dwellers of Saghata Upazila was less than Fulchhari Upazila (Table 1). The values indicate that Fulchhari Upazila char dwellers are more exposed and sensitive to natural hazards than Saghata Upazila char dwellers. Similarly, the adaptive capacity of Fulchhari Upazila char dwellers was less than that of Saghata Upazila dwellers. LVI-IPCC estimation findings indicate that Fulchhari Upazila char dwellers are more vulnerable, which is similar to previous findings [54,61,62].
3.3. Livelihood Vulnerability
The livelihood status of char dwellers was found to be highly vulnerable across the study areas. Findings show that both groups of char dwellers are vulnerable, but those living nearest to the mainland are less vulnerable than more distant dwellers. This is likely due to facilities being provided by public agencies and nongovernmental organizations, better communication and social networks, education facilities, and easy migration during extreme disasters [52,63]. Due to reduced access to education, knowledge, and skills, Fulchhari Upazila char dwellers are more at risk than Saghata Upazila dwellers. The number of educational institutions in Fulchhari Upazila is less than in Saghata Upazila, which also influences knowledge and skill level. Only primary schools are available in some villages, which causes school dropouts at the secondary level. Livelihood strategy is almost diversified in Saghata Upazila, but less diversified in Fulchhari Upazila.
Riverbank erosion is a common phenomenon in char areas, and Both study areas face it regularly. However, the extent of riverbank erosion in Saghata Upazila is greater than Fulchhari Upazila. Findings also indicate that Saghata Upazila char dwellers are more vulnerable than those of Fulchhari Upazila in terms of natural capital, including land, natural resources, natural disasters, and climate variability. The social network of char dwellers is not the same as mainland dwellers. The study reveals that the social capital of Saghata Upazila char dwellers is better than that of Fulchhari Upazila char dwellers. Like other types of capital, the physical capital, including housing and production means, agricultural assets, and nonagricultural assets, of Saghata Upazila char dwellers is better than that of Fulchhari Upazila char dwellers. This indicates that Fulchhari Upazila char dwellers are more vulnerable than Saghata Upazila dwellers in terms of physical capital. The financial capital of char dwellers is very low due to limited access to financial organizations like microfinance institutions, nongovernmental organizations (NGOs), commercial banks, and other voluntary organizations. The results also indicate that Fulchhari Upazila char dwellers are more financially vulnerable than Saghata Upazila char dwellers. Due to poor communication, nongovernmental microfinance institutions (MFIs) are not willing to work in distant char areas. Similar cases exist for public organizations [52,64]. The officials of various service-oriented organizations are not willing to work in char areas because of the lack of modern and health facilities, lack of electricity, almost no market, no communication means, sandy soil, long walking distances during the winter season, sandy wind storms, and frequent flood inundation. These reasons also cause food insecurity, poverty traps, and vulnerable livelihoods [4,26,44].
3.4. Policy Implications
Climate-resilience development may be considered a critical issue for Bangladesh. Though the nation has already taken some initiatives through formulated projects for the development of the riverbank dwellers, the need remains for strengthening char-dweller capacity to address recurrent disasters. Char dwellers face seasonal food insecurity and chronic poverty due to employment unavailability from September to November every year because of their dependency on agriculture. In addition, they face flood inundation and riverbank erosion every year. By losing almost all kinds of livelihood assets, they become highly vulnerable. Self-help is restricted due to a vicious cycle of poverty and the frequent attacks of natural disasters [4,23].
The findings of this study can help formulate a context-specific intervention program for the vulnerable communities of char areas. Particularly, targeted intervention is required to improve the livelihood of female-headed households as they are more vulnerable than male-headed households. The various social safety-net programs from GO and NGO efforts have been largely inefficient in securing char-dweller livelihoods [65]; new social safety-net programs should be implemented [66,67]. Similarly, a long-term development program should be implemented to develop char–mainland communication networks, season-oriented transportation, access to basic services, and markets for developing alternative livelihood strategies [68]. Many financial organizations are not willing to work in char areas due to geographical isolation and communication barriers. The government should, therefore, take initiative to control and monitor banking and nonbanking financial organizations so as to target their activities toward char areas and offer char dwellers greater access to financial capital. Since the professions of char dwellers are mainly related to agriculture, agricultural-research organizations should be encouraged to develop char-area-specific crop varieties and facilitate technology-transfer systems. The above means would help to develop resilience to natural disasters and maintain a sustainable livelihood throughout the country.
4. Conclusions
Due to its geographical position, Bangladesh is easily susceptible to natural disasters. Similarly, char areas are isolated from the mainland and exist throughout the country’s vast river-delta regions. This study sought to analyze the livelihood vulnerability of char dwellers, who face regular natural disasters like flood inundation, riverbank erosion, and drought. The major livelihood components were analyzed by developing a context-specific holistic approach. It was not easy to collect data from char areas due to poor accessibility. The researcher walked for miles, and sometimes used a local boat to visit char villages and conduct face-to-face interviews with the respondents. The study reveals that char dwellers are vulnerable in terms of livelihood assets, irrespective of areas. LVI and CVI results show that both char-dweller groups are vulnerable to natural disasters. They also report a difference in variability between major components and subcomponents, and with respect to mainland proximity. The main drivers of livelihood vulnerability are livelihood strategies, weak social networks, low access to food, water, and health facilities, and limited access to agricultural and nonagricultural assets, and finance. Interviews indicate the char-dweller perception that a long-term development plan, including road construction, social forestry, year-round employment, and capacity building would be helpful to build resilience against vulnerability. The adaptive capacity of char dwellers should be strengthened through the improvement of communication, transportation, livelihood diversification, and access to basic public services.
Author Contributions
M.N.I.S. and M.W. initiated the study. M.N.I.S. collected the data. M.N.I.S. and G.M.M.A. processed the data and performed statistical analysis. M.N.I.S., M.W., G.M.M.A., and R.C.S. wrote and revised the manuscript. All authors read and approved the final manuscript.
Funding
This article is funded by Sichuan University Innovation Spark Project (No.2018hhs-21), Management Science & National Governance Disciplines Platform of Sichuan University, Sichuan University Central University Basic Scientific Research Project (No.skqx201501).
Conflicts of Interest
The authors declare no conflicts of interest.
Appendix A

Table A1.
Livelihood Vulnerability Index (LVI) and Climate Vulnerability Index (CVI) components and indicators developed for this study (HHs = households; NGOs = nongovernmental organizations).
Table A1.
Livelihood Vulnerability Index (LVI) and Climate Vulnerability Index (CVI) components and indicators developed for this study (HHs = households; NGOs = nongovernmental organizations).
| Components | Indicators | Score/Values | Expected Relationship | Justification of Indicators |
|---|---|---|---|---|
| Health | Percentage of HHs that have generally taken treatment from a qualified doctor | Yes = 1, No = 0 | Treatment from a qualified doctor decreases vulnerability. | [1,2] |
| Percentage of HHs in which family members have chronic illness | Yes = 1, No = 0 | Chronic illness increases vulnerability. | [4,13] | |
| Percentage of HHs receiving treatment from a local doctor during illness | Yes = 1, No = 0 | Treatment from a local doctor increases vulnerability. | [14,15,17] | |
| Percentage of HHs having a sanitary latrine | Yes = 1, No = 0 | Using sanitary latrine decreases vulnerability. | [20,21,22,23] | |
| Percentage of HHs in which a family member missed work due to illness in the past two weeks. | Yes = 1, No = 0 | Missing work due to illness increases vulnerability. | [27,31,32,33,34] | |
| Food | Worried about lack of sufficient food during the last three months. | Yes = 1, No = 0 | Worry indicates food insecurity, i.e., nonresilient. | [1,4,15] |
| Bound to have fewer than three meals in a day due to unavailability of sufficient food during the last three months. | Yes = 1, No = 0 | Fewer than three meals indicate food insecurity. | [1,36] | |
| Bound to go bed hungry due to lack of sufficient food during the last three months. | Yes = 1, No = 0 | Sleeping without meals indicates food insecurity. | [37] | |
| Water | Percentage of HHs that easily obtain water by their own source (tubewell). | Yes = 1, No = 0 | Own water source decreases vulnerability. | [4,42] |
| Percentage of HHs using unsafe drinking water (river, pond, water hole, arsenic-contaminated water) | Yes = 1, No = 0 | Unsafe drinking water increases vulnerability. | [38,42,67] | |
| Percentage of HHs getting water from a distant water source (tubewell). | Yes = 1, No = 0 | Water from a distant water source increases vulnerability. | [23,38,48] | |
| Knowledge and skills | Having illiterate household head. | Yes = 1, No = 0 | Illiteracy increases vulnerability. | [38,53] |
| Household head having primary school completed. | Yes = 1, No = 0 | Literacy decreases vulnerability. | [38,54] | |
| Livelihood strategies | Having the training to cope with floods and other natural disasters. | Yes = 1, No = 0 | Training decreases vulnerability. | [23,38,58] |
| Cultivating more than one crop in a season. | Yes = 1, No = 0 | Cultivating more crops decreases vulnerability. | [4,67] | |
| Depending on agriculture as a major source of income. | Yes = 1, No = 0 | Single dependency increases vulnerability. | [33,67] | |
| Nonfarm activities affected by natural disasters. | Yes = 1, No = 0 | Affecting nonfarm activities increases vulnerability. | [38,59] | |
| Having no job during flood season. | Yes = 1, No = 0 | Unemployment increases vulnerability. | [6,67] | |
| Getting natural resources during flood season. | Yes = 1, No = 0 | Getting natural resources decreases vulnerability. | [60,67] | |
| Fishing during flood season. | Yes = 1, No = 0 | Fishing decreases vulnerability. | [1,23] | |
| Land | HHs owning no land whatsoever. | Yes = 1, No = 0 | HHs owning no land increases vulnerability. | [38,53] |
| HHs owning homestead land but not cultivated land. | Yes = 1, No = 0 | HHs owning homestead land but not cultivated land increases vulnerability. | [38,54] | |
| HHs with cultivated land up to 0.2 ha. | Yes = 1, No = 0 | Cultivated land up to 0.2 ha also shows vulnerability. | [38,67] | |
| HHs with cultivated land 0.2 ha to 0.42 ha. | Yes = 1, No = 0 | Cultivated land 0.2 ha to 0.42 ha decreases vulnerability. | [23,60] | |
| Natural disasters | Percentage of HHs facing severe floods in the past 10 years. | Yes = 1, No = 0 | Severe floods increase vulnerability. | [38,62] |
| Percentage of HHs facing river erosion every year. | Yes = 1, No = 0 | River erosion increases vulnerability. | [23,67] | |
| Percentage of HHs not getting flood and other natural disasters warning. | Yes = 1, No = 0 | No disaster warning increases vulnerability. | [67] | |
| Climatic variability | Facing gradually increasing floods from last 10 years. | Yes = 1, No = 0 | Facing floods increases vulnerability. | [38,67] |
| Facing gradually increasing riverbank erosion from last 10 years. | Yes = 1, No = 0 | Facing riverbank erosion increases vulnerability. | [1,4,67] | |
| Facing increasing summer temperature gradually from last 10 years | Yes = 1, No = 0 | Facing increased summer temperature increases vulnerability. | [38,58] | |
| Facing gradually increasing winter temperature from last 10 years. | Yes = 1, No = 0 | Facing increased winter temperature increases vulnerability. | [36,67] | |
| Facing gradually increasing rainfall from last 10 years. | Yes = 1, No = 0 | Facing heavy rainfall increases vulnerability. | [23,66] | |
| Facing gradually increasing monsoon rainfall from last 10 years. | Yes = 1, No = 0 | Facing increased monsoon rainfall increases vulnerability. | [23,38,67] | |
| Facing gradually increasing winter-month rainfall from last 10 years. | Yes = 1, No = 0 | Facing increased winter-month rainfall increases vulnerability. | [1,2] | |
| Facing gradually increasing winter period from last 10 years. | Yes = 1, No = 0 | Facing increased winter period increases vulnerability. | [4,13] | |
| Facing gradually increasing summer period from last 10 years. | Yes = 1, No = 0 | Facing increased summer period increases vulnerability. | [14,15,17] | |
| Facing gradually increasing drought from last 10 years. | Yes = 1, No = 0 | Facing increased droughts increases vulnerability. | [20,21,22,23] | |
| Facing gradually increasing cyclones from last 10 years. | Yes = 1, No = 0 | Facing increased cyclones increases vulnerability. | [27,31,32,33,34] | |
| Social networks | Percentage of HHs that allowed women family members to work outside the home. | Yes = 1, No = 0 | Women family members working outside the home decreases vulnerability. | [1,68] |
| Percentage of HHs involved in any farmer organization. | Yes = 1, No = 0 | Farmer participation in organizations decreases vulnerability. | [38,67] | |
| Percentage of HHs involved in any political organization | Yes = 1, No = 0 | Any political participation decreases vulnerability. | [1,38] | |
| Percentage of HHs involved as a member of any NGO. | Yes = 1, No = 0 | Farmer participation in NGOs decreases vulnerability. | [38,62] | |
| Percentage of HHs involved in any government organization. | Yes = 1, No = 0 | Farmer participation in GOs decreases vulnerability. | [1,2] | |
| Housing and production means | Percentage of HHs without a solid house. | Yes = 1, No = 0 | HHs without solid house shows vulnerability. | [4,13] |
| Percentage of HHs with house affected by floods. | Yes = 1, No = 0 | Houses affected by floods increase vulnerability. | [1,2,6] | |
| Percentage of HHs without access to production means. | Yes = 1, No = 0 | HHs without access to production means increase vulnerability. | [66,67] | |
| Agricultural assets | Cows | Yes = 1, No = 0 | Having cows decreases vulnerability. | [23,60] |
| Bulls | Yes = 1, No = 0 | Having bulls decreases vulnerability. | [38,62] | |
| Calves | Yes = 1, No = 0 | Having calves decreases vulnerability. | [23,67] | |
| Poultry (>5) | Yes = 1, No = 0 | Having poultry decreases vulnerability. | [27,31,32,33,34] | |
| Goats/sheep | Yes = 1, No = 0 | Having goats/sheep decreases vulnerability. | [38,62] | |
| Buffalos | Yes = 1, No = 0 | Having buffalos decreases vulnerability. | [23,67] | |
| Horses | Yes = 1, No = 0 | Having horses decreases vulnerability. | [23] | |
| Nonagricultural assets | Durables (Furniture, >one house, motorbikes, vans, bicycles). | Yes = 1, No = 0 | Having durables decreases vulnerability. | [1,23,68] |
| Rice-husking machine. | Yes = 1, No = 0 | Having rice-husking machine decreases vulnerability. | [27,31,32,33,34] | |
| Machine for irrigation | Yes = 1, No = 0 | Having a machine for irrigation decreases vulnerability. | [1] | |
| Boat | Yes = 1, No = 0 | Having a boat decreases vulnerability. | Localized | |
| Income | Lending money to other people. | Yes = 1, No = 0 | Lending money decreases vulnerability. | [27,31,32,33,34] |
| Borrowing money from relatives. | Yes = 1, No = 0 | Borrowing money increases vulnerability. | [38,42] | |
| Borrowing money from friends. | Yes = 1, No = 0 | This increases vulnerability. | [33,67] | |
| Borrowing money from neighbors. | Yes = 1, No = 0 | This increases vulnerability. | [27,31] | |
| Borrowing money from NGOs in the last 12 months. | Yes = 1, No = 0 | This increases vulnerability. | [1,38] | |
| Borrowing from a commercial bank in the last 12 months. | Yes = 1, No = 0 | This increases vulnerability. | [1,2] | |
| Borrowing money from a local moneylender. | Yes = 1, No = 0 | This increases vulnerability. | [6,13] | |
| Borrowing money from the Mohajon (local lender) | Yes = 1, No = 0 | This increases vulnerability. | [1,38] | |
| Having an income source during the seasonal famine (Monga) from September to December | Yes = 1, No = 0 | Income during September to December decreases vulnerability. | [38,67] |
Appendix B
Table A2.
Index value of major and subcomponents of LVI.
| Major Components | Index Value of Each Component | Subcomponents or Indicator | Index Value of Each Component | ||
|---|---|---|---|---|---|
| Saghata | Fulchhari | Saghata | Fulchhari | ||
| Health | 0.555 | 0.620 | Percentage of HHs generally having received treatment from a qualified doctor. | 0.171 | 0.35 |
| Percentage of HHs in which family members have chronic illness. | 0.759 | 0.18 | |||
| Percentage of HHs receiving treatment from a local doctor during illness. | 0.845 | 0.84 | |||
| Percentage of HHs having sanitary latrines. | 0.834 | 0.91 | |||
| Percentage of HHs in which family members missed work due to illness in the past two weeks. | 0.165 | 0.23 | |||
| Food | 0.604 | 0.602 | Percentage of HHs anxious about lack of sufficient food during the last three months. | 0.674 | 0.54 |
| Percentage of HHs bound to eat fewer than three meals in a day due to unavailability of sufficient food during the last three months. | 0.609 | 0.68 | |||
| Percentage of HHs going to bed hungry due to lack of sufficient food during the last three months | 0.524 | 0.59 | |||
| Water | 0.378 | Percentage of HHs that easily get water from own source (tubewell). | 0.54 | 0.6 | |
| 0.313 | Percentage of HHs using unsafe drinking water (river, pond, water hole, arsenic-contaminated water). | 0.561 | 0.41 | ||
| Percentage of HHs getting water from a distant water source (tubewell). | 0.421 | 0.24 | |||
| Knowledge and skills | 0.433 | 0.396 | Percentage of HHs having illiterate household Head | 0.444 | 0.43 |
| Percentage of HHs with household head who completed primary school. | 0.422 | 0.36 | |||
| Livelihood strategies | 0.45 | 0.465 | Percentage of HHs with training to cope with flood and other natural disasters. | 0.155 | 0.15 |
| Percentage of HHs cultivating more than one crop in a season. | 0.599 | 0.72 | |||
| Percentage of HHs dependent on agriculture as a major source of income. | 0.54 | 0.53 | |||
| Percentage of HHs whose nonfarm activities are affected by natural disasters. | 0.733 | 0.74 | |||
| Percentage of HHs having no job during flood season. | 0.289 | 0.27 | |||
| Percentage of HHs exploring natural resources during flood season. | 0.086 | 0.06 | |||
| Percentage of HHs that fishing during flood season. | 0.749 | 0.77 | |||
| Land | 0.299 | 0.306 | Percentage of HHs owning no land whatsoever. | 0.401 | 0.43 |
| Percentage of HHs owning homestead land but not cultivated land. | 0.24 | 0.22 | |||
| Percentage of HHs with cultivated land up to 0.2 ha. | 0.412 | 0.39 | |||
| Percentage of HHs with cultivated land 0.2 ha to 0.42 ha. | 0.144 | 0.19 | |||
| Natural disasters | 0.651 | 0.689 | Percentage of HHs facing severe floods in the past 10 years. | 0.813 | 0.84 |
| Percentage of HHs facing river erosion every year. | 0.824 | 0.9 | |||
| Percentage of HHs not warned about flood and other natural disasters. | 0.332 | 0.32 | |||
| Climatic variability | 0.459 | 0.623 | HHs facing gradually increasing floods from last 10 years. | 0.872 | 0.58 |
| HHs facing gradually increasing riverbank erosion from last 10 years. | 0.107 | 0.5 | |||
| HHs facing gradually increasing summer temperature from last 10 years | 0.631 | 0.66 | |||
| HHs facing gradually increasing winter temperature from last 10 years. | 0.406 | 0.45 | |||
| HHs facing gradually increasing rainfall from last 10 years. | 0.54 | 0.56 | |||
| HHs facing gradually increasing monsoon rainfall from last 10 years. | 0.492 | 0.99 | |||
| HHs facing gradually increasing winter-month rainfall from last 10 years. | 0.241 | 0.36 | |||
| HHs facing gradually increasing winter period from last 10 years. | 0.487 | 0.59 | |||
| HHs gradually facing increasing summer period from last 10 years | 0.636 | 0.66 | |||
| HHs facing gradually increasing droughts from last 10 years. | 0.989 | 0.97 | |||
| HHs facing gradually increasing cyclones from last 10 years. | 0.406 | 0.5 | |||
| Social networks | 0.175 | 0.191 | Percentage of HHs that allow women family members to work outside the home. | 0.374 | 0.38 |
| Percentage of HHs involved in any farmer organization. | 0.118 | 0.13 | |||
| Percentage of HHs involved in any political organization. | 0.134 | 0.2 | |||
| Percentage of HHs involved as a member of any NGO. | 0.171 | 0.17 | |||
| Percentage of HHs involved in any government organization. | 0.08 | 0.07 | |||
| Housing and production means | 0.569 | 0.437 | Percentage of HHs without a solid house. | 0.93 | 0.79 |
| Percentage of HHs with a house affected by floods. | 0.641 | 0.47 | |||
| Percentage of HHs without access to production means. | 0.134 | 0.06 | |||
| Agricultural assets (AA) | 0.338 | 0.333 | HHs having average agricultural assets. | 0.338 | 0.333 |
| Non-AA | 0.293 | 0.253 | HHs having average nonagricultural assets. | 0.293 | 0.253 |
| Finance and incomes | 0.165 | 0.159 | Percentage of HHs lending money to other people. | 0.278 | 0.3 |
| Percentage of HHs borrowing money from relatives. | 0.326 | 0.32 | |||
| Percentage of HHs borrowing money from friends. | 0.171 | 0.12 | |||
| Percentage of HHs borrowing money from neighbors. | 0.229 | 0.2 | |||
| Percentage of HHs borrowing money from NGOs in the last 12 months. | 0.101 | 0.1 | |||
| Percentage of HHs borrowing from a commercial bank in the last 12 months. | 0.032 | 0.03 | |||
| Percentage of HHs borrowing money from a local moneylender. | 0.058 | 0.06 | |||
| Percentage of HHs borrowing money from a Mohajon (local lender) | 0.053 | 0.03 | |||
| Percentage of HHs having an income source during seasonal famine (Monga) from September to December | 0.229 | 0.27 | |||
Source: field survey.
References
- Alam, G.M.M. Livelihood Cycle and Vulnerability of Rural Households to Climate Change and Hazards in Bangladesh. Environ. Manage. 2017, 59, 777–791. [Google Scholar] [CrossRef]
- Intergovernmental Panel on Climate Change (IPCC). Climate Change 2014: Impacts, Adaptation and Vulnerability, Fifth Assessment Report. In Intergovernmental Panel on Climate Change; Cambridge University Press: Cambridge, UK, 2014. [Google Scholar]
- Islam, M.R. Climate Change, Natural Disasters and Socioeconomic Livelihood Vulnerabilities: Migration Decision Among the Char Land People in Bangladesh. Soc. Indic. Res. 2018, 136, 575–593. [Google Scholar] [CrossRef]
- Alam, G.M.M.; Alam, K.; Mushtaq, S.; Clarke, M.L. Vulnerability to climatic change in riparian char and river-bank households in Bangladesh: Implication for policy, livelihoods and social development. Ecol. Indic. 2017, 72, 23–32. [Google Scholar] [CrossRef]
- EGIS. Riverine Chars in Bangladesh-environmental dynamics and management issues. In Environment and GIS Support Project for Water Sector Planning (EGIS); University Press Limited: Dhaka, Bangladesh, 2000. [Google Scholar]
- Paul, S.; Islam, M.R. Ultra-poor char people’s rights to development and accessibility to public services: A case of Bangladesh. Habitat Int. 2015, 48, 113–121. [Google Scholar] [CrossRef]
- CARE-Bangladesh and DFID-B. The Findings of the Northwest Rural Livelihoods Baseline; CARE-Bangladesh and DFID-B: Dhaka, Bangladesh, 2002. [Google Scholar]
- Rasul, G. Food, water, and energy security in South Asia: A nexus perspective from the Hindu Kush Himalayan region. Environ. Sci. Policy 2014, 39, 35–48. [Google Scholar] [CrossRef]
- Sadik, M.S.; Nakagawa, H.; Rahman, R.; Shaw, R.; Kawaike, K.; Fujita, K. A Study on Cyclone Aila Recovery in Koyra, Bangladesh: Evaluating the Inclusiveness of Recovery with Respect to Predisaster Vulnerability Reduction. Int. J. Disaster Risk Sci. 2018, 9, 28–43. [Google Scholar] [CrossRef]
- UNDP Human Development Reports 2007/8. In Fighting Climate Change: Human Solidarity in a Divided World; Human Development Report Office (HDRO), United Nations Development Programme: New York, NY, USA, 2008; pp. 1–115.
- Nelson, D.R.; Adger, W.N.; Brown, K. Adaptation to Environmental Change: Contributions of a Resilience Framework. Annu. Rev. Environ. Resour. 2007, 32, 395–419. [Google Scholar] [CrossRef]
- Folke, C. Resilience: The emergence of a perspective for social-ecological systems analyses. Glob. Environ. Chang. 2006, 16, 253–267. [Google Scholar] [CrossRef]
- Oo, A.T.; Van Huylenbroeck, G.; Speelman, S. Assessment of climate change vulnerability of farm households in Pyapon District, a delta region in Myanmar. Int. J. Disaster Risk Reduct. 2018, 28, 10–21. [Google Scholar] [CrossRef]
- Ford, J.D.; Keskitalo, E.C.H.; Smith, T.; Pearce, T.; Berrang-Ford, L.; Duerden, F.; Smit, B. Case study and analogue methodologies in climate change vulnerability research. Wiley Interdiscip. Rev. Clim. Chang. 2010, 1, 374–392. [Google Scholar] [CrossRef]
- Fraser, E.D.G.; Dougill, A.J.; Hubacek, K.; Quinn, C.H.; Sendzimir, J. Assessing Vulnerability to Climate Change in Dryland Livelihood Systems: Conceptual Challenges and Interdisciplinary Solutions. Ecol. Soc. 2011, 16, 3. [Google Scholar] [CrossRef]
- Fussel, H.M. How inequitable is the global distribution of responsibility, capability, and vulnerability to climate change: A comprehensive indicator-based assessment. Glob. Environ. Chang. 2010, 20, 597–611. [Google Scholar] [CrossRef]
- Bevacqua, A.; Yu, D.; Zhang, Y. Coastal vulnerability: Evolving concepts in understanding vulnerable people and places. Environ. Sci. Policy 2018, 82, 19–29. [Google Scholar] [CrossRef]
- Adger, W.N.; Vincent, K. Uncertainty in adaptive capacity. Comptes Rendus Geosci. 2005, 337, 399–410. [Google Scholar] [CrossRef]
- Eriksen, S.H.; Kelly, P.M. Developing credible vulnerability indicators for climate adaptation policy assessment. Mitig. Adapt. Strateg. Glob. Chang. 2007, 12, 495–524. [Google Scholar] [CrossRef]
- Gbetibouo, G.A.; Ringler, C.; Hassan, R. Vulnerability of the South African farming sector to climate change and variability: An indicator approach. Nat. Resour. Forum 2010, 34, 175–187. [Google Scholar] [CrossRef]
- Preston, B.L.; Yuen, E.J.; Westaway, R.M. Putting vulnerability to climate change on the map: A review of approaches, benefits, and risks. Sustain. Sci. 2011, 6, 177–202. [Google Scholar] [CrossRef]
- Adger, W.N. Vulnerability. Glob. Environ. Chang. 2006, 16, 268–281. [Google Scholar] [CrossRef]
- Alam, G.M.M. An Assessment of the Livelihood Vulnerability of the Riverbank Erosion Hazard and Its Impact on Food Security for Rural Households in Bangladesh. Ph.D. Thesis, University of Southern Queensland, Toowoomba, Australia, 2016. [Google Scholar]
- GOB. Comprehensive Disaster Management Programme Phase II; Ministry of Disaster Management and Relief, The Government of the peoples’ of Bangladesh: Dhaka-1212, Bangladesh, 2011.
- Huq, S.; Ayers, J. Climate change impacts and responses in Bangladesh. In Briefing Note Prepared for the European Parliament; International Institute for Environment and Development: London, UK; Policy Department Economic and Scientific Policy, DG Internal Policies of the Union: Brussels, Belgium, 2008. [Google Scholar]
- Alam, G.M.M.; Alam, K.; Mushtaq, S. Drivers of Food Security of Vulnerable Rural Households in Bangladesh: Implications for Policy and Development. South Asia Econ. J. 2018, 19, 43–63. [Google Scholar] [CrossRef]
- Mutton, D.; Haque, C.E. Human Vulnerability, Dislocation and Resettlement: Adaptation Processes of River-bank Erosion-induced Displacees in Bangladesh. Disasters 2004, 28, 41–62. [Google Scholar] [CrossRef]
- Center for Environmental and Geographic Information Services (CEGIS). Prediction of River Bank Erosion Along the Jamuna, the Ganges the Padma and the Lower Meghna Rivers in 2012; Centre for Environment and Geographic Information Services: Dhaka, Bangladesh, 2012.
- Barrett, A.; Hannan, M.; Alam, Z.; Pritchard, M. Impact of the Chars Livelihoods Programme on the Disaster Resilience of Chars Communities. 2014. Available online: https://www.gdnonline.org/resources/impact%20of%20clp%20on%20the%20disaster%20resilience%20of%20char%20communities%20[final].pdf (accessed on 15 March 2019).
- International Fund for Agricultural Development (IFAD). How Does International Price Volatility Affect Domestic Economies and Food Security? Office of Knowledge Exchange, Research and Extension, Food and Agriculture Organization of the United Nations (FAO): Rome, Italy, 2011. [Google Scholar]
- Ahsan, M.N.; Warner, J. The socioeconomic vulnerability index: A pragmatic approach for assessing climate change led risks—A case study in the south-western coastal Bangladesh. Int. J. Disaster Risk Reduct. 2014, 8, 32–49. [Google Scholar] [CrossRef]
- Bangladesh Bureau of Statistics (BBS). Statistical Pocketbook; BBS: Dhaka, Bangladesh, 2014. [Google Scholar]
- Bhuiyan, M.A.H.; Islam, S.M.D.-U.; Azam, G. Exploring impacts and livelihood vulnerability of riverbank erosion hazard among rural household along the river Padma of Bangladesh. Environ. Syst. Res. 2017, 6, 25. [Google Scholar] [CrossRef] [Green Version]
- Islam, M.R.; Hossain, D. Island Char Resources Mobilization (ICRM): Changes of Livelihoods of Vulnerable People in Bangladesh. Soc. Indic. Res. 2014, 117, 1033–1054. [Google Scholar] [CrossRef]
- Chars Livelihoods Programme (CLP). The Chars Livelihoods Programme: Alleviating Poverty & Building the Climate Resilience of the Poorest Families; Innovation, Monitoring and Learning Division, CLP Secretariate: Bogra, Bangladesh, 2010. [Google Scholar]
- Shah, A.A.; Ye, J.; Abid, M.; Khan, J.; Amir, S.M. Flood hazards: Household vulnerability and resilience in disaster-prone districts of Khyber Pakhtunkhwa province, Pakistan. Nat. Hazards 2018, 93, 147–165. [Google Scholar] [CrossRef]
- Shah, K.U.; Dulal, H.B.; Johnson, C.; Baptiste, A. Understanding livelihood vulnerability to climate change: Applying the livelihood vulnerability index in Trinidad and Tobago. Geoforum 2013, 47, 125–137. [Google Scholar] [CrossRef]
- Hahn, M.B.; Riederer, A.M.; Foster, S.O. The Livelihood Vulnerability Index: A pragmatic approach to assessing risks from climate variability and change—A case study in Mozambique. Glob. Environ. Chang. 2009, 19, 74–88. [Google Scholar] [CrossRef]
- Chambers, R.; Conway, G.R. Sustainable Rural Livelihoods: Practical Concepts for the 21st Century.; Institute of Development Studies: Brighton, UK, 1992. [Google Scholar]
- Department for International Development (DFID). Sustainable Livelihoods Guidance Sheets“a Livelihood Comprises the Capabilities, Assets and Activities Required for a Means of Living. a Livelihood Is Sustainable When It Can Cope with and Recover from Stresses and Shocks and Maintain the Natural Resourc B; East Kilbride: Glasgow, UK, 2001.
- Yamane, T. Statistics: An Introductory Analysis; Harper and Row: New York, NY, USA, 1967. [Google Scholar]
- Cinner, J.E.; Huchery, C.; Darling, E.S.; Humphries, A.T.; Graham, N.A.J.; Hicks, C.C.; Marshall, N.; McClanahan, T.R. Evaluating Social and Ecological Vulnerability of Coral Reef Fisheries to Climate Change. PLoS ONE 2013, 8, e74321. [Google Scholar] [CrossRef]
- Singh, A.; Masuku, M. Sampling Techniques & Determination of Sample Size in Applied Statistics Research: An Overview. Ijecm. Co. UK 2014, II, 1–22. [Google Scholar]
- Alam, G.M.M.; Alam, K.; Khatun, M.N.; Filho, W.L. Strategies and barriers to the adaptation of hazard-prone rural households in Bangladesh. In Limits to Climate Change Adaptation; Filho, L.W., Nalau, J., Eds.; Springer International Publishing: New York, NY, USA, 2018; pp. 11–24. [Google Scholar]
- Godswill, O.C.; Ugonma, O.V.; Ijeoma, E.E. The determinants of squatter development in Southern Aba Region of Nigeria. African J. Environ. Sci. Technol. 2016, 10, 439–450. [Google Scholar]
- Osahon, O.J.; Kingsley, O. Statistical Approach to the Link between Internal Service Quality and Employee Job Satisfaction: A Case Study. Am. J. Appl. Math. Stat. 2016, 4, 178–184. [Google Scholar]
- Sadia, H.; Iqbal, M.J.; Ahmad, J.; Ali, A.; Ahmad, A. Gender-sensitive public health risks and vulnerabilities’ assessment with reference to floods in Pakistan. Int. J. Disaster Risk Reduct. 2016, 19, 47–56. [Google Scholar] [CrossRef]
- Jacobson, C.; Crevello, S.; Nguon, C.; Chea, C. Resilience and Vulnerability Assessment as the Basis for Adaptation Dialogue in Information-Poor Environments: A Cambodian Example. In Communicating Climate Change Information for Decision-Making; Serrao-Neuman, S., Ed.; Springer International Publishing: New York, NY, USA, 2018; pp. 149–160. [Google Scholar]
- Johnson, R.M.; Edwards, E.; Gardner, J.S.; Diduck, A.P.; Johnson, R.M.; Edwards, E.; Gardner, J.S. Community vulnerability and resilience in disaster risk reduction: An example from Phojal Nalla, Himachal Pradesh, India. Reg. Environ. Chang. 2018, 18, 2073–2087. [Google Scholar] [CrossRef]
- Intergovernmental Panel on Climate Change (IPCC). Climate Change 2007: Impacts, Adaptation and Vulnerability; Cambridge University Press: New York, NY, USA, 2007. [Google Scholar]
- Pandey, R.; Jha, S.K. Climate vulnerability index—Measure of climate change vulnerability to communities: A case of rural Lower Himalaya, India. Mitig. Adapt. Strateg. Glob. Chang. 2012, 17, 487–506. [Google Scholar] [CrossRef]
- Alam, G.M.M.; Alam, K.; Mushtaq, S. Climate change perceptions and local adaptation strategies of hazard-prone rural households in Bangladesh. Clim. Risk Manag. 2017, 17, 52–63. [Google Scholar] [CrossRef]
- Antwi-agyei, P.; Stringer, L.C.; Dougill, A.J. Livelihood adaptations to climate variability: Insights from farming households in Ghana. Reg. Environ. Chang. 2014, 14, 1615–1626. [Google Scholar] [CrossRef]
- Gerlitz, J.Y.; Macchi, M.; Brooks, N.; Pandey, R.; Banerjee, S.; Jha, S.K. The Multidimensional Livelihood Vulnerability Index–an instrument to measure livelihood vulnerability to change in the Hindu Kush Himalayas. Clim. Dev. 2017, 9, 124–140. [Google Scholar] [CrossRef]
- Orencio, P.M.; Fujii, M. An Index to Determine Vulnerability of Communities in a Coastal Zone: A Case Study of Baler, Aurora, Philippines. Ambio 2013, 42, 61–71. [Google Scholar] [CrossRef]
- Maleki, R.; Nooripoor, M.; Azadi, H.; Lebailly, P. Vulnerability assessment of rural households to Urmia Lake drying (the case of Shabestar region). Sustainability 2018, 10, 1862. [Google Scholar] [CrossRef]
- Peng, L.; Xu, D.; Wang, X. Vulnerability of rural household livelihood to climate variability and adaptive strategies in landslide-threatened western mountainous regions of the Three Gorges Reservoir Area, China. Clim. Dev. 2018. [Google Scholar] [CrossRef]
- Zhang, Q.; Zhao, X.; Tang, H. Vulnerability of communities to climate change: Application of the livelihood vulnerability index to an environmentally sensitive region of China. Clim. Dev. 2018. [Google Scholar] [CrossRef]
- The Cong, P.; Huu Manh, D.; Anh Huy, H.; Thi Ly Phuong, T.; Thi Tuyen, L. Livelihood Vulnerability Assessment to Climate Change at Community Level Using Household Survey: A Case Study from Nam Dinh Province, Vietnam. Mediterr. J. Soc. Sci. 2016, 7, 358–366. [Google Scholar] [CrossRef]
- Amos, E.; Akpan, U.; Ogunjobi, K. Households’ perception and livelihood vulnerability to climate change in a coastal area of Akwa Ibom State, Nigeria. Environ. Dev. Sustain. 2015, 17, 887–908. [Google Scholar] [CrossRef]
- Pandey, R.; Jha, S.K.; Alatalo, J.M.; Archie, K.M.; Gupta, A.K. Sustainable livelihood framework-based indicators for assessing climate change vulnerability and adaptation for Himalayan communities. Ecol. Indic. 2017, 79, 338–346. [Google Scholar] [CrossRef]
- Panthi, J.; Aryal, S.; Dahal, P.; Bhandari, P.; Krakauer, N.Y.; Pandey, V.P. Livelihood vulnerability approach to assessing climate change impacts on mixed agro-livestock smallholders around the Gandaki River Basin in Nepal. Reg. Environ. Chang. 2016, 16, 1121–1132. [Google Scholar] [CrossRef]
- Islam, M.S.; Sultana, S.; Saifunnahar, M.; Miah, M.A. Adaptation of Char Livelihood in Flood and River Erosion Areas through Indigenous Practice: A Study on Bhuapur Riverine Area in Tangail. J. Environ. Sci. Nat. Resour. 2014, 7, 13–19. [Google Scholar] [CrossRef]
- Shahiduzzaman, M.; Rahman, M.Z.; Hoque, M.J.; Arefin, M.S. Food Security Condition of Landless People in a Char Area of Rangpur District. Progress. Agric. J. 2013, 24, 281–289. [Google Scholar] [CrossRef]
- Al-amin, S.; Rahman, M.M.; Uddin, A.S.; Miah, M.A.M. Contribution of Variables to the Role Performance of Char Women in Maintaining Sustainable Livelihoods in Bangladesh. Int. J. Rural Stud. 2011, 18, 1–6. [Google Scholar]
- Kamal, S. Livelihood Dynamics and Disaster Vulnerabilities of Char Land Areas; Bangladesh University of Engineering and Technology: Dhaka, Bangladesh, 2011. [Google Scholar]
- Alam, G.M.M.; Alam, K.; Mushtaq, S.; Filho, W.L. How do climate change and associated hazards impact on the resilience of riparian rural communities in Bangladesh? Policy implications for livelihood development. Environ. Sci. Policy 2018, 84, 7–18. [Google Scholar] [CrossRef]
- Tambo, J.A. Adaptation and resilience to climate change and variability in north-east Ghana. Int. J. Dis. Ris. Reduc. 2016, 17, 85–94. [Google Scholar] [CrossRef]
Figure 1.
Study areas: (top-right) Saghata and (bottom-right) Fulchhari Upazila in Gaibandha, Bangladesh.
Figure 1.
Study areas: (top-right) Saghata and (bottom-right) Fulchhari Upazila in Gaibandha, Bangladesh.

Figure 2.
Riverbank erosion and damaged crops during rainy season.

Figure 3.
Spider diagram of major components of the livelihood vulnerability of char dwellers. Source: field survey.
Figure 3.
Spider diagram of major components of the livelihood vulnerability of char dwellers. Source: field survey.

Table 1.
Major component dimension of char-dweller livelihood and climate vulnerability.
| Major Dimensions | Saghata Upazila | Fulchhari Upazila |
|---|---|---|
| Exposure (land, climatic variability, and natural disasters) | 0.498 | 0.562 |
| Sensitivity (health, food, and water) | 0.520 | 0.532 |
| Adaptive capacity (knowledge and skill, livelihood strategies, social networks, housing and production means, agricultural assets, nonagricultural assets, and finance and income) | 0.314 | 0.300 |
| Climate vulnerability Index | 0.838 | 0.958 |
| LVI-IPCC | 0.353 | 0.428 |
Source: field survey.
© 2019 by the authors. Licensee MDPI, Basel, Switzerland. This article is an open access article distributed under the terms and conditions of the Creative Commons Attribution (CC BY) license (http://creativecommons.org/licenses/by/4.0/).
Share and Cite
MDPI and ACS Style
Sarker, M.N.I.; Wu, M.; Alam, G.M.M.; Shouse, R.C. Livelihood Vulnerability of Riverine-Island Dwellers in the Face of Natural Disasters in Bangladesh. Sustainability 2019, 11, 1623. https://doi.org/10.3390/su11061623
AMA Style
Sarker MNI, Wu M, Alam GMM, Shouse RC. Livelihood Vulnerability of Riverine-Island Dwellers in the Face of Natural Disasters in Bangladesh. Sustainability. 2019; 11(6):1623. https://doi.org/10.3390/su11061623
Chicago/Turabian StyleSarker, Md Nazirul Islam, Min Wu, G M Monirul Alam, and Roger C. Shouse. 2019. "Livelihood Vulnerability of Riverine-Island Dwellers in the Face of Natural Disasters in Bangladesh" Sustainability 11, no. 6: 1623. https://doi.org/10.3390/su11061623
Note that from the first issue of 2016, this journal uses article numbers instead of page numbers. See further details here.